
Measuring Walkability with GIS—Methods Overview and New Approach Proposal


1
Department of Real Estate and Investment Economics, Cracow University of Economics, 31-510 Kraków, Poland
2
Department of Mathematics, Cracow University of Economics, 31-510 Kraków, Poland
3
Department of Photogrammetry, Remote Sensing of Environment and Spatial Engineering, Faculty of Mining Surveying and Environmental Engineering, AGH University of Science and Technology, 30-059 Kraków, Poland
*
Author to whom correspondence should be addressed.
Sustainability 2021, 13(4), 1883; https://0-doi-org.brum.beds.ac.uk/10.3390/su13041883
Submission received: 11 January 2021
/
Revised: 30 January 2021
/
Accepted: 5 February 2021
/
Published: 9 February 2021
(This article belongs to the Special Issue The Quality of Urban Areas: New Measuring Tools and Methods, Impact on Quality of Life and Costs of Bad Design)
Abstract
:Cities occupy only about 3% of the Earth’s surface area, but half of the global population lives in them. The high population density in urban areas requires special actions to make these areas develop sustainably. One of the greatest challenges of the modern world is to organize urban spaces in a way to make them attractive, safe and friendly to people living in cities. This can be managed with the help of a number of indicators, one of which is walkability. Of course, the most complete analyses are based on spatial data, and the easiest way to implement them is using GIS tools. Therefore, the goal of the paper is to present a new approach for measuring walkability, which is based on density maps of specific urban functions and networks of generally accessible pavements and paths. The method is implemented using open-source data. Density values are interpolated from point data (urban objects featuring specific functions) and polygons (pedestrian infrastructure) using Kernel Density and Line Density tools in GIS. The obtained values allow the calculation of a synthetic indicator taking into account the access by means of pedestrian infrastructure to public transport stops, parks and recreation areas, various attractions, shops and services. The proposed method was applied to calculate the walkability for Kraków (the second largest city in Poland). The greatest value of walkability was obtained for the Main Square (central part of the Old Town). The least accessible to pedestrians are, on the other hand, areas located on the outskirts of the city, which are intended for extensive industrial areas, single-family housing or large green areas.
1. Introduction
Sustainable development combines three basic dimensions, namely social, economic and environmental sustainability, and has been generally defined in the seminal Brundtland Report as the kind of development that “meets the needs of the present without compromising the ability of future generations to meet their own needs” [1]. To a large extent, sustainable development issues concern urban areas. The urban population of the world has increased from 751 million in 1950 to 4.2 billion in 2018. According to UN forecasts, 60% of people globally will live in urban areas by 2030, and the urban population will reach over 6 billion by 2045 [2,3], creating great challenges for and barriers to sustainable development. For this reason, cities have become the subject of extensive discussions on how they should develop, how they should be shaped and, finally, how they should be managed.
The goal of this paper is to overview available approaches and methods for evaluating walkability using GIS and to propose a new approach for measuring it. The new method is based on urban space coverage by particular functions and pedestrian infrastructure availability using open source data. The method has been examined in Kraków—a city with diverse functional structure, many spatial availability problems and differentiation in terms of urban and historical development.
We adopted the following hypothesis: historic built-up areas have a high level of walkability, while low walkability characterizes the peripheral areas of the city, occupied by newly built housing estates.
The paper is structured as follows. In Section 2 we briefly discuss walkability as one of the core factors of sustainable urban development and emphasize the connections between sustainable urban development and walkability. In Section 3, we review the different approaches for measuring walkability and present an overview of methods for evaluating walkability in urban areas. In Section 4, we present assumptions, clarify the new assessment method and show the results of our analysis. In Section 5, we present conclusions and directions for further research.
2. Background of the Research
2.1. Walkability in Sustainable Urban Development Concept
The concept of sustainable urban development, in addition to the three basic dimensions of social, economic and environmental sustainability, should take into account the spatial dimension. In a broader sense, a significant role in shaping a sustainable urban environment is played by political and cultural aspects, as well as the possibility of creating such public places where social integration is possible [4]. There are many definitions of sustainable urban development in the literature. One of them was developed during the URBAN 21 conference, which describes it as “a process leading to the improvement of the quality of life in the city, including ecological, cultural, political, institutional, social and economic elements, without burdening future generations. This burden is the result of a decrease in the stock of natural capital and an increasing local public debt” [5]. In this definition, Keiner [6] focuses on the local community and its needs, creating a definition of a sustainable society, and explains that sustainable urban development implies a balance between the needs of the population and the existence of specific resources, while limiting the negative impact on the environment.
Wheeler [7] describes sustainable urban development as a process that creates cities that improve the quality of life and the quality of ecosystems in the long run. In order to achieve this goal, it is necessary to protect natural ecosystems in cities, create a favorable living environment and use resources and land in a reasonable way, contributing to global sustainable development (see also [8]).
One of the important conclusions of the 2000 Sustainable City Conference in Rio was that “The concept of sustainability as applied to a city is the ability of the urban area and its region to continue to function at levels of quality of life desired by the community without restricting the options available to the present and future generations and causing adverse impacts inside and outside the urban boundary”, pointing out that cities are open systems which cannot be analyzed only within their borders but must be considered on a wider regional scale [6].
Hiremath et al. [9] defined a sustainable city as a balance between the development of urban areas and environmental protection, taking into account social justice in terms of income, employment, access to public services, social infrastructure, transport and security.
It can be assumed that the concept of sustainable city development includes issues and problems related to (i) transport, (ii) land use, (iii) spatial order, (iv) environmental protection, (v) social justice and (vi) green construction. However, the spatial dimension of the city seems to be the most distinctive factor of sustainable city development as it is the result and the expression of human activity, and it directly influences and shapes the living and working conditions of a city’s inhabitants. Meeting human needs depends on the consumption of nonrenewable resources, and such consumption generates pollutants that are distributed locally depending on the spatial characteristics of the city. Therefore, the appropriate location of educational services, healthcare, recreational areas, public transport, industrial areas, etc. is crucial for sustainable urban development, and this should be managed by local and national authorities supported by professionals and researchers.
A very important manifesto and at the same time a designation for the construction and development of modern cities was the foundation of almost parallel organizations and movements in urban planning: The New Urbanism in the United States and the European Council of Spatial Planning in Europe, which worked on the postulates and recommendations for urban development. Considering the Charter of the New Urbanism, the mission of which is to champion walkable urbanism [10], and the recommendations of The New Charter of Athens [11], it is important to note that the documents were created in different conditions. On the one hand, the reasons for discussion were the problems and situation in megacities in the United States; on the other hand, the discussion was driven by the problems and situation in historical European cities and metropolises. Despite the differences in history and social, economic and cultural conditions, European and American cities have similar problems and challenges and may benefit from similar solutions.
Fundamental recommendations that are shared by both documents are as follows: creating compact built-up areas to prevent city sprawl; increasing spatial accessibility through good street network design; creating public spaces as well as pedestrian and bicycle networks, stimulating walkability; mixed functions in the districts preventing social segregation; protection of green urban areas; and improvement of public transport infrastructure. Currently, the Strategic Plan 2020 (CNU), although developed a quarter of a century after the first Charter of the New Urbanism, still remains valid and defines very similar goals, which are “to grow the supply of neighborhoods that are both walkable and affordable; work to change the codes and regulations blocking walkable urbanism; and advance design strategies that help communities adapt to climate change and mitigate its future impact” [12].
2.2. Previous Research on Walkability Determinants
In order to respond to modern problems and situations in cities, it became necessary to develop tools and methods for measuring walkability in cities and districts. The study and method of measuring walkability depend mainly on the definition and on what factors we consider important in shaping a pedestrian-friendly environment.
The definition of walkability is difficult to capture and depends on the factors that are taken into consideration, from the availability of different destinations and population density to very subjective environmental features, i.e., comfort, safety and picturesqueness.
One definition equates walkability with “the extent to which characteristics of the built environment and land use may or may not be conducive to residents in the area walking for either leisure, exercise or recreation, to access services, or to travel to work” [13]. Speck defines a pedestrian-friendly environment as a safe, favorable environment, where streets, sidewalks and paths are comfortable and interesting [14]. Talen and Koschinsky proposed a normative definition that characterizes a neighborhood favorable to pedestrian communication as a “form of space that encourages pedestrians to be active and minimizes environmental degradation. It is related to social, economic and utility (in the context of land use) diversity. It has features of public space that enable interaction and exchange and offer equal access to goods, services and amenities” [15].
Most publications examining the walkability of the urban environment stem from the field of medical science, with particular focus on the relation between walkability and obesity [16]. It turns out that areas conducive to pedestrian traffic are correlated with a decreasing risk of obesity [17]. Many studies have analyzed the tendency to increase physical activity in relation to specific features of the environment, such as the availability of services or the quality of the pedestrian/cyclist environment. It was found that the availability of recreational facilities is positively correlated with a greater propensity to be physically active [18]. Moreover, greater distance from bicycle paths or the occurrence of steep approaches is negatively correlated with cycling activity [19]. Research shows that walkability contributes to real estate value [20] and positively affects the sustainable development of districts, decreasing the level of exclusion and crime [21]. However, the mere increase in building density can be seen as a factor that worsens the quality of the district, even though it has no negative impact on real estate prices [22].
In the field of walkability research, one can distinguish two main groups of publications. The first is focused on the factors affecting the increase in the number of pedestrians, while the second is focused on the measurement and evaluation of these factors. According to Cervero and Kockelman [23], higher building density, multifunctionality and appropriate street landscape (design) reduce the number of people driving cars and are positively correlated with the choice of other forms of transport, including public transport, bicycle or walking. This creates the concept of so-called 3D walkability based on three “D-dimensions” conducive to pedestrian communication, i.e., density, diversity and design. This concept was further developed by adding the dimensions of destination accessibility [24] and distance to transport [25], finally forming “5D walkability”.
Another group of ten factors along with the measurement method was proposed by Ramirez et al. [26]. In addition to the physical elements of built-up space, the set also includes the factors of local policy and social involvement.
Subsequent research focused on the study of how to measure and evaluate factors characteristic of the components of the walkability dimensions. The most difficult to measure objectively is the street design/street landscape, which, in addition to physical characteristics such as the layout of the street grid, sidewalks or bicycle paths, should include an assessment of the elements of the development from the pedestrian level. Ewing and Clemente [25] attempted to assess features classified into five categories: imageability, visual enclosure, human scale, transparency and complexity. Those categories were defined on the basis of literature research and evaluation of the ten best experts in spatial and urban planning.
In 2016, Ewing et al. [27] carried out a study with the main objective of assessing the impact of the street landscape on the number of pedestrians in the context of other so-called D-dimensions, i.e., diversity, destination accessibility, density and distance to transit, as well as a new additional dimension—demography.
A different approach to the walkability assessment was proposed by the London Planning Advisory Committee, which assumes that pedestrian-friendly places should be connected, convenient, comfortable, convivial and conspicuous—the “5C” approach [28].
Well-communicated streets are those whose network is connected with the so-called “key attractors”, such as working place, home, recreation area or public transport. Walking comfort relates to a situation where walking may compete with other forms of transport in terms of time, cost and space. It also depends on the pedestrian accessibility of various urban functions. A pleasant environment is one equipped with various pedestrian facilities and accessible to pedestrians with different requirements and abilities. To be conducive to pedestrian communication, a street network should be legible and well signposted.
Moura et al. [28] added another two features, namely coexistence and commitment, creating the “7C” approach. The first feature refers to the safety level of pedestrians, and the second feature is the degree of pedestrian involvement in shaping the street environment. All seven features were measured with the set of 17 key indicators (Indicators of Accessibility and Attractiveness of Pedestrian Environments (IAAPE)) and data came from direct field research and digitalization of topographic maps. The final synthetic walkability index was elaborated in GIS. The main contribution of this study is the statement that the developed group of indicators is representative and can be used to assess the walkability instead of direct observation or survey.
Pikora et al. [29] (p. 1698) developed a conceptual model of factors conducive to increased pedestrian activity. The areas of functionality, safety, aesthetics and destinations have been distinguished among the factors influencing the willingness to walk. Functional features refer to the physical attributes of sidewalks and roads, and the group of safety features reflects the need to provide a pedestrian environment that allows the use of sidewalks without any danger from other users. The concept covers two more areas: aesthetics and destinations. The more diverse services, stores, public transport stops or recreational areas are available in the surroundings, the greater chances of increasing the number of pedestrians.
Another group of ten factors along with a measurement method was proposed by Ramirez et al. [26]. In addition to the physical elements of built-up space (land-use environment, facilities, transportation environment, aesthetics, travel patterns), the set also includes the factors of local policy and social involvement. However, the authors describe the methodology and measurement methods very generally.
3. Methodology and Materials
3.1. Review of Existing Methods
The assessment of walkability depends on the scale/area of the study, methods and available data. On a microscale, it could be a single street, and the assessment may cover such features as the quality of pavements, the occurrence of various types of pedestrian facilities or the nature of the surroundings. However, at the district or city level (macroscale), the availability of services or good communication is gaining importance.
Walkability research methods, especially in the context of city design, can be divided into four groups: (i) methods based on surveys, interviews and questionnaires (subjective); (ii) direct audit tools or stock-taking (subjective), which are most often conducted by appropriately trained observers [30,31]; (iii) GIS tools (objective) [13,32]; and (iv) mixed methods, which are a combination of information from surveys or inventory with data obtained from direct measurements or from secondary data sources [18].
The first group of walkability measurement methods is based on surveys of various social groups in which subjective feelings and experiences related to walking mobility are analyzed [28]. Direct audit methods are the most expensive and time-consuming. Many university centers have developed such audit tools, and the most popular ones include [33] SPACES (Systematic Pedestrian and Cycling Environmental Scan—The University of Western Australia), PBIC Checklist (Pedestrian and Bicycle Information Center—Partnership for a Walkable America), WSAF (Walking Suitability Assessment Form—University of North Carolina), SLU (Analytic Audit Tool—St Louis University), I-M Inventory (Irvine-Minnesota Inventory—University of California) and PEDS (Pedestrian Environment Data Scan—University of Maryland). Due to the high costs of conducting direct field research, audits are increasingly combined with data from so-called secondary sources, e.g., data collected by Google Street View. Research shows that measures determined in audit questionnaires can be successfully estimated using GIS tools, based on Google Street View data [34,35].
The most common elements of the pedestrian environment examined with GIS tools include population density, land use multifunctionality, availability of various types of services and recreational facilities, crime rate, traffic intensity, quality of pavements and street layout [33,36].
Frequently, indicators of population density, multifunctionality, availability of amenities or spatial availability (street layout) in publications that explore the issues of walkability most often take very simple forms as area indicators, i.e., indicators described for districts, not at the street level, and the calculations are based on publicly available data.
One of the simplest and at the same time the most popular indicators assessing the environment favorable to pedestrian communication is Walk Score [37]. The indicator basically measures only one D dimension—the accessibility of various types of amenities—and is based on calculating the distance in a straight line between the place of residence and all other destinations within a radius of one mile. In recent years, the Walk Score methodology has been enriched with two additional features: frequency of street intersections and building length. However, it is still met with great criticism for not taking into account the characteristics of the street landscape [15]. At the same time, it needs to be noted that information on the level of walkability is available mainly for cities in the United States, Canada and Australia.
Frank et al. [38] developed the walkability index, which is an indicator combining three parameters characterizing built-up space: building density, multifunctionality and connectivity (connectivity was measured by calculating the frequency of street intersections in a given area; number of crossroads with at least three streets per 1 square kilometer). A similar approach was taken by Leslie et al. [13], who offered a walkability index based on four key features, scored on a scale of 1 to 10 for each spatial unit, namely building density, connectivity, multifunctionality and net retail area. The authors point to many limitations of the method, which does not take into account the occurrence of recreational areas, quality of pavements, terrain, distance to public transport hubs or the visual appearance of the street.
Another approach was taken by Majic and Pafka [39], who proposed two new measures: the area-weighted average perimeter and interface catchment. According to the authors, these measures better capture the capacities of urban morphologies to enable and attract pedestrian movement.
Concerning the study of the street landscape, capturing design, aesthetics and subjective features, there are many publications based on the Ewing protocol [40]. Purciel et al., using GIS tools, developed a method for measuring the five basic dimensions of the street landscape [41]. However, hybrid techniques are primarily used, allowing the combination of a research approach based on GIS methods with a pedestrian perspective using Google Street View. It has been proven that the use of virtual walking and audit conducted using Google Earth can successfully replace a direct audit [34,35].
Data limitations, high costs and time-consuming research through questionnaires resulted in the increased interest of researchers in publicly available data (OpenStreetMap, Google Street View, Bing Maps) and new techniques, including machine learning techniques. Yin and Wang [42] made their first attempt to automate the process of evaluating one of the street landscape features (limitations) in their work. In the next work, Yin, using the “5D” concept, examined the features of the street landscape (design) in Buffalo using both 2D and 3D GIS models [43].
3.2. New Approach Proposal with GIS Tools
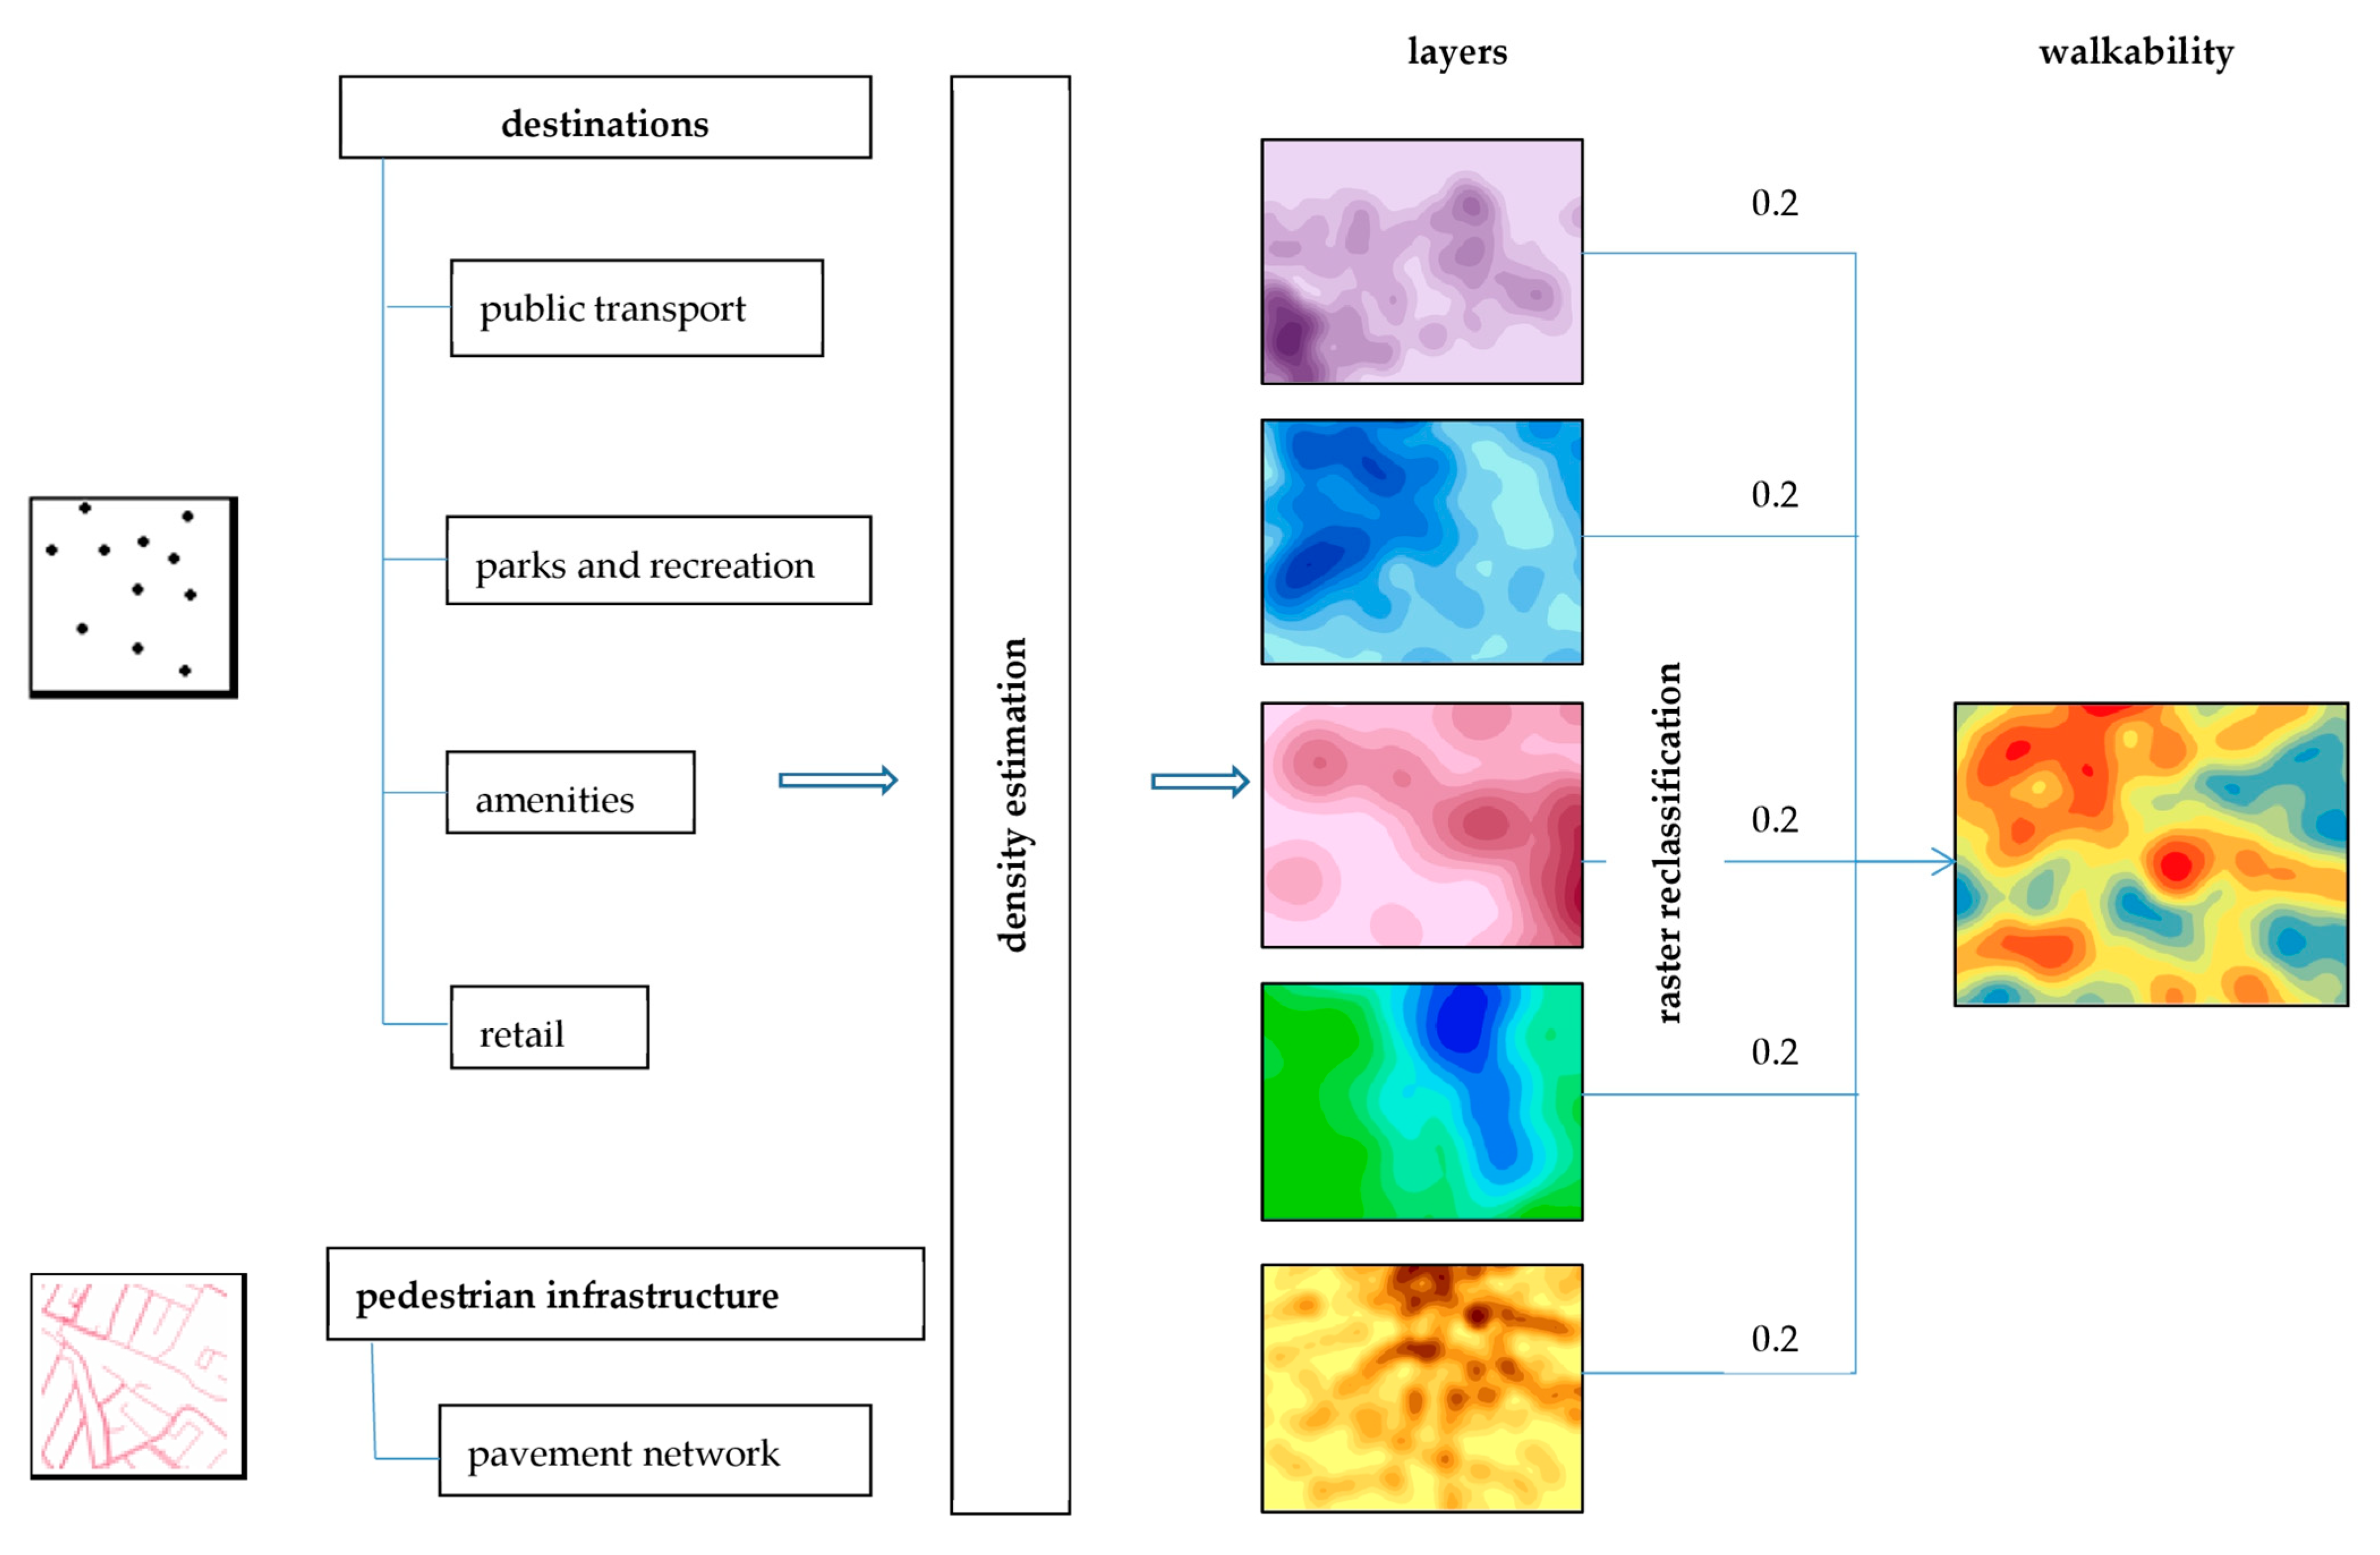
In order to assess the degree of attractiveness of urban space for pedestrian traffic, the density of individual attractors’ occurrence and pavement networks was estimated using Kernel Density and Line Density tools in GIS (the Kernel Density tool calculates the density of features in a neighborhood around those features and can be calculated for both point and line features; for more details, see [44]). Point density was estimated using a nonparametric kernel density estimator. The kernel function implemented in GIS was based on the quartic kernel function described in [45] (p. 76, Equation (4.5)). The density at each output raster cell was calculated by adding the values of all the kernel surfaces where they overlay the raster cell center, i.e.,
where x = (x, y) are location coordinates of raster cell center, and Xi for i = 1, …, n are the input points that are within the radius distance r of the (x, y) location.
The density of the pavement network was estimated with the Line Density tool. For each raster cell, the lengths of the portions of each line that fall within the radius distance r were summed, and the total was divided by the circle’s area.
We set r equal to 800 m. Research results indicate [16,37] that the main motivation for choosing walking instead of traveling by car is the location of the attractors at a distance of 800 m to 1.5 km from the place of residence, as well as proximity to public transport. With estimated densities at hand, the walkability indicator was calculated—see Figure 1.
After attractor density and sidewalk network density map preparation, a walkability map can be developed.
First of all, raster reclassification was needed (10 classes), and then we used the Kernel Density tool to estimate the values of walkability for the entire city. It was assumed that all destinations and sidewalks are equally important, so we set the same weight of 0.2 for each raster.
3.3. Research Material
A common feature of most methods of studying the street environment is access to various types of services, facilities and destinations attractive to pedestrians. Due to the limited data and computational capabilities, the basis for walkability assessment is the accessibility to transport hubs, attractions, parks and playgrounds, shops and services, as well as the accessibility of pavements. The input layers for the analysis were the vector layer of pavement distribution and the layers of potential destinations.
In the initial research phase, during the database development, we assumed that method should be universal and applicable in other European cities. Initially, European free data sources containing information on the largest European cities were reviewed. The developed methodology assumes that the database will contain detailed information on the course of the street and sidewalk network, location of buildings and their functions and points of interest (POIs). The most suitable data source that fully covers the need for information necessary to analyze walkability is OpenStreetMap (OSM). The range of data includes administrative boundaries, street network, bicycle path network, land use classification and POIs (including stores, facilities, services and health care). Despite the imperfection of the quality of data, which are collected on an ongoing basis by users with different experience in the GIS environment, they are widely used in scientific research, and the quality has been verified many times in countries such as Germany, France, Brazil and Iran [46].
4. Results and Discussion
4.1. Research Area
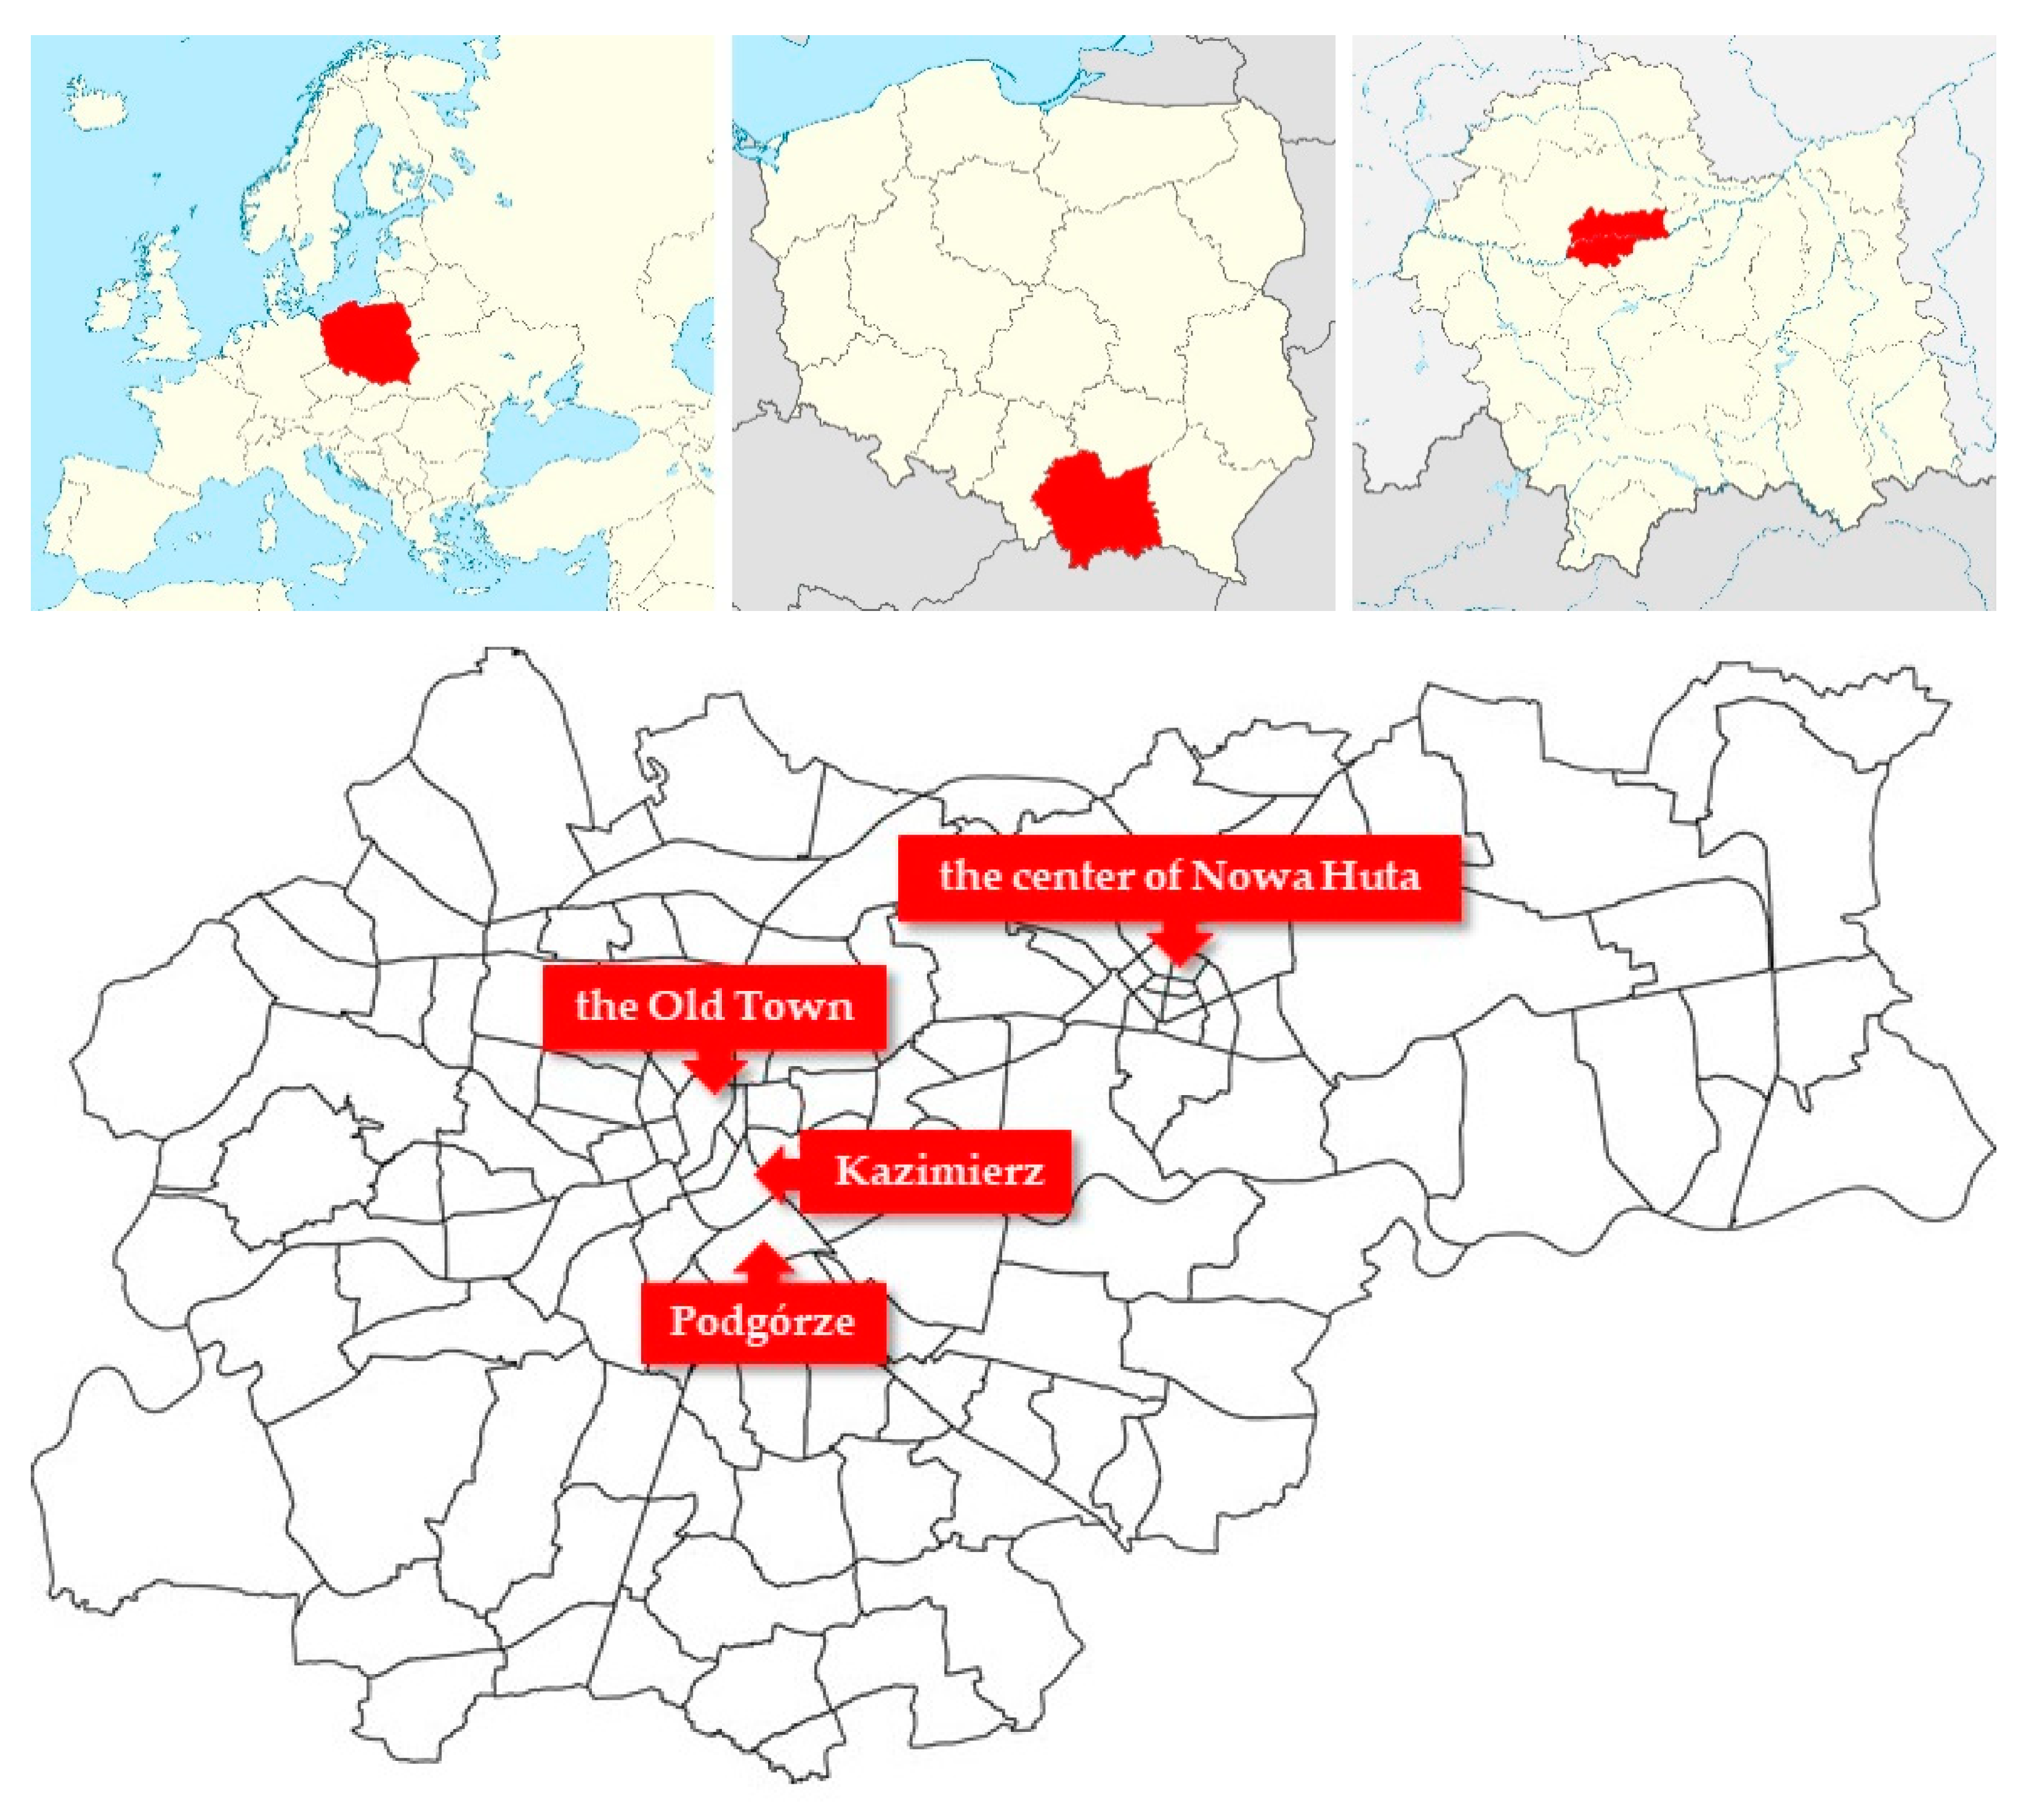
In our work, the city of Kraków is analyzed (Figure 2). It is the second largest city in Poland in terms of population (about 780,000 inhabitants) and area (326.8 km2). The city is an interesting research area for several reasons [47]. Firstly, it combines the historical buildings of three cities: the Old Town of Kraków (established in 1257), Kazimierz (14th century) and Podgórze (18th century). Secondly, the center of Nowa Huta district (20th century) was designed as an ideal city of real socialism. Thirdly, contemporary Kraków is a city with many communication problems [48,49,50], mainly related to the ghettoization of residential areas [51,52], cacophony of the urban form [53,54] and lack of greenery [55,56].
4.2. Results of the Research
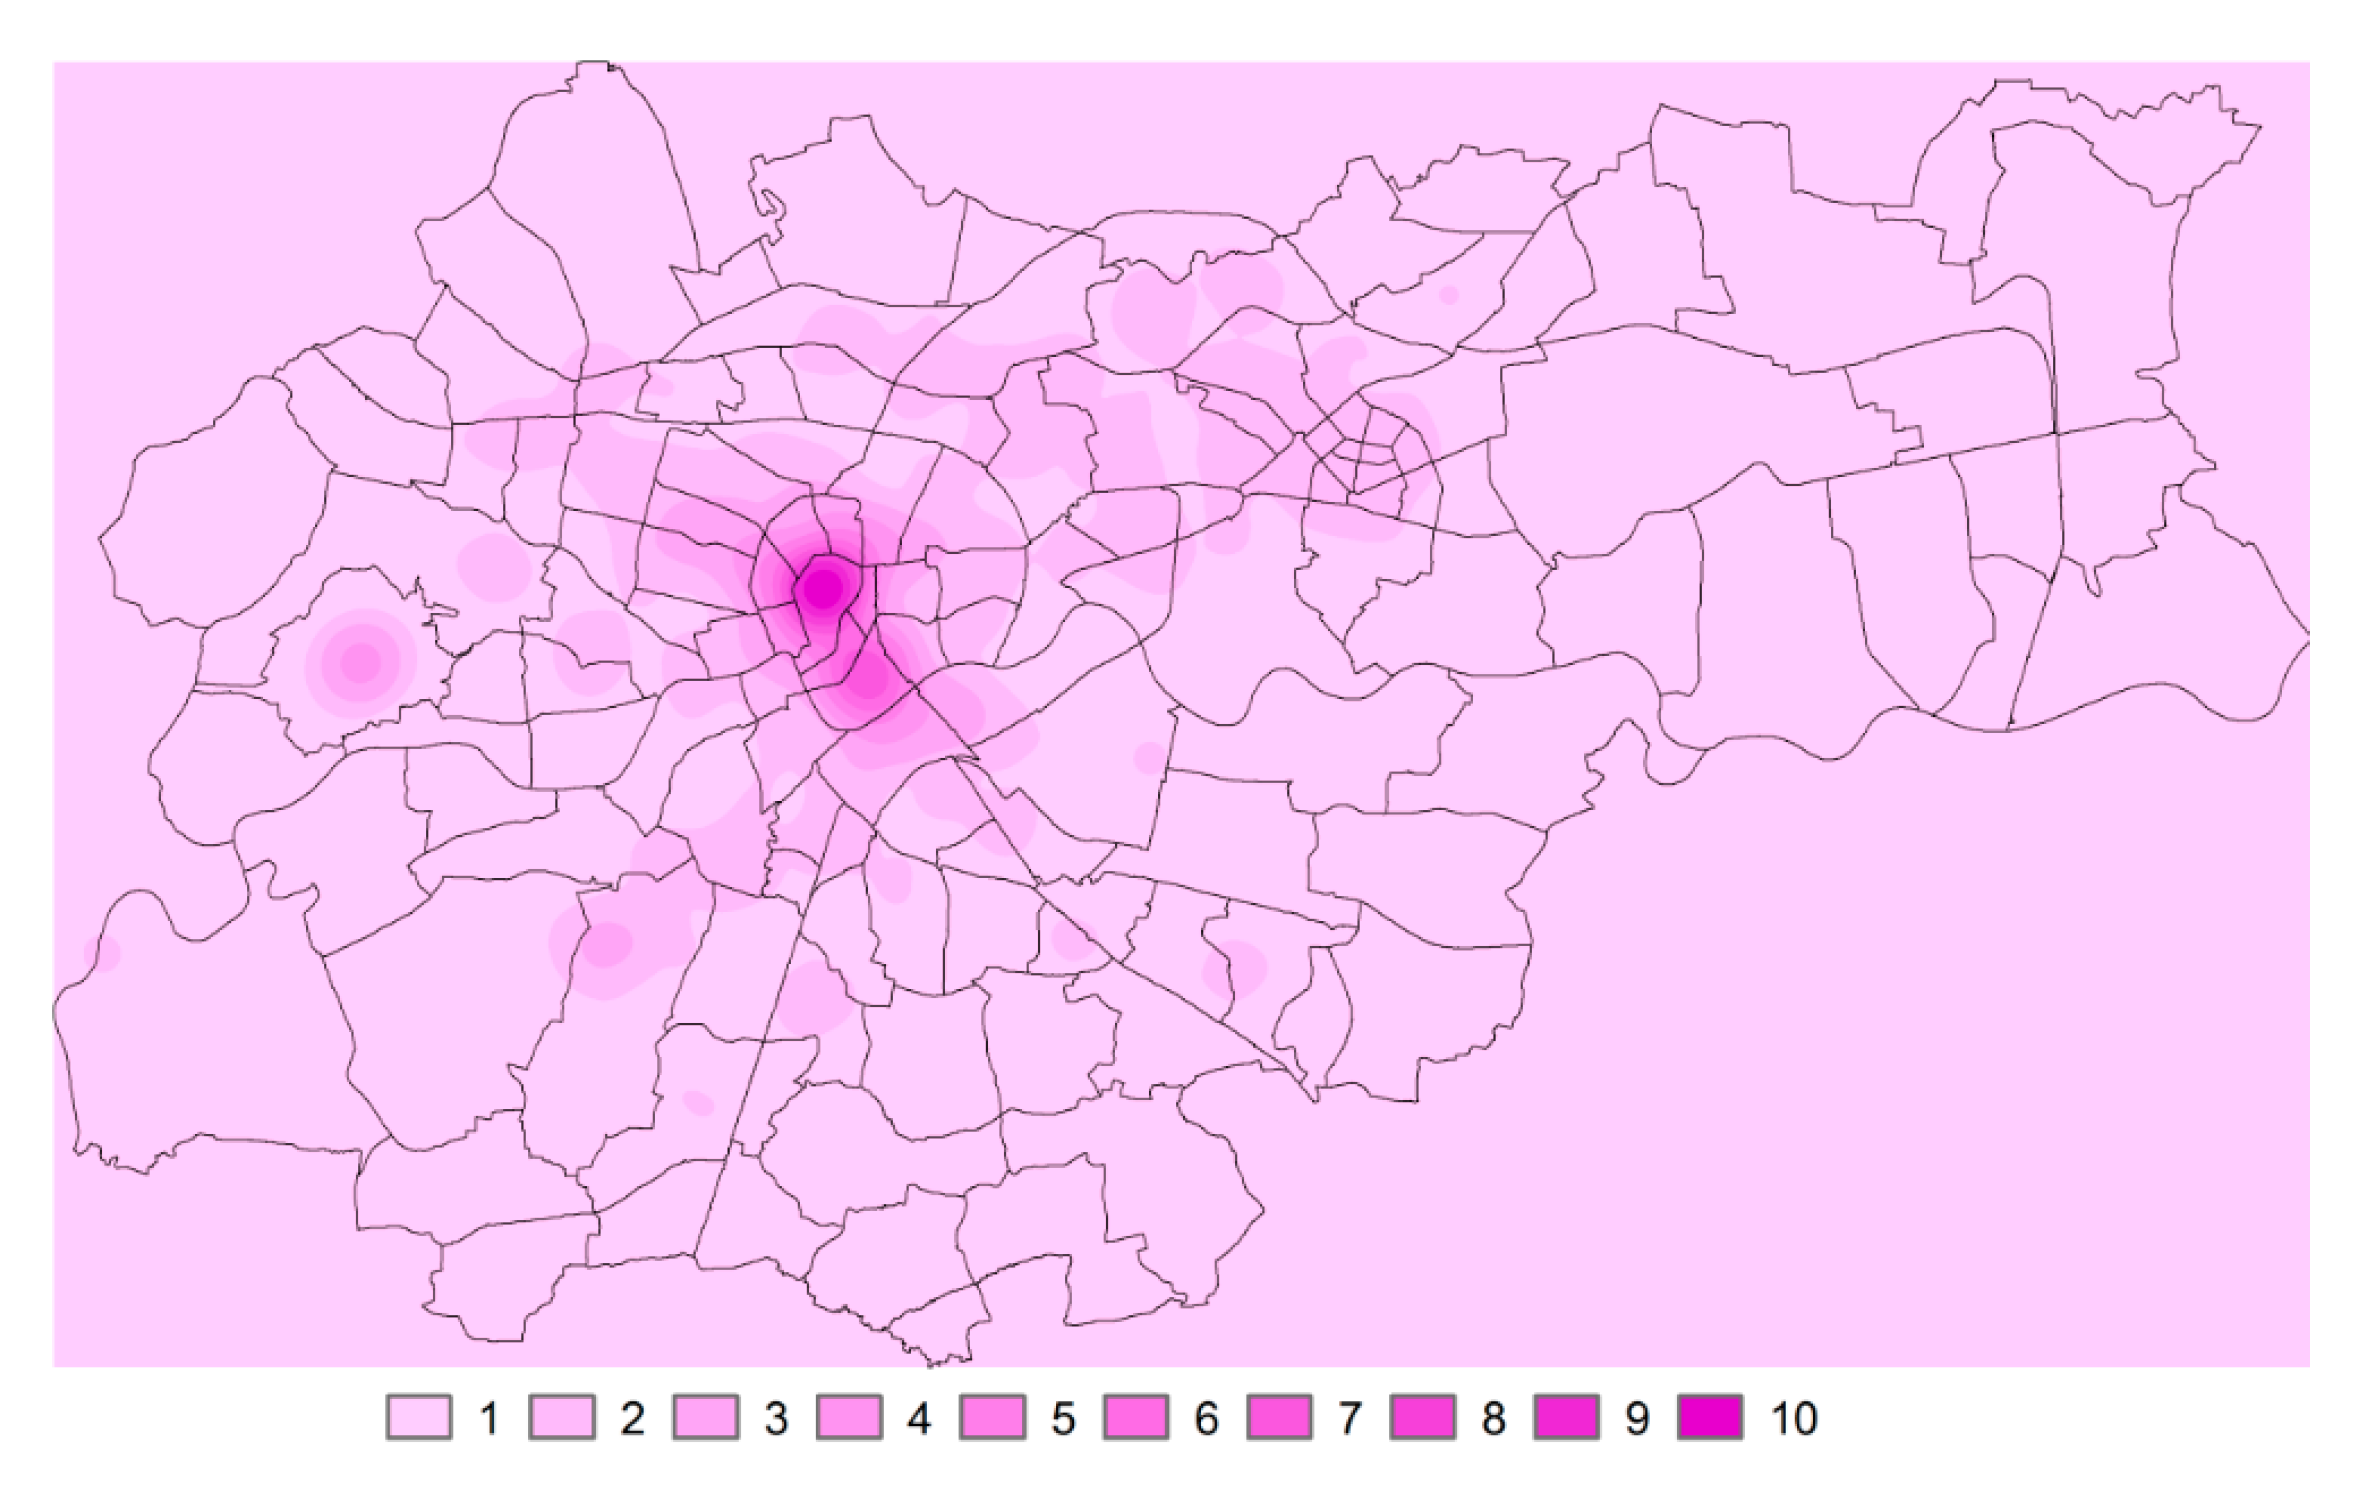
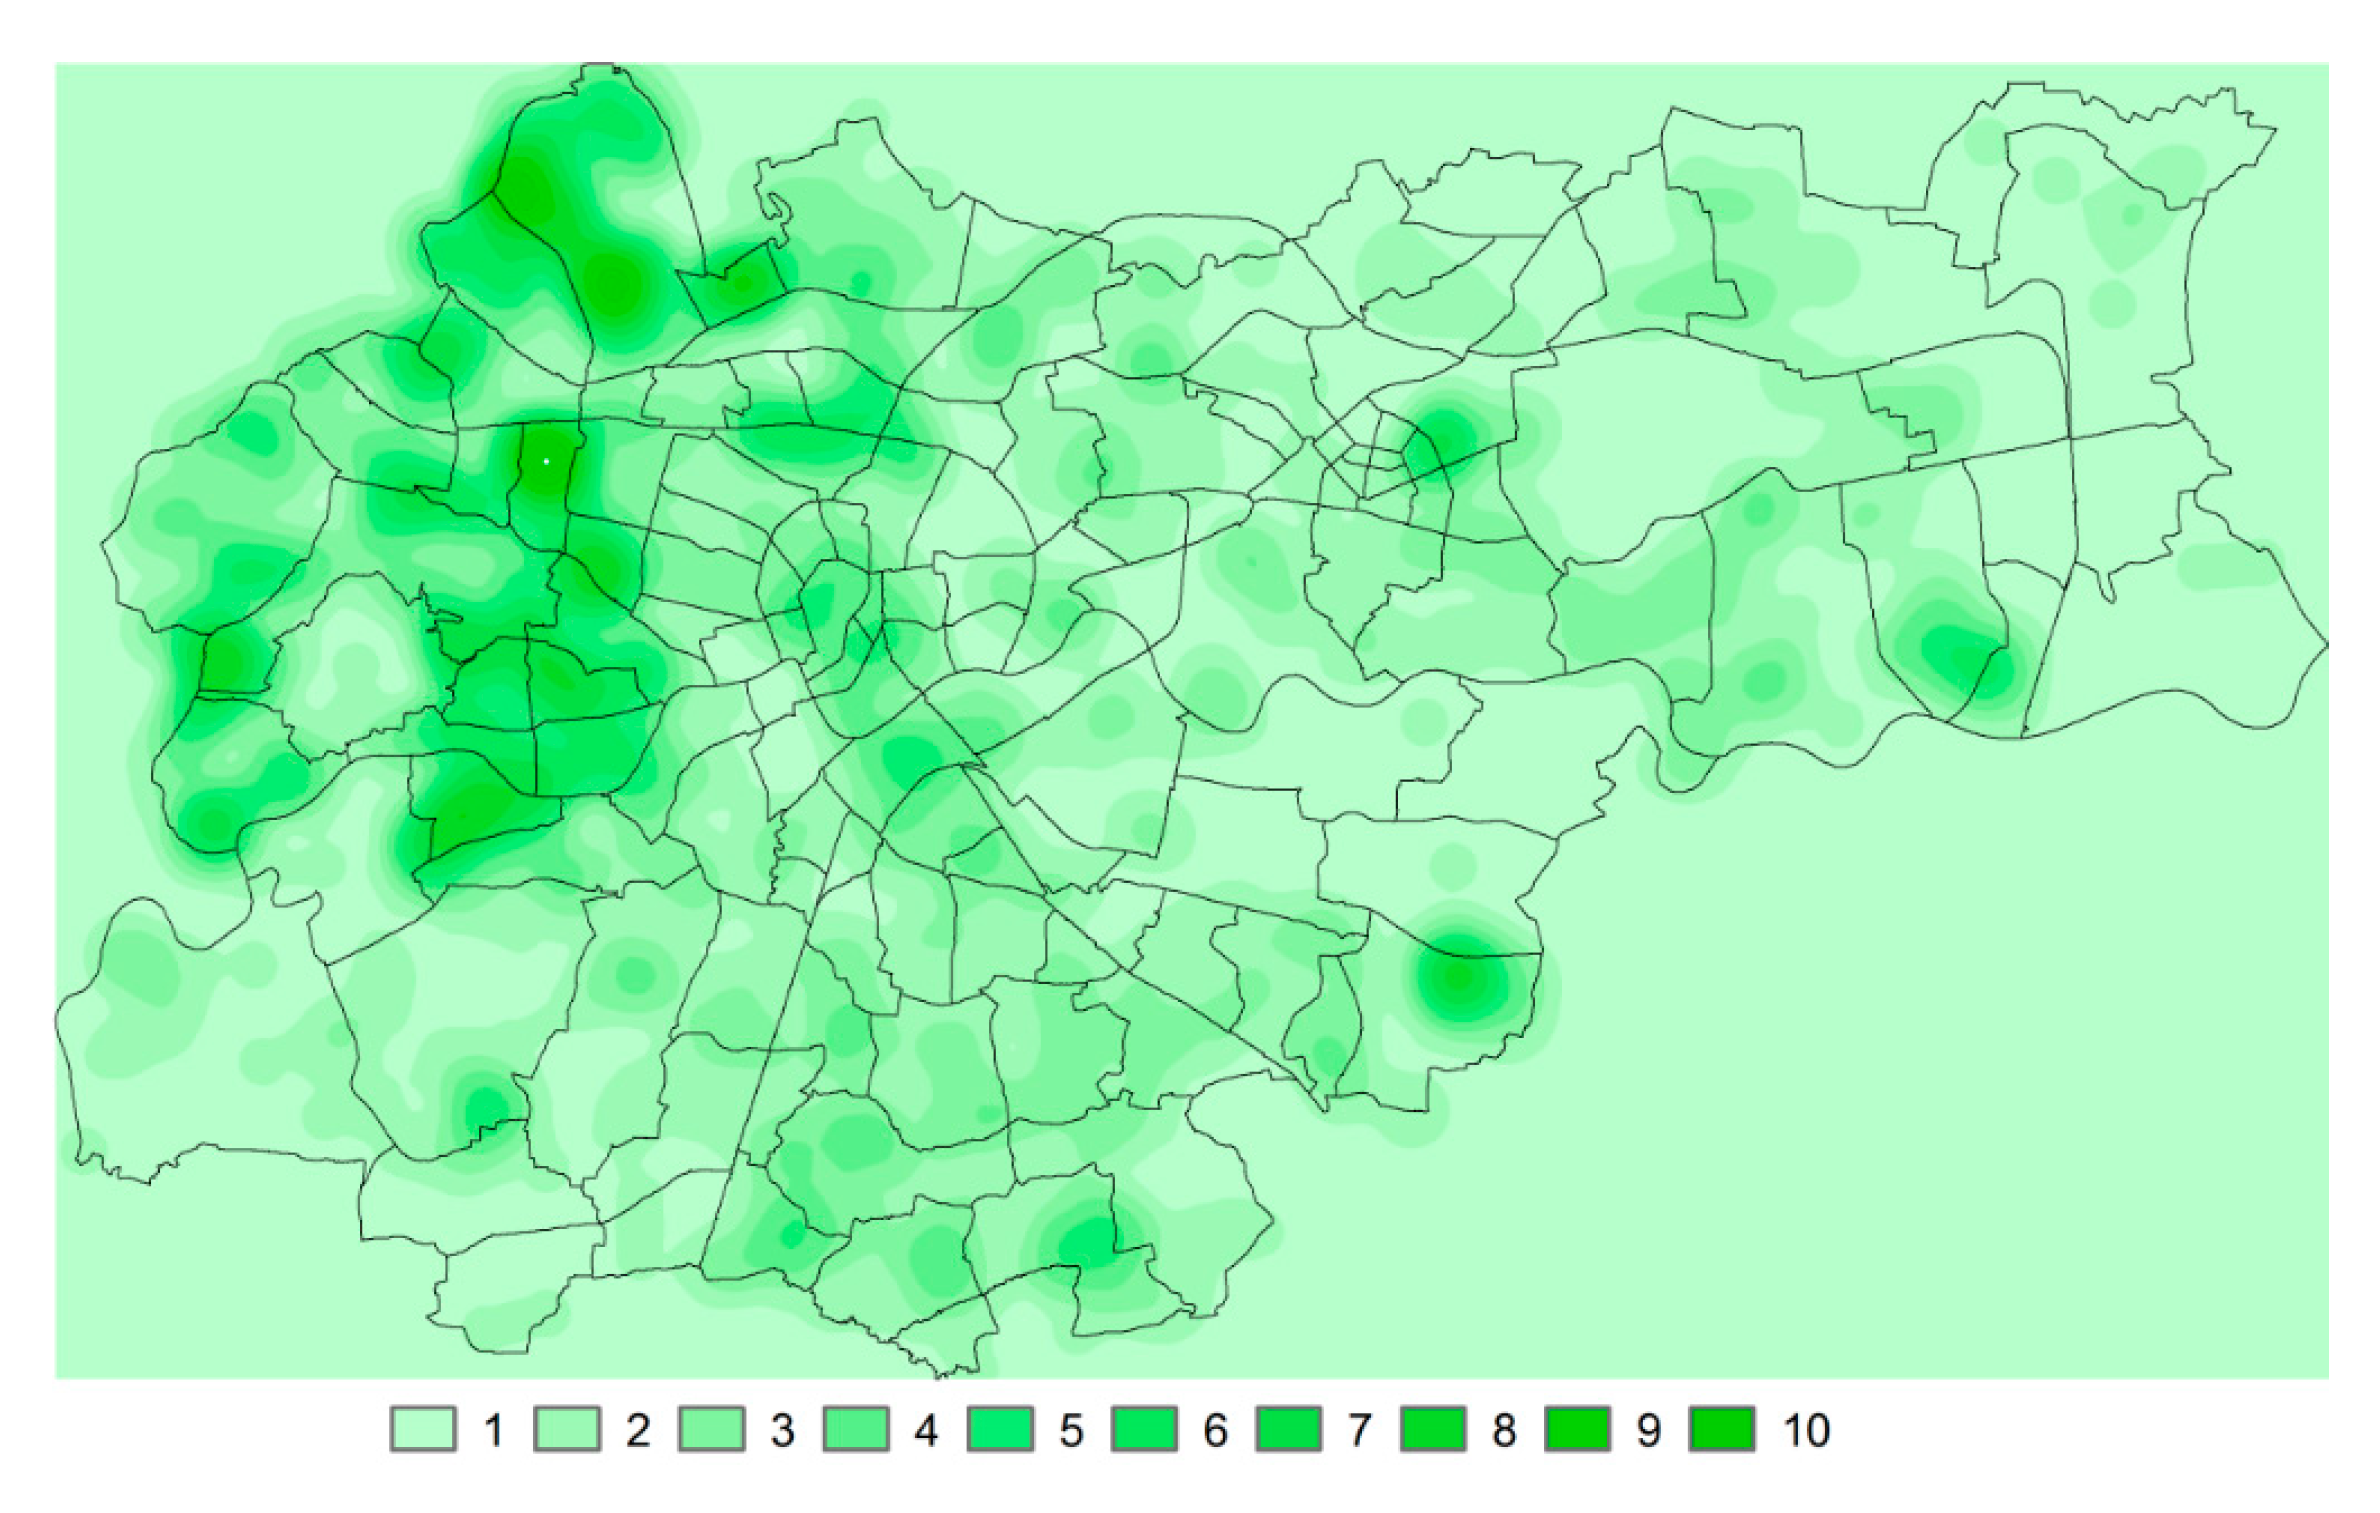
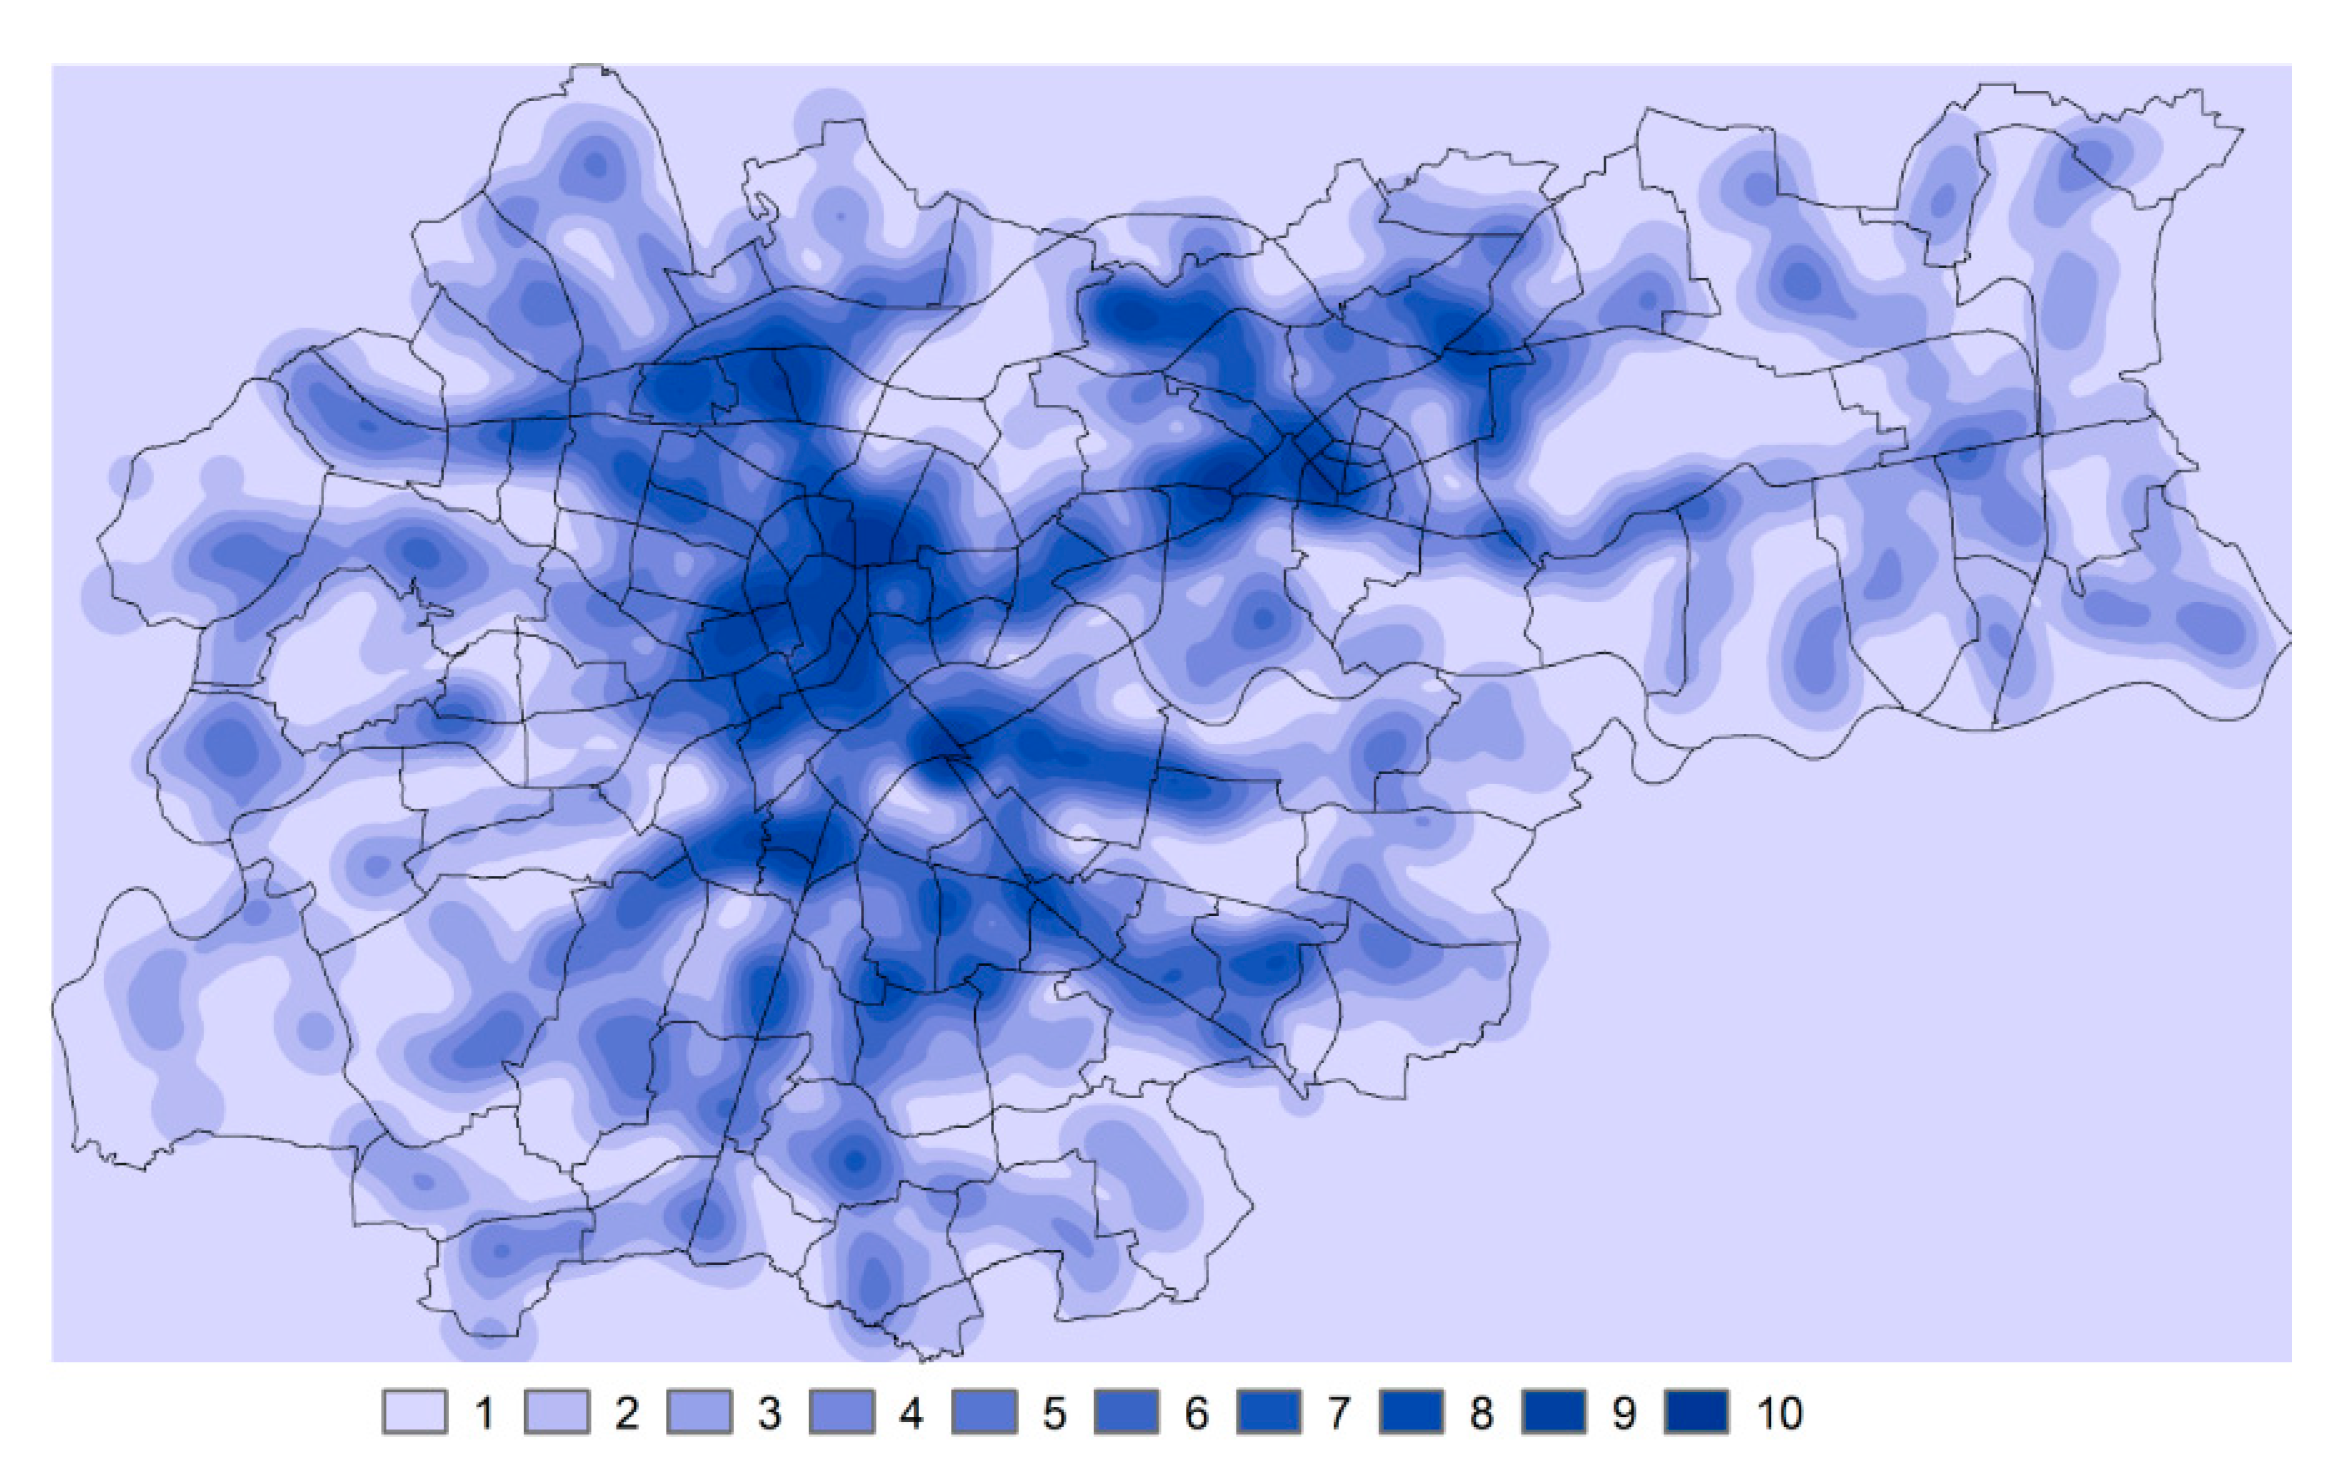
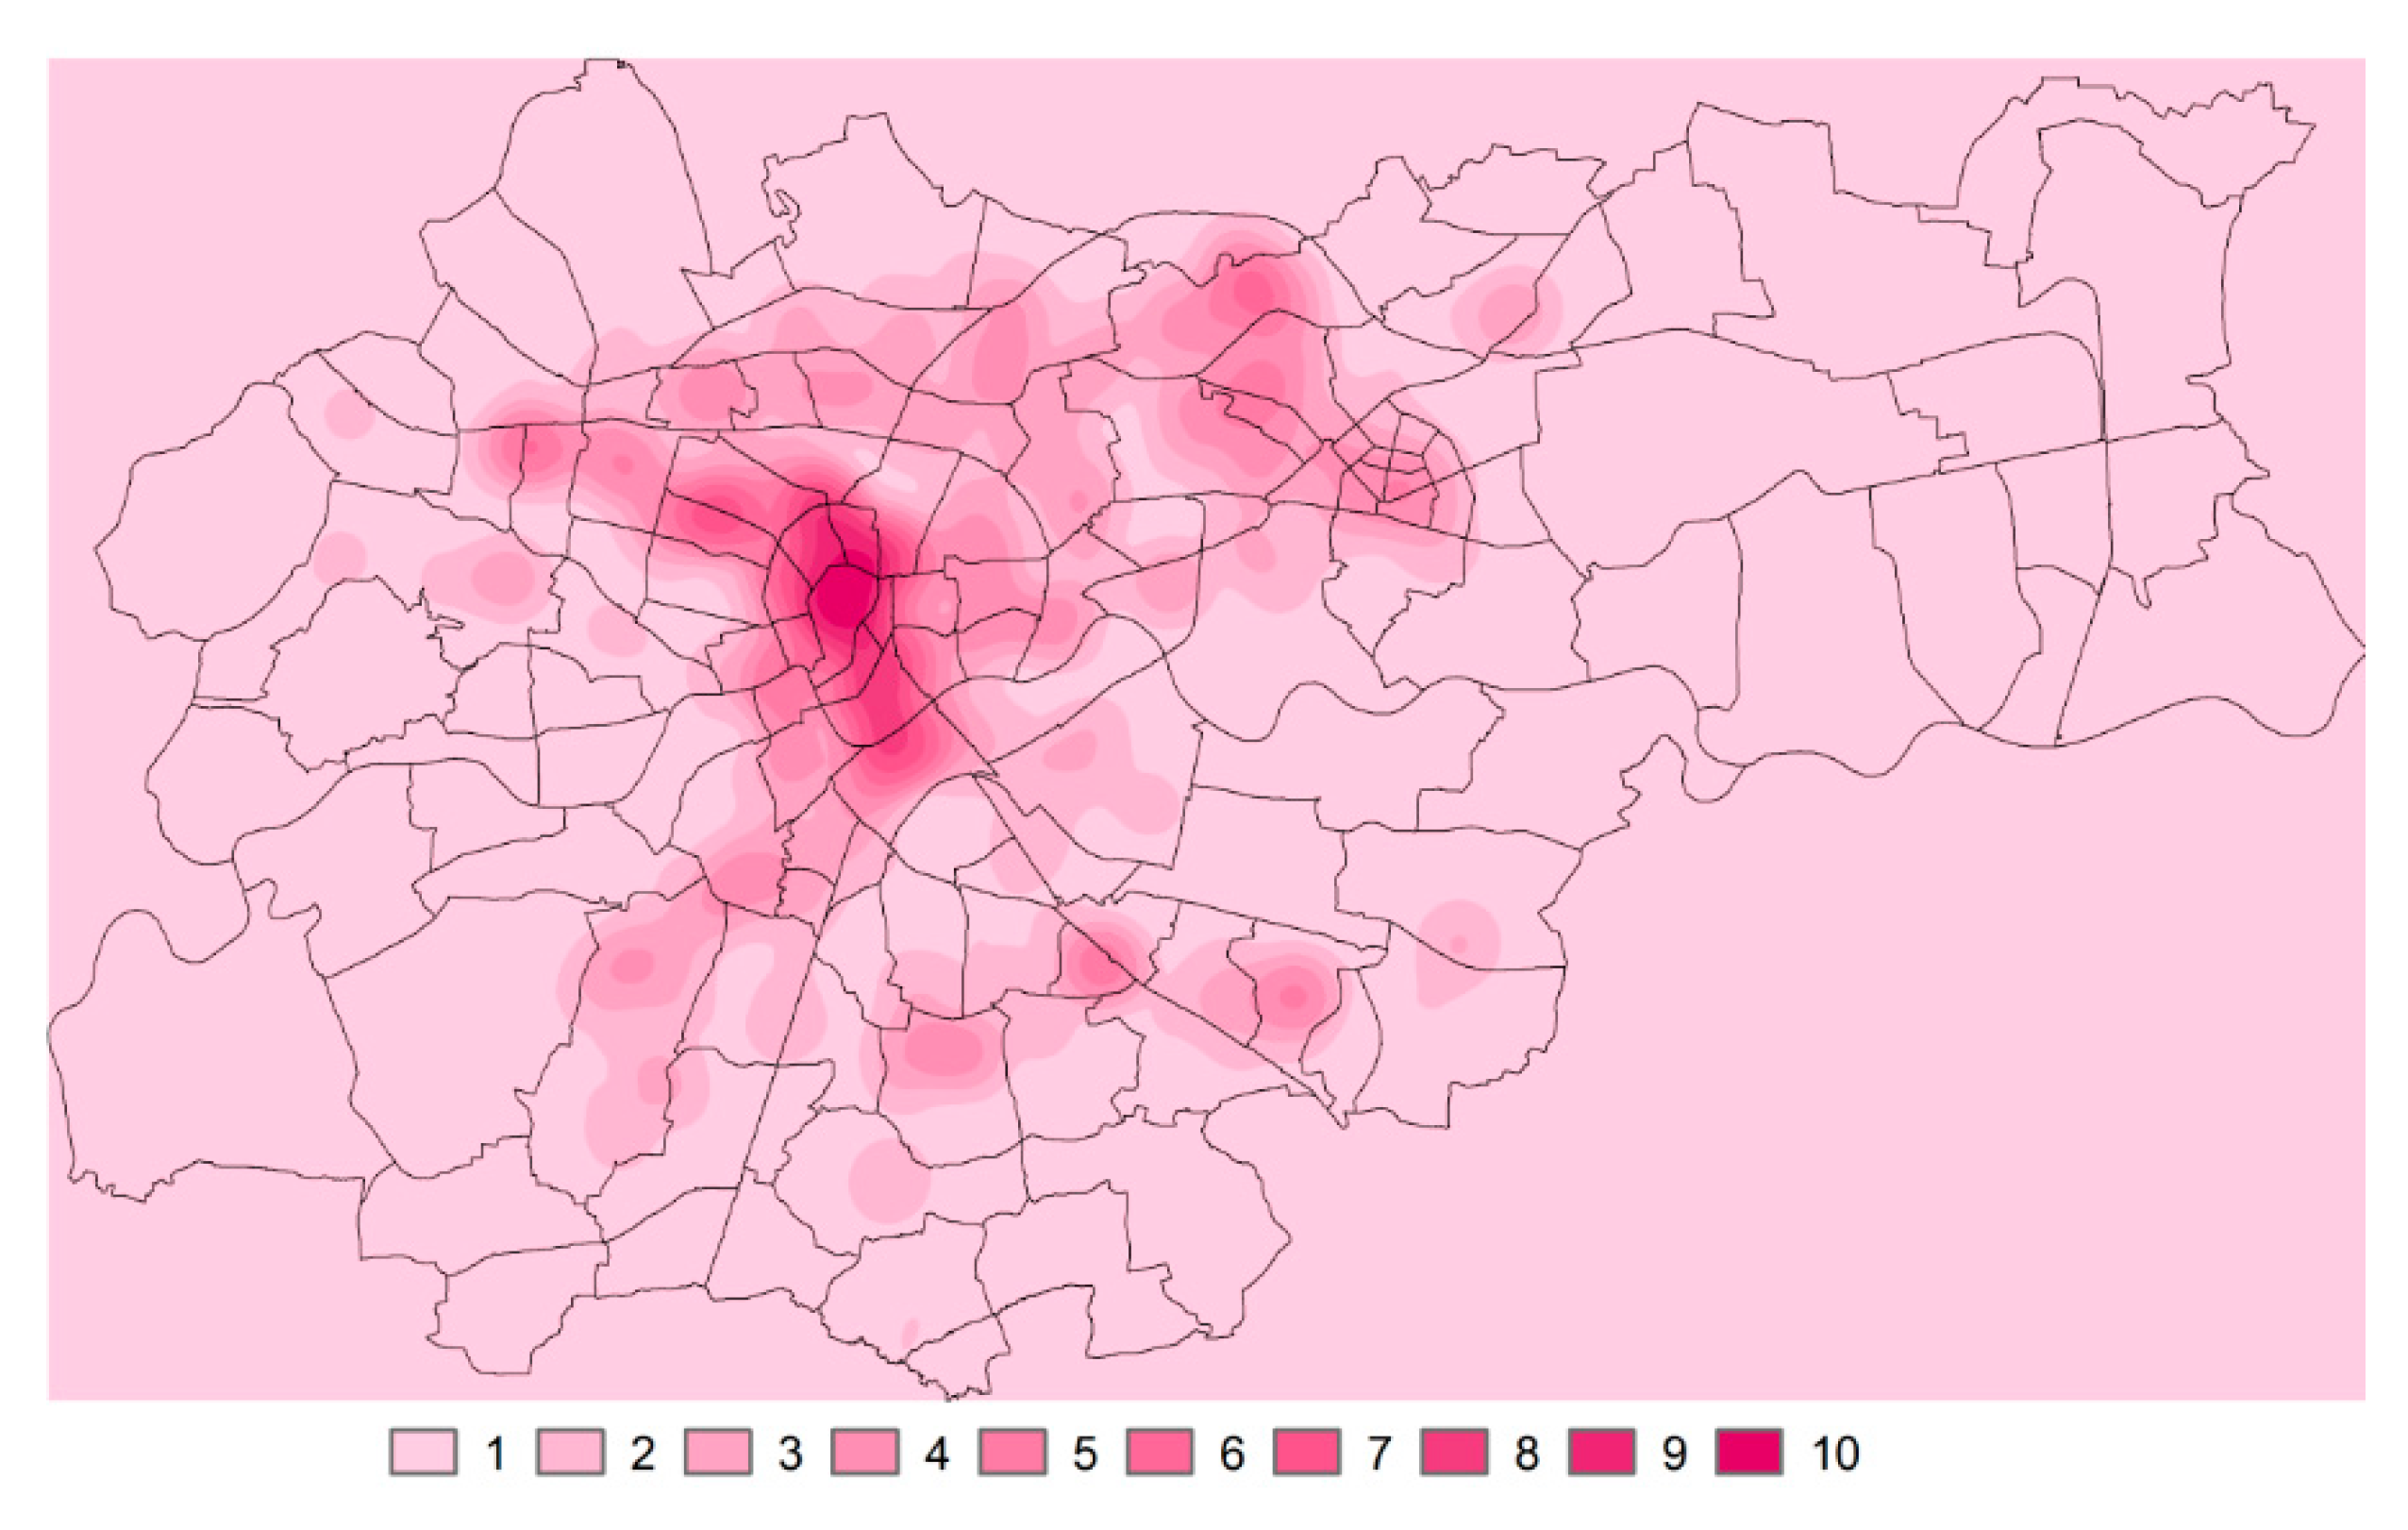
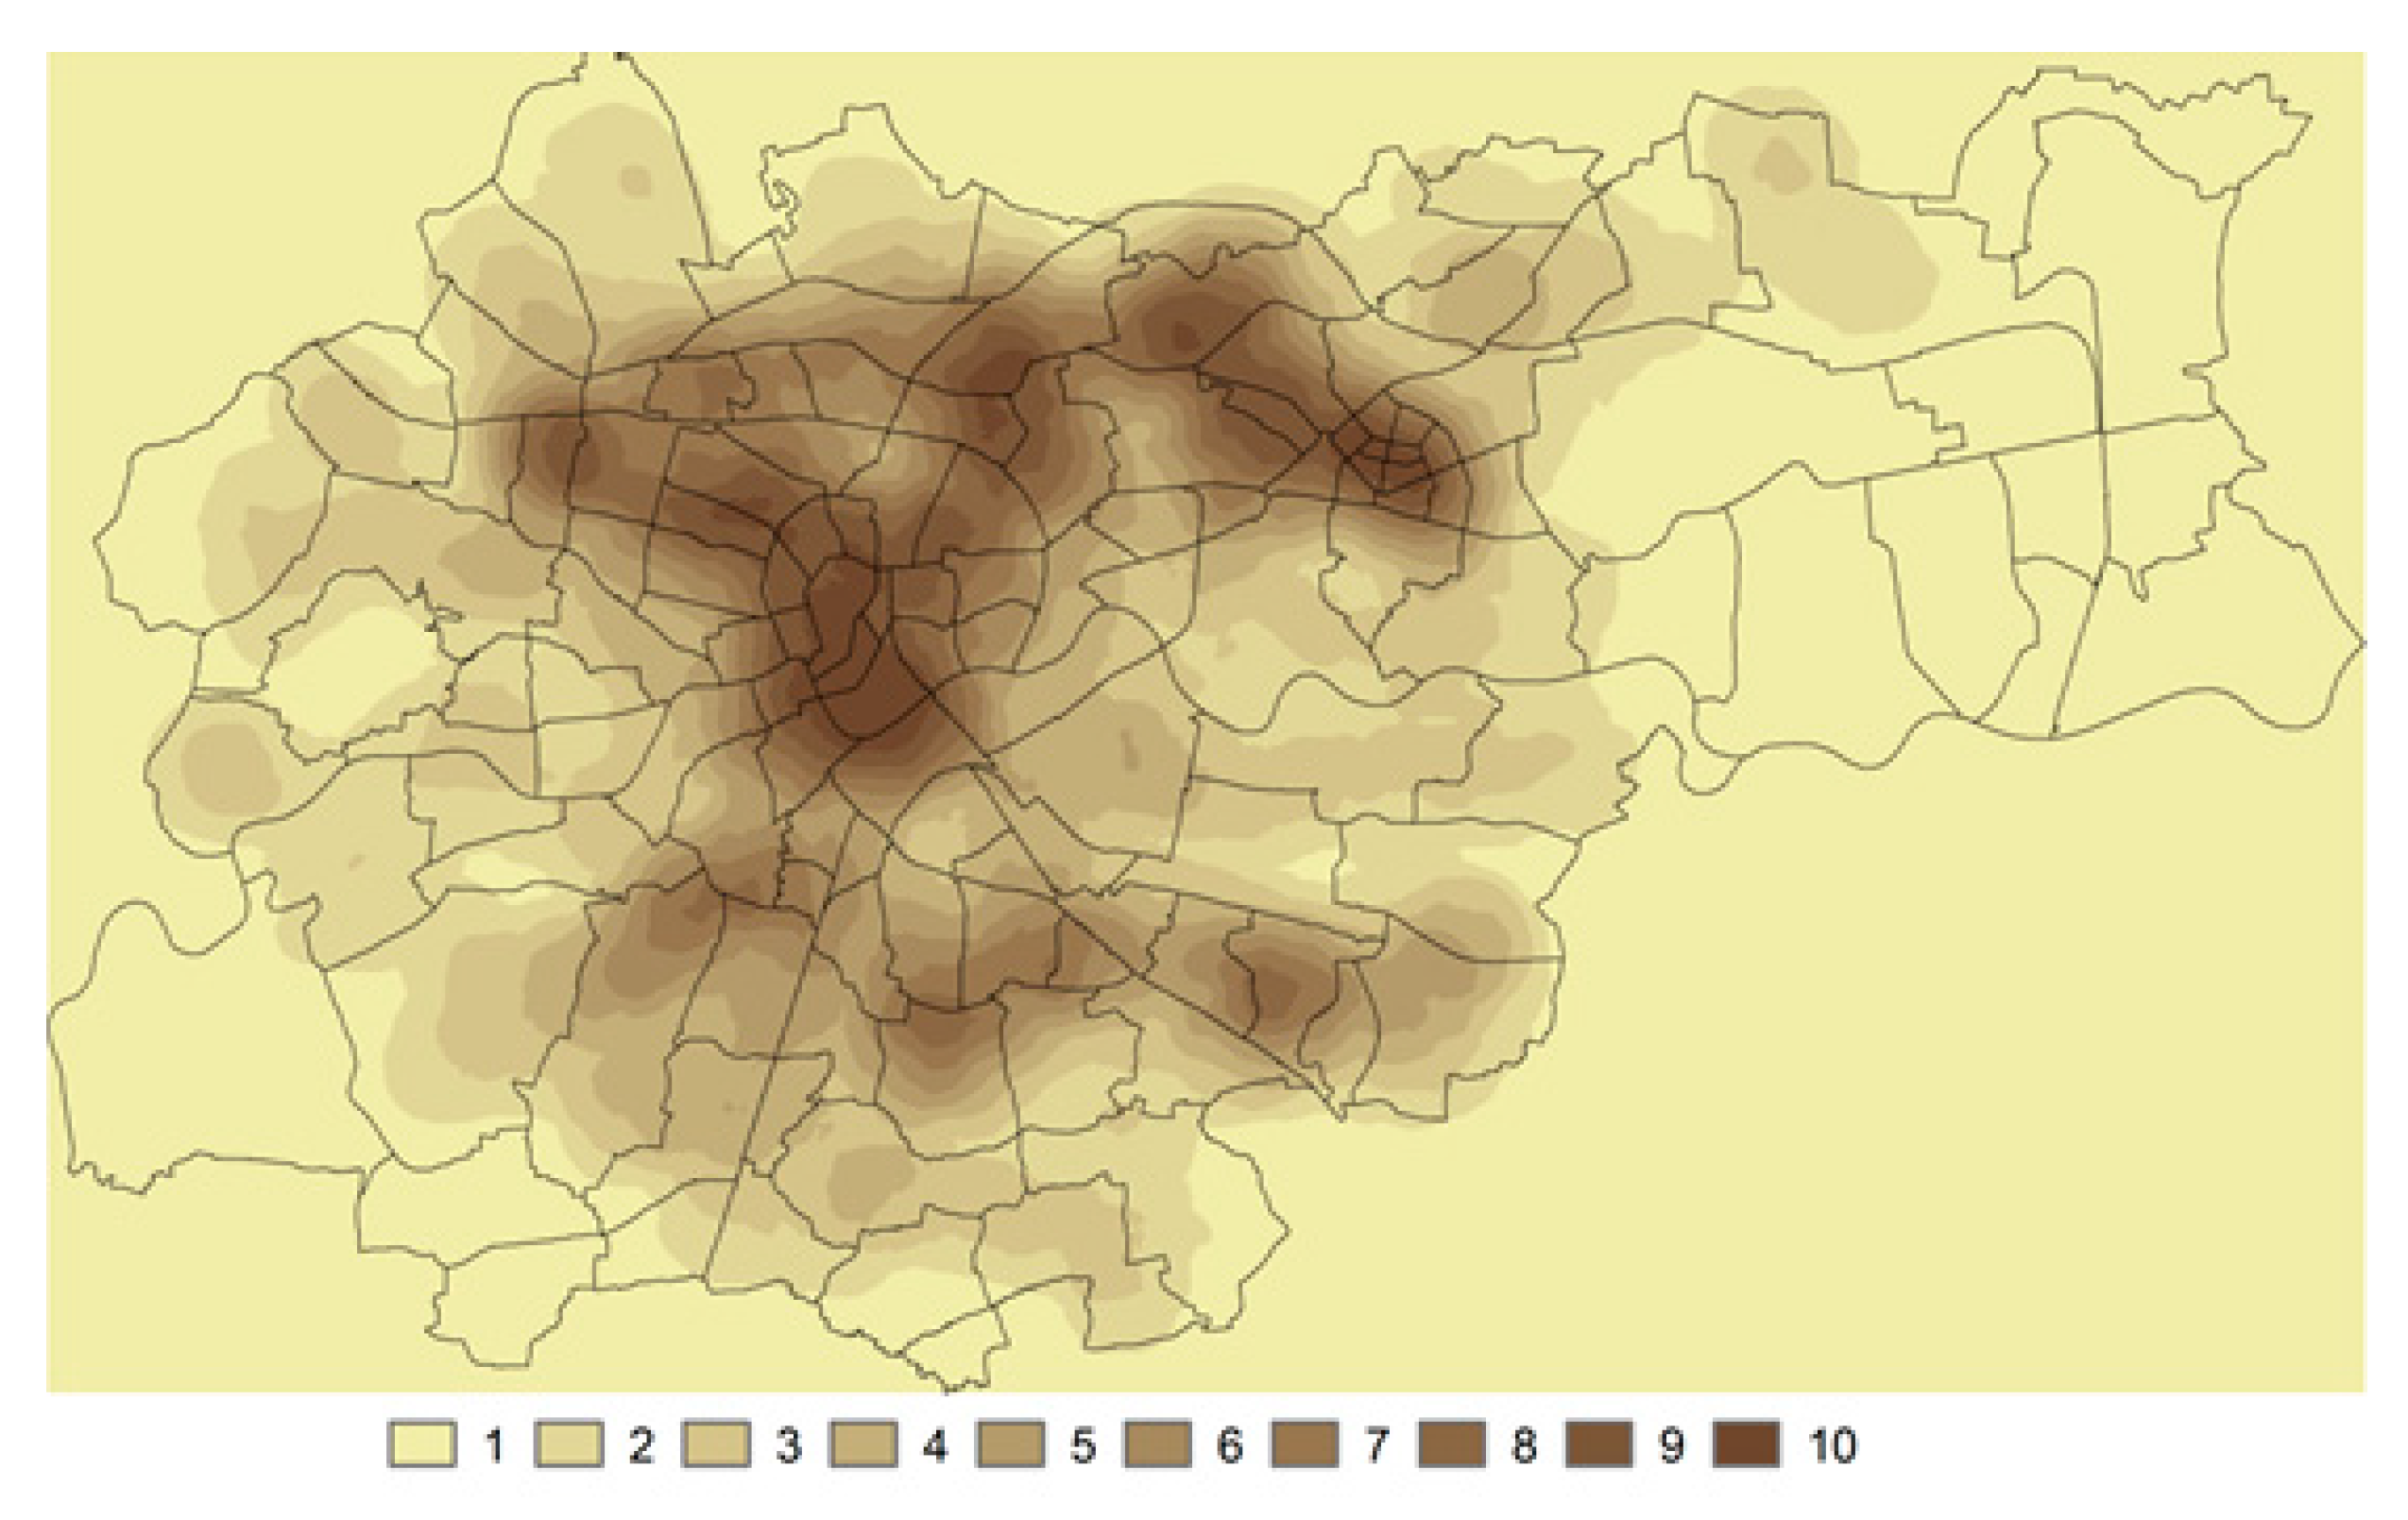
As mentioned before, to study the attractiveness of the urban area for pedestrian movement, it was assumed that important factors are the proximity of public transport stops, different amenities, parks and recreational places, as well as appropriate infrastructure in the form of pavement network. Density estimations are presented in Figure 3, Figure 4, Figure 5, Figure 6 and Figure 7.
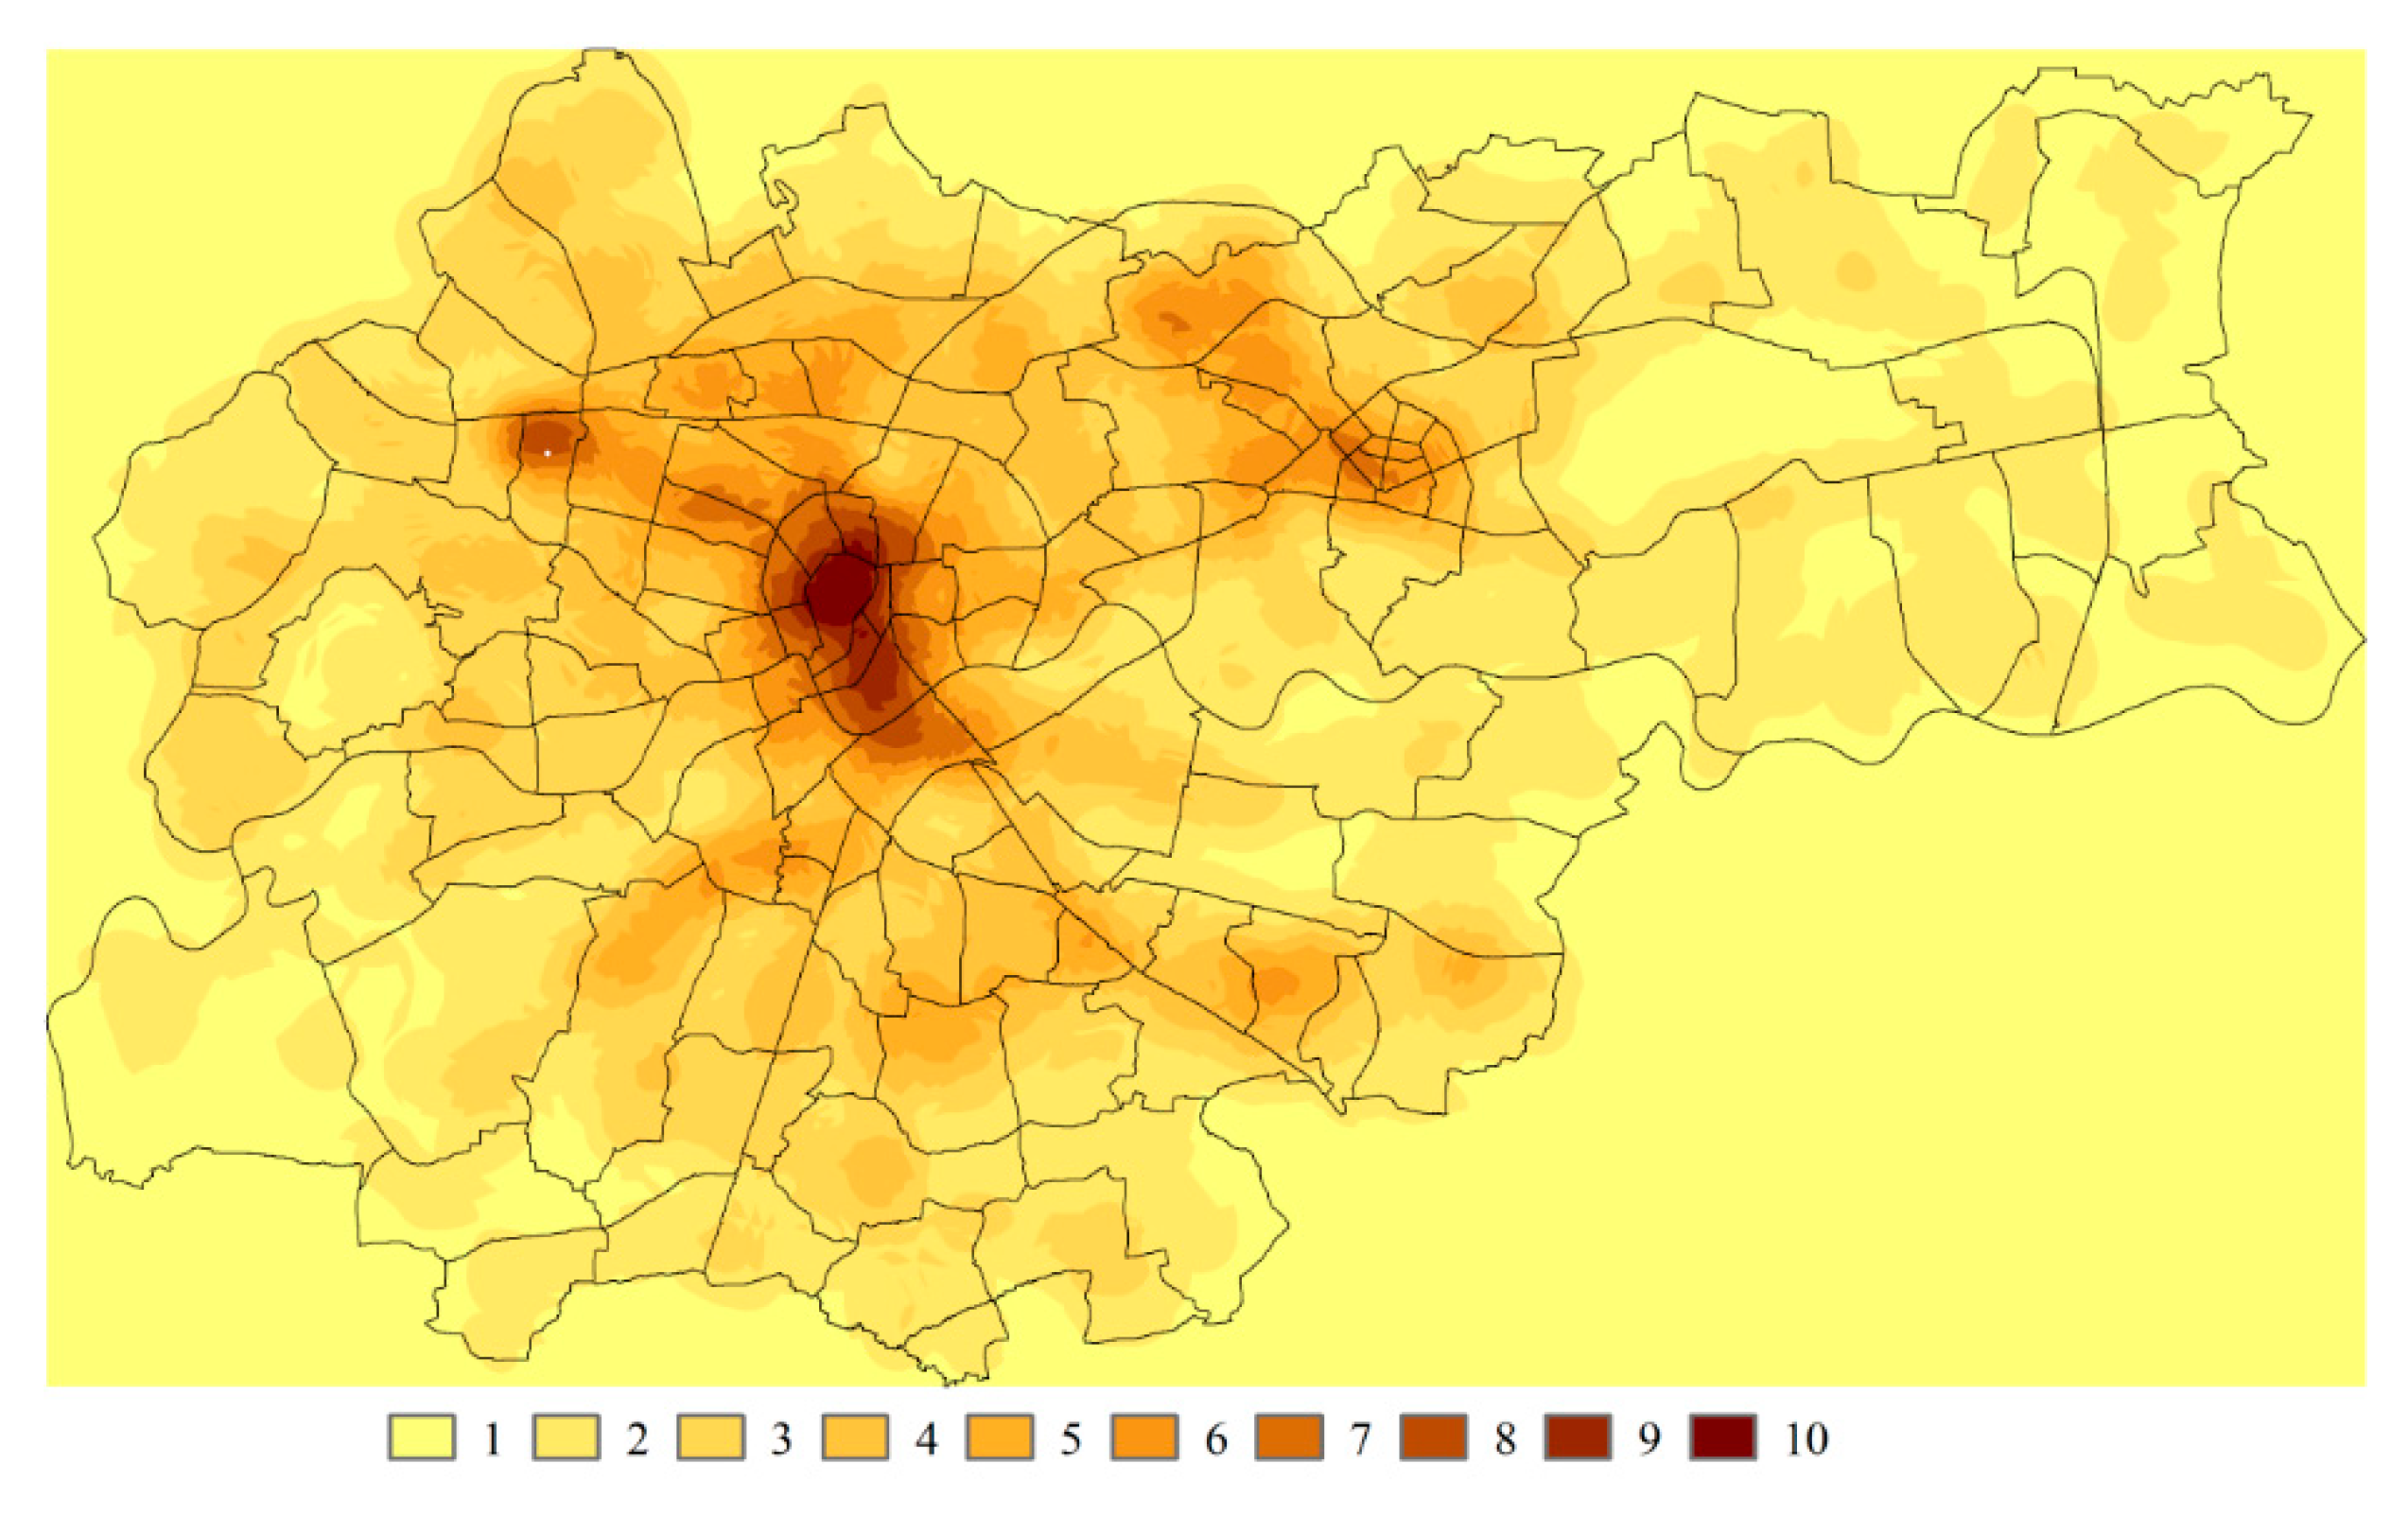
Using the estimated densities presented above, the walkability level indicator was estimated for Kraków urban area. Figure 8 shows the places that are the most favorable for pedestrian communication.
The walkability is ranked on a 1–10 scale. The highest level of the indicator is marked in brown, and the areas with the lowest walkability indicator are marked in yellow.
4.3. Discussion of Results
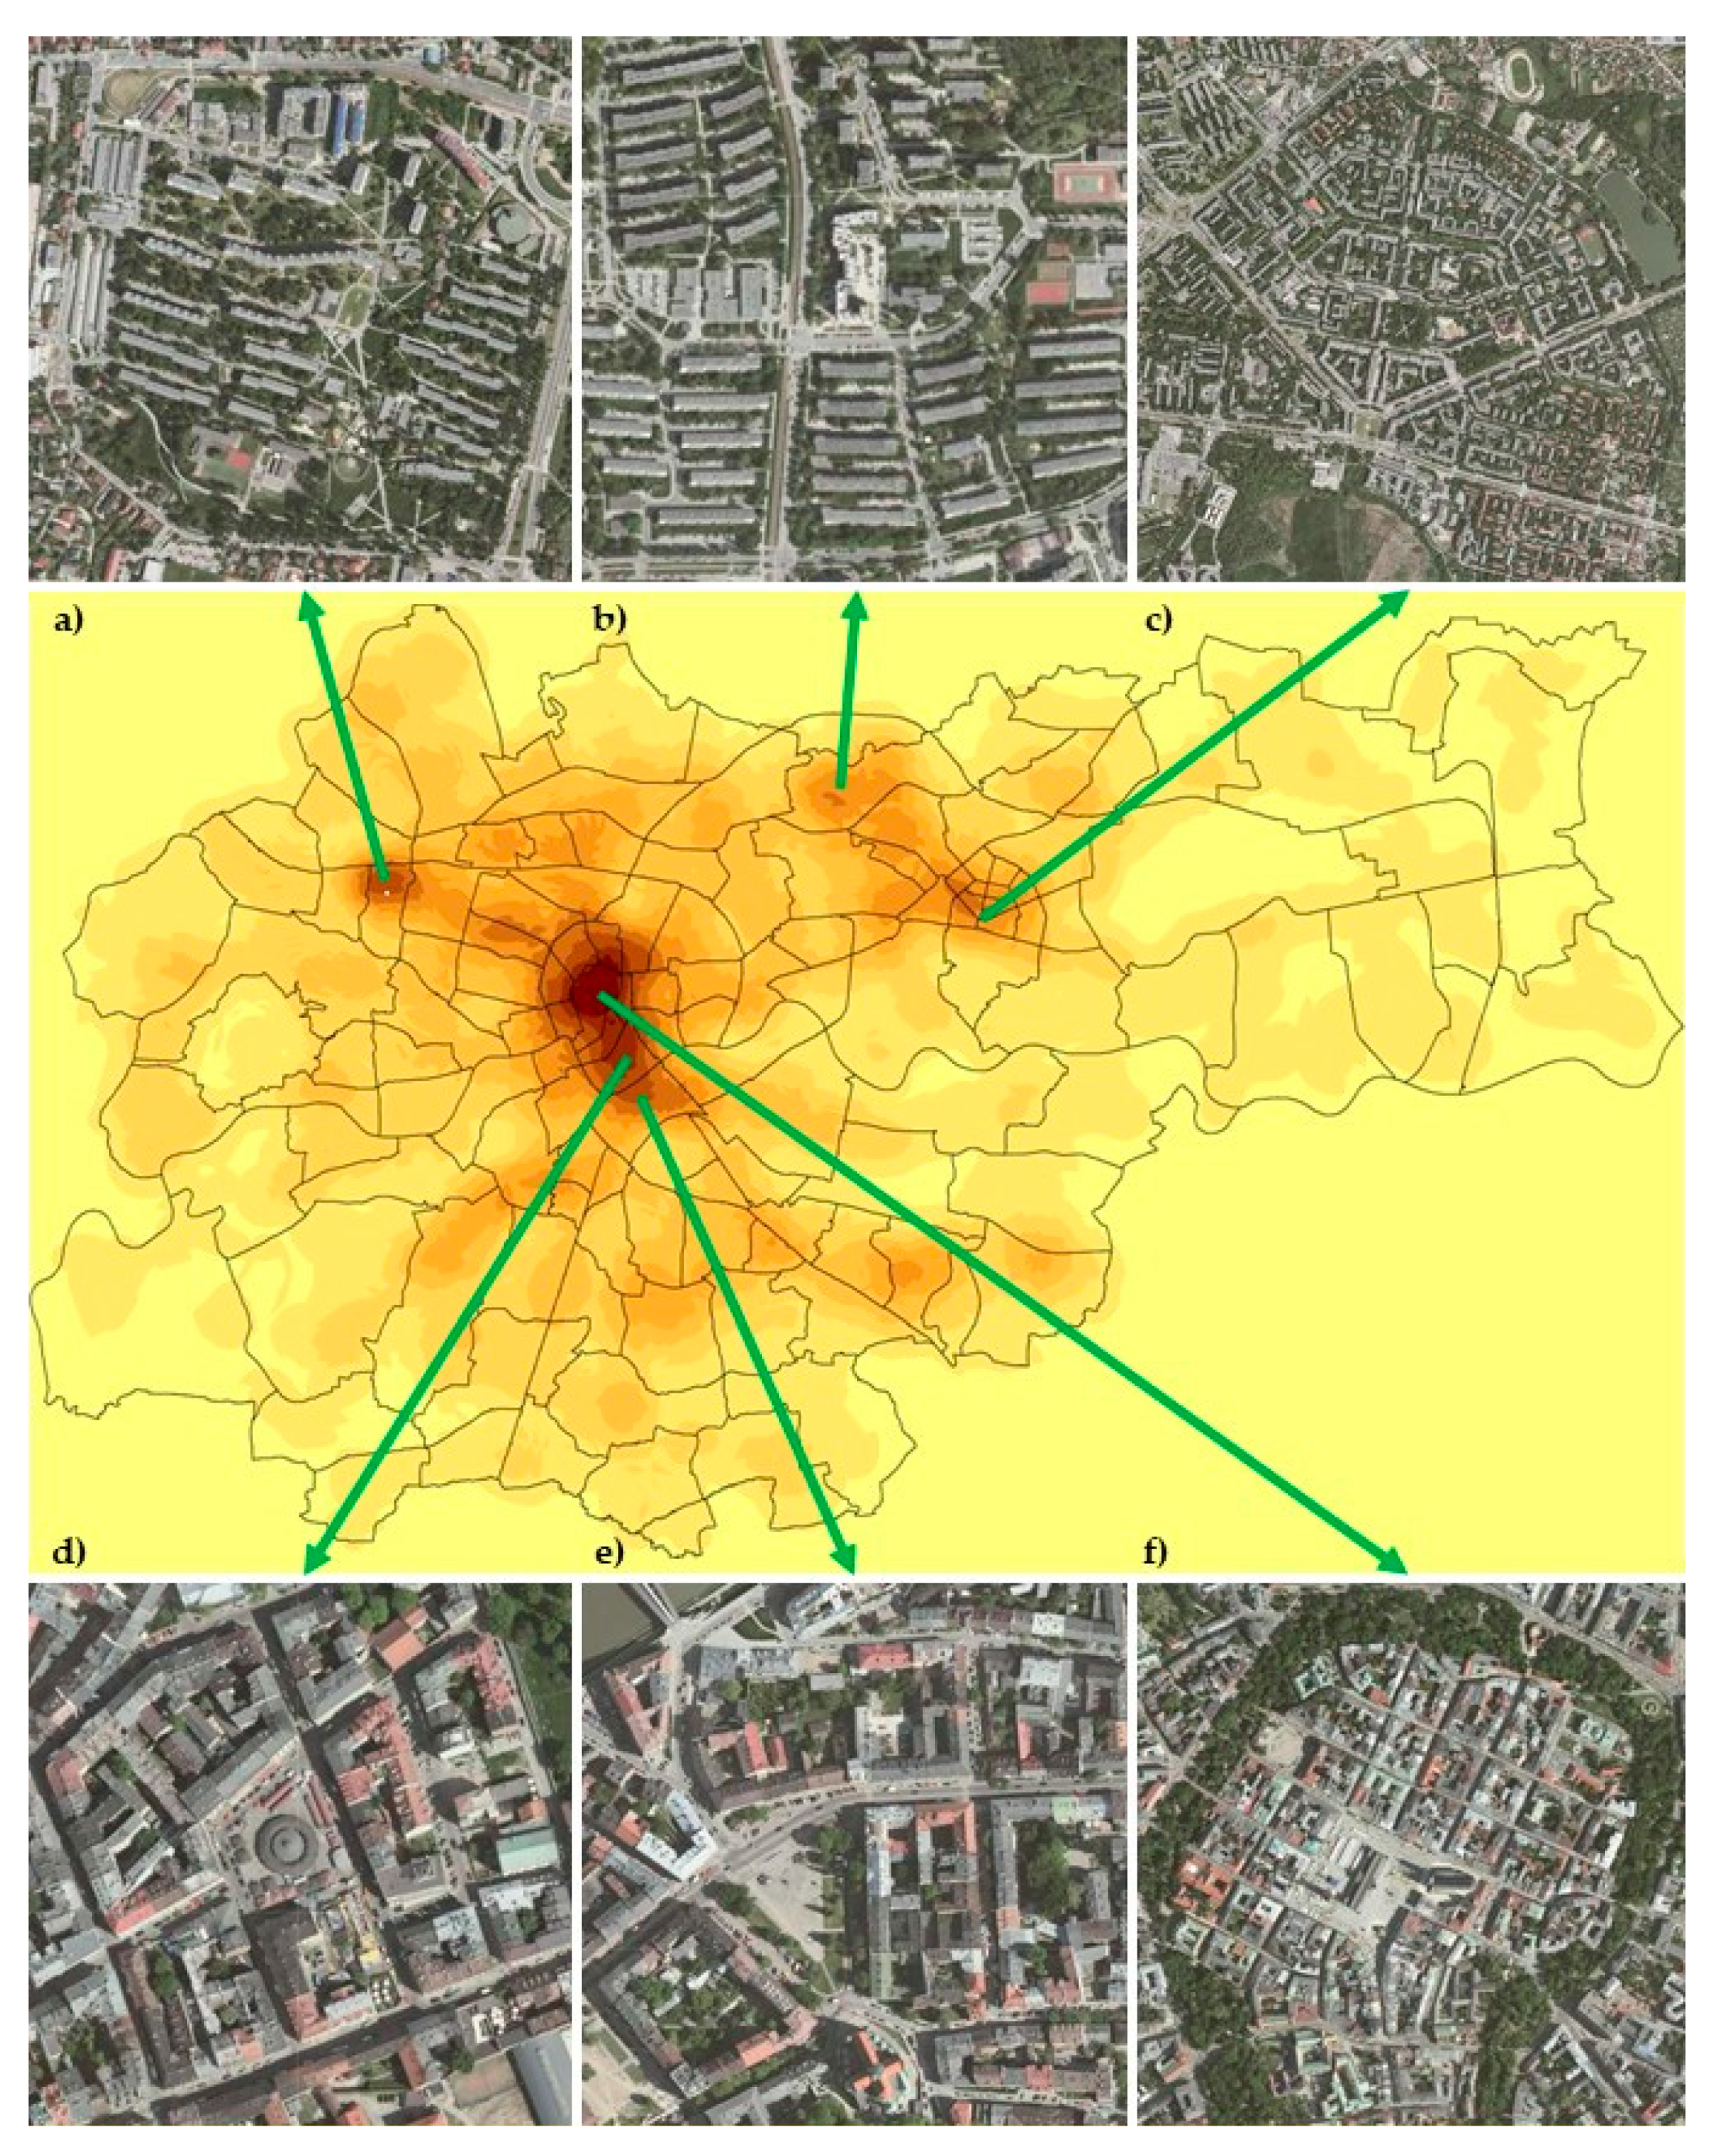
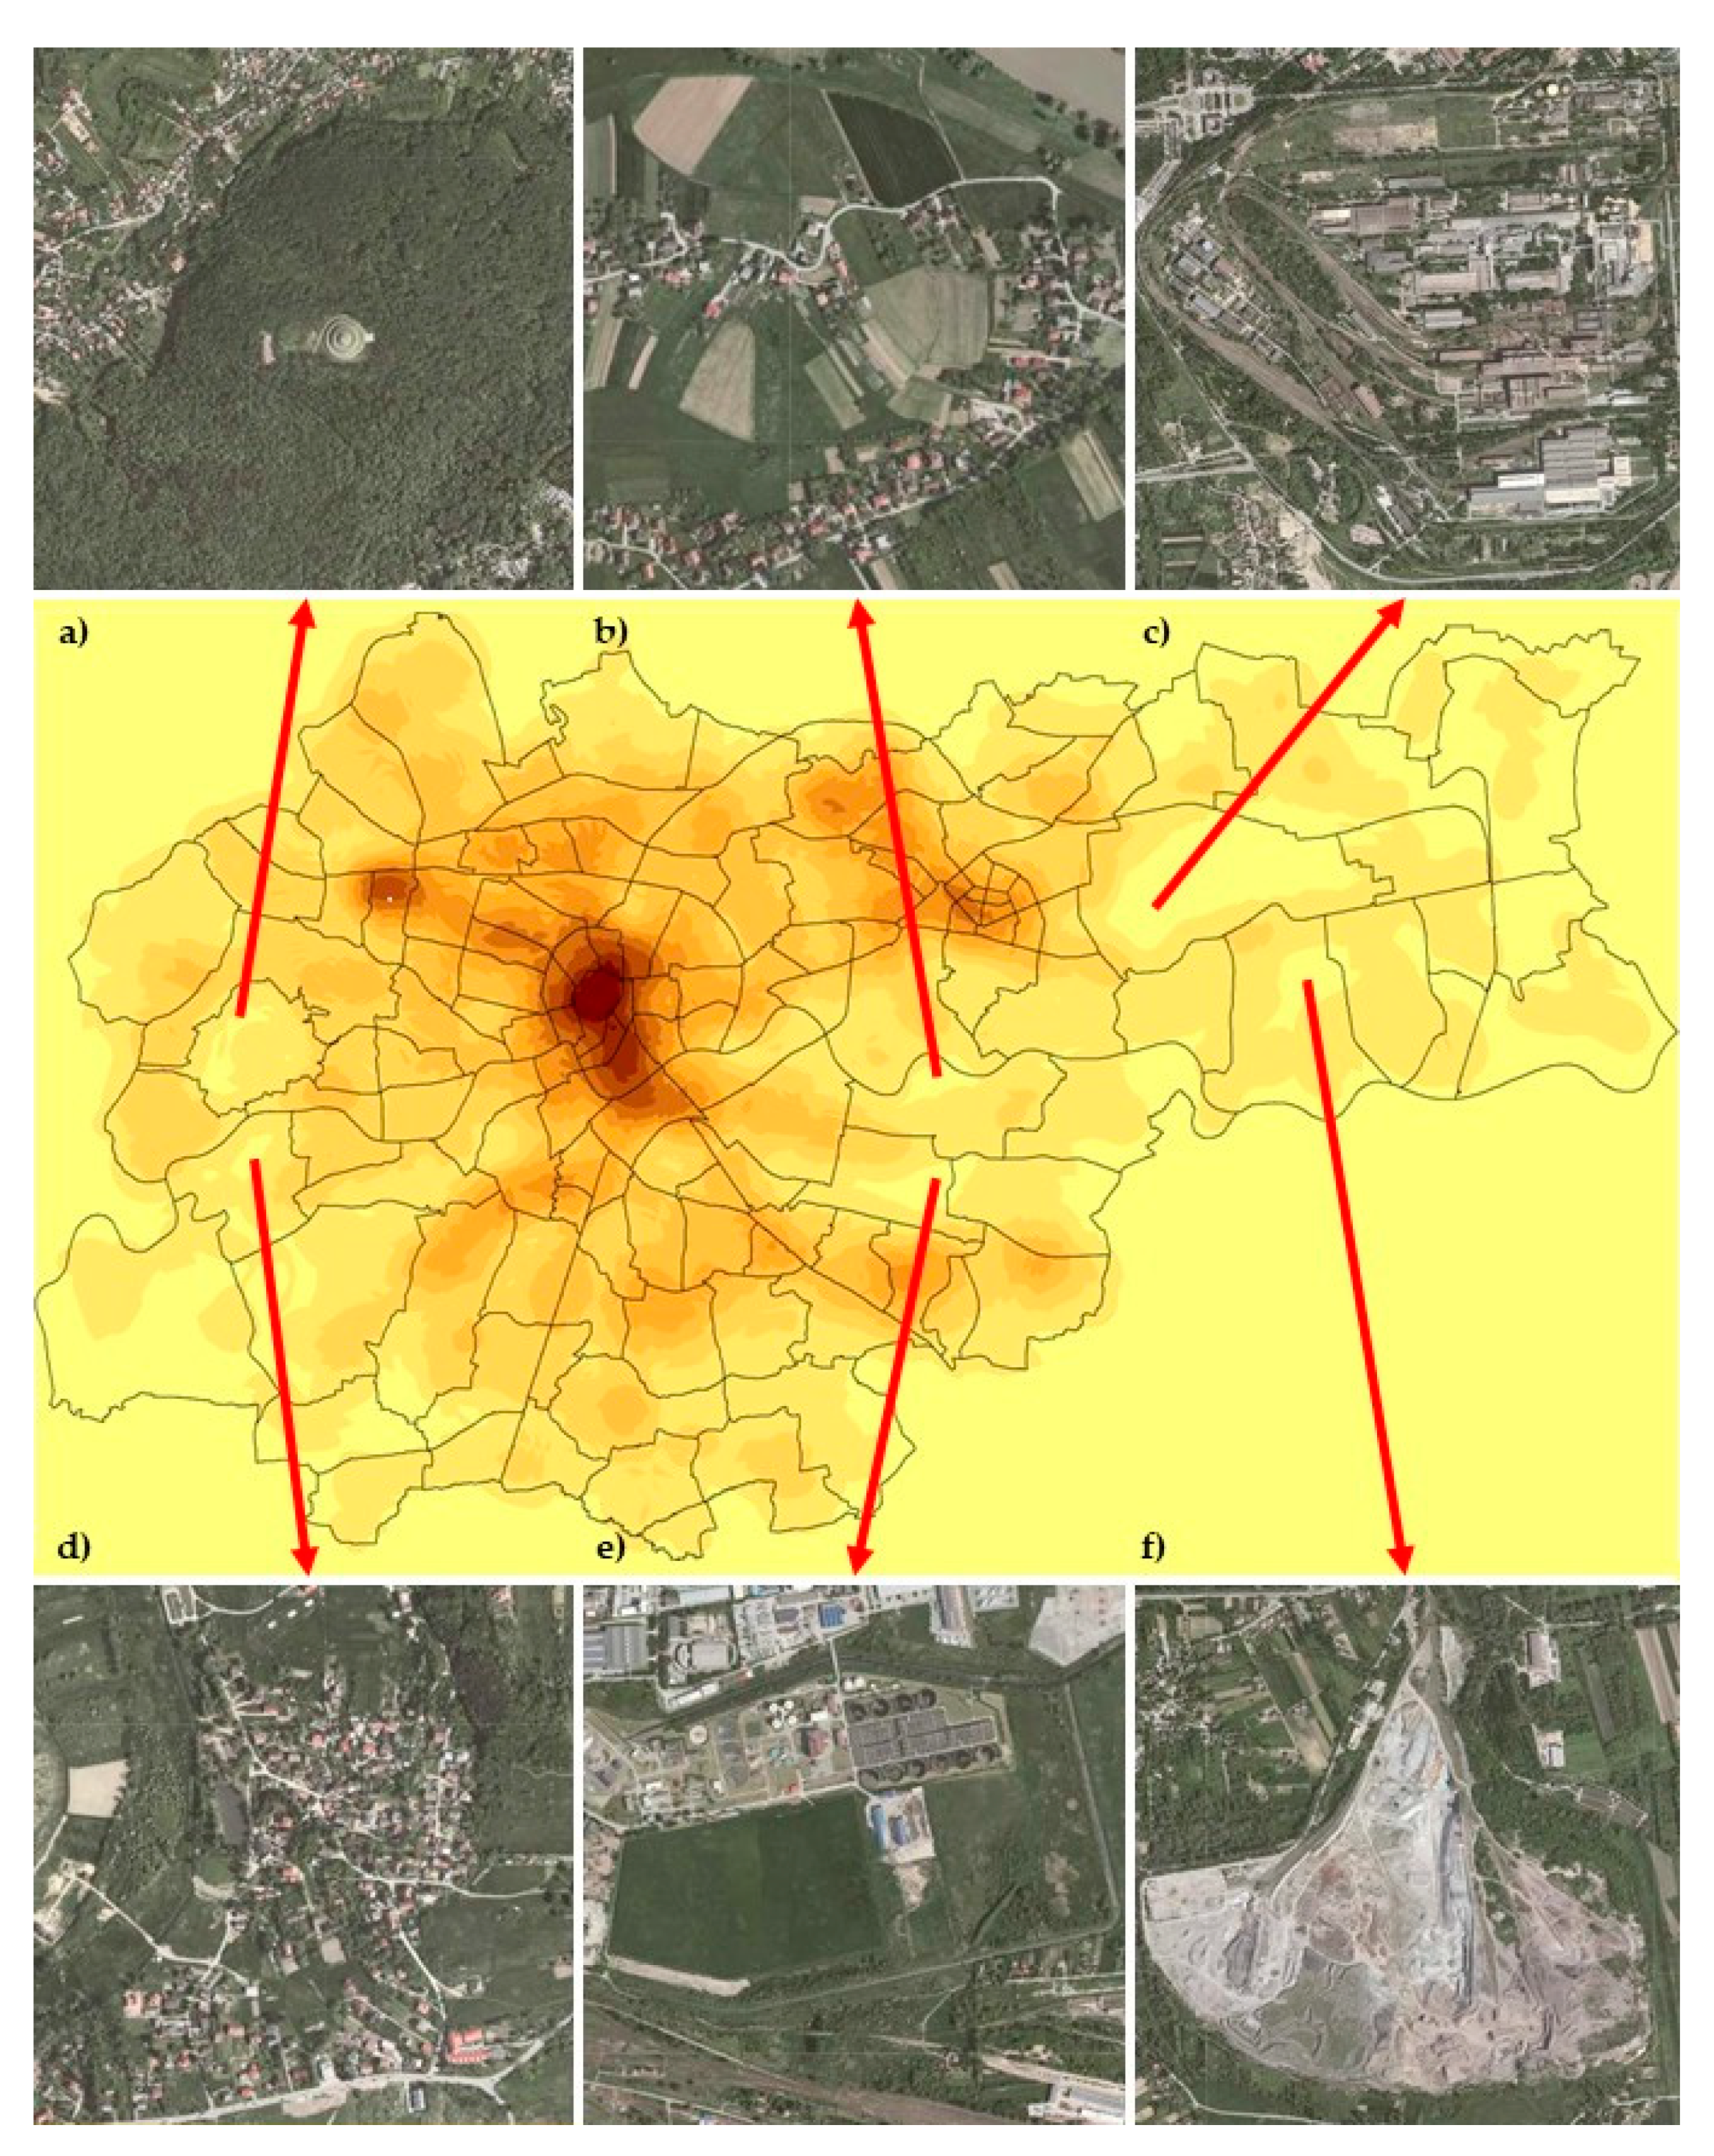
The urban units characterized by pedestrian-friendliness include the Old Town, Kazimierz and Podgórze districts, the central part of Nowa Huta district (with the Mistrzejowice estate) and Bronowice Małe, especially the Widok estate (to the west of the Old Town). The aforementioned districts with the highest walkability ratings are historical with well-organized urban structure (Figure 9). Districts or streets with the lowest level of walkability are new developments or places with dramatically poor pedestrian infrastructure (Figure 10).
It is clear that areas with more classical urban layout have greater pedestrian accessibility. The greatest value of walkability (10) was obtained for the Main Market Square, i.e., the largest square in Kraków, and its nearest surroundings (Figure 9f). The least accessible to pedestrians (1) are the areas located on the outskirts of the city. These are mainly industrial areas (Figure 10c,e,f), single-family housing (Figure 10b,d) or large green areas (Figure 10a).
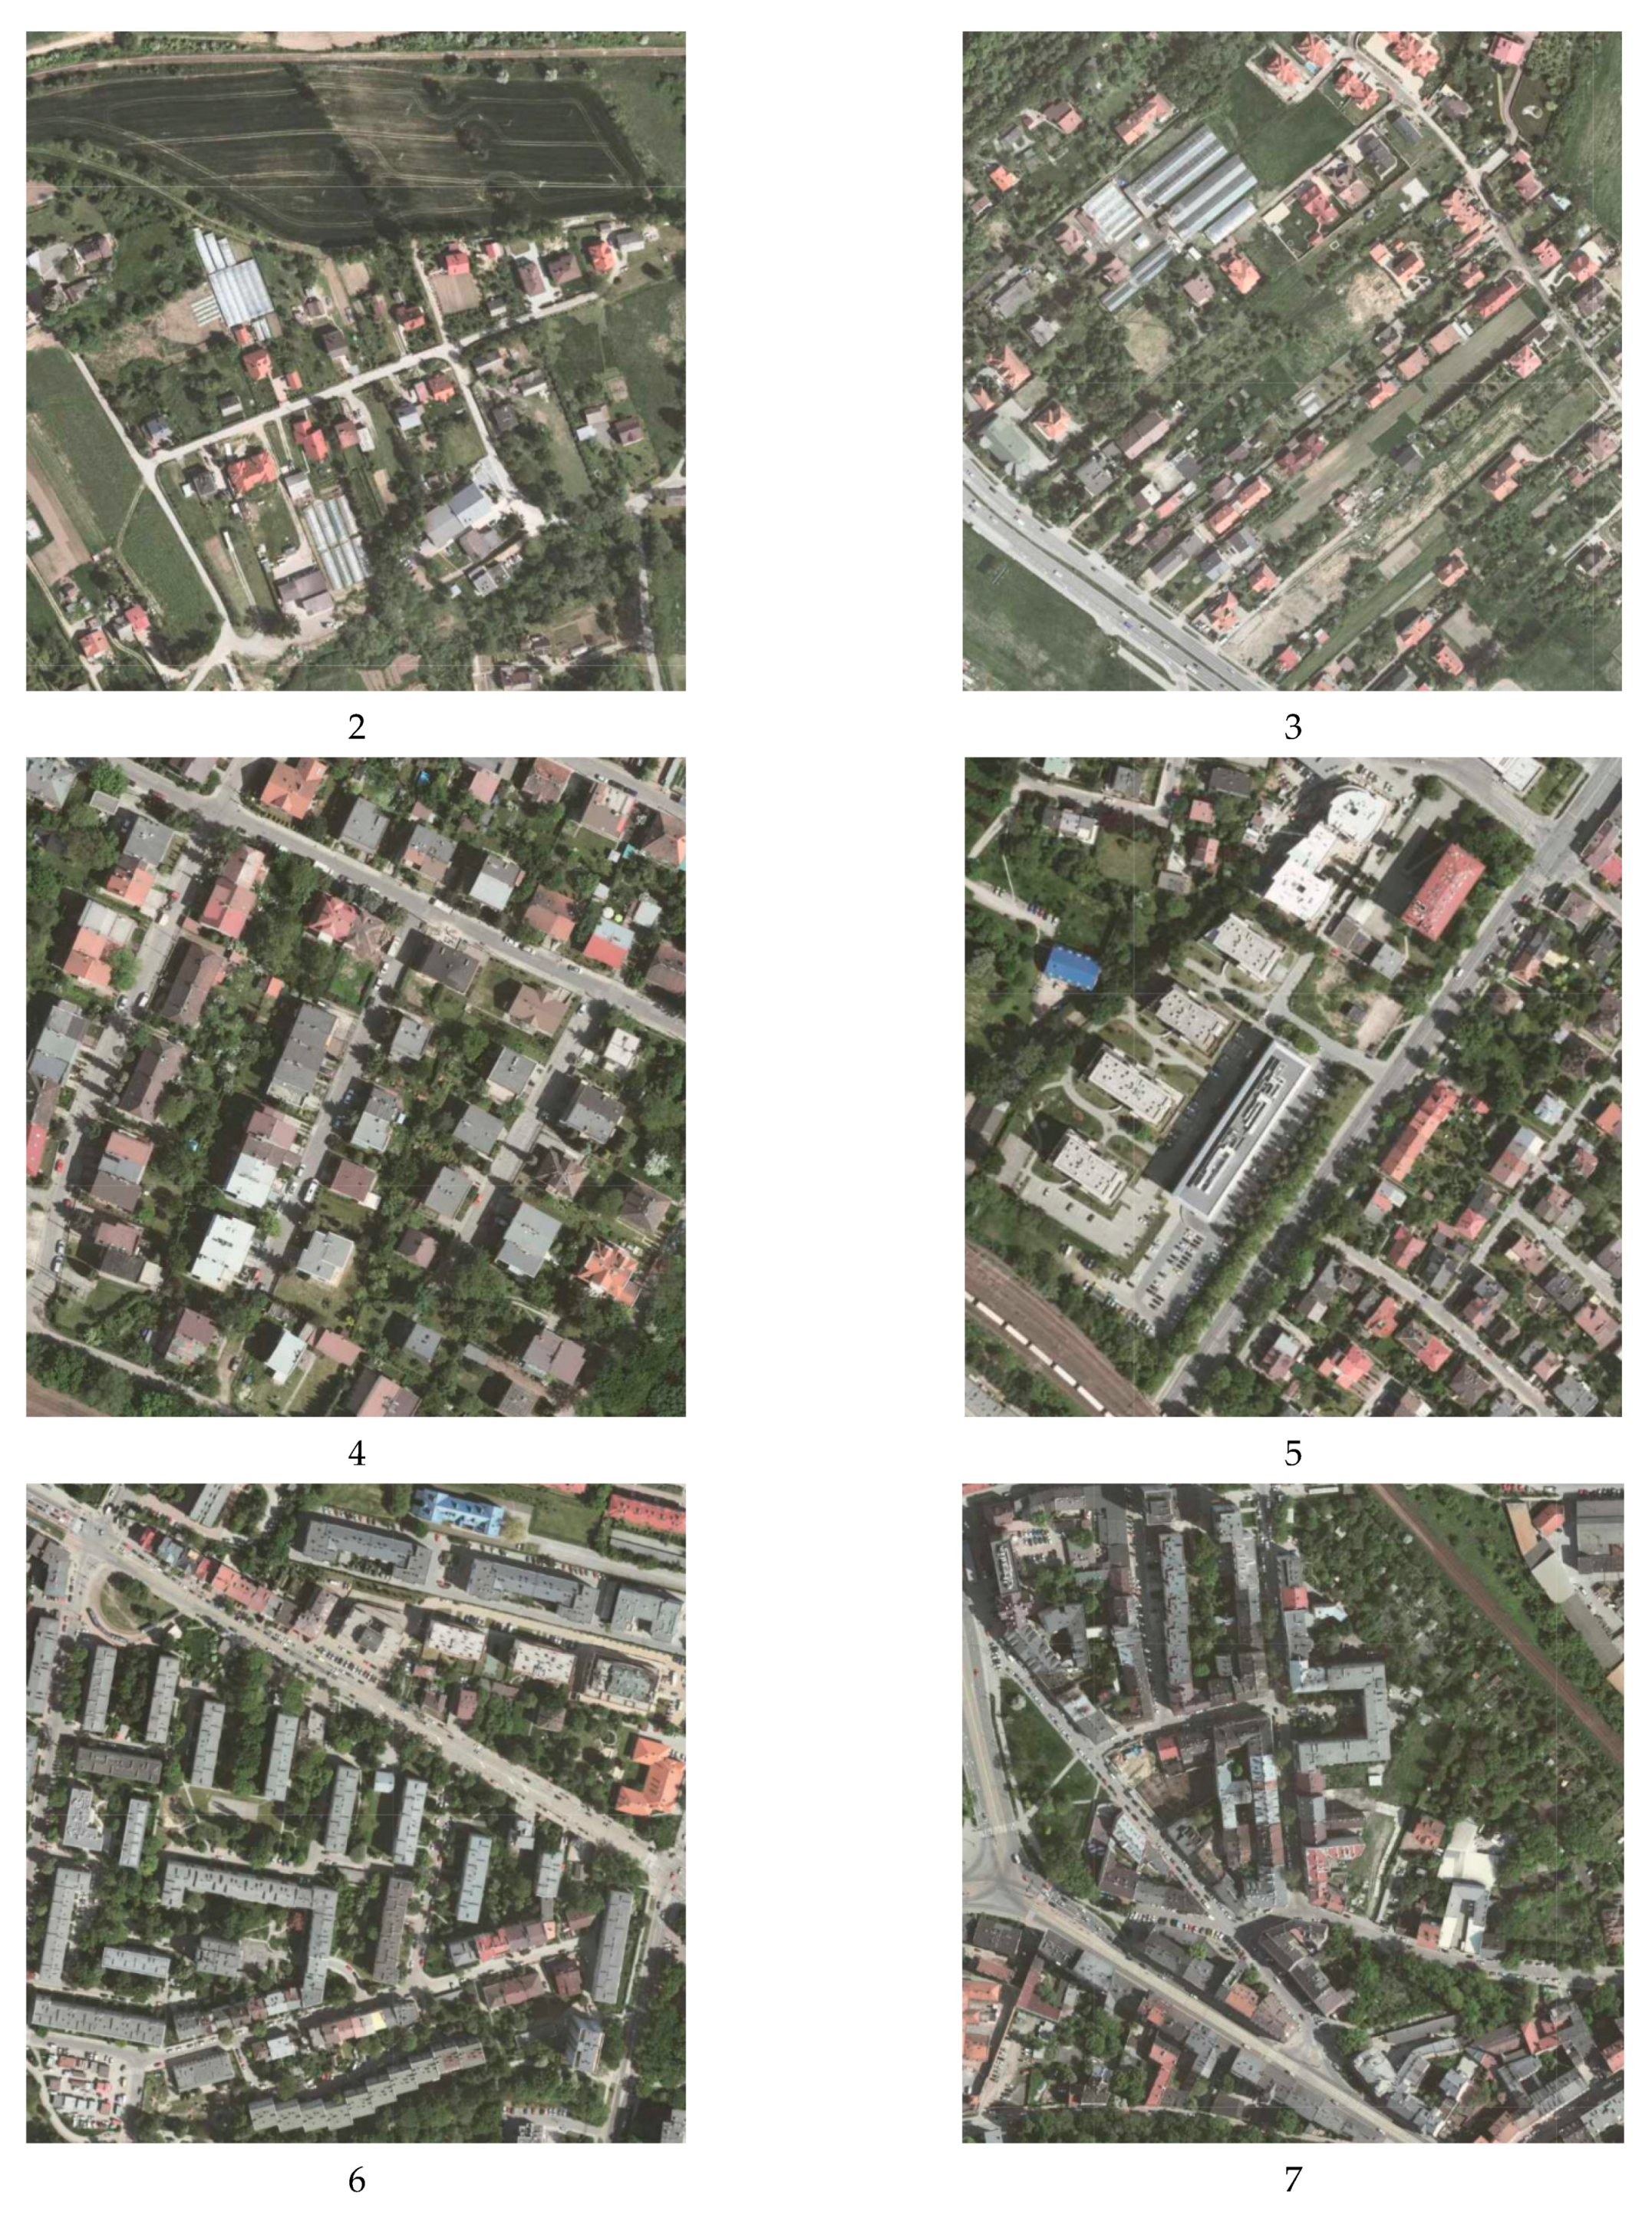
Regardless of extreme cases, the values of walkability we have determined for various areas of the city, i.e., the degree of pedestrian accessibility of these areas, may be an important indicator in the development of urban spatial policy and urban development strategies. The use of GIS tools allows for the precise identification of urban areas that require the development of pedestrian infrastructure. Examples of differences in the urban structure of areas with walkability values from 2 to 9 are presented in Figure 11.
The denser the buildings, the better the infrastructure for pedestrians and the greater accessibility to public transport, green areas and recreation, various attractions and shops. A greater value of walkability is achieved by areas occupied by multifamily buildings.
5. Conclusions
The proposed methodology has a diagnostic function, making it possible to clearly identify the problematic areas in the city or district. The methodology can be also used to forecast different states of land use and to predict the impact of changes in the location of various functions and pedestrian infrastructure on walkability. Thus, it will be possible for local governments to respond to the new developments or the setting up of new infrastructure. Data used in the research were sufficient (OpenStreetMap), but the quality needed to be controlled with Google StreetView, satellite images or a field study.
The biggest limitation of existing methods, based on direct audits or surveys, is their capital and time involvement [30,31,33]. Indicators such as Walk Score determine only the accessibility of various types of amenities, frequency of street intersection and building length [37]. Frank’s methodology points to limitations of the method, which does not take into account factors such as the occurrence of recreational areas or distance to public transport hubs [38]. The proposed method is distinguished by its simplicity and ease of application. It makes use of open-source data and includes accessibility to recreational areas, amenities and public transport but also takes into account pedestrian infrastructure.
As regards the results themselves, individually planned parts of the city present better walkability than other parts. Therefore, there should be an appropriate emphasis on conducting an appropriate spatial policy, increasing the level of walkability in the other districts that were not created as separate urban assumptions. The hypothesis has been partly confirmed. The new developments are not as pedestrian-friendly as the old settings. We are concerned that this is, unfortunately, a tendency in the whole country, where the owners and developers’ profit is more important than the quality of urban space.
The main conclusions of the work can be summarized as follows:
- Districts with the highest walkability ratings are historical with well-organized urban structure. Districts or streets with the lowest level of walkability are new developments or places with dramatically poor pedestrian infrastructure.
- The denser the buildings, the better the infrastructure for pedestrians. A greater value of walkability is achieved by areas occupied by multifamily buildings.
- The use of GIS tools allows for the precise identification of urban areas that require the development of pedestrian infrastructure.
A significant limitation of the method used is that equal weights were assigned to each component of the index. We found the independent development of the weights to be too arbitrary, while the use of the Delphi method goes beyond the scope of this work. Another important issue is the lack of data on the quality of pedestrian infrastructure (e.g., pavement surface and width).
We believe our work shows that the proposed method, due to its relative simplicity and universality, can be used to test walkability in various cities using existing data and GIS tools. Further research will be focused on determining the weights for the walkability index using the Delphi method and the comparison of research findings with the subjectively perceived walkability and audit methods. We also plan to expand the research area and apply the methodology in other cities.
It seems that the indicator can also be used in the process of spatial planning. For example, areas with high population densities and low walkability rates will require local government intervention.
Author Contributions
Conceptualization, A.T.; methodology, A.T.; software, A.T.; validation, A.T.; formal analysis, A.T.; investigation, A.T., I.T. and A.B.; resources, A.T. and I.T.; data curation, A.T. and I.T.; writing—original draft preparation, A.T., I.T. and A.B.; writing—review and editing, A.T., I.T. and A.B.; visualization, A.T. and A.B.; supervision, A.B.; project administration, A.T.; funding acquisition, A.T. and A.B. All authors have read and agreed to the published version of the manuscript.
Funding
This work was prepared within the scope of the research funds from Cracow University of Economics (Potencjał nr 5/EEN/2020/POT) and the AGH University of Science and Technology in Kraków.
Institutional Review Board Statement
Not applicable.
Informed Consent Statement
Not applicable.
Data Availability Statement
This study analyzed publicly available datasets. This data can be found here: [https://msip.krakow.pl, https://www.openstreetmap.org] (accessed on 18 December 2020).
Conflicts of Interest
The authors declare no conflict of interest.
References
- World Commission on Environment and Development. Our Common Future; Oxford University Press: Oxford, UK, 1987. [Google Scholar]
- United Nations, Department of Economic and Social Affairs, Population Division. World Urbanization Prospects 2014: Highlights. Available online: https://population.un.org/wup/Publications/Files/WUP2014-Report.pdf (accessed on 18 December 2020).
- United Nations, Department of Economic and Social Affairs, Population Division. World Urbanization Prospects 2018: Highlights. Available online: https://population.un.org/wup/Publications/Files/WUP2018-Report.pdf (accessed on 18 December 2020).
- James, P. Urban. Sustainability in Theory and Practice: Circles of Sustainability; Routledge: London, UK, 2015. [Google Scholar]
- Hall, P.; Pfeiffer, U. Urban. Future 21: A Global Agenda for Twenty-First Century Cities; Routledge: London, UK, 2000. [Google Scholar]
- Keiner, M.; Zegras, C.; Schmid, W.A. (Eds.) From Understanding to Action: Sustainable Urban. Development in Medium-Sized Cities in Africa and Latin America; Springer: Dordrecht, The Netherlands, 2004. [Google Scholar]
- Wheeler, S. Sustainable Urban. Development: A Literature Review and Analysis; University of California at Berkeley: Berkeley, CA, USA, 1996. [Google Scholar]
- Haughton, G.; Hunter, C. Sustainable Cities; Routledge: London, UK; New York, NY, USA, 2004. [Google Scholar]
- Hiremath, R.B.; Balachandra, P.; Kumar, P.; Bansode, S.S.; Murali, J. Indicator-based urban sustainability—A review. Energy Sustain. Dev. 2013, 17, 555–563. [Google Scholar] [CrossRef]
- Congress for the New Urbanism. The Charter of New Urbanism; McGraw-Hill: New York, NY, USA, 1999. [Google Scholar]
- The European Council of Town Planners. The New Charter of Athens; Alinea: Firenze, Italy, 2003. [Google Scholar]
- Congress for the New Urbanism. Strategic Plan 2020. Available online: https://www.cnu.org/sites/default/files/StrategicPlan_2020.pdf (accessed on 18 December 2020).
- Leslie, E.; Coffee, N.; Frank, L.; Owen, N.; Bauman, A.; Hugo, G. Walkability of local communities: Using geographic information systems to objectively assess relevant environmental attributes. Health Place 2007, 13, 111–122. [Google Scholar] [CrossRef] [PubMed]
- Speck, J. Walkable City: How Downtown Can Save America, One Step at a Time; North Point Press: New York, NY, USA, 2013. [Google Scholar]
- Talen, E.; Koschinsky, J. The walkable neighbourhood: A literature review. Int. J. Sustain. Land Use Urban. Plan. 2013, 1, 42–63. [Google Scholar]
- Frank, L.; Kerr, J.; Chapman, J.; Sallis, J. Urban form relationships with walk trip frequency and distance among youth. Am. J. Health Promot. 2007, 21, 305–311. [Google Scholar] [CrossRef] [PubMed]
- Doyle, S.; Kelly-Schwartz, A.; Schlossberg, M.; Stockard, J. Active community environments and health: The relationship of walkable and safe communities to individual health. J. Am. Plan. Assoc. 2006, 72, 19–31. [Google Scholar] [CrossRef]
- Giles-Corti, B.; Donovan, R.J. The relative influence of individual, social and physical environment determinants of physical activity. Soc. Sci. Med. 2002, 54, 1793–1812. [Google Scholar] [CrossRef]
- Troped, P.J.; Saunders, R.P.; Pate, R.R.; Reininger, B.; Ureda, J.R.; Thompson, S.J. Associations between self-reported and objective physical environmental factors and use of a community rail-trail. Prev. Med. 2001, 32, 191–200. [Google Scholar] [CrossRef] [PubMed]
- Carswell, A.; Zahirovic-Herbert, V.; Gibler, K. Who Cares About Walk Scores? A Quantile Approach to Residential House Prices and Walkability; European Real Estate Society (ERES): Bergisch Gladbach, Germany, 2016. [Google Scholar]
- Gilderbloom, J.I.; Riggs, W.W.; Meares, W.L. Does walkability matter? An examination of walkability’s impact on housing values, foreclosures and crime. Cities 2015, 42, 13–24. [Google Scholar] [CrossRef]
- Sohn, D.W.; Moudon, A.V.; Lee, J. The economic value of walkable neighborhoods. Urban. Des. Int. 2012, 17, 115–128. [Google Scholar] [CrossRef]
- Cervero, R.; Kockelman, K. Travel demand and the 3Ds: Density, diversity, and design. Transp. Res. Part D Transp. Environ. 1997, 2, 199–219. [Google Scholar] [CrossRef]
- Lee, C.; Moudon, A.V. The 3Ds+ R: Quantifying land use and urban form correlates of walking. Transp. Res. Part D Transp. Environ. 2006, 11, 204–215. [Google Scholar] [CrossRef]
- Ewing, R.; Clemente, O. Measuring Urban Design: Metrics for Liveable Places; Island Press: Washington, DC, USA, 2013. [Google Scholar]
- Ramirez, L.K.B.; Hoehner, C.M.; Brownson, R.C.; Cook, R.; Orleans, C.T.; Hollander, M.; Barker, D.C.; Bors, P.; Ewing, R.; Killingsworth, R.; et al. Indicators of activity-friendly communities: An evidence-based consensus process. Am. J. Prev. Med. 2006, 31, 515–524. [Google Scholar] [CrossRef]
- Ewing, R.; Hajrasouliha, A.; Neckerman, K.; Purciel-Hill, K.M.; Greene, W. Streetscape features related to pedestrian activity. J. Plan. Educ. Res. 2016, 36, 5–15. [Google Scholar] [CrossRef] [Green Version]
- Moura, F.; Cambra, P.; Goncalves, A.B. Measuring walkability for distinct pedestrian groups with a participatory assessment method: A case study in Lisbon. Landsc. Urban. Plan. 2017, 157, 282–296. [Google Scholar] [CrossRef]
- Pikora, T.; Giles-Corti, B.; Bull, F.; Jamrozik, K.; Donovan, R. Developing a framework for assessment of the environmental determinants of walking and cycling. Soc. Sci. Med. 2003, 56, 1693–1703. [Google Scholar] [CrossRef]
- Craig, C.L.; Brownson, R.C.; Cragg, S.E.; Dunn, A.L. Exploring the effect of the environment on physical activity: A study examining walking to work. Am. J. Prev. Med. 2002, 23, 36–43. [Google Scholar] [CrossRef]
- Pikora, T.J.; Bull, F.C.; Jamrozik, K.; Knuiman, M.; Giles-Corti, B.; Donovan, R.J. Developing a reliable audit instrument to measure the physical environment for physical activity. Am. J. Prev. Med. 2002, 23, 187–194. [Google Scholar] [CrossRef]
- Frank, L.D.; Greenwald, M.J.; Kavage, S.; Devlin, A. An Assessment of Urban form and Pedestrian and Transit Improvements as an Integrated GHG Reduction Strategy; Washington State Department of Transportation: Washington, DC, USA, 2011.
- Lee, S.; Talen, E. Measuring walkability: A note on auditing methods. J. Urban. Des. 2014, 19, 372–374. [Google Scholar] [CrossRef]
- Clarke, P.; Ailshire, J.; Melendez, R.; Bader, M.; Morenoff, J. Using Google Earth to conduct a neighborhood audit: Reliability of a virtual audit instrument. Health Place 2010, 16, 1224–1229. [Google Scholar] [CrossRef] [PubMed] [Green Version]
- Rundle, A.G.; Bader, M.D.; Richards, C.A.; Neckerman, K.M.; Teitler, J.O. Using Google Street View to audit neighborhood environments. Am. J. Prev. Med. 2011, 40, 94–100. [Google Scholar] [CrossRef] [PubMed] [Green Version]
- Brownson, R.C.; Hoehner, C.M.; Day, K.; Forsyth, A.; Sallis, J.F. Measuring the built environment for physical activity: State of the science. Am. J. Prev. Med. 2009, 36, 99–123. [Google Scholar] [CrossRef] [PubMed] [Green Version]
- Walk Score®. Available online: https://www.walkscore.com/ (accessed on 18 December 2020).
- Frank, L.D.; Schmid, T.L.; Sallis, J.F.; Chapman, J.; Saelens, B.E. Linking objectively measured physical activity with objectively measured urban form: Findings from SMARTRAQ. Am. J. Prev. Med. 2005, 28, 117–125. [Google Scholar] [CrossRef] [PubMed]
- Majic, I.; Pafka, E. AwaP-IC—An Open-Source GIS Tool for Measuring Walkable Access. Urban Sci. 2019, 3, 48. [Google Scholar] [CrossRef] [Green Version]
- Ewing, R.; Handy, S. Measuring the unmeasurable: Urban design qualities related to walkability. J. Urban Des. 2009, 14, 65–84. [Google Scholar] [CrossRef]
- Purciel, M.; Neckerman, K.M.; Lovasi, G.S.; Quinn, J.W.; Weiss, C.H.; Bader, M.; Ewing, R.; Rundle, A. Creating and validating GIS measures of urban design for health research. J. Environ. Psychol. 2009, 29, 457–466. [Google Scholar] [CrossRef] [PubMed] [Green Version]
- Yin, L.; Wang, Z. Measuring visual enclosure for street walkability: Using machine learning algorithms and Google Street View imagery. Appl. Geogr. 2016, 76, 147–153. [Google Scholar] [CrossRef]
- Yin, L. Street level urban design qualities for walkability: Combining 2D and 3D GIS measures. Comput. Environ. Urban. Syst. 2017, 64, 288–296. [Google Scholar] [CrossRef]
- ArcGIS Pro. Available online: https://pro.arcgis.com/en/pro-app/tool-reference/spatial-analyst/how-kernel-density-works.htm (accessed on 18 December 2020).
- Silverman, B.W. Density Estimation for Statistics and Data Analysis; Chapman and Hall: London, UK, 1986. [Google Scholar]
- Mocnik, F.B.; Mobasheri, A.; Zipf, A. Open source data mining infrastructure for exploring and analysing OpenStreetMap. Open Geospat. Data Softw. Stand. 2018, 3, 7. [Google Scholar] [CrossRef]
- Bieda, A.; Bydlosz, J.; Parzych, P.; Pukanská, K.; Wójciak, E. 3D Technologies as the Future of Spatial Planning: The Example of Krakow. Geomat. Environ. Eng. 2020, 14, 15–33. [Google Scholar] [CrossRef]
- Bogacki, M.; Oleniacz, R.; Rzeszutek, M.; Bździuch, P.; Szulecka, A.; Gorzelnik, T. Assessing the Impact of Road Traffic Reorganization on Air Quality: A Street Canyon Case Study. Atmosphere 2020, 11, 695. [Google Scholar] [CrossRef]
- Drabicki, A.; Szarata, A.; Kucharski, R. Suppressing the effects of induced traffic in urban road systems: Impact assessment with macrosimulation tools-results from the city of Krakow (Poland). Transp. Res. Procedia 2020, 47, 131–138. [Google Scholar] [CrossRef]
- Siejka, M.; Relidzynski, K. Extension of the Road Network as the Determinant of Development of the Regions on the Example of Cracow (Poland). IOP Conf. Ser.: Mater. Sci. Eng. 2019, 603, 022057. [Google Scholar] [CrossRef]
- Gyurkovich, J. Living Space in A City-Selected Problems of Shaping Modern Housing Complexes in Cracow-A Multiple Case Studies: Part 2–The Case Study of High Density Forms of Multi-Family Residential Buildings. IOP Conf. Ser. Mater. Sci. Eng. 2019, 471, 092016. [Google Scholar] [CrossRef]
- Gyurkovich, M. Sotoca, A Quality of Social Space in selected contemporary multifamily housing complexes in Poland’s three biggest cities. IOP Conf. Ser. Mater. Sci. Eng. 2019, 471, 092009. [Google Scholar] [CrossRef]
- Kukulska-Kozieł, A.; Szylar, M.; Cegielska, K.; Noszczyk, T.; Hernik, J.; Gawroński, K.; Dixon-Gough, R.; Jombach, S.; Valánszki, I.; Kovács, K.F. Towards three decades of spatial development transformation in two contrasting post-Soviet cities—Kraków and Budapest. Land Use Policy 2019, 85, 328–339. [Google Scholar] [CrossRef]
- Weclawowicz-Bilska, E. Recipe for a City. IOP Conf. Ser. Mater. Sci. Eng. 2019, 471, 112048. [Google Scholar] [CrossRef]
- Gałaś, S.; Gryga, M. Evaluation of availability of green areas in urban areas, taking Kraków, Poland as an example. In Public Recreation and Landscape Protection—With Nature Hand in Hand? Fialová, J., Pernicová, D., Eds.; Mendel University in Brno: Brno, Czech Republic, 1–3 May 2017; Available online: https://docplayer.net/65275894-With-nature-hand-in-hand.html (accessed on 8 January 2021).
- Kwartnik-Pruc, A.; Trembecka, A. Public Green Space Policy Implementation: A Case Study of Krakow, Poland. Sustainability 2021, 13, 538. [Google Scholar] [CrossRef]
Figure 1.
Steps of walkability estimation.

Figure 2.
Location of Kraków and characteristic areas in the city in the background of urban units.

Figure 3.
Culture and entertainment.

Figure 4.
Parks and recreational places.

Figure 5.
Public transport stops.

Figure 6.
Retail facilities.

Figure 7.
Pavement network.

Figure 8.
Walkability in Kraków.

Figure 9.
Urban structure of (a) the Widok estate, (b) the Mistrzejowice estate, (c) the central part of Nowa Huta district, (d) Kazimierz, (e) Podgórze and (f) the Old Town.
Figure 9.
Urban structure of (a) the Widok estate, (b) the Mistrzejowice estate, (c) the central part of Nowa Huta district, (d) Kazimierz, (e) Podgórze and (f) the Old Town.

Figure 10.
Urban structure of (a) part of the Wolski Forest, (b) single-family houses in Rybitwy, (c) part of the Tadeusz Sendzimir Steelworks, (d) single-family houses in Kostrze, (e) Płaszow Sewage Treatment Plant and (f) the heap in Pleszów.
Figure 10.
Urban structure of (a) part of the Wolski Forest, (b) single-family houses in Rybitwy, (c) part of the Tadeusz Sendzimir Steelworks, (d) single-family houses in Kostrze, (e) Płaszow Sewage Treatment Plant and (f) the heap in Pleszów.

Figure 11.
Urban structure of areas with different walkability.


Publisher’s Note: MDPI stays neutral with regard to jurisdictional claims in published maps and institutional affiliations. |
© 2021 by the authors. Licensee MDPI, Basel, Switzerland. This article is an open access article distributed under the terms and conditions of the Creative Commons Attribution (CC BY) license (http://creativecommons.org/licenses/by/4.0/).
Share and Cite
MDPI and ACS Style
Telega, A.; Telega, I.; Bieda, A. Measuring Walkability with GIS—Methods Overview and New Approach Proposal. Sustainability 2021, 13, 1883. https://0-doi-org.brum.beds.ac.uk/10.3390/su13041883
AMA Style
Telega A, Telega I, Bieda A. Measuring Walkability with GIS—Methods Overview and New Approach Proposal. Sustainability. 2021; 13(4):1883. https://0-doi-org.brum.beds.ac.uk/10.3390/su13041883
Chicago/Turabian StyleTelega, Agnieszka, Ivan Telega, and Agnieszka Bieda. 2021. "Measuring Walkability with GIS—Methods Overview and New Approach Proposal" Sustainability 13, no. 4: 1883. https://0-doi-org.brum.beds.ac.uk/10.3390/su13041883
Note that from the first issue of 2016, this journal uses article numbers instead of page numbers. See further details here.