Article

Evaluation of the Impact of Separative Collection and Recycling of Municipal Solid Waste on Performance: An Empirical Application for Chile

by
Paula Llanquileo-Melgarejo
1,*,
María Molinos-Senante
1,2,
Giulia Romano
3 and
Laura Carosi
3
1
Departamento de Ingeniería Hidráulica y Ambiental, Pontificia Universidad Católica de Chile, Av. Vicuña Mackenna, Santiago 4860, Chile
2
Centro de Desarrollo Urbano Sustentable ANID/FONDAP/15110020, Av. Vicuña Mackenna, Santiago 4860, Chile
3
Department of Economics and Management, University of Pisa, Via Ridolfi, 10, 56124 Pisa, Italy
*
Author to whom correspondence should be addressed.
Sustainability 2021, 13(4), 2022; https://0-doi-org.brum.beds.ac.uk/10.3390/su13042022
Submission received: 21 December 2020 / Revised: 28 January 2021 / Accepted: 30 January 2021 / Published: 13 February 2021
(This article belongs to the Collection Circular Economy and Sustainable Strategies)

Abstract

:
The collection of municipal solid waste (MSW) is a public service with notable effects on the environment and public health. The objective of this study was to evaluate the impact of selective collection and recycling of MSW on the performance of municipalities in providing MSW services. By employing the data envelopment analysis method, the efficiency and eco-efficiency scores for a sample of 298 municipalities in Chile were analyzed and compared. The efficiency estimation focused on the economic performance of the municipalities in the provision of MSW services, whereas the eco-efficiency assessment also integrated the environmental performance. The results indicated that the selective collection and recycling of MSW had a significant impact on the performance of the municipalities in providing these services. The percentages of efficient and eco-efficient municipalities were very low (4.70% and 4.36%, respectively), thus demonstrating the large room for performance improvement by Chilean municipalities in the management of MSW. The efficient and eco-efficient municipalities were heterogeneously distributed throughout the country, revealing the lack of collaboration between municipalities at the regional level. Finally, exogenous variables to the management of MSW carried out by the municipalities, including the population served, population density, tourism and waste generated per capita, all had an impact on the efficiency and eco-efficiency scores. The results and conclusions of this study are of great relevance for policy makers at the regional and local levels to improve the management of MSW in the context of a circular economy.

1. Introduction

In recent years, there has been an increase in the production of municipal solid waste (MSW), which has been linked with the economic development of countries, population growth and an increased urban population density [1]. In many countries, the management of MSW has become one of the most serious problems facing modern society [2,3].
Despite the advances in waste management in Latin America and the Caribbean (LA&C), the region still faces many challenges in the field of waste management due to the existence of open, uncontrolled landfills (33%) and/or low recovery rates of waste fractions (<4%) [4]. Chile presents the highest Gross Domestic Product (GDP) per capita among Latin American countries [5] and has been part of the Organization for Economic Cooperation and Development (OECD) since 2010. Therefore, municipal recycling services have been promoted in the last 10 years [6]. The main regulation on waste management issues in Chile was implemented in 2016 and is known as the Recycling and Extended Producer Responsibility Law. This law establishes that every producer or importer of “priority products” must take charge of the merchandise once its useful life has ended. In other words, these “useless” products must return to the industries where they were manufactured, and they take over their final destination. This Law also establishes collection and recovery goals differentiated by types of waste [7]. However, before the adaptation of this Law, municipal recycling services emerged without a national recycling policy [8]. In this context, recycling was introduced in the past, thanks to municipal authorities’ autonomous initiatives [6]. On the other hand, there is the Municipal Revenue Law (Decree Law No. 3063, of 1979), in which each service municipality is responsible for the home collection and waste management in the urban and suburban sectors of the communes, which generates inequity.
In this context, the European Union (EU) has paid considerable attention to waste management policies that aim to increase resource efficiency and to reduce the negative impact of waste on the environment and the health of citizens. In other words, the EU is promoting the circular economy, defined as “a system where the values of products, materials and resources are kept in the economy for as long as possible and the generation of waste is minimized” [9], in the framework of waste management. At the global level, the importance of MSW management is included within Goal 11 (Sustainable Cities and Communities) of the Sustainable Development Goals proposed by the United Nations (2015). As demonstrated by [10] and [11], the accomplishment of these goals can be facilitated by the good practices of the circular economy.
Moreover, improving the efficiency in the management of municipal waste services is necessary to reduce their associated costs, to provide a better quality of service, to comply with the requirements established both worldwide and locally and to reduce the fees for citizens [12]. The concept of efficiency has been studied and used from an economic perspective to evaluate the performance of units from several topics [13]. It is defined as the relationship between the outputs produced and the inputs used by the units (e.g., municipalities in this case study); it is a relative measure because it compares the performance among the units evaluated. However, as environmental concerns have grown, the necessity of integrating environmental variables into the efficiency assessment has become more important [14]. In this context, the concept of eco-efficiency, which is defined as the production of more goods (outputs) and services with fewer resources (inputs) and less of an environmental impact, has been proposed [15]. The prefix ‘eco’ represents the environmental and economic performance; therefore, the assessment of eco-efficiency involves considering both environmental and economic variables [16].
In the framework of MSW management, previous studies have evaluated the efficiency and eco-efficiency of the provision of municipal waste collection services separately and independently (e.g., [2,17,18,19,20]). However, to the best of our knowledge, there are no studies in which both metrics (efficiency and eco-efficiency) have been compared. In order to develop public policies in the context of the circular economy, it is important to assess both the efficiency and the eco-efficiency. According to the literature [12,19,21,22,23,24], some external factors to the management of MSW services carried out by municipalities, such as population density, age range, geographical characteristics, amount of waste generated, socioeconomic level, size of the community, among others, have an impact on the performance (efficiency) of the provision of municipal waste services. However, since there are no studies comparing the metrics of efficiency and eco-efficiency in the provision of MSW services, there is no information about the impact of external factors on the differences between these two metrics.
Therefore, the main objective of this work was to evaluate the impact of selective collection and recycling of MSW on the performance of municipalities in the provision of MSW services by estimating and comparing their efficiency and eco-efficiency. The second objective of this study was to explore the impact of exogenous variables on the differences between the efficiency and eco-efficiency. The empirical application focused on a large sample of Chilean municipalities, which are making notable efforts to improve the recycling rates of MSW.
This research is novel because the concepts of efficiency and eco-efficiency were compared. To evaluate the eco-efficiency, an undesirable output (unsorted waste) was integrated into the evaluation of the municipalities’ performance in the provision of MSW services. This approach makes it possible to estimate the eco-efficiency, which, unlike the conventional evaluation of efficiency, integrates not only economic but also environmental variables. This topic is very important to support the decision-making of municipalities, since it provides information on the costs related to the environmental performance of municipalities in the provision of MSW services. Moreover, the identification of factors affecting the differences in the efficiency and eco-efficiency scores provides relevant information to understand why some municipalities present significant differences in their performance depending on which of the two metrics was considered in the assessment.

2. Material and Methods

The methodological approach applied in this study was divided into two stages. First, based on previous research (e.g., [18,19,20,25]), the efficiency and eco-efficiency of municipalities in the collection and treatment of MSW were evaluated using the data envelopment analysis method. Both metrics were employed to assess the impact of selective collection and recycling on the performance of municipalities in the provision of MSW services. Second, a non-parametric test was employed to identify exogenous factors affecting the difference in the efficiency and eco-efficiency scores for each municipality evaluated (see Supplementary Materials).

2.1. Efficiency and Eco-Efficiency Assessment

Assuming a production process in which, from an input vector x     N + N , a vector of desirable outputs y     N + M is obtained using the T technology, the set of production possibilities is defined as follows:
P ( x ) = { ( x , y ) : x   c a n   p r o d u c e   y }
The input distance function is defined as:
D ( x , y ) = m i n θ { θ > 0 : x θ   P ( x ) }
According to [26], for each unit j (a municipality in this study), a linear program has to be solved to calculate its efficiency score (see Equation (3)). Based on previous studies (e.g., [12,21]), an input orientation assuming variable returns to scale was employed. It should be noted that municipalities cannot directly control the amount of MSW that is generated; therefore, the input orientation is more adequate.
M i n     θ V R S     s . t . j = 1 N λ j x i j θ x i 0                                                                                           1 i M j = 1 N λ j y r j y r 0                                                                                             1 r S         j = 1 N λ j = 1           λ j 0                                                                                                                                 1 J N
where θ V R S indicates the efficiency score of each unit evaluated; M is the number of inputs used; S is the number of outputs generated; N is the number of units analysed; J is the number of units evaluated (municipalities) and λ j is a set of intensity variables that represents the weighting of each analysed municipality j in the composition of the efficient frontier. θ V R S (0, 1] and a unit is efficient if its efficiency score ( θ V R S ) equals unity, whereas it is inefficient if 0 ≤ θ < 1.
To evaluate the eco-efficiency of municipalities in the provision of MSW services, the following methodology was employed. Assuming a production process whereby from an input x     N + N , a vector of desirable outputs y     N + M and another vector of undesirable outputs b     N + H are obtained using the technology T , the production possibility set of desirable and undesirable outputs is defined as follows:
P * ( x ) = { ( y , b ) : x   c a n   p r o d u c e   ( y , b ) }
The input distance function, including undesirable outputs, is defined as follows:
D ( x , y , b ) = m i n θ { θ > 0 : x θ   P * ( x ) }
According to [27], for each unit j , the linear program to be solved to compute the eco-efficiency score, also assuming an input orientation and variable returns-to-scale technology, is as follows:
M i n     θ V R S     s . t . j = 1 N λ j x i j θ * x i 0                                                                                       1 i M j = 1 N λ j y r j y r 0                                                                                             1 r S j = 1 N λ j b z j = b z 0                                                                                             1 z H j = 1 N λ j = 1       λ j 0                                                                                                                                   1 J N
where θ V R S indicates the eco-efficiency score of the unit evaluated; M is the number of inputs used; S is the number of desirable outputs generated; H is the number of undesirable outputs involved in the assessment; N is the number of municipalities analysed; J is the number of units evaluated (municipalities) and λ j is a set of intensity variables that represent the weighting of each analysed municipality j in the composition of the efficient frontier. As in the case of efficiency assessment, θ V R S ( 0 ,   1 ] and a unit is eco-efficient if θ V R S . equals unity, whereas it is inefficient if 0 θ V R S < 1 .
A limitation for any data envelopment analysis model is the number of units (municipalities) analysed in relation to the number of inputs and outputs considered in the assessment. To avoid relative efficiency discrimination problems, Cooper’s rule must be met. This means that the number of units (municipalities) to be evaluated must be greater than or equal to m a x   { m   x   s ;   3   ( m   +   s ) } , where m is the number of inputs and s is the number of outputs involved in the evaluation (Molinos-Senante et al., 2016). Considering that 298 municipalities were evaluated, and that one input and five outputs (desirable and undesirable) were considered, then it was concluded that this study does comply with Cooper’s rule.
To evaluate whether the differences between the efficiency and eco-efficiency indices are statistically significant, the non-parametric Mann–Whitney test was applied. The null hypothesis (H0) states that the groups come from the same populations. H0 can be rejected with a significance level of 95% if the p-value is equal to or less than 0.05, meaning that the differences in the efficiency and eco-efficiency scores for the municipalities evaluated are statistically significant.

2.2. Factors Affecting the Efficiency and Eco-Efficiency Differences

Previously described Equations (3) and (6) allowed us to estimate the efficiency and eco-efficiency scores in the provision of MSW services for each municipality evaluated. However, some external factors that might affect the management of MSW, also known as environmental variables, could have an impact on the efficiency and eco-efficiency differences. These factors cannot be considered as inputs or outputs in the efficiency and eco-efficiency assessment, since they are not directly controllable by the municipalities.
To evaluate the impact of exogenous variables on the performance of units, some previous studies have used parametric methodologies [28], that is, econometric models in which the dependent variable is the performance index and the independent variables are the external factors evaluated. However, this approach presents problems related to multicollinearity [2]; therefore, a non-parametric test must also be applied [12,29,30,31].
To apply the non-parametric approach, the evaluated municipalities were grouped according to the external factors that could affect their performance, based on previous studies [12,19,21]. Subsequently, the non-parametric Kruskal–Wallis test was employed in which the null hypothesis tested was that the K samples are derived from the same population. The null hypothesis could be rejected at a significance level of 95% if the p-value is less than or equal to 0.05.
The Kruskal–Wallis test is given by [32]:
T   = 12 / [ N   ( N + 1 ) ] i = 1 k R i 2 N i 3 ( N + 1 )
where N is the total number of observations; Ri is the rank for an individual sample; k is the number of groups; and Ni is the number of observations in group i .
The relative difference in the efficiency and eco-efficiency scores was estimated using the following equation:
R e l a t i v e   d i f f e r e n c e   ( % ) =   E c o e f f i c i e n c y   s c o r e     E f f i c i e n c y   s c o r e E f f i c i e n c y   s c o r e 100

2.3. Sample Description

The sample used for this empirical application corresponds to 298 out of 345 Chilean municipalities. These 298 municipalities involve 14,716,132 inhabitants out of a total population of 18,729,160 (79%) people in Chile [33].
Based on previous research on the performance of waste service management [2,22,29,34], the total annual cost of MSW services provided by each municipality was integrated into the efficiency and eco-efficiency evaluation as an input. Information on MSW management is available in the database of the National Waste Declaration System (SINADER, acronym in Spanish), corresponding to the year 2018. The amounts of recyclable waste items (tons/year) were integrated as desirable outputs and were classified into: (i) paper and cardboard, (ii) glass, (iii) plastic and (iv) organic waste [12,31], While for the eco-efficiency evaluation, the amount of unsorted waste (tons/year) was included as an undesirable output (see Table 1; Table 2).
To select the exogenous variables that might affect the efficiency and eco-efficiency differences, three criteria were considered: (i) the characteristics of the MSW sector in Chile, (ii) the information available for the evaluated municipalities and (iii) the existing literature [12,21,35]. According to these criteria, the following variables were considered: (i) the urban population, which was defined as the total number of people living in cities with MSW services; (ii) the size of the municipality, expressed in km2. It should be noted that this variable did not include all areas of the municipality but focused on the urban area where MSW services are provided; (iii) population density, which was expressed as the number of inhabitants per km2 of urban area of the municipality; (iv) the tourism index proposed by the Division of Studies and Territory of the Undersecretariat of Tourism (Sernatur, for its acronym in Spanish), which includes 15 variables; and (v) the amount of waste generated per capita, which was estimated as the ratio of the total amount of waste generated (kg) and the number of inhabitants of each municipality.
The main statistical variables to estimate the efficiency and eco-efficiency scores of the Chilean municipalities and the exogenous variables analyzed are shown in Table 1; Table 2.

3. Results and Discussion

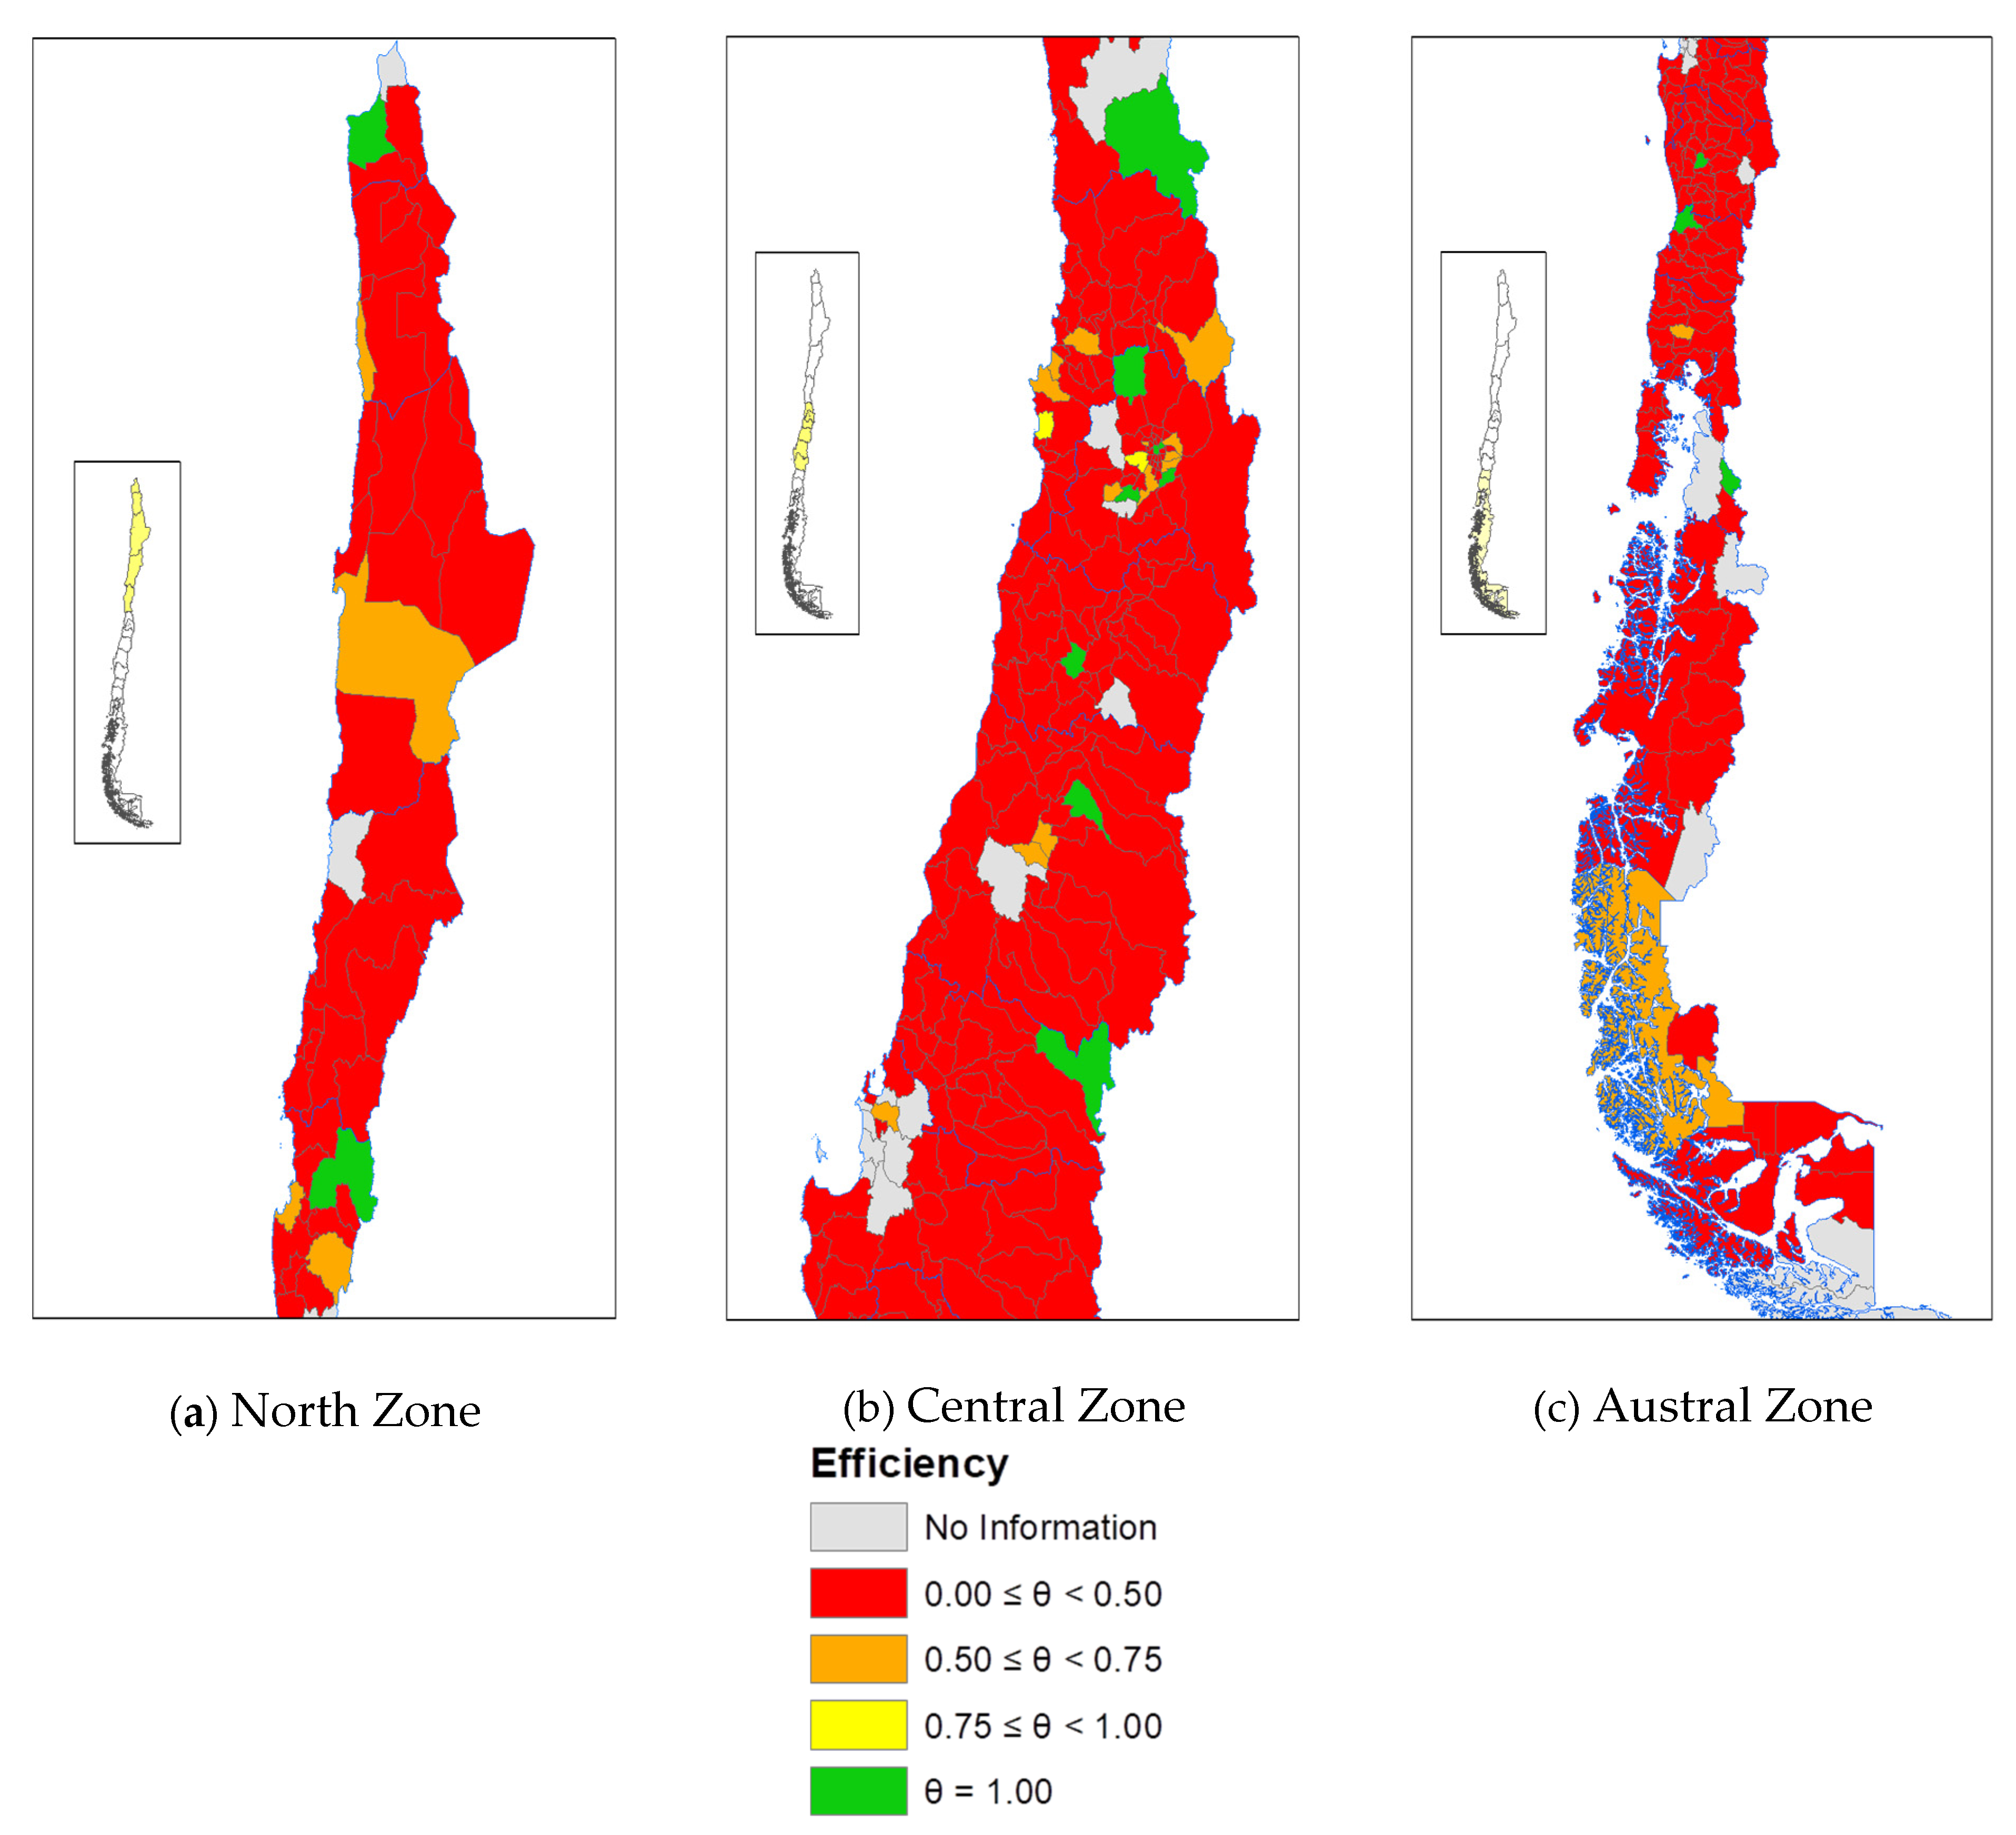
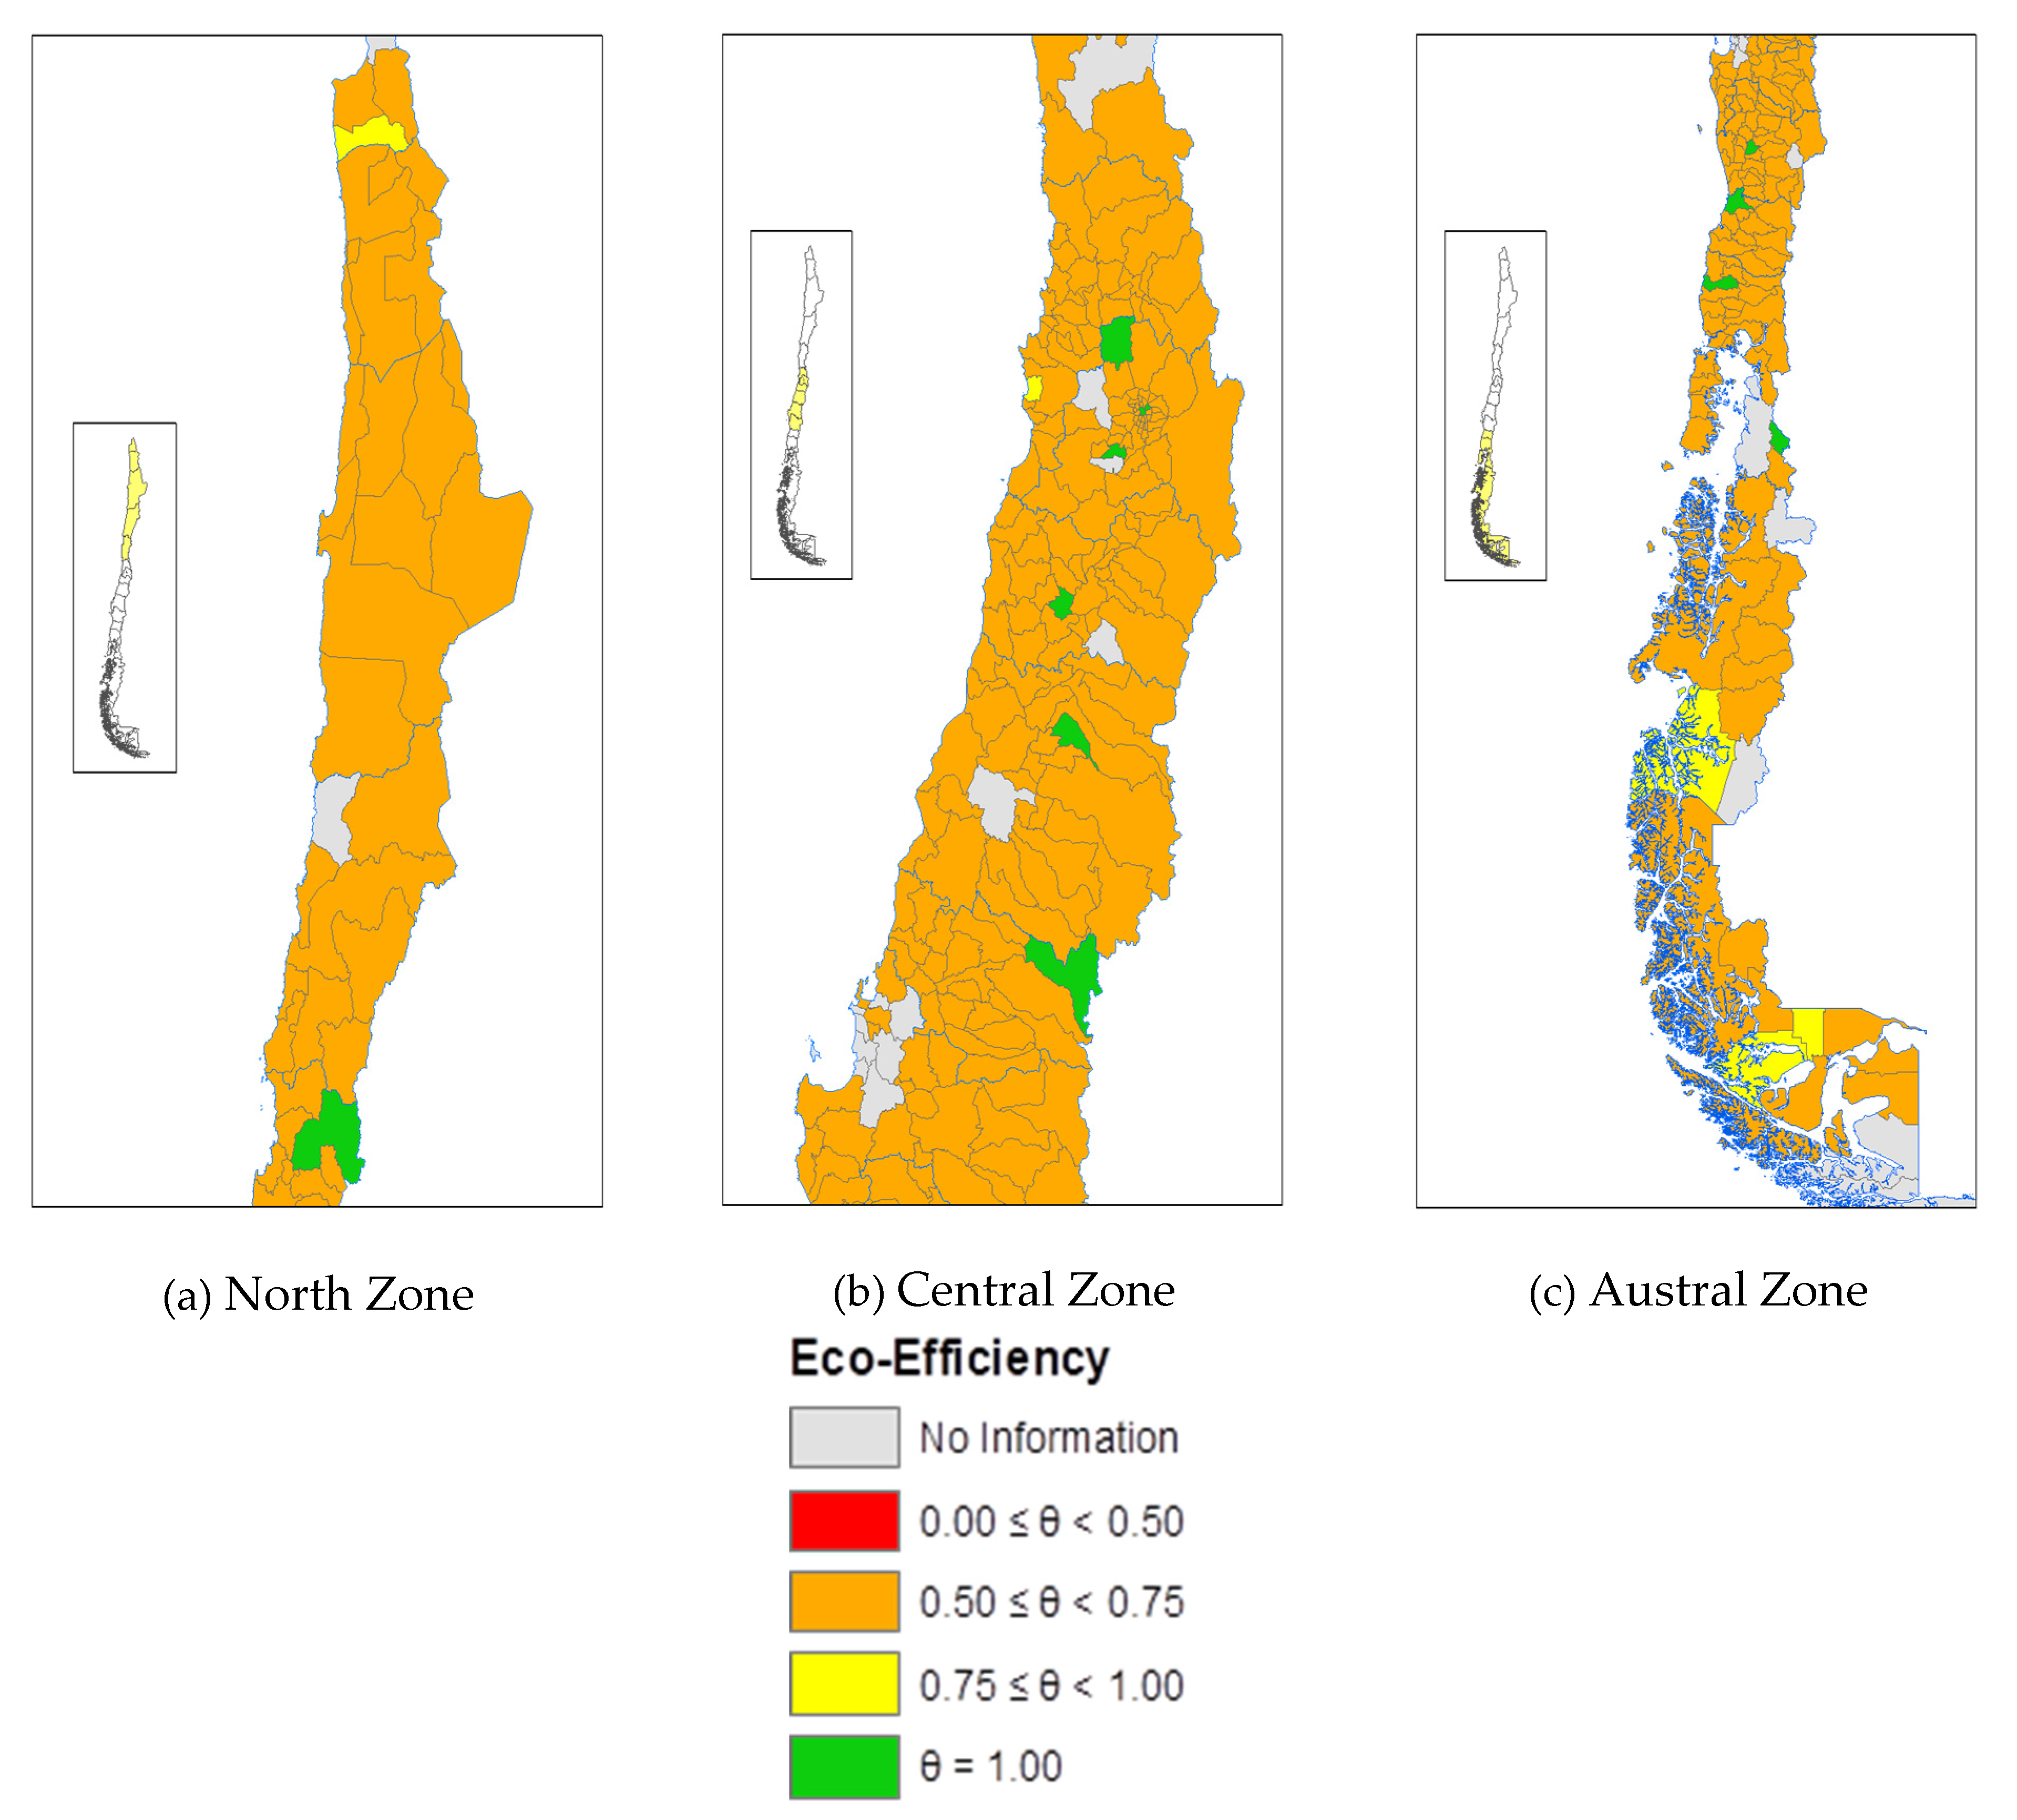
3.1. Efficiency and Eco-Efficiency Estimation

The efficiency and eco-efficiency scores of the 298 Chilean municipalities were estimated using Equations (3) and (6), respectively. Table 3 shows the main statistical characteristics of the results. The complete sample of Chilean municipalities illustrated that when the efficiency evaluation excluded selective waste collection (recycling), the mean efficiency score was 0.26. This means that, on average, the evaluated municipalities could reduce their inputs (total costs) by 74% if they operated as efficient municipalities. In this scenario, only 14 out of the 298 municipalities analyzed were efficient, which corresponds to 4.70%. In a very similar way, when the selective collection and recycling of MSW was integrated into the evaluation, the number of eco-efficient municipalities was 13, which represents 4.36% of the sample. By contrast, the mean eco-efficiency score increased to 0.54. Thus, municipalities perform better when the evaluation integrates the collection and recycling of MSW. Furthermore, on average, municipalities are making economic efforts to increase the amount of selective waste collection and recycling.
The histogram in Figure 1 shows the distribution of the efficiency and eco-efficiency scores of the 298 Chilean municipalities evaluated. When comparing the efficiency and eco-efficiency scores, the impact of selective collection and recycling on the performance of municipalities was verified as the p-value of the Mann–Whitney test was less than 0.05. Most of the municipalities (181/248; 73%) had efficiency scores of less than 0.2, indicating that they had a poor performance. These findings imply that these municipalities could save around 80% of their operating costs if they were managed more efficiently. On the other hand, 261 municipalities presented eco-efficiency scores between 0.4 and 0.6; thus, their costs improved by 50% when non-recycled waste was considered.
To further analyze the differences between the efficiency and eco-efficiency scores, the histogram shown in Figure 2 illustrates that 112 municipalities had a difference in their eco-efficiency and efficiency scores of between 0.40 and 0.50. This positive value means that municipalities present better performance when the assessment differentiates desirable and undesirable outputs, i.e., recycled and unsorted waste.
Chile is a long and narrow country; to illustrate variations across the country, the efficiency and eco-efficiency scores were also reported geographically (Figure 3; Figure 4, respectively). Both maps show the ranges of the performance (efficiency and eco-efficiency scores) of the Chilean municipalities in the provision of MSW services. Those municipalities whose efficiency/eco-efficiency score was less than 0.5 are in red color; those whose efficiency/eco-efficiency score ranged between 0.50 and 0.75 are in orange color; those whose efficiency/eco-efficiency score ranged between 0.75 and 1.0 are in yellow color; and, finally, the efficient/eco-efficient municipalities, i.e., the efficiency/eco-efficiency score was equal to 1.0, are in green color. Figure 3 shows that the efficient municipalities in the provision of MSW services are distributed in different regions across the country. This finding indicates that the geographical factor is not a determinant in the efficiency of the municipalities in the provision of MSW services. It should also be noted that the metropolitan region of Santiago, the capital of Chile, included municipalities with a diversity of efficiencies, clearly indicating the lack of collaboration among municipalities and the absence of a standard regional policy in this area of 7037 million people, accounting for approximately 40% of the total population of the country.
Figure 4 shows that the municipalities that were eco-efficient are different from the ones that were identified as efficient (see Figure 3). This finding demonstrates that some municipalities have focused on reducing the operational costs of MSW management, whereas others have also made notable efforts to increase the amount of recycled waste. It should be noted that in 2016, Law 20.920 established the framework for waste management in Chile to extend the responsibility of the producer to promote recycling. This law sought to reduce the generation of waste; to increase the recovery, reuse and recycling of materials; and to protect health human and the environment. Moreover, this law obliges producers to be responsible for the processing and valorization of the product, grants municipalities the power to establish agreements with management systems and grassroots recyclers, requires waste separation at the source in their municipal ordinances, encourages the implementation of communication and awareness strategies, requires permits for waste storage facilities and promotes environmental education. However, in the face of multiple political efforts, this has led to each municipality taking charge of its own waste management, thus bringing differences in the quality of service and effectiveness in the MSW collection services, since they are carried out at home and not from a specific point. Of note, Chile is the country that sends the second highest amount of waste per capita to landfills among the 34 countries that make up the Organization for Economic Cooperation and Development.
To better visualize the efficiency and eco-efficiency scores, Figure 5 shows that most of the evaluated municipalities present larger eco-efficiency scores than efficiency scores, as indicated by the green color. This result may be mainly due to the fact that municipalities have developed environmental management tools or incorporated “green practices” in their internal processes. Because of the differences in the efficiency and eco-efficiency scores among municipalities, this study also evaluated the external factors that may have affected these differences.

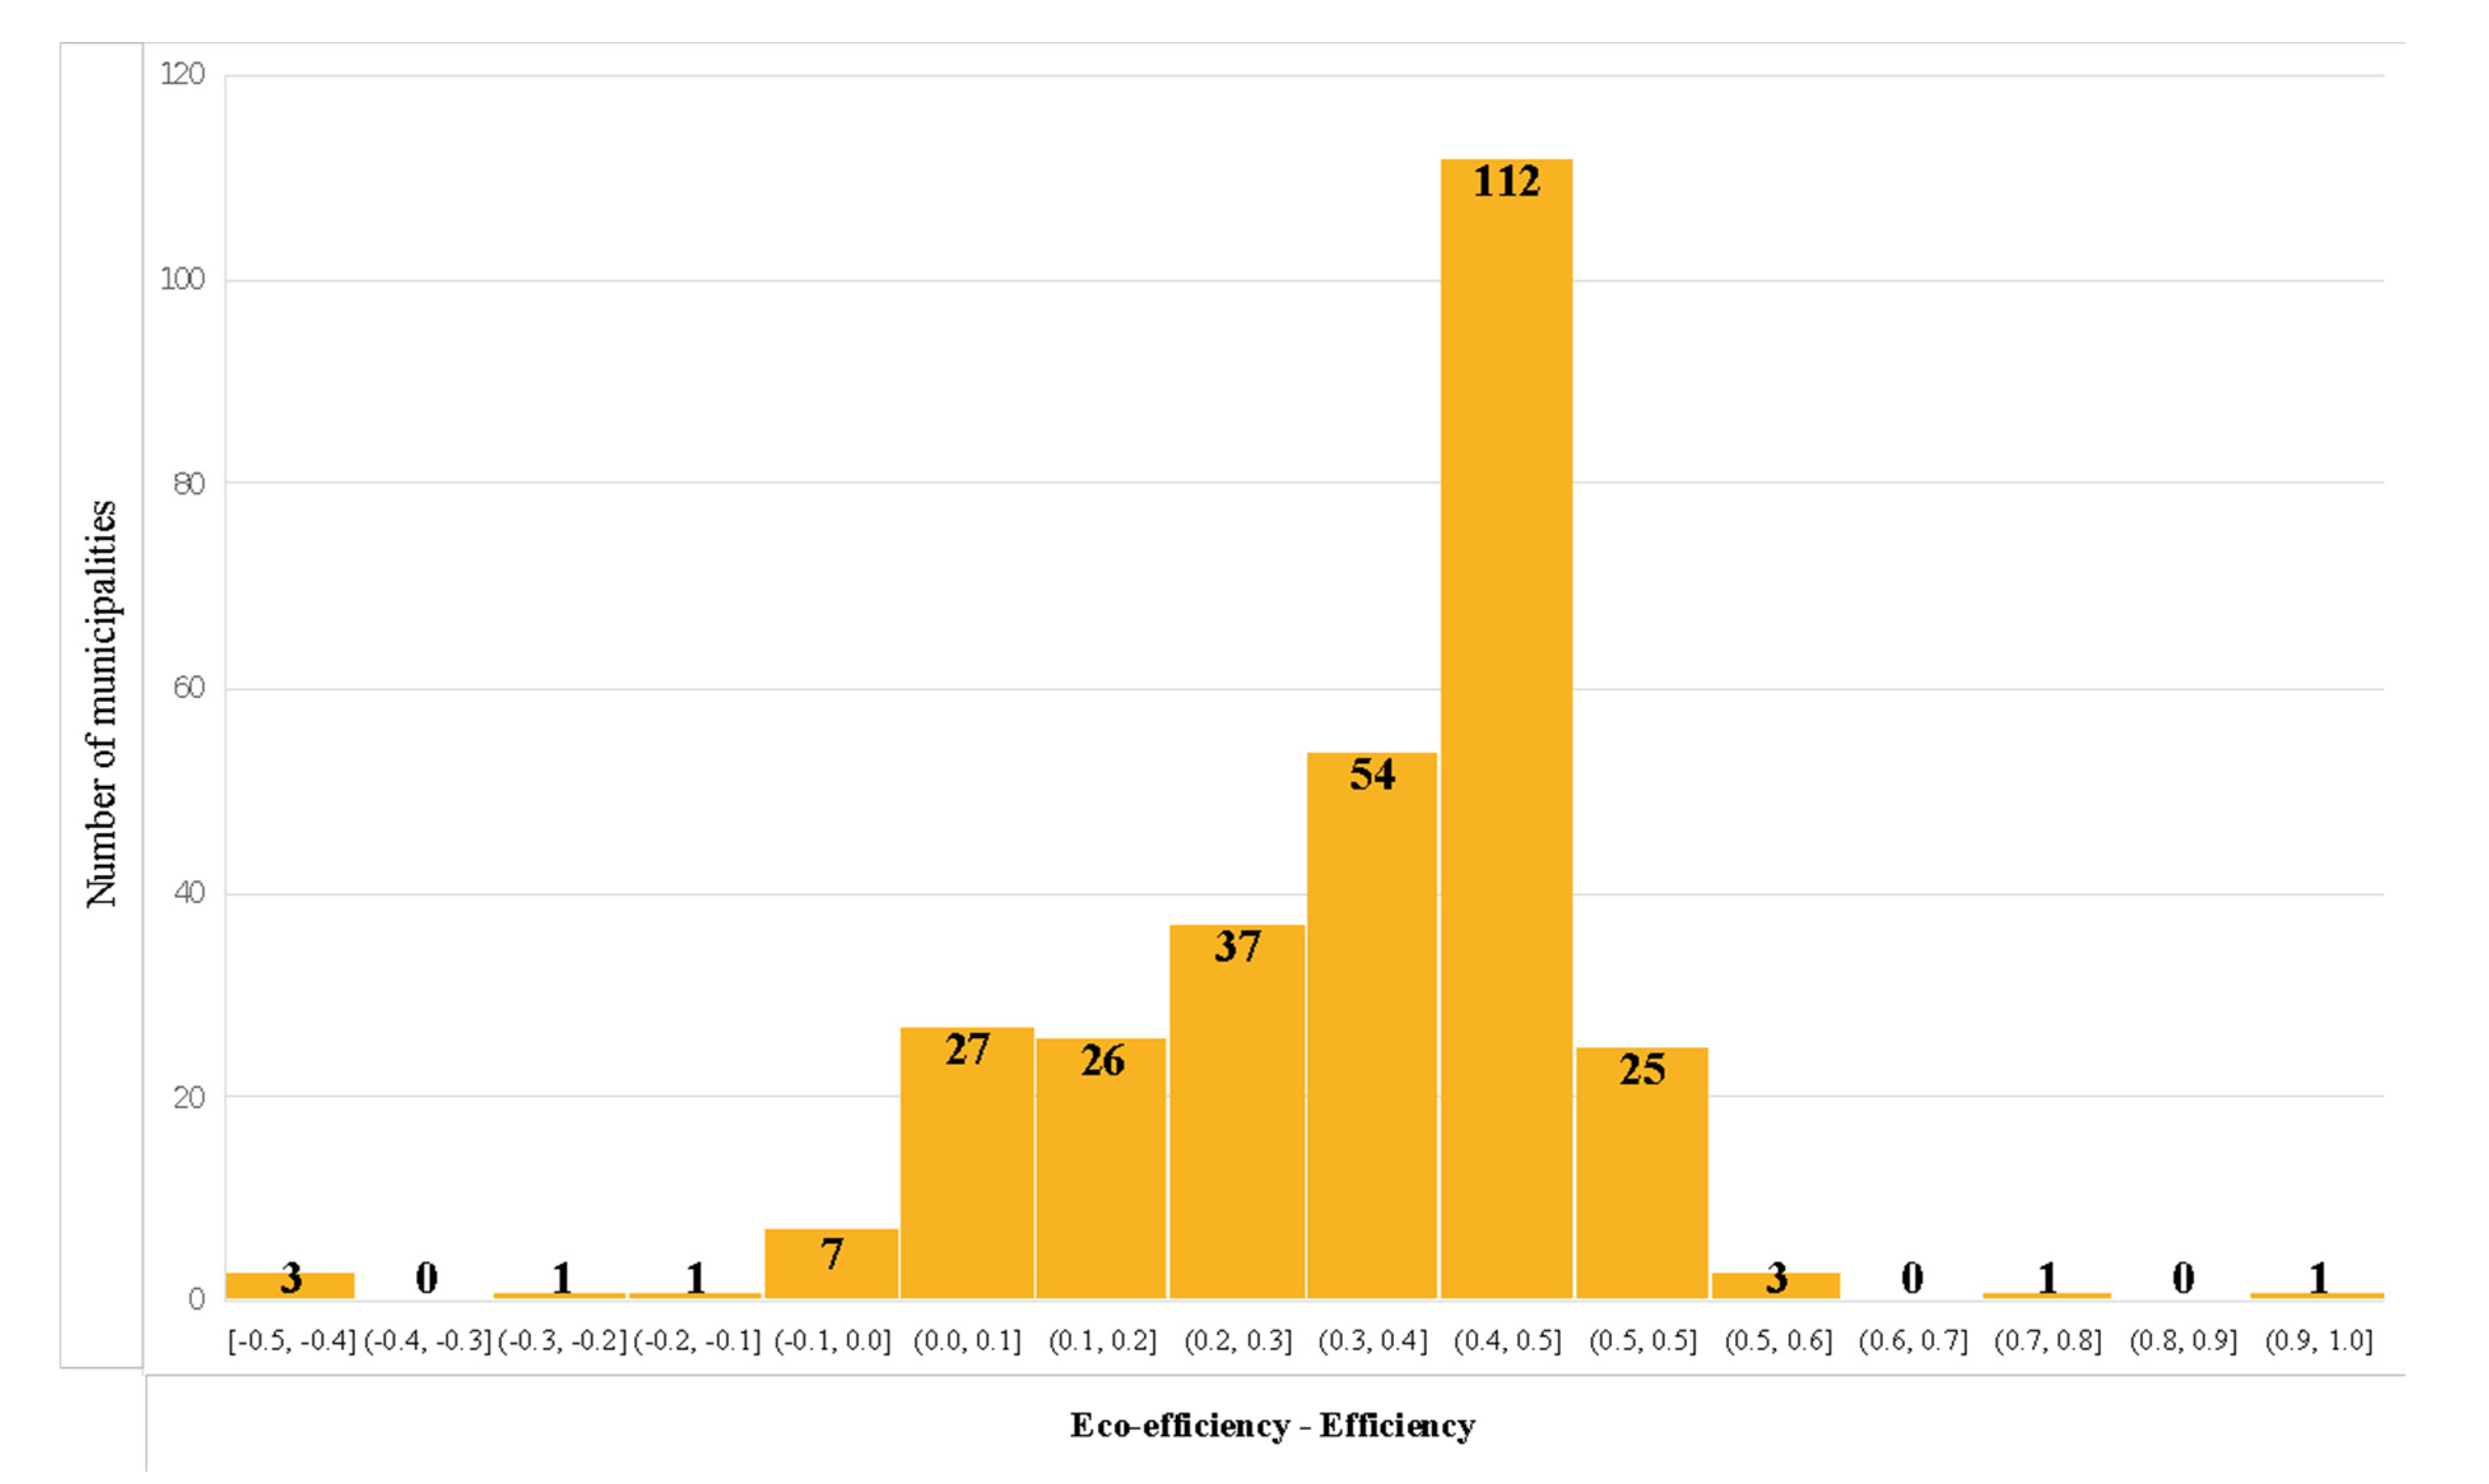
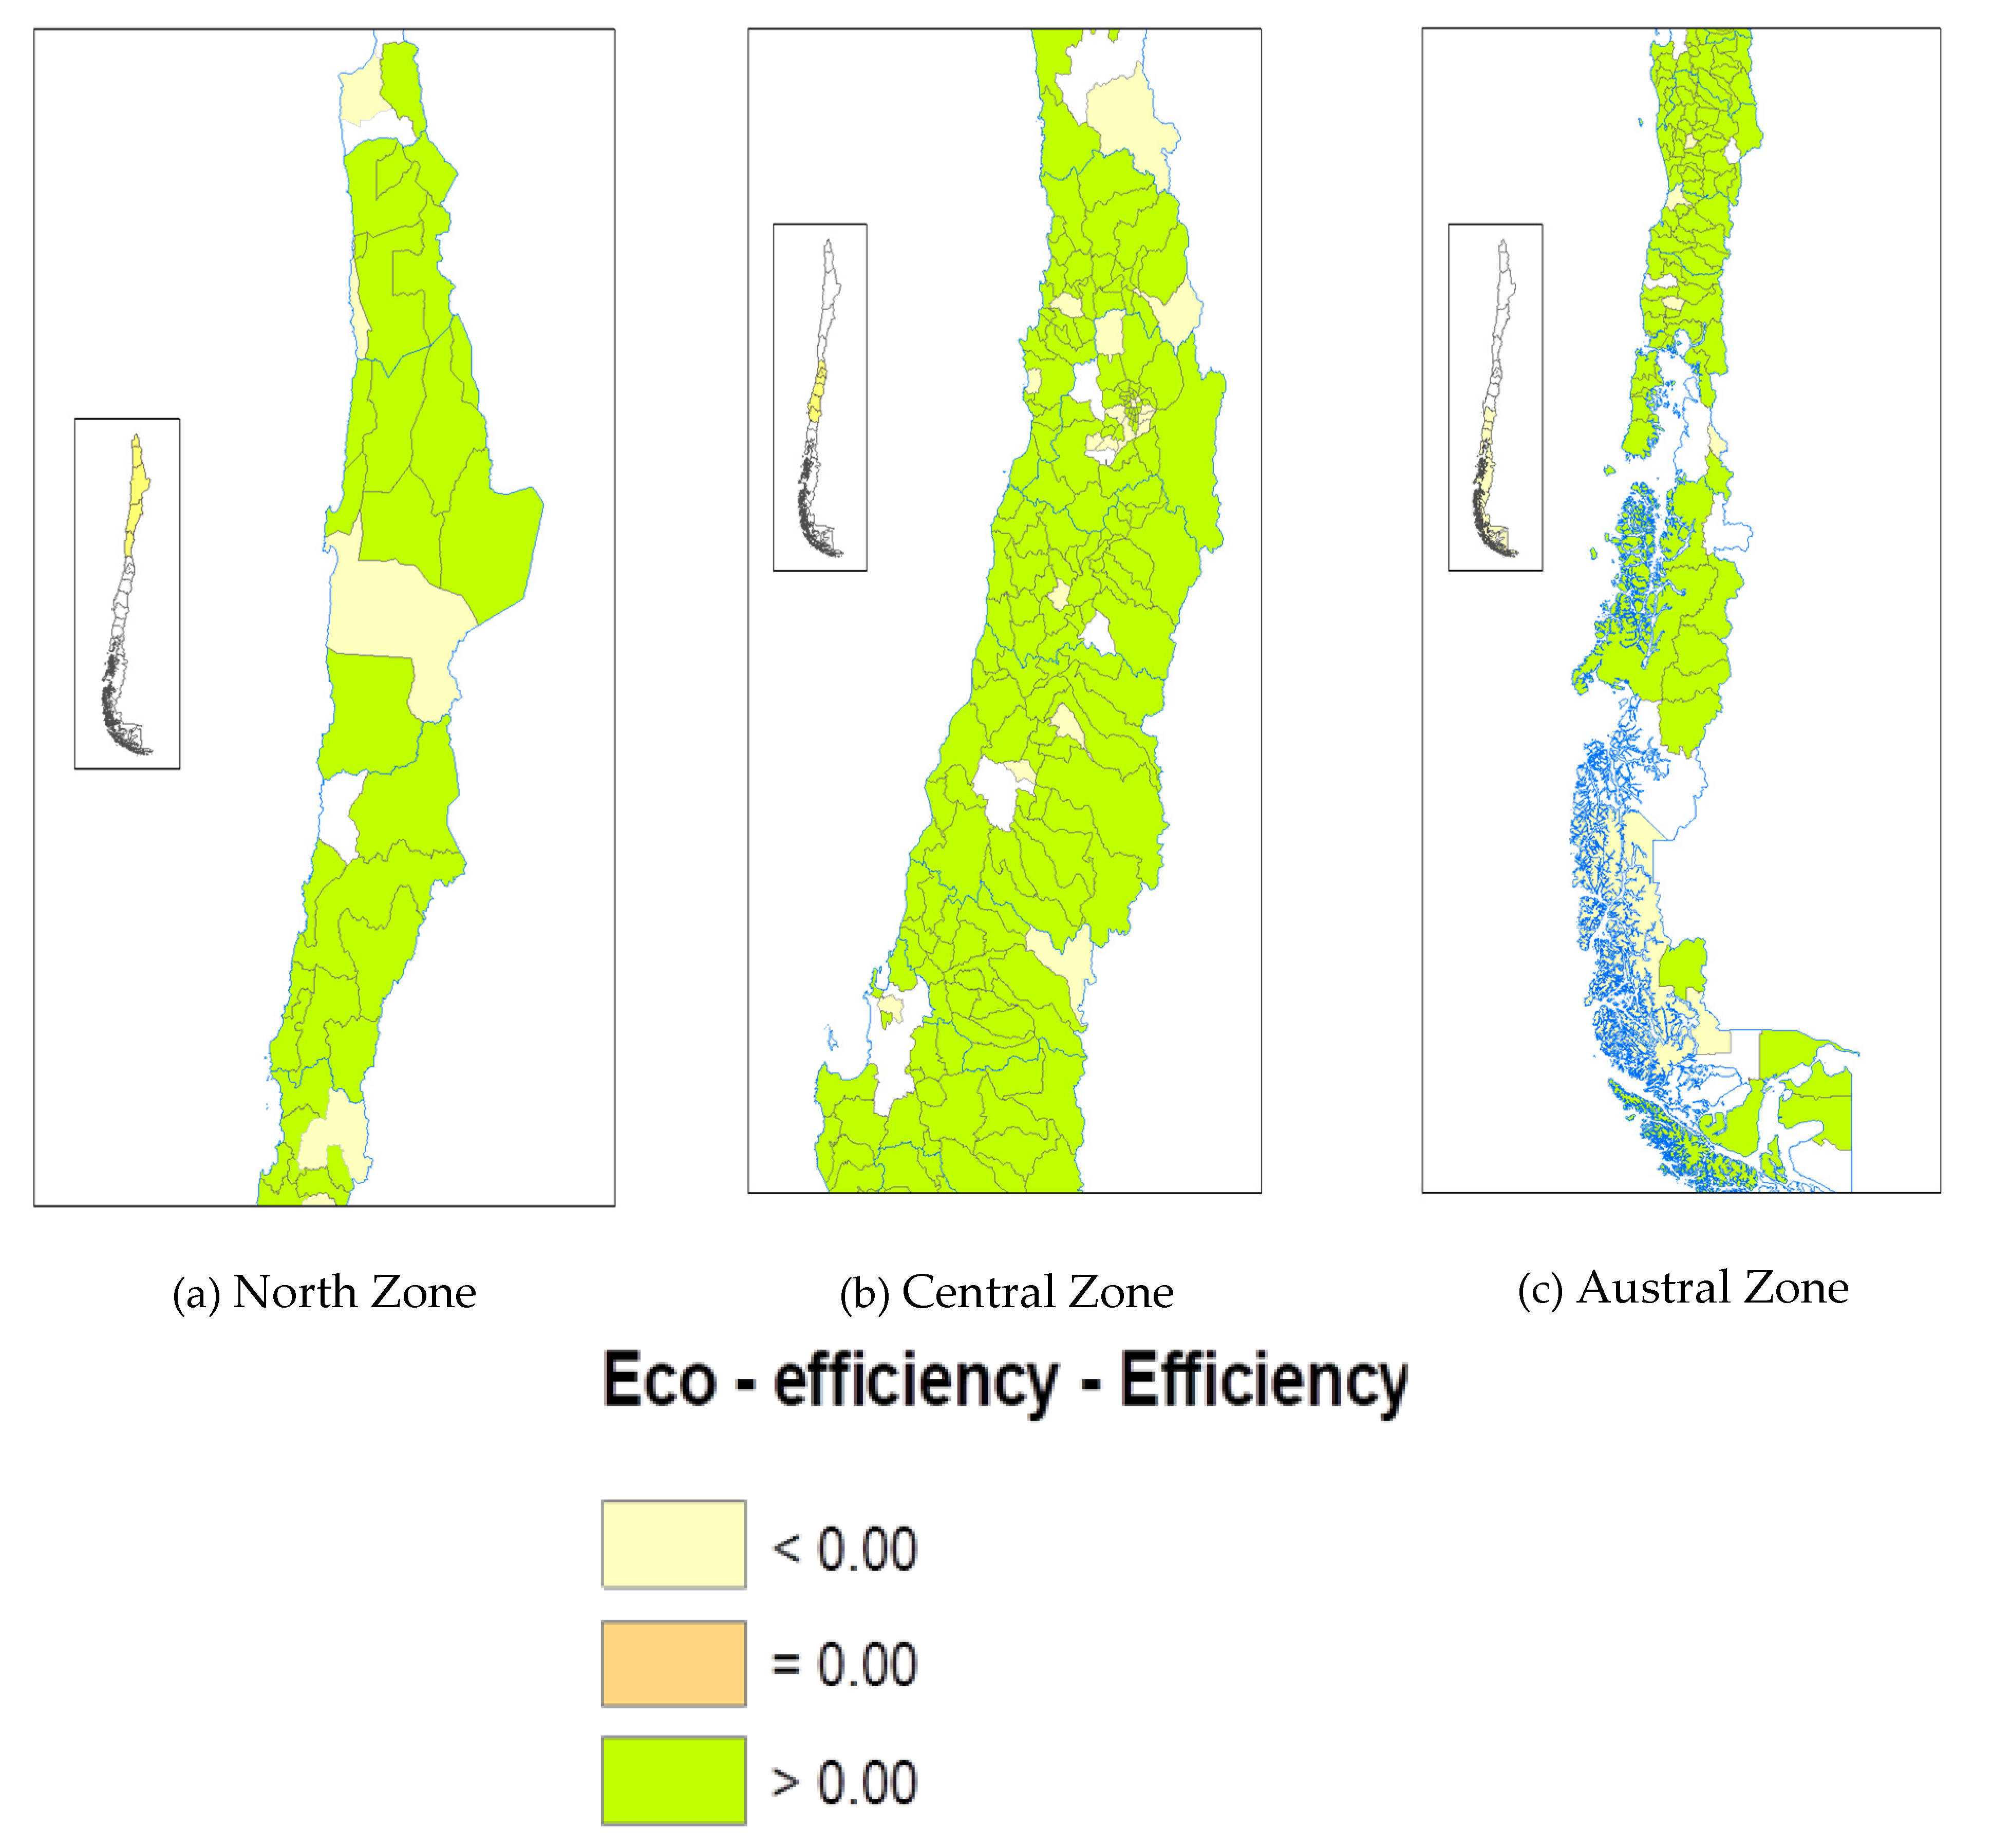
3.2. Factors Affecting Differences between the Efficiency and Eco-Efficiency Scores

Previous studies by [12,18,21] have investigated the external factors affecting the eco-efficiency of municipalities in the provision of MSW services. Taking into account the main objective of this study, i.e., evaluating the impact of selective collection and recycling on the performance of MSW service providers, we focused on assessing the impact of exogenous variables on the difference of the efficiency and eco-efficiency scores measured as a relative difference (Equation (8)). The Kruskal–Wallis tests were conducted, and the results are shown in Table 4.
Regarding the variable number of inhabitants, Table 4 shows that for populations between 3100 and 10,900 inhabitants, the differences between the efficiency and eco-efficiency scores were the highest. In contrast, for municipalities with a larger population, the differences between scores were not significant. The Kruskal–Wallis test revealed that the population served by the MSW service provider had a statistically significant impact on the difference between the efficiency and eco-efficiency scores of Chilean municipalities providing MSW services. This finding indicates that as the size of the population increases (in terms of the population served), the difference between the economic and joint economic and environmental performance was not significant.
Focusing on the size of the municipality, expressed in km2, the p-value of the Kruskal–Wallis test (>0.05) did not allow us to reject the null hypothesis; thus, this variable did not have a statistically significant impact on the difference between the efficiency and eco-efficiency scores. However, as shown in Table 4, the largest municipalities had a greater difference between the efficiency and eco-efficiency scores, which might be due to the difficulty in establishing green points to collect recyclable waste materials.
The third variable evaluated was the population density. The null hypothesis was that this variable does not have an impact on the difference between the efficiency and eco-efficiency scores. However, the results of the Kruskal–Wallis test illustrated that the null hypothesis should be rejected since the p-value is <0.050, meaning that the population density significantly affects the difference between the efficiency and eco-efficiency scores. The population density plays an important role as an exogenous variable. The results obtained in this work are congruent with recent studies carried out by [36], who concluded that this external variable negatively affects the efficiency, possibly due to the complex intra-municipal organization, regulation and control from the service providers. Since each municipality carried out its own management of waste collection services in this study, the effect of the population density on the difference between the efficiency and eco-efficiency scores was even more pronounced.
Next, the effect of tourism on the difference between the efficiency and eco-efficiency scores was determined, and the results are shown in Table 4. This exogenous variable had an impact on waste management at the municipal level, as demonstrated by the significant differences between the efficiency and eco-efficiency scores (p-value = 0.002). In particular, greater differences between the efficiency and eco-efficiency scores were reported for municipalities with a moderate level of tourism. By contrast, the municipalities with the greatest level of tourism presented lower differences between the efficiency and eco-efficiency scores. Previous studies, such as those carried out by [12,19], have concluded that tourism might have an impact on MSW management because the excess amount of waste generated during high-tourism seasons is not collected or managed efficiently.
Finally, the last factor evaluated in this study was the amount of waste generated per capita. The results of the Kruskal–Wallis test (p-value < 0.05) revealed that this exogenous factor significantly affected the difference in the efficiency and eco-efficiency scores in the management of MSW. Table 4 also shows that greater differences were observed for those municipalities whose citizens produce small amounts of waste (less than 405 kg per inhabitant per year), which facilitates the recycling of MSW.

4. Conclusions

The importance of MSW management is explained by the fact that it is an essential service that is directly related to the environment and public health; therefore, it must be approached in an interdisciplinary way. This study analyzed the impact of selective collection and recycling of MSW on the waste management performance of municipalities by evaluating and comparing the efficiency and eco-efficiency scores for an empirical sample of 298 municipalities in Chile.
The results from the empirical application illustrate that the selective collection and recycling of MSW had an impact on the performance of municipalities from a statistical point of view. Both metrics (efficiency and eco-efficiency) employed in this study demonstrated the low performance of Chilean municipalities in the provision of MSW services. The percentage of inefficient municipalities was determined to be 95.30% and 96.64%, according to the efficiency and eco-efficiency scores, respectively. These results reveal that the municipalities must improve their management significantly. Moreover, this study shows that efficient and eco-efficient municipalities are not the same; for example, some of them focus on economic issues, whereas others are managed according to both economic and environmental issues. From a geographical point of view, the findings indicate the lack of cooperation in the management of MSW among nearby municipalities, which present very divergent efficiency and eco-efficiency scores. Thus, a regional policy needs to be implemented in order to improve the management of MSW services in Chile. Finally, some exogenous variables, such as the population served, population density, tourism and waste generated per capita, were shown to have a significant impact on the differences between the efficiency and eco-efficiency scores. This information is very relevant for policy makers who aim to improve not just efficiency but also eco-efficiency in the provision of MSW services.
From a political perspective, the results of this study are very relevant to supporting and adopting specific actions by policy makers. Firstly, the few municipalities identified as eco-efficient should be considered as examples for the other municipalities and therefore, the actions and policies implemented by eco-efficient municipalities should be monitored, collected and disseminated to the rest of Chilean municipalities to improve their eco-efficiency. Another strategy for improving the eco-efficiency of municipalities in the provision of MSW would be the promotion of environmental education at the local level, in schools and non-profit institutions. Additionally, the generation of alliances with the private sector for funding installations and specific measures for MSW recycling would help improve the eco-efficiency of municipalities.

Supplementary Materials

The following are available online at https://0-www-mdpi-com.brum.beds.ac.uk/2071-1050/13/4/2022/s1, Table S1: Efficiency and eco-efficiency scores for each municipality evaluated.

Author Contributions

Conceptualization, P.L.-M., M.M.-S., L.C., G.R.; methodology, software, M.M.-S.; validation: M.M.-S., L.C., G.R.; formal analysis, P.L.-M.; investigation, P.L.-M. and M.M.-S.; resources, M.M.-S.; data curation, P.L.-M. and M.M.-S.; writing—original draft preparation, P.L.-M.; writing—review and editing, P.L.-M., M.M.-S., L.C., G.R.; visualization, P.L.-M.; supervision, M.M.-S.; project administration, M.M.-S.; funding acquisition, M.M.-S., L.C., G.R. All authors have read and agreed to the published version of the manuscript.

Funding

This work was supported by the Agencia Nacional de Investigación y Desarrollo (ANID) [grant numbers ANID/FONDAP/15110020, Becas Chile Program 21182091, FONDECYT 1210077] and the School of Engineering of the Pontificia Universidad Católica de Chile through its Seed Fund.

Data Availability Statement

Data is available in https://mma.gob.cl/tag/sinader/.

Conflicts of Interest

The authors declare no conflict of interest.

References

  1. Daskalopoulos, E.; Badr, O.; Probert, S.D. An integrated approach to municipal solid waste management. Resour. Conserv. Recycl. 1998, 24, 33–50. [Google Scholar] [CrossRef]
  2. Marques, R.C.; Simoes, P. Incentive regulation and performance measurement of the Portuguese solid waste management services. Waste Manag. Res. 2009, 27, 188–196. [Google Scholar] [CrossRef]
  3. Di Foggia, G.; Beccarello, M. Improving efficiency in the MSW collection and disposal service combining price cap and yardstick regulation: The Italian case. Waste Manag. 2018, 79, 223–231. [Google Scholar] [CrossRef] [PubMed]
  4. Margallo, M.; Ziegler-Rodriguez, K.; Vázquez-Rowe, I.; Aldaco, R.; Irabien, Á.; Kahha, R. Enhancing waste management strategies in Latin America under a holistic environmental assessment perspective: A review for policy support. Sci. Total Environ. 2019, 689, 1255–1275. [Google Scholar] [CrossRef]
  5. World Bank. World Development Indicators. 2009. Available online: http://databank.worldbank.org/data/source/world-development-indicators (accessed on 31 January 2020).
  6. Valenzuela-Levi, N. Factors influencing municipal recycling in the Global South: The case of Chile. Resour. Conserv. Recycl. 2019, 150, 104441. [Google Scholar] [CrossRef]
  7. Ministry of Environment. Ley 20.920 Gestión de Residuos, Responsabilidad Extendida del Productor y Fomento al Reciclaje; (In Spanish). 2016. Available online: https://mma.gob.cl/economia-circular/ley-de-fomento-al-reciclaje/ (accessed on 31 January 2020).
  8. Vásquez, Ó. Gestión de los residuos sólidos municipales en la ciudad del Gran Santiago de Chile: Desafíos y oportunidades. Rev. Int. Contam. Ambient. 2011, 27, 347–355. [Google Scholar]
  9. European Commission, A.A. Closing the Loop—An EU Action Plan for the Circular Economy. Communication No. 614. 2015. Available online: https://eur-lex.europa.eu/legal-content/EN/TXT/?uri=CELEX:52015DC0614 (accessed on 13 February 2021).
  10. Cavaleiro de Ferreira, A.; Fuso-Nerini, F. A Framework for Implementing and Tracking Circular Economy in Cities: The Case of Porto. Sustainability 2019, 11, 1813. [Google Scholar] [CrossRef] [Green Version]
  11. Schroeder, P.; Anggraeni, K.; Weber, U. The Relevance of Circular Economy Practices to the Sustainable Development Goals. Resear. Ana. 2018, 23, 77–95. [Google Scholar] [CrossRef] [Green Version]
  12. Romano, G.; Molinos-Senante, M. Factors affecting eco-efficiency of municipal waste services in Tuscan municipalities: An empirical investigation of different management models. Waste Manag. 2020, 105, 384–394. [Google Scholar] [CrossRef] [PubMed]
  13. Cooper, W.W.; Seiford, L.M.; Zhu, J. Handbook on Data Envelopment Analysis; Springer: Berlin/Heidelberg, Germany, 2011. [Google Scholar]
  14. Korhonen, P.; Luptacik, M. Eco-efficiency analysis of power plants: An extension of data envelopment analysis. Eur. J. Operat. Resear. 2004, 154, 437–446. [Google Scholar] [CrossRef]
  15. Beltrán-Esteve, M.; Reig-Martínez, E.; Estruch-Guitart, V. Assessing eco-efficiency: A metafrontier directional distance function approach using life cycle analysis. Environ. Imp Assessment. 2017, 63, 116–127. [Google Scholar] [CrossRef]
  16. Gomez, T.; Gémar, G.; Molinos-Senante, M.; Sala-Garrido, R.; Caballero, R. Measuring the eco-efficiency of wastewater treatment plants under data uncertain. J. Environ. Sci. 2018, 226, 484–492. [Google Scholar]
  17. Rogge, N.; De Jaeger, S. Evaluating the efficiency of municipalities in collecting and processing municipal solid waste: A shared input DEA-model. Waste Manag. 2012, 32, 1968–1987. [Google Scholar] [CrossRef]
  18. Pérez-López, G.; Prior, D.; Zafra-Gómez, J.L. Temporal scale efficiency in DEA panel data estimations. An application to the solid waste disposal service in Spain. Omega 2018, 76, 18–27. [Google Scholar] [CrossRef]
  19. Guerrini, A.; Carvalho, P.; Romano, G.; Cunha Marques, R.; Leardini, C. Assessing efficiency drivers in municipal solid waste collection services through a non-parametric method. J. Clean. Prod. 2017, 147, 431–441. [Google Scholar] [CrossRef]
  20. Yang, Q.; Fu, L.; Liu, X.; Cheng, M. Evaluating the efficiency of municipal solid waste management in China. Int. J. Environ. Res. Public Health 2018, 15, 2448. [Google Scholar] [CrossRef] [Green Version]
  21. Sarra, A.; Mazzocchitti, M.; Rapposelli, A. Evaluating joint environmental and cost performance in municipal waste management systems through data envelopment analysis: Scale effects and policy implications. Ecol. Ind. 2017, 73, 756–771. [Google Scholar] [CrossRef]
  22. Expósito, A.; Velasco, F. Municipal solid-waste recycling market and the European 2020 Horizon Strategy: A regional efficiency analysis in Spain. J. Clean. Prod. 2018, 172, 938–948. [Google Scholar] [CrossRef]
  23. Agovino, M.; D’Uva, M.; Garofalo, A.; Marchesano, K. Waste management performance in Italian provinces: Efficiency and spatial effects of local governments and citizen action. Ecol. Indic. 2018, 89, 680–695. [Google Scholar] [CrossRef]
  24. Halkos, G.; Petrou, K.N. Assessing 28 EU member states’ environmental efficiency in national waste generation with DEA. J. Clean. Prod. 2019, 208, 509–521. [Google Scholar] [CrossRef]
  25. Marques, R.C.; De Witte, K. Is big better? On scale and scope economies in the Portuguese water sector. Econ. Model. 2011, 28, 1009–1016. [Google Scholar] [CrossRef]
  26. Charnes, A.; Cooper, W.W.; Rhodes, E. Measuring the efficiency of decision making units. Eur. J. Oper. Res. 1978, 2, 429–444. [Google Scholar] [CrossRef]
  27. Fare, R.; Grosskopf, S.; Noris, M.; Zhang, Z. Productivity Growth, Technical Progress and Efficiency Change in Industrialized Countries. Am. Econ. Rev. 1994, 1, 66–83. [Google Scholar]
  28. Fernández-Aracil, P.; Ortuño-Padilla, A.; Melgarejo-Moreno, J. Factors related to municipal costs of waste collection service in Spain. J. Clean. Prod. 2018, 175, 553–560. [Google Scholar] [CrossRef] [Green Version]
  29. Simões, P.; De Witte, K.; Marques, R.C. Regulatory structures and the operational environment in the Portuguese solid waste sector. Waste Manag. 2010, 30, 1130–1137. [Google Scholar] [CrossRef]
  30. Simões, P.; Cruz, N.F.; Marques, R.C. The performance of private partners in the waste sector. J. Clean. Prod. 2012, 29–30, 214–221. [Google Scholar] [CrossRef]
  31. Díaz-Villavicencio, G.; Didonet, S.R.; Dodd, A. Influencing factors of ecoefficient urban waste management: Evidence from Spanish municipalities. J. Clean. Prod. 2017, 164, 1486–1496. [Google Scholar] [CrossRef]
  32. Theodorsson-Norheim, E. Kruskal-Wallis test: BASIC computer program to perform nonparametric one-way analysis of variance and multiple comparisons on ranks of several independent samples. Comp. Meth. Progr. Biomed. 1986, 23, 57–62. [Google Scholar] [CrossRef]
  33. Chilean Census. 2017. Available online: https://www.censo2017.cl/ (accessed on 1 February 2020).
  34. Romano, G.; Rapposelli, A.; Marrucci, L. Improving waste production and recycling through zero-waste strategy and privatization: An empirical investigation. Resour. Conserv. Recycl. 2019, 146, 256–263. [Google Scholar] [CrossRef]
  35. Calabrò, P.S.; Komilis, D. A standardized inspection methodology to evaluate municipal solid waste collection performance. J. Environ. Manag. 2019, 246, 184–191. [Google Scholar] [CrossRef] [PubMed]
  36. Sarra, A.; Mazzocchitti, M.; Nissi, E. A methodological proposal to determine the optimal levels of intermunicipal cooperation in the organization of solid waste management systems. Waste Mang. 2020, 115, 56–64. [Google Scholar] [CrossRef] [PubMed]
Figure 1. Histogram of the efficiency and eco-efficiency scores of the Chilean municipalities evaluated.
Sustainability 13 02022 g001
Figure 2. Histogram of difference between eco-efficiency and efficiency scores Chilean municipalities evaluated.
Sustainability 13 02022 g002
Figure 3. Efficiency scores for each Chilean municipality evaluated.
Sustainability 13 02022 g003
Figure 4. Eco-efficiency scores for each Chilean municipality evaluated.
Sustainability 13 02022 g004
Figure 5. Differences in eco-efficiency and efficiency scores for the Chilean municipalities evaluated.
Sustainability 13 02022 g005
Table 1. Variables used as inputs and outputs to evaluate efficiency and eco-efficiency of municipalities in MSW management.
Efficiency AssessmentEco-Efficiency Assessment
Inputs: (i) total costs of MSW collection and disposal (CLP/year)Inputs: (i) total costs of MSW collection and disposal (CLP/year)
Output: (i) quantity of MSW collected and disposed (ton/year)Desirable outputs: (i) quantity of paper collected and recycled (ton/year); (ii) quantity of glass collected and recycled (ton/year); (iii) quantity of plastic collected and recycled (ton/year); (iv) quantity of organic matter collected and recycled (ton/year).
Undesirable output: unsorted waste (ton/year)
Table 2. Basic statistics of the variables considered to evaluate efficiency and eco-efficiency.
Unit of MeasureAverageStandard DeviationMinimumMaximum
InputTotal costsCLP/year1,173,0682,051,9709814,765,504
Desirable outputPaper recycledTons/year5138906023
Glass recycledTons/year8930202759
Plastics recycledTons/year1511401842
Organic waste recycledTons/year88803013,089
Undesirable OutputsUnsorted wasteTons/year25,96743,0743360,451
Environmental VariablesPopulation DensityInhabit./km211173272018,221
Municipality size km218314747749,924
Population ServedInhabitants49,38387,729633568,094
Tourism Index 0.0480.1070.0001.000
Annual waste generated per capitakg/Inhabit*year124010,1920.430176,500
Table 3. Main statistics of the efficiency and eco-efficiency scores of the Chilean municipalities evaluated.
Efficiency
Score ( θ V R S )
Eco-Efficiency Score ( θ V R S )
Average0.260.54
Standard deviation0.230.11
Maximum1.001.00
Minimum0.000.50
Efficient municipalities (%)4.704.36
Table 4. Number of municipalities per group, average relative difference between efficiency and eco-efficiency scores and p-value for each environmental variable.
GroupsNumber of MunicipalitiesAverage Relative Difference (%)p-Value of Kruskal–Wallis
Population Served (Inhabitant)
<31003510790.000
3100–10,9009511,994
10,901–13,50026402
>13,500142116
Municipal size (Km2)
<248791860.448
240–42036346
420–60040383
>6001438124
Population Density (Inhabitant/km2)
<42410960.002
4–481547534
48–11,000108159
>11,0001240
Tourism Ranking
<0.10676610.002
0.10–0.591557419
0.59–0.8740164
>0.873693
Kg waste generated/ Nº of inhabitants (kg waste generated/inhabitant*year)
<4054425,8970.000
405–51072231
510–1210161268
>121021232
Publisher’s Note: MDPI stays neutral with regard to jurisdictional claims in published maps and institutional affiliations.

