Article

Level of Contamination Assessment of Potentially Toxic Elements in the Urban Soils of Volos City (Central Greece)

by
Evangelia E. Golia
1,*,
Sotiria G. Papadimou
1,2,
Christos Cavalaris
3 and
Nikolaos G. Tsiropoulos
2
1
Department of Agriculture Crop Production and Agricultural Environment, Laboratory of Soil Science, University of Thessaly, N. Ionia Volos, 38 446 Magnesia, Greece
2
Department of Agriculture Crop Production and Agricultural Environment, Analytical Chemistry and Pesticides Laboratory, University of Thessaly, N. Ionia Volos, 38 446 Magnesia, Greece
3
Department of Agriculture Crop Production and Agricultural Environment, Laboratory of Agricultural Engineering, University of Thessaly, N. Ionia Volos, 38 446 Magnesia, Greece
*
Author to whom correspondence should be addressed.
Sustainability 2021, 13(4), 2029; https://0-doi-org.brum.beds.ac.uk/10.3390/su13042029
Submission received: 18 January 2021 / Revised: 10 February 2021 / Accepted: 10 February 2021 / Published: 13 February 2021

Abstract

:
A three-year study, designed to record the level of potentially toxic elements within the urban complex in the city of Volos, Greece, was carried out between 2018 and 2020. For the needs of the aforementioned study, 62 surface (0–15 cm) soil samples were collected each year (i.e., 186 samples in total) from an urban area of 3.65 km2, and the average value of pseudo-total metal concentration was measured. Soil pollution indices, such as the contamination factor (CF) and the geo-accumulation index (Igeo), were estimated regarding each of the metals of interest. The respective thematic maps were constructed, and the spatial variability of the contamination degree was displayed. Higher values of the CF and Igeo were obtained near the heavy traffic roads and beside the railway station, the bus stations, and the commercial port. The maps based on the pollution indices, along with the database that was constructed using the appropriate mathematical tools of geostatistical analysis, may be a useful tool for monitoring, prediction, and continuous verification of contamination in the urban soils of Volos city.

1. Introduction

Important functions vital for agricultural, environmental, land preservation, perspective architecture, and urban activities usually take place in the soil [1,2]. Urban soils are inside or nearby cities, i.e., in urban and suburban areas that are significantly and persistently disrupted by human activity [3]. They include: (a) soils consisting of a mixture of materials of different origins, with inorganic or organic compositions, and from agricultural or forest areas, which are largely transformed by human intervention [4]; (b) soils in parks and green gardens that offer different compositions, uses, and management of agricultural land [5,6]; and (c) soils or mixtures resulting from various construction or metallurgical activities within cities [7].
Urban soils are created when human intervention takes place for many years, or after an immediate and abrupt concentration of human activities in a specific area and in a specific environmental background [8,9,10]. Compared to natural and agricultural soils, urban soil inherits certain characteristics of the parent rock, but it is also influenced by the local microenvironment as well as the process of its formation. Changes in the physical and chemical properties and in the biological cycles of nutrients are often observed.
Urban areas are often densely populated, so there is an over-consumption of natural resources and high production of pollutants. In recent decades, there has been an increase in urbanization and industrialization, as short-term and intensive human activities lead to large numbers of organic pollutants (such as polyhalogenated compounds), along with inorganic pollutants (such as potentially toxic metals) [11,12].
It is well known that Potentially Toxic Elements (PTEs) accumulation in the soil leads to soil degradation, which can be a serious problem concerning human health, as metals can easily accumulate in the human body through food or ingestion of water as well as through respiration pathways [13]. Ecological risk assessments and their potential impact on human health are of great importance because they can point to unbearable dangers related to man and the environment [14]. In addition, they also require the identification of the specific driving factors that contribute to these risks [15]. The accumulation of metals in the upper soil can threaten health through consumption, digestion, and skin contact [3], and soil toxicity by heavy metals is highly correlated with metal levels and nature. In many cases, damage to human health is inevitable: headaches, insomnia, insanity, joint pain, and cancer. They can have a stronger effect on human health, plants, and soil organisms as well as in water filtration [16]. Problems due to urban soil systems are distinguished by other strongly affected soils, such as those found in quarries, mines, and airports far from cities [17]. There are different routes of exposure, such as direct ingestion through the food chain, inhalation through the mouth and nose, and direct skin contact. Therefore, it is important to assess the contamination and risk to human health of soil metals to improve the environment and protect human health [18,19].
Identifying potential sources of metals in soils is important for controlling priority pollutants. Recently, various mathematical models and methods of statistical analysis have been applied, such as the various indices usually called environmental factors (EFs) such as, the contamination factor (CF), the geo-accumulation index (Igeo), the availability factor (AF), principal component analysis (PCA), and factor analysis (FA) [20,21]. These tools are highly used to distinguish the natural and human origins of metals in soil systems [17] On the other hand, GIS in environmental pollution is a valuable tool for mapping out the contaminants in soil. Spatial display and pollutant distribution allow for a more efficient perspective to monitor soil contamination [22,23]. Spatial data management has a large range of applications along with great advantages [24,25] Methodologies incorporating GIS can be applied in soil contamination projects to facilitate the interpretation, estimation, and evaluation of information between stakeholders, which will improve stakeholder communication in the decision making process [26].The potential burden on the urban environment due to the presence of heavy metals in urban soils, along with the particles suspended in the air and deposited on the soil surface, has gained intense research interest in recent years [27,28]. However, limited studies are focused on risk assessment in urban and suburban areas, on densely populated areas, or on the industrial cities of Greece [29,30,31].
The objectives of the present study were (1) to evaluate heavy metal contamination levels in the urban soils of Volos, (2) to identify which PTEs are of most concern using soil contamination indices, and (3) to highlight the areas (sites) that are most at risk of pollution by constructing proper thematic maps to illustrate the spatial distribution in the study area. The novelty of the present research lies in the fact that, for the first time, a database has been created that enables the continuous monitoring of contamination assessment after recording the changes of the contamination index values in the area studied.

2. Materials and Methods

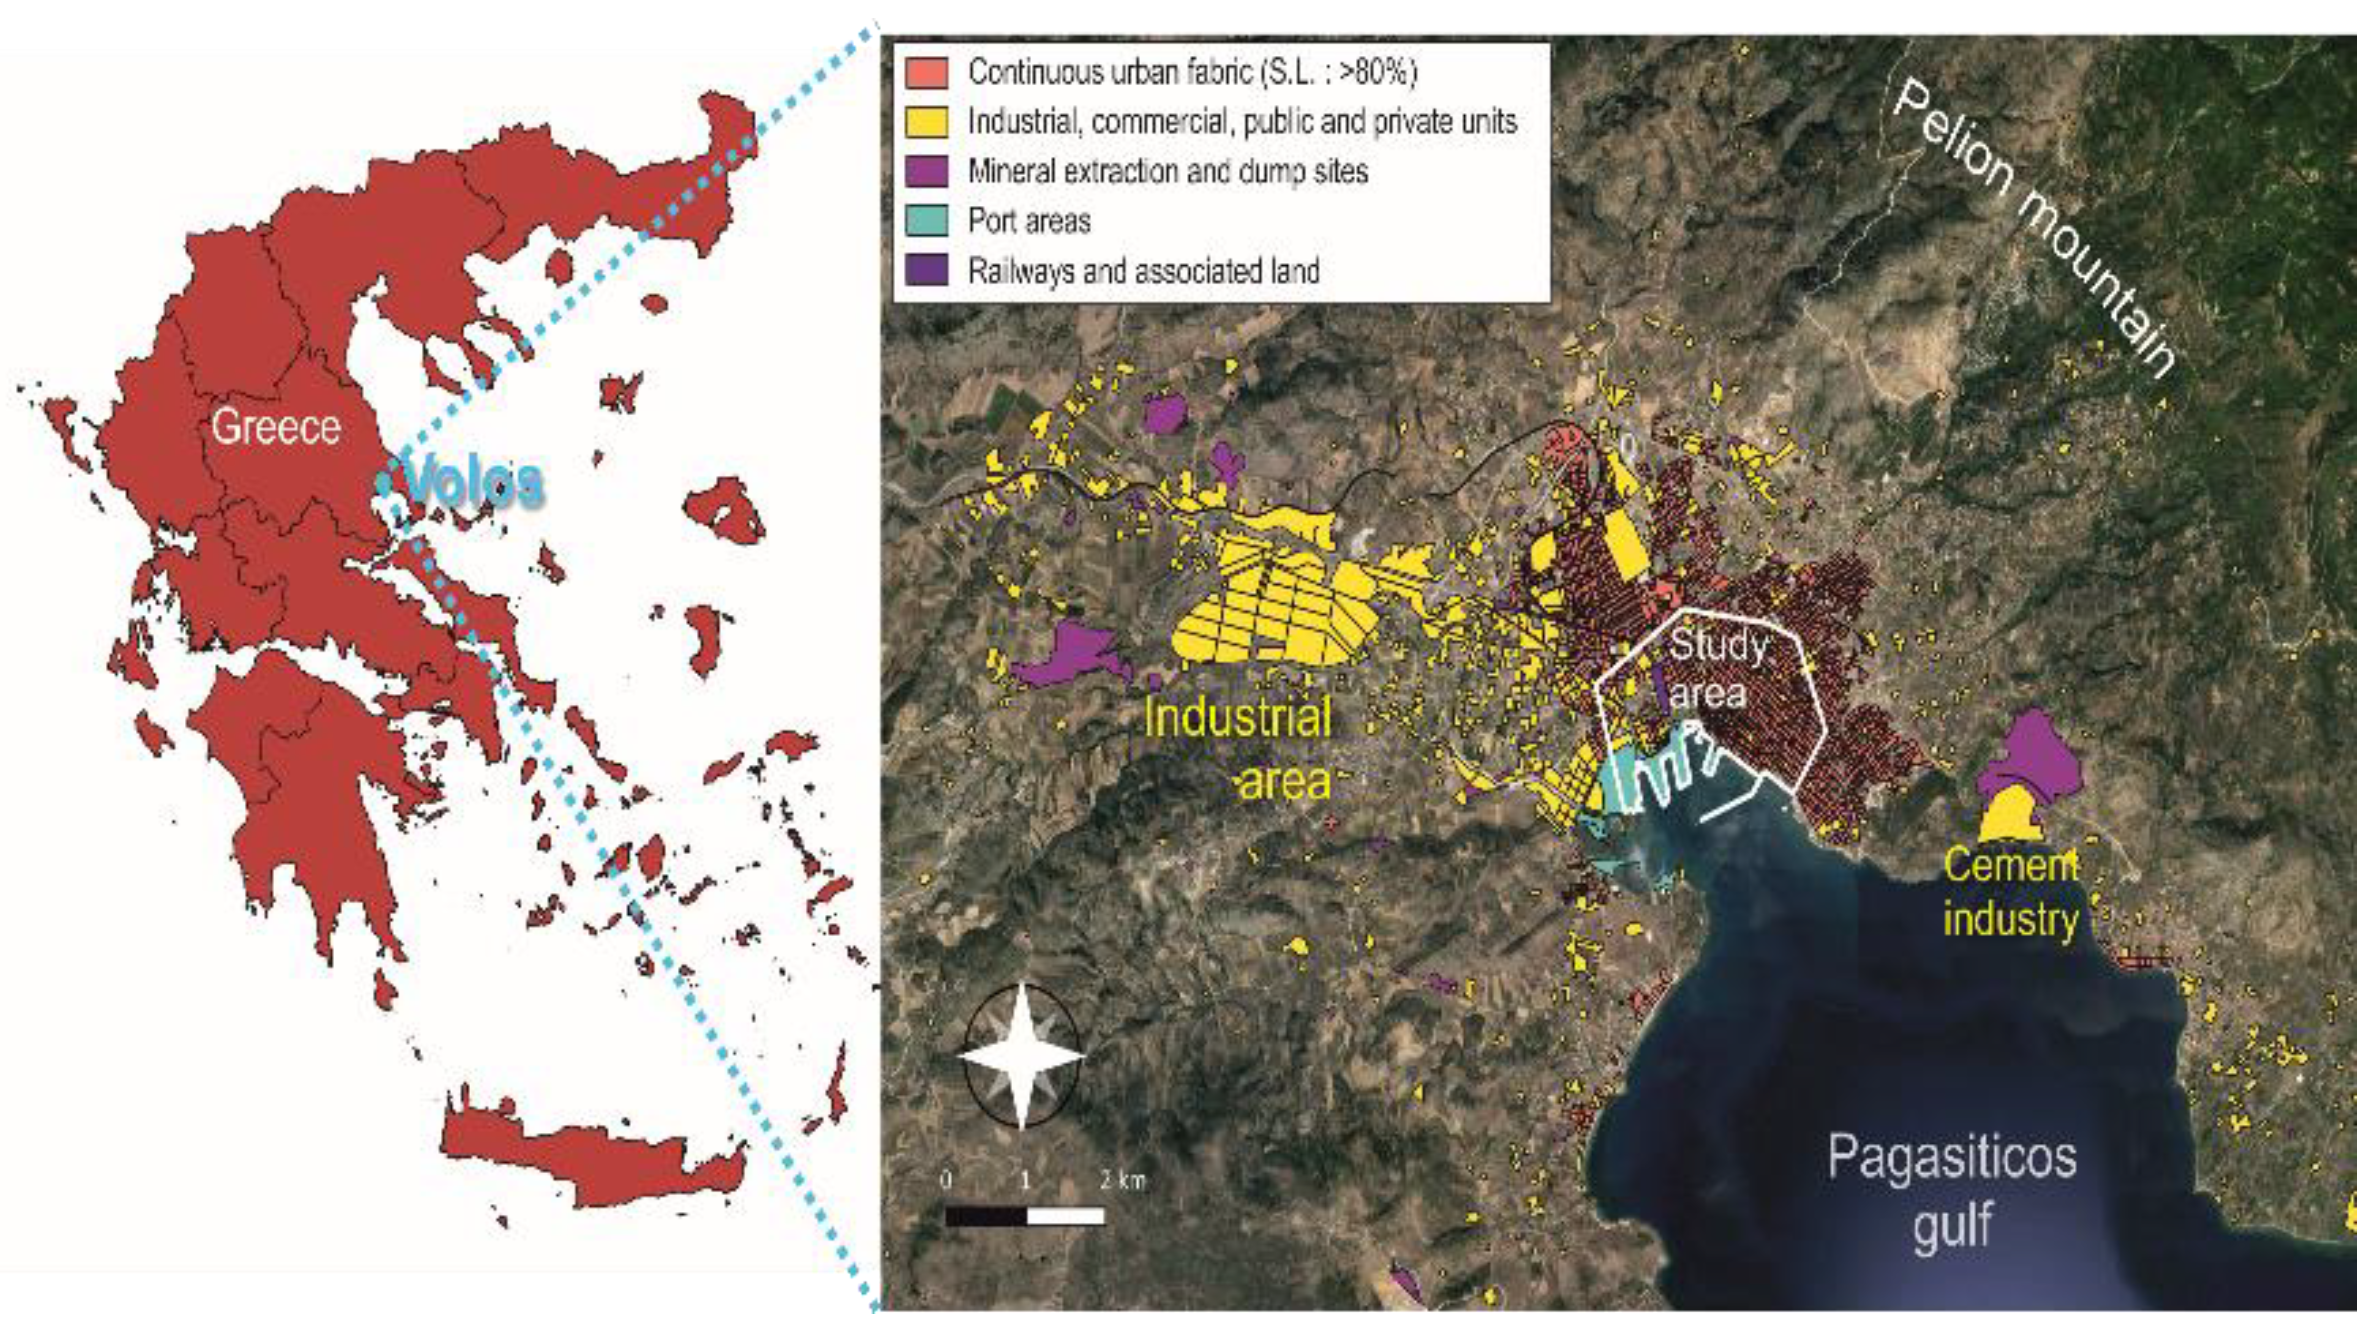
2.1. Site Description

Volos is a seaside port of Thessaly located in the middle of Greece. It was built inside the Pagasiticos Gulf and spreads along the plain beneath Pelion. It has a population of about 150,000 inhabitants. The area has a typical Mediterranean climate with wet and cold winters, dry and hot summers, a 14.4 °C average yearly temperature, and a mean yearly precipitation of 450 mm. At the west side, about 12–14 km from the city center, resides an industrial area that also includes a steel plant. Another large cement industry, producing seven types of cement, clinker, solid fuels, and aggregates, is located a distance of 4 km to the east part of the city (Figure 1). The present study is focused on the downtown city center, covering an area of 3.65 km2.

2.2. Soil Sampling

Sixty-two soil samples per year, consisting of three sub-soils each [32], were collected from diverse green spaces, including parks, playgrounds, squares close to the harbor, flower beds located close to main streets, and a neighborhood adjacent to a cement factory. The investigation began in June 2018. In the following two years (2019–2020), soil samples were collected from the same sampling points (i.e., 186 soil samples in total) of Volos.

2.3. Chemical Analysis of Soil Samples

The physicochemical analyses of the soil samples were conducted using the methods described by Page et al. [33]. The analyses were preceded by air-drying the soil samples for three days and sieving them using a 2 mm sieve. Clay, sand, and silt percentage, as well as cation exchange capacity (CEC), pH values, electrical conductivity, organic matter content (Table 1), and pseudo-total content (Table 2), were measured using the aqua regia method [34,35]. Metals were determined using an atomic absorption spectrophotometer (flame and/or graphite furnace) with the following detection limits: 0.1, 0.09, 0.09, 0.1, 0.08, 0.2, 0.1, 0.15 (mg L−1) for Cu, Zn, Cd, Mn, Pb, Ni, Cr, and Co, respectively. A series of 11 standard solutions (Perkin Elmer®) for each metal were used after conducting the proper solutions with 5% c. HNO3 [35]. For the verification of the accuracy of the analyses, a certified reference material (CRM) (No 141R, calcareous loam soil) from the Community Bureau of Reference (BCR) was analyzed with the soil samples. The results of the metal determination in the CRM are presented in the Supplementary Materials Section. The European Council Directive 86/278/EEC [36] regulated the permissible limits for Cd, Cu, Co, Ni, Pb, and Zn. The Cr and Mn maximum values were reported in Kabata–Pendias [37] as the maximum allowable concentrations.

2.4. Contamination Risk Assessment Indices of PTEs

The following PTE contamination indices were estimated. [17,38].
The contamination factor (CF) is as follows:
CF = CΑR/CAR ref,
where CΑR is aqua regia extracted metal (mean values of the 3 years of the study) (mg kg−1 soil). CAR ref is the background reference element concentration in uncontaminated areas (mg kg−1, PTE concentrations in pristine soils, “world soil average”) [37].
The CF follows the classification: class I: CF < 1 (pristine soil), class II: CF = 1–3 (contamination is rated “moderate”), class III: CF = 3–6 (“considerable”), class IV: CF > 6 (“very high”).
The geo-accumulation Index (Igeo) is as follows:
Igeo = log2(CΑR /1.5 CAR ref)
Igeo [39] is designated using Latin numbering [40]: class I: Igeo < 0, class II: Igeo = 0–1, class III: Igeo = 1–2, class IV: Igeo = 2–3, class V: Igeo = 3–4, class VI: Igeo = 4–5, class VII: Igeo > 5.

2.5. Statistical and Geostatistical Procedures

The 3-year data taken from the 62 sample sites were subjected to a one-way ANOVA at a p < 0.05 level using the SPSS-26 package, in order to identify potential timescale changes [23,41]. The results showed no significant differences for the mean three-year values, although an upward trend from year to year was detected (ANOVA results are listed in the Supplementary Materials Section). The mean values were used for further analysis and the construction of thematic maps. Initially, the mean values were checked for normality and homogeneity by means of the Kolmogorov–Smirnov and Shapiro–Wilks tests [42]. The results showed an abnormal distribution. Based on that distribution, a spatial interpolation process using the ordinary kriging along with data logarithmic transformation and a grid of 5 m spatial resolution, was performed in the SAGA 7.9.0 GIS (SAGA User Group Association, 2020) [43]. Prior to kriging, the datasets were also checked for anisotropy in two perpendicular directions. Showing a similar spatial autocorrelation pattern, an omnidirectional variogram was computed for every variable, and a suitable model was fitted to that. The geospatial statistics are presented in Table 3 and Table 4. The ordinary kriging process resulted in raster images of pollution for each element. These rasters, along with the sampling point vector information and local points of interests (POIs), were integrated on the thematic maps using the QGIS 3.16.1 (QGIS Development Team, 2020) [44] and utilizing the web map service OpenStreetMap as a base layer (Figure 3).

3. Results

3.1. Physicochemical Properties of Soil Samples

The soils ranged from sandy loam to clayey, with soil reaction values between 6.6 and 8.9 (Table 1). High clay content was found in 19% of the soil samples, while 57% had a sandy texture. According to the soil pH values, 82.3% of the soil samples were alkaline, while 17.7% had a slightly acid soil reaction (<7). Organic matter (OM) values ranged between 0.3% and 4.4%. Soil electrical conductivity (EC) varied between 1122 and 6958 μS cm−1, with the mean value at 3204 μS cm−1.

3.2. Levels of Potentially Toxic Elements

The mean values of metal concentrations during the three years’ research along with their statistical characteristics are presented in Table 2. The mean values were found to be lower than maximum permitted values. The mean Cu concentration was 53.9, while the CEC directive value [36] was 140 mg kg−1. The other values were as follows: for Zn, the mean was 131.0, while the CEC limit was 300; for Pb, the mean was 35.9, while the CEC limit was 300; for Cd, the mean was 0.94, while the CEC limit was 3; for Cr, the mean was 93.2, while the Kabata–Pendias [37] value was 200; and for Ni, the average was 67.3, while the CEC limit was 75mg kg−1). Average Ni concentration was lower than the EU limit, while the Co and Mn mean concentrations were higher than the background levels.

3.3. Geostatistical analysis, Construction of Thematic Maps of Availability Indices of PTEs

The thematic maps, presented in Figure 2 and Figure 3, were created for the optimal depiction of spatial variability of the metal pollution assessment. The contamination factor (CF) and geo-accumulation index (Igeo) were used as useful tools to assess the pollution of the area. Descriptive statistics for the contamination factor (CF) and geo-accumulation index (Igeo) calculations along with the geostatistical parameters, for the creation and validation of the contour maps, are presented in Table 3 and Table 4, respectively.
The largest number of soil samples had CF values belonging to class II (1–3) and were characterized as “moderate contamination”. In class ΙΙ, the order of CFs was as follows: Cd = Zn > Ni > Co > Cu = Pb = Cr = Mn. In class III (CF: 3–6), characterized as “considerable contamination”, the order changed as follows: Ni > Co > Zn = Cd. There were no soil samples with CF > 6, i.e., belonging to class IV with “very high contamination”.
The Igeo values were also calculated. In class II (0–1), the order of the metal elements was as follows: Cd > Zn > Cr = Ni > Pb > Co > Mn > Cu. In class III (1–2), Ni was the most enriched element in the soil, followed by Co. Zn and Cd exhibited lower Igeo values in the decreasing sequence: Ni > Co > Zn = Cd. None of the metals studied had Igeo values > 2.

4. Discussion

4.1. Physicochemical Properties of Soil Samples

The soil samples were neutral to slightly alkaline. The presence of alkaline soils in the urban environment is rather common [7]. High clay content has usually been found in urban and peri-urban locations [28]. On the other hand, 19% of the samples had a sandy texture, which is probably due to the proximity of the samples to the coastal zone [45] or to the area near the river, which flows into the Pagasiticos Gulf. The organic matter content was rather low, but usually observed in Mediterranean soils with the characteristic climate, relatively high temperatures, and low humidity [46]. Anthropogenic activities create conditions of impaired salinity in soils, and especially in the capitals of the prefectures. A survey conducted in a Mediterranean site also revealed that soil salinity is controlled mainly by seawater intrusion and the usual application of salt-rich water [12]. The lower part of the study area was adjacent to the edges of the Pagasiticos Gulf, which naturally contributes to the increase in salinity [47].

4.2. Levels of Potentially Toxic Elements and Contamination Indices

The average CF values of the metals were >1, which indicates the strong anthropogenic influence in the area studied. The PTE contents were lower than those in soil samples in Athens, as described by Massas et al. [18] and Kelepertzis and Argyraki [5]. The soil samples seemed to be less contaminated than soils in areas with high anthropogenic activities [26,30,31,48]. The previous studies of Antoniadis et al. [48] and Kelepertzis et al. [30] made extensive reference to the impact of industrial activity on the peri-urban environment of Volos. The soil contamination indices (CF and Igeo) indicated low or moderate contamination. The elevated Ni Igeo may have been influenced by activities leading to enhanced Ni deposition [49]. Moreover, high Ni levels were previously reported in the nearby site, probably due to the geochemical composition of the parental material [48].

4.3. Construction of Thematic Maps and Geostatistical Analysis

The constructed maps based on the contamination indices [50] seemed to be a useful tool for the investigation of spatial distribution of metals in the city of Volos. To avoid misleading interpretations and alerts from visual observations, a uniform full-scale of the CF and Igeo values was used for the present maps’ color classification. Despite reducing the spatial discrimination, this choice resulted in the maps depicting the potential toxicity of the studied metals [23]. In the present study, the cubic, exponential, and spherical models were used for the construction of the thematic maps in Figure 2 and Figure 3, of the CF and Igeo, respectively. The cubic model seemed to be the proper one for the construction of maps based on the contamination factor of Cu along with the Pb, Ni, and Cr maps based on the Igeo indices [24]. The exponential and spherical models were preferred for the spatial distribution of Zn and Co in the CF and Igeo indices, respectively. Similar techniques and mathematical models have been used by other researchers [51,52] as they provide the best predictions. The low nugget/sill ratio (<0.25) obtained for most of the parameters indicated the spatial dependence of the variables [53].

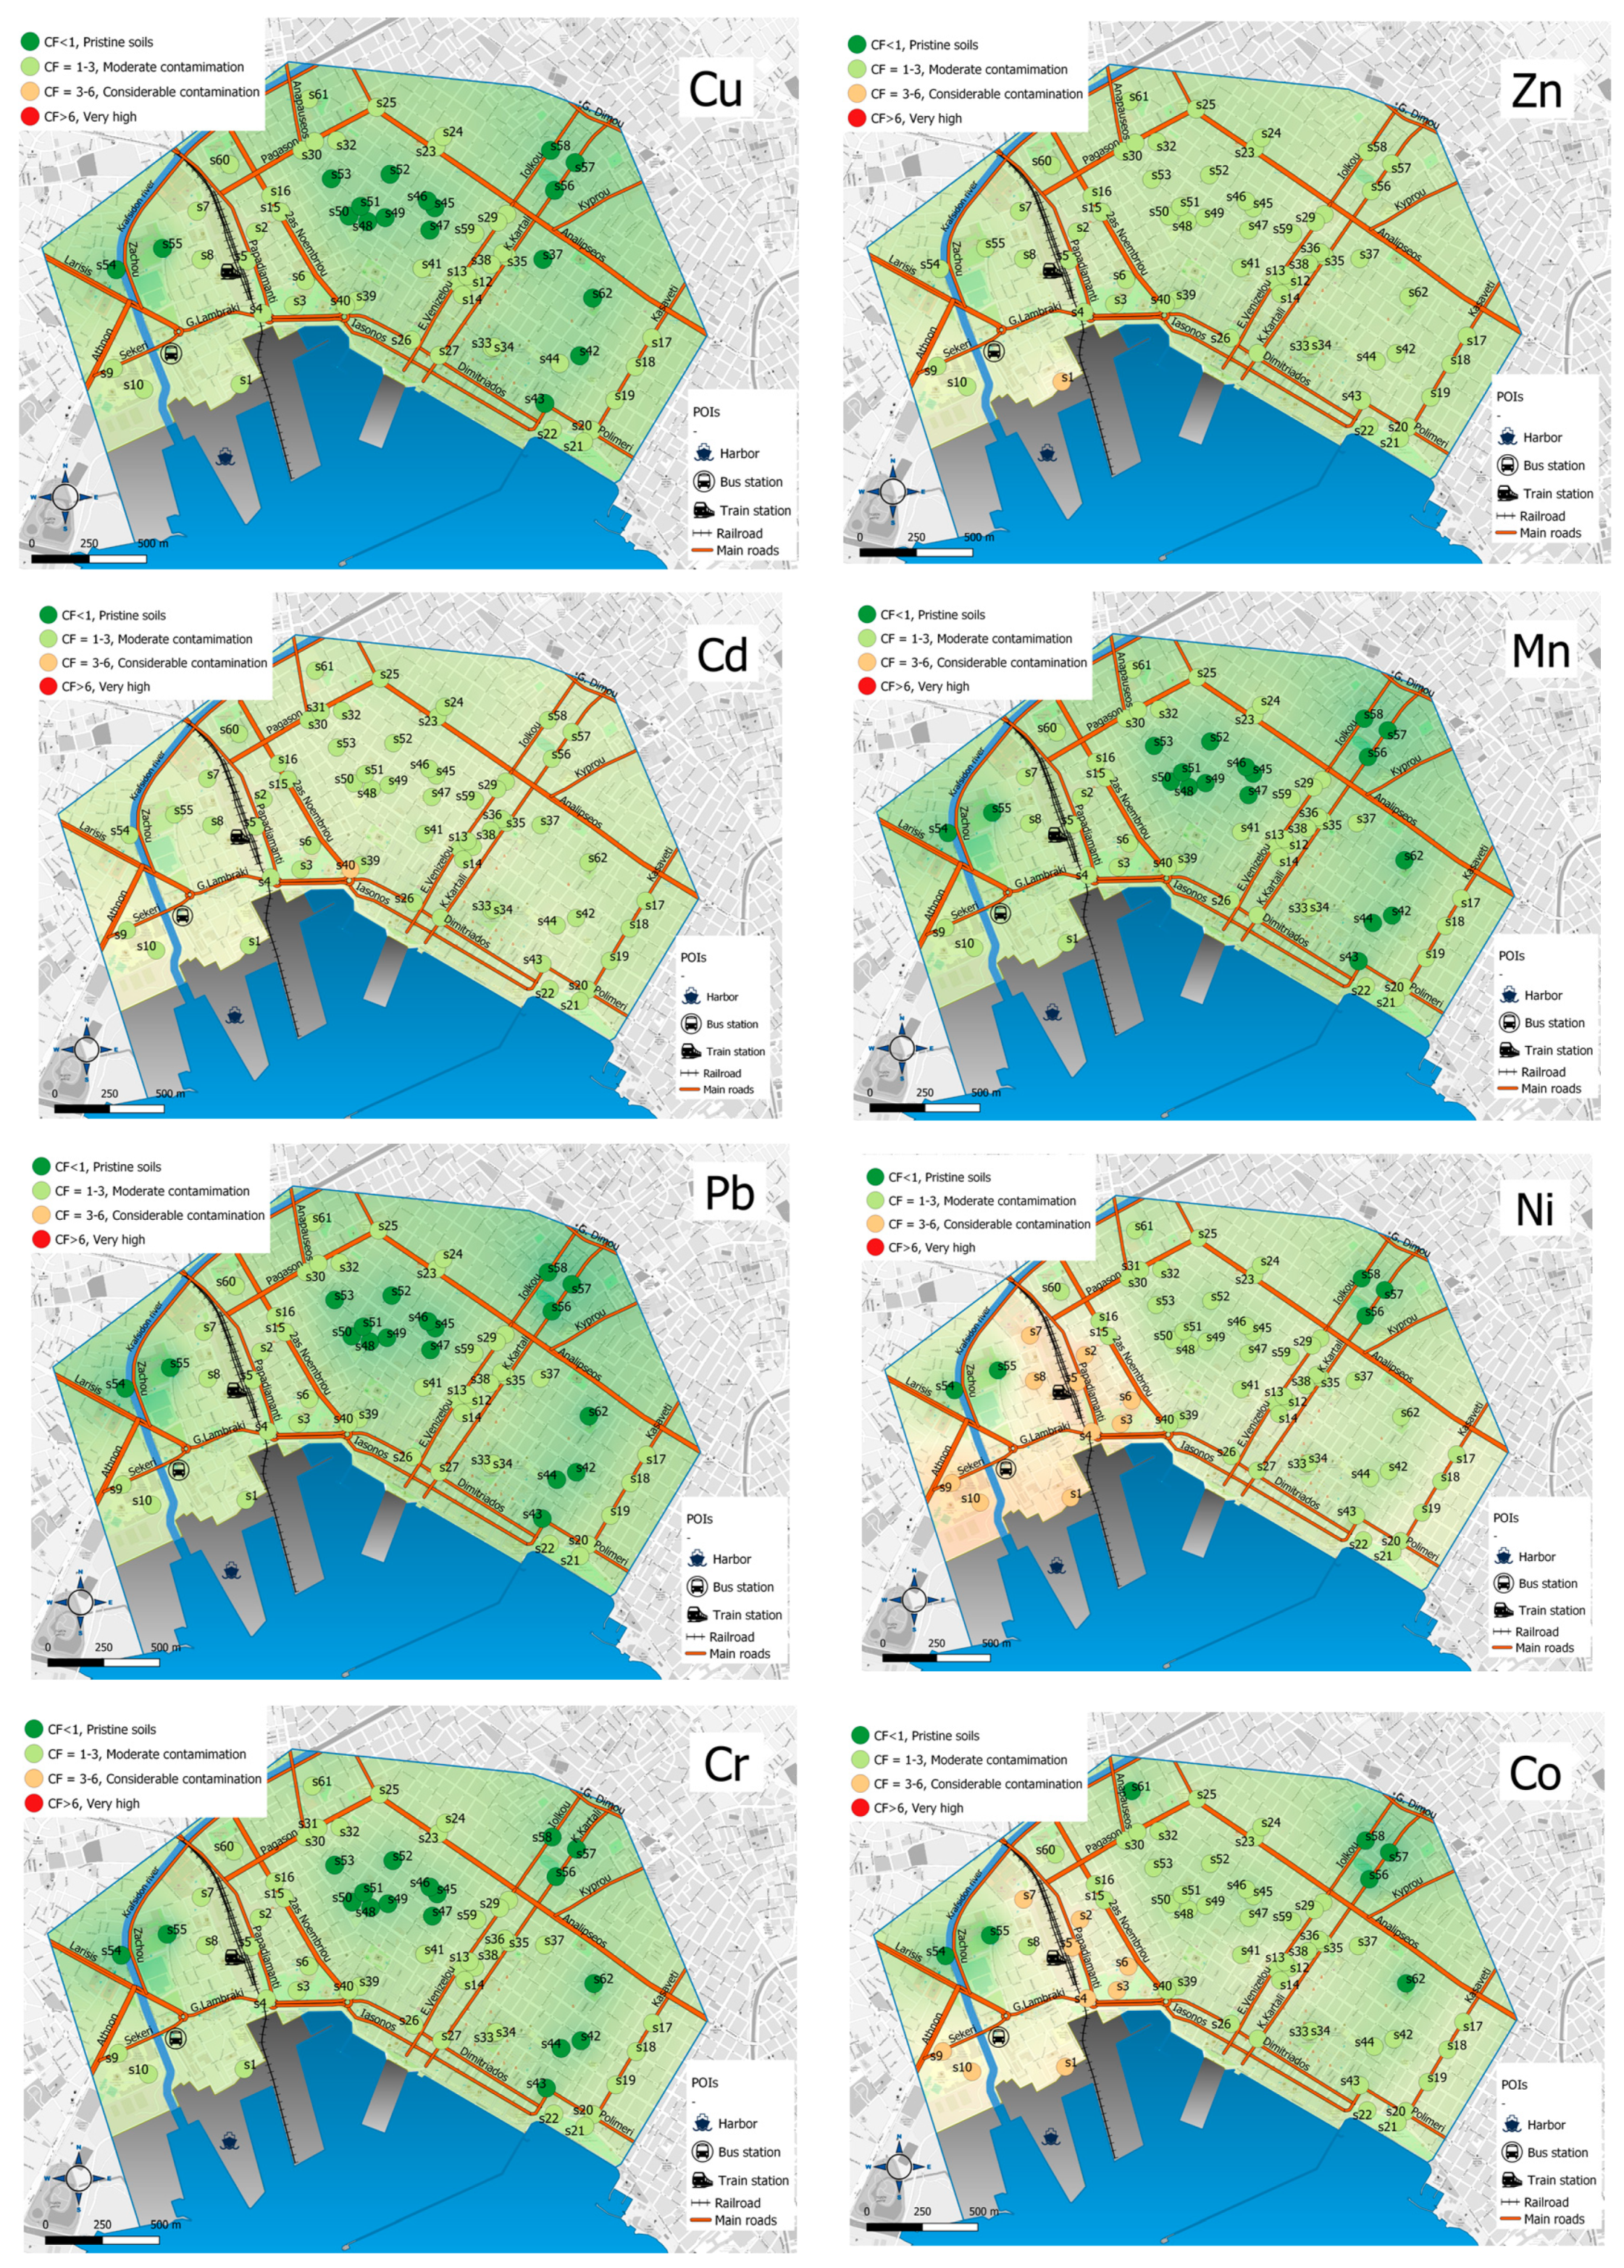
4.3.1. Maps of Contamination Factors

The Cu, Pb, Mn, and Cr contamination factor maps (Figure 2) revealed that the highest concentrations of these metals occurred near the heaviest traffic roads (Analipseos, K., Kartali, Demetriados), as well as in the areas adjacent to the railway station, the bus stations, and the commercial port, as mentioned in many studies [13,30,54]. The long-time and increased vehicle traffic using lead-based fuels, before the banning of lead-containing gasoline, may have led to increased PTE contents in urban soils [54,55]. Nevertheless, the CF values were high, and the ranking led to the rating of “moderate contamination” conditions. Cd and Zn revealed “moderate contamination” in all sampling points, with the exception of S40. The higher Cd concentrations were probably because of road construction works carried out during the sampling period (second year, 2019). The high CF value of Zn in S1 near the commercial port led to “considerable contamination”. Prolonged use and storage of metal objects and scrubs may have led to high Zn levels locally [29]. Ni and Co concentrations led to “considerable contamination” around the railway, the bus stations, and the port [56]. However, in the main area of Volos, the CF of Ni and Co indicated a “moderate contamination”.

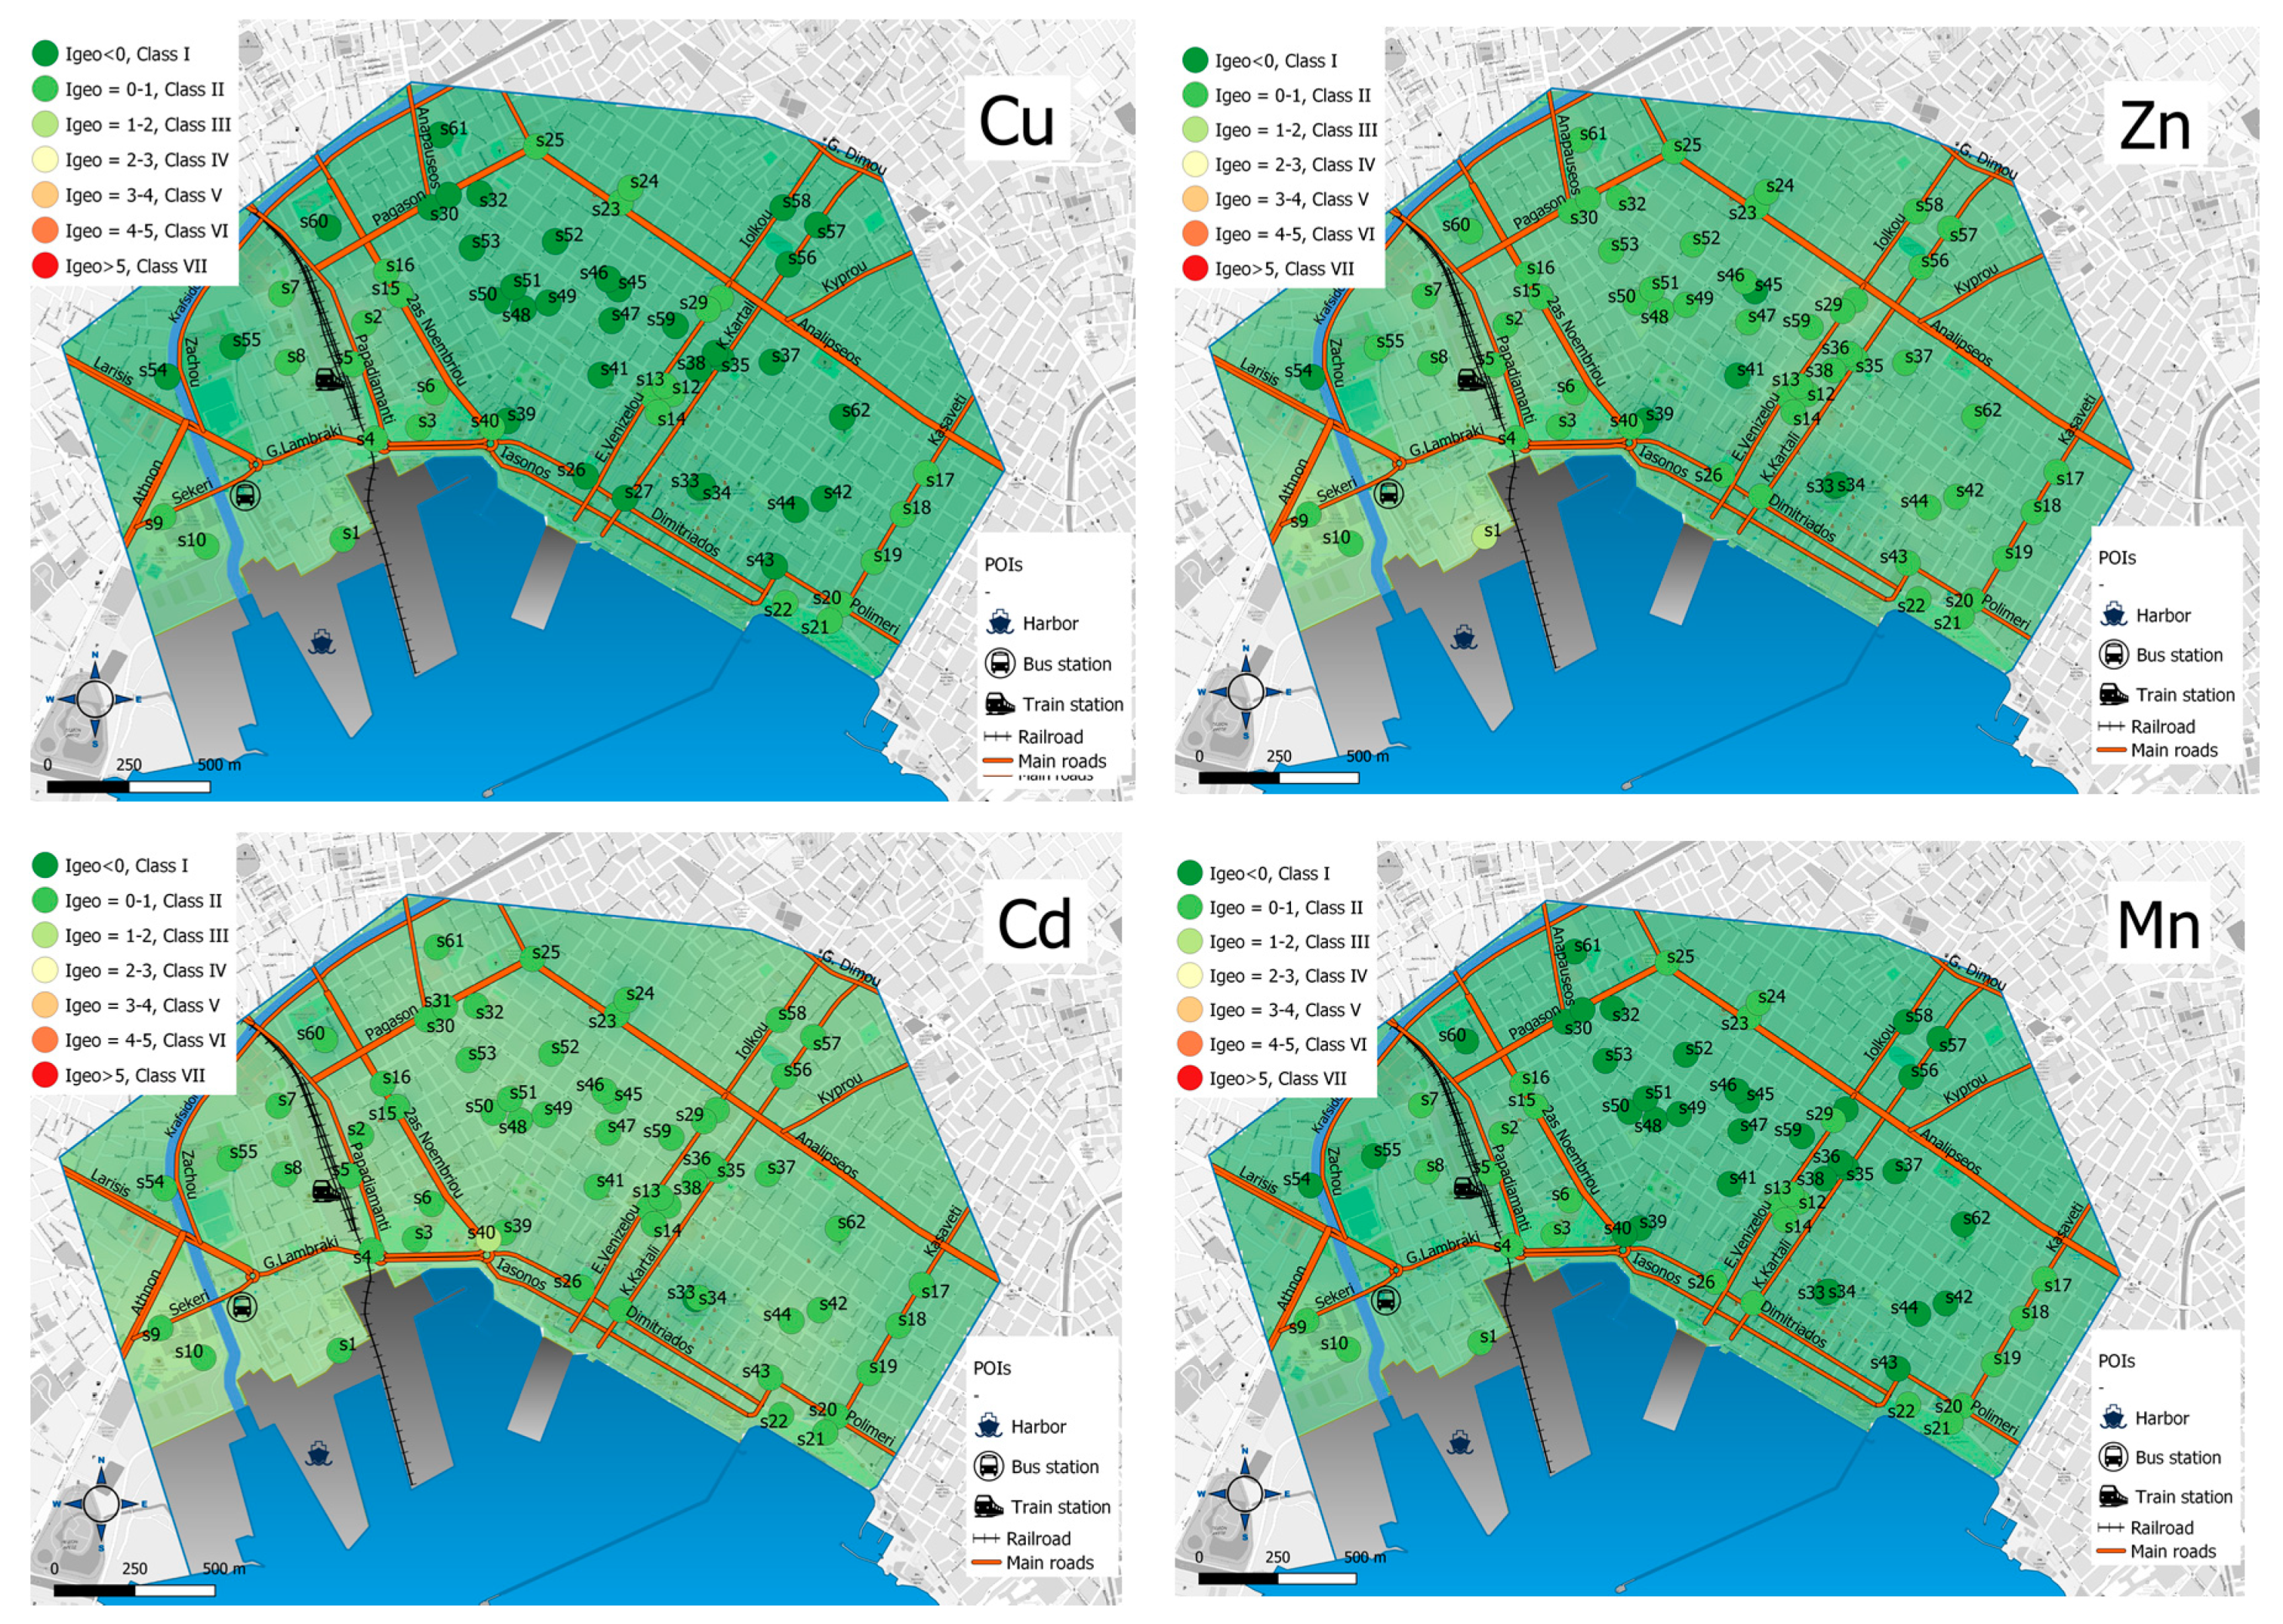
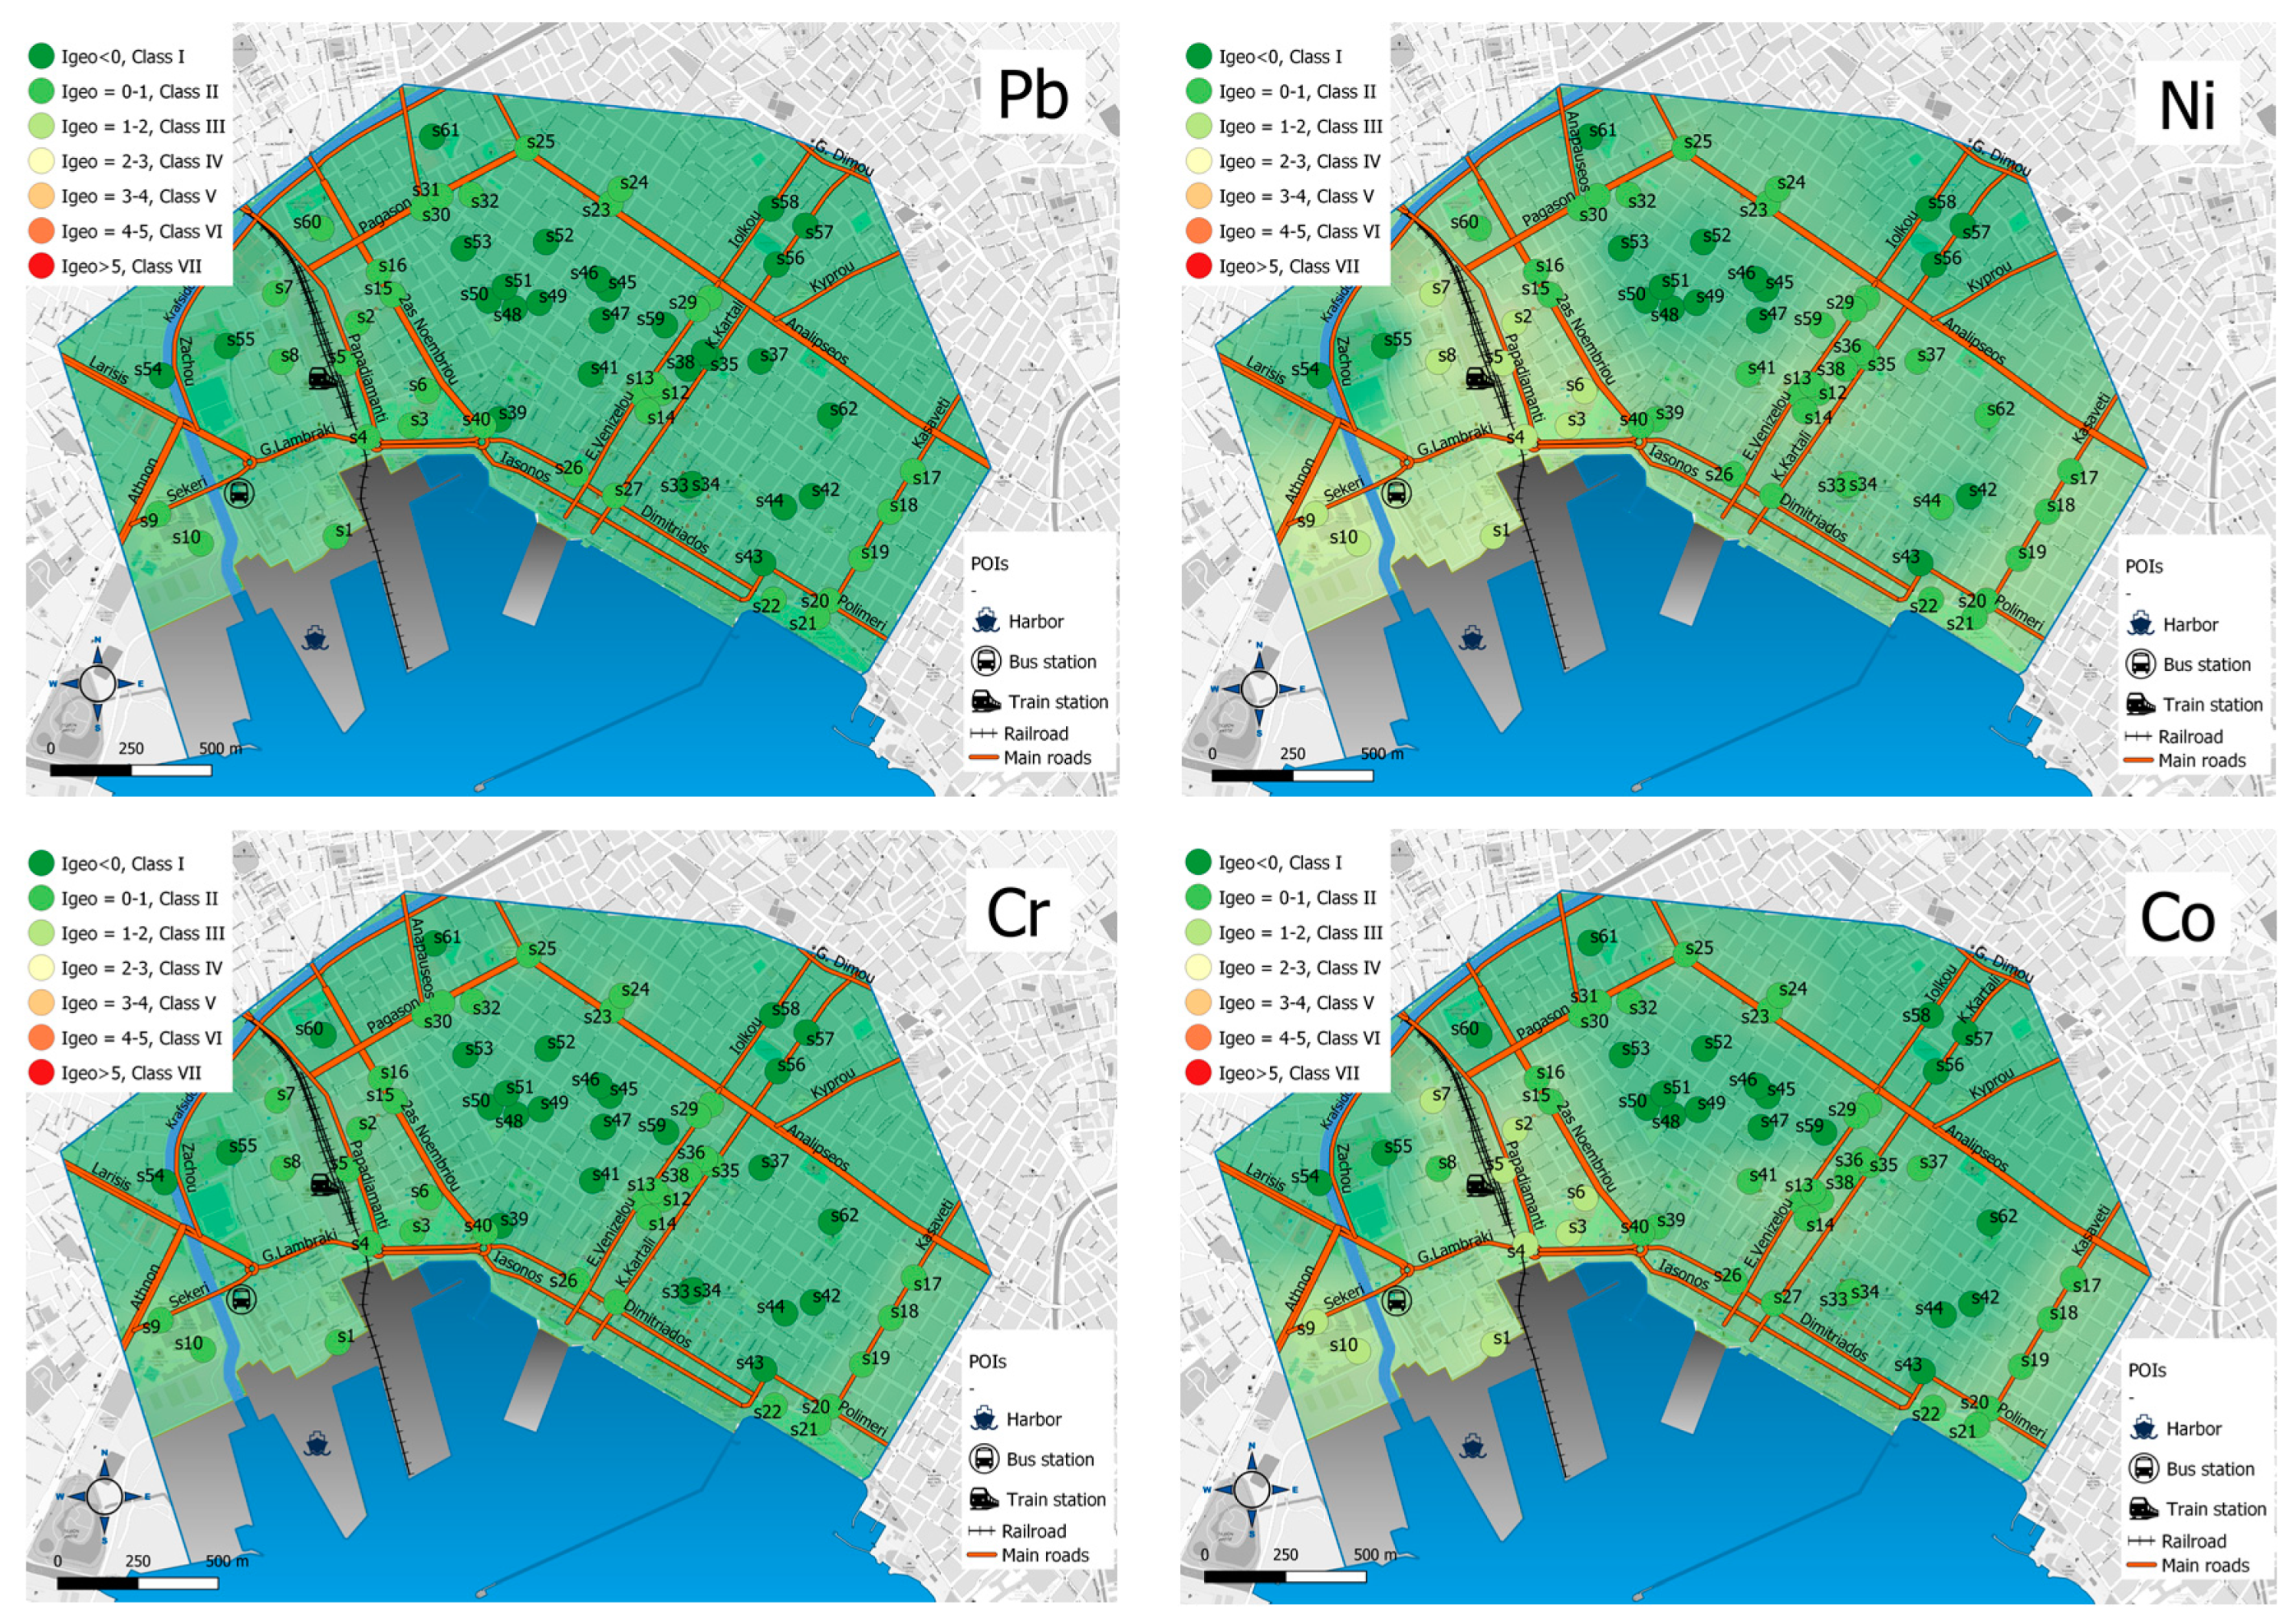
4.3.2. Maps of Geo-Accumulation Index

The maps (Figure 3), based on the Igeo distribution, revealed moderate contamination of Cu and Mn at the main roads and railway, and beside the bus stations and the city port (Igeo, 0–1), and the values suggested lower contamination level compared to other researches [28,29,37]. The Igeo values of Cd and Zn also belonged to class II (0–1), but in the S1 and S40 soil samples, an exaggeration was observed as higher values were recorded. High levels of metals beside ports are usually observed [56]. It is well known that metal concentration in aquatic ecosystems, such as ports, is measured in water and in sediment. Usually, metals exist in the lowest content in water and in higher concentrations in sea sediments [6,12]. The permanent presence of metals near ports is a problem of utmost concern as their constant contact with salts and the particularly high percentage of moisture creates oxidizing conditions. The metals therefore corrode and their concentrations in the soils accumulate [45]. In 16.1% of the soil samples, the Igeo values of nickel belonged to class III (1–2). Nickel has a large number of industrial uses and applications [57]. The occurrence of unexpectedly higher concentrations of nickel at the railway station and on the west side of the study area may be related to its geochemical origin, as recorded in a previous study [48]. The Igeo values of class II (0–1) were found for Pb, Co, and Cr near the main city roads, possibly affected by heavy traffic [57,58,59,60].
The factories located around the city of Volos may contribute to the pollution of the area, especially when the weather conditions are favorable for the spread of pollutants [30,48]. It is also worth mentioning that Volos is a rural area surrounded by the Pelion mountain to the north and the Pagasiticos Gulf to the south, creating a microenvironment favorable to the frequent entrapment of atmospheric pollution [29,30]. The burning of materials in the fireplaces of the houses to the right of the study area may also contribute to the increase in PTE pollution [61]. There is also evidence that the coal or crude oil used for household heating, gasoline, and diesel vehicle exhaust is of the major problems in urban soil pollution [29]. Concluding, the contamination seems to be significantly increasing near the commercial port of the city of Volos, close to the railway station, and in the intercity bus station along with the big and heaviest traffic roads of Volos [62]. The present study could give rise to further and more thorough research in the future. The identification of contamination sources at the local and national level could control or even reduce the levels of PTEs in the area of interest.

5. Conclusions

The level of PTEs in the soil samples of Volos were found to be lower than the maximum permitted values set by the European Union. Soil contamination indices (CF and Igeo) also confirmed the low to moderate level of contamination with PTEs. The formation of a database with three-year records of the PTE level is an innovation, as it has not been described before. Map formation, based on the values of the contamination indices, is a valuable, useful, and easy-to-handle tool for recording, monitoring, managing, and predicting contamination levels in the area of interest. Nevertheless, continuous long-term monitoring for the assessment of PTE levels is of paramount importance, as high PTE levels could ultimately have negative effects on the environment, food, and consequently, on the health of the citizens of Volos and the adjacent communities. Spatial environmental monitoring could be very useful for the assessment of environmental conditions and trends in the cities of Greece, and even worldwide, as it leads to an evidence-based approach for reporting to national policy makers. After all, maintaining good urban soil environmental quality is crucial for several socio-economic reasons along with human health and well-being.

Supplementary Materials

The following are available online at https://0-www-mdpi-com.brum.beds.ac.uk/2071-1050/13/4/2029/s1, (Table S1(SM) Pseudo-total concentrations of heavy metals of the reference material BCR CRM 141 R, Table S2(SM) Results of the analysis of variance (ANOVA) for the three-year data.

Author Contributions

Conceptualization, E.E.G. and N.G.T.; methodology, E.E.G. and C.C.; software, C.C.; validation, E.E.G. and N.G.T.; formal analfiguysis, E.E.G., S.G.P. and C.C.; investigation, E.E.G. and S.G.P.; resources, E.E.G., C.C. and N.G.T.; data curation, E.E.G., C.C. and S.G.P.; writing—original draft preparation, E.E.G., S.G.P. and C.C.; writing—review and editing, E.E.G., C.C. and N.G.T.; visualization, C.C. and S.G.P.; supervision, E.E.G. and N.G.T.; All authors have read and agreed to the published version of the manuscript.

Funding

This research received no external funding.

Institutional Review Board Statement

Not applicable.

Informed Consent Statement

Not applicable.

Data Availability Statement

Data that support the findings of this study are available from the corresponding author upon reasonable request.

Acknowledgments

The authors would like to express their gratitude to the Postgraduate Program of the University of Thessaly, entitled: Environmental Changes Management and Circular Economy. Part of the results come from the post-graduate dissertation of student Sotiria G. Papadimou.

Conflicts of Interest

The authors declare no conflict of interest.

References

  1. Pan, L.; Wang, Y.; Ma, J.; Hu, Y.; Su, B.; Fang, G.; Wang, L.; Xiang, B. A review of heavy metal pollution levels and health risk assessment of urban soils in Chinese cities. Environ. Sci. Pollut. Res. 2018, 25, 1055–1069. [Google Scholar] [CrossRef] [PubMed]
  2. Adimalla, N.; Chen, J.; Qian, H. Spatial characteristics of heavy metal contamination and potential human health risk assessment of urban soils: A case study from an urban region of South India. Ecotoxicol. Environ. Saf. 2020, 194. [Google Scholar] [CrossRef] [PubMed]
  3. Mehmood, K.; Ahmad, H.R.; Abbas, R.; Saifullah, R.; Murtaza, G. Heavy metals in urban and peri-urban soils of a heavily-populated and industrialized city: Assessment of ecological risks and human health repercussions. Hum. Ecol. Risk Assess. 2020, 26, 1705–1722. [Google Scholar] [CrossRef]
  4. Ok, Y.S.; Lee, S.S.; Jeon, W.T.; Oh, S.E.; Usman, A.R.A.; Moon, D.H. Application of eggshell waste for the immobilization of cadmium and lead in a contaminated soil. Environ. Geochem. Health 2011, 33, 31–39. [Google Scholar] [CrossRef]
  5. Kelepertzis, E.; Argyraki, A. Geochemical associations for evaluating the availability of potentially harmful elements in urban soils: Lessons learnt from Athens, Greece. Appl. Geochem. 2015, 59, 63–73. [Google Scholar] [CrossRef]
  6. Papadopoulou-Vrynioti, K.; Alexakis, D.; Bathrellos, G.D.; Skilodimou, H.D.; Vryniotis, D.; Vassiliades, E.; Gamvroula, D. Distribution of trace elements in stream sediments of Arta plain (western Hellas): The influence of geomorphological parameters. J. Geochem. Explor. 2013, 134, 17–26. [Google Scholar] [CrossRef]
  7. Hanfi, M.Y.; Mostafa, M.Y.A.; Zhukovsky, M. V Heavy metal contamination in urban surface sediments: Sources, distribution, contamination control, and remediation. Environ. Monit. Assess. 2020, 192, 1–21. [Google Scholar] [CrossRef]
  8. Adimalla, N. Heavy metals pollution assessment and its associated human health risk evaluation of urban soils from Indian cities: A review. Environ. Geochem. Health 2020, 42, 173–190. [Google Scholar] [CrossRef] [PubMed]
  9. Bathrellos, G.D.; Skilodimou, H.D.; Kelepertsis, A.; Alexakis, D.; Chrisanthaki, I.; Archonti, D. Environmental research of groundwater in the urban and suburban areas of Attica region, Greece. Environ. Geol. 2008, 56, 11–18. [Google Scholar] [CrossRef]
  10. Gamvroula, D.; Alexakis, D.; Stamatis, G. Diagnosis of groundwater quality and assessment of contamination sources in the Megara basin (Attica, Greece). Arab. J. Geosci. 2013, 6, 2367–2381. [Google Scholar] [CrossRef]
  11. Papadopoulou-Vrynioti, K.; Alexakis, D.; Bathrellos, G.D.; Skilodimou, H.D.; Vryniotis, D.; Vassiliades, E. Environmental research and evaluation of agricultural soil of the Arta plain, western Hellas. J. Geochemical Explor. 2014, 136, 84–92. [Google Scholar] [CrossRef]
  12. Alexakis, D.; Gotsis, D.; Giakoumakis, S. Evaluation of soil salinization in a Mediterranean site (Agoulinitsa district—West Greece). Arab. J. Geosci. 2015, 8, 1373–1383. [Google Scholar] [CrossRef]
  13. Han, Q.; Wang, M.; Cao, J.; Gui, C.; Liu, Y.; He, X.; He, Y.; Liu, Y. Health risk assessment and bioaccessibilities of heavy metals for children in soil and dust from urban parks and schools of Jiaozuo, China. Ecotoxicol. Environ. Saf. 2020, 191. [Google Scholar] [CrossRef] [PubMed]
  14. Wei, B.; Yang, L. A review of heavy metal contaminations in urban soils, urban road dusts and agricultural soils from China. Microchem. J. 2010, 94, 99–107. [Google Scholar] [CrossRef]
  15. Trujillo-González, J.M.; Torres-Mora, M.A.; Jiménez-Ballesta, R.; Zhang, J. Land-use-dependent spatial variation and exposure risk of heavy metals in road-deposited sediment in Villavicencio, Colombia. Environ. Geochem. Health 2019, 41, 667–679. [Google Scholar] [CrossRef]
  16. Gu, Y.G.; Gao, Y.P.; Lin, Q. Contamination, bioaccessibility and human health risk of heavy metals in exposed-lawn soils from 28 urban parks in southern China’s largest city, Guangzhou. Appl. Geochem. 2016, 67, 52–58. [Google Scholar] [CrossRef]
  17. Kowalska, J.B.; Mazurek, R.; Gąsiorek Michałand Zaleski, T. Pollution indices as useful tools for the comprehensive evaluation of the degree of soil contamination–A review. Environ. Geochem. Health 2018, 40, 2395–2420. [Google Scholar] [CrossRef] [Green Version]
  18. Massas, I.; Ehaliotis, C.; Kalivas, D.; Panagopoulou, G. Concentrations and availability indicators of soil heavy metals; The case of children’s playgrounds in the city of Athens (Greece). Water. Air. Soil Pollut. 2010, 212, 51–63. [Google Scholar] [CrossRef]
  19. Wijesiri, B.; Egodawatta, P.; McGree, J.; Goonetilleke, A. Process variability of pollutant build-up on urban road surfaces. Sci. Total Environ. 2015, 518–519, 434–440. [Google Scholar] [CrossRef] [Green Version]
  20. Seleznev, A.A.; Yarmoshenko, I.V.; Malinovsky, G.P. Assessment of total amount of surface sediment in urban environment using data on solid matter content in snow-dirt sludge. Environ. Process. 2019, 6, 581–595. [Google Scholar] [CrossRef]
  21. Alexakis, D.; Gamvroula, D.; Theofili, E. Environmental availability of potentially toxic elements in an agricultural Mediterranean site. Environ. Eng. Geosci. 2019, 25, 169–178. [Google Scholar] [CrossRef]
  22. Mehmood, K.; Chang, S.; Yu, S.; Wang, L.; Li, P.; Li, Z.; Liu, W.; Rosenfeld, D.; Seinfeld, J.H. Spatial and temporal distributions of air pollutant emissions from open crop straw and biomass burnings in China from 2002 to 2016. Environ. Chem. Lett. 2018, 16, 301–309. [Google Scholar] [CrossRef]
  23. Tong, S.; Li, H.; Li, W.; Tudi, M.; Yang, L. Concentration, spatial distribution, contamination degree and human health risk assessment of heavy metals in urban soils across china between 2003 and 2019—A systematic review. Int. J. Environ. Res. Public Health 2020, 17, 3099. [Google Scholar] [CrossRef]
  24. Guo, G.; Wu, F.; Xie, F.; Zhang, R. Spatial distribution and pollution assessment of heavy metals in urban soils from southwest China. J. Environ. Sci. 2012, 24, 410–418. [Google Scholar] [CrossRef]
  25. Zhang, X.; Wei, S.; Sun, Q.; Wadood, S.A.; Guo, B. Source identification and spatial distribution of arsenic and heavy metals in agricultural soil around Hunan industrial estate by positive matrix factorization model, principle components analysis and geo statistical analysis. Ecotoxicol. Environ. Saf. 2018, 159, 354–362. [Google Scholar] [CrossRef] [PubMed]
  26. Saha, N.; Rahman, M.S.; Jolly, Y.N.; Rahman, A.; Sattar, M.A.; Hai, M.A. Spatial distribution and contamination assessment of six heavy metals in soils and their transfer into mature tobacco plants in Kushtia District, Bangladesh. Environ. Sci. Pollut. Res. 2016, 23, 3414–3426. [Google Scholar] [CrossRef]
  27. Khoder, M.; Al Ghamdi, M.; Shiboob, M. Heavy Metal Distribution in Street Dust of Urban and Industrial Areas in Jeddah, Saudi Arabia. J. King Abdulaziz Univ. Environ. Arid L. Agric. Sci. 2012, 23, 55–75. [Google Scholar] [CrossRef]
  28. Logiewa, A.; Miazgowicz, A.; Krennhuber, K.; Lanzerstorfer, C. Variation in the concentration of metals in road dust size fractions between 2 µm and 2 mm: Results from three metallurgical centres in Poland. Arch. Environ. Contam. Toxicol. 2020, 78, 46–59. [Google Scholar] [CrossRef] [PubMed] [Green Version]
  29. Botsou, F.; Moutafis, I.; Dalaina, S.; Kelepertzis, E. Settled bus dust as a proxy of traffic-related emissions and health implications of exposures to potentially harmful elements. Atmos. Pollut. Res. 2020, 11, 1776–1784. [Google Scholar] [CrossRef]
  30. Kelepertzis, E.; Argyraki, A.; Chrastný, V.; Botsou, F.; Skordas, K.; Komárek, M.; Fouskas, A. Metal(loid) and isotopic tracing of Pb in soils, road and house dusts from the industrial area of Volos (central Greece). Sci. Total Environ. 2020, 725. [Google Scholar] [CrossRef]
  31. Christoforidis, A.; Stamatis, N. Heavy metal contamination in street dust and roadside soil along the major national road in Kavala’s region, Greece. Geoderma 2009, 151, 257–263. [Google Scholar] [CrossRef]
  32. McLaughlin, M.J.; Zarcinas, B.A.; Stevens, D.P.; Cook, N. Soil testing for heavy metals. Commun. Soil Sci. Plant Anal. 2000, 31, 1661–1700. [Google Scholar] [CrossRef]
  33. Page, A.L. Methods of soil analysis-Part 2: Chemical and microbiological properties. In American Sociaty of Agronomy, 2nd ed.; Phosphurus Inc.: Madison, WI, USA, 1982; Volume 9, pp. 421–422. [Google Scholar]
  34. ISO. Environment Soil Quality; ISO/DIS 11466; ISO Standards Compendium: Switzerland, Geneva, 1994. [Google Scholar]
  35. Golia, E.E.; Tsiropoulos, N.G.; Dimirkou, A.; Mitsios, I. Distribution of heavy metals of agricultural soils of central Greece using the modified BCR sequential extraction method. Int. J. Environ. Anal. Chem. 2007, 87, 1053–1063. [Google Scholar] [CrossRef]
  36. Council of the European Communities. The protection of the environment, and in particular of the soil, when sewage sludge is used in agriculture; Council Directive of 12 June 1986. Off. J. Eur. Commun. 1986, 181, 6. [Google Scholar]
  37. Meharg, A.A. Trace Elements in Soils and Plants, 4th ed.; Kabata-Pendias, A., Ed.; CRC Press/Taylor & Francis Group: Boca Raton, FL, USA, 2010; ISBN 9781420093704. [Google Scholar]
  38. Antoniadis, V.; Golia, E.E.; Shaheen, S.M.; Rinklebe, J. Bioavailability and health risk assessment of potentially toxic elements in Thriasio Plain, near Athens, Greece. Environ. Geochem. Health 2017, 39, 319–330. [Google Scholar] [CrossRef]
  39. Mueller, G. Schwermetalle in Den Sedimenten Des Rheins—Veranderungen Seit 1971. Umsch. Wissensch. Techn. 1979, 79, 778–783. [Google Scholar]
  40. Kasa, E.; Felix-Henningsen, P.; Duering, R.A.; Gjoka, F. The occurrence of heavy metals in irrigated and non-irrigated arable soils, NW Albania. Environ. Monit. Assess. 2014, 186, 3595–3603. [Google Scholar] [CrossRef]
  41. Ding, Q.; Shi, X.; Zhuang, D.; Wang, Y. Temporal and spatial distributions of ecological vulnerability under the influence of natural and anthropogenic factors in an eco-province under construction in China. Sustainability 2018, 10, 87. [Google Scholar] [CrossRef] [Green Version]
  42. Johnson, R.A.; Wichern, D.W. Applied Multivariate Statistical Analysis, 6th ed.; Prentice-Hall: Hoboken, NJ, USA, 2007. [Google Scholar]
  43. SAGA User Group Association. SAGA 7.9.0—System for Automated Geoscientific Analyses. Available online: http://www.saga-gis.org (accessed on 29 December 2020).
  44. QGIS Development Team. QGIS Geographic Information System. Available online: http://qgis.osgeo.org (accessed on 10 December 2020).
  45. Shirani, M.; Afzali, K.N.; Jahan, S.; Strezov, V.; Soleimani-Sardo, M. Pollution and contamination assessment of heavy metals in the sediments of Jazmurian playa in southeast Iran. Sci. Rep. 2020, 10. [Google Scholar] [CrossRef] [PubMed]
  46. Antoniadis, V.; Golia, E.E. Sorption of Cu and Zn in low organic matter-soils as influenced by soil properties and by the degree of soil weathering. Chemosphere 2015, 138, 364–369. [Google Scholar] [CrossRef] [PubMed]
  47. Wu, Y.; Lu, X.; Zhuang, S.; Han, X.; Zhou, Y. Contamination characteristics and assessment of manganese, Zinc, Chrome, Lead, Copper and Nickel in Bus Station Dusts of Xifeng, Northwest China. Preprints 2016, 1–13. [Google Scholar] [CrossRef] [Green Version]
  48. Antoniadis, V.; Golia, E.E.; Liu, Y.T.; Wang, S.L.; Shaheen, S.M.; Rinklebe, J. Soil and maize contamination by trace elements and associated health risk assessment in the industrial area of Volos, Greece. Environ. Int. 2019, 124, 79–88. [Google Scholar] [CrossRef]
  49. Ivankovic, N.; Kasanin-Grubin, M.; Brceski, I.; Vukelic, N. Possible sources of heavy metals in urban soils: Example from Belgrade, Serbia. J. Environ. Prot. Ecol. 2010, 11, 455–464. [Google Scholar]
  50. Briggs, D.J. The use of GIS to evaluate traffic-related pollution. Occup. Environ. Med. 2007, 64, 1–2. [Google Scholar] [CrossRef] [PubMed] [Green Version]
  51. Isaaks, E.H.; Srivastava, R.M. An Introduction to Applied Geostatistics; Oxford University Press: New York, NY, USA, 1989. [Google Scholar]
  52. Mihailović, A.; Budinski-Petković, L.; Popov, S.; Ninkov, J.; Vasin, J.; Ralević, N.M.; Vasić, M.V. Spatial distribution of metals in urban soil of Novi Sad, Serbia: GIS based approach. J. Geochemical Explor. 2015, 150, 104–114. [Google Scholar] [CrossRef]
  53. Kerry, R.; Oliver, M.A. Determining nugget:sill ratios of standardized variograms from aerial photographs to krige sparse soil data. Precis. Agric. 2008, 9, 33–56. [Google Scholar] [CrossRef]
  54. Zhang, Y.; Lu, H.; Qu, W. Geographical detection of traffic accidents spatial stratified heterogeneity and influence factors. Int. J. Environ. Res. Public Health 2020, 17, 572. [Google Scholar] [CrossRef] [PubMed] [Green Version]
  55. Wu, Y.; Lu, X. Physicochemical properties and toxic elements in bus stop dusts from Qingyang, NW China. Sci. Rep. 2018, 8. [Google Scholar] [CrossRef] [PubMed] [Green Version]
  56. Jahan, S.; Strezov, V. Assessment of trace elements pollution in the sea ports of New South Wales (NSW), Australia using oysters as bioindicators. Sci. Rep. 2019, 9. [Google Scholar] [CrossRef]
  57. Rizo, O.D.; Hernández, I.C.; López, J.A.; Arado, O.D.; Pino, N.L.; Rodríguez, K.D. Chromium, cobalt and nickel contents in urban soils of Moa, northeastern Cuba. Bull. Environ. Contam. Toxicol. 2011, 86, 189–193. [Google Scholar] [CrossRef]
  58. Maeaba, W.; Prasad, S.; Chandra, S. First assessment of metals contamination in road dust and roadside soil of Suva City, Fiji. Arch. Environ. Contam. Toxicol. 2019, 77, 249–262. [Google Scholar] [CrossRef] [PubMed] [Green Version]
  59. Różański, S.; Jaworska, H.; Matuszczak, K.; Nowak, J.; Hardy, A. Impact of highway traffic and the acoustic screen on the content and spatial distribution of heavy metals in soils. Environ. Sci. Pollut. Res. 2017, 24, 12778–12786. [Google Scholar] [CrossRef] [PubMed] [Green Version]
  60. Szwalec, A.; Mundała, P.; Kędzior, R.; Pawlik, J. Monitoring and assessment of cadmium, lead, zinc and copper concentrations in arable roadside soils in terms of different traffic conditions. Environ. Monit. Assess. 2020, 192. [Google Scholar] [CrossRef] [PubMed] [Green Version]
  61. Navarro, M.; D’Agostino, A.; Neri, L. The effect of urbanization on subjective well-being: Explaining cross-regional differences. Socioecon. Plann. Sci. 2020, 71. [Google Scholar] [CrossRef]
  62. Vaiškūnaitė, R.; Jasiūnienė, V. The analysis of heavy metal pollutants emitted by railway transport. Transport 2020, 35, 213–223. [Google Scholar] [CrossRef]
Figure 1. The city of Volos in Thessaly, Central Greece and the study area.
Sustainability 13 02029 g001
Figure 2. Thematic maps of potentially toxic metals based on contamination factor (CF) values in Volos (mean values of the three years of the study).
Sustainability 13 02029 g002
Figure 3. Thematic maps of potentially toxic metals based on the geo-accumulation index (Igeo) values in Volos city (mean values of the three-year study).
Sustainability 13 02029 g003aSustainability 13 02029 g003b
Table 1. Physicochemical parameters of the soil samples (mean values of the three-year study, n = 186).
Descriptive StatisticspH
(1:1)
EC
(μS cm−1)

(%)
Clay
(%)
Sand
(%)
CaCO3
(%)
Minimum Value6.571123.000.302229.61
Maximum Value8.926957.464.40527820.54
Mean Value7.443235.602.44195714.57
Relative Standard Deviation0.4112.760.917.506.991.54
Kurtosis Coefficient1.415−0.495−0.676−0.006−0.071−0.680
Skewness Coefficient0.7100.747−0.1281.0096−0.9320.231
Table 2. Pseudo-total concentrations of potentially toxic elements (mean values of the three years of the study, n = 186).
.CuZnPbNiCdCoCrMn
.mg kg−1
Minimum Value28.9088.425.4324.980.574.6226.07254.33
10th-perc a33.91106.1713.0532.960.7110.8147.72308.64
50th-perc b51.48126.4041.3163.410.9622.38110.86714.13
Average53.91131.0235.9467.280.9422.5693.24663.71
90th-perc c80.26166.0755.12114.861.1435.40122.33942.59
Maximum Value89.27218.1158.14117.891.2538.14123.25951.18
EU Limits d140300300753-200-
BG (mg kg−1) e24.5764.3529.6922.920.499.6223.84540.13
a 10th percentile, b 50th percentile, c 90th percentile; d For Cr: maximum allowable concentrations ([37], p. 24). For Cd, Cu, Ni, Pb, and Zn: 86/278/EEC Directive [36]; e Average of all reported background reference values in Kabata–Pendias [37].
Table 3. Descriptive statistics for the contamination factor (CF) of the potentially toxic elements and geostatistical parameters, for the creation and validation of the contour maps.
CFCuZnPbNiCdCoCrMn
Descriptive statistics
Mean Value1.381.851.302.322.273.992.211.34
Standard Deviation0.460.400.620.990.431.721.210.50
Minimum Value0.741.150.090.861.200.150.190.48
Maximum Value2.303.122.154.073.066.753.911.95
Skewness Coefficient0.4011.018−0.3810.368−0.405−0.2340.120−0.360
Kurtosis Coefficient−1.0161.249−1.177−0.935−0.650−0.796−1.583−1.373
Geostatistical parameters
ModelCubicExp.Exp.Exp.Spher.Spher.Spher.Spher.
Nugget0.0170.0040.1090.1430.0640.0160.0270.026
Range9859859731209981984996985
Sill0.2310.1760.4261.1910.1980.8330.4880.207
Slope--------
Nugget sill ratio0.080.020.260.120.320.020.050.13
R20.530.680.400.470.600.640.460.30
Table 4. Descriptive statistics for the Igeo of the potentially toxic elements and geostatistical parameters, for the creation and validation of the contour maps.
IgeoCuZnPbNiCdCoCrMn
Descriptive statistics
Mean Value−0.200.27−0.470.490.571.206.18−0.28
Standard Deviation0.480.291.020.660.290.960.980.64
Minimum Value−1.01−0.38−4.14−0.80−0.33−3.312.91−1.65
Maximum Value0.611.050.521.441.032.177.280.38
Skewness Coefficient0.0070.400−1.379−0.285−0.819−2.218−0.777−0.712
Kurtosis Coefficient−1.2620.2251.644−0.8930.2537.2100.416−0.942
Geostatistical parameters
ModelExp.Exp.CubicCubicExp.Spher.CubicExp.
Nugget0.0550.0040.0310.0060.0010.0310.0060.082
Range985984979971983995846983
Sill0.2720.0931.1400.4900.0950.6550.3860.443
Slope--------
Nugget sill ratio0.200.040.030.010.010.050.010.19
R20.490.660.500.520.600.650.460.34
Publisher’s Note: MDPI stays neutral with regard to jurisdictional claims in published maps and institutional affiliations.

