
Cardiac Autonomic Effects of Yearly Athletic Retreats on Elite Basket Players: Usefulness of a Unitary Autonomic Nervous System Indicator


 , and
, and
Abstract
:1. Introduction
2. Materials and Methods
2.1. Study Population and Protocol
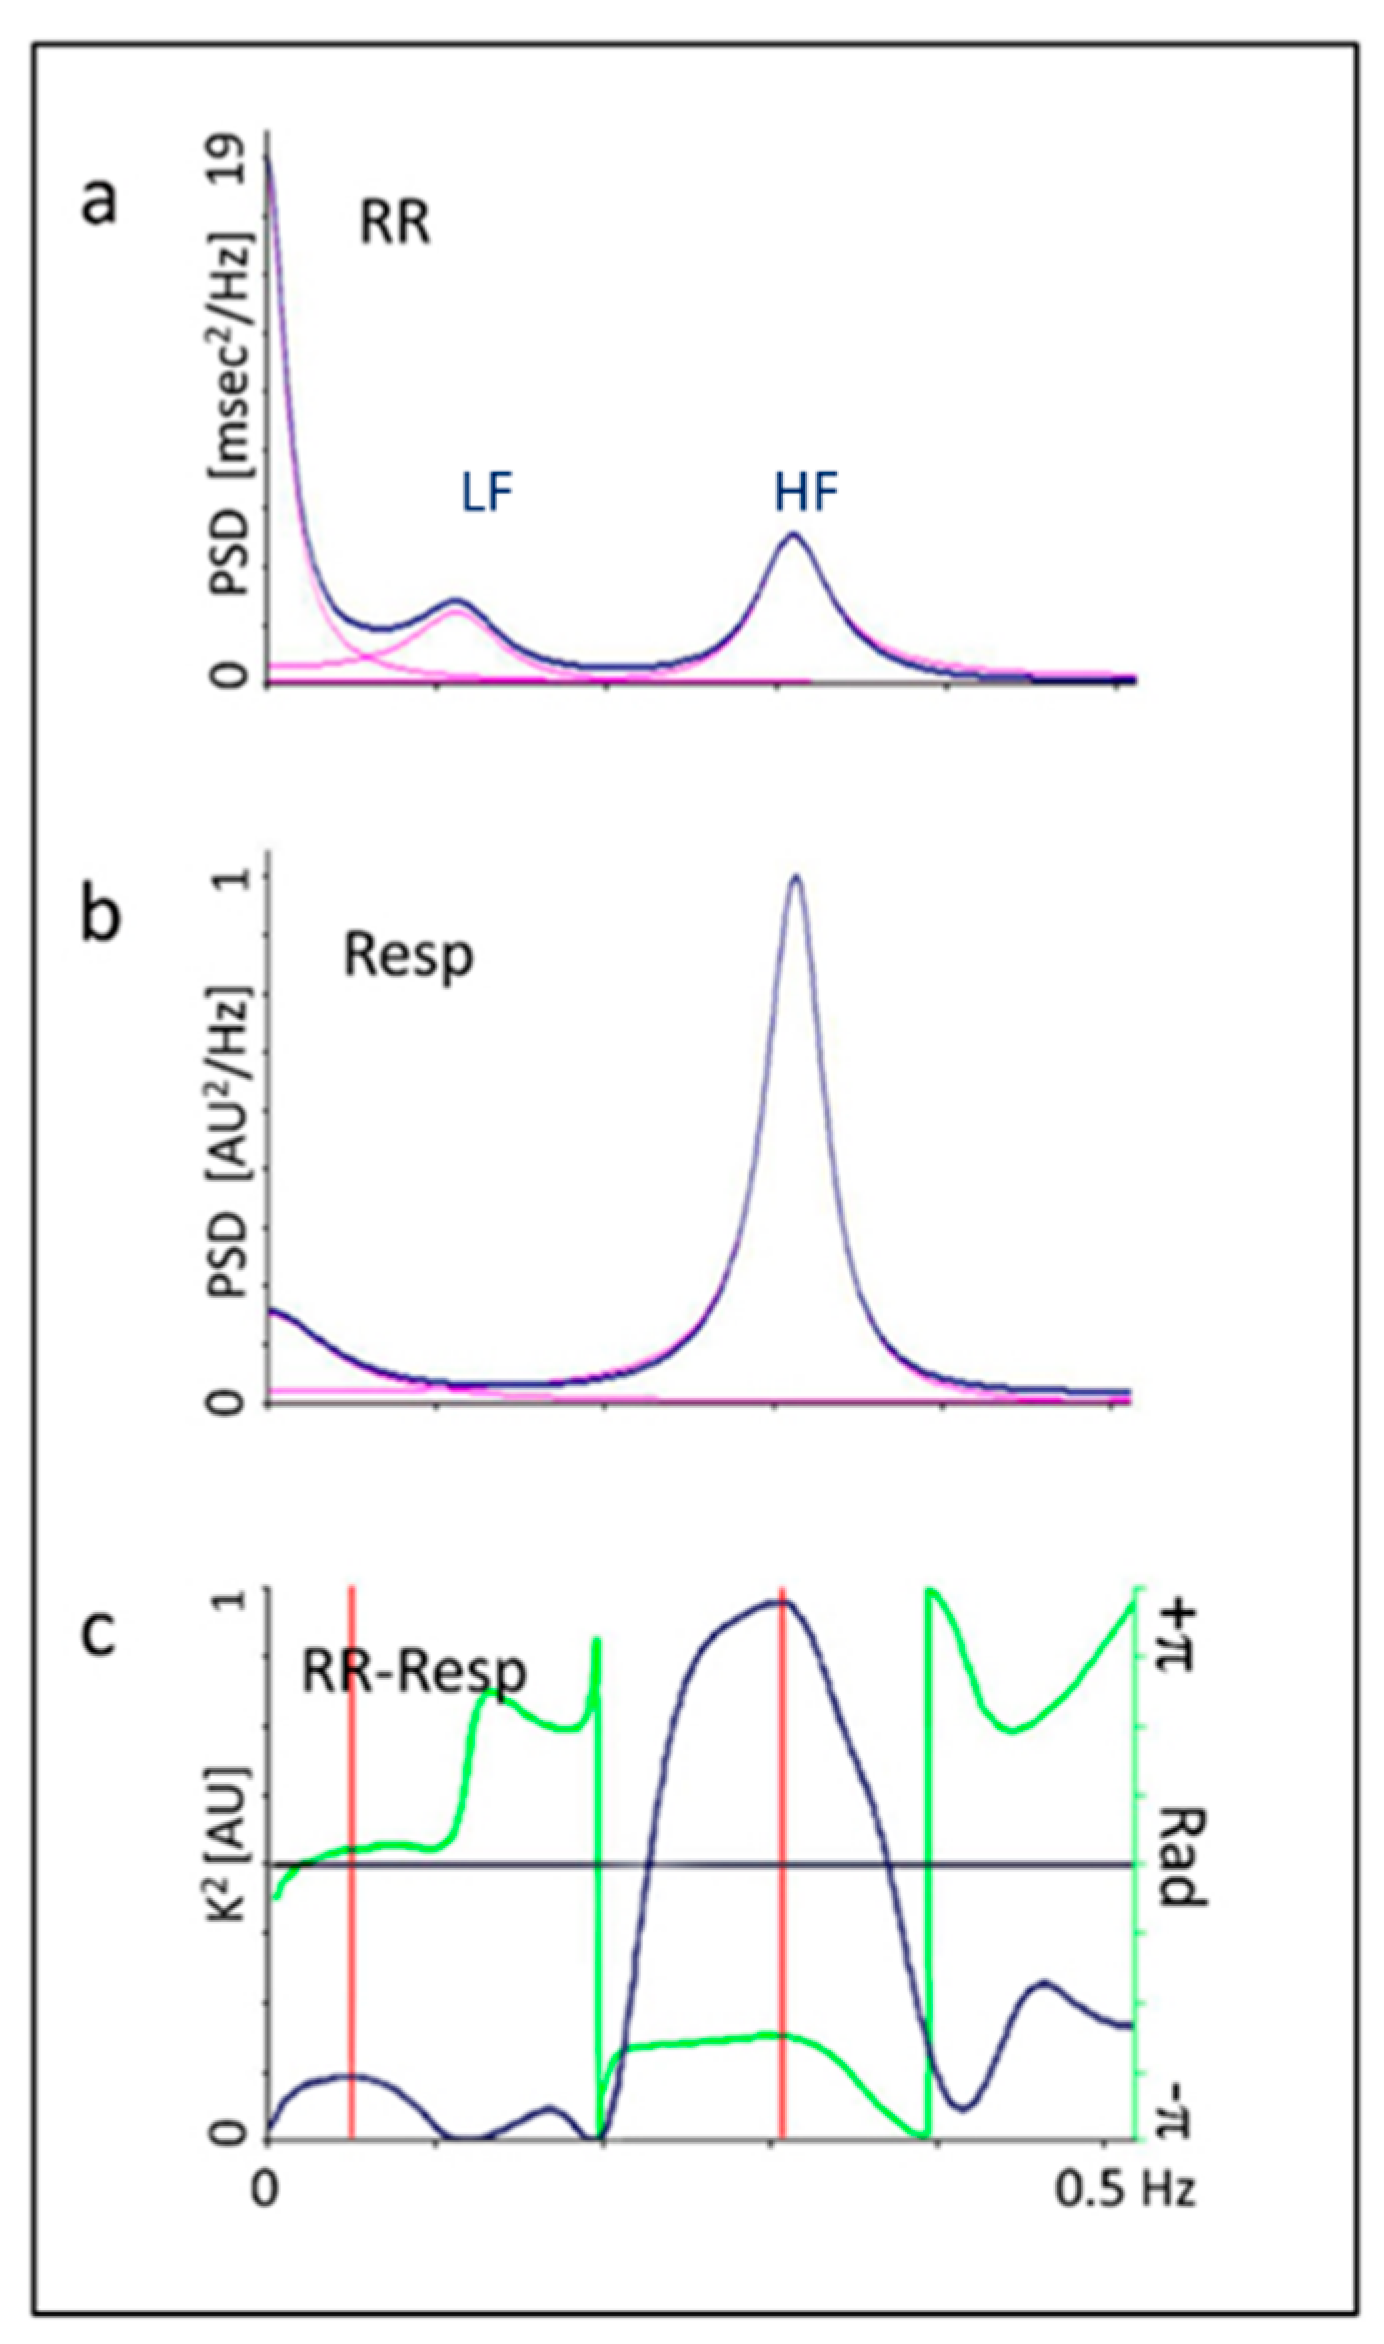
2.2. Autonomic Evaluation
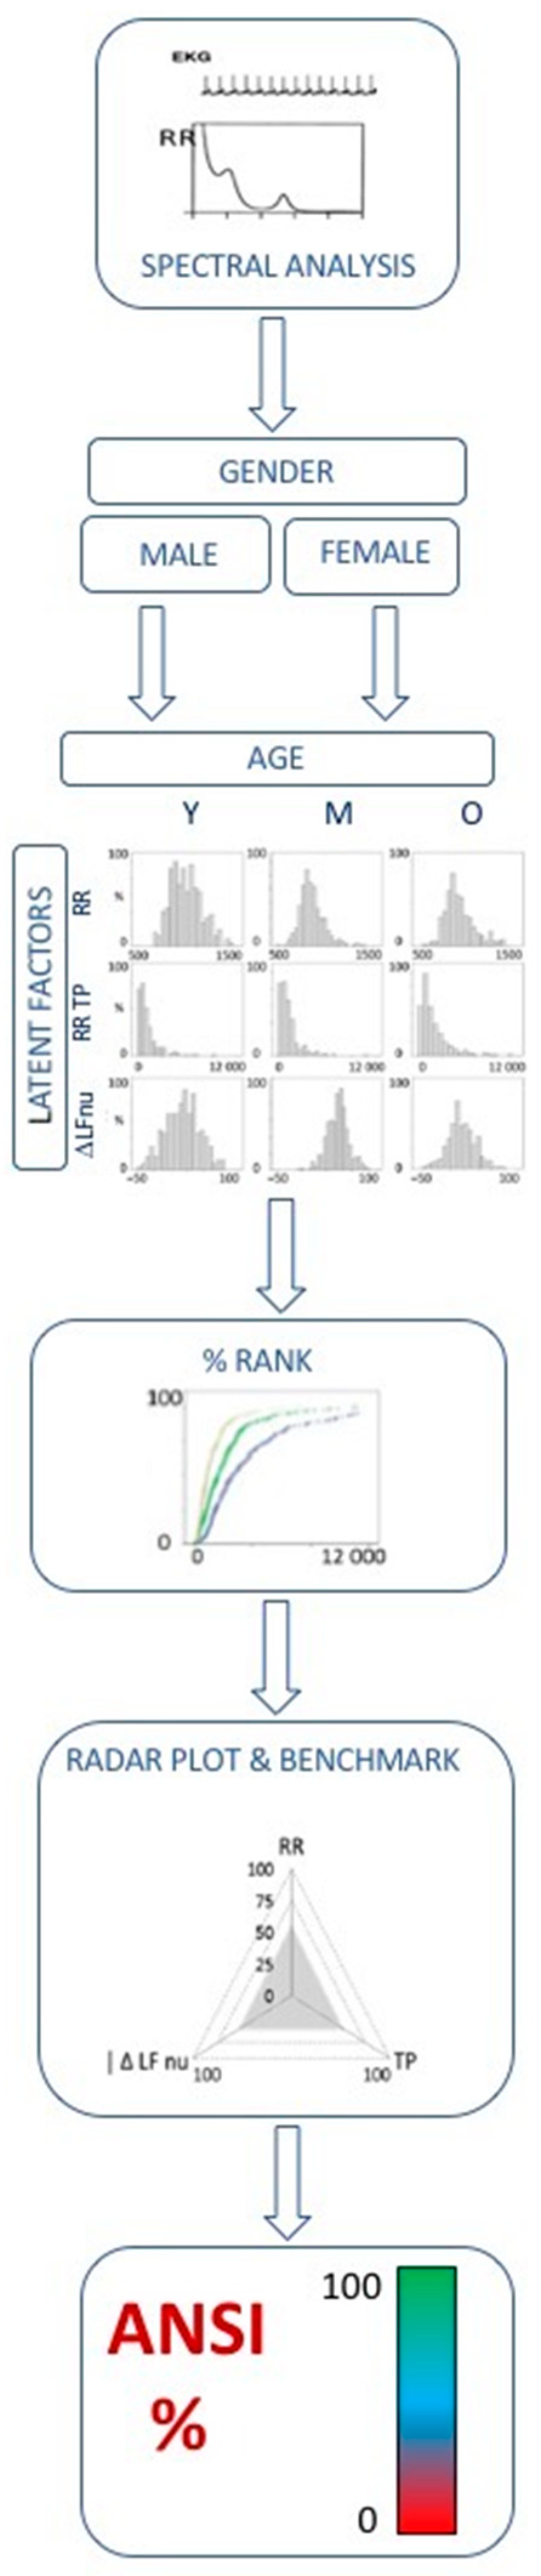
2.3. ANSI, a Proxy of Cardiac Autonomic Regulation (CAR)
2.4. Psychological Evaluation
2.5. Statistics
3. Results
4. Discussion
4.1. Main Findings
4.2. Interpretation of Autonomic Indices
5. Conclusions
Author Contributions
Funding
Institutional Review Board Statement
Informed Consent Statement
Data Availability Statement
Conflicts of Interest
Abbreviations
| Abbreviation | Meaning |
| 4SQ | Subjective Stress related Somatic Symptoms |
| a | Amplitude (usually applied to LF or HF spectral components) |
| ANSI | Autonomic Nervous System Index |
| CAR | Cardiac Autonomic Regulation |
| GPD | Gross domestic product |
| HF | High Frequency (range from 0.15–0.40 Hz) |
| HR | Heart Rate |
| HRV | Heart Rate Variability |
| Hz | Hertz |
| K2 | Square coherence |
| LF | Low Frequency (range from 0.03–0.14 Hz) |
| min | minute |
| msec | millisecond |
| nu | Normalized units |
| p | significance |
| P_0v | Three beat pattern: 0 variation |
| P_1v | Three beat pattern: 1 variation |
| P_2lv | Three beat pattern: 2 like variations |
| P_2uv | Three beat pattern: 2 unlike variations |
| PSD | Power Spectral Density |
| rad | Radian (measure of angle; one complete revolution is 2 radians = 360 degrees) |
| RESP | respiration |
| RR | Interval between successive peaks of R waves of the ECG |
| RR VAR | Variance of the continuous RR series |
| RRRo | Regularity index |
| RRV | RR interval variability |
| SD | Standard Deviation |
| SEM | Standard Error of the Mean |
| TP | Total spectral power (corresponding to variance) |
| VAF | Variance Accounted For |
| VLF | Very Low Frequency |
| vs | Versus (as compared to) |
References
- Pagani, M.; Lucini, D. Can autonomic monitoring predict results in distance runners? Am. J. Physiol. Heart Circ. Physiol. 2009, 296, 1721–1722. [Google Scholar] [CrossRef]
- Stone, N.M.; Kilding, A.E. Aerobic conditioning for team sport athletes. Sports Med. 2009, 39, 615–642. [Google Scholar] [CrossRef] [PubMed]
- Thomas, D.T.; Erdman, K.A.; Burke, L.M. American College of Sports Medicine joint position statement. Nutrition and athletic performance. Med. Sci. Sports Exerc. 2016, 48, 543–568. [Google Scholar] [CrossRef]
- Rumbold, J.L.; Fletcher, D.; Daniels, K. A Systematic Review of Stress Management Interventions with Sport Performers. Sport Exerc. Perform. Psychol. 2012, 1, 173–193. [Google Scholar] [CrossRef] [Green Version]
- Hawkins, J.R.; Sharp, E.B.; Williams, S.M. Take a page from your coach’s play book: Teaching technical and tactical skills in athletic training. Athl. Train Educ. J. 2015, 102, 44–248. [Google Scholar] [CrossRef]
- Johnson, S.; Wojnar, P.; Price, W.; Foley, T.; Moon, J.; Esposito, E.; Cromartie, F. A coach’s responsibility: Learning how to prepare athletes for peak performance. Sport J. 2011, 14, 1–13. [Google Scholar]
- Bangsbo, J. Performance in sports—With specific emphasis on the effect of intensified training. Scand. J. Med. Sci. Sports 2015, 25 (Suppl. 4), 88–99. [Google Scholar] [CrossRef]
- Mitchell, J.H.; Haskell, W.; Snell, P.; Van Camp, S.P. Task force 8: Classification of sports. J. Am. Coll. Cardiol. 2005, 45, 1364–1367. [Google Scholar] [CrossRef] [PubMed] [Green Version]
- Lucini, D.; Fallanca, A.; Malacarne, M.; Casasco, M.; Galiuto, L.; Pigozzi, F.; Galanti, G.; Pagani, M. Streamlining analysis of RR interval variability in elite soccer players: Preliminary experience with a composite indicator of cardiac autonomic regulation. Int. J. Environ. Res. Public Health 2020, 17, 1844. [Google Scholar] [CrossRef] [Green Version]
- Saw, A.E.; Main, L.C.; Gastin, P.B. Monitoring the athlete training response: Subjective self-reported measures trump commonly used objective measures: A systematic review. Br. J. Sports Med. 2016, 50, 281–291. [Google Scholar] [CrossRef] [PubMed]
- Plews, D.J.; Laursen, P.B.; Stanley, J.; Kilding, A.E.; Buchheit, M. Training adaptation and heart rate variability in elite endurance athletes: Opening the door to effective monitoring. Sports Med. 2013, 43, 773–781. [Google Scholar] [CrossRef]
- Buchheit, M. Monitoring training status with HR measures: Do all roads lead to Rome? Front. Physiol. 2014, 5, 73. [Google Scholar] [CrossRef] [Green Version]
- Task Force of the European Society of Cardiology and the North American Society of Pacing and Electrophysiology. Heart rate variability: Standards of measurement, physiological interpretation and clinical use. Circulation 1996, 93, 1043–1065. [Google Scholar] [CrossRef] [Green Version]
- Malliani, A.; Pagani, M.; Lombardi, F.; Cerutti, S. Cardiovascular neural regulation explored in the frequency domain. Circulation 1991, 84, 482–492. [Google Scholar] [CrossRef] [PubMed] [Green Version]
- Kiviniemi, A.M.; Hautala, A.J.; Kinnunen, H.; Tulppo, M.P. Endurance training guided individually by daily heart rate variability measurements. Eur. J. Appl. Physiol. 2007, 101, 743–751. [Google Scholar] [CrossRef]
- Manzi, V.; Castagna, C.; Padua, E.; Lombardo, M.; D’Ottavio, S.; Massaro, M.; Volterrani, M.; Iellamo, F. Dose-response relationship of autonomic nervous system responses to individualized training impulse in marathon runners. Am. J. Physiol. Heart Circ. Physiol. 2009, 296, 1733–1740. [Google Scholar] [CrossRef] [PubMed] [Green Version]
- Sala, R.; Malacarne, M.; Pagani, M.; Lucini, D. Association between aerobic fitness and indices of autonomic regulation: Cardiovascular risk implications. J. Sport Med. Phys. Fit. 2016, 56, 794–801. [Google Scholar]
- Schmitt, L.; Regnard, J.; Millet, G.P. Monitoring fatigue status with HRV measures in elite athletes: An avenue beyond RMSSD? Front. Physiol. 2015, 6, 343. [Google Scholar] [CrossRef] [PubMed] [Green Version]
- Pagani, M.; Lombardi, F.; Guzzetti, S.; Rimoldi, O.; Furlan, R.; Pizzinelli, P.; Sandrone, G.; Malfatto, G.; Dell’Orto, S.; Piccaluga, E.; et al. Power spectral analysis of heart rate and arterial pressure variabilities as a marker of sympatho-vagal interaction in man and conscious dog. Circ. Res. 1986, 59, 178–193. [Google Scholar] [CrossRef] [Green Version]
- Pagani, M.; Montano, N.; Porta, A.; Malliani, A.; Abboud, F.M.; Birkett, C.; Somers, V.K. Relationship between spectral components of cardiovascular variabilities and direct measures of muscle sympathetic nerve activity in humans. Circulation 1997, 18, 1441–1448. [Google Scholar] [CrossRef]
- Massimini, M.; Porta, A.; Mariotti, M.; Malliani, A.; Montano, N. Heart rate variability is encoded in the spontaneous discharge of thalamic somatosensory neurones in cat. J. Physiol. 2000, 526, 387–396. [Google Scholar] [CrossRef] [PubMed]
- Cohen, R.A. Yerkes-Dodson Law. In Encyclopedia of Clinical Neuropsychology; Springer: New York, NY, USA, 2011; pp. 2737–2738. [Google Scholar]
- Aston-Jones, G.; Cohen, J.D. An integrative theory of locus coeruleus-norepinephrine function: Adaptive gain and optimal performance. Annu. Rev. Neurosci. 2005, 28, 403–450. [Google Scholar] [CrossRef] [Green Version]
- Pagani, M.; Malliani, A. Interpreting oscillations of muscle sympathetic nerve activity and heart rate variability. J. Hypertens. 2000, 18, 1709–1719. [Google Scholar] [CrossRef] [PubMed]
- Iellamo, F.; Legramante, J.M.; Pigozzi, F.; Spataro, A.; Norbiato, G.; Lucini, D.; Pagani, M. Conversion from vagal to sympathetic predominance with strenuous training in high-performance world class athletes. Circulation 2002, 105, 2719–2724. [Google Scholar] [CrossRef] [Green Version]
- Sandercock, G.R.H.; Brodie, D.A. The use of heart rate variability measures to assess autonomic control during exercise. Scand. J. Med. Sci. Sports 2006, 16, 302–313. [Google Scholar] [CrossRef]
- Sala, R.; Malacarne, M.; Tosi, F.; Benzi, M.; Solaro, N.; Tamorri, S.; Spataro, A.; Pagani, M.; Lucini, D. May a unitary autonomic index help assess autonomic cardiac regulation in elite athletes? Preliminary observations on the national Italian Olympic committee team. J. Sport Med. Phys. Fit. 2017, 57, 1702–1710. [Google Scholar] [CrossRef]
- Sala, R.; Malacarne, M.; Solaro, N.; Pagani, M.; Lucini, D. A composite autonomic index as unitary metric for heart rate variability: A proof of concept. Eur. J. Clin. Investig. 2017, 47, 241–249. [Google Scholar] [CrossRef]
- Pagani, M.; Sala, R.; Malacarne, M.; Lucini, D. Benchmarking heart rate variability to overcome sex-related bias. Adv. Exp. Med. Biol. 2018, 1065, 191–205. [Google Scholar] [CrossRef] [PubMed]
- Lucini, D.; Sala, R.; Spataro, A.; Malacarne, M.; Benzi, M.; Tamorri, S.; Pagani, M. Can the use of a single integrated unitary autonomic index provide early clues for eventual eligibility for Olympic games? Eur. J. Appl. Physiol. 2018, 118, 919–926. [Google Scholar] [CrossRef]
- Oggionni, G.; Spataro, A.; Pelliccia, A.; Malacarne, M.; Pagani, M.; Lucini, D. Left ventricular hypertrophy in world class elite athletes is associated with signs of improved cardiac autonomic regulation. Eur. J. Prev. Cardiol. 2019. [Google Scholar] [CrossRef]
- Lucini, D.; Malacarne, M.; Gatzemeier, W.; Pagani, M. A simple home-based lifestyle intervention program to improve cardiac autonomic regulation in patients with increased cardiometabolic risk. Sustainability 2020, 12, 7671. [Google Scholar] [CrossRef]
- Lucini, D.; Malacarne, M.; Oggionni, G.; Gatzmeier, W.; Santoro, A.; Pagani, M. Endocrine adjuvant therapy might impair cardiac autonomic regulation in breast cancer survivors. J. Cardiovasc. Med. 2019, 3, 34–49. [Google Scholar] [CrossRef] [Green Version]
- Porta, A.; Guzzetti, S.; Montano, N.; Furlan, R.; Pagani, M.; Malliani, A.; Cerutti, S. Entropy, entropy rate, and pattern classification as tools to typify complexity in short heart period variability series. IEEE Trans. Biomed. Eng. 2001, 48, 1282–1291. [Google Scholar] [CrossRef]
- Kerkhof, P.L.M.; Peace, R.A.; Handly, N. Ratiology and a complementary class of metrics for cardiovascular investigations. Physiology 2019, 34, 250–263. [Google Scholar] [CrossRef] [PubMed]
- Lucini, D.; Solaro, N.; Pagani, M. Autonomic differentiation map: A novel statistical tool for interpretation of Heart Rate Variability. Front. Physiol. 2018, 9, 1–13. [Google Scholar] [CrossRef] [PubMed] [Green Version]
- Solaro, N.; Malacarne, M.; Pagani, M.; Lucini, D. Cardiac baroreflex, HRV, and statistics: An interdisciplinary approach in hypertension. Front. Physiol. 2019, 10, 478. [Google Scholar] [CrossRef] [PubMed]
- Badilini, F.; Pagani, M.; Porta, A. HeartScope: A software tool addressing autonomic nervous system regulation. Comput. Cardiol. 2005, 32, 259–262. [Google Scholar] [CrossRef]
- Lucini, D.; Marchetti, I.; Spataro, A.; Malacarne, M.; Benzi, M.; Tamorri, S.; Sala, R.; Pagani, M. Heart rate variability to monitor performance in elite athletes: Criticalities and avoidable pitfalls. Int. J. Cardiol. 2017, 240, 307–312. [Google Scholar] [CrossRef]
- West, B.T. Analyzing longitudinal data with the linear mixed models procedure in SPSS. Eval. Healh Prof. 2009, 32, 207–228. [Google Scholar] [CrossRef]
- IBM. Linear Mixed-Effects Modeling in SPSS: An Introduction to the MIXED Procedure. Available online: https://www.spss.ch/upload/1126184451_Linear%20Mixed%20Effects%20Modeling%20in%20SPSS.pdf (accessed on 17 February 2021).
- Pawelczyk, J.A. Big concepts, small N. J. Physiol. 2006, 572, 607–608. [Google Scholar] [CrossRef] [Green Version]
- Ferretti, G.; Iellamo, F.; Pizzinelli, P.; Kenfack, M.A.; Lador, F.; Lucini, D.; Porta, A.; Narkiewicz, K.; Pagani, M. Prolonged head down bed rest-induced inactivity impairs tonic autonomic regulation while sparing oscillatory cardiovascular rhythms in healthy humans. J. Hypertens. 2009, 27, 551–561. [Google Scholar] [CrossRef] [Green Version]
- White, D.W.; Raven, P.B. Autonomic neural control of heart rate during dynamic exercise: Revisited. J. Physiol. 2014, 592, 2491–2500. [Google Scholar] [CrossRef]
- D’souza, A.; Bucchi, A.; Johnsen, A.B.; Logantha, S.J.R.J.; Monfredi, O.; Yanni, J.; Prehar, S.; Hart, G.; Cartwright, E.; Wisloff, U.; et al. Exercise training reduces resting heart rate via downregulation of the funny channel HCN4. Nat. Commun. 2014, 5, 3775. [Google Scholar] [CrossRef] [PubMed]
- Langley, J. The Autonomic Nervous System; Heffer & Sons: Cambridge, UK, 1921. [Google Scholar]
- Hess, W.R. The central control of the activity of internal organs. In Proceedings of the Nobel Lecture Physiology or Medicine, Stockholm, Sweden, 12 December 1949; Elsevier Publishing Company: Amsterdam, The Netherlands, 1964; pp. 1942–1962. Available online: https://www.nobelprize.org/prizes/medicine/1949/hess/lecture/ (accessed on 17 February 2021).
- Fukuda, K.; Kanazawa, H.; Aizawa, Y.; Ardell, J.L.; Shivkumar, K. Cardiac innervation and sudden cardiac death. Circ. Res. 2015, 116, 2005–2019. [Google Scholar] [CrossRef] [PubMed] [Green Version]
- Benarroch, E.E. The central autonomic network: Functional organization, dysfunction, and perspective. Mayo Clin. Proc. 1993, 68, 988–1001. [Google Scholar] [CrossRef]
- Iellamo, F.; Pigozzi, F.; Parisi, A.; Di Salvo, V.; Vago, T.; Norbiato, G.; Lucini, D.; Pagani, M. The stress of competition dissociates neural and cortisol homeostasis in elite athletes. J. Sport Med. Phys. Fit. 2003, 43, 539–545. [Google Scholar]
- Lucini, D.; Solaro, N.; Lesma, A.; Gillet, V.B.; Pagani, M. Health promotion in the workplace: Assessing stress and lifestyle with an intranet tool. J. Med. Internet Res. 2011, 13, e88. [Google Scholar] [CrossRef]
- Iellamo, F.; Pigozzi, F.; Spataro, A.; Di Salvo, V.; Fagnani, F.; Roselli, A.; Rizzo, M.; Malacarne, M.; Pagani, M.; Lucini, D. Autonomic and psychological adaptation in Olympic rowers. J. Sport. Med. Phys. Fit. 2006, 46, 598–604. [Google Scholar]
- Di Cagno, A.; Buonsenso, A.; Baralla, F.; Grazioli, E.; Di Martino, G.; Lecce, E.; Calcagno, G.; Fiorilli, G. Psychological impact of the quarantine-induced stress during the coronavirus (COVID-19) outbreak among italian athletes. Int. J. Environ. Res. Public Health 2020, 17, 8867. [Google Scholar] [CrossRef]


| Variables | Unit | Definition |
|---|---|---|
| HR | [beat/min] | Heart Rate |
| RR Mean | [msec] | Average of RR interval from tachogram sections |
| RR VAR | [msec2] | RR variance from tachogram sections |
| RR LFa | [msec 2] | Absolute power(a) of Low Frequency (LF) component of RR variability V |
| RR HFa | [msec 2] | Absolute power(a) of High Frequency (HF) component of RRV |
| RR LFnu | [nu] | Normalized power (nu) of Low Frequency (LF) component of RRV |
| RR HFnu | [nu] | Normalized power (nu) of High Frequency (HF) component of RRV |
| RR LF/HF | [.] | Ratio between absolute values of LF and HF |
| RR LFHz | [Hz] | Center frequency of the RRLF AR spectral component |
| LFHFHz | [Hz] | Center frequency of the RRHF AR spectral component |
| RR-RESP HFHz | [Hz] | Peak frequency of the RR-RESP coherence function |
| RR-RESP HFK2 | [.] | Peak frequency of the RR-RESP AR coherence function |
| ΔRRLFnu | [nu] | Difference of LF power in nu between stand and rest |
| ANSI | [%] | Composite unitary Autonomic Nervous System Index |
| RRRo | [.] | Regularity index |
| P_0v | [%] | Three beat pattern classification: 0 variations |
| P_1v | [%] | Three beat pattern classification: 1 variation |
| P_2lv | [%] | Three beat pattern classification: 2 like variations |
| P_2uv | [%] | Three beat pattern classification: 2 unlike variations |
| Epoch T1 | Epoch T2 | Epoch T3 | |||||||
|---|---|---|---|---|---|---|---|---|---|
| Variable | Unit | Mean | SD | Contrast | Mean | SD | Mean | SD | p |
| HR | beat/min | 58.40 | 9.22 | * + | 50.42 | 7.53 | 49.37 | 10.91 | <0.001 |
| RR Mean | msec | 1051.83 | 171.74 | * + | 1212.91 | 167.35 | 1269.69 | 278.80 | <0.001 |
| RR TP | msec2 | 5330.21 | 6244.92 | + | 8737.72 | 7583.93 | 8325.24 | 5508.85 | 0.025 |
| RR LFa | msec2 | 696.57 | 449.10 | * + | 1792.54 | 1694.55 | 2570.76 | 2098.96 | <0.001 |
| RR HFa | msec2 | 2705.42 | 4606.51 | 3285.92 | 4372.17 | 3144.80 | 2033.32 | 0.991 | |
| RR LFnu | nu | 35.52 | 22.76 | 34.49 | 15.20 | 40.50 | 14.93 | 0.764 | |
| RR HFnu | nu | 60.37 | 23.89 | 63.98 | 14.58 | 57.88 | 13.65 | 0.888 | |
| RR LF/HF | au | 0.86 | 0.78 | 0.68 | 0.72 | 0.81 | 0.55 | 0.692 | |
| RR LFHz | au | 0.09 | 0.02 | 0.10 | 0.02 | 0.10 | 0.02 | 0.658 | |
| RR HF | Hz | 0.24 | 0.07 | 0.27 | 0.05 | 0.27 | 0.05 | 0.313 | |
| RR-RESP HF | Hz | 0.24 | 0.07 | 0.27 | 0.07 | 0.27 | 0.06 | 0.161 | |
| RR-RESP HFK2 | . | 0.84 | 0.17 | 0.88 | 0.14 | 0.81 | 0.20 | 0.383 | |
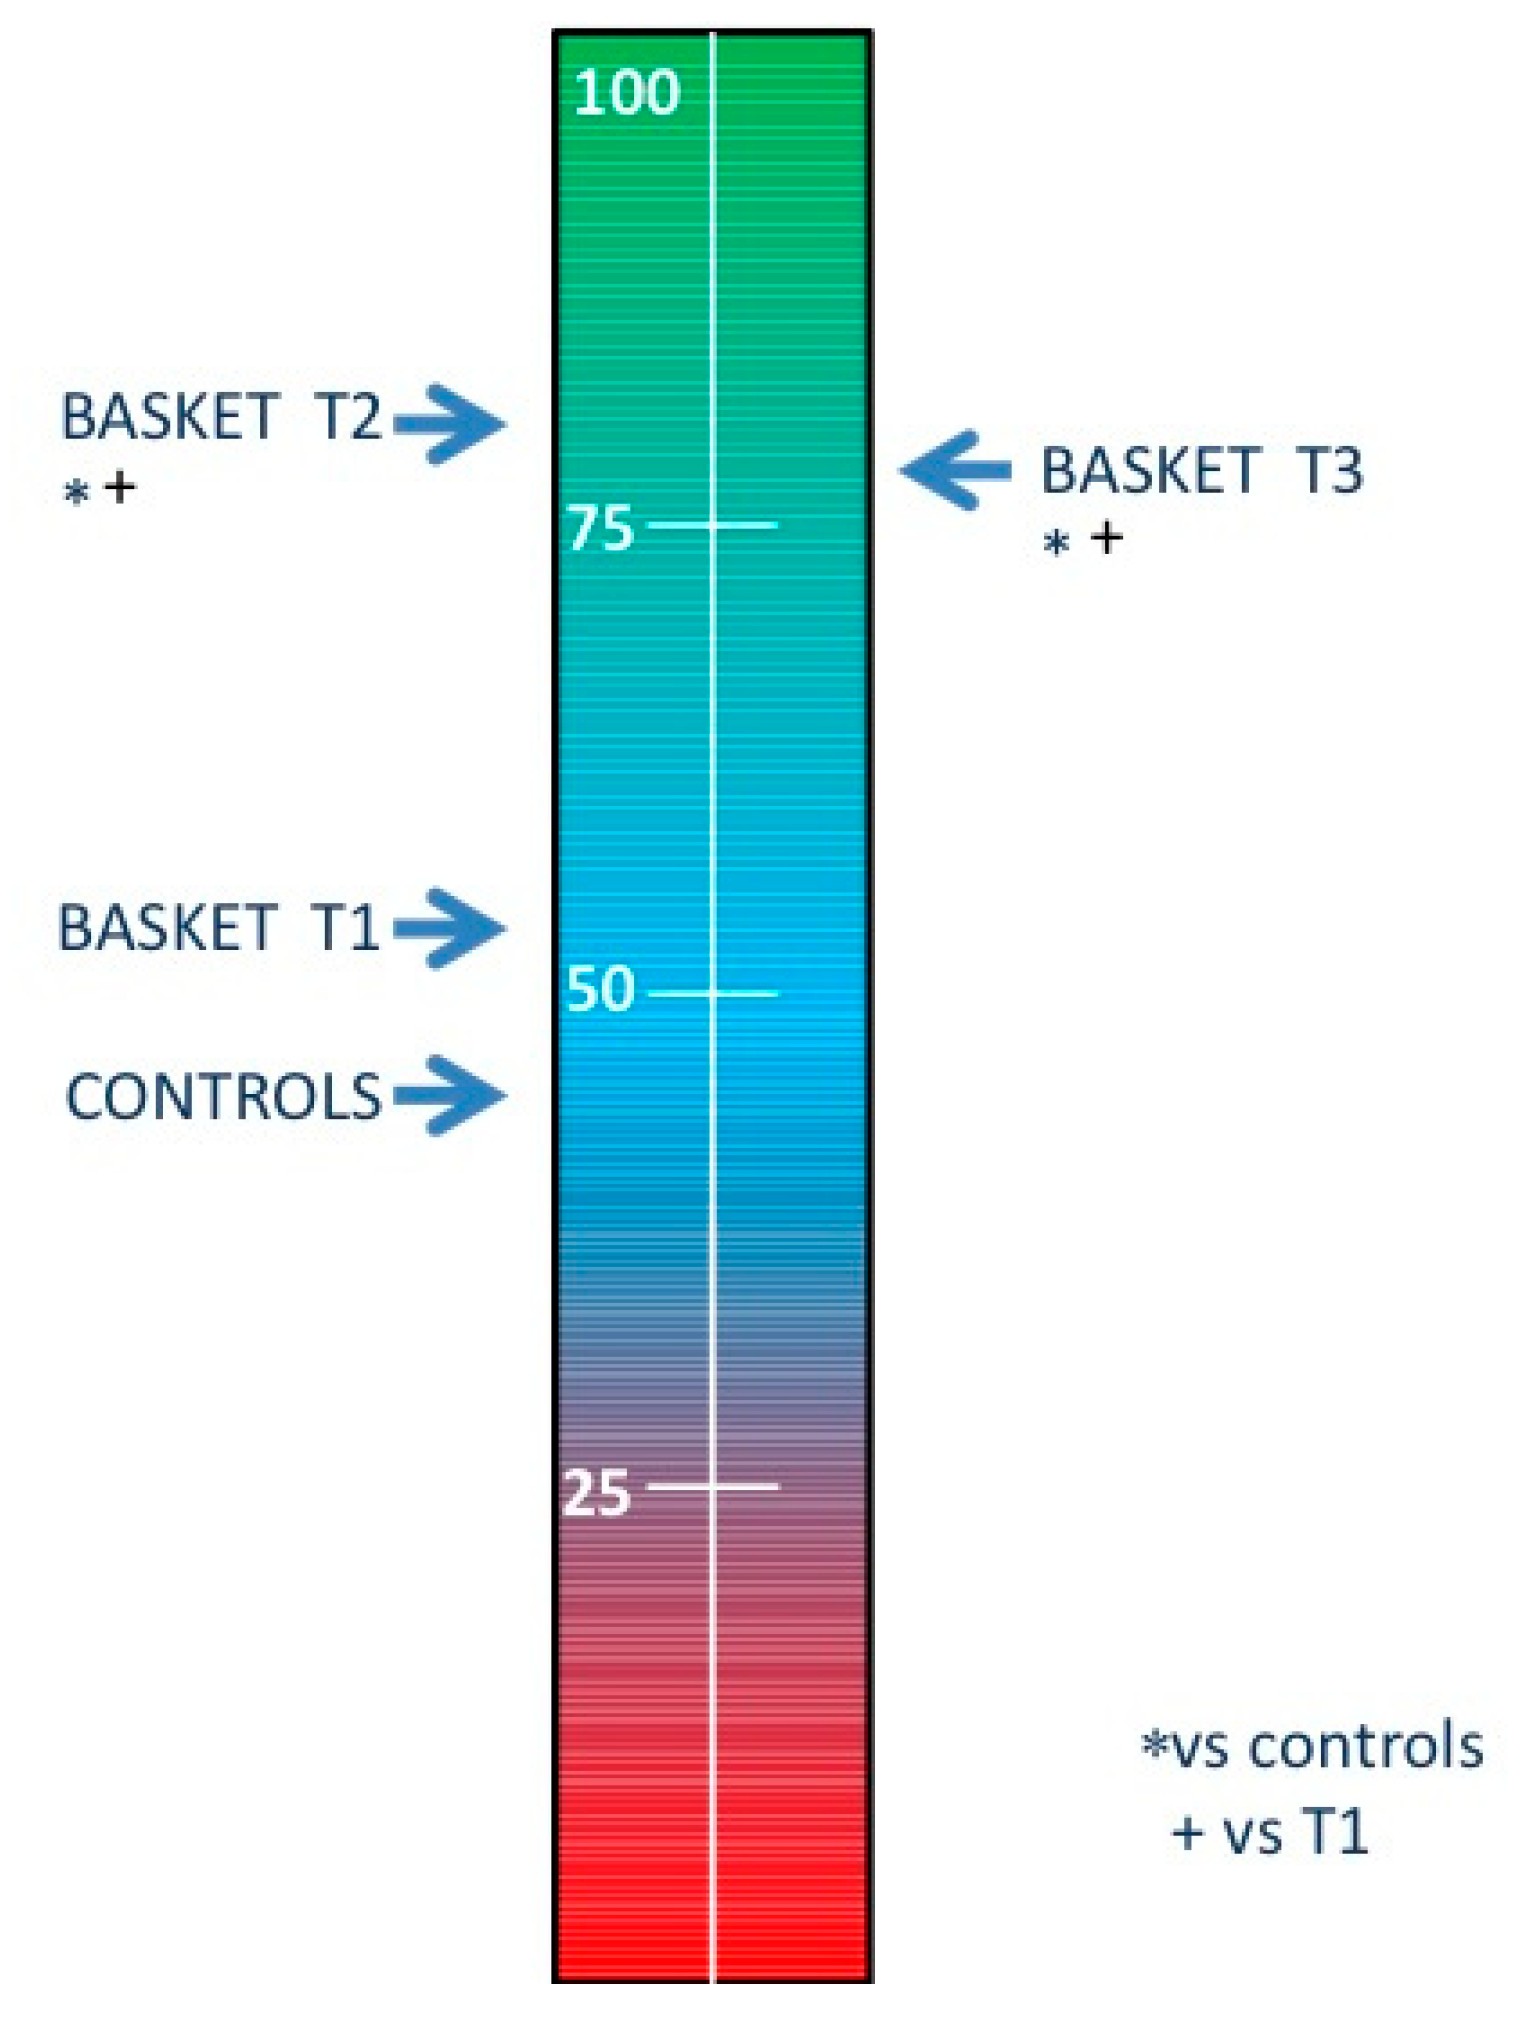
| ANSI | % | 53.83 | 32.56 | * + | 81.07 | 27.50 | 77.44 | 26.86 | 0.007 |
| RR Ro | . | 0.29 | 0.10 | * + | 0.17 | 0.08 | 0.20 | 0.08 | 0.03 |
| P_0v | % | 17.35 | 11.59 | * + | 11.50 | 7.78 | 12.52 | 8.27 | 0.028 |
| P_1v | % | 46.16 | 7.25 | 40.14 | 10.65 | 42.07 | 9.02 | 0.107 | |
| P_2lv | % | 15.27 | 11.88 | 12.15 | 5.81 | 10.74 | 5.04 | 0.296 | |
| P_2uv | % | 21.23 | 11.05 | * + | 36.21 | 17.17 | 34.67 | 14.23 | <0.001 |
| Stress | au | 1.75 | 1.82 | 1.40 | 1.64 | 0.91 | 0.83 | 0.141 | |
| tired | au | 2.33 | 1.30 | 2.20 | 2.08 | 1.82 | 1.33 | 0.583 | |
| 4SQ | au | 14.42 | 13.65 | * | 10.27 | 13.08 | 14.55 | 12.83 | 0.009 |
| Total Variance Explained (VAF) | |||||
|---|---|---|---|---|---|
| % of total variance | 30.83 | 28.29 | 15.82 | 11.21 | |
| cumulative % | 30.83 | 59.13 | 74.95 | 86.16 | |
| Hidden Factor | |||||
| ANS proxies | unit | 1 | 2 | 3 | 4 |
| HR | [b/min] | −0.937 | |||
| RR Mean | [msec] | 0.973 | |||
| RR TP | [msec]2 | 0.909 | |||
| RR LFa | [msec]2 | 0.839 | |||
| RR HFa | [msec]2 | 0.882 | |||
| RR LFnu | [nu] | 0.967 | |||
| RR HFnu | [nu] | −0.982 | |||
| RR LF/HF | [.] | 0.912 | |||
| RR LFHz | [Hz] | 0.759 | |||
| RR HFHz | [Hz] | −0.460 | |||
| RRRo | [.] | 0.860 | |||
| P_0v | [%] | 0.921 | |||
Publisher’s Note: MDPI stays neutral with regard to jurisdictional claims in published maps and institutional affiliations. |
© 2021 by the authors. Licensee MDPI, Basel, Switzerland. This article is an open access article distributed under the terms and conditions of the Creative Commons Attribution (CC BY) license (http://creativecommons.org/licenses/by/4.0/).
Share and Cite
Lucini, D.; Galiuto, L.; Malacarne, M.; Meucci, M.C.; Pagani, M. Cardiac Autonomic Effects of Yearly Athletic Retreats on Elite Basket Players: Usefulness of a Unitary Autonomic Nervous System Indicator. Sustainability 2021, 13, 2330. https://0-doi-org.brum.beds.ac.uk/10.3390/su13042330
Lucini D, Galiuto L, Malacarne M, Meucci MC, Pagani M. Cardiac Autonomic Effects of Yearly Athletic Retreats on Elite Basket Players: Usefulness of a Unitary Autonomic Nervous System Indicator. Sustainability. 2021; 13(4):2330. https://0-doi-org.brum.beds.ac.uk/10.3390/su13042330
Chicago/Turabian StyleLucini, Daniela, Leonarda Galiuto, Mara Malacarne, Maria Chiara Meucci, and Massimo Pagani. 2021. "Cardiac Autonomic Effects of Yearly Athletic Retreats on Elite Basket Players: Usefulness of a Unitary Autonomic Nervous System Indicator" Sustainability 13, no. 4: 2330. https://0-doi-org.brum.beds.ac.uk/10.3390/su13042330