
Bikeability and Emerging Phenomena in Cycling: Exploratory Analysis and Review


Centre of Territory Environment and Construction (CTAC), University of Minho, 4800-058 Guimarães, Portugal
*
Authors to whom correspondence should be addressed.
Sustainability 2021, 13(4), 2394; https://0-doi-org.brum.beds.ac.uk/10.3390/su13042394
Submission received: 9 January 2021
/
Revised: 10 February 2021
/
Accepted: 19 February 2021
/
Published: 23 February 2021
(This article belongs to the Section Sustainable Transportation)
Abstract
:Recent strategies to improve the performance of the cycling mode of transport are based on infrastructural, behavioral, and multimodal measures, which are related to the concept of bikeability. A literature review on “bikeability indexes” was conducted focusing on indicators, using a four-step systematic process. Fourteen studies were included for the final analysis and provided 138 indicators, 17 criteria, and four domains. The exploratory analysis evidenced limited application of indicators related to pollution, scarce use of indicators related to bicycle sharing systems (BSS), absence of indicators related to electric bicycles, lack of indicators related to digital solutions, and the need of a calibration and validation process for bikeability indexes. Considering the changes and opportunities created by emerging innovations (namely BSS and electric bicycles) and the health trade-off related to pollution reduction, this research reveals that the current bikeability indexes do not fully address the real potential of a cycle network, limiting its use as a comprehensive tool for the promotion of sustainable mobility.
1. Introduction
Bikeability is a broad concept that relates different factors to bicycle use, depending on the focus and interest of the research. It is mainly applied to the fields of transport, urban planning, public health, and well-being. Although it was only at the beginning of this decade that there was interest in the topic, there have been several initiatives since the beginning of this century to measure the quality of environments for active modes; however, the vast majority focus on walking [1]. The concept of bikeability was developed from a concept of walkability, extending the analysis to all active modes [2].
If, in the past, the automobile prevailed as the main reference for urban and transport planning, there have been some changes in the 21st century [3], with a paradigm shifting to the promotion of a more sustainable mobility and urban planning processes through the development of policies and actions centered on soft modes transport. In this context, the bicycle had an important role, especially in this second decade of the 21st century, as it is as an interesting way to meet 11 out of the 17 sustainable development goals of the 2030 agenda [4]. Therefore, cycling can be seen as way to promote physical activity and became an excellent alternative for decarbonization of mobility, reduce transport costs for families, promote gender equality, construct resilient and more efficient sustainable infrastructures and transport systems, as well provide more accessibility to those who have no other transport alternatives, and to support the development of local and regional economies [5].
A comprehensive strategy to promote cycling in cities consists of developing policies, plans, and measures related to infrastructure, behavior, and the integration with other modes of transport, e.g., multimodality [6]. This work focused in cycle infrastructure dimension, considering the existing supply and types of cycling facilities, as well as the inherent level of perception of the quality, suitability, and the degree of importance of various characteristics of the cycling environment.
1.1. Bikeability Concept
Bikeability is related to concepts of bicycle level of service [7], bicycle-friendliness [8], cycling accessibility [9], and cycling quality [10], which enables the definition of a bikeability concept in a clear and adjusted way in the context of urban mobility, integrating different contributions from the existing bikeability definitions [11].
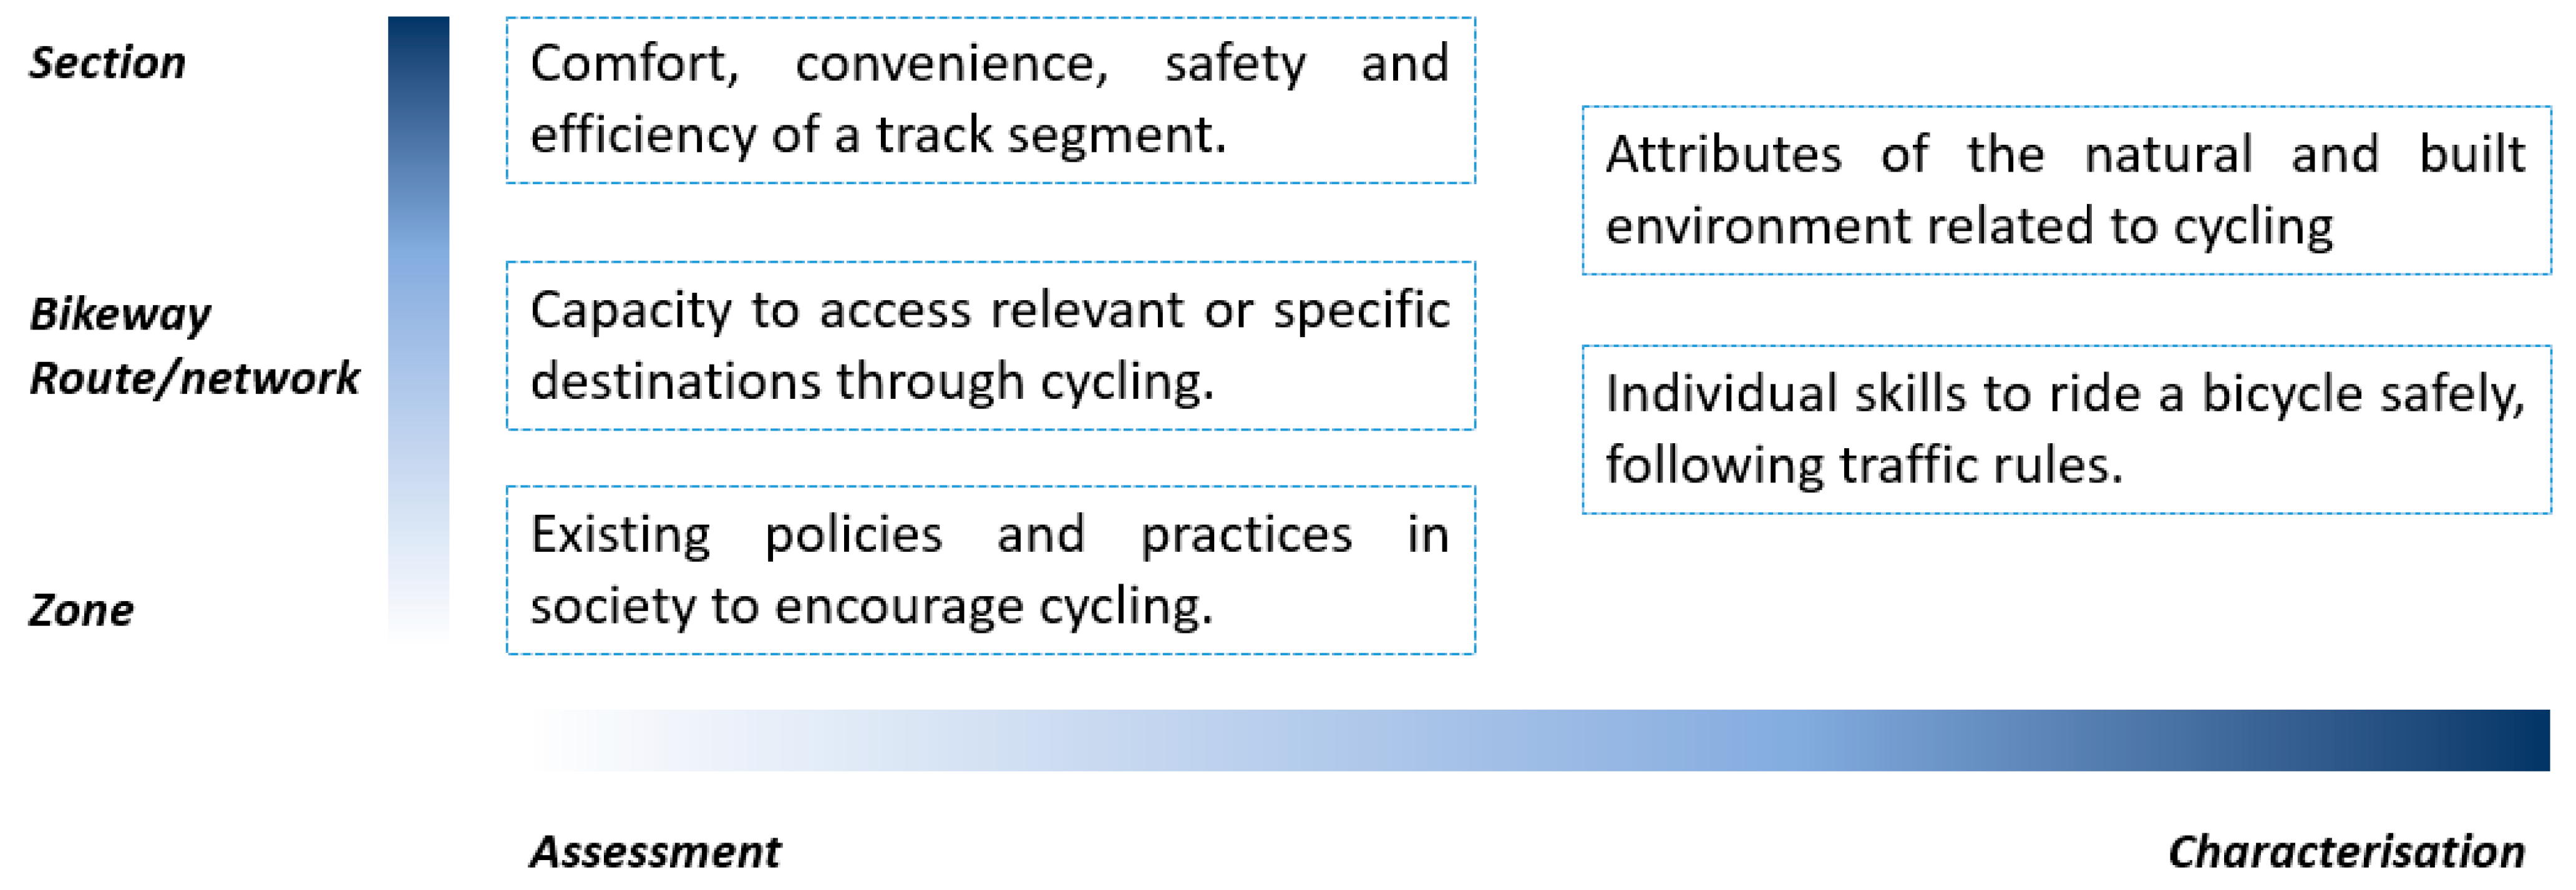
In the field of public health and well-being, bikeability is widely used to address environmental factors associated with cycling, such as the ability to provide comfort, convenience, and safety conditions [12]. Concerning the field of urban planning, bikeability analyses explicitly include variables related to urban form. The scale of analysis of bikeability varies from a specific section of the road to an urban area, and also considering the analysis of a road network using indicators such as connectivity and objectivity. Thus, Manum et al. (2017) [13] define bikeability, taking into account the relationship among street characteristics and bicycle flows and speeds. This research is one of the few examples of applying space syntax analysis in the assessment of bikeability.
A similar definition is used in the field of transport to assess the level of suitability of urban environments for bicycle trips, especially for commuting purposes, considering indicators of cycle infrastructure, land use, topography, and urban network connectivity [2,8,14,15,16]. Beyond this, recent studies, such as Porter et al. (2019) [2], additionally consider indicators related to air quality, i.e., pollutant emission levels, to assess bikeability. Most researches analyze bikeability in a limited number of cycle paths, usually defined arbitrarily or based on methodological restrictions. Thus, Gholamialam and Matisziw (2019) [17] analyzed all possible network cycle paths between origins and destinations considering safety, comfort, and efficiency objectives to assess bikeability through characteristics of a road segment, namely minimizing the level of traffic stress and minimizing path length and the number of intersections crossed.
Another prevailing perspective in the field of transport is the definition of bikeability as the level of accessibility of the cycling mode to relevant or specific destinations, such as public transport terminals. Thus, accessibility concepts can be integrated into the structure of bikeability assessment [9,18]. The way in which accessibility is addressed varies according to the definition of bikeability used. McNeil (2011) [19] defines bikeability as accessibility to the largest number of destinations, considering a 20-min trip in a non-motorized environment. Lowry et al. (2012) [7] define it as comfort and convenience provided by the cycle network having access to important destinations. Saghapour et al. (2017) [9] define bikeability as a measure of accessibility in terms of travel costs between origins and destinations, which are commonly expressed in terms of time and/or distance. These travel costs can also be determined by the perceived distance, which is estimated by the safety, comfort, and attractiveness conditions of the route [10].
There is also a less prevalent definition of bikeability in transport research, which considers general efforts, policies, and practices in a society to promote cycling. It is common in research, from this perspective, to explore factors that act as barriers or motivators in the cycling mode. In this set, bikeability is considered as bicycle-friendliness issue [7].
Despite the wide scope of the concept, it can be concluded that most of the works address bikeability as specific definitions focused on a restricted property of cycle networks, such as accessibility, comfort, or others [2,8,9,12,14,15,16,19]. However, Lorry et al. (2012) [7] considered that some cycling properties, like comfort, convenience, and safety, are not a part of the bikeability concept, but are different concepts of bicycle suitability, considering bikeability only as the capacity to have access through cycling to destinations. Furthermore, Lin and Wei (2018) define bikeability as concept formed by three integrated characteristics such as suitability, amenity, and accessibility [20].
In Figure 1, the conceptual structure of the definitions underlying the concept of bikeability is presented, based on the main characteristics of the definitions found in the literature, which translates into the following two dimensions: spatial and functional.
Finally, there is still a less usual perspective that defines the term “bikeability” as the individual abilities to ride a bicycle safely, taking into account the traffic rules, which is out of the scope of this research. It is expected that a cyclist has adequate physical and psychological skills to ride on a bicycle. This is the vision provided by initiatives such as the “bikeability trust” [21].
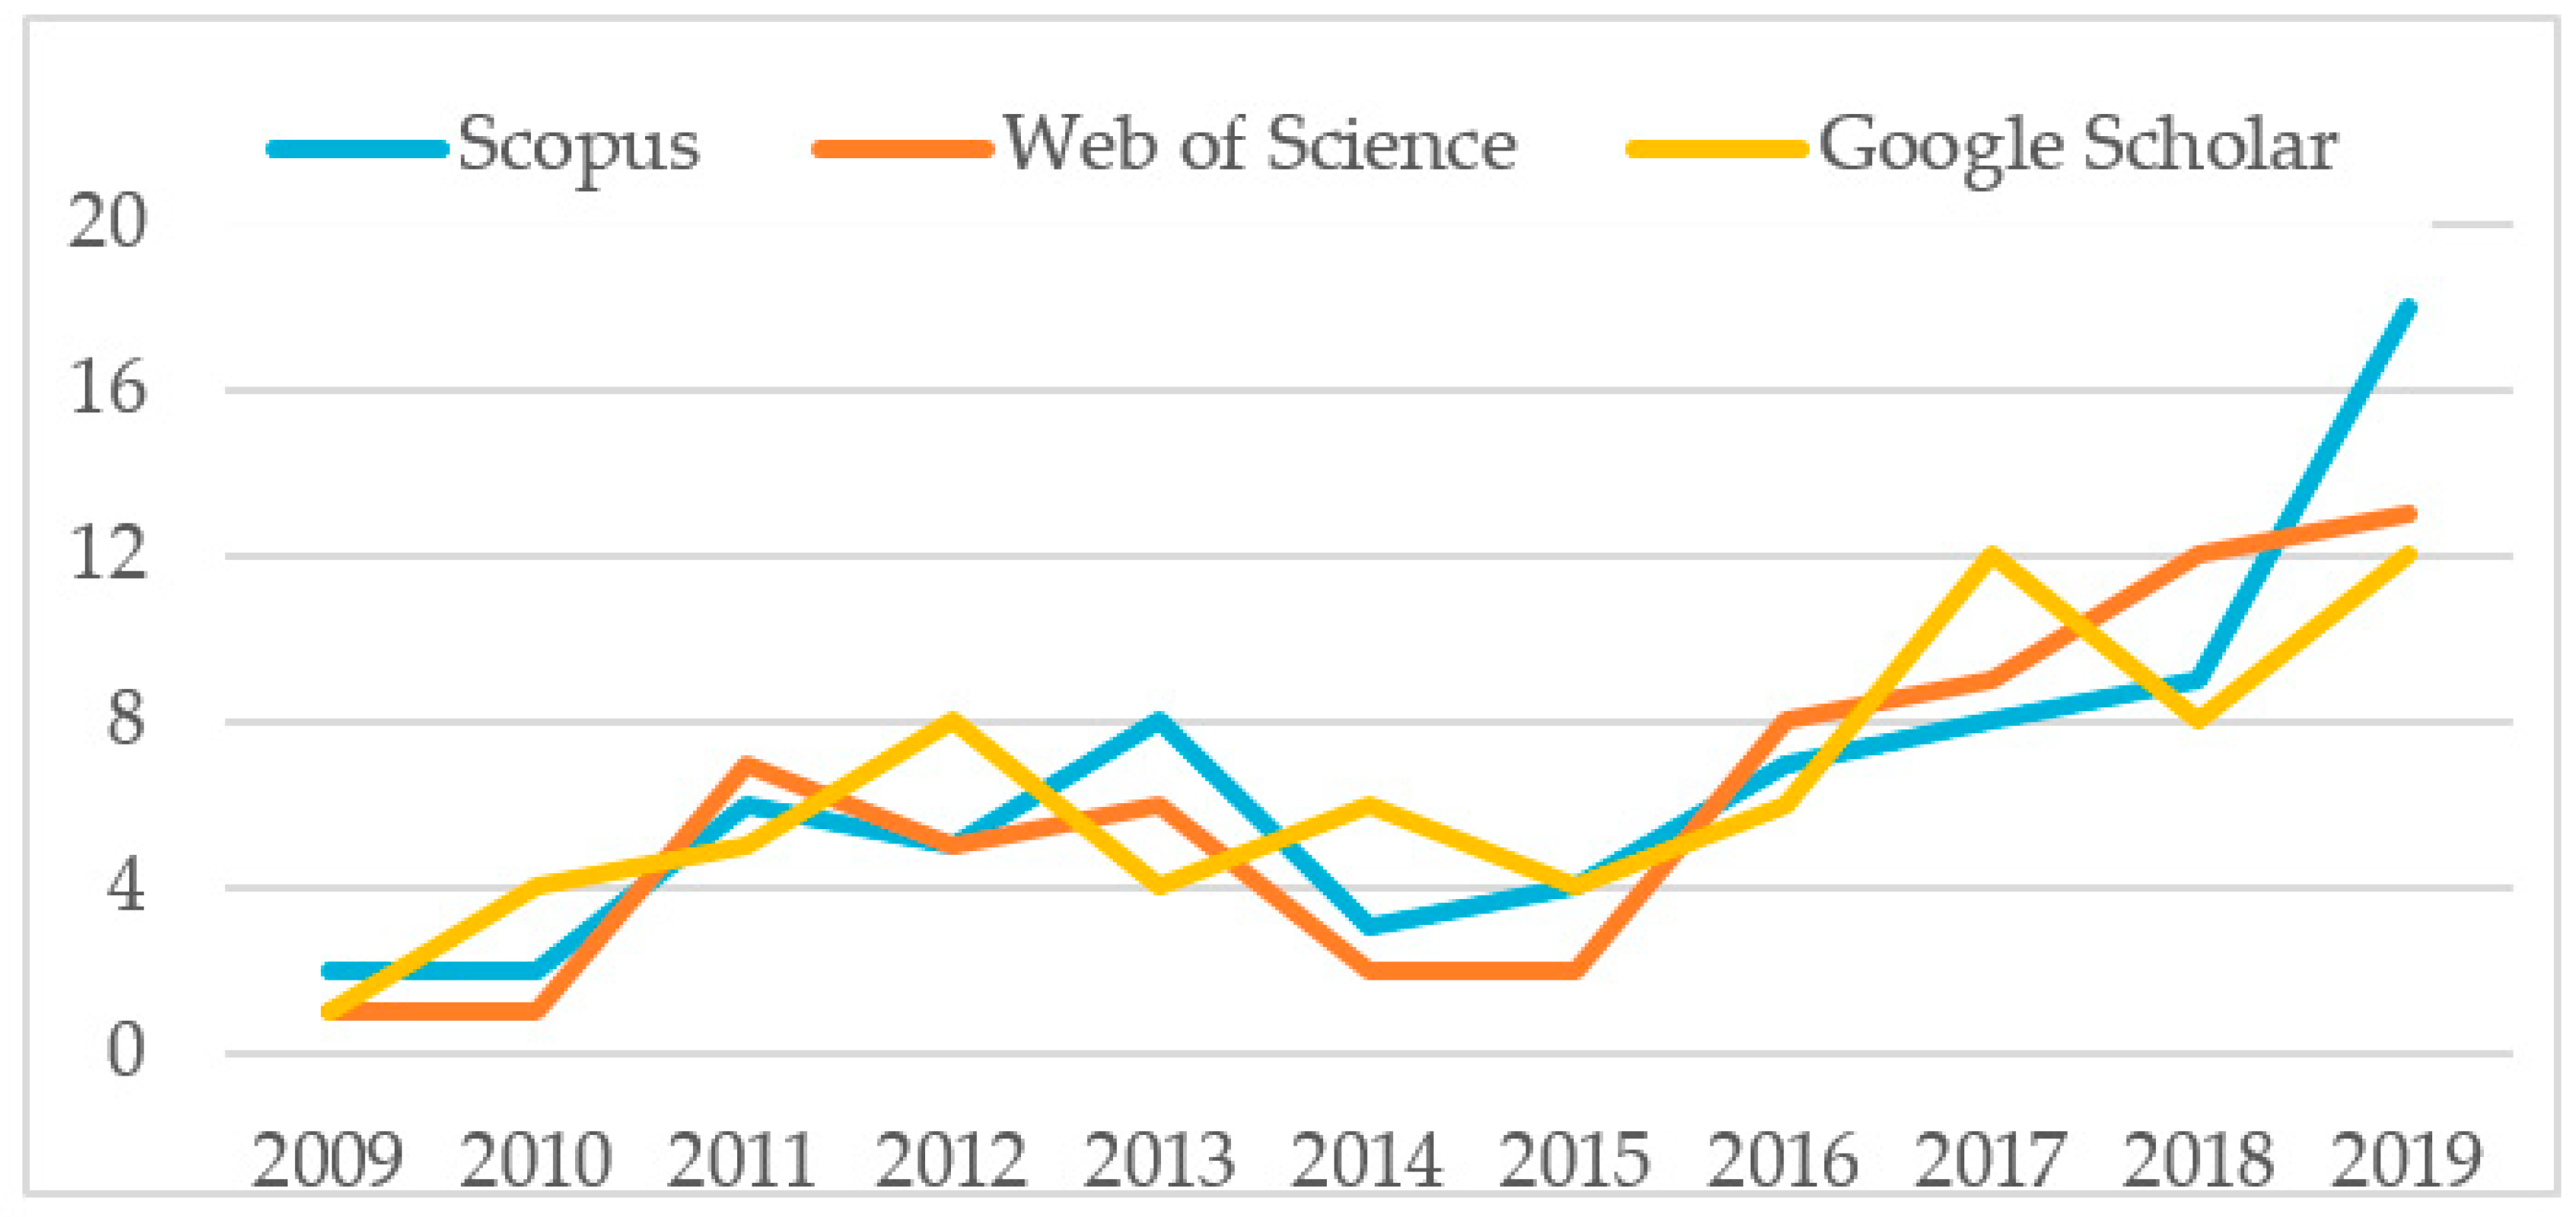
Figure 2 presents the evolution of scientific publications in the field of bikeability, showing the growth of interest of this topic in the last four years.
Therefore, it can be noted that bikeability is a relatively recent concept (Figure 2) and relevant to the field of sustainable mobility, namely to promote a better sustainable urban transport planning. Since then, it has intended to assess and integrate cycle infrastructures with both individual well-being and the sustainability of urban environments for a regular use of bicycle in urban areas.
Bikeability can be used to define a cycle network implementation hierarchy within the scope of the potential evaluation, planning horizons, or specific infrastructure projects. The importance of evaluating the concept and how bikeability is measured in the different stages of the planning process of a potential cycle network is needed to adjust the supply of infrastructure to the demand for cycling and encourage the use of bicycles, which should be coherent and consistent with local realities.
1.2. Emerging Phenomena in Cycling
When considering the recent scientific literature on cycling, it is possible to highlight evidence that electric bicycles and bicycle sharing systems (BSS) are becoming part of the current mobility system of cities [22,23] and are considered new trends in cycling mobility.
The electric bicycle can be used in different contexts. In low-density territories, mainly rural and peri-urban areas, it allows for medium and long-term travel [24,25]. On the other hand, in cities with a higher population density with a complex road network, the electric bicycle can be an excellent option, since it provides the cyclist the possibility of reducing effort to start the movement (e.g., starting at traffic lights or intersection) [26] and for maintaining constant speeds on steep stretches, providing even greater capacity for transporting goods and merchandise [27]. Additionally, the electric bicycle also allows for the development of higher speeds [28,29], making travel faster, but potentially reducing the safety of cyclists. In fact, the increase in speed can reach values 20% higher than those of a traditional bicycle, resulting in more demanding geometric and functional requirements for cycle infrastructures to mitigate conflicts between the electric bicycle and other types of transport, especially the traditional bicycle [30] and motorized traffic, due to the difficulty in distinguishing different types of bicycles by drivers [31].
The relationship between electric assistance and bicycles has aroused great interest in the scientific community, and an increase of interest can be observed in research both in the fields of transport and urban planning. The main scientific issues related to this theme are linked to environmental [32], safety [30], and modal shift dimensions [33,34], in which the bicycle operates in a shared system or as a private vehicle.
Riding an electric bicycle can be seen as an improvement on the traditional bicycle usage, as well as a new standard of mobility. From this point of view, electric assistance can play a crucial role in shared bicycle systems and be an interesting transition element for electric mobility, specifically due to the spread of electric bicycle sharing systems (E-BSS) [35,36].
The introduction of electrical assistance in shared systems (E-BSS) is seen as a natural evolutionary process of BSS [34]. Moreover, the potential modal shift to the bicycle promoted by the E-BSS may allow a reduction in car traffic volumes and, consequently, a reduction in the risk of accidents for cyclists [37] and in air pollution.
The expansion of BSS occurred between 2004 and 2014 [38], which can be explained by the benefits inherent to the concept of sharing that promote more sustainable and accessible mobility systems. From the perspective of public health, BSS are positively related to the prevention of diseases and early deaths—caused, respectively, by the increase in the levels of physical activity and by the reduction of environmental risks and accidents associated with road traffic [39,40], especially systems that operate with traditional bicycles. From the social and behavioral point of view, the BSS systems strengthen the benefits of the use bicycles such as the pleasure of travelling, social interaction, and the feeling of freedom, and can even increase the community cohesion [41].
Regardless of the type, shared bicycle systems (BSS and EBSS) provide an increase in the variety of supply for cycling in urban areas, increasing mobility options and enabling access to a cheap mode of transport, positively influencing access to opportunities in the urban environment and reducing travel times and traffic congestion, thus ensuring greater social equity in the mobility system [3,22,42,43]. These systems also contribute to the resolution of last mile problems [38,44,45] as well as an alternative of transport for short trips that are relatively quick [46,47] and typical of urban areas where most BSS are being implemented [48]. BSS and E-BSS can also promote public transport traveling through the increasing of spatial coverage of the service and the possibility to achieve more multimodal trips [49,50,51]. They also provide greater access to small businesses, thereby strengthening local economies [52].
A relevant difference between BSS and EBSS refers to the size and layout of the stations. If compared to the traditional ones, the electrified system operates with stations of greater capacity and in smaller numbers. This results in a greater distance between stations and consequently the coverage area [53].
The bicycle can be seen as a potential substitute for the car that can be promoted by BSS, despite the fact that these travel replacement rates vary widely depending on the different spatial contexts [54,55]. It appears that in urban contexts centered on the car, i.e., with an absence of or low cycle culture, the modal shift to the bicycle occurs mainly from the car [44,56]. In urban areas where BSS are already properly implemented and consolidated, it can be seen that a significant percentage of trips transferred to bicycles result from users of public transport and pedestrians [54,55,57,58].
BSS and E-BSS must be considered as an emerging phenomenon in cycling, especially in urban areas. Thus, for a more accurate characterization of the travel patterns of different BSS users, travel data need to be collected from the BSS operators [54], especially due to the fact that regular users use the BSS in only a small part of their trips [38,57,59,60]. Thus, different types of cyclists must be included: frequent and sporadic [50,55,57,58]. BSS is particularly convenient for those who stay temporarily in the city, such as tourists, since they rarely take their bikes with them to the cities they visit, and this situation makes BSS a desirable and more suitable mode of transport for them [61]. On the other hand, non-cyclists can also be included to evaluate the potential use of BSS [58], since they can assume the status of non-regular cyclists, especially in tourism, or sporadically on a daily basis.
Therefore, this work aims to understand, characterize, and explore the current indexes and indicators used in different methods for assessing bikeability in order to propose a framework for a new bikeability index, capable of taking into account the emerging phenomena of electric assistance in cycling and Bicycle Sharing Systems (BSS), as well as the combination of both phenomena—the Electric-Bicycle Sharing Systems (E-BSS).
This work is developed in five sections, including this introduction. The second section presents the research methodology used in the review process, then the third section presents the main results such as the indicators found in the bikeability methodologies, gathered in criteria and domains, as well as the bikeability-related methodologies draw from the literature. The fourth section discusses the results considering the emerging phenomena of cycling defined in this section. Finally, the main conclusions are drawn in the last section.
2. Research Methodology
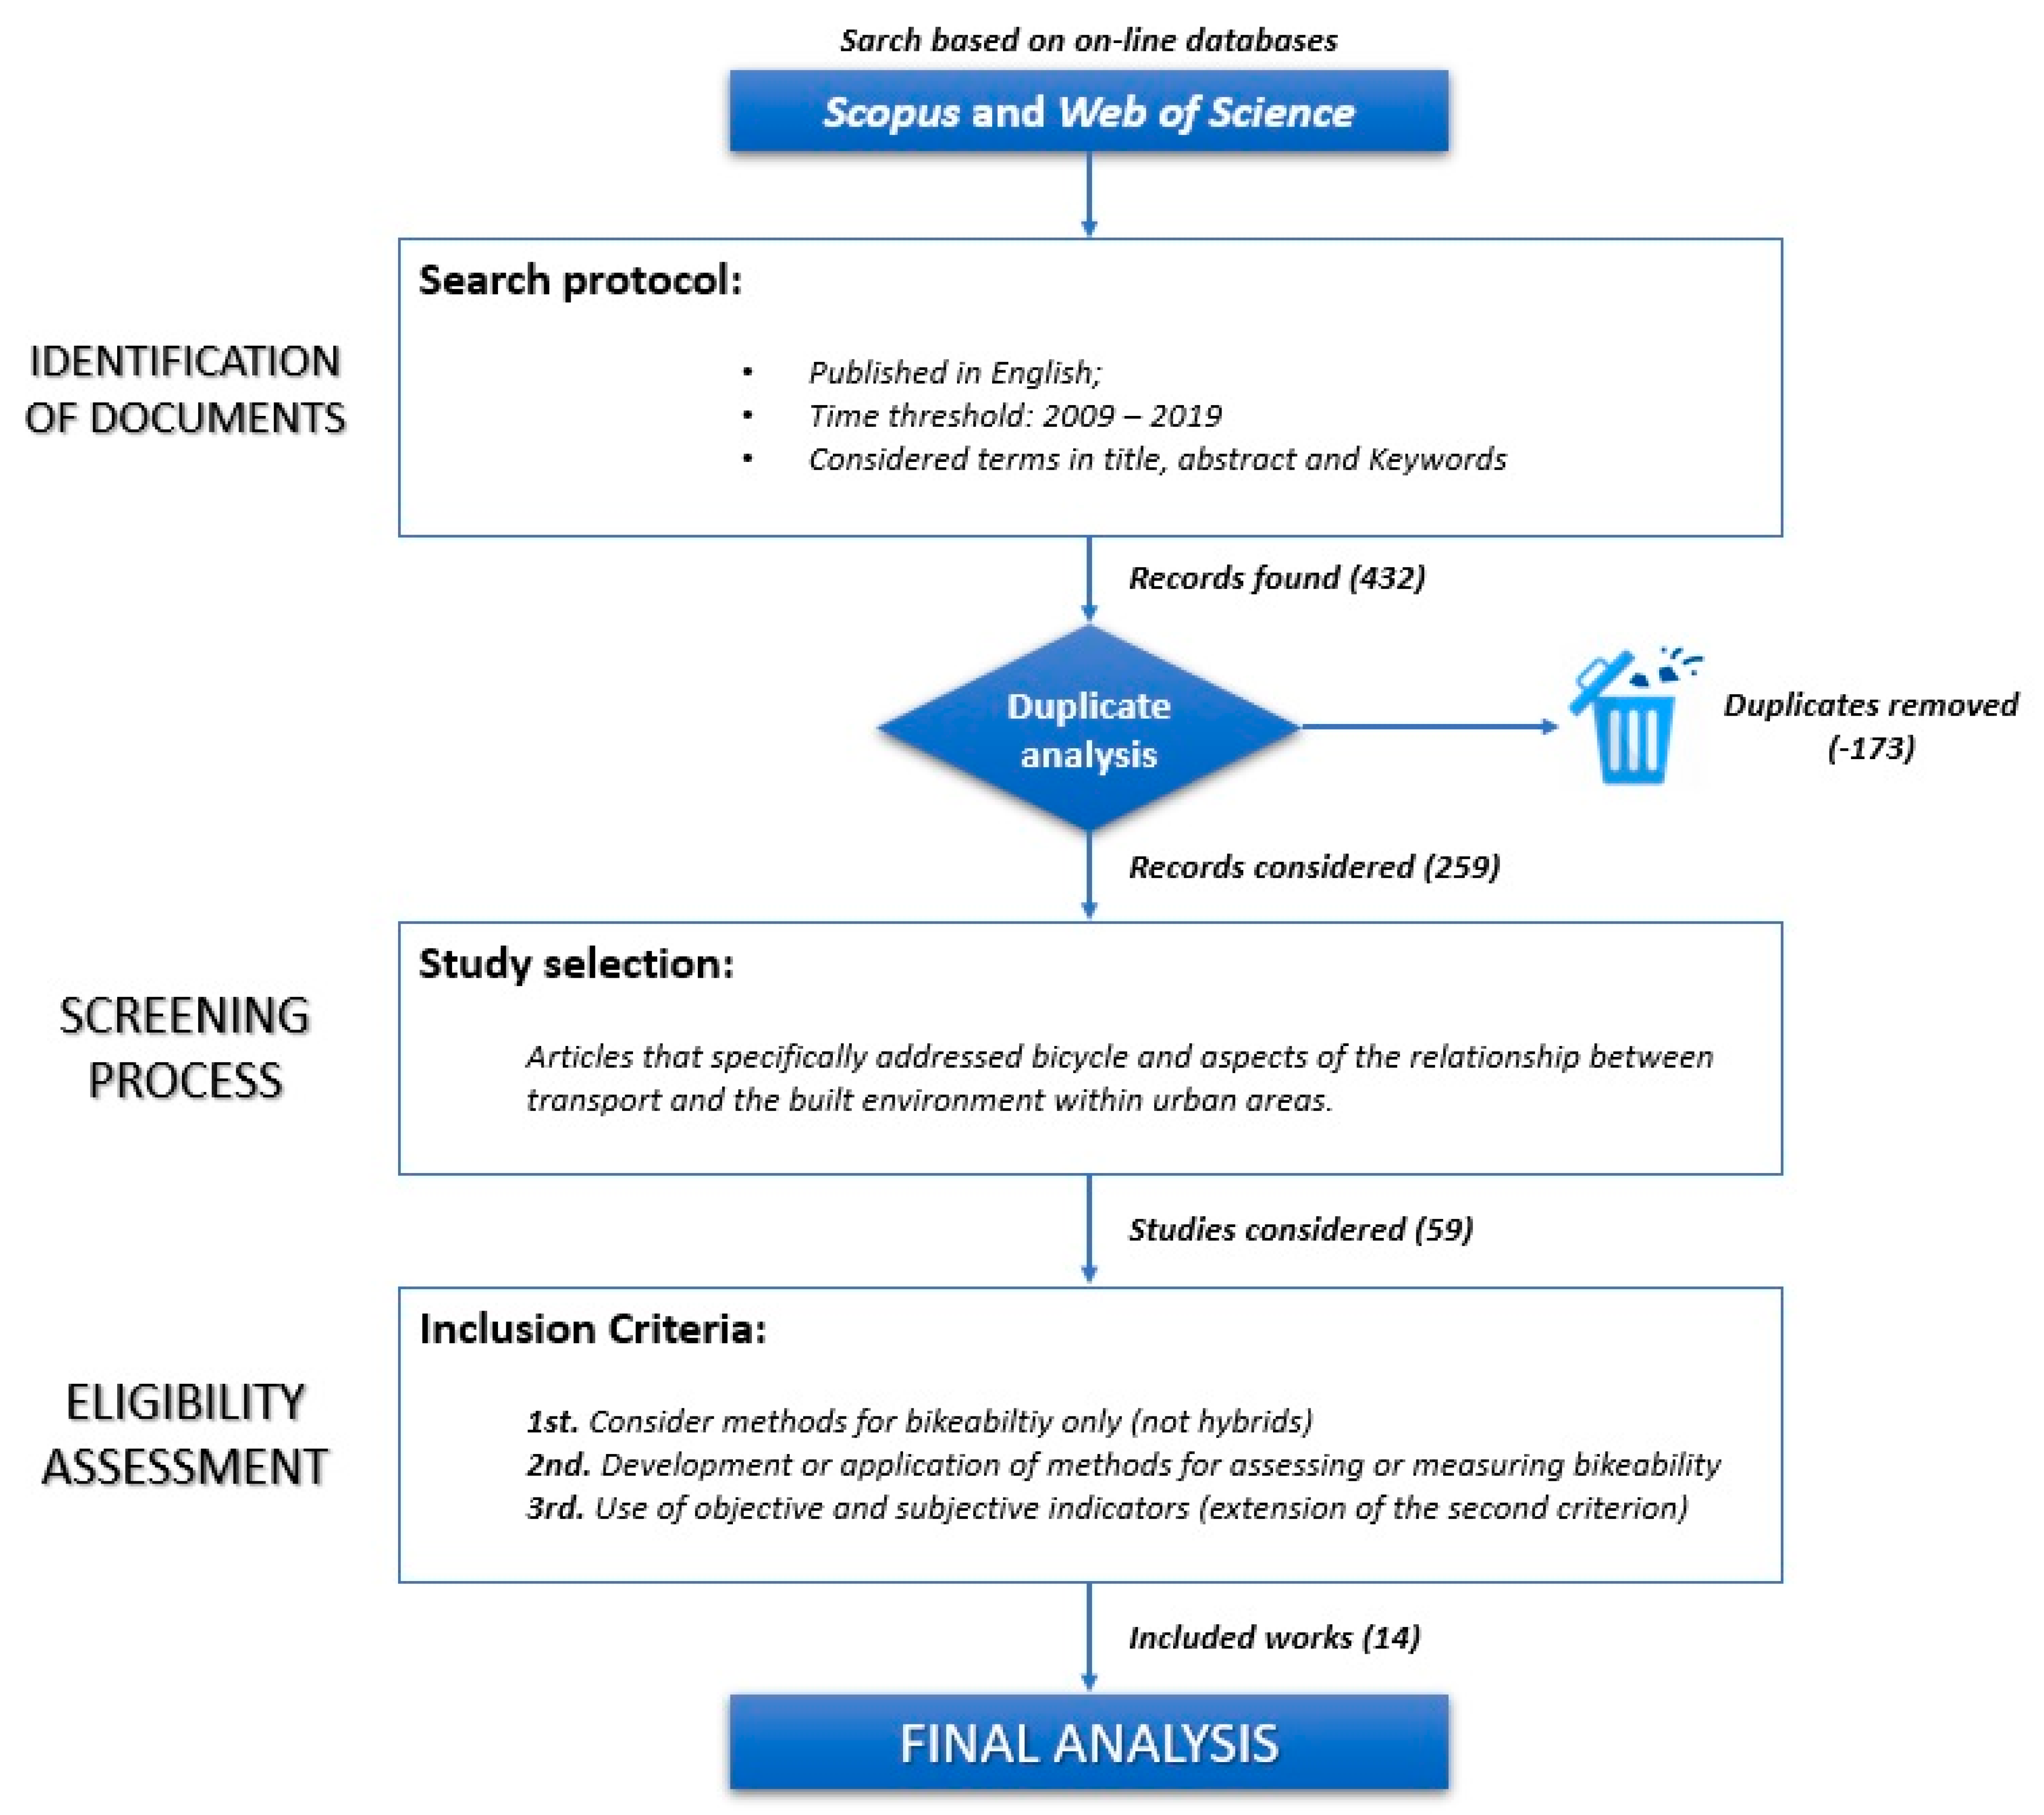
To conduct a comprehensive literature review on the indicators used in bikeability indexes, the following four-step systematic process was followed: (I) identifying documents by searching for online databases, (II) a screening process, (III) eligibility assessment, and (IV) an inclusion for the final analysis [62,63].
Initially, two databases were considered: Web of Science (WoS) and Scopus. Despite the overlapping issues, both were used, as they are considered the best international sources for multidisciplinary investigations in transport [64,65,66].
In the first stage, a research protocol was used in which only documents written in English and published within the time horizon between 2009 and 2019 were considered, taking into account the analysis of the chart in Figure 2. To perform the searches in the databases, the presence of the following terms in the title, abstract, and keywords were considered: “bicycle”, “bikeability”, “index”, “criteria of evaluation”, “level of service”, “electrical bicycles”, “e-bike”, “bicycle sharing systems”, and “shared bicycles”, as well as their associations. It is relevant to say that the use of the term “cycling” was considered associated with the other terms. In a previous analysis, many records were observed that were not related to the field of transport or even to “cycling”. Then, the term “bicycling” was chosen. The research was carried out in November 2019. The queries applied in the search engines, and the number of records provided by Web of Science and Scopus, are specified in Table 1.
At the end of the first stage, after excluding duplicate documents, 259 records remained. Having all the manuscripts from each record, the screening process began, in which the suitability and adjustment of each article to the topic and aspects related to transport and the built environment were evaluated by analyzing the abstracts. In this stage, 200 documents were excluded.
From the remaining documents, which included 59 scientific papers, the eligibility assessment phase began, guided by three inclusion criteria, presented as follows:
- (i)
- first, investigations that pointed/suggested or made use of objective and/or subjective indicators to address issues related to transport and the built environment were considered;
- (ii)
- second, to be considered, an investigation should specifically assess bikeability and not just address criteria relevant to or associated with the concept of bikeability. Investigations that did not meet this criterion were excluded, e.g., the work of Rybarczyk and Gallagher (2014) [67]. Although this work presents many indicators that address the ease or impediment of using a bicycle, the focus of the research is on travel demand management and not on the assessment or measurement of bikeability;
- (iii)
- third, hybrid methods were excluded. This is due to the existence of several methods that evaluate the characteristics of the urban environment that interfere and condition the propensity to use active modes, particularly in the frequency of bicycle trips [11]. Most studies that address only cycling focus on analyzing walkability, while some others consider both walkability and bikeability. Thus, the application of this last criterion led to the inclusion of only those methods whose object of analysis was bikeability. At the end of this stage, a total of 45 documents were eliminated, resulting in a selection of 14 scientific papers.
Furthermore, to complement the information obtained, the list of references of the remaining 14 publications was examined to verify if any article within the research period would be relevant for the survey of methods for assessing and measuring bikeability. A holistic and careful analysis of the 14 publications selected by the method proposed in Figure 3 was done, to evaluate in each document the following aspects: the definition of bikeability considered, the use of indicators, criteria and domains, as well as the similarities and distinctions between the methods of assessing bikeability.
3. Results and Analysis of Selected Documents
3.1. Bikeability Domains, Criteria, and Indicators
Using indicators is common practice in bikeability studies for evaluating or characterizing systems performance. They can establish or discard links between the factor of interest and the relevant characteristic of cycling. Indicators form the lowest hierarchical level in the structure of a bikeability index.
To develop a bikeability index, its purpose needs to be defined, since there may be different indexes for different areas of research and contexts. Thus, it is fundamental to identify and understand the domains, criteria, and indicators used in structuring the concept of bikeability presented by Lin and Wei (2018) [20], which is not common to all bikeability indexes. In fact, the procedure of the majority of the methodologies included in the review uses only two levels, e.g., criteria and indicators.
In all methodologies, indicators play a crucial role in the formulation of the indexes that are chosen, according to the criteria of each domain. An indicator serves to characterize and/or evaluate a certain performance issue. There are two types of indicators: objective and subjective. Objective indicators are based on measurements derived from observations and systematic surveys that can incorporate spatial data. The subjective indicators can be obtained from measuring, observing, and surveying techniques such as stated preference models, which capture how each individual perceives the environment around them in their way that may be influenced by their experiences and by a relationship with others [16]. Both types of indicators are used in bikeability indexes and can be applied separately or together. However, it should be highlighted that the methods that use both types of indicators only appear in recent works [16,20], since the possibility of subjective indicators include, improve, and clarify the information resulting from an objective assessment.
In order to define a framework for a new bikeability index, the following workflow was adopted: first—indicator, second—criteria, third—domain [20], to support and allow the systematic analysis developed in this review process. Therefore, the survey started from raising the basic entities—a total of 138 indicators (106 objective and 32 subjective), which were allocated in 17 criteria and then clustered into four domains, using thematic clustering techniques. Table 2 summarizes the information regarding the criteria used in each selected work.
3.1.1. Cycle Infrastructure
The domain of Cycle Infrastructure comprises aspects related to the infrastructure and facilities, namely about the following objective criteria: availability, quantity, and typology; geometric design (layout and cross section-related features); multimodal features (interface and parking); and a bicycle sharing system. It also comprises the following subjective criteria: quality of the cycle infrastructure. In the following paragraphs, the main characteristics of these criteria will be explored. Table 3 presents the set of indicators that characterize and evaluate each of the criteria in this domain, and identifies the type of indicator as objective or subjective.
- Availability, quantity, and typology: These criteria refer to the objective indicators for analyzing the cycle infrastructure. When addressing availability, most authors exclusively consider the existence of bicycle lanes [2,8,17,18]. Concerning the quantity criterion, two different sets of indicators can be used. The first addresses the number of cycleways per unit area [8,16,20], or by the length of the route [9]. The second set quantifies the percentage of the transport network that is available for cycling [13,17,19], which can be divided according to the different types of cycle paths [9]. Regarding the typology, the indicators to characterize this criterion are based both on the level of segregation and on the exclusive use of infrastructure [10,13,19], namely “shared lanes”, “bicycle lanes”, and “bicycle paths”.
- Geometric design features (layout and cross sections): The relevance of these criteria can be observed in reference design manuals for cycling such as the Dutch “Design manual for bicycle traffic” of CROW—NL [68], which define the dimensions and layout of the different types of cross sections according to the type of cycle path. These are closely related to the function, form, and use of the cycle infrastructure, and their dimensions are essentially influenced by the volume and speed of motorized traffic and the volume of cyclists [68]. The main characteristic (dimension) of cross-sections is the width of the different features, which are reflected in several indicators, namely the width of the cycleway [7,13,20], shoulder [7,20], and road lane [7]. Other indicators such as the number and width of crossroads [10,17] and the presence of sidewalks [7] are also used in this perspective. The approach to the layout of cycleway must be done in relation to the carriageway and the intersections, since the features of these elements are different, depending on local conditions (e.g., traffic volumes and speeds, regulation, and available space). At the carriageway level (bicycle lanes and bicycle paths), the bikeability indexes use indicators related to lighting [20], horizontal alignment [13], and pavement surface [7,13]. The first two conditions affect mainly the visibility of the path by the cyclist, whereas the latter concerns the quality of service provided by the infrastructure to cyclists, which should not force them to make unexpected trajectory deviations. At the level of intersections, the bikeability indexes use indicators related to traffic flow control and safety [10], as these are zones of conflict between trajectories of different types of vehicles. The intersection design can also be evaluated by indicators that assess the ease of crossing the intersection and the directness of the routes [7,10]. Moreover, when considering the intersections in the network context, there are specific indicators to address mainly connectivity issues [13].
- Multimodal features (Interface and parking): According to the literature, the link between cycling and other urban transport systems is addressed considering two groups of indicators related to public transport and to parking infrastructure. Public transport can be considered for multimodal purposes by cyclists through the simple existence of a station [20] or through the distances between origins and a specific station/stop [2]. Furthermore, public transport provides an increase in the area of influence of cycling [69]. On the other hand, the parking infrastructure available for bicycles is a relevant aspect and is closely related to the context of multimodality. The lack or the unsuitable conditions of these facilities can influence the cyclists’ choice about the route or mode of transport [70]. The importance of assessing the availability of bicycle parking goes beyond public transport interfaces, extending this issue to other relevant destinations for cyclists (e.g., shopping centers, central regions of cities). Thus, bicycle parking infrastructure can be quantified in relation to public transport stations [18] or to the entire urban area [20].
- Bicycle sharing systems (BSS): BSS are important to promote and expand cycling in urban areas, given the public and shared nature of the service. These systems operate more efficiently when there are regions with a high diversity of destinations with a cycle infrastructure. In addition, it is important to highlight that the surrounding environmental conditions of urban areas are considered very important for the demand and use of shared bicycles [38,53]. However, only two works slightly considered the effect of BSS on bikeability indexes through the evaluation of the availability of BSS [18,20], spatial coverage of the BSS service, and the lack of available bicycles or docks in public, rental stations [20].
3.1.2. Accessibility
The domain of accessibility encompasses criteria related to aspects of land use and network features inherent to origins and destinations of cycling journeys. In the following paragraphs, the main characteristics of these criteria will be explored. Table 4 presents the set of indicators that characterize and evaluate each of the criteria in this domain, and identifies the type of indicator as objective or subjective.
- Land use: Under the domain of accessibility, this criterion is approached both objectively and subjectively, focusing on the origins [2,13,19] and destinations [7,9,15,16,19,20]. The relationship between land use and transport began in the second half of the 20th century [73]. Regarding cycling, mixed land use is recognised as important to promote and encourage this mode of transport [15,19,74], since mixed-use is related to a broader diversity of living activities that potentially reduces the distances between origins and destinations of the utilitarian journeys, becoming more suitable for bicycle use [75]. To assess these criteria indicators are used related to the types of activities and land uses, O/D distances, densities, and trip generation. Densities usually refer to populations, destinations, or homes; although they are related, those density concepts are distinct: the first is a social measure, while the last two are land-use measures [2]. The reference area to assess densities varies according to the type of research [15], namely in terms of the scale of analysis; thus, the demand (frequency of bicycle use) should be carefully inferred for different urban contexts (e.g., types of activities and land uses) [13]. Intensity of the activities in destinations can be defined by the number of existing destinations in catchment area [9] or by the relevance of the existing facilities in destinations expressed through the number of employees and the floor area [7].
- Network features: The second criterion of the accessibility domain is related to the basic planning requirements for cycle networks [68], except for the safety issue that was addressed in a specific dimension. Access to cycle infrastructures is strongly related to the use of bicycles; therefore, there is a certain propensity among cyclists to make changes to their potential routes in order to take advantage of these infrastructures [76]. However, there is a need for constant changes in the direction caused by elements such as sharp bends and deviations, negatively affect cycling trips [12]. Access and deviations are, respectively, examples of the influence of cohesion and directness of a cycle network. While the first requirement covers the connection between origins and destinations and the distance from the network mesh, the second one focuses on movements in terms of space and time, seeking to minimize them [68]. The distribution of cycle infrastructures in the urban network is addressed by objective bikeability indicators related to the various types of densities [15,20] to evaluate network cohesion. The degree of connectivity of the cycle network is approached by an indicator that assesses if a node has links with cycle infrastructures [15,16], which is extremely relevant for regular commuting [74] for assessing network directness. Although less usual, cohesion and directness can also be assessed subjectively, as performed by Wahlgren and Schantz (2011) [12], who used the indicator “course of the route” in order to assess the permeability of the urban environment for bicycles provided by the cycle network. Another approach to assess this criterion is through indicators related to space syntax [13], which consider the layout of the urban network, in terms of directness and connectivity, as a significant inducer of bicycle traffic flows. Spatial syntax models the relationship between the properties of the network environment and the physical and cognitive abilities of cyclists [77].
3.1.3. Safety
The domain of safety comprises aspects of the relationship between the cycle infrastructures conditions (physical and functional characteristics) and the different types of traffic, as well as the interaction of cycling with other modes of transport. This domain comprises the traffic, segregation, conflicts, and behavior criteria. In the following paragraphs, the main characteristics of these criteria will be explored. Table 5 presents the set of objective and subjective indicators that characterize and evaluate each of the criteria in this domain
- Traffic: The objective indicators used in bikeability indexes that make up the “traffic” criterion are related to the volume of traffic [7,10,20], the speed limit [10,17], the traffic composition [7], and the speed of motor vehicles [7,18], as well as more complex and structured indicators such as level of traffic streets—LTS [78] and the bicycle level of service—BLoS [79]. This criterion, although much less frequently, can also be portrayed through subjective indicators such as how cyclists perceived congestion and delays caused by traffic conditions (e.g., traffic lights) [12,20].
- Segregation: According to CROW (2007), bicycles can share and coexist with motor vehicles when the traffic conditions (e.g., homogeneity of the types of vehicles and a speed limit of 30 km/h) are guaranteed; otherwise, there is a need to segregate bicycle traffic [68]. Thus, the level of segregation is defined by objective indicators such as the existence of infrastructure [15,20], the degree of separation provided by different types of cycle infrastructures [13], and the extent (e.g., length) of segregated infrastructure [8]. Segregation can also be addressed concerning pedestrians [13], as in some cases, cyclists can use pedestrian infrastructure; thus, it is an indicator that identifies the type of separation from pedestrian (e.g., furniture, vegetation, height difference, and different surfaces). Regarding subjective indicators, they are intended to capture cyclist’s perception of how segregated and safe the cycle route is [12].
- Conflicts: This criterion is objectively addressed in bikeability indexes by indicators related to the interaction of cycling with infrastructures dedicated to other modes of transport and other living activities. Indicators such as car parking, bus stops, and entrances along the segment of the cycle network are identified as potential points of conflict with other activities, influencing cycle traffic conditions, namely the speed and flow of bicycles [13]. Subjectively, the indicators are extracted through surveys, which addressed questions to measure the general cyclists’ perception in relation to conflicts with motorized traffic [16,20], of the relationships between cyclists and other soft users [12], or more specific to the automobile [14].
- Behavior: According to the literature, these criteria of the safety domain refer to indicators that reflect the behavior adopted by cyclists and drivers, the perception of danger and risk, and the local enforcement activity. In the selected works, these criteria were addressed only through subjective indicators, and only Eliou et al. (2009) [14] specifically considered cyclists’ attitudes towards their safety, while Lin and Wei (2018) [20] and Ma and Dill (2017) [16] use bike safety design and enforcement attractiveness to evaluate these criteria.
3.1.4. Surrounding Environment
The domain of the surrounding environment comprises the physical aspects of the environment in the influence area of the cycle infrastructure that affect the choice for using the bicycle as mode of transport and the possible routes for cycling. This dimension integrates the following criteria topography, green and water features, aesthetics, and pollution (air quality and noise). In the following paragraphs, the main characteristics of these criteria will be explored. Table 6 presents the set of objective and subjective indicators that characterize and evaluate each of the criteria.
- Topography: This criterion is one of the most influential factors for the route choice for cyclists [10,15]. Topography can have a negative impact on the cyclist visibility of the route, as well as on the cyclists’ physical effort for transposing ascending stretches [20], or for safety reasons due to developing high speeds in situations of long descending stretches [13]. The indicators used to assess this criterion are usually the slope/gradient [8,13,15,16], which can be collected in the field or from existing databases [20], determined and presented in a geographic information system [13,15].
- Landscape Aesthetics (green and aquatic features): The aesthetic conditions of the surrounding environment refer mainly to the landscape elements that influence people’s willingness and well-being [12]. The presence of green areas and aquatic elements (water bodies) makes the cycling experience more pleasant, and therefore favors the use of this mode, especially in a recreational way [8,18]. More important than encouraging the recreational use of bicycles, these areas favor the synergy between components of the built form and accessibility, with a strong positive correlation between cycling and the existence of green parks [2]. Another example of the relevance of this criterion is the existence of specific considerations improving green spaces to enhance bikeability [20]. From the perspective of the route, this criterion is positively related to cycling, because the shade of the trees softens the thermal conditions [10,20]. Therefore, the objective indicators associated with this criterion can be related to a specific route or a certain area. Regarding the route, the criterion can be measured by the ratio between the number of trees and the length of the street, or by the percentage of vegetation in a specific width buffer (e.g., 1.5 km) [2]. Regarding the area, this can be addressed by the ratio between the green area and the study area [8,20], and the ratio of the number of green and aquatic features within a study area [2,18]. Subjectively, this criterion is addressed in survey type by Wahlgren and Schantz (2011) [12] considering two indicators: “availability of greenery”, which refers specifically to landscape aesthetics, and “ugly or beautiful”, whose intention is to capture a composite aesthetic perception from other sources.
- Pollution (Air quality and Noise): The last criterion refers to the situation of cyclists’ exposure to pollution, especially in urban environments, where one of the main sources are the motorized vehicles that circulate close to or share roads with bicycles [80]. Thus, the health benefits resulting from using bicycles may not offset the impacts of cyclists’ exposure to air pollution and noise related to traffic. Although travel time and traffic volume are still a major concern for cyclists, they are willing to consider detours that increase the duration of the trip to avoid exposure to pollution [81,82]. The consideration of indicators that identify the environmental pollution conditions can help in planning and promote cycling. However, these are factors rarely integrated or emphasized in the bikeability indexes. Among the 137 indicators, only three indicators relating to air quality were identified, two of them based on the perception of cyclists [12,20]. Only Porter et al. (2019) [2] incorporated an objective indicator, related to the ozone level. A similar situation occurs with noise, since only Wahlgren and Schantz (2011) [12] used a subjective indicator to include this condition, also based on the cyclist’s perception.
3.2. Bikeability-Related Methods
There are three basic categories of methodologies for collecting data when the aim is to assess the level of bikeability in the cycle network and in the entire urban area. The first category consists of self-responsive interviews or questionnaires by cyclists or citizens [12]. The second category comprises the systematic observation or audit to objectively quantify the attributes of the urban environment and the traffic conditions that cyclists are subject to. Typically, these attributes require on-site observation, use of imaging, and/or georeferencing equipment to collect data. The stretch of a street is the typical observation unit. Since it is not possible to audit large areas, it is necessary to select a sample of street sections representative of the study areas [13,14]. The third category is the use of available data and information from official sources, e.g., population density, land use and occupation, road networks, among others [8,15]. The indicators to be used to define bikeability are sometimes limited by the collection methods and data available for the analysis area [9].
Most of the bikeability assessment methods in the literature are based on aspects related to locations and facilities. Location-based methods consider the ease of reaching destinations from a location, by applying various accessibility indicators. Facility-based methods focus on the suitability of a cycling facility and use indicators to measure levels of comfort, safety, and attractiveness of a route or area [20].
In location-based methods, two ways are used to assess bikeability, distance-based and gravity-based. The distance-based method considers the accessibility to the different destinations, taking into account the pre-established values of the distances, which can be characterized by the distance/time in a straight line (Euclidian) or by the distance measured taking into account the network configuration (routes). In the gravity-based methods, the measures are based on the cycling destination attractiveness potential, considering the impedance to reach the desired destination by adopting the gravitational method [19]. The Hansen model [73] is still used to calculate the level of bikeability, based on the importance and respective impedance function associated with the distance/time to the destination, and the importance of the destination can be weighted with equal weight [19], or by different weights [7].
Facility-based methodologies are generally applied in two spatial contexts: in a route (OD) or in an area. Generally, space syntax analyses are applied to assess network connectivity to assess the level of network bikeability [13]. On the other hand, the analysis of the level of service based on the indicators related to cycle infrastructure also evaluates the quality and comfort of a cycle network segment and the respective level of bikeability.
From the selected works, the use of methodologies for the development, application and validation of the different bikeability indexes was observed. In this context, two decision support models were used, multicriteria and multiobjective, which defined the set of criteria and respective indicators. Statistical techniques were observed for the selection of the most significant indicators and for the respective mathematical formulation of the bikeability index.
Regarding decision support models, it is possible to determine that multicriteria methods are the most used [7,17,20]. A similar situation occurs with the application of statistical techniques, where the most used works to determine the value of the bikeability index are the additive models, which corresponds to the sum of the indicators weighted by a given weight [2,8,9,10,15,16].
The most used technique for assessing the influence or importance of an indicator on the bikeability value is the regression analysis [8,12,13,16]. This can also be done by other techniques such as cluster analysis [16] and exploratory factor analysis [2].
In addition, it was also possible to find a set of methodologies applied to certain specific contexts to define and contribute to the development of bikeability indexes, such as a focus group [15,20], generalized entropy measures [18], and spatial syntax analysis [13].
The results of the bikeability indexes are presented predominantly in the form of a numerical value [12,14,20] and/or graph [15,17,18]. A GIS is a useful technique for visualizing the variation of the index in the cycle network or in the study areas. Table 7 presents a summary of the models, methods, and techniques used in the studies selected to determine the bikeability index.
4. Discussion
From the analyzed works, it was observed that the bikeability indexes are mainly centered on the domain of the cycle infrastructure, followed by the domains of accessibility and safety. In fact, these three domains are always associated with the characterization, study, and evaluation of the bicycle usage for several purposes, involving or not the development of bikeability indexes.
On the other hand, it is possible to observe that studies on the bikeability index rarely integrate environmental, health, and technological innovation issues. There are several studies that show the influence of pollution and environmental noise on cyclists’ health, especially for commuting purposes [80,81,82], which should be included in new bikeability indexes.
Another relevant issue is related to parking facilities. On bikeability indexes, bicycle parking is a relatively underused criterion, despite being considered a fundamental cycling facility, since its location should cover all the demand needs and therefore be close to the main origins and destinations, such as city points of interests and transit hubs [72]. Although the availability of bicycle parking and other end-of-trip facilities is a relevant aspect for regular use of bicycles, especially in a multimodal context journey, it was only slightly used by Lin and Wei [20] as density indicator in a bikeability index. In this context, a more comprehensive bikeability index must integrate bicycle parking criterion through the following set of indicators: location, availability, and quantity of parking spaces, as well as parking features related to the suitability to the land use and cyclists trip purposes, e.g., short-term parking facilities (i.e., any type of free-standing rack) and long-term (i.e., a bicycle storage locker, or shed, with restricted access and with a fee) [71].
Moreover, the literature shows that bikeability indicators in the domain of technological innovations have not been properly used to assess the network potential for cycling, e.g., the reduced use of information regarding BSS and E-BSS, which were only considered in two studies to evaluate the availability of this systems [18,20] and the bicycles at dock stations [20], and the benefits associated with electric assistance on bicycles that were not considered in any of the selected works in this review.
In relation to the BSS, it can be concluded that the benefits of the system to improve the conditions of bicycle use can be defined through a vast set of indicators, such as the number, distance, coverage area of the BSS stations and/or E-BSS, integration with other modes of transport, and the type and quantity of digital solutions associated with the service, among others [6,18,20,83].
According to the technology and infrastructure developments in BSS, the different generations of BSS, i.e., the principal physical and operational characteristics, must also be integrated in new bikeability indexes. In this context, it can be highlighted that the fifth BSS generation that is characterized by free-float (dockless) systems has to deal with new performance issues like the rebalancing operation of bicycles, i.e., frequency and intensity of bicycle removal or refill operations at stations, which is strongly related to the production and attraction of trips due to infrastructure and land use contexts [84], as well as parking issues associated with the impact mitigation of the parking of bicycles in undesired places [85], which would generate a set of indicators related to the quality of service provided by the system and consequently to bikeability. Furthermore, a broader set of BSS performance indicators could also be considered in new bikeability indexes, such as the number of users, costs, e.g., bike-sharing compared to public transportation, market practices among BSS operators, or parking [61].
Regardless of if the system is shared or not, it was also observed that the technological development at the bicycles has not been considered in bikeability indexes, particularly the electric bicycles. Thus, in the development of new bikeability indexes, it is necessary to analyze whether the benefits associated with electric assistance can be considered only by a set of indicators, or if this characteristic is sufficient to generate a specific index to differentiate the traditional (mechanic) in relation to electric bicycle, through a new index such as the “e-bikeability index”. Moreover, new indexes should integrate the dichotomy between conventional and electric bicycles and the quality and typology of service provided by the sharing systems in the technological domain, to be more adjusted to the actual current and future contexts of urban mobility,
The main methods used to formulate and develop the bikeability indexes are the multicriteria models, which aggregate and combine weights and variables based on statistical techniques through additive models [2,8,9,10,15,16] and logistic and linear regression models [8,12,13,16]. On the other hand, other methods are used for specific bikeability issues, such as the generalized entropy measures to assess the levels of inequality in access to transport by social issues [18]; space syntax analysis to integrate the cycle network characteristics, territory, and bicycle traffic flows to assess bikeability without explicit use of mathematical formulations [13]; and focus group techniques to integrate the participation of stakeholders in the process of developing the indexes [15,20], giving a qualitative character that in many cases makes it difficult to validate the results of the indexes. Although various methods are used, it should be noted that several studies [8,13,14,15] pointed out that the lack of data is a critical issue in the development of bikeability indexes, namely to ensure the levels of reliability of results and reproducibility of the indexes, making it necessary to adopt robust and advanced data collection techniques, such as digitization of cycling and infrastructures, and develop a systematic and regular surveying of the entire cycling system, in order to overcome these issues.
From the studied works, it can be observed that the validation process of the bikeability indexes was not developed, showing a possible future field of research that could be accomplish in future studies. In fact, it is understood that aspects related to bicycle trips, such as flows, distance/length, and frequency, are indicators that should be used in the index calibration and validation process. Once these indicators are associated with travel demand management strategies used to promote cycling [67], it can be assumed that the greater the demand in a segment of the cycle network, the higher the bikeability index. Moreover, it is important to emphasize that the validation process of bikeability indexes will have to integrate a greater variety of indicators that should preferably include indicators from the four domains considered in this work.
5. Conclusions
In recent years, there has been an increase in the importance of the bikeability concept, which is reflected in the significant number of researches in various areas of knowledge, especially in mobility and transports.
Safety, comfort, and efficiency of bicycle infrastructures and the level of accessibility to destinations are the most usual characteristics associated with the concept of bikeability. However, bikeability is assessed through indexes, which are usually developed according to the following structure: indicators, criteria, and domains. Indicators can be of two types, objective or subjective; objective indicators are the most used. In order to systematize the information collected from the selected works on bikeability indexes, 138 indicators can be identified, which are divided into 17 criteria and subdivided into four main domains (cycle infrastructure, safety, accessibility, and surrounding environment) that characterize the concept of bikeability.
Regarding the methods used to develop bikeability indexes, there was a predominance of the use of multicriteria models, which aggregate and combine weights and variables, based on additive models and linear and logistic regressions.
From the analysis of the bikeability indexes structure, five key issues were identified for the development of more adjusted, comprehensive, and holistic indexes: (1) the lack of indicators related to exposure to air pollution and noise; (2) the scarce number of indicators related to bicycle sharing systems; (3) the need for integrating electric bicycles into the bikeability indexes; (4) the possibility of using indicators that characterize the contribution of digital platforms to support the use of bicycles in increasing the level of bikeability; and (5) the need to define processes and methodologies for calibrating and validating indexes.
Finally, it should be noted that bikeability indexes are an important tool in cycle network planning processes and also for defining strategies to promote the use of bicycles, especially in urban areas, since they allow the identification of disconnections and lack of coherence of conditions and quality offered to cyclists throughout the different segments of the network and in an aggregated manner in different areas of urban environments. On the other hand, by deconstructing and analyzing the bikeability indexes, considering the four domains, it can be identified which of them perform better or worse. This allows the definition of a strategy better oriented to improving cycle networks, and therefore promoting more sustainable mobility patterns.
Author Contributions
Conceptualization: U.N.C. and P.J.G.R.; methodology: U.N.C. and P.J.G.R.; investigation: U.N.C. and P.J.G.R.; writing—original draft preparation: U.N.C. and P.J.G.R.; writing—review and editing: U.N.C. and P.J.G.R. All authors have read and agreed to the published version of the manuscript.
Funding
This research received no external funding.
Conflicts of Interest
The authors declare no conflict of interest.
References
- Werner, C.; Resch, B.; Loidl, M. Evaluating Urban Bicycle Infrastructures through Intersubjectivity of Stress Sensations Derived from Physiological Measurements. ISPRS Int. J. Geo-Inf. 2019, 8, 265. [Google Scholar] [CrossRef] [Green Version]
- Porter, K.; Kohl, H.W.; Pérez, A.; Reininger, B.; Pettee Gabriel, K.; Salvo, D. Bikeability: Assessing the Objectively Measured Environment in Relation to Recreation and Transportation Bicycling. Environ. Behav. 2020, 52, 861–894. [Google Scholar] [CrossRef]
- Fishman, E.; Washington, S.; Haworth, N. Bike Share: A Synthesis of the Literature. Transp. Rev. 2013, 33, 148–165. [Google Scholar] [CrossRef] [Green Version]
- UN. Transforming Our World: The 2030 Agenda for Sustainable Development; Department of Economic and Social Affairs: New York, NY, USA, 2016. [Google Scholar]
- E.C.F. Cycling Delivers on the Global Goals; European Cyclistis’ Federation: Brussels, Belgium, 2015; p. 8. [Google Scholar]
- Meireles, M.; Ribeiro, P.J.G. Digital platform/mobile app to boost cycling for the promotion of sustainable mobility in mid-sized starter cycling cities. Sustainability 2020, 12, 5. [Google Scholar] [CrossRef] [Green Version]
- Lowry, M.; Callister, D.; Gresham, M.; Moore, B. Assessment of communitywide bikeability with bicycle level of service. Transp. Res. Rec. 2012, 2314, 41–48. [Google Scholar] [CrossRef]
- Krenn, P.J.; Oja, P.; Titze, S. Development of a Bikeability Index to Assess the Bicycle-Friendliness of Urban Environments. Open J. Civ. Eng. 2015, 5, 451–459. [Google Scholar] [CrossRef] [Green Version]
- Saghapour, T.; Moridpour, S.; Thompson, R.G. Measuring cycling accessibility in metropolitan areas. Int. J. Sustain. Transp. 2017, 11, 381–394. [Google Scholar] [CrossRef]
- Grigore, E.; Garrick, N.; Fuhrer, R.; Axhausen, I.K.W. Bikeability in Basel. Transp. Res. Rec. 2019, 2673, 607–617. [Google Scholar] [CrossRef]
- Vale, D.S.; Saraiva, M.; Pereira, M. Active accessibility: A review of operational measures of walking and cycling accessibility. J. Transp. Land Use 2016, 9, 209–235. [Google Scholar] [CrossRef]
- Wahlgren, L.; Schantz, P. Bikeability and methodological issues using the active commuting route environment scale (ACRES) in a metropolitan setting. BMC Med. Res. Methodol. 2011, 11, 1–20. [Google Scholar] [CrossRef] [PubMed] [Green Version]
- Manum, B.; Nordström, T.; Gil, J.; Nilsson, L.; Marcus, L. Modelling bikeability, Space syntax based measures applied in examining speeds and flows of bicycling in Gothenburg. In Proceedings of the 11th International Space Syntax Symposium, SSS 2017, Lisbon, Portugal, 3–7 July 2017; pp. 3–7. [Google Scholar]
- Eliou, N.; Galanis, A.; Proios, A. Evaluation of the bikeability of a Greek city: Case study ‘City of Volos’. WSEAS Trans. Environ. Dev. 2009, 5, 545–555. [Google Scholar]
- Winters, M.; Brauer, M.; Setton, E.M.; Teschke, K. Mapping bikeability: A spatial tool to support sustainable travel. Environ. Plan. B Plan. Des. 2013, 40, 865–883. [Google Scholar] [CrossRef]
- Ma, L.; Dill, J. Do people’s perceptions of neighborhood bikeability match ‘reality’? J. Transp. Land Use 2017, 10, 291–308. [Google Scholar] [CrossRef] [Green Version]
- Gholamialam, A.; Matisziw, T.C. Modeling Bikeability of Urban Systems. Geogr. Anal. 2019, 51, 73–89. [Google Scholar] [CrossRef]
- Hamidi, Z.; Camporeale, R.; Caggiani, L. Inequalities in access to bike-and-ride opportunities: Findings for the city of Malmö. Transp. Res. Part A Policy Pract. 2019, 130, 673–688. [Google Scholar] [CrossRef]
- McNeil, N. Bikeability and the 20-min neighborhood: How infrastructure and destinations influence bicycle accessibility. Transp. Res. Rec. 2011, 2247, 53–63. [Google Scholar] [CrossRef]
- Lin, J.J.; Wei, Y.H. Assessing area-wide bikeability: A grey analytic network process. Transp. Res. Part A Policy Pract. 2018, 113, 381–396. [Google Scholar] [CrossRef]
- The Biekability Trust. Available online: https://bikeabilitytrust.org/ (accessed on 15 November 2019).
- Fishman, E.; Cherry, C. E-bikes in the Mainstream: Reviewing a Decade of Research. Transp. Rev. 2016, 36, 72–91. [Google Scholar] [CrossRef]
- Behrendt, F. Why cycling matters for electric mobility: Towards diverse, active and sustainable e-mobilities. Mobilities 2018, 13, 64–80. [Google Scholar] [CrossRef]
- Astegiano, P.; Tampère, C.M.J.; Beckx, C. A preliminary analysis over the factors related with the possession of an electric bike. Transp. Res. Procedia 2015, 10, 393–402. [Google Scholar] [CrossRef]
- Jones, T.; Harms, L.; Heinen, E. Motives, perceptions and experiences of electric bicycle owners and implications for health, wellbeing and mobility. J. Transp. Geogr. 2016, 53, 41–49. [Google Scholar] [CrossRef] [Green Version]
- Plazier, P.A.; Weitkamp, G.; van den Berg, A.E. ‘Cycling was never so easy!’ An analysis of e-bike commuters’ motives, travel behaviour and experiences using GPS-tracking and interviews. J. Transp. Geogr. 2017, 65, 25–34. [Google Scholar] [CrossRef] [Green Version]
- Fyhri, A.; Heinen, E.; Fearnley, N.; Sundfør, H.B. A push to cycling—Exploring the e-bike’s role in overcoming barriers to bicycle use with a survey and an intervention study. Int. J. Sustain. Transp. 2017, 11, 681–695. [Google Scholar] [CrossRef]
- Lin, X.; Wells, P.; Sovacool, B.K. Benign mobility? Electric bicycles, sustainable transport consumption behaviour and socio-technical transitions in Nanjing, China. Transp. Res. Part A Policy Pract. 2017, 103, 223–234. [Google Scholar] [CrossRef] [Green Version]
- Lee, A.; Molin, E.; Maat, K.; Sierzchula, W. Electric Bicycle Use and Mode Choice in the Netherlands. Transp. Res. Rec. J. Transp. Res. Board 2015, 2520, 1–7. [Google Scholar] [CrossRef]
- Huertas-Leyva, P.; Dozza, M.; Baldanzini, N. Investigating cycling kinematics and braking maneuvers in the real world: E-bikes make cyclists move faster, brake harder, and experience new conflicts. Transp. Res. Part F Traffic Psychol. Behav. 2018, 54, 211–222. [Google Scholar] [CrossRef]
- Dozza, M.; Bianchi Piccinini, G.F.; Werneke, J. Using naturalistic data to assess e-cyclist behavior. Transp. Res. Part F Traffic Psychol. Behav. 2016, 41, 217–226. [Google Scholar] [CrossRef] [Green Version]
- Hiselius, L.W.; Svensson, A. E-bike use in Sweden—CO2 effects due to modal change and municipal promotion strategies. J. Clean. Prod. 2017, 141, 818–824. [Google Scholar] [CrossRef]
- Romanillos, G.; Moya-Gómez, B.; Zaltz-Austwick, M.; Lamíquiz-Daudén, P.J. The pulse of the cycling city: Visualising Madrid bike share system GPS routes and cycling flow. J. Maps 2018, 14, 34–43. [Google Scholar] [CrossRef]
- Guidon, S.; Becker, H.; Dediu, H.; Axhausen, K.W. Electric Bicycle-Sharing: A New Competitor in the Urban Transportation Market? An Empirical Analysis of Transaction Data. Transp. Res. Rec. 2019, 2673, 15–26. [Google Scholar] [CrossRef]
- Jittrapirom, P.; Caiati, V.; Feneri, A.-M.; Ebrahimigharehbaghi, S.; González, M.J.A.; Narayan, J. Mobility as a Service: A Critical Review of Definitions, Assessments of Schemes, and Key Challenges. Urban Plan. 2017, 2, 13. [Google Scholar] [CrossRef] [Green Version]
- Wolf, A.; Seebauer, S. Technology adoption of electric bicycles: A survey among early adopters. Transp. Res. Part A Policy Pract. 2014, 69, 196–211. [Google Scholar] [CrossRef]
- Schepers, J.P.; Fishman, E.; Den Hertog, P.; Wolt, K.K.; Schwab, A.L. The safety of electrically assisted bicycles compared to classic bicycles. Accid. Anal. Prev. 2014, 73, 174–180. [Google Scholar] [CrossRef] [PubMed]
- Fishman, E. Bikeshare: A Review of Recent Literature. Transp. Rev. 2016, 36, 92–113. [Google Scholar] [CrossRef]
- Woodcock, J.; Tainio, M.; Cheshire, J.; O’Brien, O.; Goodman, A. Health effects of the London bicycle sharing system: Health impact modelling study. BMJ 2014, 348, 1–14. [Google Scholar] [CrossRef] [Green Version]
- Otero, M.J. Nieuwenhuijsen, and D. Rojas-Rueda, Health impacts of bike sharing systems in Europe. Environ. Int. 2018, 115, 387–394. [Google Scholar] [CrossRef]
- Winslow, J.; Mont, O. Bicycle sharing: Sustainable value creation and institutionalisation strategies in Barcelona. Sustainability 2019, 11, 3. [Google Scholar] [CrossRef] [Green Version]
- DeMaio, P. Bike-sharing: History, Impacts, Models of Provision, and Future. J. Public Transp. 2019, 12, 41–56. [Google Scholar] [CrossRef]
- Shaheen, S.; Guzman, S.; Zhang, H. Bikesharing in Europe, the Americas, and Asia. Transp. Res. Rec. J. Transp. Res. Board 2010, 2143, 159–167. [Google Scholar] [CrossRef] [Green Version]
- Wang, M.; Zhou, X. Bike-sharing systems and congestion: Evidence from US cities. J. Transp. Geogr. 2017, 65, 147–154. [Google Scholar] [CrossRef]
- Hamilton, T.L.; Wichman, C.J. Bicycle infrastructure and traffic congestion: Evidence from DC’s Capital Bikeshare. J. Environ. Econ. Manag. 2018, 87, 72–93. [Google Scholar] [CrossRef]
- Jensen, P.; Rouquier, J.B.; Ovtracht, N.; Robardet, C. Characterizing the speed and paths of shared bicycle use in Lyon. Transp. Res. Part D Transp. Environ. 2010, 15, 522–524. [Google Scholar] [CrossRef] [Green Version]
- Faghih-Imani, A.; Anowar, S.; Miller, E.J.; Eluru, N. Hail a cab or ride a bike? A travel time comparison of taxi and bicycle-sharing systems in New York City. Transp. Res. Part A Policy Pract. 2017, 101, 11–21. [Google Scholar] [CrossRef]
- Mora, R.; Moran, P. Public bike sharing programs under the prism of urban planning officials: The case of santiago de Chile. Appl. Sci. 2020, 12, 5720. [Google Scholar] [CrossRef]
- Jäppinen, S.; Toivonen, T.; Salonen, M. Modelling the potential effect of shared bicycles on public transport travel times in Greater Helsinki: An open data approach. Appl. Geogr. 2013, 43, 13–24. [Google Scholar] [CrossRef]
- Shaheen, S.; Martin, E.; Cohen, A. Public Bikesharing and Modal Shift Behavior: A Comparative Study of Early Bikesharing Systems in North America. Int. J. Transp. 2013, 1, 35–54. [Google Scholar] [CrossRef]
- Martin, E.W.; Shaheen, S.A. Evaluating public transit modal shift dynamics in response to bikesharing: A tale of two U.S. cities. J. Transp. Geogr. 2014, 41, 315–324. [Google Scholar] [CrossRef] [Green Version]
- El-Geneidy, A.; van Lierop, D.; Wasfi, R. Do people value bicycle sharing? A multilevel longitudinal analysis capturing the impact of bicycle sharing on residential sales in Montreal, Canada. Transp. Policy 2016, 51, 174–181. [Google Scholar] [CrossRef]
- Campbell, A.; Cherry, C.R.; Ryerson, M.S.; Yang, X. Factors influencing the choice of shared bicycles and shared electric bikes in Beijing. Transp. Res. Part C Emerg. Technol. 2016, 67, 399–414. [Google Scholar] [CrossRef] [Green Version]
- Fishman, E.; Washington, S.; Haworth, N. Bike share’s impact on car use: Evidence from the United States, Great Britain, and Australia. Transp. Res. Part D Transp. Environ. 2014, 31, 13–20. [Google Scholar] [CrossRef] [Green Version]
- Murphy, E.; Usher, J. The Role of Bicycle-sharing in the City: Analysis of the Irish Experience. Int. J. Sustain. Transp. 2015, 9, 116–125. [Google Scholar] [CrossRef]
- Salmeron-Manzano, E.; Manzano-Agugliaro, F. The electric bicycle: Worldwide research trends. Energies 2018, 11, 1894. [Google Scholar] [CrossRef] [Green Version]
- Buck, D.; Buehler, R.; Happ, P.; Rawls, B.; Chung, P.; Borecki, N. Are bikeshare users different from regular cyclists? Transp. Res. Rec. 2013, 2387, 112–119. [Google Scholar] [CrossRef]
- Fuller, D.; Gauvin, L.; Kestens, Y.; Morency, P.; Drouin, L. The potential modal shift and health benefits of implementing a public bicycle share program in Montreal, Canada. Int. J. Behav. Nutr. Phys. Act. 2013, 10, 2–7. [Google Scholar] [CrossRef] [Green Version]
- Raux, D.; Zoubir, A.; Geyik, M. Who are bike sharing schemes members and do they travel differently? The case of Lyon’s ‘Velo’v’ scheme. Transp. Res. Part A Policy Pract. 2017, 106, 350–363. [Google Scholar] [CrossRef] [Green Version]
- Wielinski, G.; Trépanier, M.; Morency, C. Carsharing versus bikesharing: Comparing mobility behaviors. Transp. Res. Rec. 2017, 2650, 112–122. [Google Scholar] [CrossRef]
- Bieliński, T.; Kwapisz, A.; Wazna, A. Bike-sharing systems in Poland. Sustainability 2019, 11, 2458. [Google Scholar] [CrossRef] [Green Version]
- Moher, D.; Liberati, A.; Tetzlaff, J.; Altman, D.G. Preferred Reporting Items for Systematic Reviews and Meta-Analyses: The PRISMA Statement. PLoS Med. 2009, 6, e1000097. [Google Scholar] [CrossRef] [Green Version]
- Gonçalves, A.P.J.; Ribeiro, P.J.G. Resilience of urban transportation systems. Concept, characteristics, and methods. J. Transp. Geogr. 2020, 85, 102727. [Google Scholar] [CrossRef]
- Mongeon, P.; Paul-Hus, A. The journal coverage of Web of Science and Scopus: A comparative analysis. Scientometrics 2016, 106, 213–228. [Google Scholar] [CrossRef]
- Van Wee, B.; Banister, D. How to Write a Literature Review Paper? Transp. Rev. 2016, 36, 278–288. [Google Scholar]
- Ribeiro, P.J.G.; Pena Jardim Gonçalves, L.A. Urban resilience: A conceptual framework. Sustain. Cities Soc. 2019, 50, 101625. [Google Scholar] [CrossRef]
- Rybarczyk, G.; Gallagher, L. Measuring the potential for bicycling and walking at a metropolitan commuter university. J. Transp. Geogr. 2014, 39, 1–10. [Google Scholar] [CrossRef]
- Groot, R.D. Desing Manual for Bicycle Traffic; CROW: Ede, The Netherlands, 2007. [Google Scholar]
- Kager, R.; Bertolini, L.; Te Brömmelstroet, M. Characterisation of and reflections on the synergy of bicycles and public transport. Transp. Res. Part A Policy Pract. 2016, 85, 208–219. [Google Scholar] [CrossRef] [Green Version]
- Van der Spek, S.C.; Scheltema, N. The importance of bicycle parking management. Res. Transp. Bus. Manag. 2015, 15, 39–49. [Google Scholar] [CrossRef]
- Veillette, P.; Grisé, E.; El-Geneidy, A. Park ‘n’ Roll: Identifying and Prioritizing Locations for New Bicycle Parking in Québec City, Canada. Transp. Res. Rec. 2018, 2672, 73–82. [Google Scholar] [CrossRef] [Green Version]
- Fazio, M.; Giuffrida, N.; Le Pira, M.; Inturri, G.; Ignaccolo, M. Bike oriented development: Selecting locations for cycle stations through a spatial approach. Res. Transp. Bus. Manag. 2020, 100576. [Google Scholar] [CrossRef]
- Hansen, W.G. How Accessibility Shapes Land Use. J. Am. Plan. Assoc. 1959, 25, 73–76. [Google Scholar] [CrossRef]
- Cervero, R.; Sarmiento, O.L.; Jacoby, E.; Gomez, L.F.; Neiman, A. Influences of built environments on walking and cycling: Lessons from Bogotá. Int. J. Sustain. Transp. 2009, 3, 203–226. [Google Scholar] [CrossRef]
- Zhao, P. The Impact of the Built Environment on Bicycle Commuting: Evidence from Beijing. Urban Stud. 2014, 51, 1019–1037. [Google Scholar] [CrossRef]
- Zhao, C.; Carstensen, T.A.; Nielsen, T.A.S.; Olafsson, A.S. Bicycle-friendly infrastructure planning in Beijing and Copenhagen—between adapting design solutions and learning local planning cultures. J. Transp. Geogr. 2018, 68, 149–159. [Google Scholar] [CrossRef]
- Marcus, L. Ecological space and cognitive geometry: Linking humans and environment in space syntax theory. In Proceedings of the SSS 2015—10th International Space Syntax Symposium, London, UK, 13–17 July 2015. [Google Scholar]
- Mekuria, C.; Furth, P.G.; Nixon, H. Loss-Stress Bicycling and Network Connectivity; MTI: San José, CA, USA, 2012. [Google Scholar]
- T.R.B. Highway Capacity Manua; Transportation Research Board: Washington, DC, USA, 2010. [Google Scholar]
- Arsenio, E.; Ribeiro, P. The economic assessment of health benefits of active transport. Transp. Sustain. 2015, 7, 1–22. [Google Scholar]
- Anowar, S.; Eluru, N.; Hatzopoulou, M. Quantifying the value of a clean ride: How far would you bicycle to avoid exposure to traffic-related air pollution? Transp. Res. Part A Policy Pract. 2017, 105, 66–78. [Google Scholar] [CrossRef]
- Ribeiro, P.; Mendes, J.F.G. Healthy routes for active modes in school journeys. Int. J. Sustain. Dev. Plan. 2013, 8, 591–602. [Google Scholar] [CrossRef] [Green Version]
- Czech, P.; Turoń, K.; Urbańczyk, R. Bike-sharing as an element of integrated Urban transport system. Adv. Intell. Syst. Comput. 2018, 631, 103–111. [Google Scholar]
- Faghih-Imani, A.; Hampshire, R.; Marla, L.; Eluru, N. An empirical analysis of bike sharing usage and rebalancing: Evidence from Barcelona and Seville. Transp. Res. Part A Policy Pract. 2017, 97, 177–191. [Google Scholar] [CrossRef]
- Chen, F.; Turoń, K.; Kłos, M.; Czech, P.; Pamuła, W.; Sierpiński, G. Fifth Generation of Bike-Sharing Systems—Examples of Poland and China. Sci. J. Sil. Univ. 2020. [Google Scholar] [CrossRef]
Figure 1.
Conceptual structure of bikeability definitions.

Figure 2.
Bikeability query-related documents by year (source: Scopus, Web of Science, and Google Scholar).
Figure 2.
Bikeability query-related documents by year (source: Scopus, Web of Science, and Google Scholar).

Figure 3.
Methodological flowchart.


Table 1.
Terms used in Web of Science (WoS) and Scopus queries.
| Query | WoS | Scopus |
|---|---|---|
| (“bicycl*”) AND (“leve* of service*” OR “level-of-service”) | 97 | 110 |
| (“bicycl*”) AND (“criteria$ of evaluation” OR “evaluation criteria$”) | 25 | 22 |
| (“bikeability”) | 71 | 74 |
| (“bikeability”) AND (“index*”) | 14 | 16 |
| ‘(“bikeability”) AND (“index*”) AND (“bicycle sharing systems” OR “shared bicycles”) | 2 | 0 |
| (“bikeability”) AND (“index*”) AND (“e-bike” OR “electrical bicycles”) | 0 | 1 |
| (“bikeability”) AND (“index*”) AND (“e-bike” OR “electrical bicycles”) AND (“bicycle sharing systems” OR “shared bicycles”) | 0 | 0 |
Table 2.
Main criteria used in bikeability indexes.
| DOMAIN | CRITERIA | Gholamialam and Matisziw (2019) | Grigore et al. (2019) | Hamidi et al. (2019) | Porter et al. (2019) | Lin and Wei (2018) | Manum et al. (2017) | Saghapour et al. (2017) | Ma and Dill (2016) | Krenn et al. (2015) | Winters et al. (2013) | Lowry et al. (2012) | McNeil (2011) | Wahlgren and Schantz (2011) | Eliou et al. (2009) |
|---|---|---|---|---|---|---|---|---|---|---|---|---|---|---|---|
| Cycle Infrastructure | Availability | ✓ | ✓ | ✓ | ✓ | ✓ | |||||||||
| Quantity | ✓ | ✓ | ✓ | ✓ | ✓ | ✓ | ✓ | ||||||||
| Typology | ✓ | ✓ | ✓ | ||||||||||||
| Geometric design features (layout and cross sections) | ✓ | ✓ | ✓ | ✓ | ✓ | ✓ | ✓ | ✓ | |||||||
| Multimodal features (Interface and parking) | ✓ | ✓ | ✓ | ||||||||||||
| Bicycle Sharing System | ✓ | ✓ | |||||||||||||
| Quality of cycle infrastructure | ✓ | ✓ | ✓ | ||||||||||||
| Accessibility | Land Use | ✓ | ✓ | ✓ | ✓ | ✓ | ✓ | ✓ | ✓ | ||||||
| Network features | ✓ | ✓ | ✓ | ✓ | ✓ | ||||||||||
| Safety | Traffic | ✓ | ✓ | ✓ | ✓ | ✓ | ✓ | ✓ | ✓ | ||||||
| Segregation | ✓ | ✓ | ✓ | ✓ | ✓ | ||||||||||
| Conflicts | ✓ | ✓ | ✓ | ✓ | ✓ | ||||||||||
| Behavior | ✓ | ✓ | ✓ | ||||||||||||
| Surrounding Environment | Topography | ✓ | ✓ | ✓ | ✓ | ✓ | ✓ | ✓ | ✓ | ||||||
| Landscape Aesthetics (green and aquatic features) | ✓ | ✓ | ✓ | ✓ | ✓ | ✓ | |||||||||
| Pollution (Air quality and Noise) | ✓ | ✓ | ✓ |
✓—Identified in the work.
Table 3.
List of indicators by criterion for the Cycle Infrastructure domain.
| Gholamialam and Matisziw (2019) | Grigore et al. (2019) | Hamidi et al. (2019) | Porter et al. (2019) | Lin and Wei (2018) | Manum et al. (2017) | Saghapour et al. (2017) | Ma and Dill (2016) | Krenn et al. (2015) | Winters et al. (2013) | Lowry et al. (2012) | McNeil (2011) | Wahlgren and Schantz (2011) | Eliou et al. (2009) | ||
|---|---|---|---|---|---|---|---|---|---|---|---|---|---|---|---|
| Availability | Presence of bicycle infrastructure or similar indicator | o | o | o | o | s | |||||||||
| Quantity | Effective length (OD) | o | |||||||||||||
| Length of segment or similar indicator | o | o | o | ||||||||||||
| Length of bicycle path within the zone/route or similar indicator | o | o | o | ||||||||||||
| Segment connected junctions | o | ||||||||||||||
| Typology | Type of cycle infrastructure | o | o | o | |||||||||||
| Geometric design features (layout and cross sections) | Number of lanes or similar indicators | o | o | o | |||||||||||
| Presence of curb | o | ||||||||||||||
| Presence of traffic lights and stop signs | o | s | |||||||||||||
| Width (bicycle lane, sidewalk, shoulder, outside lane) | o | o | o | ||||||||||||
| Horizontal alignment (radius) | o | ||||||||||||||
| Intersection design | o | ||||||||||||||
| Night lighting | o | ||||||||||||||
| Surface type/condition | s | o | o | o | s | ||||||||||
| Multimodal features | Biking parking spots around transport hub | o | |||||||||||||
| Transit service or similar indicator | o | o | |||||||||||||
| Bicycle parking | Bike parking space density | o | |||||||||||||
| Bicycle sharing system | Presence of a BSS | o | o | ||||||||||||
| Public bike unavailability | o | ||||||||||||||
| Quality of cycling infrastructure | Easy use of bicycle | s | s | s |
o—objective indicator(s); s—subjective indicator(s).
Table 4.
List of indicators by criterion for the accessibility domain.
| Gholamialam and Matisziw (2019) | Grigore et al. (2019) | Hamidi et al. (2019) | Porter et al. (2019) | Lin and Wei (2018) | Manum et al. (2017) | Saghapour et al. (2017) | Ma and Dill (2016) | Krenn et al. (2015) | Winters et al. (2013) | Lowry et al. (2012) | McNeil (2011) | Wahlgren and Schantz (2011) | Eliou et al. (2009) | ||
|---|---|---|---|---|---|---|---|---|---|---|---|---|---|---|---|
| Land use | Type of activities or similar indicator | o | o | ||||||||||||
| Mixed land use | o | o | o | ||||||||||||
| Proximity to origin location | o | ||||||||||||||
| Densities (destination, population, residential, bike parking space) | o | o | o | o | |||||||||||
| Intensity of each destination categories | o | o | |||||||||||||
| Network features | Densities (bicycle facilities, Bikeway, Arcade, Intersection, Bike parking space) | o | o | o | |||||||||||
| Space syntax measures | o | ||||||||||||||
| Connectivity of bicycle-friendly streets | o | ||||||||||||||
| Hindrance caused by the course of the route | s |
o—objective indicator(s); s—subjective indicator(s).
Table 5.
List of indicators by criterion for the safety domain.
| Gholamialam and Matisziw (2019) | Grigore et al. (2019) | Hamidi et al. (2019) | Porter et al. (2019) | Lin and Wei (2018) | Manum et al. (2017) | Saghapour et al. (2017) | Ma and Dill (2016) | Krenn et al. (2015) | Winters et al. (2013) | Lowry et al. (2012) | McNeil (2011) | Wahlgren and Schantz (2011) | Eliou et al. (2009) | ||
|---|---|---|---|---|---|---|---|---|---|---|---|---|---|---|---|
| Traffic | Level of Traffic Stress | o | |||||||||||||
| Percentage of heavy vehicles | o | ||||||||||||||
| Speed limit or average speed | o | o | o | o | s | ||||||||||
| Speeds of cyclists | s | ||||||||||||||
| Traffic congestion | s | s | |||||||||||||
| Traffic volume or similar indicator | o | o | s | o | s | s | |||||||||
| Segregation | Bicycle route separation or similar indicator | o | o | o | s | ||||||||||
| Bikeway exclusiveness | o | ||||||||||||||
| Kind of separation from pedestrians | o | ||||||||||||||
| Conflicts | Car parking and bus stop | o | |||||||||||||
| Entrances along segment | o | ||||||||||||||
| Traffic conflict or similar indicator | s | s | s | s | |||||||||||
| Behavior | Bikers’ behavior | s | |||||||||||||
| Drivers’ behavior | s | ||||||||||||||
| Satisfaction with your neighborhood layout | s | ||||||||||||||
| Enforcement activeness | s |
o—objective indicator(s); s—subjective indicator(s).
Table 6.
List of indicators by criterion for the surrounding environment domain.
| Gholamialam and Matisziw (2019) | Grigore et al. (2019) | Hamidi et al. (2019) | Porter et al. (2019) | Lin and Wei (2018) | Manum et al. (2017) | Saghapour et al. (2017) | Ma and Dill (2016) | Krenn et al. (2015) | Winters et al. (2013) | Lowry et al. (2012) | McNeil (2011) | Wahlgren and Schantz (2011) | Eliou et al. (2009) | ||
|---|---|---|---|---|---|---|---|---|---|---|---|---|---|---|---|
| Topography | Slope or similar indicators | o | o | o | o | o | o | o | s | ||||||
| Landscape aesthetics | Presence of natural elements or similar indicators | o | o | o | |||||||||||
| Surface of green and aquatic areas in a cell | o | ||||||||||||||
| Greenery | s | ||||||||||||||
| The aesthetics and comfort of the riding environment or similar indicators | o | s | |||||||||||||
| Tree canopy coverage or similar indicator | o | o | |||||||||||||
| Pollution | Air quality | s | |||||||||||||
| Exhaust fumes | s | ||||||||||||||
| Ozone level | o | ||||||||||||||
| Noise levels | s |
o—objective indicator(s); s—subjective indicator(s).
Table 7.
Summary of methodological features.
| Gholamialam and Matisziw (2019) | Grigore et al. (2019) | Hamidi et al. (2019) | Porter et al. (2019) | Lin and Wei (2018) | Manum et al. (2017) | Saghapour et al. (2017) | Ma and Dill (2016) | Krenn et al. (2015) | Winters et al. (2013) | Lowry et al. (2012) | McNeil (2011) | Wahlgren and Schantz (2011) | Eliou et al. (2009) | |||
|---|---|---|---|---|---|---|---|---|---|---|---|---|---|---|---|---|
| Data acquisition | Surveys (interview/questionnaire) | ✓ | ✓ | ✓ | ✓ | |||||||||||
| Systematic audit/observation | ✓ | ✓ | ||||||||||||||
| Official sources | ✓ | ✓ | ✓ | ✓ | ✓ | ✓ | ✓ | ✓ | ✓ | ✓ | ✓ | ✓ | ||||
| Index family | Facility-based | ✓ | ✓ | ✓ | ✓ | ✓ | ✓ | ✓ | ✓ | ✓ | ||||||
| Location-based | ✓ | ✓ | ✓ | ✓ | ✓ | ✓ | ✓ | |||||||||
| Related-methods | Decision Support Models | Multiobjective Analysis | ✓ | |||||||||||||
| Multicriteria Assessment | ✓ | ✓ | ✓ | |||||||||||||
| Technical Statistics | Additive model | ✓ | ✓ | ✓ | ✓ | ✓ | ✓ | ✓ | ||||||||
| Cluster Analysis | ✓ | |||||||||||||||
| Exploratory Factor Analysis | ✓ | |||||||||||||||
| Post hoc Analysis | ✓ | |||||||||||||||
| Regression Analysis | ✓ | ✓ | ✓ | ✓ | ||||||||||||
| Sensitivity Analysis | ✓ | |||||||||||||||
| Focus group | ✓ | ✓ | ||||||||||||||
| Spatial Syntax Analysis | ✓ | |||||||||||||||
| Generalized Entropy Measures | ✓ | |||||||||||||||
| Results of the indexes | Numerical | ✓ | ✓ | ✓ | ✓ | |||||||||||
| Graphic (GIS) | ✓ | ✓ | ✓ | ✓ | ✓ | ✓ | ✓ | ✓ | ✓ | ✓ | ||||||
Publisher’s Note: MDPI stays neutral with regard to jurisdictional claims in published maps and institutional affiliations. |
© 2021 by the authors. Licensee MDPI, Basel, Switzerland. This article is an open access article distributed under the terms and conditions of the Creative Commons Attribution (CC BY) license (http://creativecommons.org/licenses/by/4.0/).
Share and Cite
MDPI and ACS Style
Castañon, U.N.; Ribeiro, P.J.G. Bikeability and Emerging Phenomena in Cycling: Exploratory Analysis and Review. Sustainability 2021, 13, 2394. https://0-doi-org.brum.beds.ac.uk/10.3390/su13042394
AMA Style
Castañon UN, Ribeiro PJG. Bikeability and Emerging Phenomena in Cycling: Exploratory Analysis and Review. Sustainability. 2021; 13(4):2394. https://0-doi-org.brum.beds.ac.uk/10.3390/su13042394
Chicago/Turabian StyleCastañon, Ugo N., and Paulo J. G. Ribeiro. 2021. "Bikeability and Emerging Phenomena in Cycling: Exploratory Analysis and Review" Sustainability 13, no. 4: 2394. https://0-doi-org.brum.beds.ac.uk/10.3390/su13042394
Note that from the first issue of 2016, this journal uses article numbers instead of page numbers. See further details here.