Article

Latent Heat Thermal Storage in Non-Uniform Metal Foam Filled with Nano-Enhanced Phase Change Material

1
Metamaterials for Mechanical, Biomechanical and Multiphysical Applications Research Group, Ton Duc Thang University, Ho Chi Minh City 758307, Vietnam
2
Faculty of Applied Sciences, Ton Duc Thang University, Ho Chi Minh City 758307, Vietnam
3
Young Researchers and Elite Club, Yasooj Branch, Islamic Azad University, Yasooj 7591493686, Iran
4
ECAM Lyon, LabECAM, Université de Lyon, 69005 Lyon, France
5
College of Preparatory Year, Umm Al Qura University, Makkah Al Mukarramah 21955, Saudi Arabia
6
Department of Mechanical Engineering, College of Engineering at Wadi Addwaser, Prince Sattam Bin Abdulaziz University, Wadi Addwaser 11991, Saudi Arabia
7
Department of Mechanical Engineering, Faculty of Engineering, University of Khartoum, Khartoum 11111, Sudan
8
Faculty of Engineering, The University of Nottingham, University Park, Nottingham NG7 2RD, UK
9
CanmetENERGY Research Centre, Natural Resources Canada, 1 Haanel Drive, Ottawa, ON K1A 1M1, Canada
*
Authors to whom correspondence should be addressed.
Sustainability 2021, 13(4), 2401; https://0-doi-org.brum.beds.ac.uk/10.3390/su13042401
Submission received: 26 January 2021 / Revised: 14 February 2021 / Accepted: 18 February 2021 / Published: 23 February 2021
(This article belongs to the Special Issue Green Deal in Construction and Building Materials)

Abstract

:
The melting heat transfer of CuO—coconut oil embedded in a non-uniform copper metal foam—was addressed. Copper foam is placed in a channel-shaped Thermal Energy Storage (TES) unit heated from one side. The foam is non-uniform with a linear porosity gradient in a direction perpendicular to the heated surface. The finite element method was applied to simulate natural convection flow and phase change heat transfer in the TES unit. The results showed that the porosity gradient could significantly boost the melting rate and stored energy rate in the TES unit. The best non-uniform porosity corresponds to a case in which the maximum porosity is next to a heated surface. The variation of the unit placement’s inclination angle is only important in the final stage of charging, where there is a dominant natural convection flow. The variation of porous pore size induces minimal impact on the phase change rate, except in the case of a large pore size of 30 pore density (PPI). The presence of nanoparticles could increase or decrease the charging time. However, using a 4% volume fraction of nanoparticles could mainly reduce the charging time.

1. Introduction

The rise in the participation of renewable energy in the prevailing cooling, heating, and power infrastructures demands new encounters to be overcome. Thermal energy storage systems are capable of storing/releasing a notable amount of heat in a compact volume. Thermal energy storage (TES) systems could also help shift heat loads or damp transient heat load fluctuations. Thus, such systems are crucial to heat load distribution time and reduction in the design size of thermal systems. For instance, the presence of a TES unit could act as a thermal buffer and allow a design of a heating system for average thermal load instead of maximum thermal load.
Latent Heat Storage (LHS) is an advantageous type of thermal energy storage due to its large melting enthalpy and the sharpness of the working temperature. From a thermodynamic point of view, a pure substance can phase change at a constant fusion temperature and release/absorb a significant amount of heat. During the last two decades, latent heat storage using Phase Change Materials (PCMs) has been employed in many engineering applications [1]. Besides the high thermal capacity features of LHS, practical application of PCMs encounters some heat transfer drawbacks, which are mainly due to the low thermal conductivity of PCMs [2,3]. Low thermal conductivity acts as a barrier to heat transfer and drastically increases the charging/discharging times of TES units. A fast charging/discharging TES is essential for many industrial applications so that energy storage units can quickly supply transient demanded thermal loads. Thus, improving the heat transfer performance of TES units is a hot topic. An increase in heat transfer performance could be achieved by increasing the thermal conductivity enhancement (TCE) of PCMs or the effective thermal conductivity of the overall TES.
Different techniques have been used to enhance the conductivity of PCMs. Among these techniques, we can quote the embedding of fins or extended surfaces [4,5,6], encapsulated PCMs [7,8], insertion of particles/nanoparticles of high thermal conductivity within the PCM [9,10,11], and inclusion of high thermal conductivity material structures [12,13,14,15]. One promising TCE technique consists of the use of porous open-cell metal foam [16,17,18]. Metal foams have high thermal conductivity, large porosity, and large surface area per unit of volume, which makes them potentially good candidates for promoting latent heat storage performance. Additionally, they are characterized by a strong mechanical structure and stable thermo-physics properties.
Huang et al. [19] conducted an experimental protocol to make a composite of PCM/ metal foam using vacuum melting infiltration. Myristyl alcohol (MA) was used as PCM and copper/nickel as foams. Measurements showed that thermal conductivity was improved by 1.8 with nickel foam (40 PPI) and 7.51 with copper foam (40 PPI). Martenelli et al. [20] experimented with the phase change heat transfer of a PCM in a copper-foam-filled shell-and-tube heat exchanger. These researchers found that the charging and discharging times were reduced remarkably.
Xiao et al. [21] investigated the effect of porosity on the effective thermal conductivity of a paraffin/nickel foam composite and paraffin/copper foam composite experimentally and found that thermal conductivity was drastically improved. Moreover, they found that pore size induces minimal impact on phase change performance.
Some researchers have tried to integrate two or more TCE techniques to further improve the heat transfer performance of TES units. For instance, a combination of fins and Nano-enhanced PCMs (NePCM) [22,23], a combination of Nano-Encapsulated PCMs (NEPCMs) and fins [24], and a combination of NePCM and metal foams have been employed.
Mahdi et al. [25] studied the discharge of LHS numerically during the solidification of multiple PCMs with nanoparticles in a shell-and-tube containment with a cascade of multiple foams. They showed that with the application of multiple cascade foams and multiple PCMs, the solidification time can be enhanced by 17 times compared with the reference case of one PCM with no foam. An experiment was performed by Al Jethelah et al. [26] to examine the charging of latent heat during the melting of bio-based NePCM, embedded with aluminum foam. The NePCM was made of CuO nanoparticles dispersed in coconut oil. The authors examined the melting rate of NePCM in aluminum foams with different porosities of 88%, 92%, and 96%. It was found that the insertion of metal foam boosts the melting rate of PCM significantly. Thus, the performance of the storage unit after employing nanoadditives and metal foam was much better than only using nanoadditives. These researchers also reported that a dense metal foam with a porosity of 88% suppresses natural convection flow and leads to uniform melting, but natural convection plays a clear role when porosity increases to 96%.
Li et al. [27] analyzed the effectiveness of a triple-tube heat exchanger by filling the middle tube with NePCM/copper foam composite. Li et al. tested different nanoparticle concentrations and metal foam porosities. The outcomes showed that the melting/solidification time was shortened by 25.9/28.2% by adding 5% copper nanoparticles. Additionally, the melting/solidification time was reduced by 83.7/88.2% due to the presence of metal foam with 95% porosity. This reduction in charging/discharging time confirms the advantage of adding metal foam compared with adding nanoparticles.
Utilizing metal foam with non-uniform porosity or employing a cascade of metal foams with different porosities is a novel idea that could adjust local thermal conductivity to the initial melting times and allow degrees of natural convection in the final stages. There is a scarce number of publications on the phase change of PCMs in non-uniform metal foams. One of the main reasons could be the difficulties in producing non-uniform metal foams. Recently, with the advancement of 3D metal printers and other production methods, synthesis of non-uniform metal foams is feasible. Regarding the phase change of non-uniform metal foams, Yang et al. [28] proposed a model of the vertical porosity gradient of the metal foam, in which the porosity increases linearly from bottom to top. Such non-uniform porosity could shorten the full melting time (charging time) by enhancing natural convection and improving heat transfer performance, compared with a case of uniform porosity. Mahdi et al. [29] investigated the melting and solidification of PCM-filled metal foam in a shell-and-tube thermal storage system theoretically. The space between the two concentric cylinders was filled with multiple-segments of different porosities. It was found that the performance of the storage system in terms of charging and discharging times was improved by cascading the porosity. Recently, Girish et al. [30] investigated the phase change heat transfer in a cylindrical heatsink filled with composite PCM-open metal foam. They used a vertical porosity gradient from the bottom to the top of the cylinder with uniform PPI density. They showed an increase in performance by using non-uniform porosity metal foam.

2. Mathematical Model
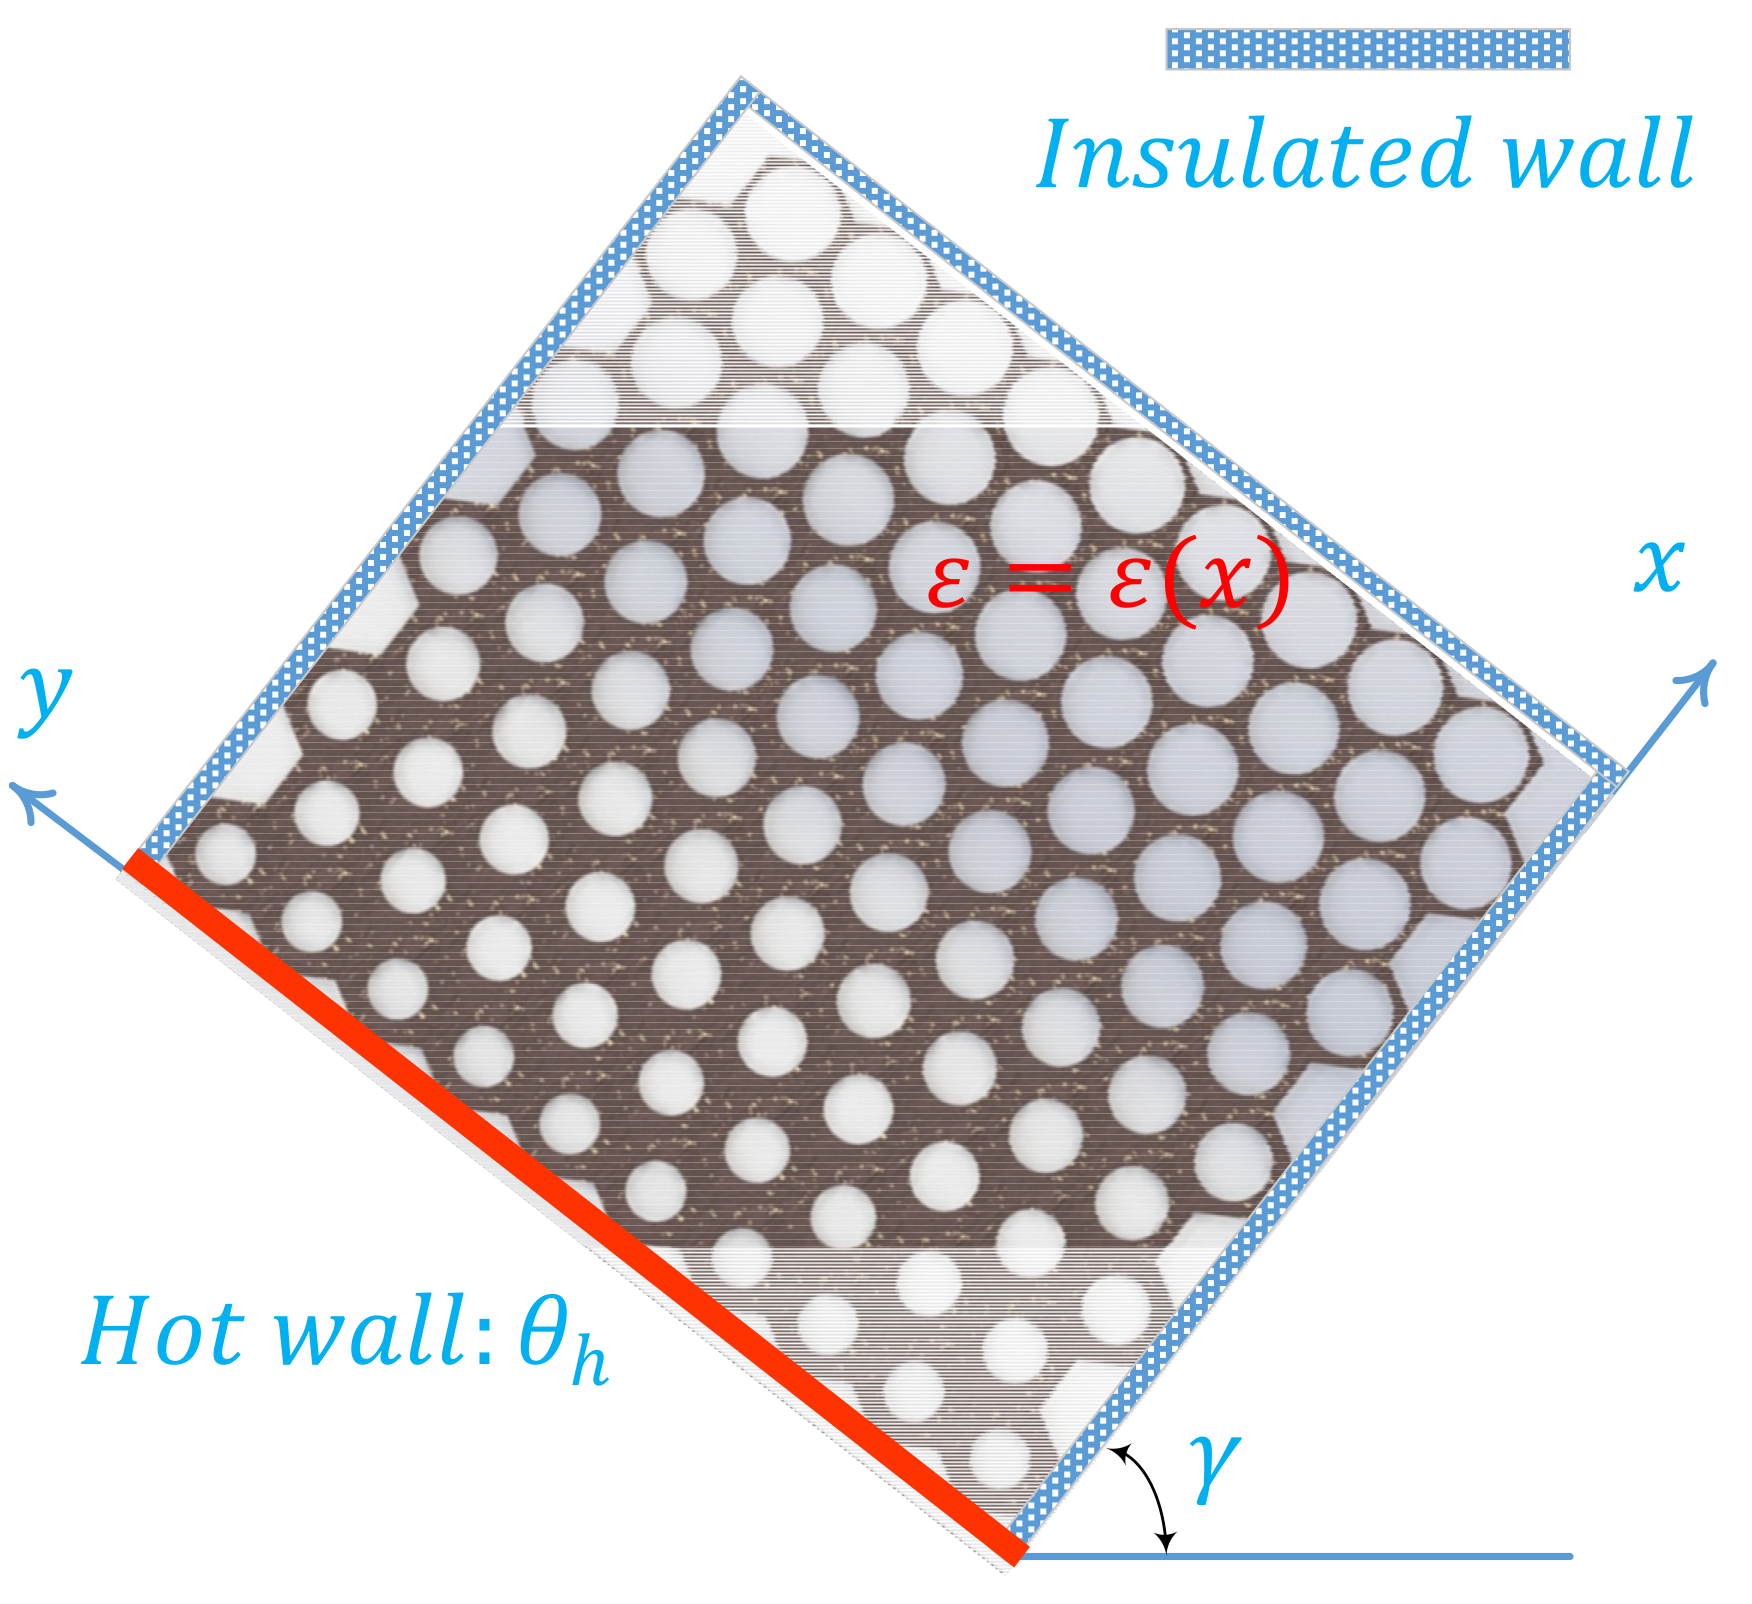
2.1. Physical Model

A schematic view of an inclined porous rectangular enclosure saturated by a nano-enhanced phase change material, studied in this work, is depicted in Figure 1. The active wall of the enclosed medium, which is along the y-axis and located at x = 0, is kept at a high temperature, i.e. Th. However, the other walls are fully insulated. The PCM and the nanoadditives on the NePCM are coconut oil and CuO nanoparticles, with the thermophysical characteristics listed in Table 1.
The length of the domian, i.e. L, is 40 mm, and the width, i.e. W, is 20 mm. The porosity varies as:
ε a v g = a x + b
ε a v g is the average porosiy. a as the porosity gradient is the input changeable parameter, and the b parameter is defined based on the values of ε a v g and a.

2.2. Convective Phase Change Heat Transfer in NePCM

NePCM melts over time, and the natural convection of molten NePCM occurs in the liquid phase. The transient phase change process with natural convection in the porous domain is described using the volume-averaged approach:
Mass conservation
q = 0
Momentum equations
1 ε ρ n p c m , l q t + 1 ε ρ n p c m , l q q 1 ε = p I + μ n p c m , l 1 ε q + q T μ n p c m , l κ q +   ρ β n p c m , l g θ θ m e l   +   F θ q
in which,
g = g cos γ i   +   sin γ j
F θ   =   A m u s h 1 2 l θ   +   l 2 θ Γ + l 3 θ ; A m u s h   =   5 × 10 5 a n d Γ =   10 3
l θ   =   0 θ < θ m e l Δ θ m e l 2 θ     θ m e l Δ θ m e l +   1 2 θ m e l Δ θ m e l 2 < θ < θ m e l + Δ θ m e l 2 1 θ > θ m e l + Δ θ m e l 2
Additionally, the permeability of the porous domain can be expressed as [32]:
κ = 73   ×   10 5 D p 2 1     ε 0.224 D l D p 1 1.11 D l D p 1 = 1     ε 3 π 0.5 1.18 1 e 1 ε / 0.04 D p = 254 × 10 4 P P I 1  
Energy conservation
ρ c p e f f θ t   +   ρ c p n p c m , l q   ·   θ   =     ·   λ e f f θ     1 V F n a ρ p c m , l h f , p c m ε l θ t
in which,
ρ c p e f f   =   l θ ρ c p e f f , l     ρ c p e f f , s   +   ρ c p e f f , s
ρ c p e f f , l s   =   1 ε ρ c p m f + ε ρ c p n p c m , l s
The subscript mf denotes the metal foam. The thermal conductivity of PCM depends on the melt fraction of NePCM in an element. Thus, the melt volume fraction is used, and the effective thermal conductivity of metal foam and NePCM is evaluated as:
λ e f f = l θ λ e f f , l   +   1 l θ λ e f f , s
Some researchers argued for possible relations for evaluation of the effective thermal conductivity of a composite metal foam and the material inside pores, as reviewed in Ranut [33]. The below relation has been generally adopted in many literature works. Thus, it has also been selected for the current investigation [13,34]:
λ e f f , l s = λ n p c m , l s   +   π ι ι Δ λ l s λ n p c m , l s   +   ι π Δ λ l s λ n p c m , l s   +   4 3 ι 1     ε   +   π ι     1     ε Δ λ l s ι = 1     ε 3 π ,   Δ λ l s = λ m f λ n p c m , l s

2.3. NePCM Thermo-Physical Properties

The density of NePCM is the linear average of the PCM and nanoparticles [35]:
ρ n p c m = ρ p c m + V F n a ρ n a ρ p c m
ρ p c m θ   =   l θ ρ p c m , l ρ p c m , s   +   ρ p c m , s
where VFna represents the nanoparticles’ volume fraction. Here, the well-known Brinkman relation is applied to approximate the dynamic viscosity of molten NePCM:
μ n p c m , l = μ p c m , l 1 V F n a 2.5
The coefficients of thermal expansion and effective heat capacities are also computed as the linear average of density and the expansion coefficient. Density is also involved in this relationship, since the production of these terms includes thermal terms and buoyancy force:
ρ n p c m , l β n p c m , l = ρ p c m , l β p c m , l + V F n a ρ n a β n a ρ p c m , l β p c m , l
ρ c p n p c m = ρ p c m c p , p c m + V F n a ρ n a c p , n a ρ p c m c p , p c m
ρ p c m c p , p c m θ   =   l θ ρ p c m , l c p , p c m , l ρ p c m , s c p , p c m , s   +   ρ p c m , s c p , p c m , s
The well-known Maxwell model is applied to estimate the thermal conductivity of NePCM:
λ n p c m , l s λ p c m , l s = λ n a + 2 λ p c m , l s     2 V F n a λ p c m , l s λ n a λ n a + 2 λ p c m , l s   +   V F n a λ p c m , l s     λ n a

2.4. Model Conditions

Boundary condition on the hot wall:
θ = θ h ,   q = 0
Boundary condition on insulated walls:
θ n = 0 ,   q = 0
Initial condition for the computational domain:
θ = 295.15   K ,   q = 0

2.5. Characteristics Parameters

The cumulative heat transferred ( E S t ) from the hot wall to the NePCM is exactly equal to the stored energy in the unit. E S t can be calculated as the following:
E S t   =   ρ C p e f f θ θ i n i t i a l   d + 1 V F n a ρ p c m , l ε h p c m d
The melting volume fraction is evaluated as:
M V F t   =   l θ d d
In the practical application of the LHS unit, the performance of the unit can be evaluated by charging power. This parameter shows the capacity of PCM to store energy and depends on the amount of the energy stored at 100% melting volume fraction:
P = E S   when   the   melting   process   complete complete   melting   time
To further discuss temperature distribution, the temperature uniformity index TU(t) was proposed, w as described below:
T U t   =   θ x , t     θ a v e 2 d
θ a v e = θ d d

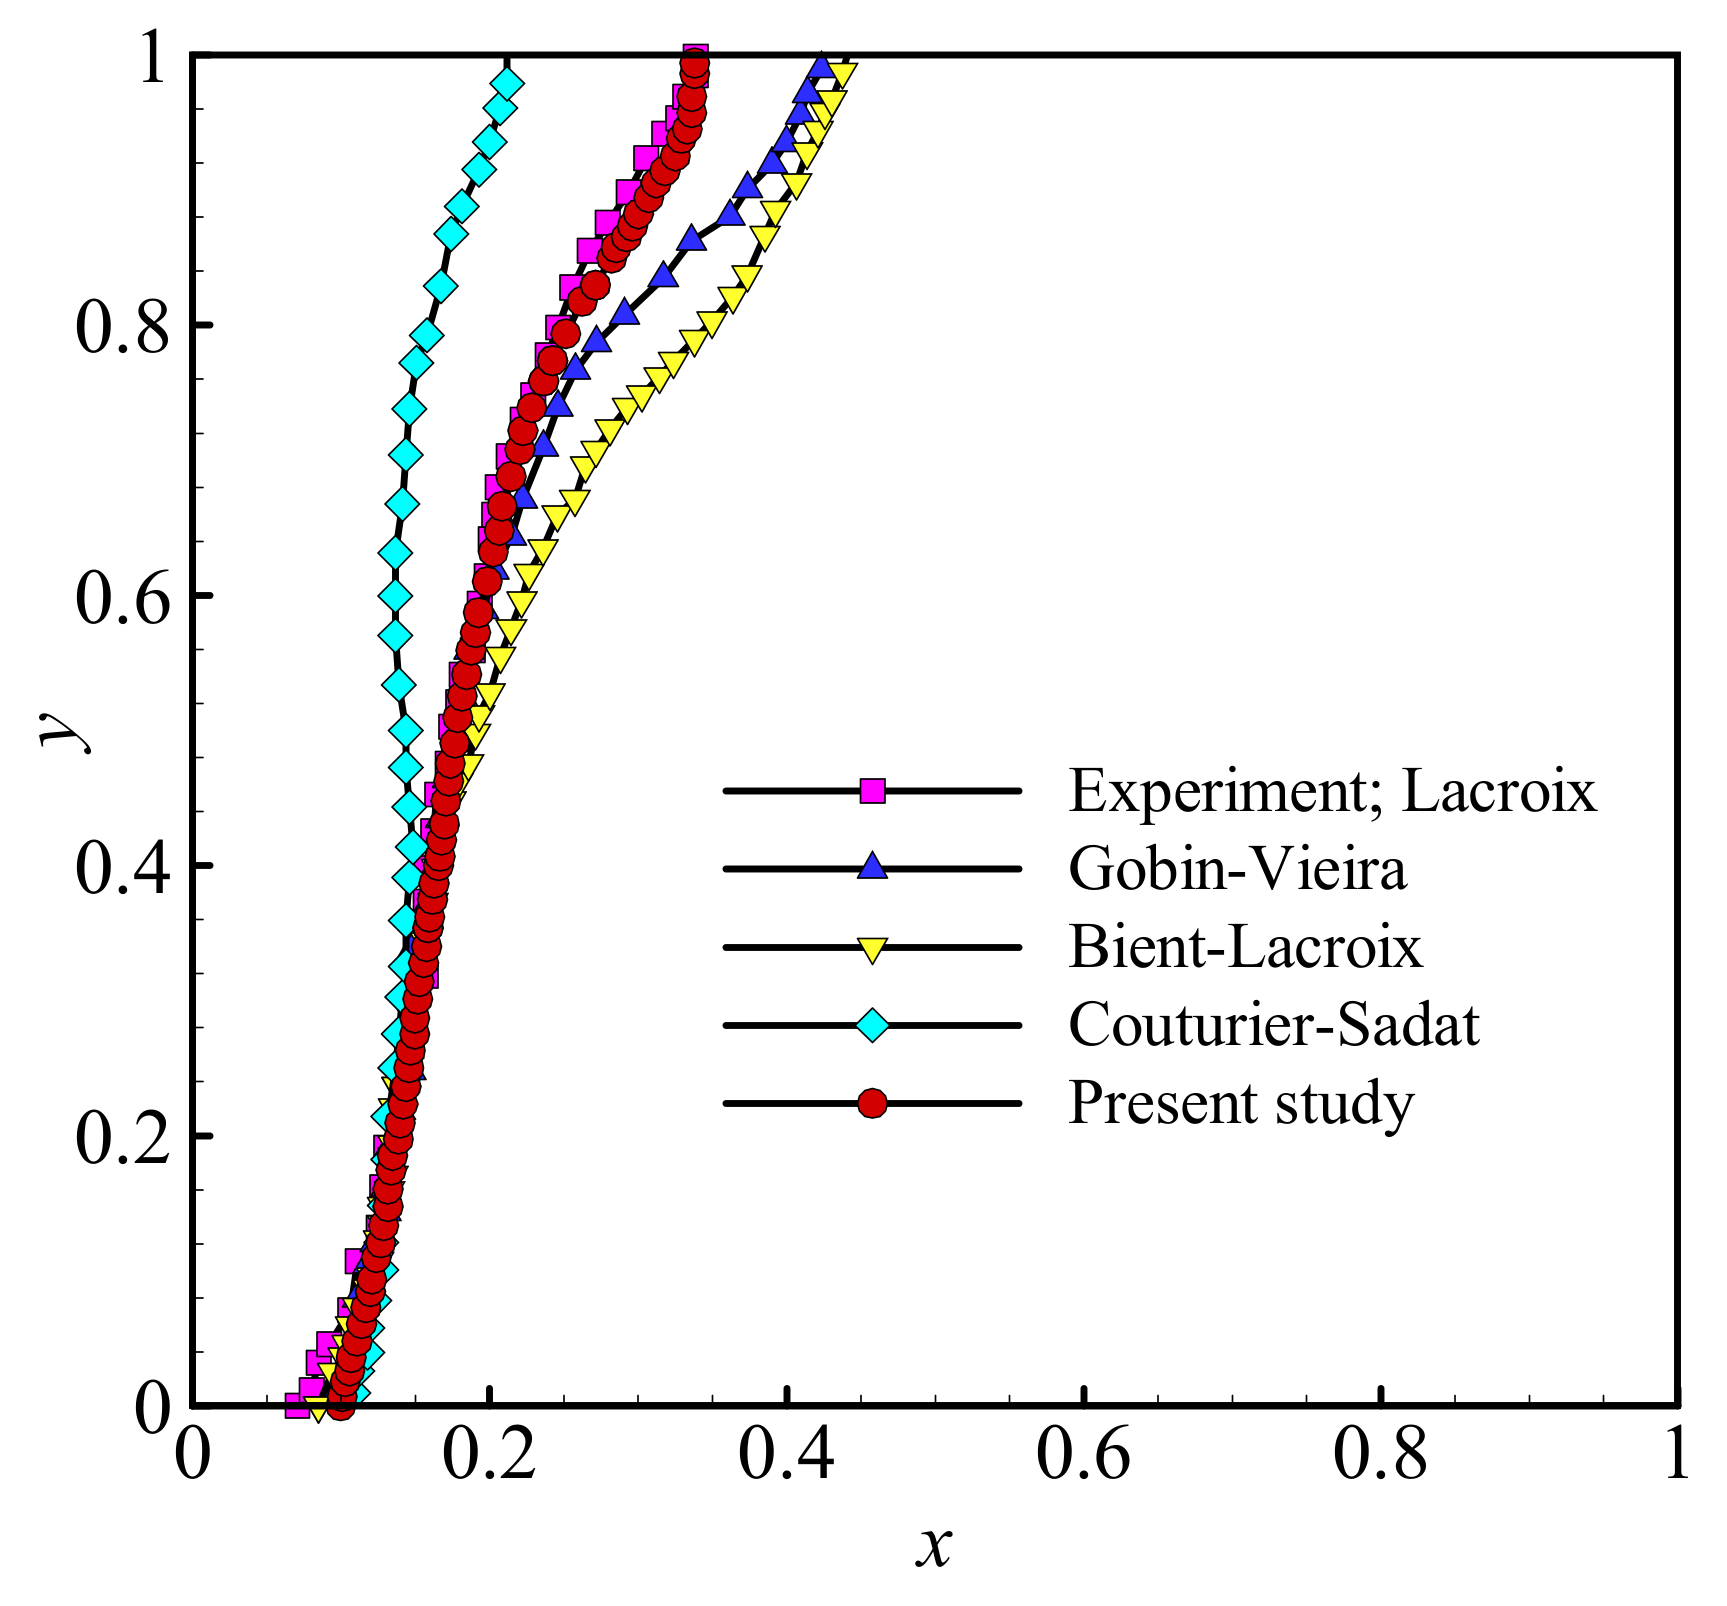
3. Numerical Approach and Grid Dependency

The Finite Element Method was employed to solve simultaneous dominant partial differential equations (PDEs). User-defined codes were developed to model phase change in a non-uniform porous medium. The PDEs are discretized by the use of rectangular elements in the computational region. As previously mentioned in detail, the thermophysical characteristics of NePCM are determined based on temperature, defining the liquid, mushy and solid zones, and the concentration of dispersed nanoadditives. Mesh quality is a key parameter influencing the precision of results for a numerical problem. To find an appropriate grid, five sets of grids are examined. The selected parameters in this test are L = 50 mm, VFna = 0.06, εavg = 0.900, a = 4, γ = π/4, PPI = 10. As Figure 2a,b depict, no significant changes in the Melted Volume Fraction (MVF) and the temperature at the center of the enclosure could be seen when varying the mesh sizes. Based on these results, a uniform mesh of 150 × 150 intervals will be used for the present study. Additionally, the time-stepping with a maximum number of 8 iterations in each time step is automatically adopted.
The validation of the employed numerical approach can be confirmed by comparisons between the simulated results and the numerical/experimental data available in the literature [26,36]. In the first comparison, the melted liquid domains of the experimental study conducted by Al-Jethelah et al. [26] and the established numerical model are illustrated in Figure 3. Al-Jethelah et al. [26] carried out an experimental study to track the melting flow corresponding to a bio-based NePCM inserted in an aluminum foam enclosed medium with constant heat flux imposed on the left sidewall. The bio-based PCM and high thermal conductivity particles were coconut oil and CuO. The dimensions of the porous enclosed medium were 72 mm in height and 50 mm in width. In the comparison, illustrated in Figure 3, PPI = 5, ε = 92 and κ = 3.3142 × 10⁻⁷.
According to the comparative illustrations in Figure 4, the obtained melted liquid domains from the established model are compatible with the experimental observations. In the second comparative analysis, the reliability of the current adopted model is tested through the progressive melting fronts from this work and the experimental-numerical study discussed in [36]. The problem physics studied in [36] was a square enclosed medium with a size of 100 mm containing Octadecane with the fusion temperature of 30 °C. Several other researchers simulated the investigation conducted by Bertrand et al. [36] as a benchmark. As shown in Figure 4, the numerical approach agrees with numerical-experimental outcomes, demonstrating that melting flow is appropriately modeled.

4. Results and Discussion

In the present model, flow and heat transfer behavior in the enclosure are influenced by the following parameters: average porosity ( 0.8 ε a v g 0.9 ), the volume fraction of nanoadditives ( 0 V F n a 0.04 ), the gradient of porosity, ( 4 a 4 ), the inclination angle of the enclosed medium ( 0 γ π ) and the pore per inch of the metal matrix ( 10 P P I χ 30 P P I ).
It is obvious that performing numerical experiments to test all possible combinations of the abovementioned parameters presents a substantial computational cost and is impracticable. In order to optimize such experiments, the L-25 orthogonal array statistical technique is employed as follows.
Each one of the five parameters, or control factors, is given five values, each representing a level (Table 2).
Testing all possible combinations would require 55 experiments. However, The L-25 orthogonal array method is employed to explore the design space systematically. As the objective here is to select the design that would lead to the fastest melting, Table 3 presents the details of the L-25 orthogonal array and its corresponding parameters. It is shown that P is maximum for the following values of the control factors, which are considered optimal values:
V F n a =   0.04 , ε a v g =   0.8 , a =   4 , γ =   3 π / 4 , P P I =   20
Further experiments are performed around the optimal values and summarized in Table 4 in order to confirm the design optimization for these values. In each experiment, one control factor is varied among four values, while the other factors are kept constant. It can be seen that in most cases, the other experiments led to a greater melting duration compared with the one obtained with the optimal values, which confirms the optimization of the design. However, some minor exceptions exist in which the melting duration is slightly shorter than the optimal one, but the difference remains relatively low. In these exceptions, the values of the parameters VFna, εavg, and a are equal to their optimal values, but those of γ and PPI are changed. This indicates that the influence of the latter parameters on optimization is relatively weak compared with the other parameters, as the power is still maximized when they are changed.
In any case, the flow and thermal patterns inside the enclosure should be studied to better understand how various control parameters affect NePCM behavior and clarify how optimal values lead to better results in melting duration and charging power.
Figure 5a,b show the variation of porosity and metal foam permeability for the optimum case, respectively. The optimum value of a was 4. Thus, as seen in Figure 5a, the porosity next to the left wall is low (due to the high amount of metal foam) and linearly increases toward the right wall. From Figure 5b, it can be seen that by moving from left to right the permeability increases. The increase in permeability is due to the increase in local porosity.
Figure 6 and Figure 7 depict the streamlines and isothermal contours in the cavity for the different nanoparticle volume fraction, VFna. It should be noted that the streamlines indicate the presence of melted PCM, and the red line separates the liquid and solid phases. It can be seen that the behavior of NePCM is similar in all cases. The PCM starts melting initially in the left region near the heated wall. As time goes, the hot melt circulates upwards while the colder one goes downwards, and convective flow takes place, as illustrated by the single recirculation zone occupying the cavity. Nonetheless, the vertical shape of the isotherms indicates that heat transfer remains mainly dominated by conduction, expect in the final stages of melting. As the melted region grows, natural convection flows can be initiated, and isotherms would deflect due to the natural convection effects. The melting interface is more advanced toward the right when VFna is raised, indicating that the volume of melted PCM is slightly higher when VFna is increased. Furthermore, and following the development of the flow patterns, the isothermal contours reveal that the temperature is higher when a greater value of VFna is employed in the same zones of the cavity. Indeed, dispersing highly conductive nanoparticles in pure PCM improves its thermal conductivity and intensifies heat transfer between the different regions, raising the overall temperature and enhancing PCM melting.
Figure 8 shows the time evolution of the melted volume fraction (MVF) and the stored energy (ES). It is clear that the MVF is at its maximum when VFna = 0.04, which corresponds to the optimal value, and full melting (MVF = 1) is achieved faster for this value of VFna. On the other hand, VFna seems to have little effect on ES. However, considering the charging power, defined as the ratio of ES to full melting time, it becomes clear that the power is at its maximum when VFna = 0.4 and confirms the optimization for that value.
The effect of the average porosity εavg on flow and temperature patterns in the enclosure is illustrated in Figure 9 and Figure 10. It is clear that the melting front is developed, and the size of the melted PCM zone is greater when εavg is decreased. Full melting of the PCM is reached faster in that case. In addition, the temperature in the cavity increases when a lower value of εavg is utilized. These observations are confirmed in the plots of MVF and ES in Figure 11. A substantial increase in both the MVF and ES is observed when εavg is reduced. Full melting time is at its minimum when εavg = 0.8, and ES is also at its maximum in this case, which indicates a maximization of the charging power and confirms the optimization when εavg = 0.8. Indeed, the porosity is defined as the ratio of the volume of voids to the total volume of the metal foam. When εavg is reduced, the volume of the solid matrix is increased relative to that of the fluid. Since this solid matrix is thermally conductive, heat transfer is enhanced in this case, which results in higher temperature and faster PCM melting.
The streamlines and isotherms are plotted in Figure 12 and Figure 13 for various values of the porosity gradient a. A positive value of an indicates that porosity is low near the left hot wall and increases in the right direction, while a negative value indicates a decreasing porosity starting from the left wall. Raising a clearly tends to intensify heat transfer and accelerate PCM melting. The fastest melting occurs when a = 4, which validates the optimal aspect of that value. The reason behind this behavior is that in the initial stages, heat transfer is dominated by conduction. Conductive effects are enhanced near the left wall for a higher value of a, i.e., low porosity in that area and consequent higher metal volume, which tends to melt PCM at a faster rate. Once the PCM has melted and the convective effects take place in the last stage in the right part of the cavity, the high porosity in that area facilitates liquid circulation, which further contributes to convective heat transfer. The opposite occurs when a is decreased, mainly to negative values, where the porosity near the wall is high; conductive heat transfer is inhibited, and porosity is low in the right region, which slows down the flow and diminishes the convective effects. For this reason, both MVF and ES increase when a is higher and are at their maximum when a = 4, as observed in Figure 14. The charging power is at its maximum when a = 4, and that value is therefore confirmed as optimal.
Figure 15 and Figure 16 illustrate the impact of the inclination angle of cavity γ on flow and thermal patterns. It can be seen that γ has a negligible effect on the streamlines and isotherms in the initial stages. As time goes by, a slight development in the melting front can be seen for γ = π/4 and γ = 3π/4 compared with the cases of γ = 0 and γ = π. In fact, tilting the cavity impacts the location of the hot wall and influences the effects of gravitational forces. This consequently affects the convective heat transfer, which is slightly enhanced when the cavity is tilted. This appears in the plots of MVF and ES in Figure 17, where it can be seen that both parameters have the same variation in the initial stages, but this trend changes over time, as both MVF and ES, and consequently the power P, become relatively higher for γ = π/4 and γ = 3π/4.
The flow patterns and isothermal contours are plotted in Figure 18 and Figure 19 for different values of the pores-per-inch of metal square PPI. It should be noted that even though the PPI is varied, the average porosity is constant, which means the total metal volume is the same in all the cases. When PPI is decreased, the number of pores is lower, so the thickness of the solid metal matrix is increased, which enhances thermal conductivity. However, in that case, the interface contact area between PCM and the metal structure is reduced, which may diminish heat transfer between the two components. For this reason, PPI seems to have a little effect on the thermal behavior of PCM due to the balance between positive and negative effects, as appears in the plots of MVF and ES in Figure 20. Nonetheless, it seems that the case PPI = 15 leads to lower MVF and ES compared with the other cases, which indicates that the improvement of thermal conductivity fails to balance the decrease in the interface area in this case.

5. Conclusions

The melting heat transfer of NePCMs in non-uniform metal foam was addressed systematically. Porosity changes linearly, in the x-direction. Non-linear porosity could improve local effective thermal conductivity in conduction-dominant regions by decreasing porosity, while low porosity could facilitate natural convection in convection-dominant regions. The FEM was applied to solve the governing equations. The impacts of the volume fraction of nanoparticles, average porosity of metal foam, porosity gradient, inclination angle, and pore size were investigated on the phase change process and melting rate. The results were reported in the form of isotherms, melting maps, streamlines, and graphs of melting rates and stored energy. The following main outcomes were found:
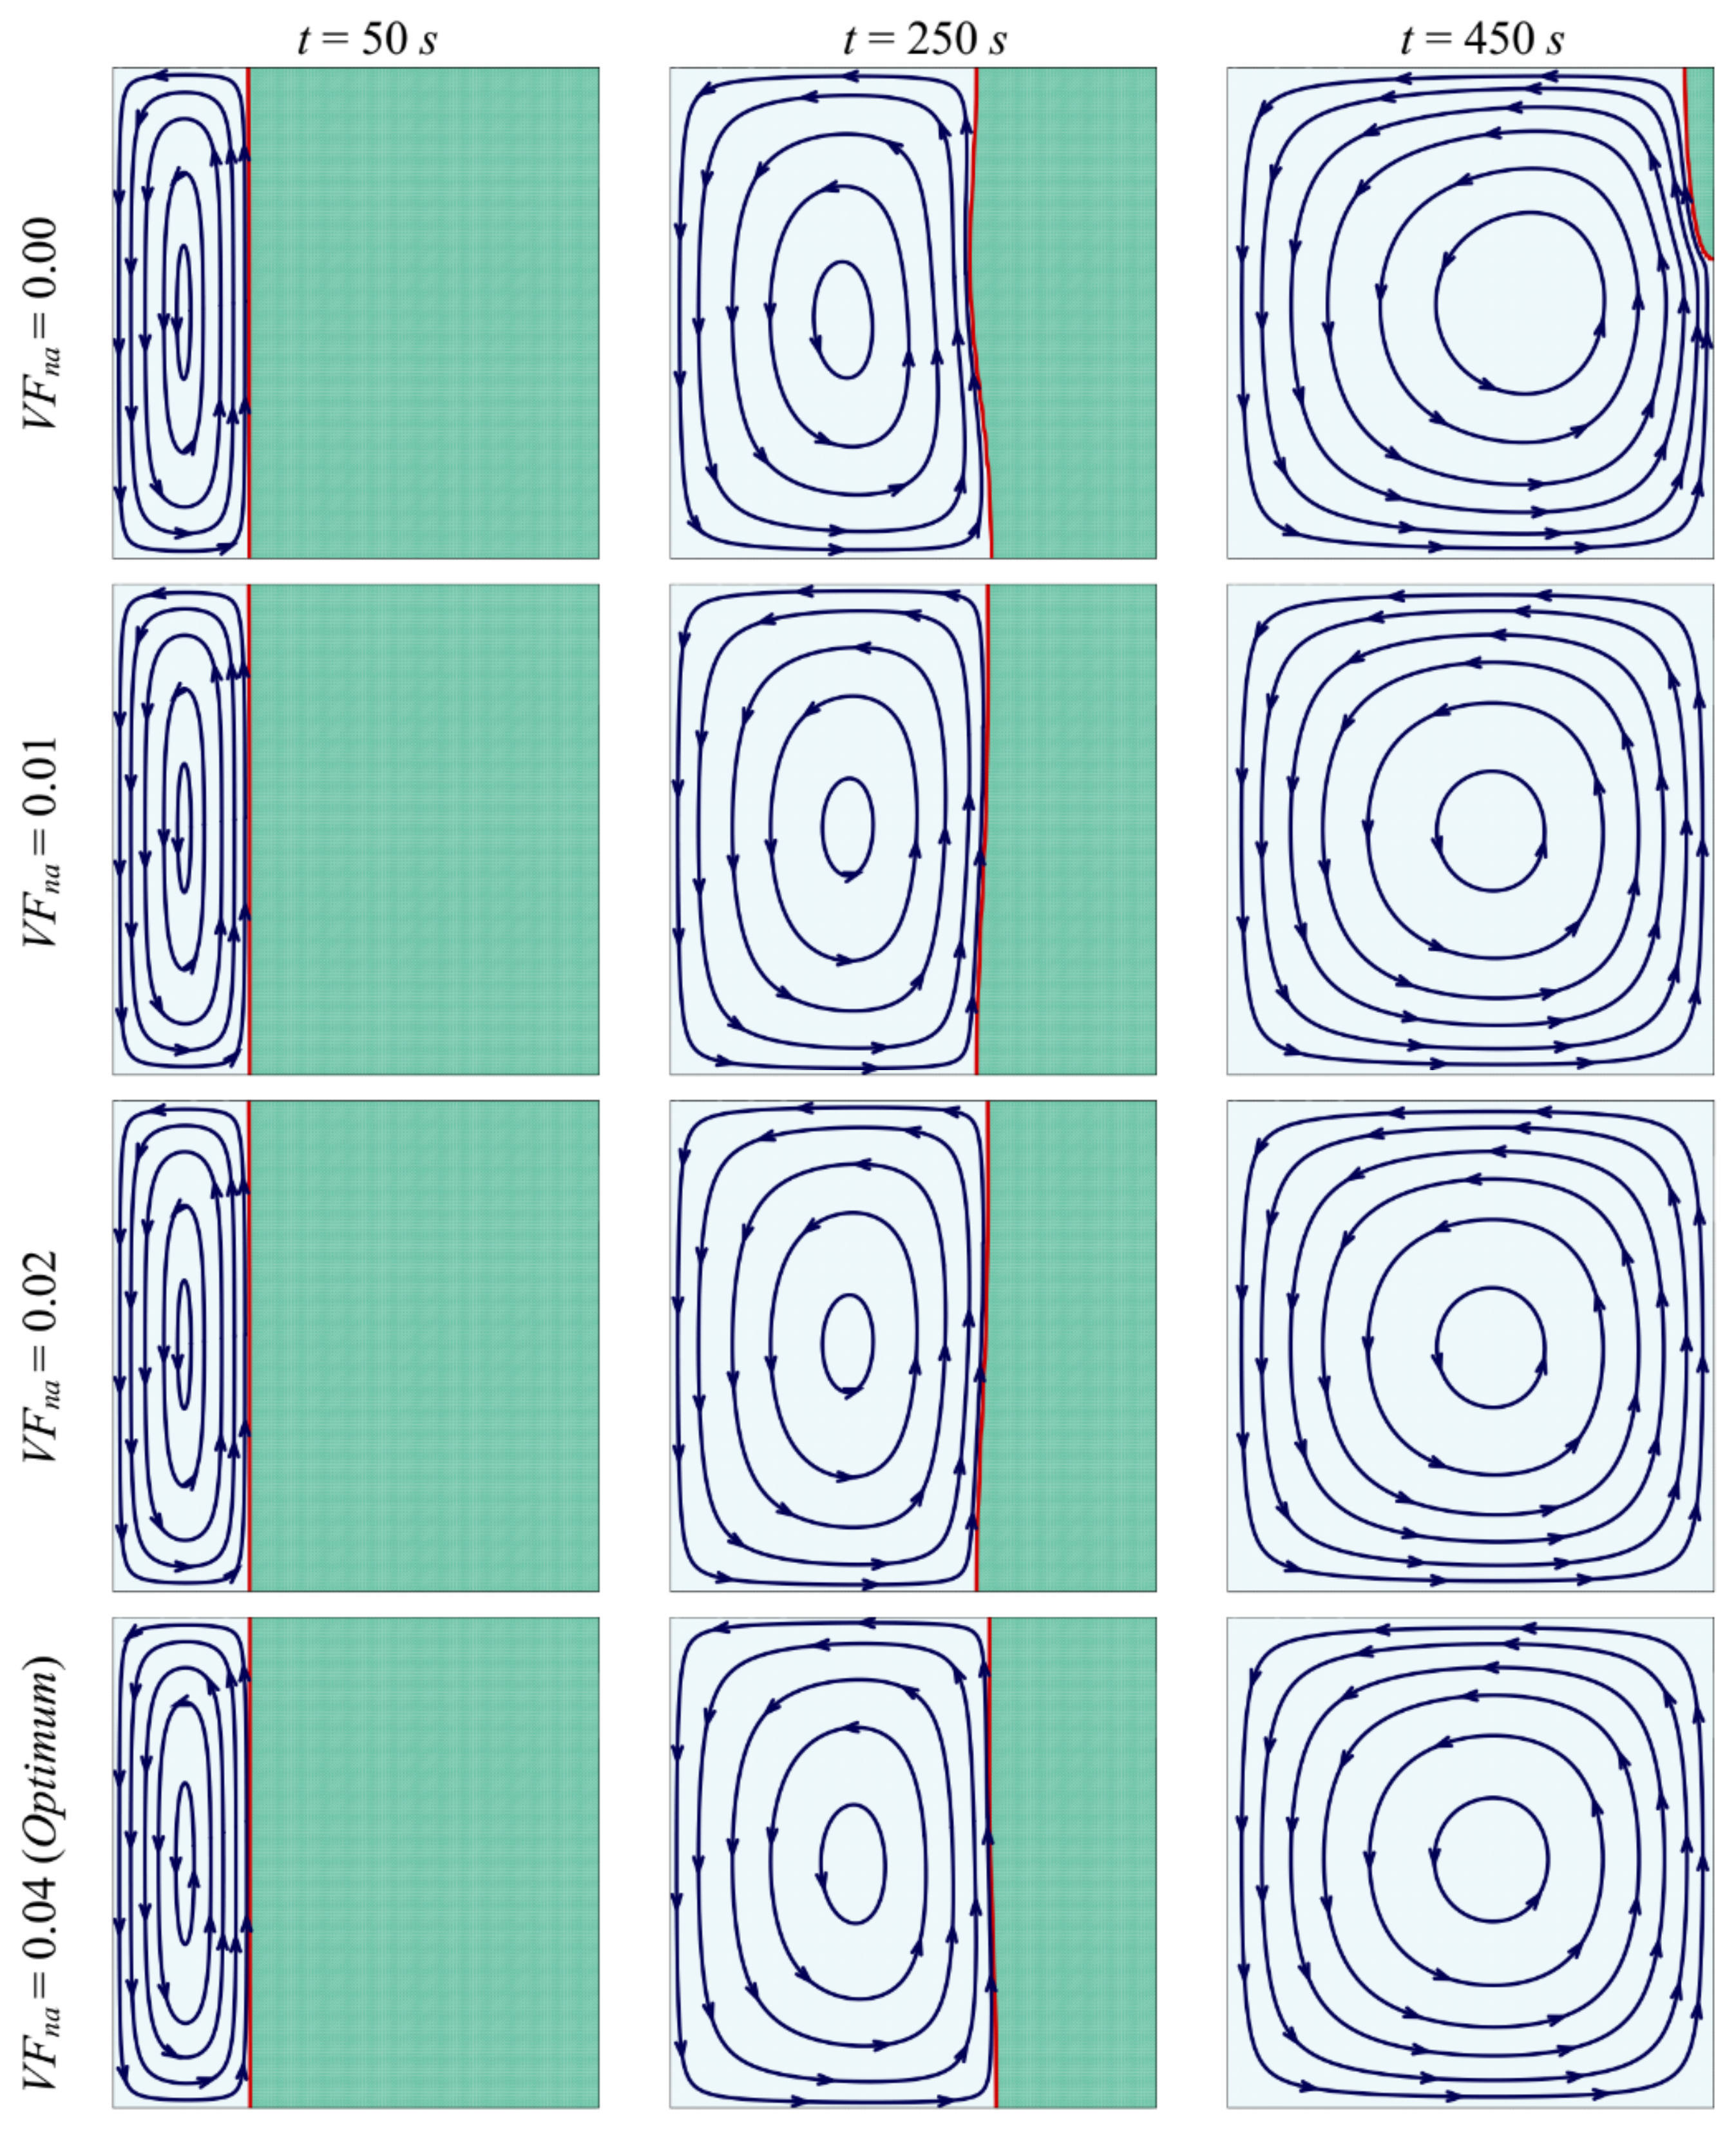
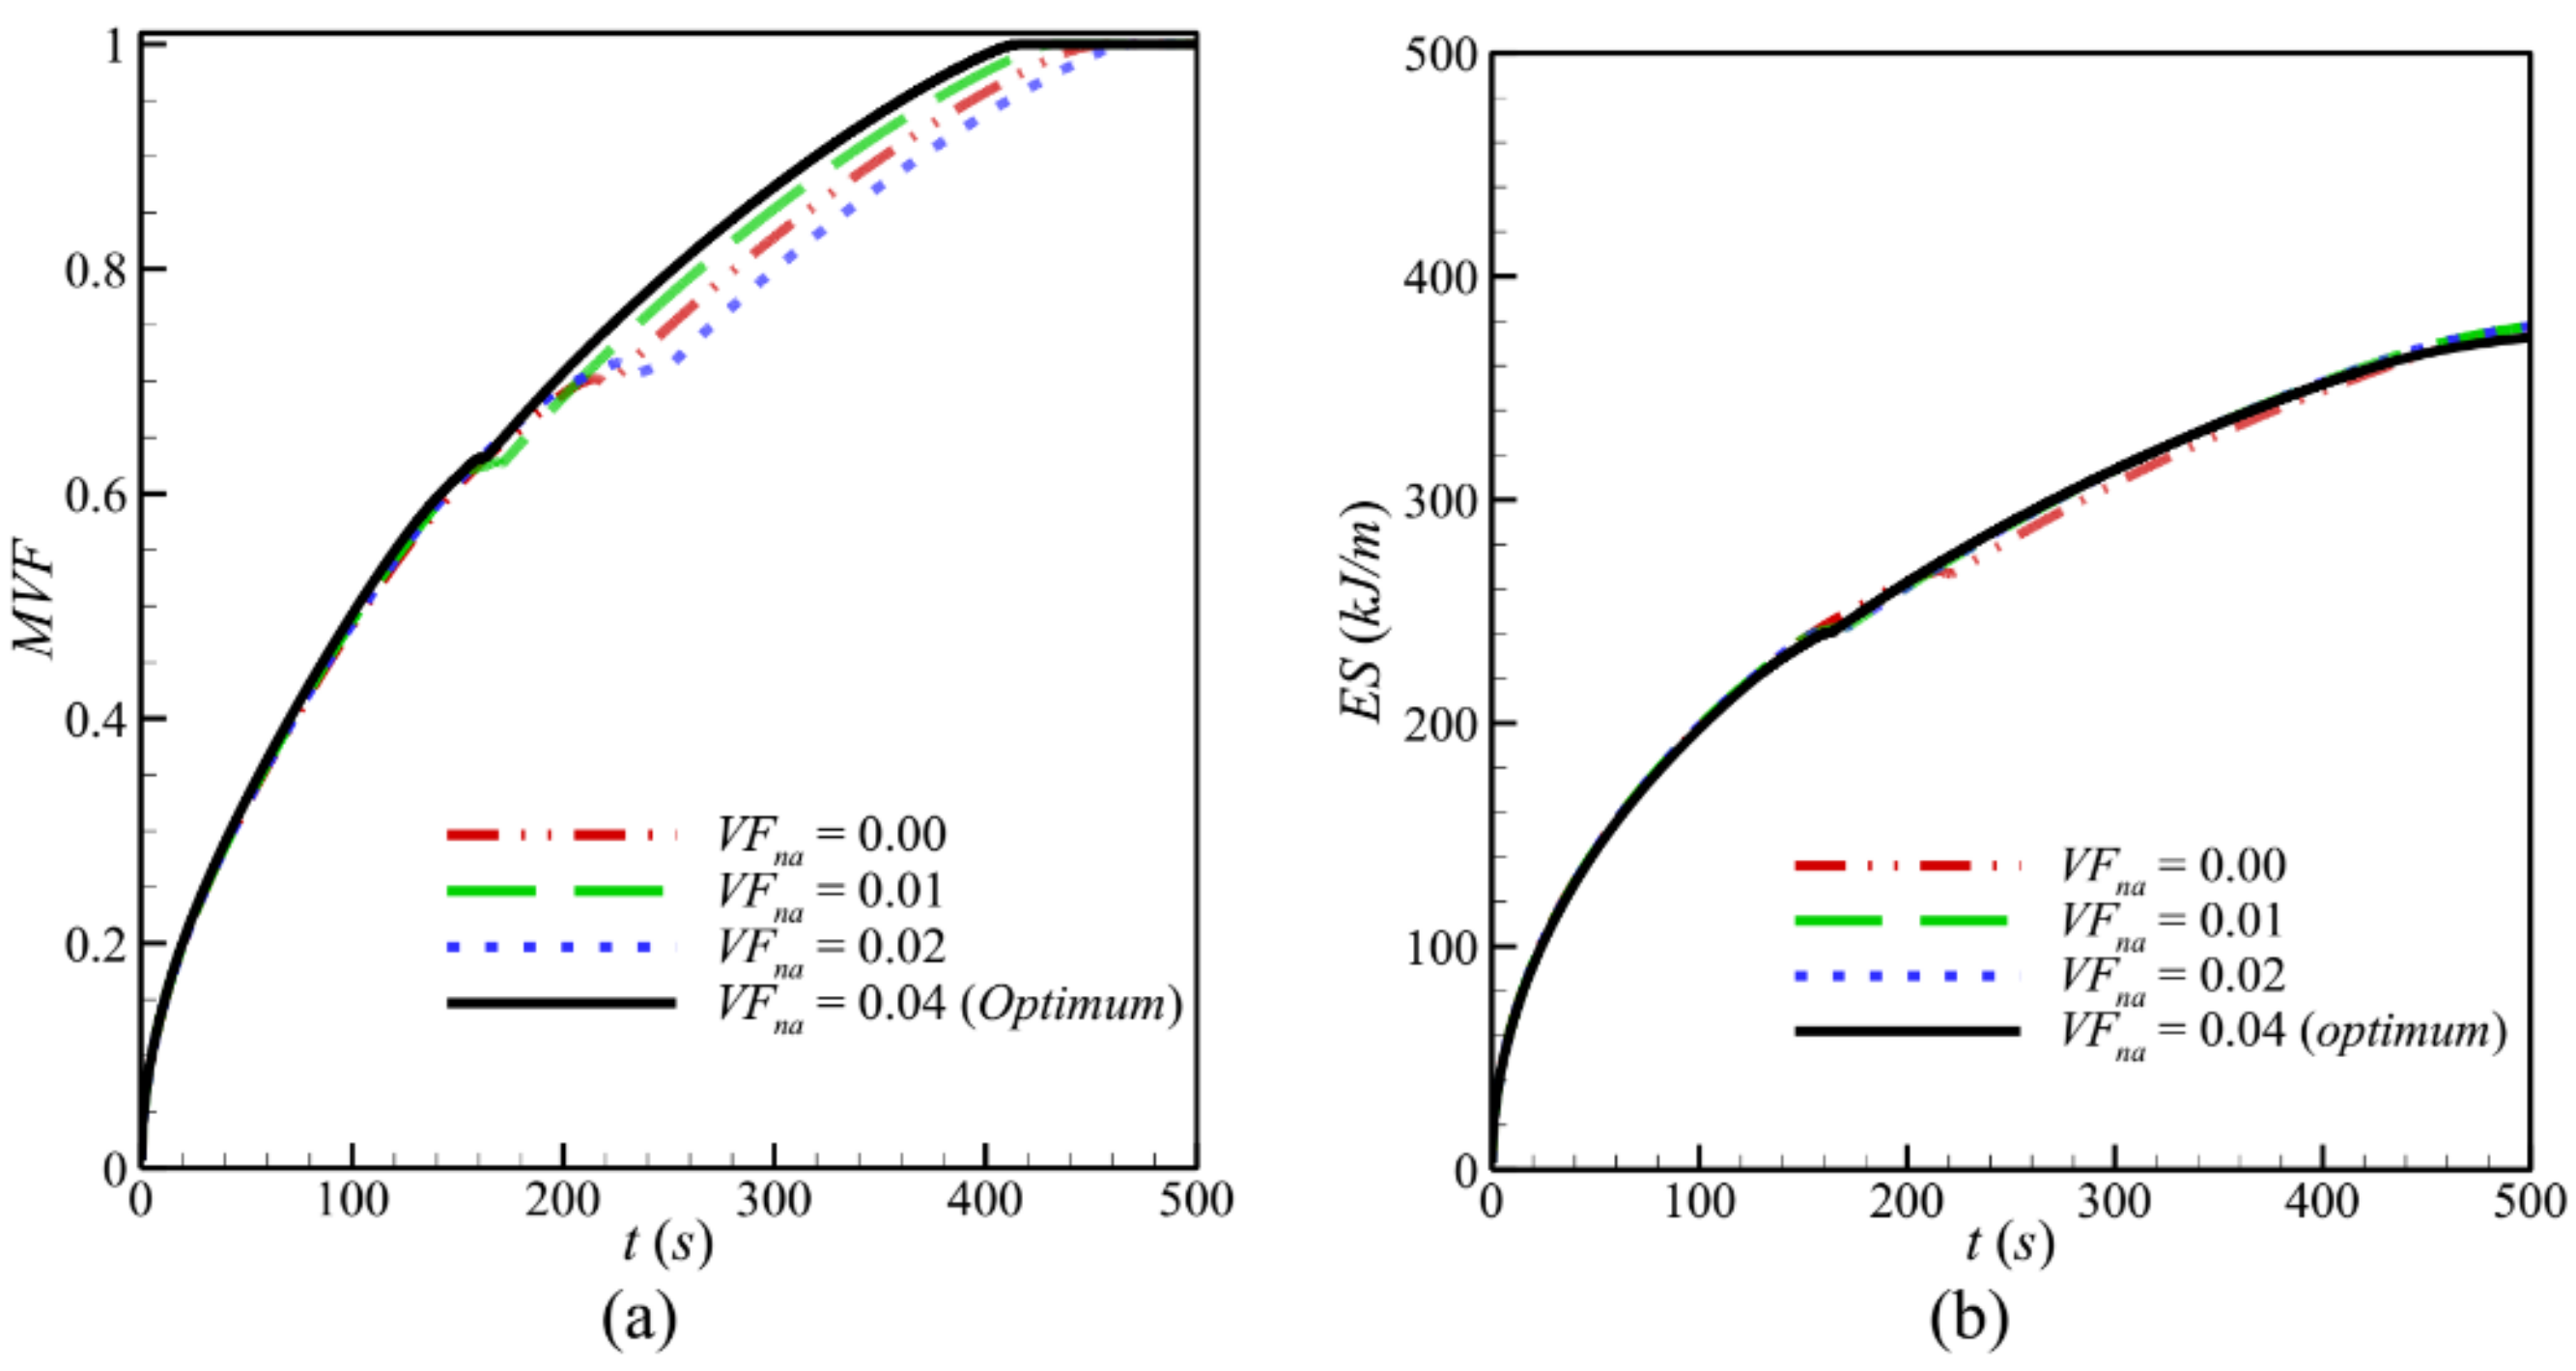
  • Increasing the volume fraction of the nanoparticles improves the effective thermal conductivity of PCM, which enhances heat transfer and accelerates PCM melting. The value that leads to the fastest melting and maximum charging power P is VFna = 0.04.
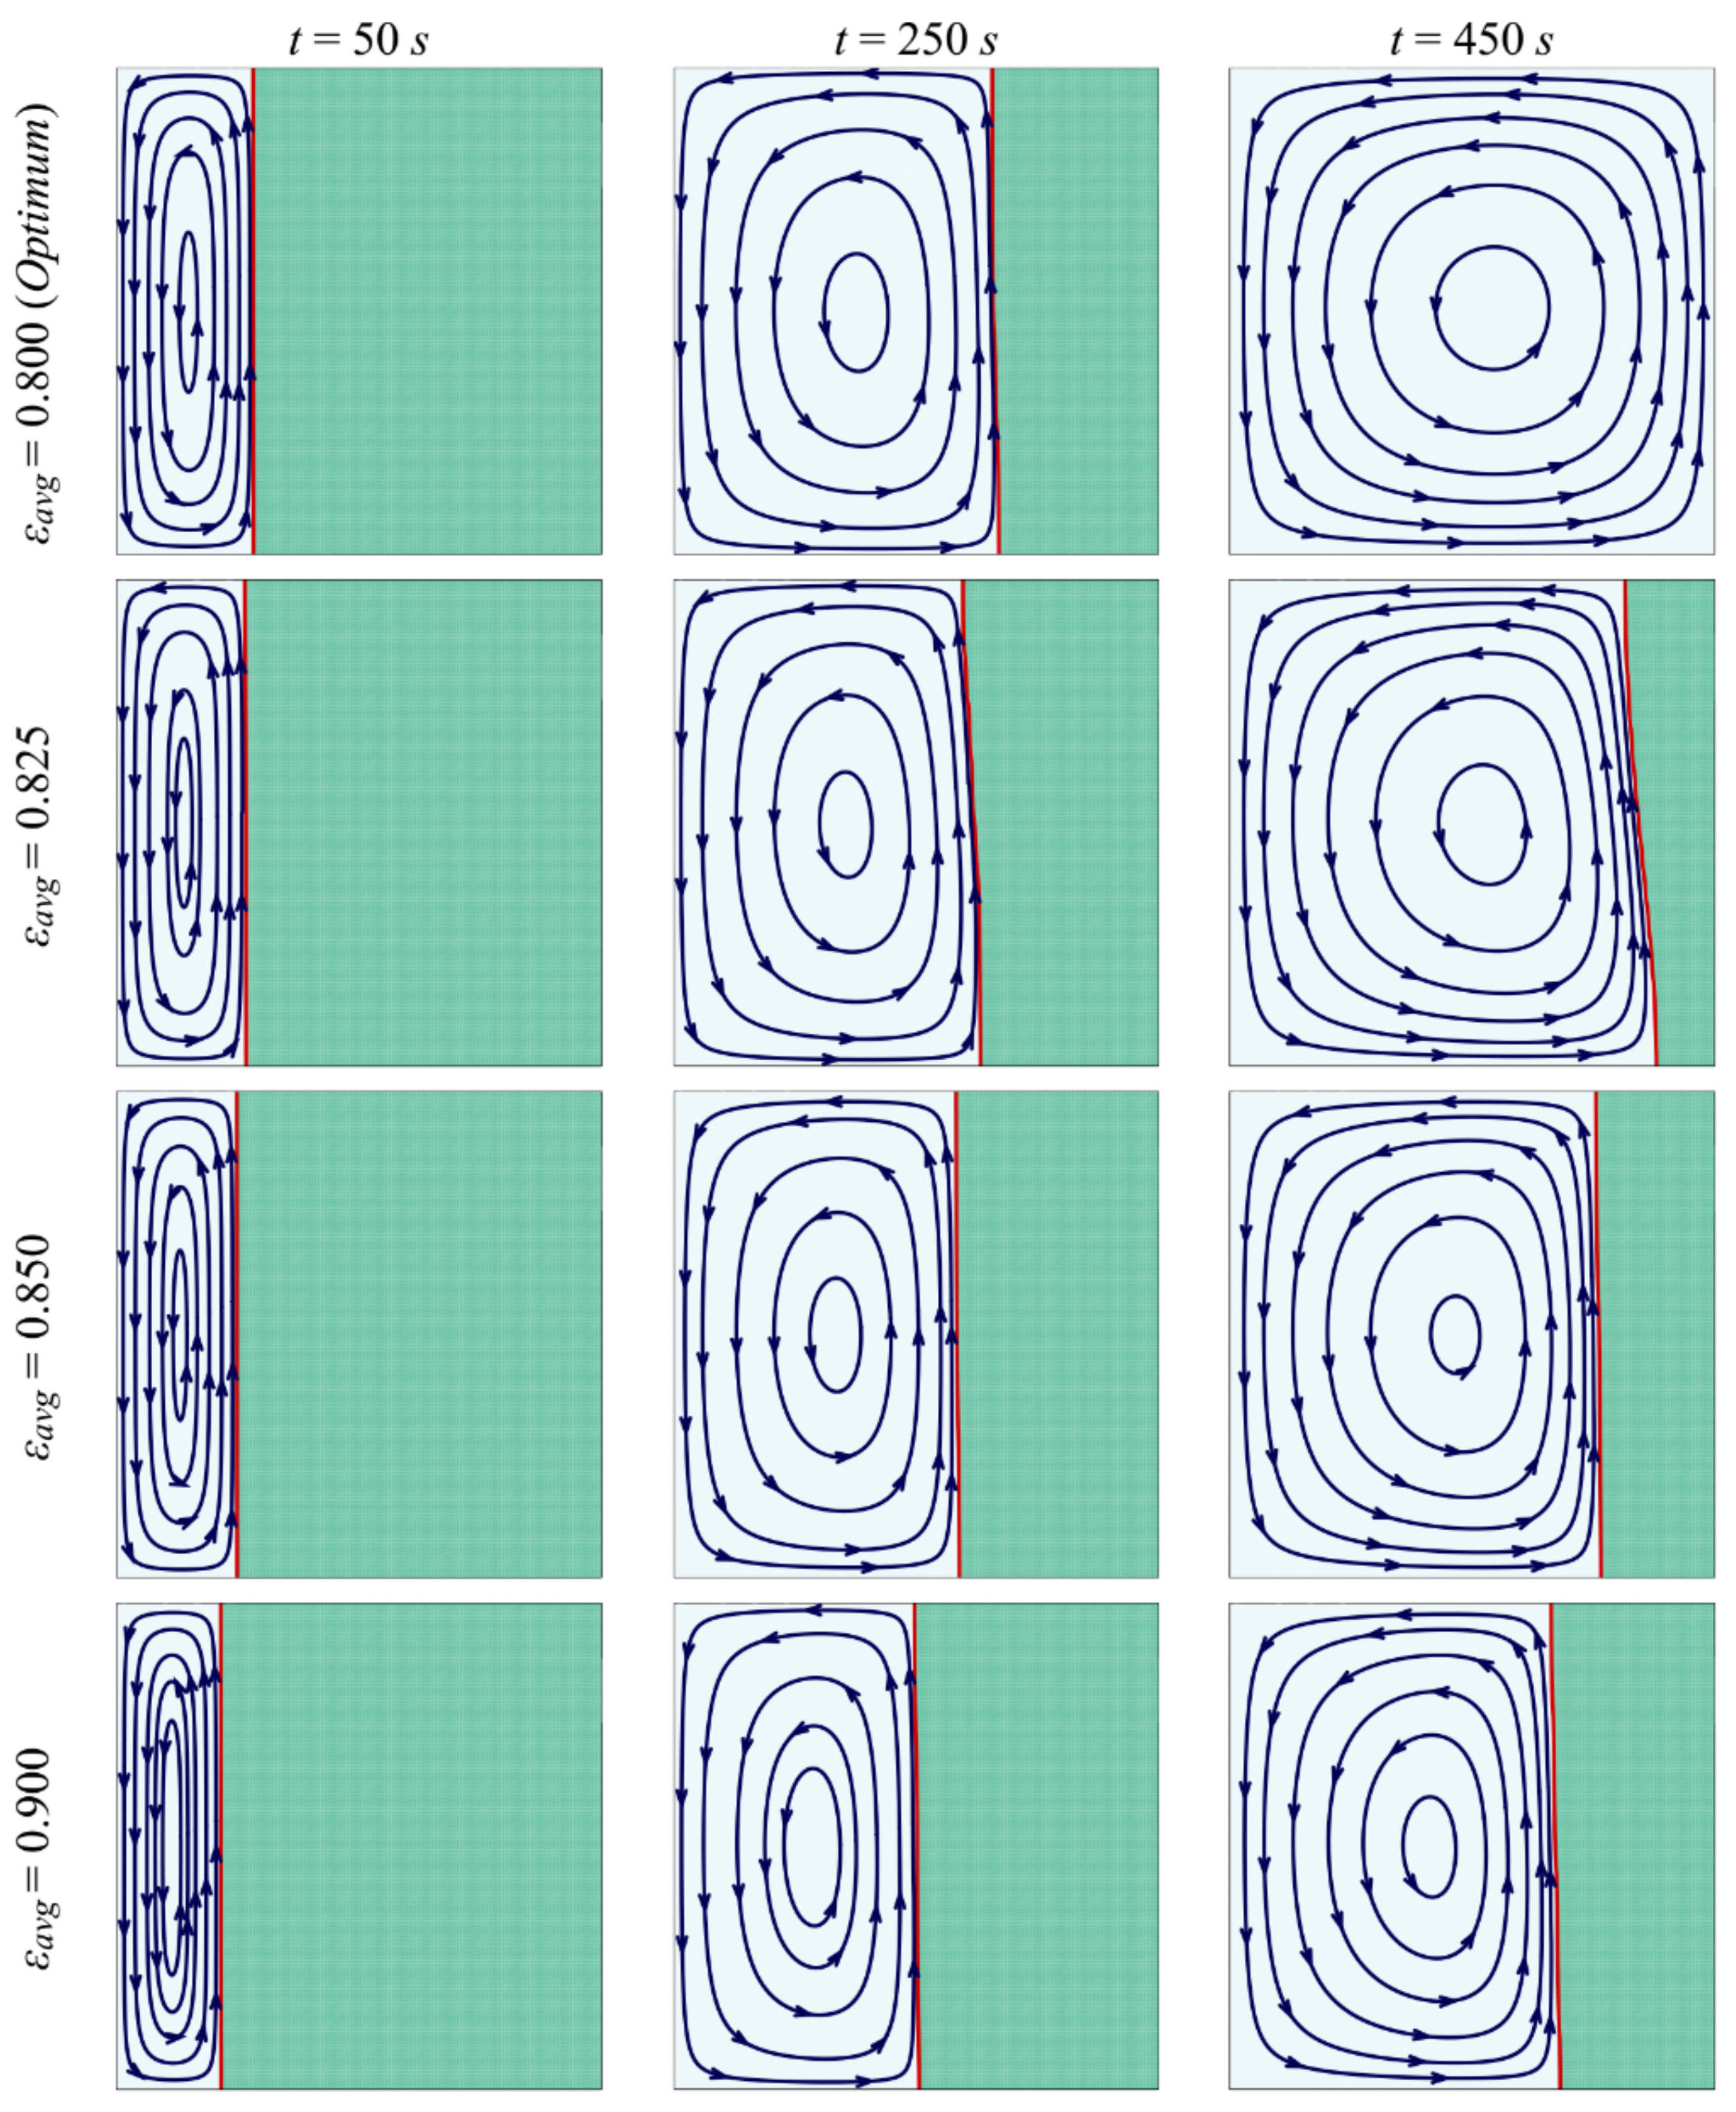
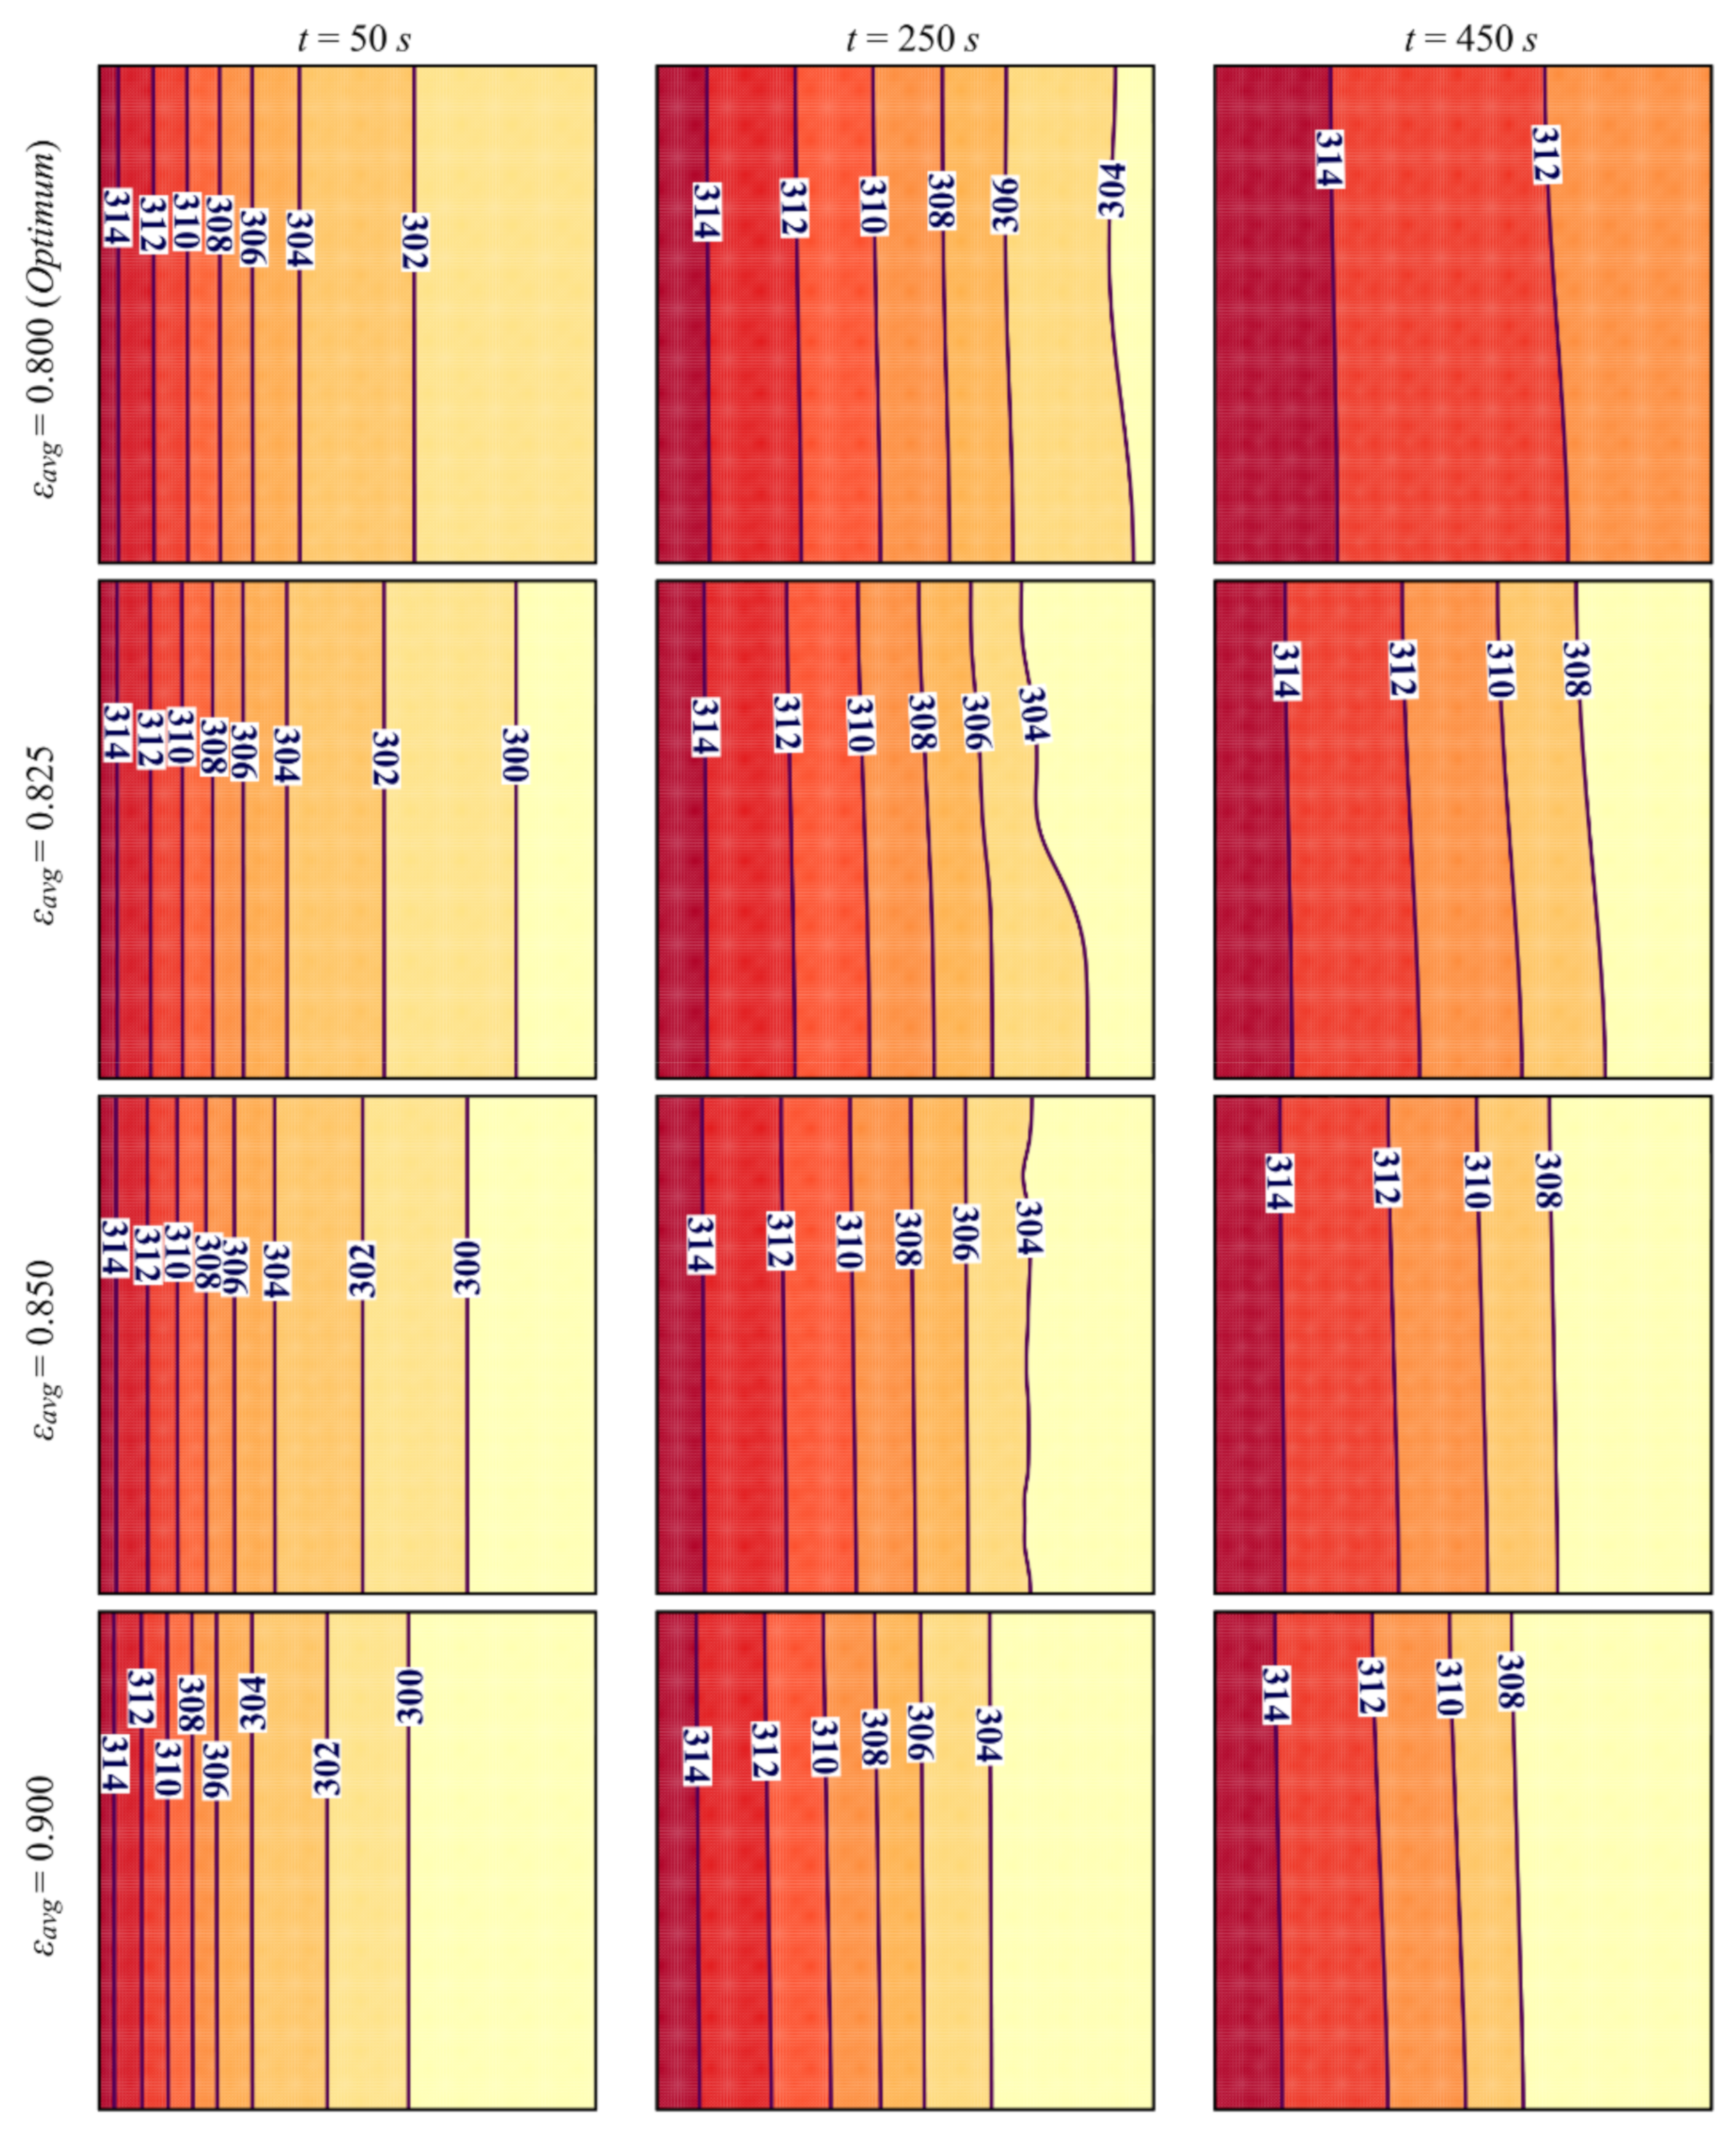
  • Reducing the average porosity εavg of metal foam increased the volume of the metallic matrix and resulted in higher thermal conductivity. This led to faster PCM melting and higher stored energy and charging power. The lowest melting duration was obtained for εavg = 0.8.
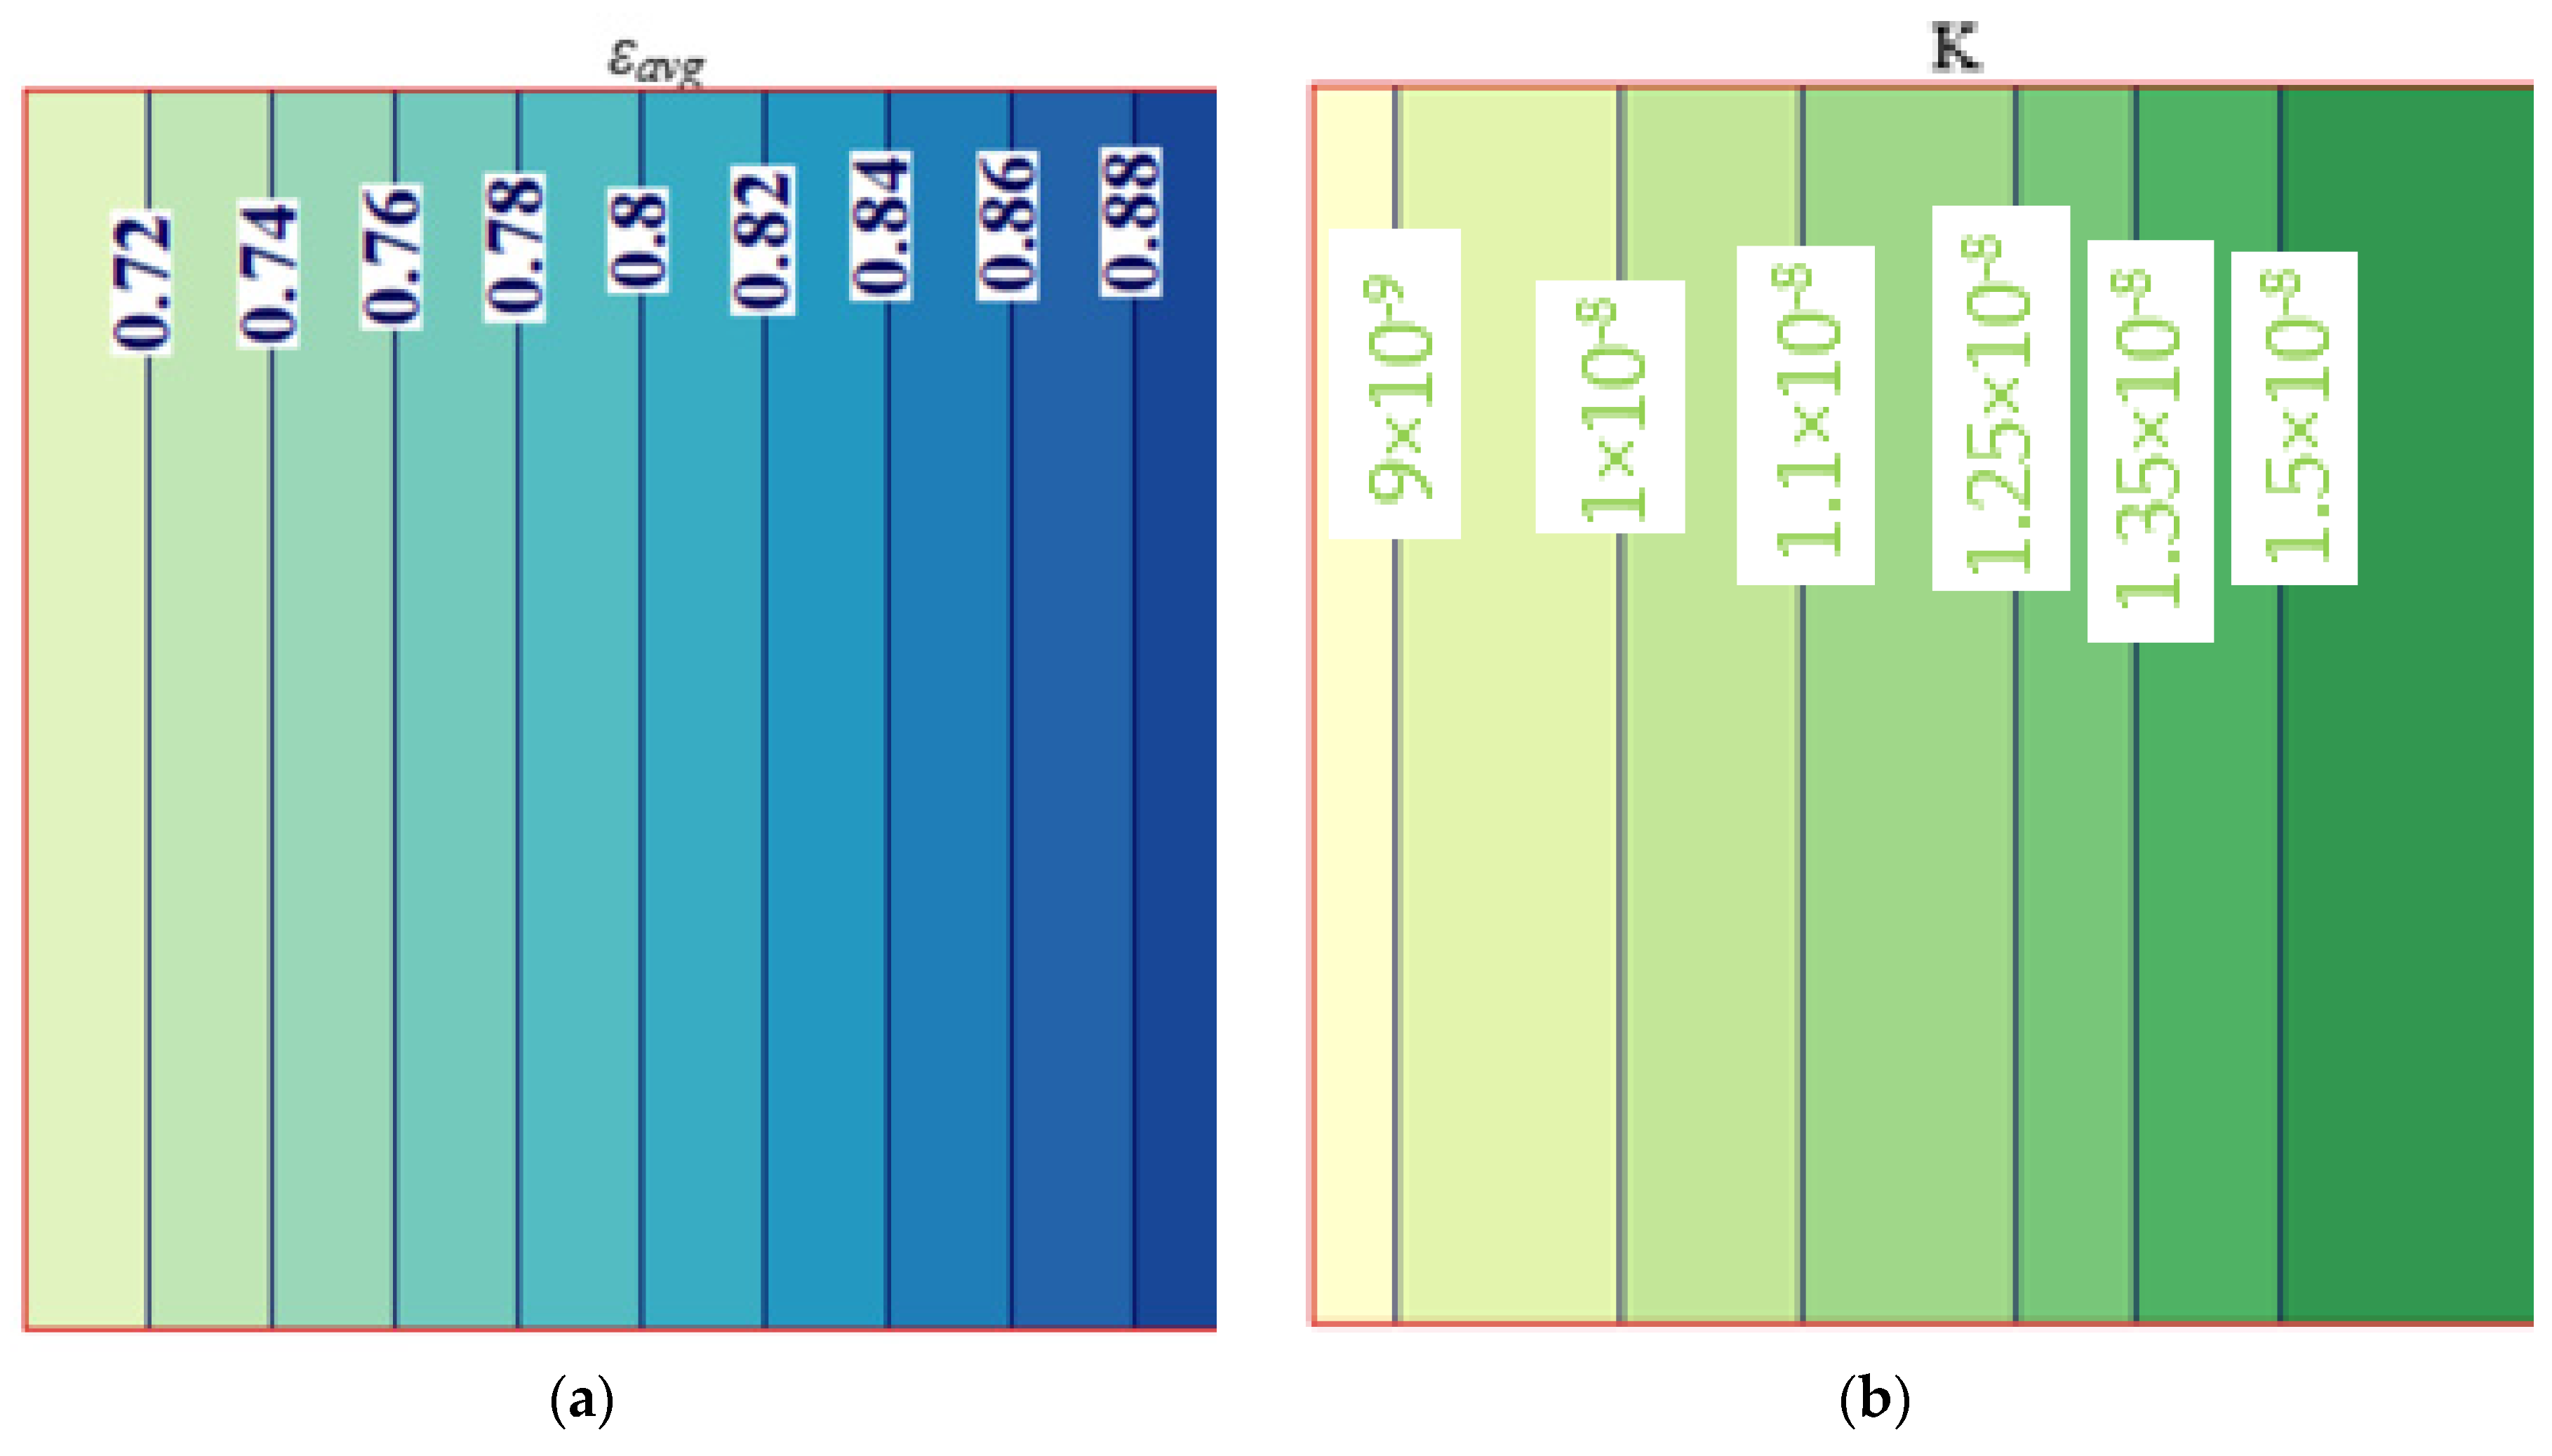
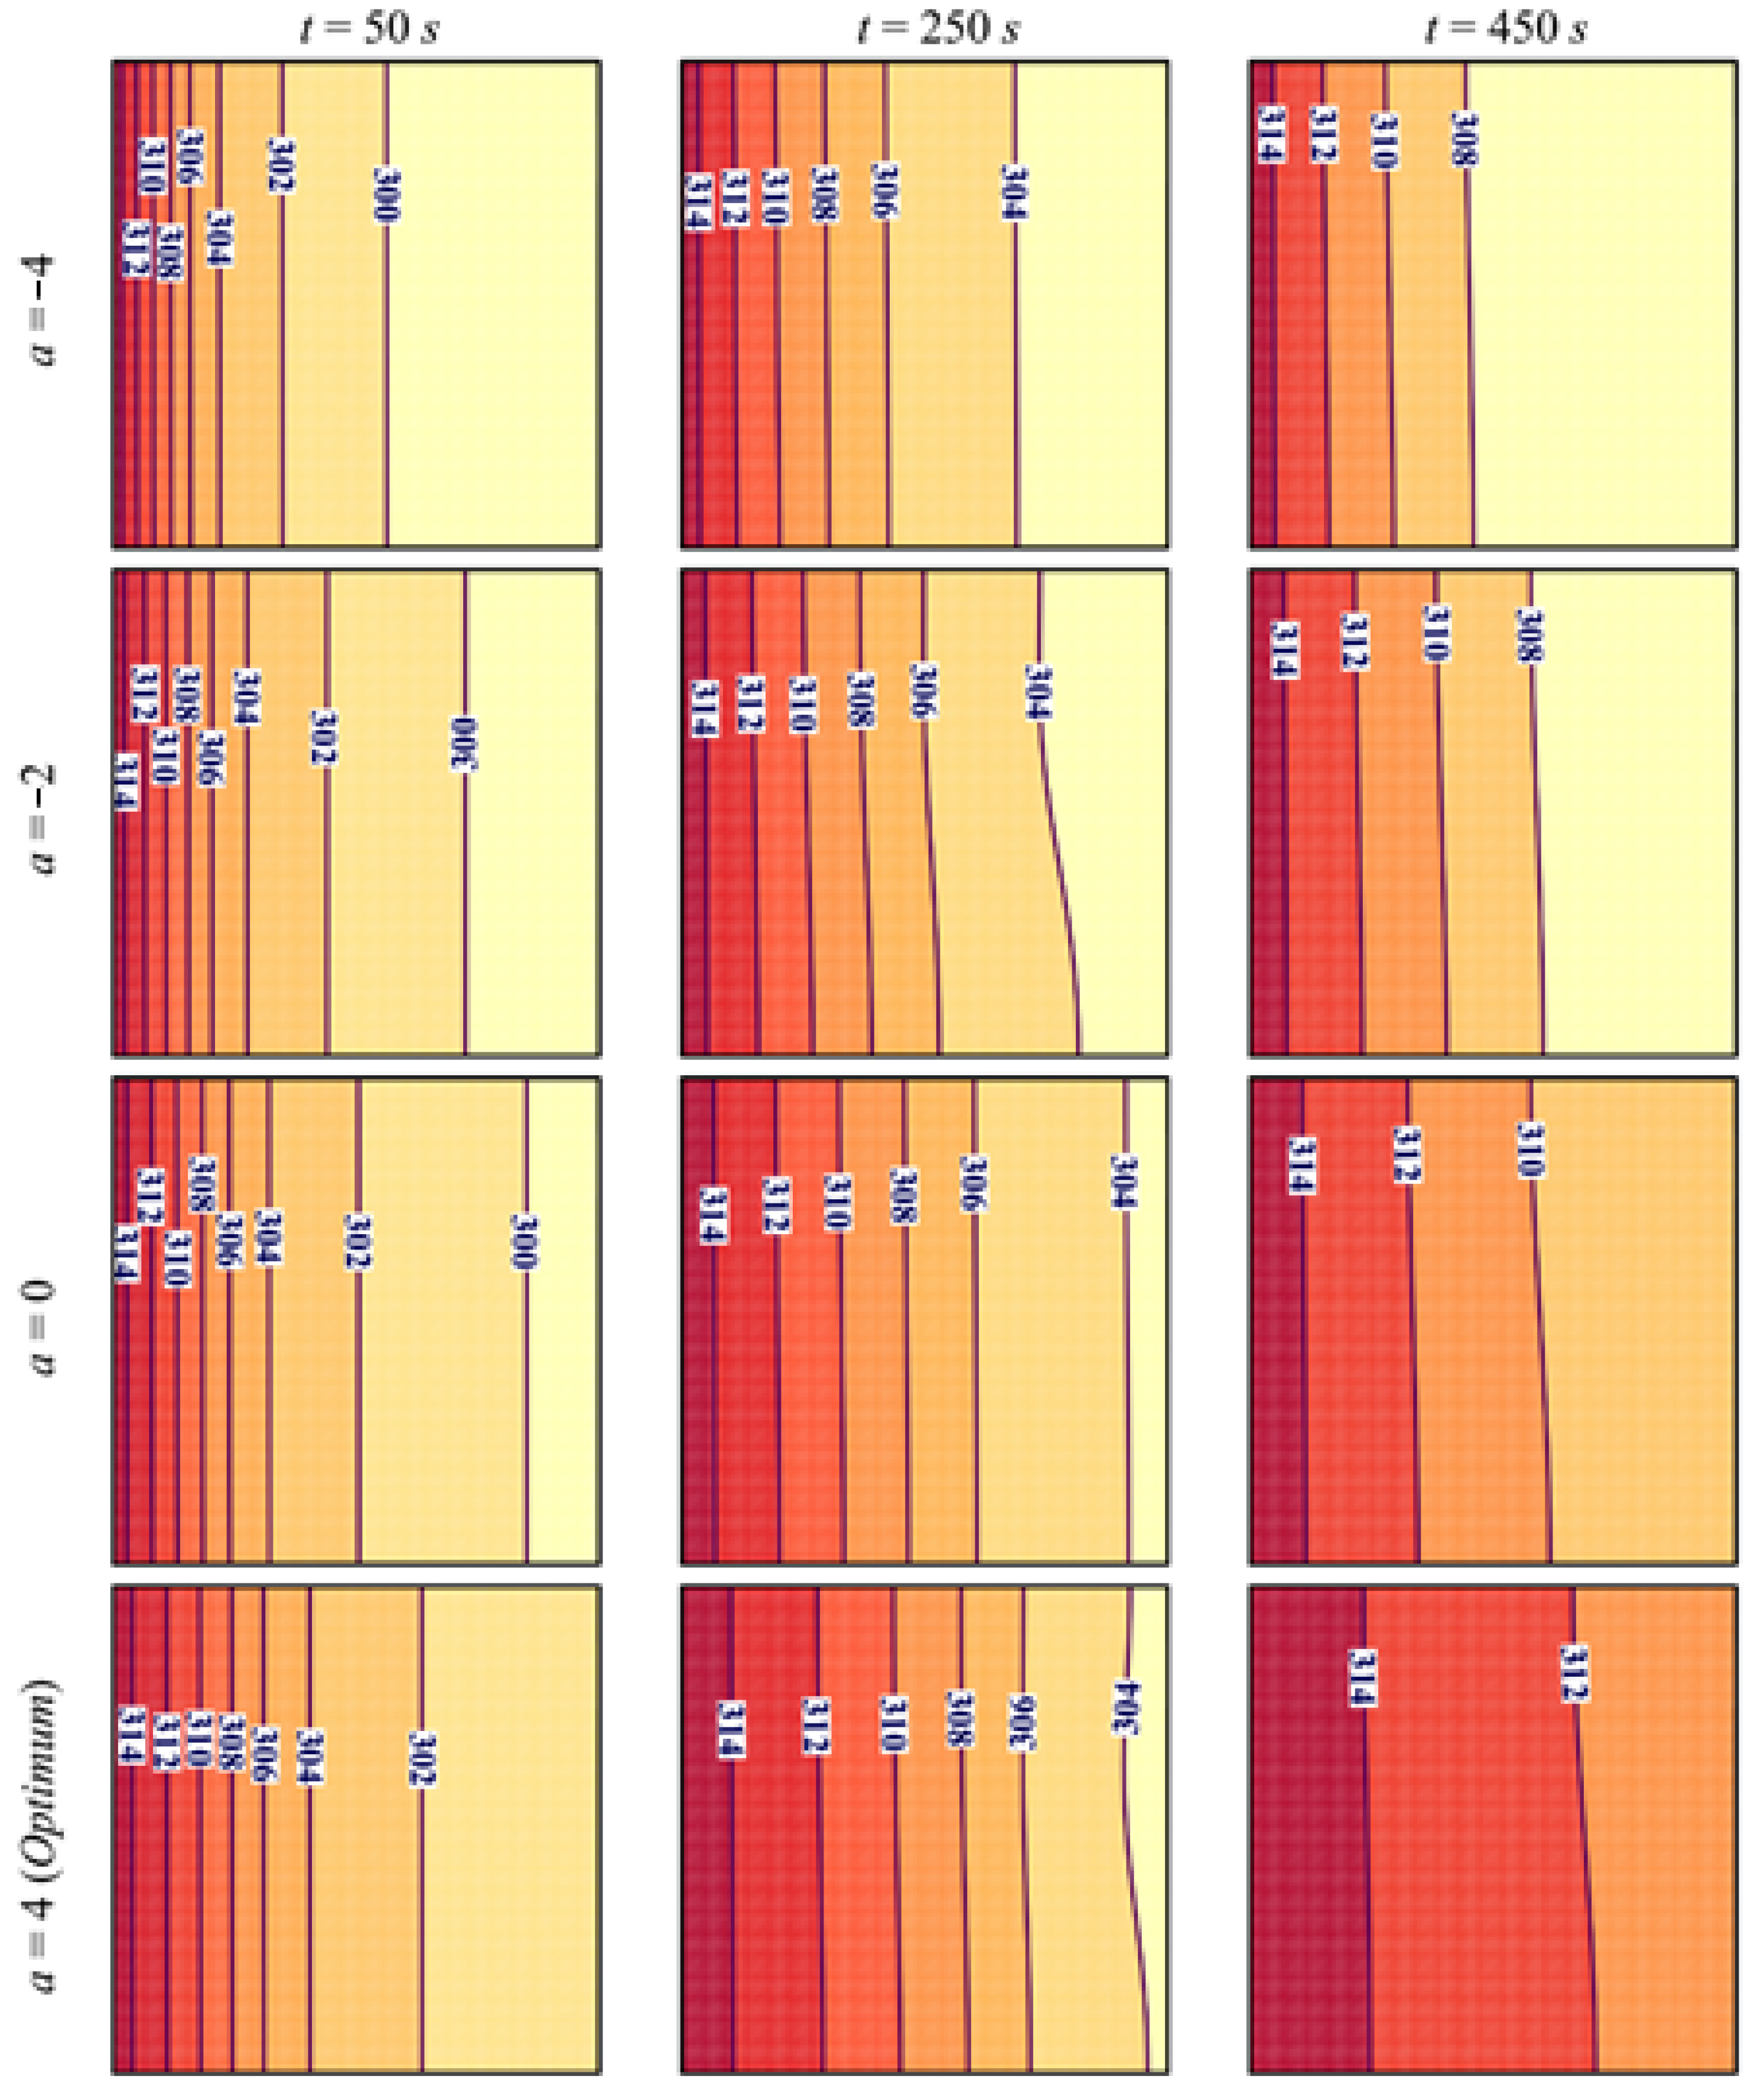
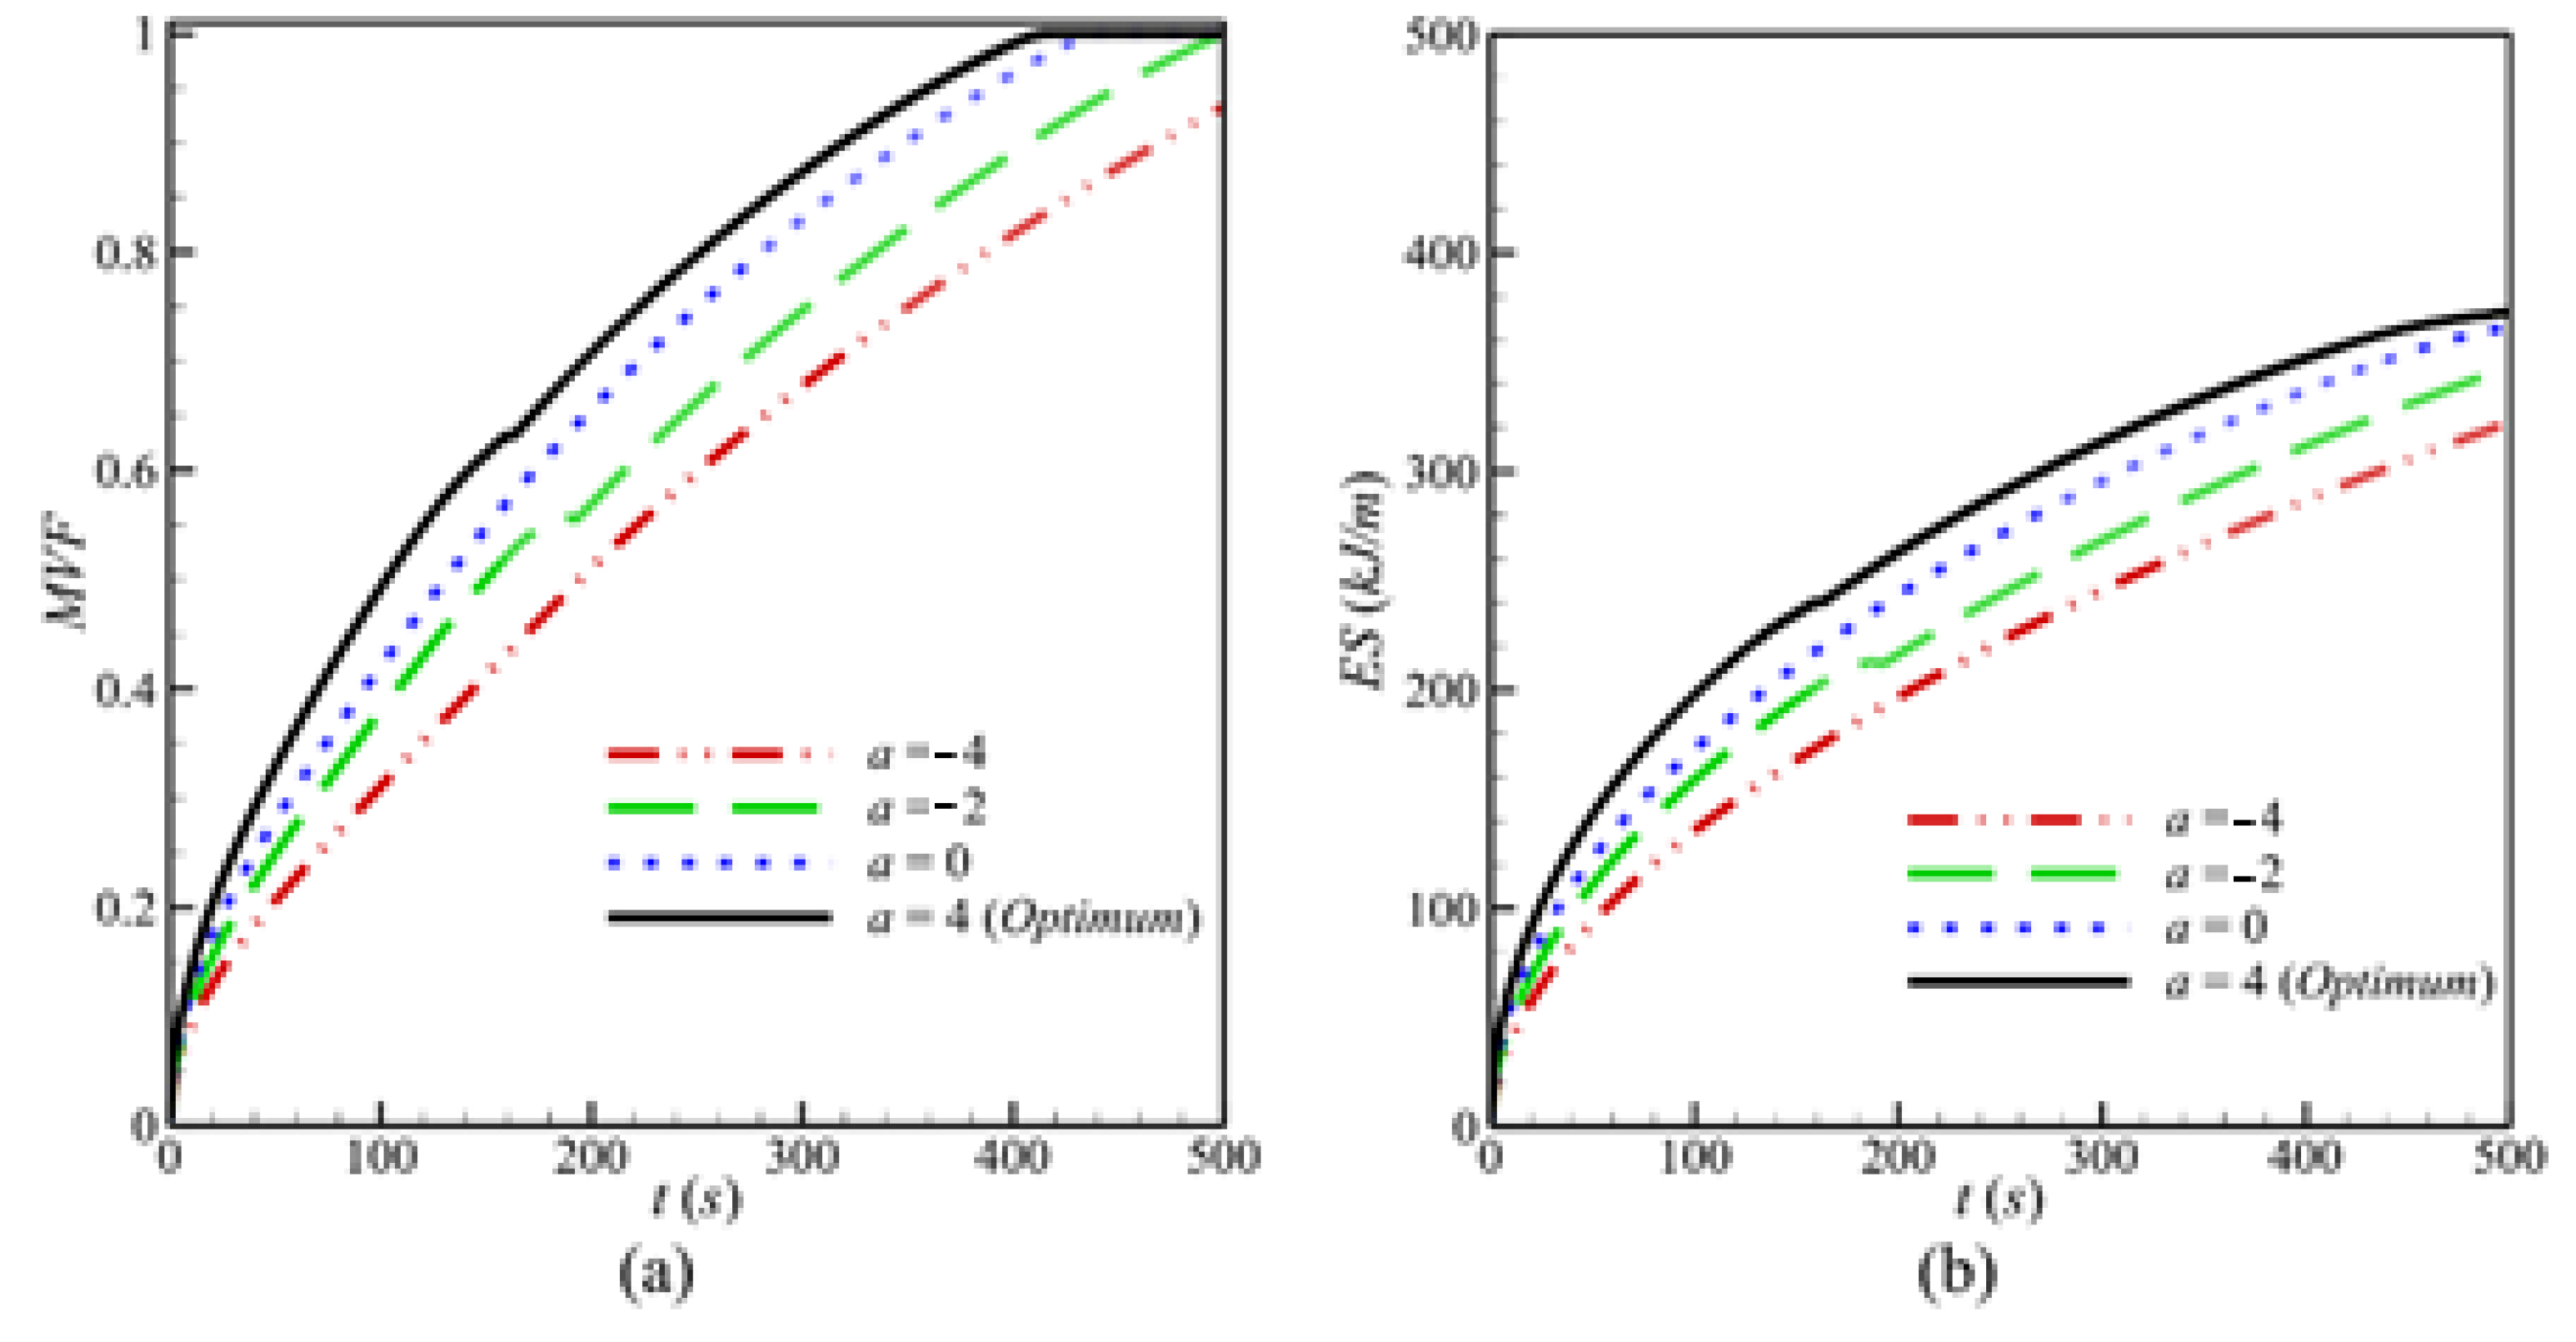
  • At a constant average porosity, using a higher positive porosity gradient a, defined from the left hot wall toward the right, enhances conductive heat transfer near the left region with low porosity in initial stages and the convective heat transfer in the right side of the cavity in the final stages. The opposite occurs when lower and negative values of a are used. Melting duration is minimized for a = 4.
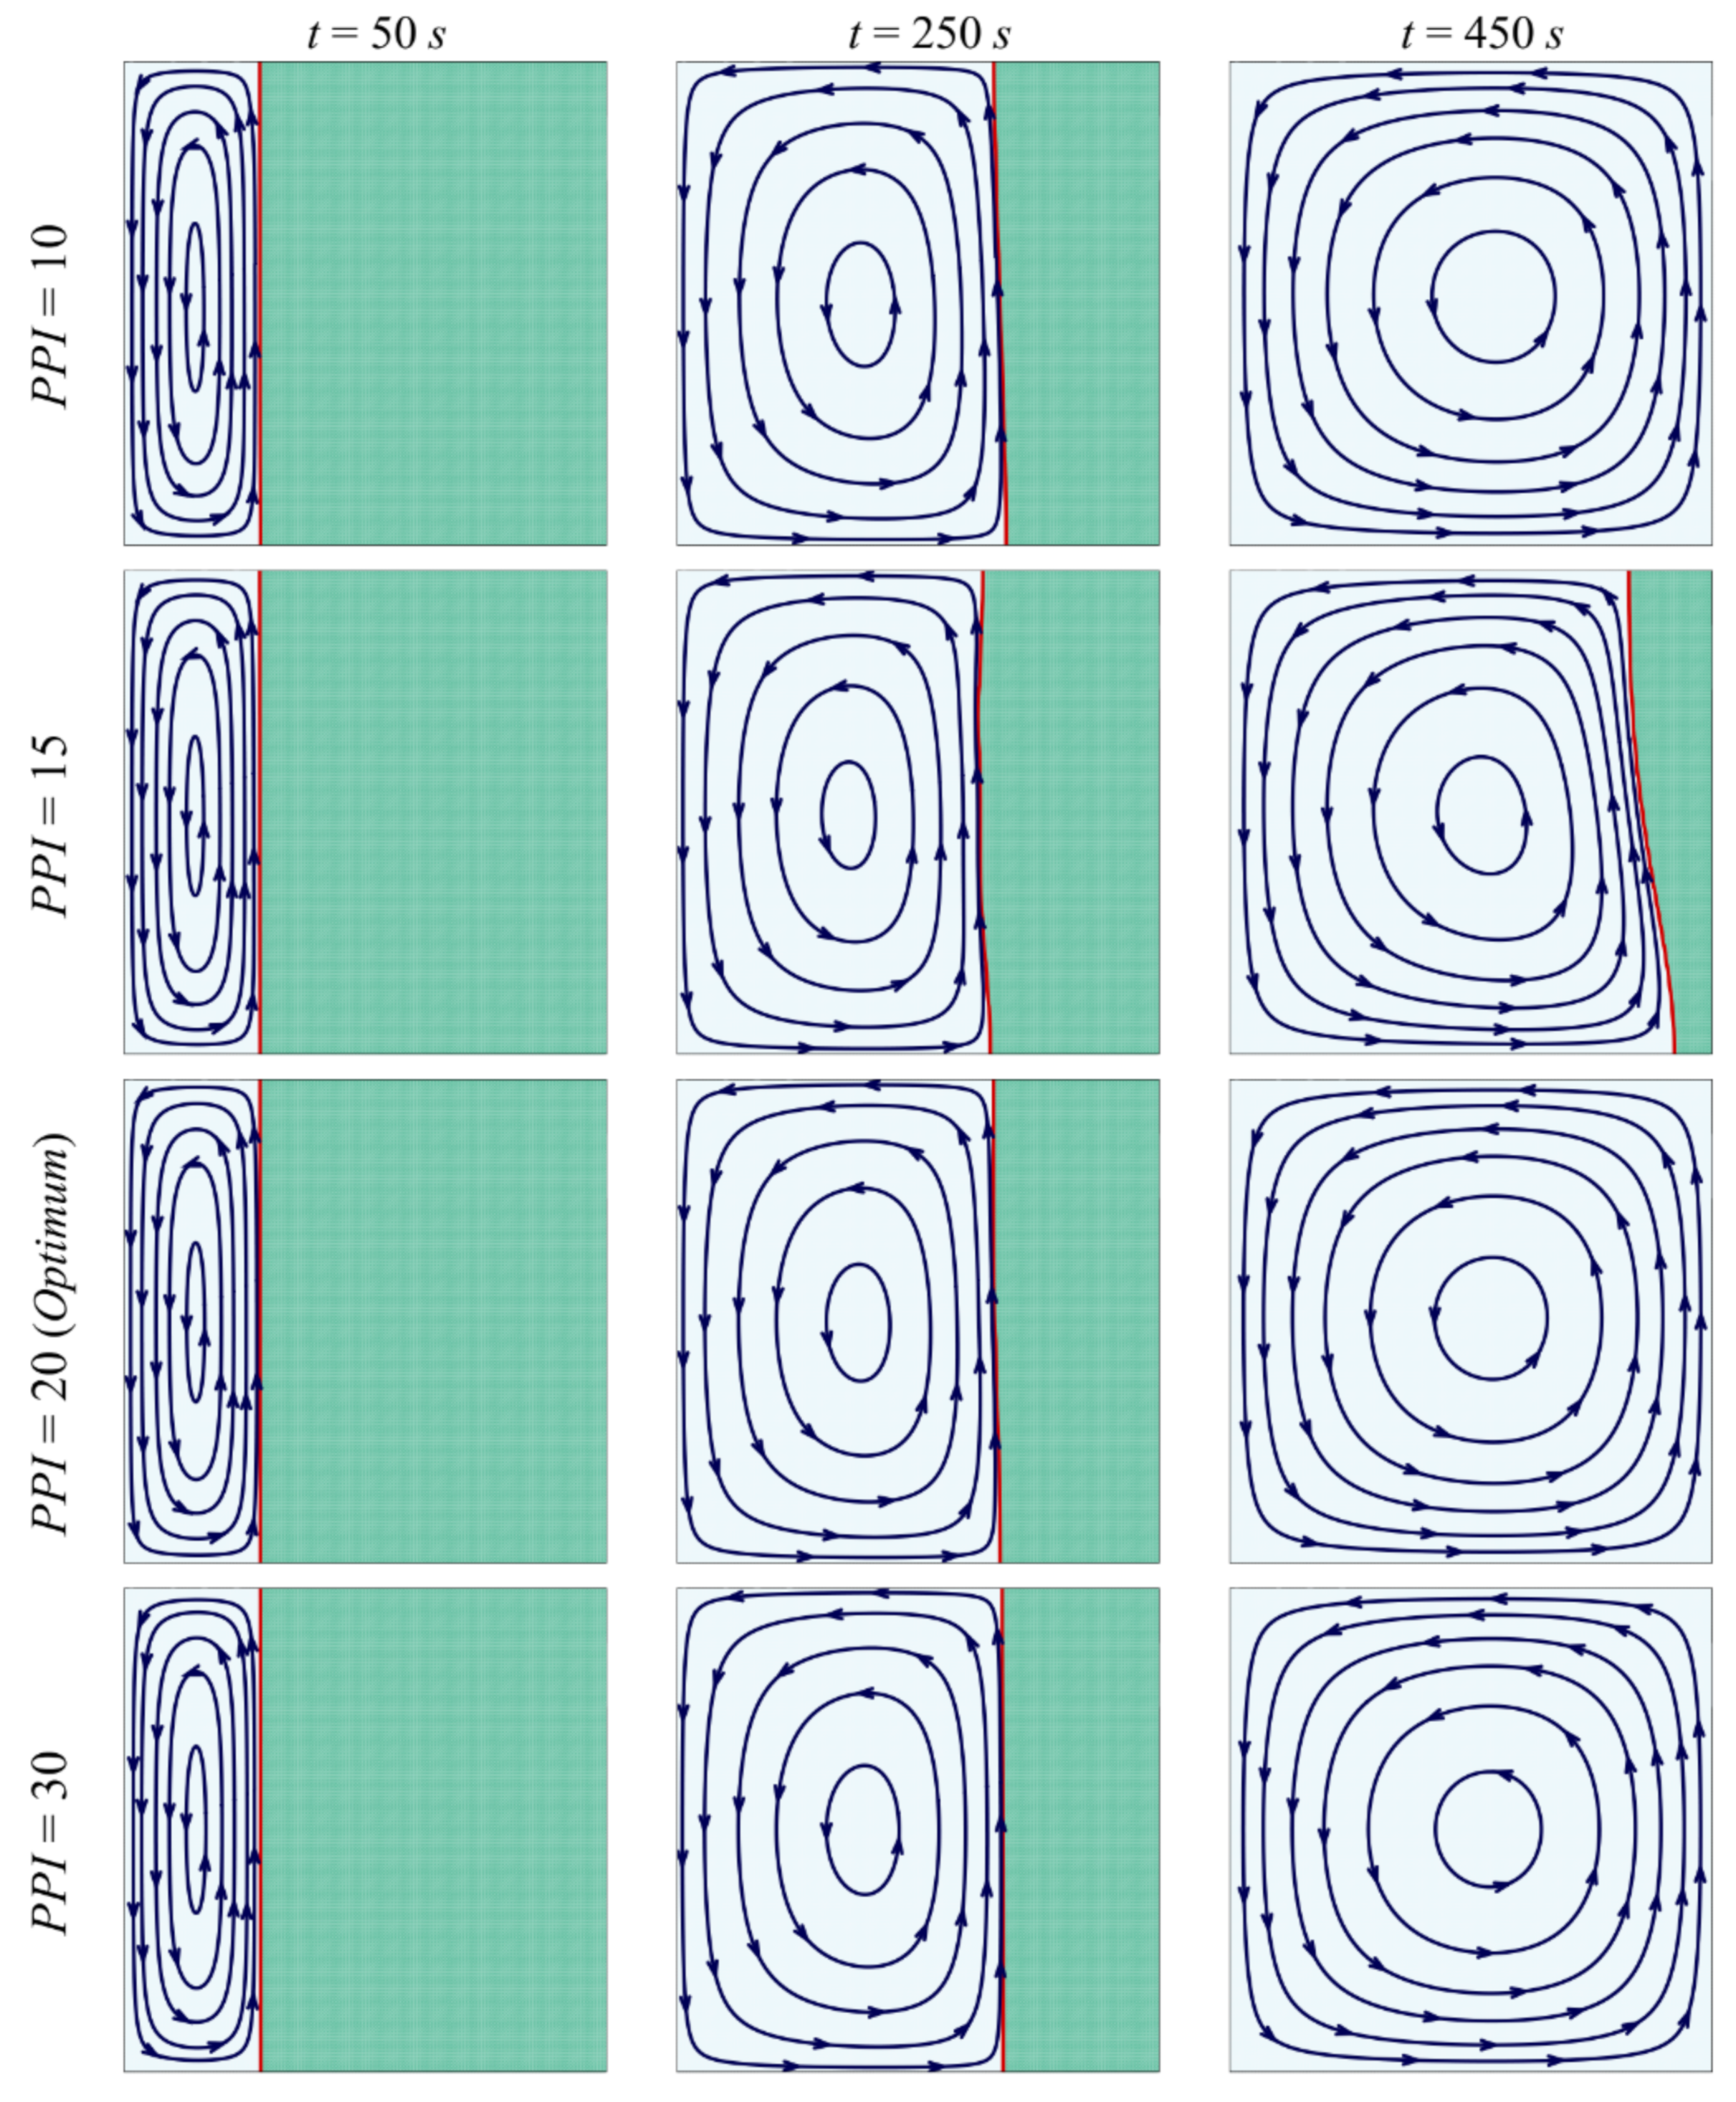
  • Raising the PPI presents two effects. First, it reduces the thickness of the solid matrix, which diminishes effective thermal conductivity. Second, it increases surface contact and improves the heat transfer between metal foam and PCM. The balance between these two effects leads to a slight overall impact of PPI on the charging power.
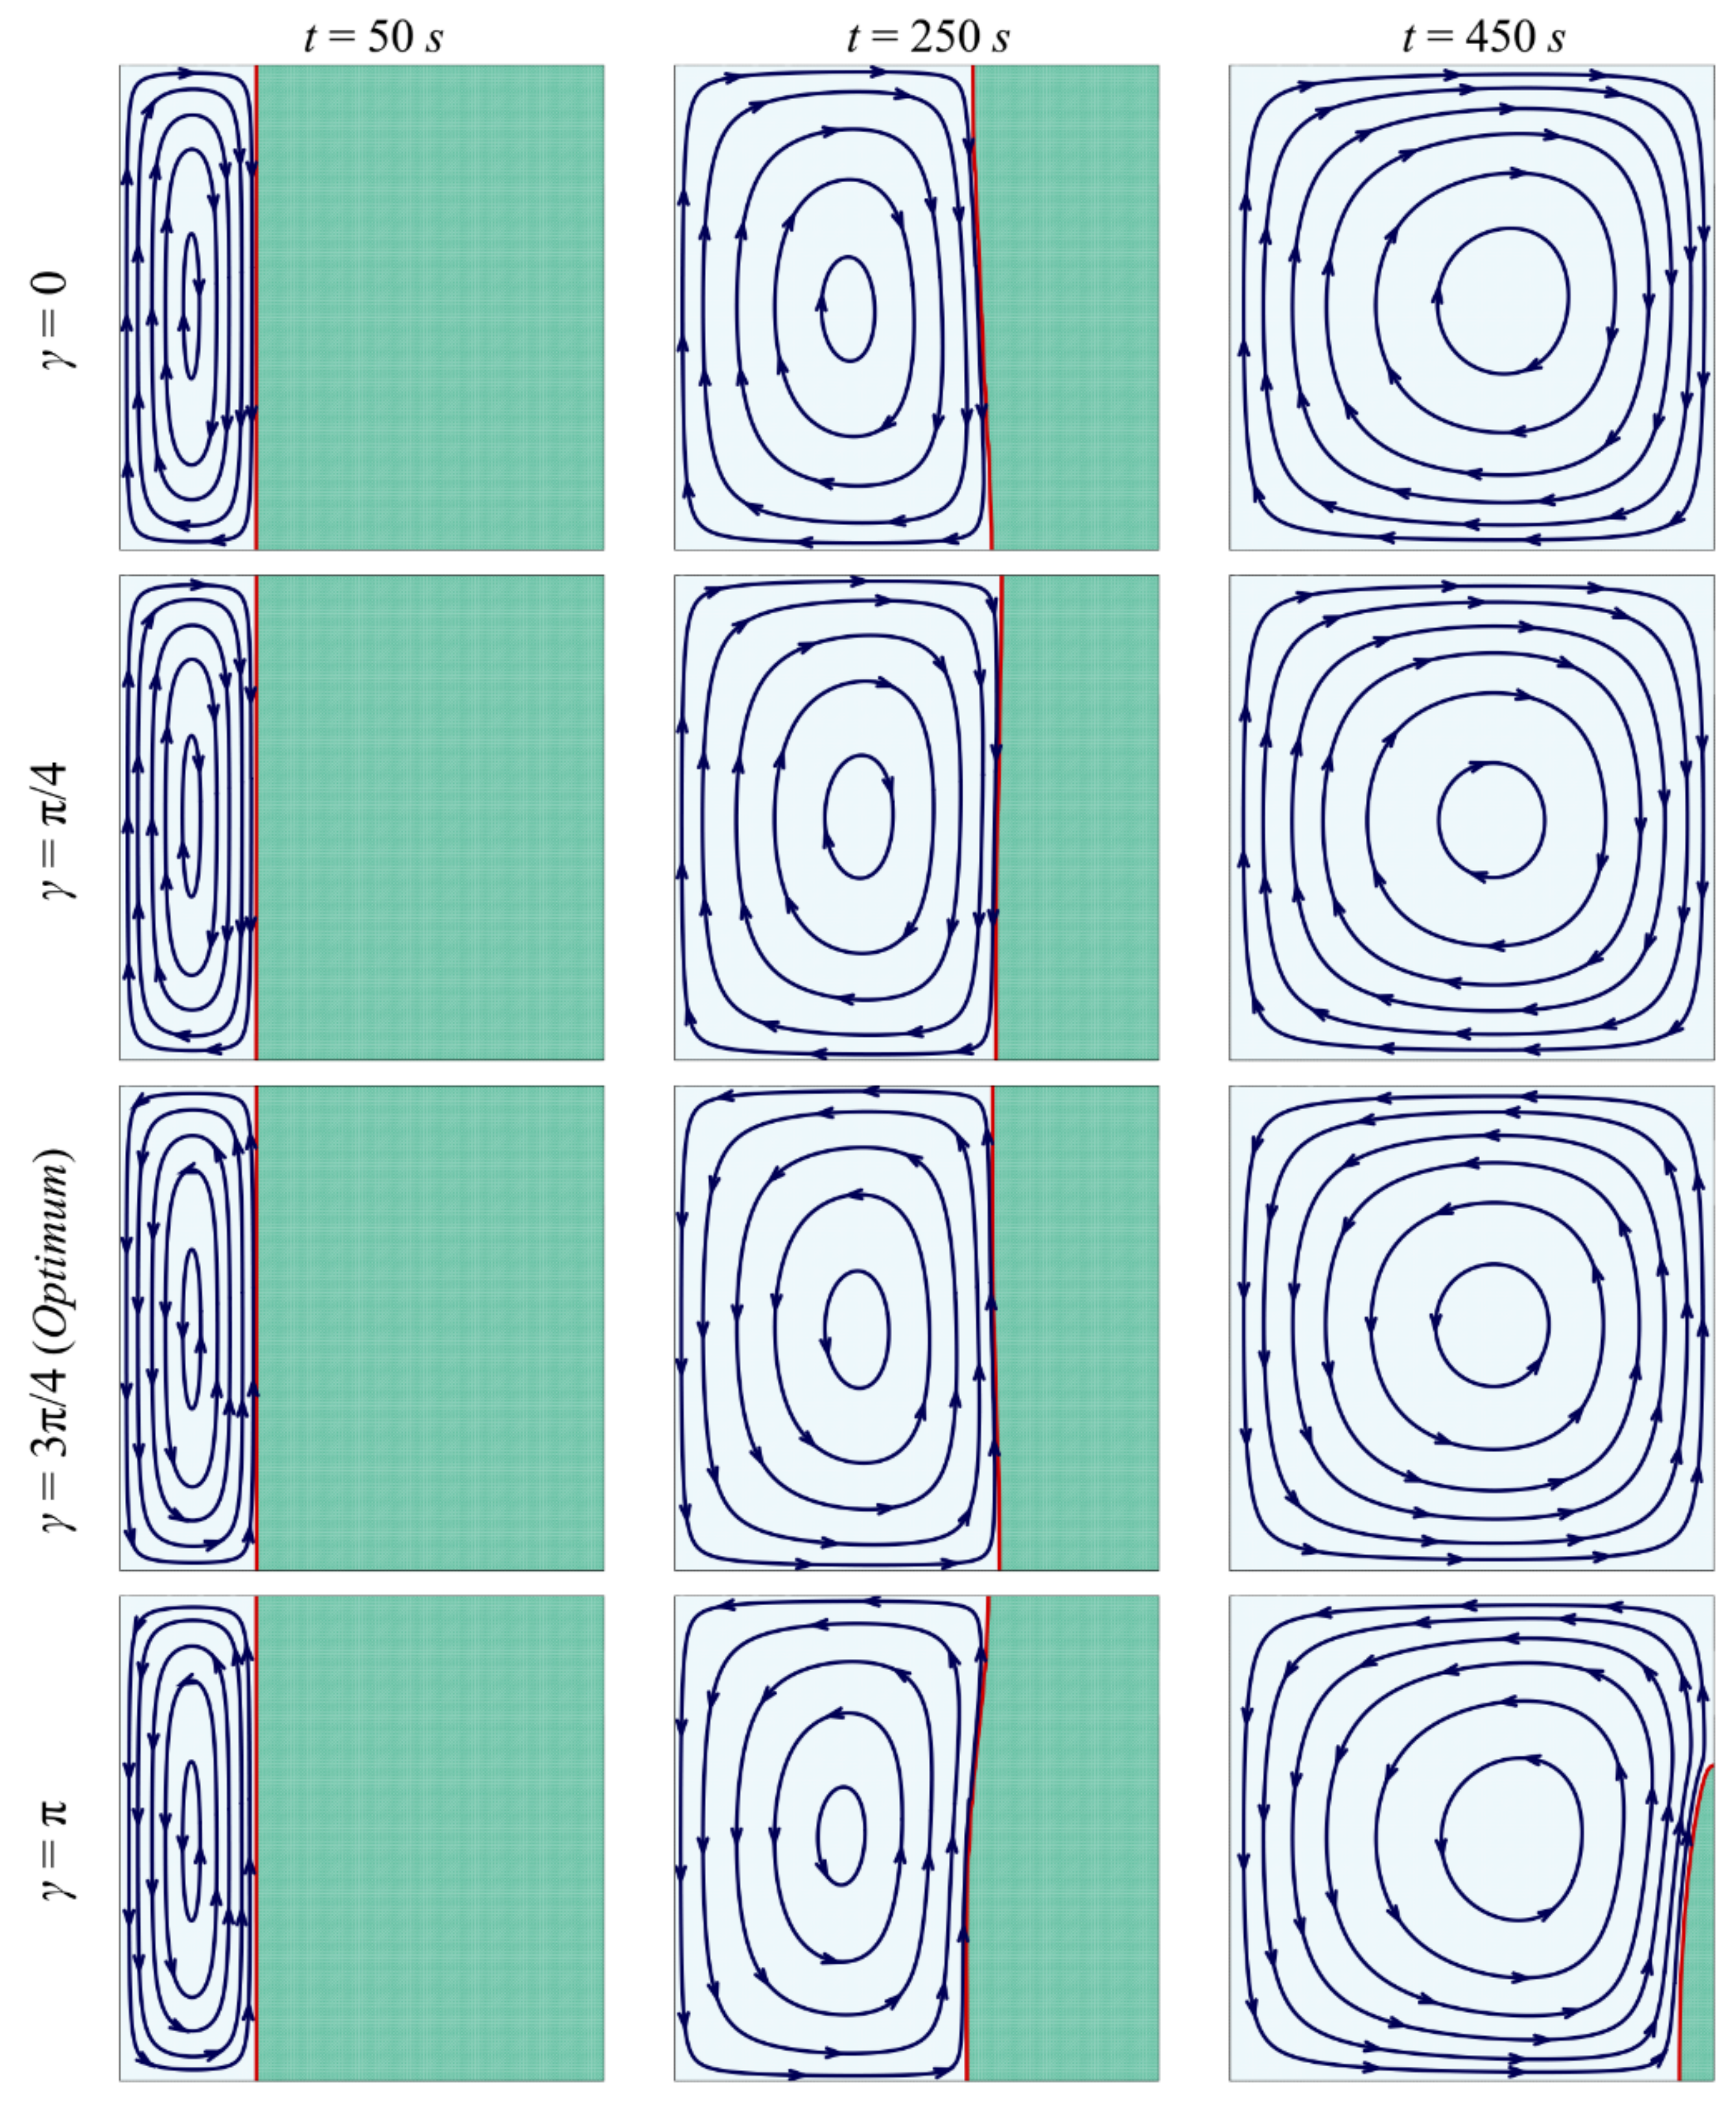
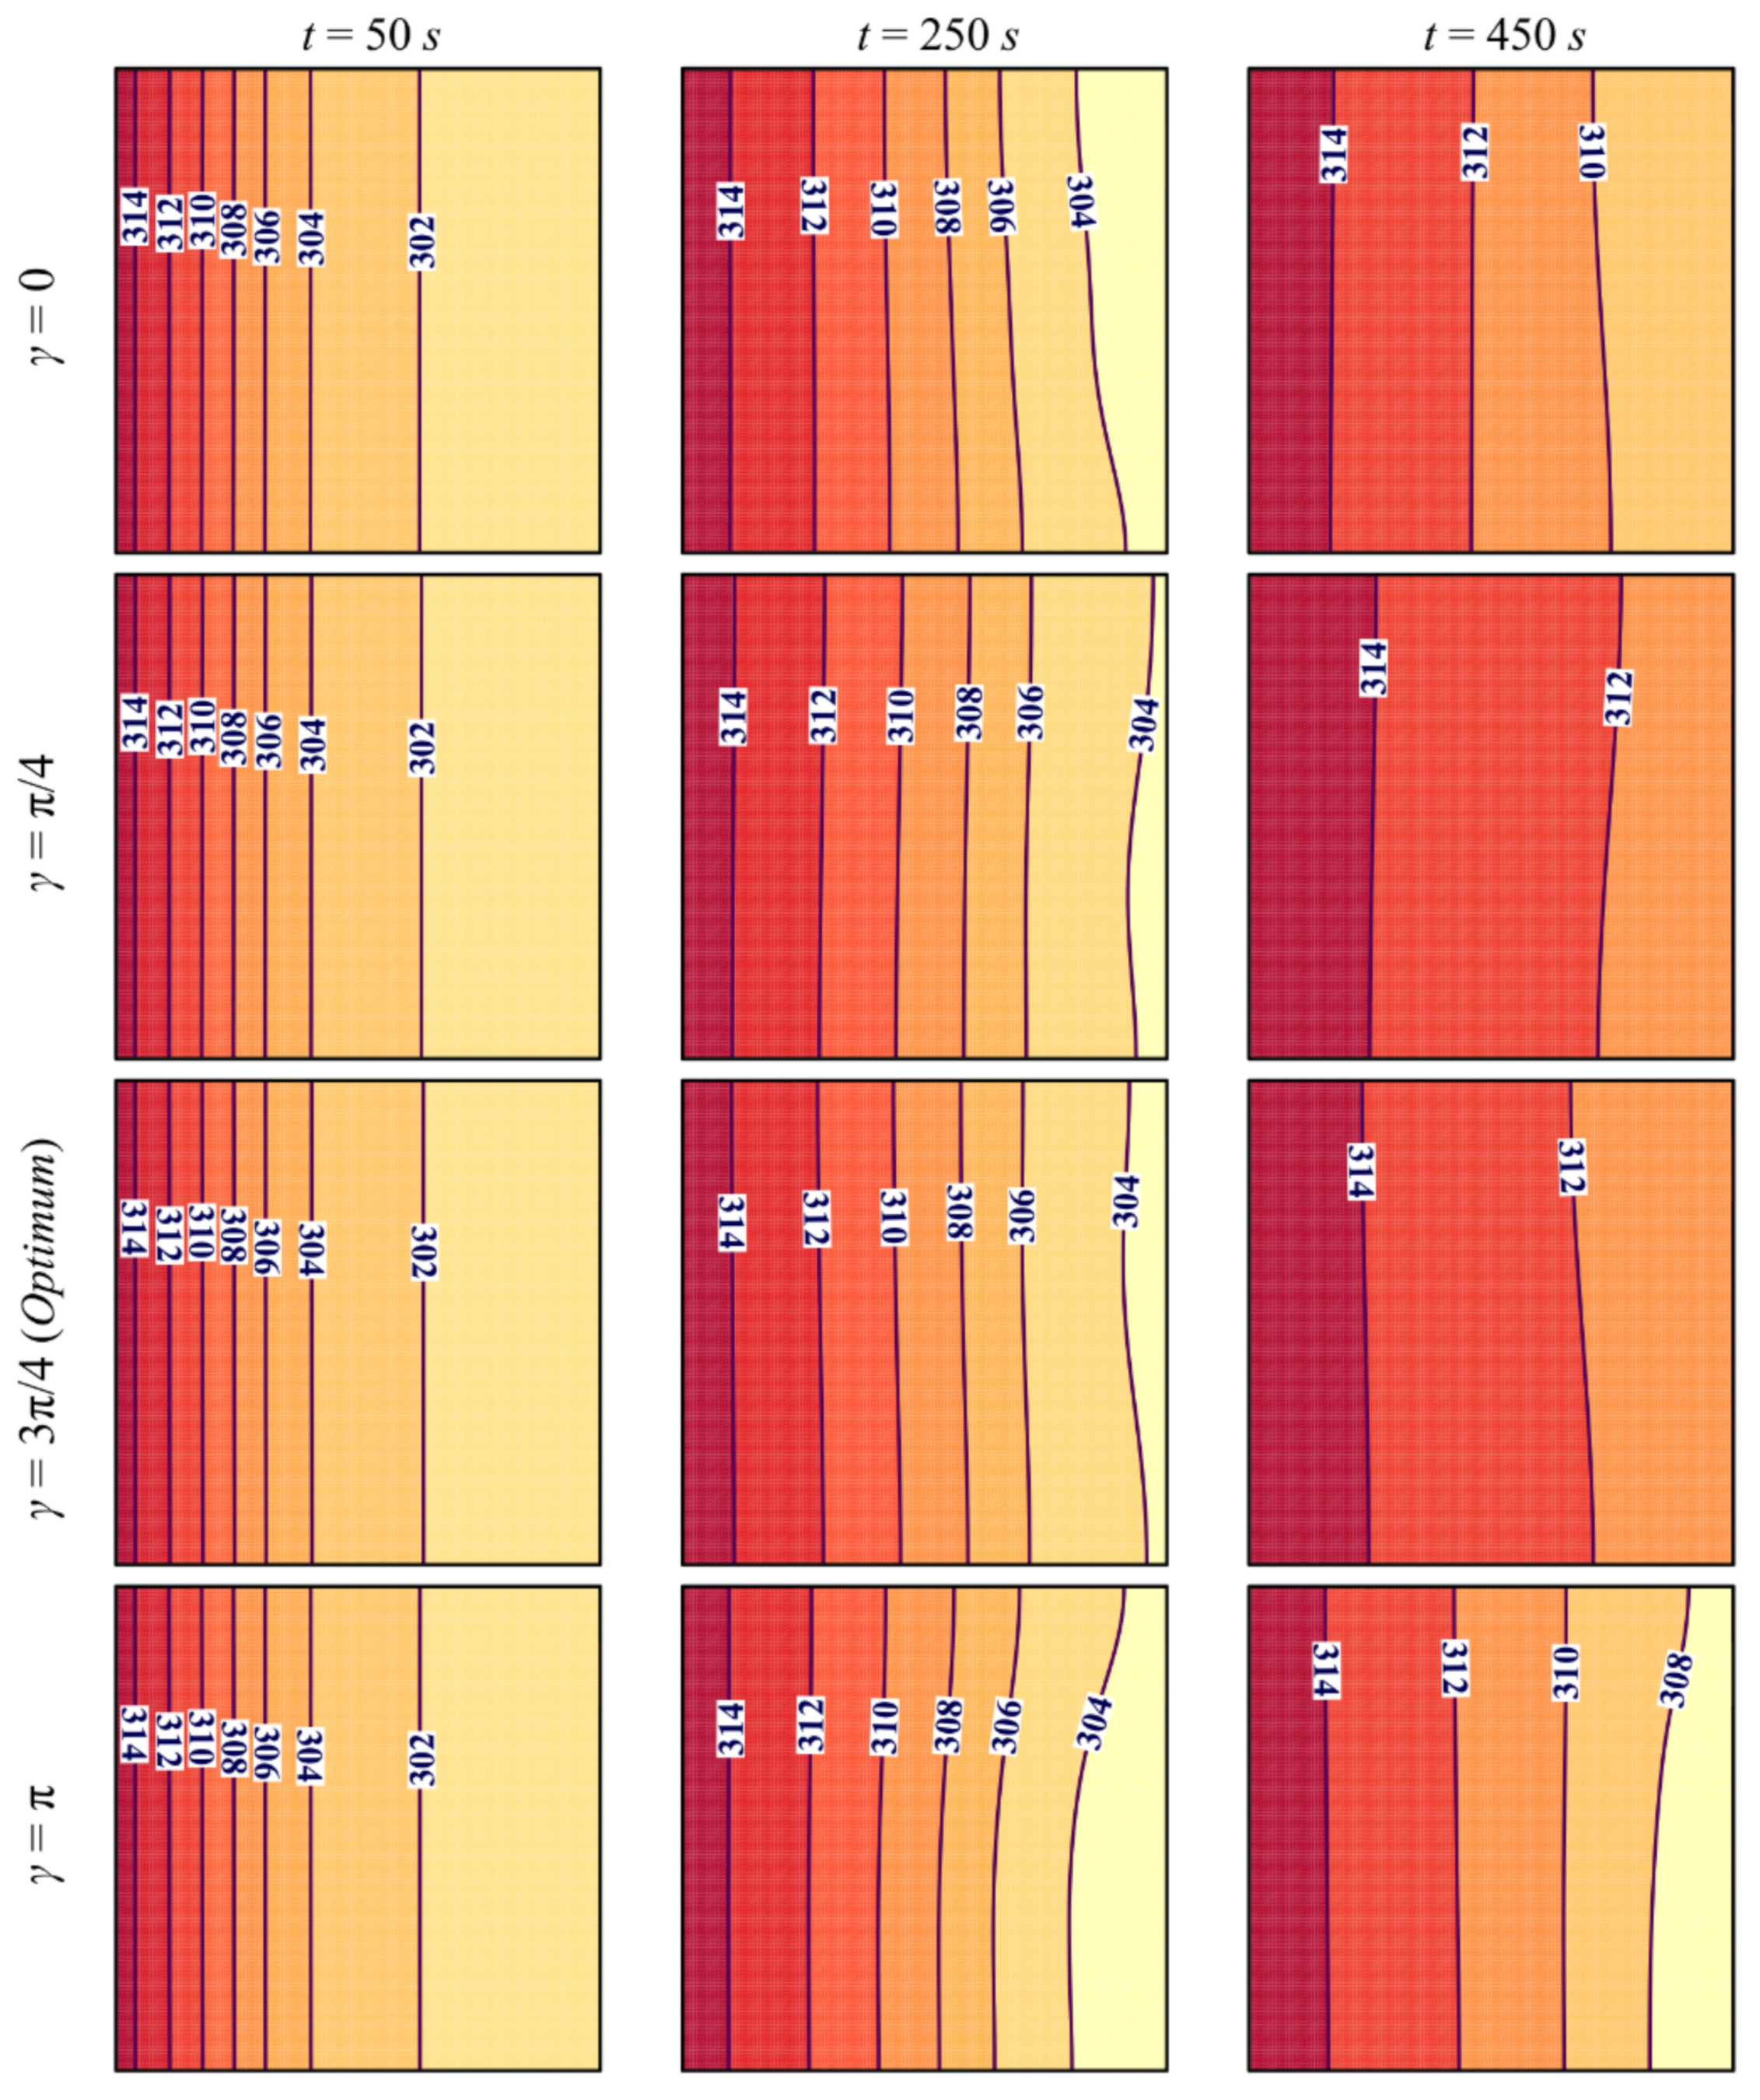
  • Tilting the cavity has a limited effect on the flow and thermal behavior of NePCM, mainly in the initial stages. This effect becomes more apparent when the convective heat transfer starts taking place, and the charging power can be improved when the inclination angle is γ = π/4 or γ = 3π/4 compared with the cases of γ = 0 and γ = π.
The focus of the present study was thermal energy storage, which is concerned with the melting of PCM. Investigation of solidification (discharging) in a non-uniform metal foam could be subject to future studies.

Author Contributions

Conceptualization, S.A.M.M. and M.G.; methodology, S.A.M.M., A.H., M.A.F., O.Y., P.T.S., W.Y. and M.G.; software, S.A.M.M., and M.G.; validation, S.A.M.M. and M.G.; formal analysis, S.A.M.M., A.H., M.A.F., and O.Y.; investigation, S.A.M.M., M.A.F., A.H., P.T.S., O.Y. and W.Y.; resources, W.Y. and O.Y.; writing—original draft preparation, S.A.M.M., A.H., M.A.F., O.Y., P.T.S., W.Y., and M.G.; writing—review and editing, S.A.M.M., A.H., M.A.F., O.Y., P.T.S., W.Y, and M.G.; visualization, S.A.M.M.; supervision, M.G.; funding acquisition, W.Y., O.Y., and M.G. All authors have read and agreed to the published version of the manuscript.

Funding

This research received no external funding.

Institutional Review Board Statement

Not applicable.

Informed Consent Statement

Not applicable.

Data Availability Statement

The data will be available on request.

Conflicts of Interest

The authors declare no conflict of interest.

Nomenclature

Latin Symbols
aslope of porosity
Amushmushy constant (kg m−3 s−1)
bconstant parameter
cpheat capacity (J kg−1 K−1)
Dlfiber diameter (m)
Dppore diameter (m)
Fmushy source term (kg m−3 s−1)
g gravity acceleration vector (m s−2)
hflatent heat (kJ kg−1)
Iidentity matrix
Llength of the domian (m)
MVFnormalized liquid fraction
nsurface normal
ppressure (Pa)
PPIpore density (pore per inch)
ttime (s)
TUtemperature uniformity index (K)
q velocity vector (m s−1)
VFnavolume fraction of nanoadditives
Wwidth of the domain (m)
xx-axis (m)
yy-axis (m)
Greek Symbols
βthermal expansion coefficient of liquid PCM (K−1)
γinclination angle (rad)
l liquid fraction
Γa small value
Δθmelmelting temperature range of PCM (K)
εporosity
θtemperature (K)
ιdummy variable for Equation (8)
κpermeability (m2)
λthermal conductivity (W m−1 K−1)
μdynamic viscosity (Pa s)
ρdensity (kg m−3)
Subscripts
aveaverage
effeffective properties of the PCM and metal foam
initialinitial condition
lPCM in liquid state
melmelting
mfmetal foam
nananoadditives
npcmnano-enhanced phase change material
pcmphase change material
sPCM in solid state
Superscript
TTranspose of matrix

References

  1. Sharma, A.; Tyagi, V.V.; Chen, C.; Buddhi, D. Review on thermal energy storage with phase change materials and applications. Renew. Sustain. Energy Rev. 2009, 13, 318–345. [Google Scholar] [CrossRef]
  2. Fan, L.; Khodadadi, J.M. Thermal conductivity enhancement of phase change materials for thermal energy storage: A review. Renew. Sustain. Energy Rev. 2011, 15, 24–46. [Google Scholar] [CrossRef]
  3. Agyenim, F.; Hewitt, N.; Eames, P.; Smyth, M. A review of materials, heat transfer and phase change problem formulation for latent heat thermal energy storage systems (LHTESS). Renew. Sustain. Energy Rev. 2010, 14, 615–628. [Google Scholar] [CrossRef]
  4. Sharifi, N.; Bergman, T.L.; Faghri, A. Enhancement of PCM melting in enclosures with horizontally-finned internal surfaces. Int. J. Heat Mass Transf. 2011, 54, 4182–4192. [Google Scholar] [CrossRef]
  5. Sciacovelli, A.; Gagliardi, F.; Verda, V. Maximization of performance of a PCM latent heat storage system with innovative fins. Appl. Energy 2015, 137, 707–715. [Google Scholar] [CrossRef]
  6. Kurnia, J.C.; Sasmito, A.P.; Jangam, S.V.; Mujumdar, A.S. Improved design for heat transfer performance of a novel phase change material (PCM) thermal energy storage (TES). Appl. Therm. Eng. 2013, 50, 896–907. [Google Scholar] [CrossRef]
  7. Raul, A.; Jain, M.; Gaikwad, S.; Saha, S.K. Modelling and experimental study of latent heat thermal energy storage with encapsulated PCMs for solar thermal applications. Appl. Therm. Eng. 2018, 143, 415–428. [Google Scholar] [CrossRef]
  8. Raj, A.; Srinivas, M.; Jayaraj, S. CFD modeling of macro-encapsulated latent heat storage system used for solar heating applications. Int. J. Therm. Sci. 2019, 139, 88–104. [Google Scholar] [CrossRef]
  9. Mettawee, E.-B.S.; Assassa, G.M. Thermal conductivity enhancement in a latent heat storage system. Sol. Energy 2007, 81, 839–845. [Google Scholar] [CrossRef]
  10. Sanusi, O.; Warzoha, R.; Fleischer, A.S. Energy storage and solidification of paraffin phase change material embedded with graphite nanofibers. Int. J. Heat Mass Transf. 2011, 54, 4429–4436. [Google Scholar] [CrossRef]
  11. Rostami, S.; Afrand, M.; Shahsavar, A.; Sheikholeslami, M.; Kalbasi, R.; Aghakhani, S.; Shadloo, M.S.; Oztop, H.F. A review of melting and freezing processes of PCM/nano-PCM and their application in energy storage. Energy 2020, 211, 118698. [Google Scholar] [CrossRef]
  12. Frusteri, F.; Leonardi, V.; Vasta, S.; Restuccia, G. Thermal conductivity measurement of a PCM based storage system containing carbon fibers. Appl. Therm. Eng. 2005, 25, 1623–1633. [Google Scholar] [CrossRef]
  13. Mesalhy, O.; Lafdi, K.; Elgafy, A.; Bowman, K. Numerical study for enhancing the thermal conductivity of phase change material (PCM) storage using high thermal conductivity porous matrix. Energy Convers. Manag. 2005, 46, 847–867. [Google Scholar] [CrossRef]
  14. Ebadi, S.; Tasnim, S.H.; Aliabadi, A.A.; Mahmud, S. An experimental investigation of the charging process of thermal energy storage system filled with PCM and metal wire mesh. Appl. Therm. Eng. 2020, 115266. [Google Scholar] [CrossRef]
  15. Gopalan, K.S.; Eswaran, V. Numerical investigation of thermal performance of PCM based heat sink using structured porous media as thermal conductivity enhancers. Int. J. Therm. Sci. 2016, 104, 266–280. [Google Scholar] [CrossRef]
  16. Liu, Z.; Yao, Y.; Wu, H. Numerical modeling for solid–liquid phase change phenomena in porous media: Shell-and-tube type latent heat thermal energy storage. Appl. Energy 2013, 112, 1222–1232. [Google Scholar] [CrossRef]
  17. Deng, Z.; Liu, X.; Zhang, C.; Huang, Y.; Chen, Y. Melting behaviors of PCM in porous metal foam characterized by fractal geometry. Int. J. Heat Mass Transf. 2017, 113, 1031–1042. [Google Scholar] [CrossRef]
  18. El Idi, M.M.; Karkri, M. Heating and cooling conditions effects on the kinetic of phase change of PCM embedded in metal foam. Case Stud. Therm. Eng. 2020, 21, 100716. [Google Scholar] [CrossRef]
  19. Huang, X.; Lin, Y.; Alva, G.; Fang, G. Thermal properties and thermal conductivity enhancement of composite phase change materials using myristyl alcohol/metal foam for solar thermal storage. Sol. Energy Mater. Sol. Cells 2017, 170, 68–76. [Google Scholar] [CrossRef]
  20. Martinelli, M.; Bentivoglio, F.; Caron-Soupart, A.; Couturier, R.; Fourmigue, J.-F.; Marty, P. Experimental study of a phase change thermal energy storage with copper foam. Appl. Therm. Eng. 2016, 101, 247–261. [Google Scholar] [CrossRef]
  21. Xiao, X.; Zhang, P.; Li, M. Effective thermal conductivity of open-cell metal foams impregnated with pure paraffin for latent heat storage. Int. J. Therm. Sci. 2014, 81, 94–105. [Google Scholar] [CrossRef]
  22. Sheikholeslami, M. Numerical modeling of nano enhanced PCM solidification in an enclosure with metallic fin. J. Mol. Liq. 2018, 259, 424–438. [Google Scholar] [CrossRef]
  23. Kok, B. Examining effects of special heat transfer fins designed for the melting process of PCM and Nano-PCM. Appl. Therm. Eng. 2020, 170, 114989. [Google Scholar] [CrossRef]
  24. Huu-Quan, D.; Sheremet, M.; Kamel, M.S.; Izadi, M. Investigation of thermal-hydro dynamical behavior on nano-encapsulated PCM suspension: Effect of fin position, fractioning and aspect ratio. Chem. Eng. Process. Process Intensif. 2020, 157, 108122. [Google Scholar] [CrossRef]
  25. Mahdi, J.M.; Mohammed, H.I.; Hashim, E.T.; Talebizadehsardari, P.; Nsofor, E.C. Solidification enhancement with multiple PCMs, cascaded metal foam and nanoparticles in the shell-and-tube energy storage system. Appl. Energy 2020, 257, 113993. [Google Scholar] [CrossRef]
  26. Al-Jethelah, M.; Ebadi, S.; Venkateshwar, K.; Tasnim, S.; Mahmud, S.; Dutta, A. Charging nanoparticle enhanced bio-based PCM in open cell metallic foams: An experimental investigation. Appl. Therm. Eng. 2019, 148, 1029–1042. [Google Scholar] [CrossRef]
  27. Li, Z.; Shahsavar, A.; Al-Rashed, A.A.; Talebizadehsardari, P. Effect of porous medium and nanoparticles presences in a counter-current triple-tube composite porous/nano-PCM system. Appl. Therm. Eng. 2020, 167, 114777. [Google Scholar] [CrossRef]
  28. Yang, J.; Yang, L.; Xu, C.; Du, X. Numerical analysis on thermal behavior of solid–liquid phase change within copper foam with varying porosity. Int. J. Heat Mass Transf. 2015, 84, 1008–1018. [Google Scholar] [CrossRef]
  29. Mahdi, J.M.; Nsofor, E.C. Multiple-segment metal foam application in the shell-and-tube PCM thermal energy storage system. J. Energy Storage 2018, 20, 529–541. [Google Scholar] [CrossRef]
  30. Marri, G.K.; Balaji, C. Experimental and numerical investigations on the effect of porosity and PPI gradients of metal foams on the thermal performance of a composite phase change material heat sink. Int. J. Heat Mass Transf. 2021, 164, 120454. [Google Scholar] [CrossRef]
  31. Choi, S.-K.; Kim, S.-O.; Lee, T.-H.; Dohee-Hahn. Computation of the natural convection of nanofluid in a square cavity with homogeneous and nonhomogeneous models. Numer. Heat Transf. Part A Appl. 2014, 65, 287–301. [Google Scholar] [CrossRef]
  32. Nield, D.A.; Bejan, A. Convection in Porous Media; Springer: Berlin/Heidelberg, Germany, 2017. [Google Scholar]
  33. Ranut, P. On the effective thermal conductivity of aluminum metal foams: Review and improvement of the available empirical and analytical models. Appl. Therm. Eng. 2016, 101, 496–524. [Google Scholar] [CrossRef]
  34. Zheng, H.; Wang, C.; Liu, Q.; Tian, Z.; Fan, X. Thermal performance of copper foam/paraffin composite phase change material. Energy Convers. Manag. 2018, 157, 372–381. [Google Scholar] [CrossRef]
  35. Gupta, M.; Singh, V.; Kumar, R.; Said, Z. A review on thermophysical properties of nanofluids and heat transfer applications. Renew. Sustain. Energy Rev. 2017, 74, 638–670. [Google Scholar] [CrossRef]
  36. Bertrand, O.; Binet, B.; Combeau, H.; Couturier, S.; Delannoy, Y.; Gobin, D.; Lacroix, M.; Le Quéré, P.; Médale, M.; Mencinger, J. Melting driven by natural convection A comparison exercise: First results. Int. J. Therm. Sci. 1999, 38, 5–26. [Google Scholar] [CrossRef]
Figure 1. The physical model of the latent heat thermal energy storage unit with non-uniform porosity in the x-direction.
Sustainability 13 02401 g001
Figure 2. The variation of (a) Melted Volume Fraction (MVF) and (b) temperature distribution at points with coordinates (0.025, 0.025) for variants of the uniform mesh, when L = 50 mm, VFna = 0.06, εavg = 0.900, a = 4, γ = π/4, PPI = 10.
Sustainability 13 02401 g002
Figure 3. The melted liquid domains of (I) in the experimental study conducted by Al-Jethelah et al. [26] and (II) the present study.
Sustainability 13 02401 g003
Figure 4. Melting front of the conducted studies in [36] and this work when t = 5000s.
Sustainability 13 02401 g004
Figure 5. The variation of porosity and permeability for optimum design: (a) porosity map and (b) permeability map.
Sustainability 13 02401 g005
Figure 6. Streamlines and melting interfaces (red solid line) at three different times for various volume fractions of nanoadditives when εavg = 0.800, a = 4, γ = 3π/4 and PPI = 20.
Sustainability 13 02401 g006
Figure 7. Isotherm contours at three different times for various volume fractions of nanoadditives when εavg = 0.800, a = 4, γ = 3π/4 and PPI = 20.
Sustainability 13 02401 g007
Figure 8. The effect of various volume fractions of nanoadditives (a) on the melting volume fraction and (b) energy stored when εavg = 0.800, a = 4, γ = 3π/4 and PPI = 20.
Sustainability 13 02401 g008
Figure 9. Streamlines and melting interfaces (red solid line) at three different times for various average porosities when VFna = 0.04, a = 4, γ = 3π/4 and PPI = 20.
Sustainability 13 02401 g009
Figure 10. Isotherm contours at three different times for various average porosities when VFna = 0.04, a = 4, γ = 3π/4 and PPI = 20.
Sustainability 13 02401 g010
Figure 11. The effect of various average porosities (a) on the melting volume fraction and (b) energy stored when VFna = 0.04, a = 4, γ = 3π/4 and PPI = 20.
Sustainability 13 02401 g011
Figure 12. Streamlines and melting interfaces (red solid line) at three different times for various gradients of porosity of nanoadditives when VFna = 0.04, ε = 0.800, γ = 3π/4 and PPI = 20.
Sustainability 13 02401 g012
Figure 13. Isotherm contours at three different times for various gradients of porosity of nanoadditives when VFna = 0.04, ε = 0.800, γ = 3π/4 and PPI = 20.
Sustainability 13 02401 g013
Figure 14. The effect of various gradients of porosity (a) on the melting volume fraction and (b) energy stored when VFna = 0.04, εavg = 0.800, γ = 3π/4 and PPI = 20.
Sustainability 13 02401 g014
Figure 15. Streamlines and melting interfaces (red solid line) at three different times for various inclination angles of the enclosed medium when VFna = 0.04, ε = 0.800, a = 4 and PPI = 20.
Sustainability 13 02401 g015
Figure 16. Isotherm contours at three different times for various inclination angles of the enclosed medium when VFna = 0.04, ε = 0.800, a = 4 and PPI = 20.
Sustainability 13 02401 g016
Figure 17. The effect of various inclination angles of the enclosed medium (a) on the melting volume fraction and (b) energy stored when VFna = 0.04, εavg = 0.800, a = 4 and PPI = 20.
Sustainability 13 02401 g017
Figure 18. Streamlines and melting interfaces (red solid line) at three different times for various pores-per-inch values of the metal matrix when VFna = 0.04, εavg = 0.800, a = 4 and γ = 3π/4.
Sustainability 13 02401 g018
Figure 19. Isotherm contours at three different times for various pores-per-inch values of the metal matrix when VFna = 0.04, εavg = 0.800, a = 4 and γ = 3π/4.
Sustainability 13 02401 g019
Figure 20. The effect of various pores-per-inch values of the metal matrix (a) on the melting volume fraction and (b) energy stored when VFna = 0.04, εavg = 0.800, a = 4 and γ = 3π/4.
Sustainability 13 02401 g020
Table 1. Thermophysical properties of the coconut oil and nanoadditives [26,31].
PropertiesCoconut Oil (Measured)Metal FoamCuO Nano Additives
Liquid (32 C)Solid (15 C)
Cp (JkgK−1)20103750386540
ρ P C M (kgm−1)914920 89006500
k (Wm−1K−1)0.1660.22838018
μ P C M (Nsm−2)0.0326---
hf (kJkg−1)103---
TmeTme)-24 C--
Pr394.73---
Table 2. The range and levels of control parameters.
FactorsControl ParametersLevel 1Level 2Level 3Level 4Level 5
AVFna0.000.010.020.030.04
Bεavg0.8000.8250.8500.8750.9
Ca−4−2024
Dγ0π/4π/23π/4π
EPPI1015202530
Table 3. L-25 orthogonal table corresponding to range and levels of control parameters.
Experiment NumberControl ParametersTime (s) When MVF = 0.9ES
(kJ/m)
P
(kW/m)
VFnaεavgaγPPI
10.000.800−4010480320.300.667
20.000.825−2π/415488328.860.674
30.000.85002π/420521337.710.648
40.000.87523π/425627347.450.554
50.000.9004π30773359.820.466
60.010.800−22π/425397320.900.808
70.010.82503π/430404329.270.815
80.010.8502π10470338.520.720
90.010.8754015579349.090.603
100.010.900−4π/4204460335.910.075
110.020.8000π15351320.950.914
120.020.8252020428329.950.772
130.020.8504π/425437339.400.776
140.020.875−42π/4301288332.200.258
150.020.900−23π/4101174342.280.292
160.030.8002π/430324321.240.991
170.030.82542π/410358330.390.922
180.030.850−43π/415774325.110.420
190.030.875−2π20795334.150.420
200.030.9000025810343.610.424
21 *0.040.80043π/420318321.791.012
220.040.825−4π25615317.630.517
230.040.850−2030606326.230.538
240.040.8750π/410830335.390.404
250.040.90022π/415712345.210.485
* The row 21 was selected as the best design.
Table 4. A further 21 cases to explore the design space around the optimum design.
Experiment Number Control ParametersTime When MVF = 0.9ES
(kJ/m)
P
(kW/m)
Parameter StudyVFnaεavgaγPPI
1VFna0.000.80043π/420351.511329.9270.9386
20.010.80043π/420334.002327.8700.9816
30.020.80043π/420369.538325.9110.8819
40.030.80043π/420365.244323.9350.8869
5εavg0.040.82543π/420392.582328.4380.8366
60.040.85043π/420467.525335.2550.7171
70.040.87543π/420528.626342.3990.6477
80.040.90043π/420688.149350.6560.5096
9a0.040.800−43π/420469.522312.0430.6646
100.040.800−23π/420407.366314.5570.7722
110.040.80003π/420348.865316.9160.9084
120.040.80023π/420338.125319.2860.9443
13γ0.040.8004020347.665321.8380.9257
140.040.8004π/420315.240321.7871.0208
150.040.80042π/420353.908334.9020.9463
160.040.8004π20360.902321.8270.8917
17PPI0.040.80043π/410312.557321.8071.0296
180.040.80043π/415391.438321.8810.8223
190.040.80043π/425346.688321.8530.9284
200.040.80043π/430307.910321.7481.0449
21Optimum case0.040.80043π/420319.425321.7661.0073
Publisher’s Note: MDPI stays neutral with regard to jurisdictional claims in published maps and institutional affiliations.

