1. Introduction
The environment and its protection together are one of the most important tasks of our society. As a result of scientific and technological development, the growth of the human population, and the globalization of the world, another important issue related to the damage and devastation of the environment comes to the forefront, namely, noise. Noise presents one of the most common environmental problems, which is also affected by the development of industry and transport. Noise presents unwanted, disturbing, or, in some cases, harmful sound that is transmitted through sound waves. Environmental noise is a natural part of human activity; its existence in the environment is related to different work, non-work activities, industries, or transport. At present, it is possible to talk about noise pollution. Noise pollution interferes in complex task performance, it may affect social behavior, and it may cause noise annoyance and noise-induced sleep disturbance [
1,
2]. Generally, noise may be defined as unwanted sound and it is perceived as an environmental stressor. Basner et al. defined the non-auditory effects of noise as all of those effects on health and well-being that are caused by exposure to noise [
3].
Environmental noise management is an important aspect of the environmental policy of the European Union [
4]. Environmental noise is, as stipulated in the European Union (EU) policy, regulated by the Environmental Noise Directive (2002/49/EC). This directive, related to the process of the assessment and management of environmental noise, is also referred to as the “END”. This directive aims to define a common approach to prevent or reduce environmental noises. The basis of the environmental noise management is to develop EU measures to reduce the noise emitted by important sources, such as industrial activity. The most important elements are to monitor the environmental problems and create strategic noise maps (e.g., for roads, agglomeration, and industrial plants). This uses “L den” (day–evening–night equivalent level) and “L night” (night equivalent level) harmonized noise indicators. Another important role of this directive is to inform the public about noise exposure and its effects and to realize measures [
5].
It is very important to emphasize that the usage condition of industrial units has a major and significant effect on the noise emissions [
6]. Nowadays, a widely used concept for improving the life standard is to reduce the industrial noise, above all in industrial and residential mixed areas [
7]. Industrial development, different, and also, in some cases, chaotic locations of manufacturing facilities which are near residential areas demands to realize noise level monitoring [
7].
An interesting view of industrial noise solution was presented by Vasilyev [
8], who used active noise and vibration control to reduce low-frequency noise and vibration in gas guide systems of power plants. This author explained that the impact of vibration and the related mechanical noise of industrial plants and joining mechanical systems may cause a significant impact on, for example, the reliability, productivity, durability, and other significant parameters [
8]. The authors in [
9,
10] conducted research on noise solution, dealing with the problems of vibration and noisiness, and they stated that the two are closely related.
An important part of measures to reduce noise is the proposal and verification process of the realized measures. It is also necessary to take into account the material selection, construction, and other parameters during this process [
11,
12].
The problem of industrial noise and its impact on the environment was presented by Sadler, who analyzed the industrial noise generated by industrial installations, and then described a proposal about how to take into account the additional effect from other types of noise from the environment and other human activities in the described area [
13]. During the evaluation of noise sources, it is important to evaluate the sound quality, and not just the sound quantity, because some sounds are very annoying for people [
14].
Wzolek and Kukulski examined a methodological approach with the help of a case study with the main subject being the cumulation of industrial noise sources. These authors used the evaluation of cumulative noise levels for a new object realized by computational methods, as well as for the existing object, by measurement of or by help from a combination of measurement and computational methods [
15].
Research of industrial noise was presented by Tomozei et al., who used mathematical modeling of noise pollution to preset a three-dimensional mathematical model. This model characterizes the variation of sound pressure level propagation and the variation of attenuation of the sound pressure level propagated in an enclosed space. The authors realized experimental measurements and mathematical modeling, taking into account the position of the acoustic screen for the noise source and the height of the used microphone for recording [
16].
The use of mathematical modeling for the prediction of pollutants was also presented by Ani et al. (via MATLAB), who used the initial parameters for the calculation of pollutant distribution [
17].
The possibility of industrial noise source localization and reduction in industrial plants was examined by Fiebig and Dabrowski, who identified main noise sources using an acoustic camera and the beamforming method. They also performed a sound level measurement on the main noise sources. Their research was presented in the form of an acoustic noise map with the help of LEQ Professional software, which also included the 3D geometry of the examined buildings inside the studied plant [
18,
19].
An acoustic camera is a measurement tool that joined the field of acoustics a few years ago. This technology analyzes the actual sound scene, which consists of a superposition of different sound sources, and then combines them into a visual sound map. The basic principle relies on the accurate calculation of the specific runtime delays of acoustic sound emissions radiating from several sources to the individual microphones of an array. An acoustic map of the local sound pressure distribution at a given distance is calculated using the acoustic data of all simultaneously recorded microphone channels. The sound pressure level is displayed via color coding, similar to popular thermal imaging. The application of an acoustic camera was also presented in [
20]. Bocher et al. conducted noise modeling in their research, and they described an open source form for the implementation of a noise mapping tool that is fully implemented in a geographic information system compliant with the Open Geospatial Consortium standards. The contribution of these authors made easier the formatting and harvesting of noise model input data and output data, linkage with population data, and also cartographic rendering [
20]. The use of noise mapping is very important and necessary to ensure environmental noise control, as well as industrial noise control. Noise maps are established to obtain information for noise reduction planning [
6], and noise mapping presents the best suitable way to present information on acoustic pollution [
21].
One of the tasks of noise mapping is to investigate noise exposure in living areas and knowledge of noise situation in the surroundings of noise sources, particularly in connection with the development of residential and industrial areas, as well as transport axes in many urban areas. These types of maps are also useful for the determination of the minimal sound insulation of individual buildings necessary for acoustic comfort conditions [
22].
In the literature review, it is possible to find publications related to the study of noise and noise mapping. For example publications [
23,
24,
25] which are oriented to the area of transport (railway noise, airport noise, road noise). Another interesting publication is presented by the authors Lertsawat et al. They focused on the prediction of noise emissions from power plants using a mathematical model. They used the principles of outdoor sound propagation and developed a noise prediction model, providing an illustration of the accuracy level of the mathematical model [
26].
The noise mapping of industrial sources was researched by Santos et al. [
27]. They described the forms of applications of noise mapping for industrial sources, and additionally pointed to its potential in the design phase of existing installations for noise reduction plans. They also created a general methodology for the noise mapping of industrial plants, consisting of input data collection, data processing and adjusting, modeling by software to compute noise emissions and propagation, and, at the end, the noise map production [
27].
2. Materials and Methods
2.1. Determination of Sound Pressure Levels
The measurements were carried out in accordance with applicable national legislation and international standards (ISO 1996-1 Acoustics standards. Description, measurement and assessment of environmental noise. Part 1: Basic quantities and assessment procedures; ISO 1996-2 Acoustics. Description, measurement and assessment of environmental noise. Part 2: Determination of sound pressure levels) [
28,
29].
For measurement of the sound pressure level, the Norsonic type 140 (Nor140) sound analyzer with the Norsonic type 1225 (Nor1225) microphone was used. The Nor140 is a class 1 approved integrating sound level meter, while Nor1225 is a ½ free-field, 50 mV/Pa sensitivity microphone—a general purpose microphone covering the frequency range from 3.15 to 20 kHz, corresponding to class 1 of the sound level meter standard IEC (International Electronical Comminsion) 61672.
2.2. Sound Visualization
For sound visualization, the gfai tech acoustic camera with a star microphone array, a 48-channel measurement system designed for outdoor applications, was used. A digital camera is taking an image of the noise emitting object. At the same time an exactly computed array of microphones acquires and records the sound waves emitted by the object. A specially developed software calculates a sound map and combines the acoustical and the optical images of the sound source. The acoustic camera can extend the time and frequency selectivity and add a location-selective component. With this method the sound signal is shown and also a sequence of acoustic images can be acquired-acoustic videos are generated. The measurement distances ranged from 4 to 200 m, while the frequency mapping ranged from 150 to 13 kHz. For acoustic cameras, the delay-and-sum beamforming method is the most widely known sound localization technique [
30,
31].
2.3. Noise Mapping
The mathematical model-based noise map was created using the CADNA A version 3.6.117 software package with the relevant methodologies implemented. CADNA A meets the requirements for quality assurance of software for the calculation of sound outdoors according to the DIN 45687 and ISO 17534 series. For calculation purposes, the ISO 9613-2 standard was used. For calculating the noise maps, the software requires the sound power level data of each relevant noise point source. This was achieved by measuring the sound pressure level around the identified noise sources in the wastewater plant. An Acoustic Determinator is a tool that determines the sound power level of respective noise sources by measuring the sound pressure levels using reverse engineering methods, in accordance with ISO 8297 and other similar guidelines.
The first step of the noise map creation was to model the terrain, for which we set an appropriate ground factor for each part and also took into account vegetation. All noise sources were modeled as point sources, with only the air distribution pipe being a line source. Noise maps were then created with noise isophones at a height of 1.5 or 3 m above ground level, which were subsequently color coded in 5 dB steps. The height of the isophone and calculation points was chosen as 3 m because of the hilly terrain, in aid of better knowledge of the acoustic situation and the spread of noise at the location in question, and also because a large number of the houses have windows at this height.
3. Description of the Problem
The main task of the wastewater treatment process is to convert wastewaters into clean waters of the required quality. This fact means that this process has to respect the limits of the contaminants imposed by the legislation of the environment, for example, by the Water Quality No. 2000/60/EC directive [
32].
In the case study the effect of wastewater treatment plant on the noise situation is described, as noise pollution is one of the major environmental problems. A biological wastewater treatment plant is a source of such noise. Herein, we chose a treatment plant that is used for treating wastewater from industry, as well as municipal wastewater, located between two villages approximately 200 m from the treatment plant site. Residents of these villages complain about the noise caused by this wastewater treatment plant. According to the operator of wastewater treatment plant, 13 noise complaints have been registered in the last three years (personally, phone, or mail).
3.1. Description of the Noise Source
The noise source that we evaluated was the operation of the wastewater treatment plant and, in particular, the individual pieces of equipment located on the treatment plant site. The operation of the treatment plant is continuous and the nature of the sound emitted by the equipment is stable. The treatment plant purifies wastewater from a paper-manufacturing company’s industrial plant, along with wastewater from residents and other wastewater producers in the town and connected villages. A view of the treatment plant premises is given in
Figure 1. The critical sources of noise on the site of the wastewater treatment plant are the:
Blower room;
Air distribution pipes;
Biofilter;
Sludge treatment;
Activation tanks;
Input pumping station.
Description of the Site and Protected Areas
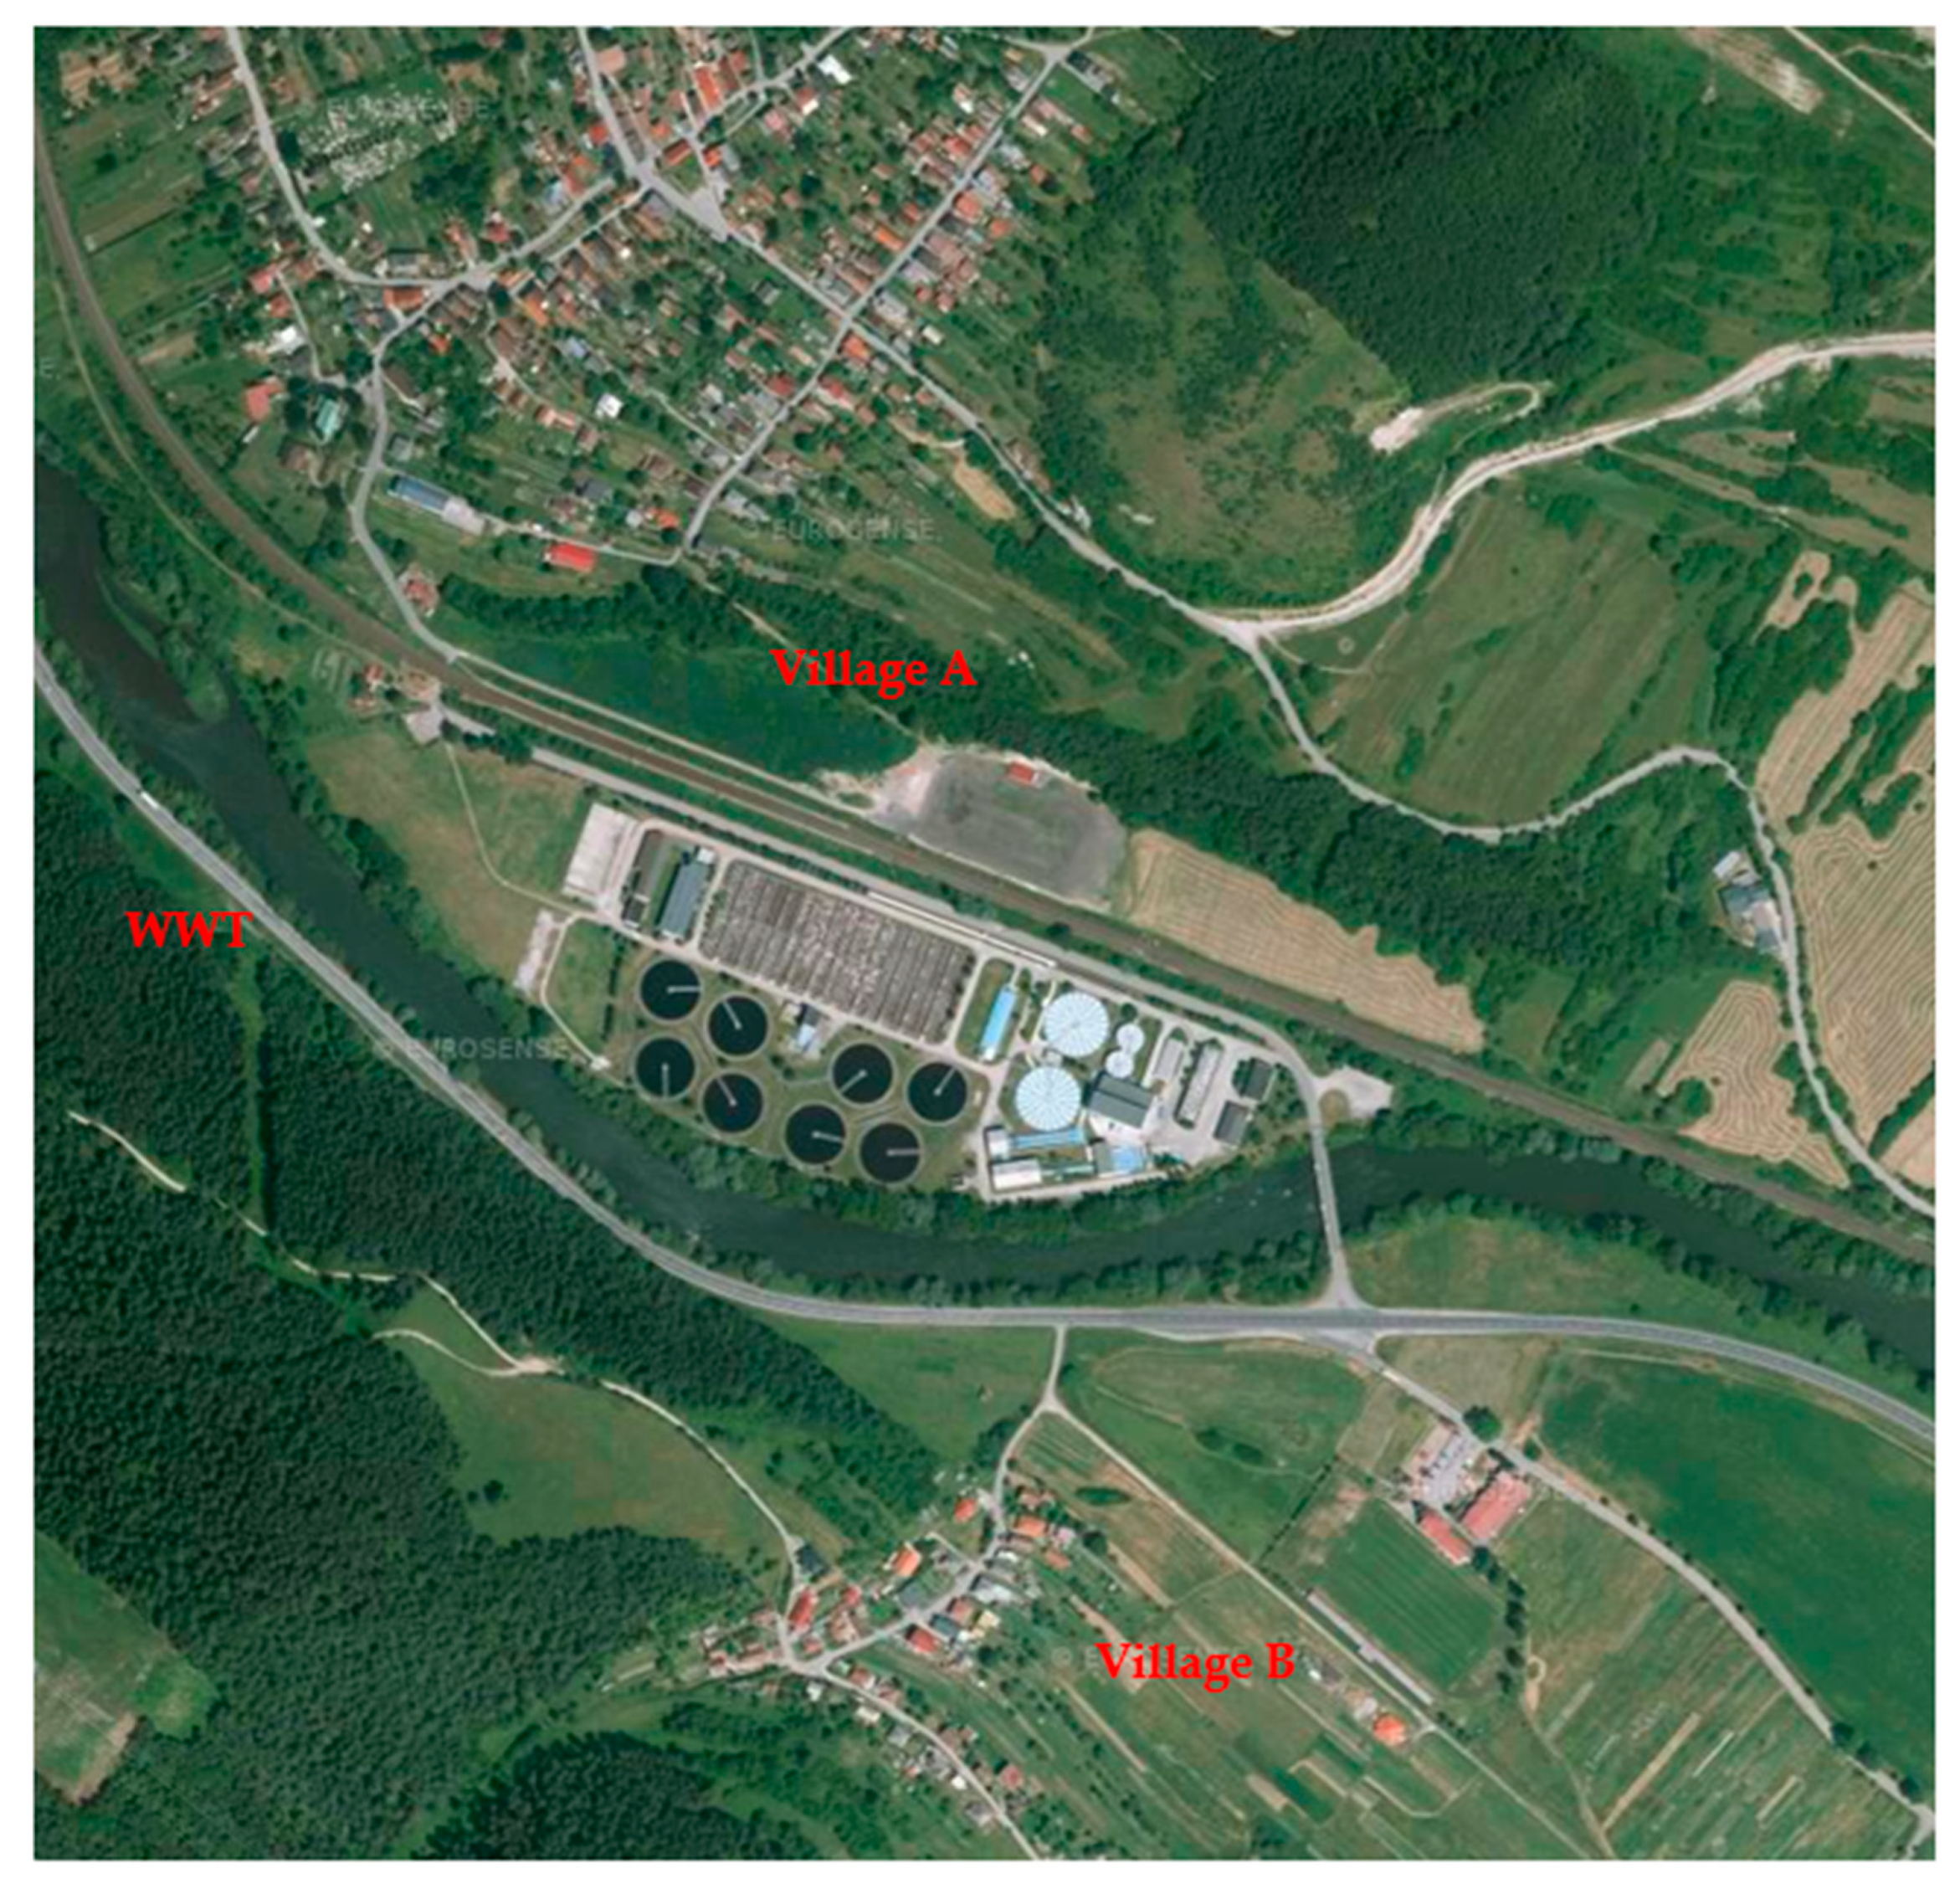
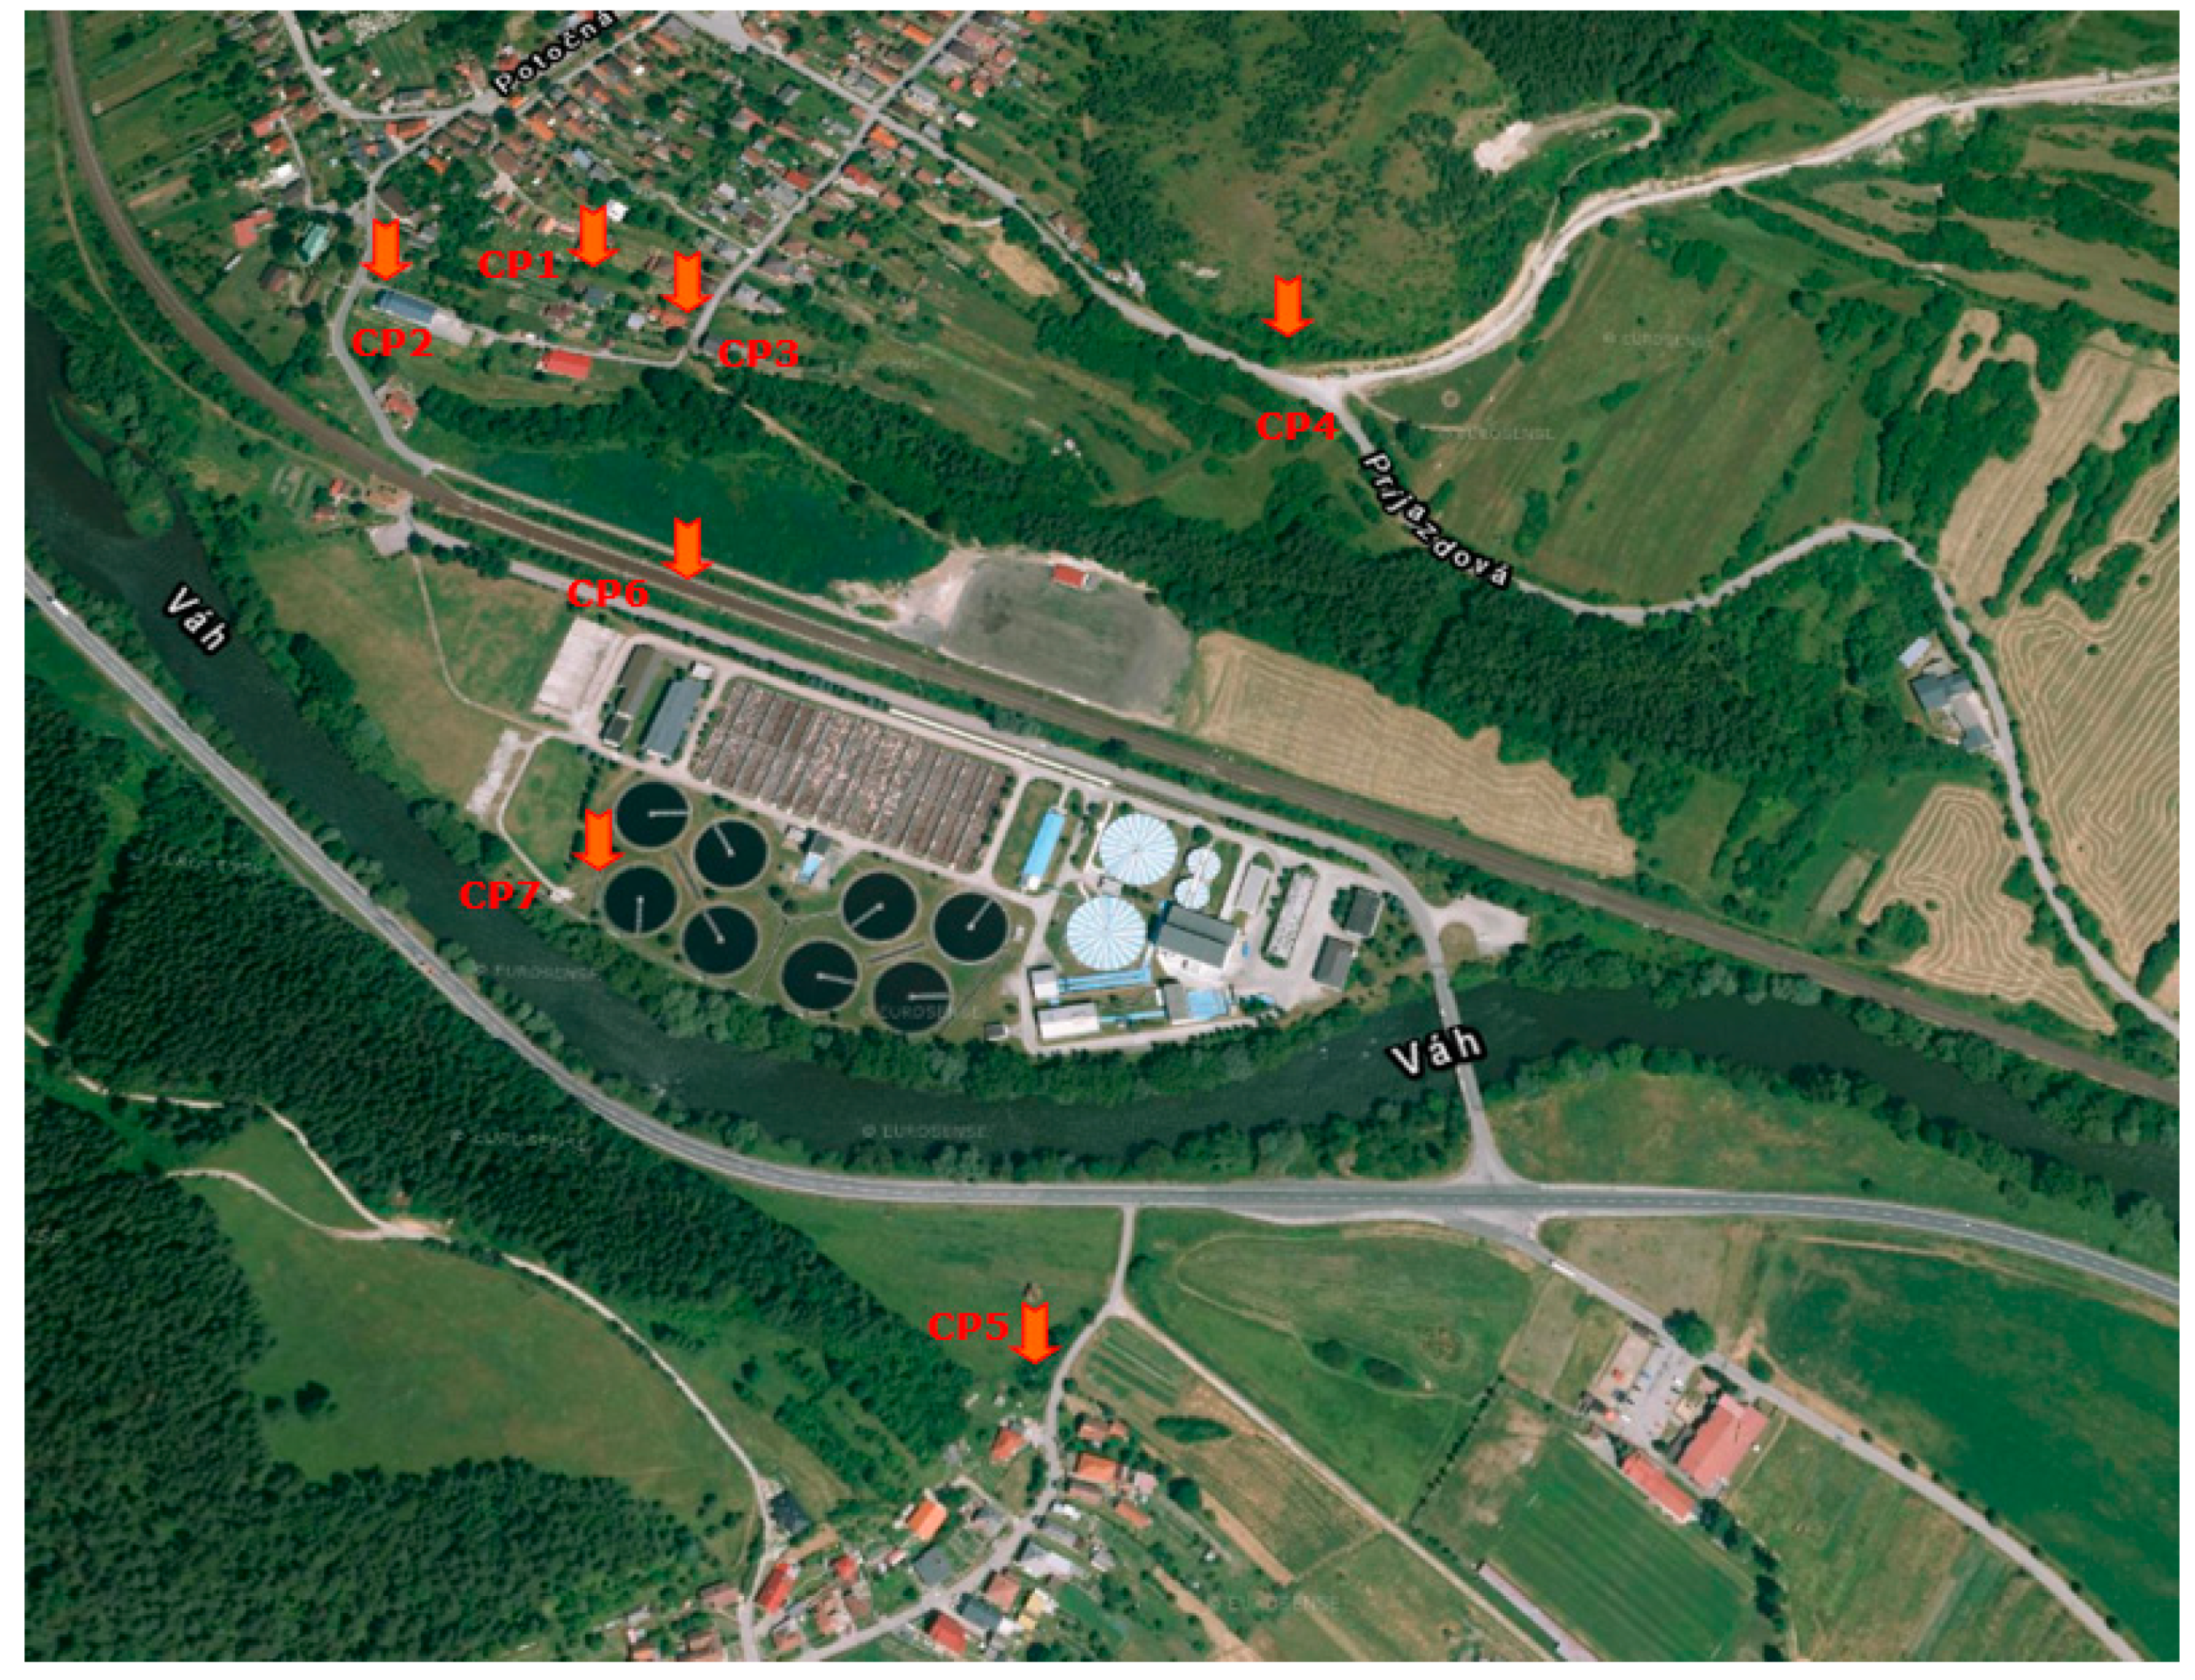
The wastewater treatment plant site is located between two villages. Village A is located at a distance of approximately 200 m north of the treatment plant site, while village B is at a distance of approximately 180 m south of the treatment plant site. The villages contain mainly houses for families. A view of the wastewater treatment plant area and the adjacent villages is shown in
Figure 2.
4. Knowledge of the Current State of the Noise Situation in the Adjacent Villages
In order to gain knowledge of the current noise situation in the adjacent villages, noise measurements were carried out in both villages in the protected areas near the family homes on the edges of the villages facing toward the wastewater treatment plant. Measurements were made in front of the façade of the family houses. We consider these selected locations to be the most affected by the noise from the plant’s operation.
The measurements were carried out in accordance with applicable national legislation and international standards (ISO 1996-1 Acoustics standards. Description, measurement and assessment of environmental noise. Part 1: Basic quantities and assessment procedures; ISO 1996-2 Acoustics. Description, measurement and assessment of environmental noise. Part 2: Determination of sound pressure levels) [
28,
29].
The measurement results of the equivalent noise levels are given in
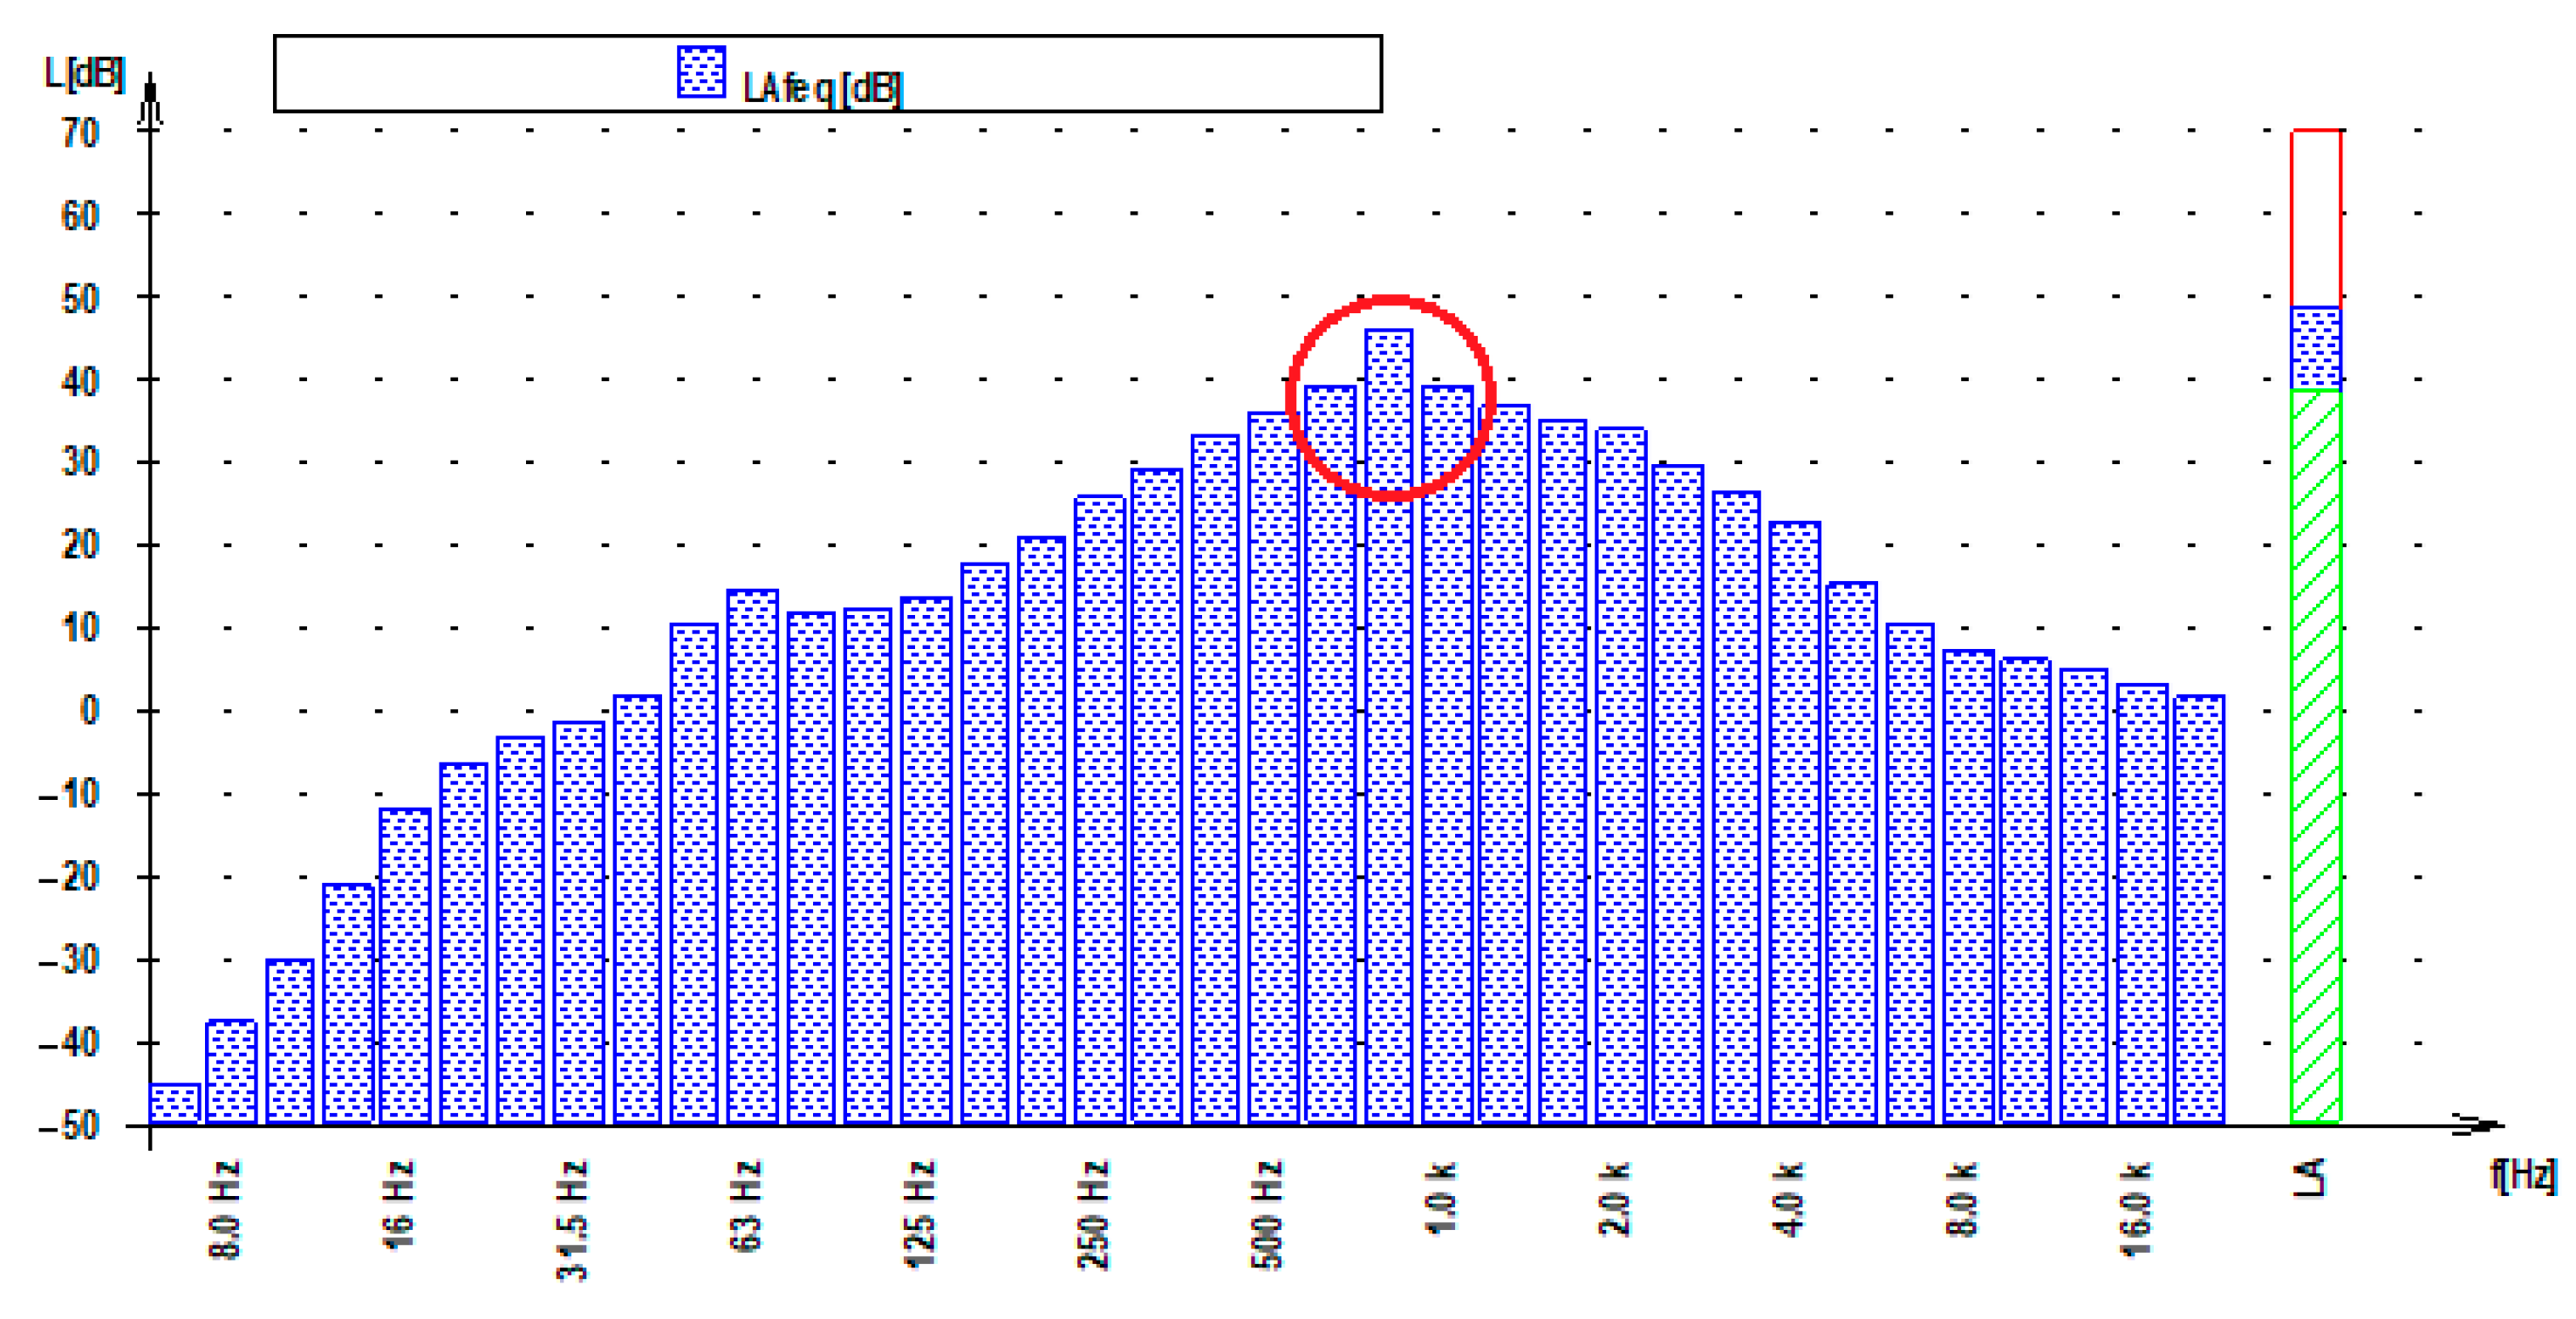
Table 1. It is clear from the frequency analysis of the noise measurement results that the noise is characterized by tonal components at a frequency of 800 Hz, as shown in
Figure 3.
From the point of view of the legislation in force, a correction of 5 dB for sound with tonal components should be added to the measured values. Positive values of wide uncertainty must be added to these values. These values can then be compared with the permissible values to determine the noise pollution levels. The results of the noise measurements in the surrounding villages are given in
Table 1.
Based on objectification of the noise measurements, it can be concluded that the noise limit values in both villages are exceeded for all reference intervals: Day, 50 dB(A); evening, 50 dB(A); night, 45 dB(A).
5. Measurement of the Noise Sources on the Site of the Wastewater Treatment Plant
Measurements on the site of the wastewater treatment plant were carried out adjacent to the individual noise sources, as well as generally across the site. Measurements were made at 18 measuring points, the locations of which are shown in
Figure 4. The measurement results are shown in
Table 2.
Measurements were carried out to determine the noise level of the stationary sources on the site of the wastewater treatment plant, the results of which were later used as input into the mathematical model (noise map) of the surroundings of the treatment plant, including knowledge of the acoustic situation and the site of the wastewater treatment plant.
6. Visualization of the Noise Sources on the Site of the Wastewater Treatment Plant
6.1. Measurement No. 1—Air Distribution Pipes
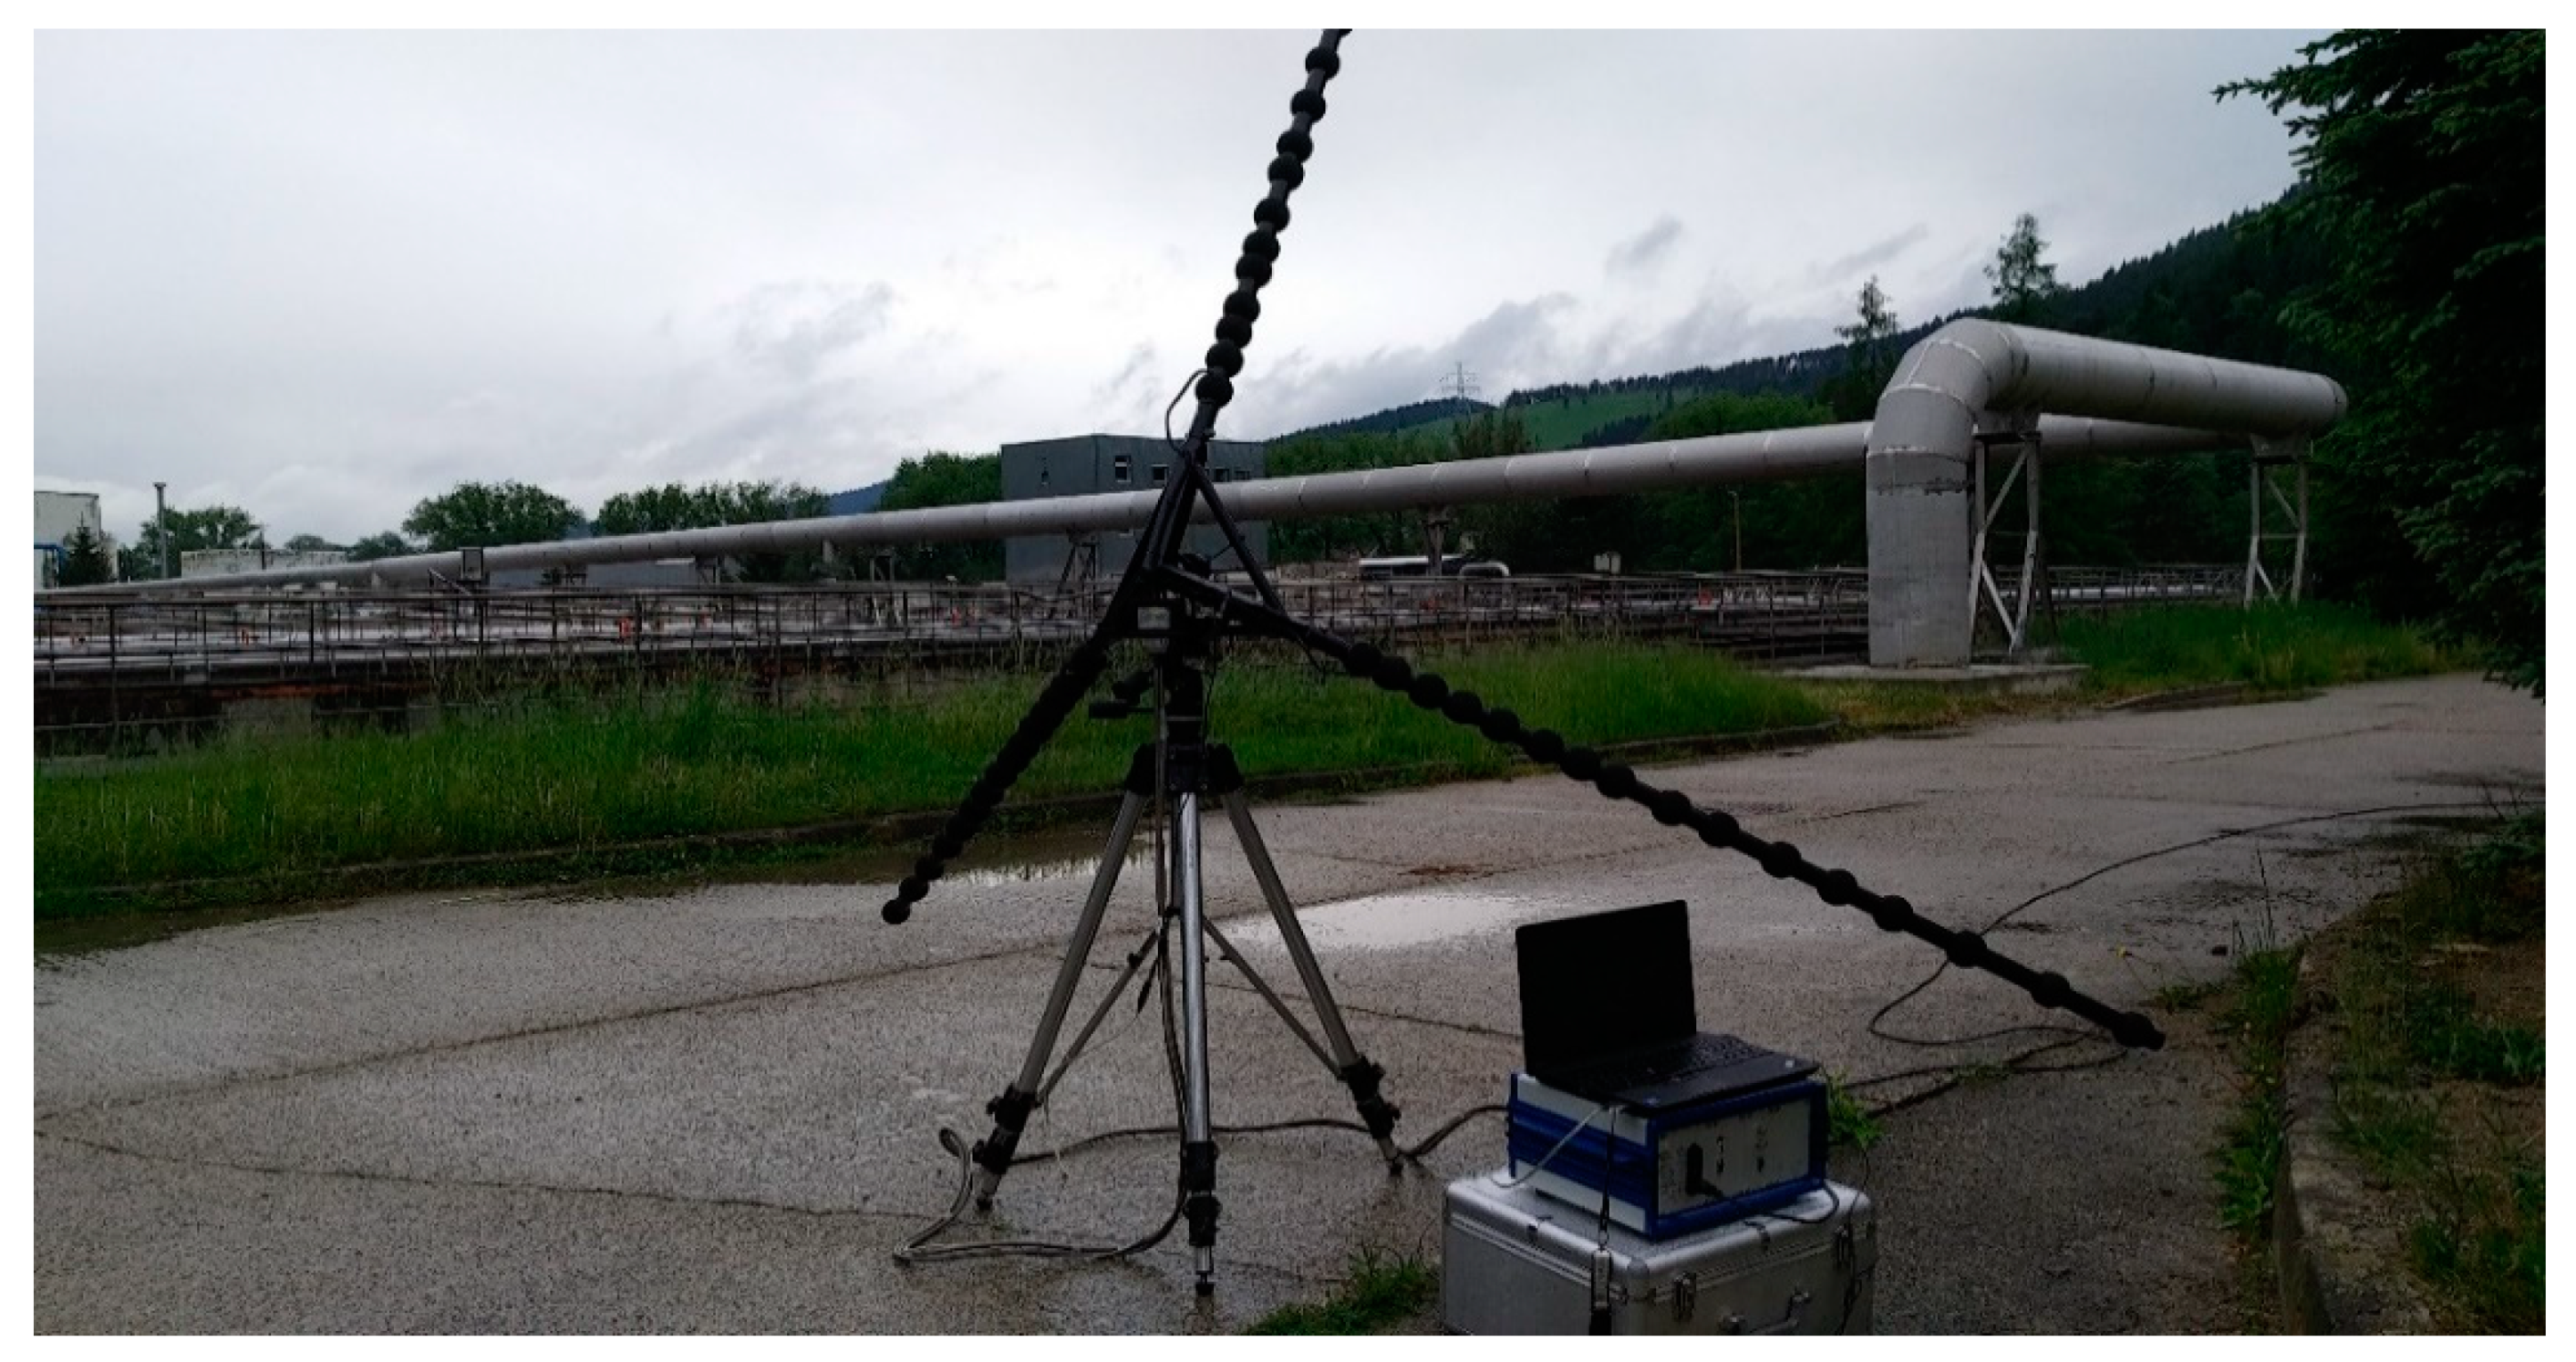
Measurement no. 1 was carried out with a focus on the pipes designed for air distribution from a distance of 20 m.
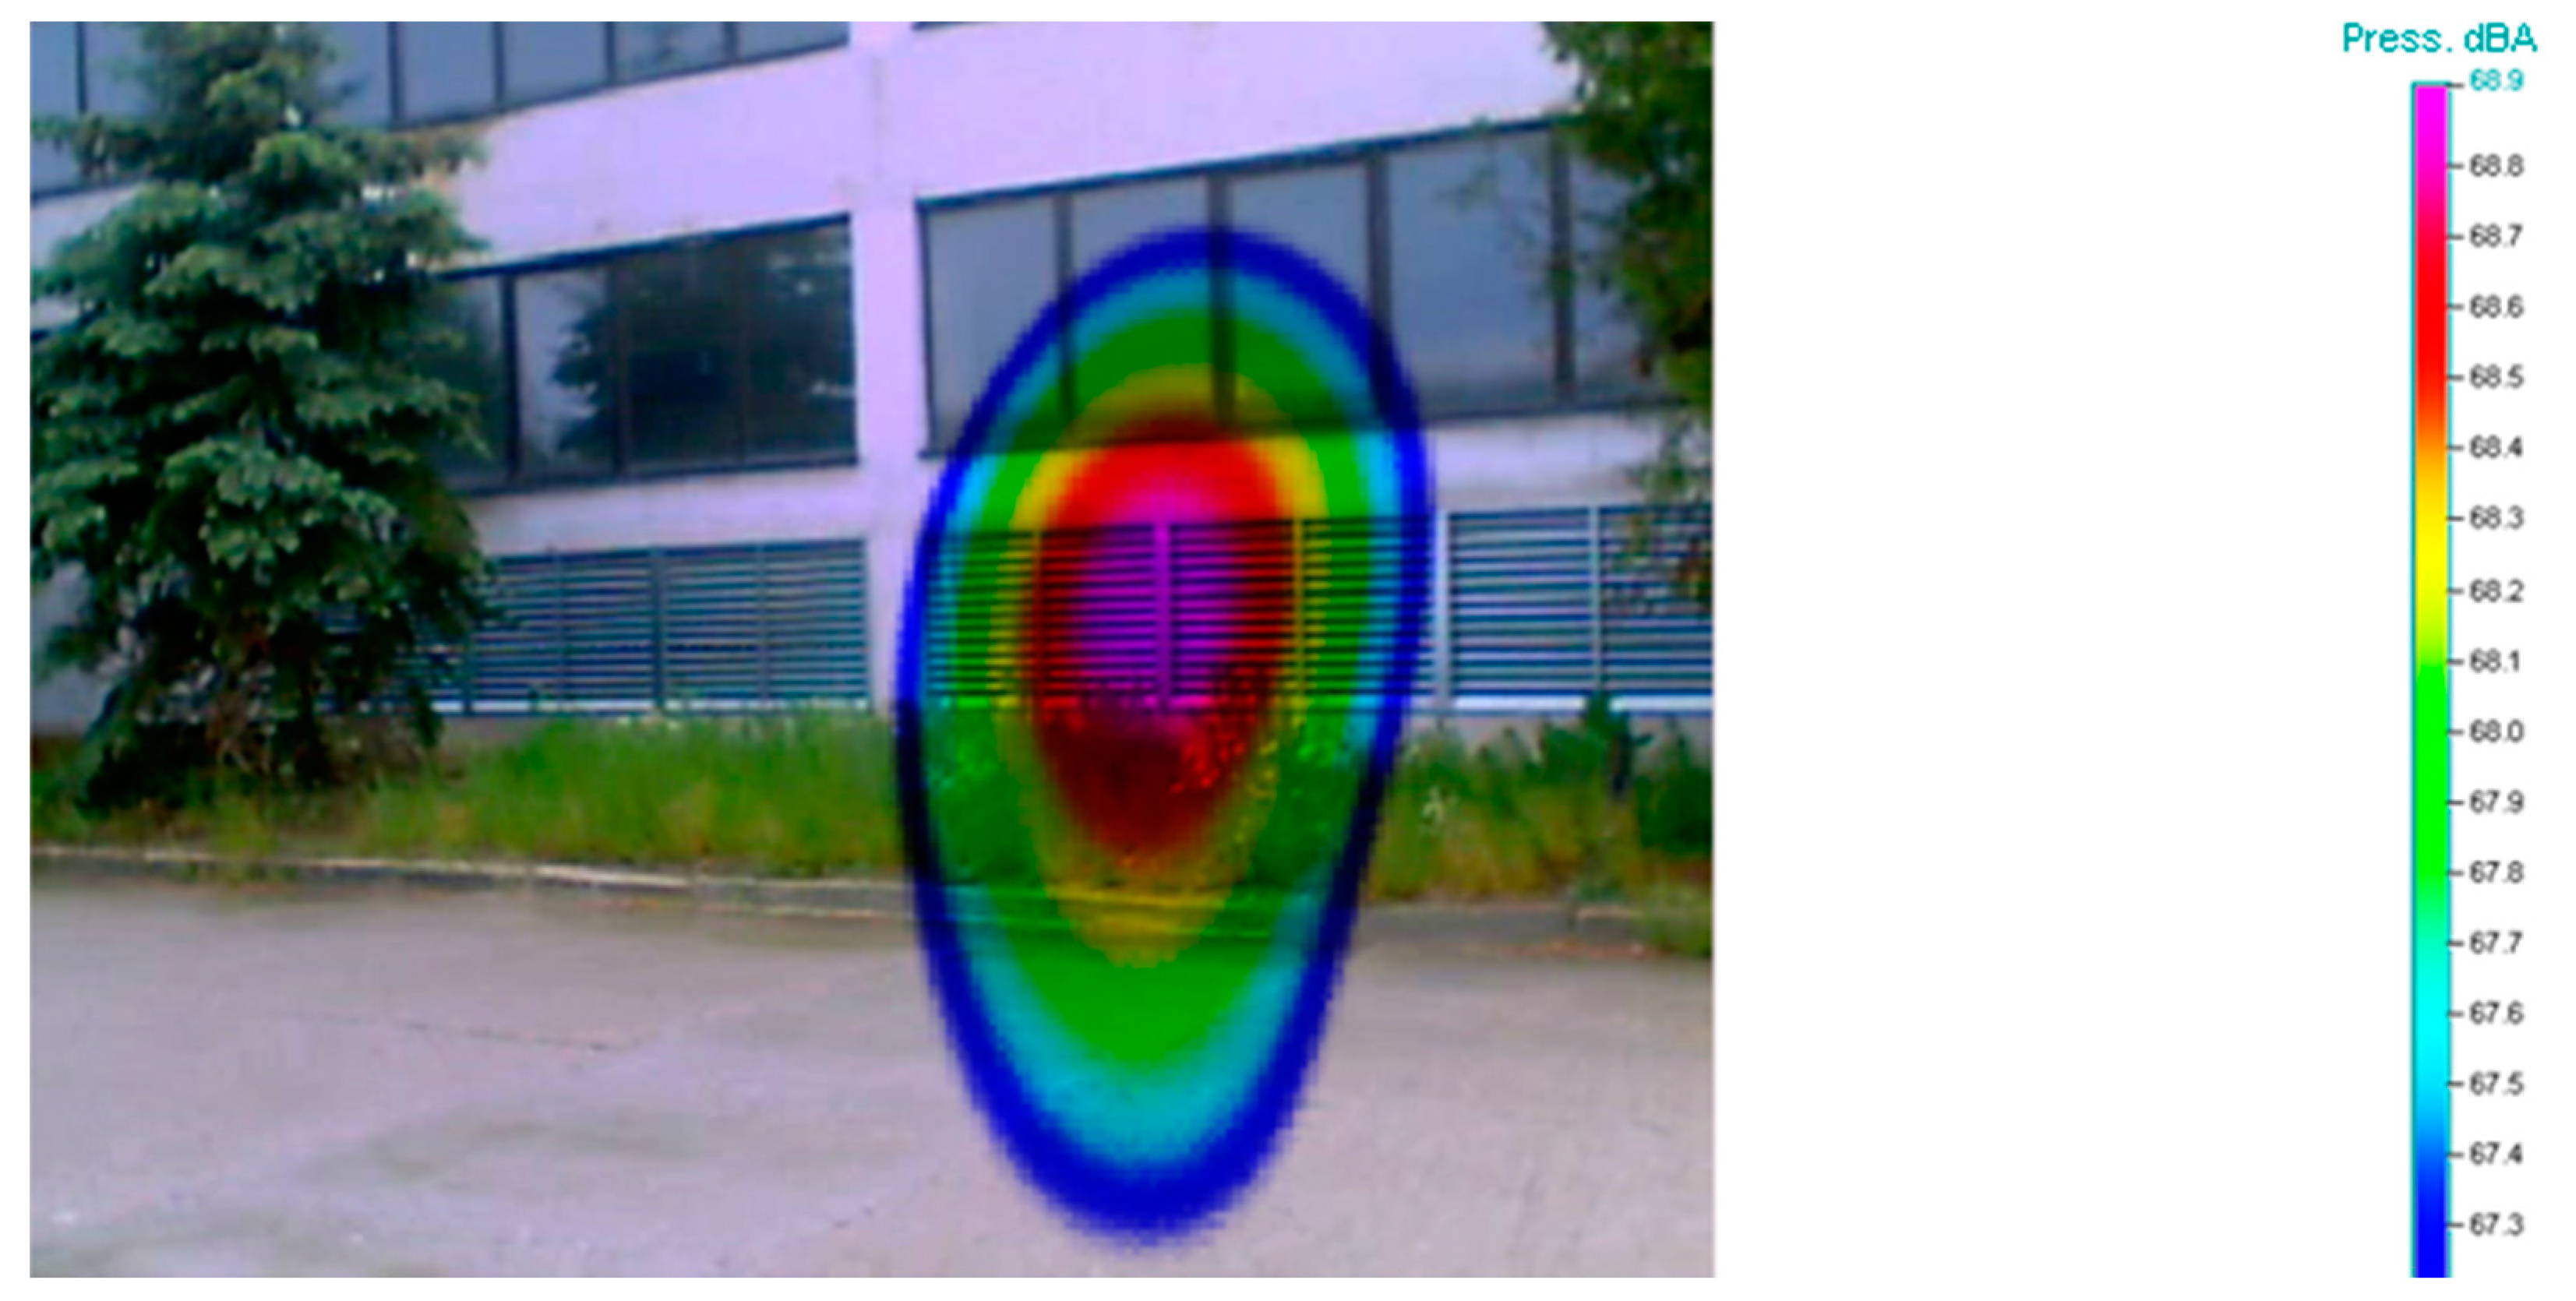
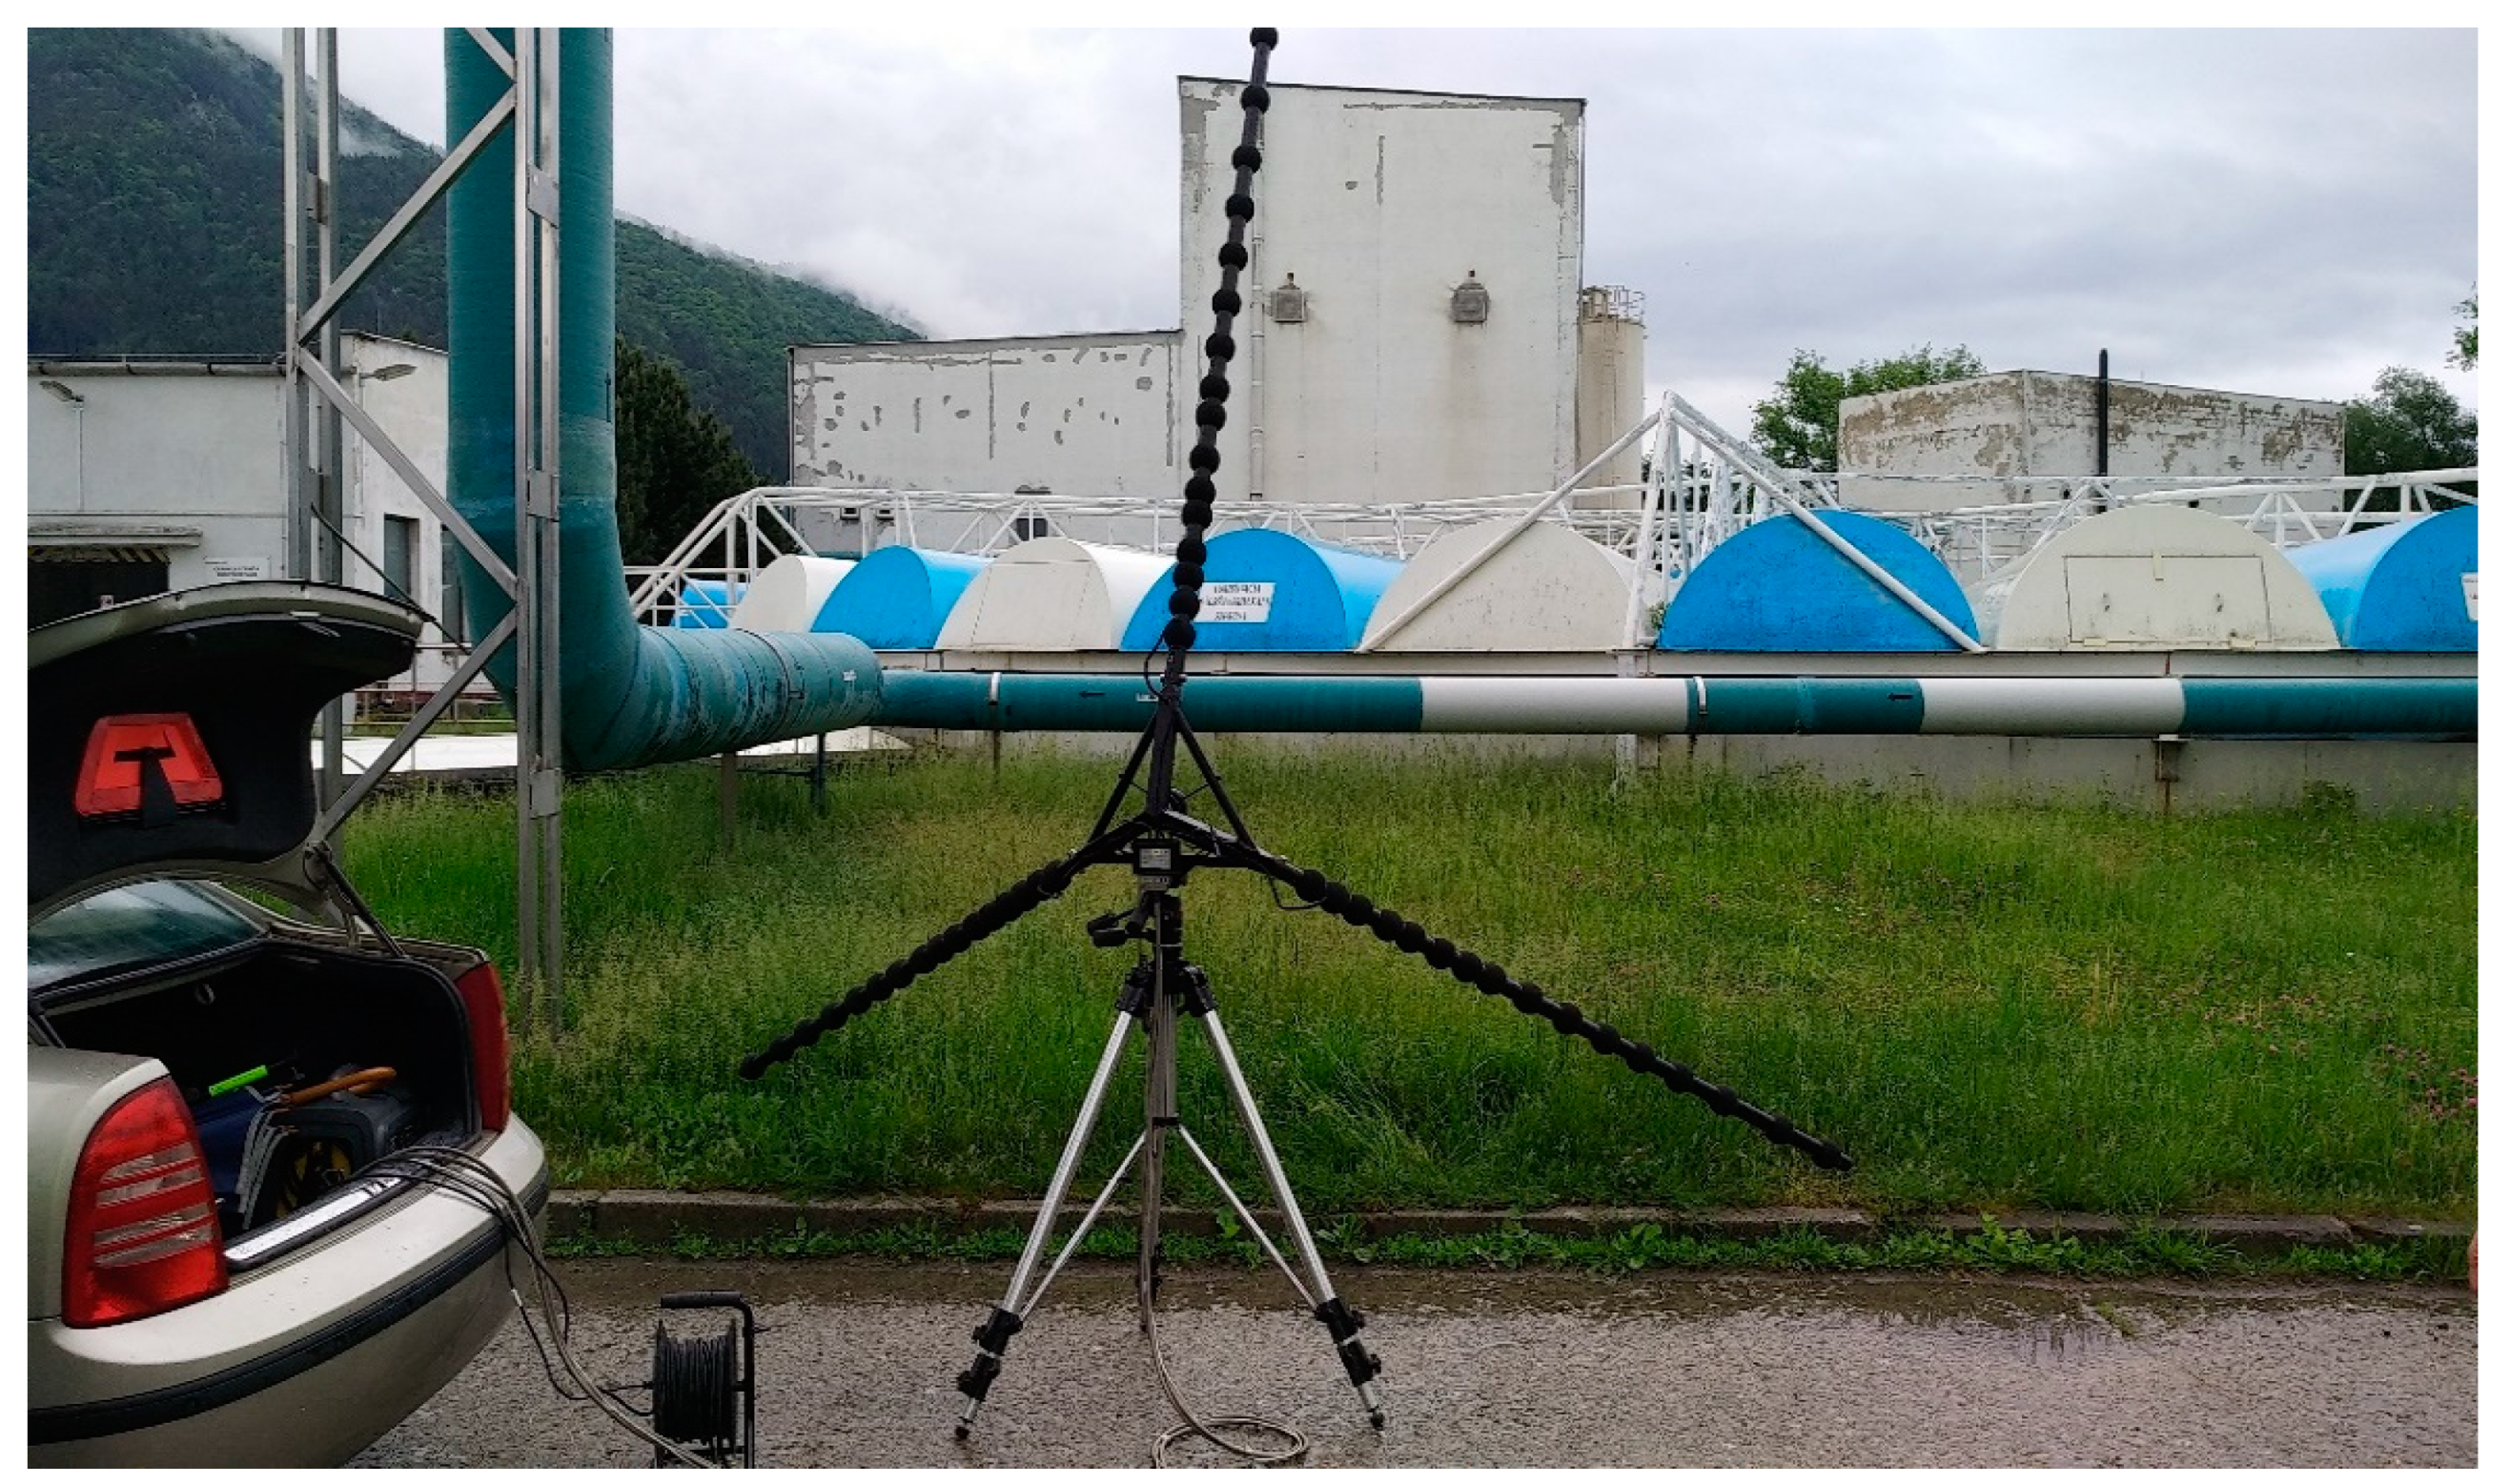
Figure 5 shows a view of the installed acoustic camera.
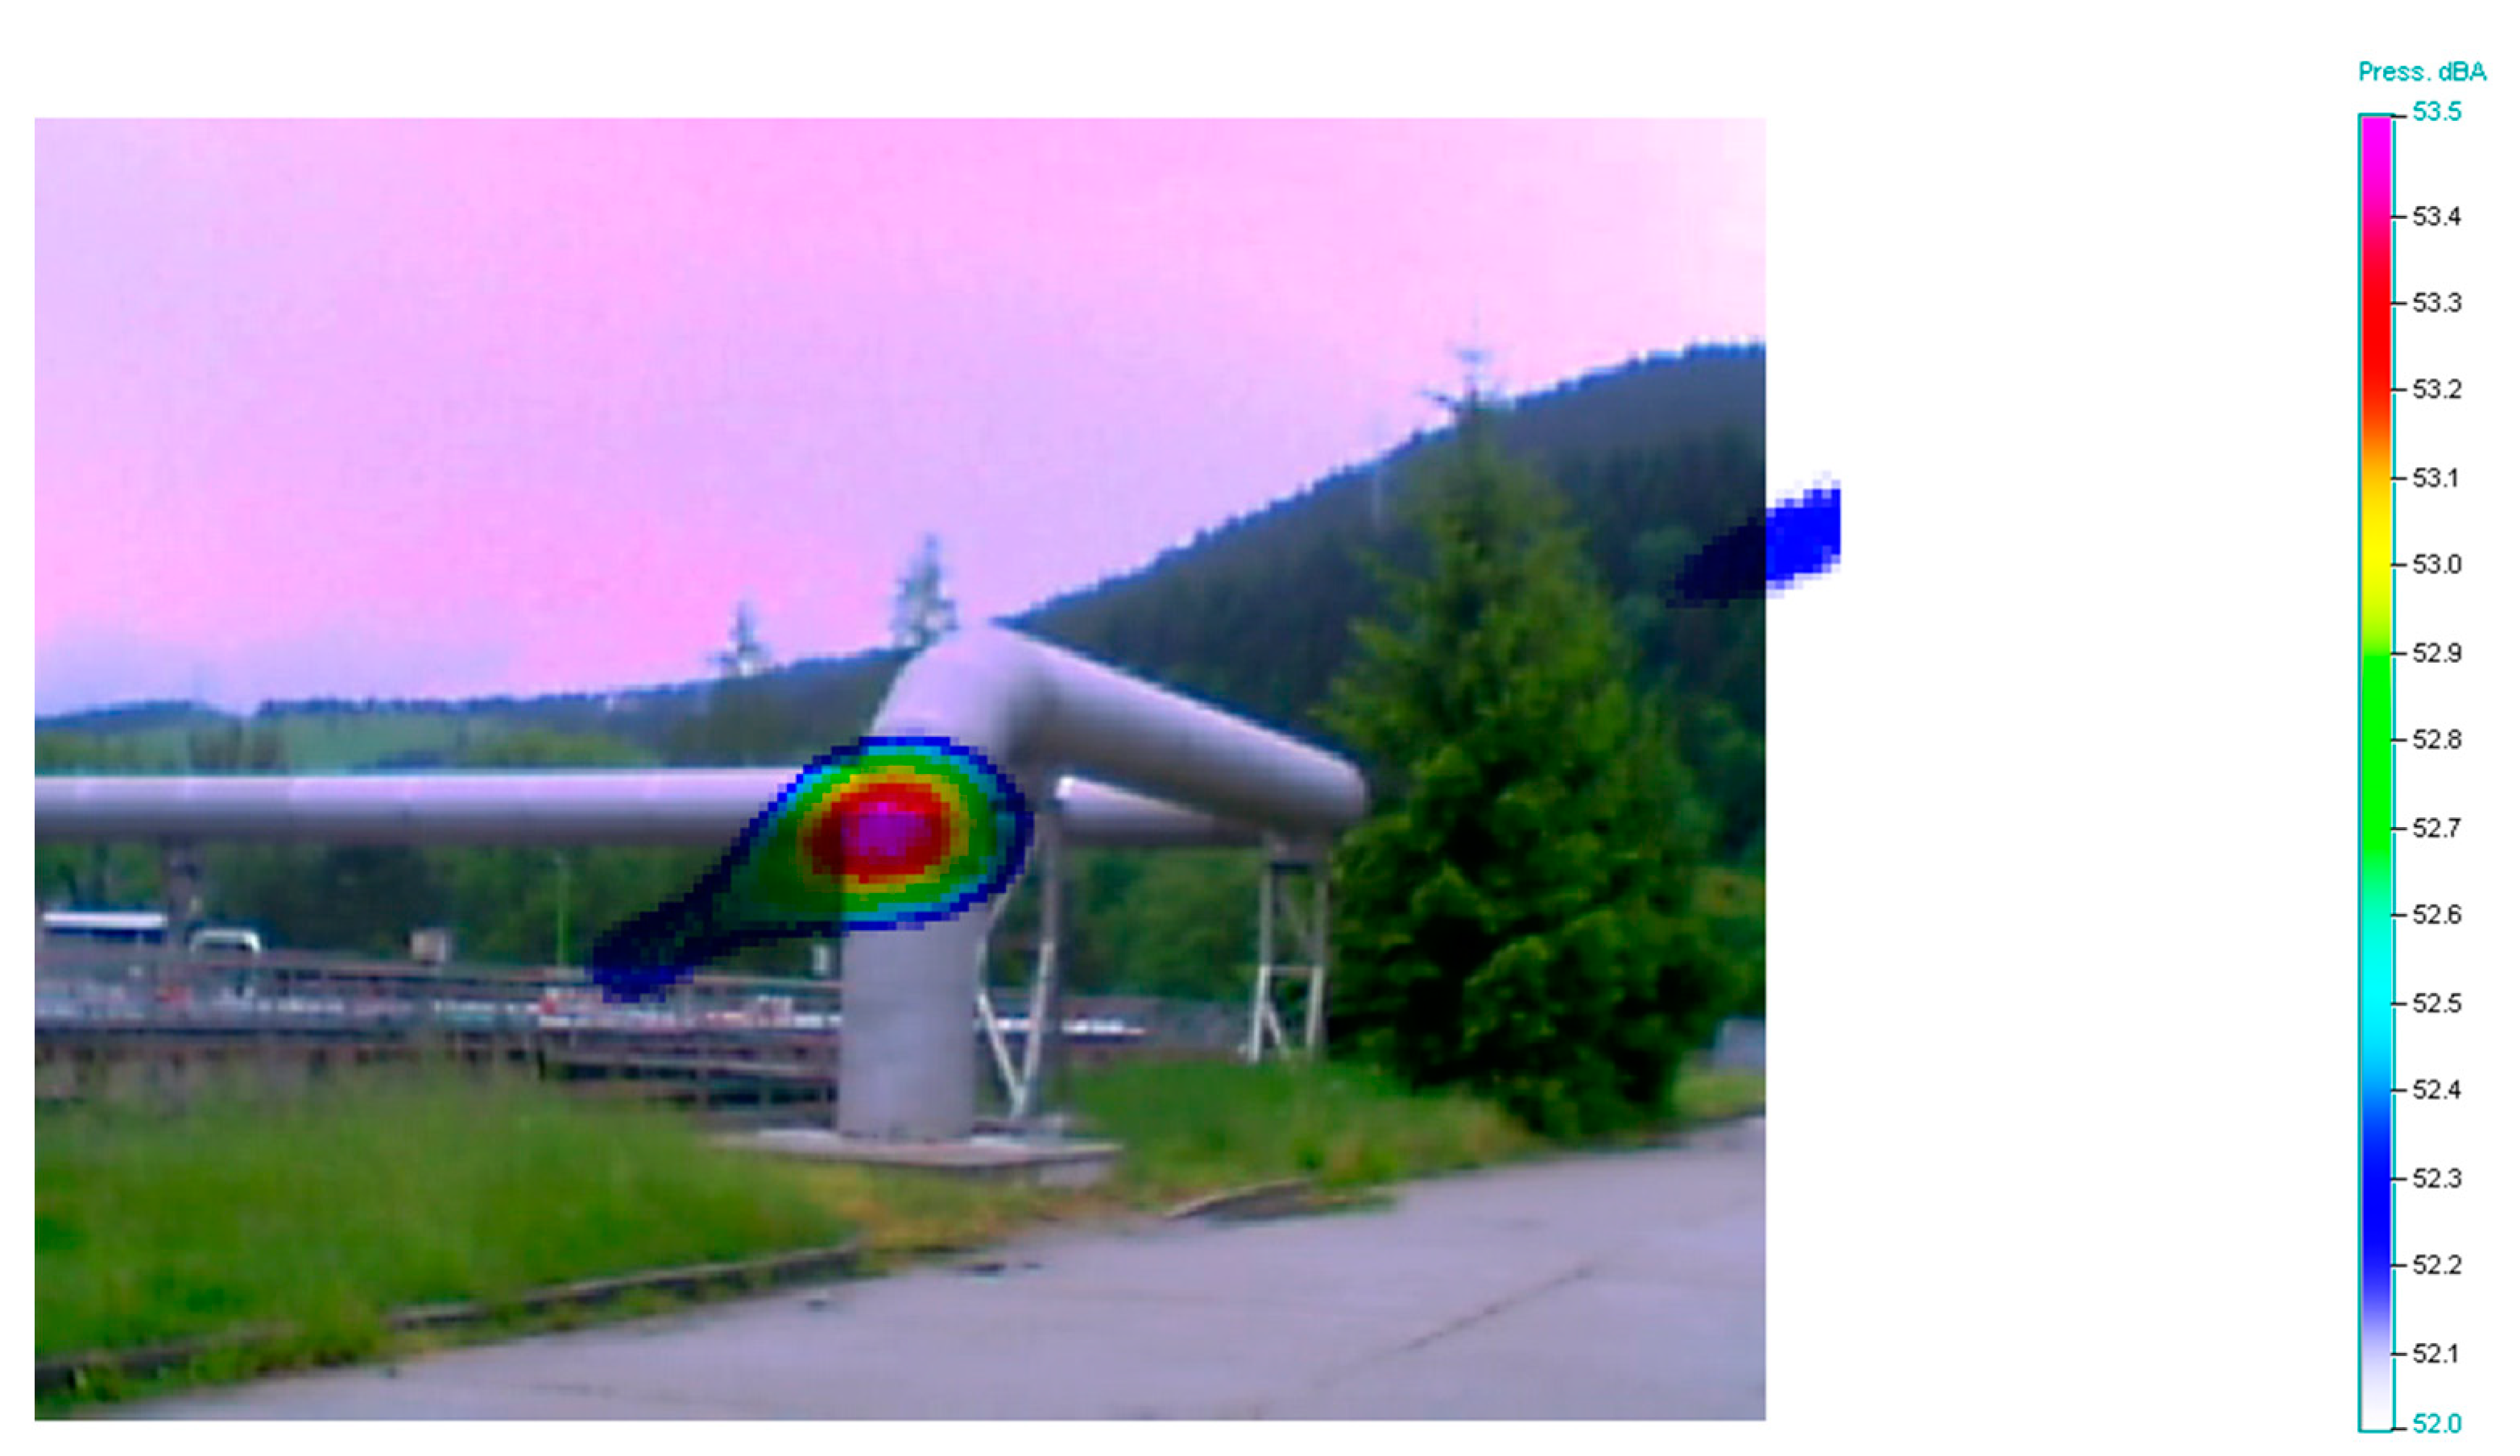
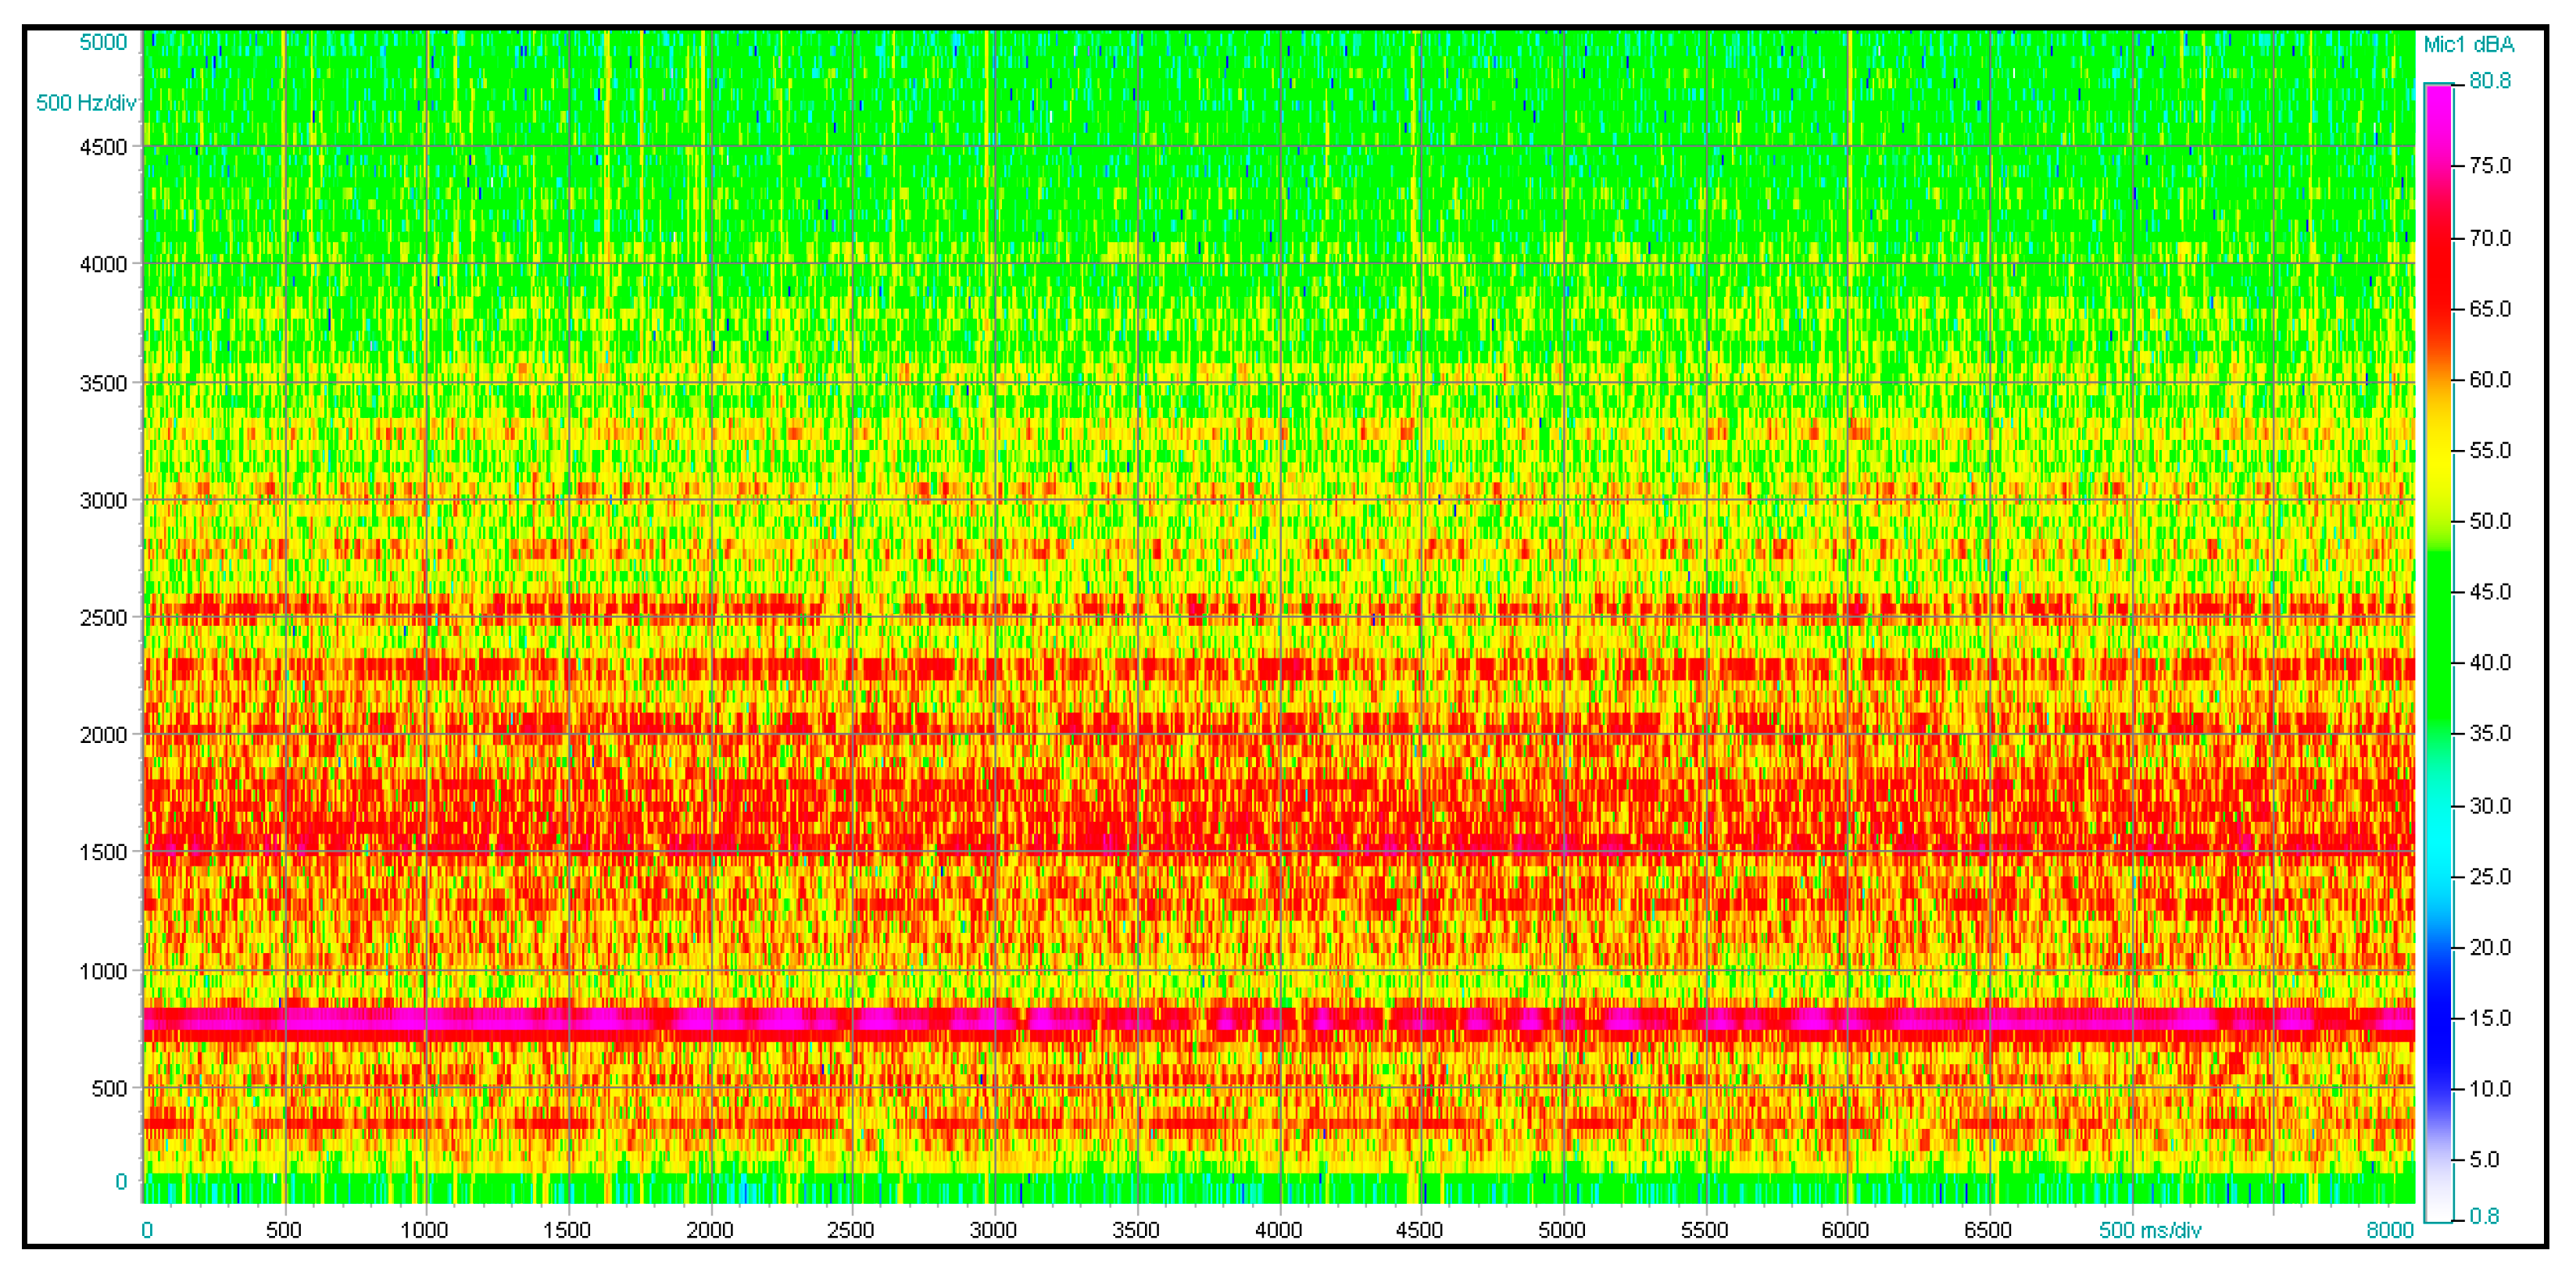
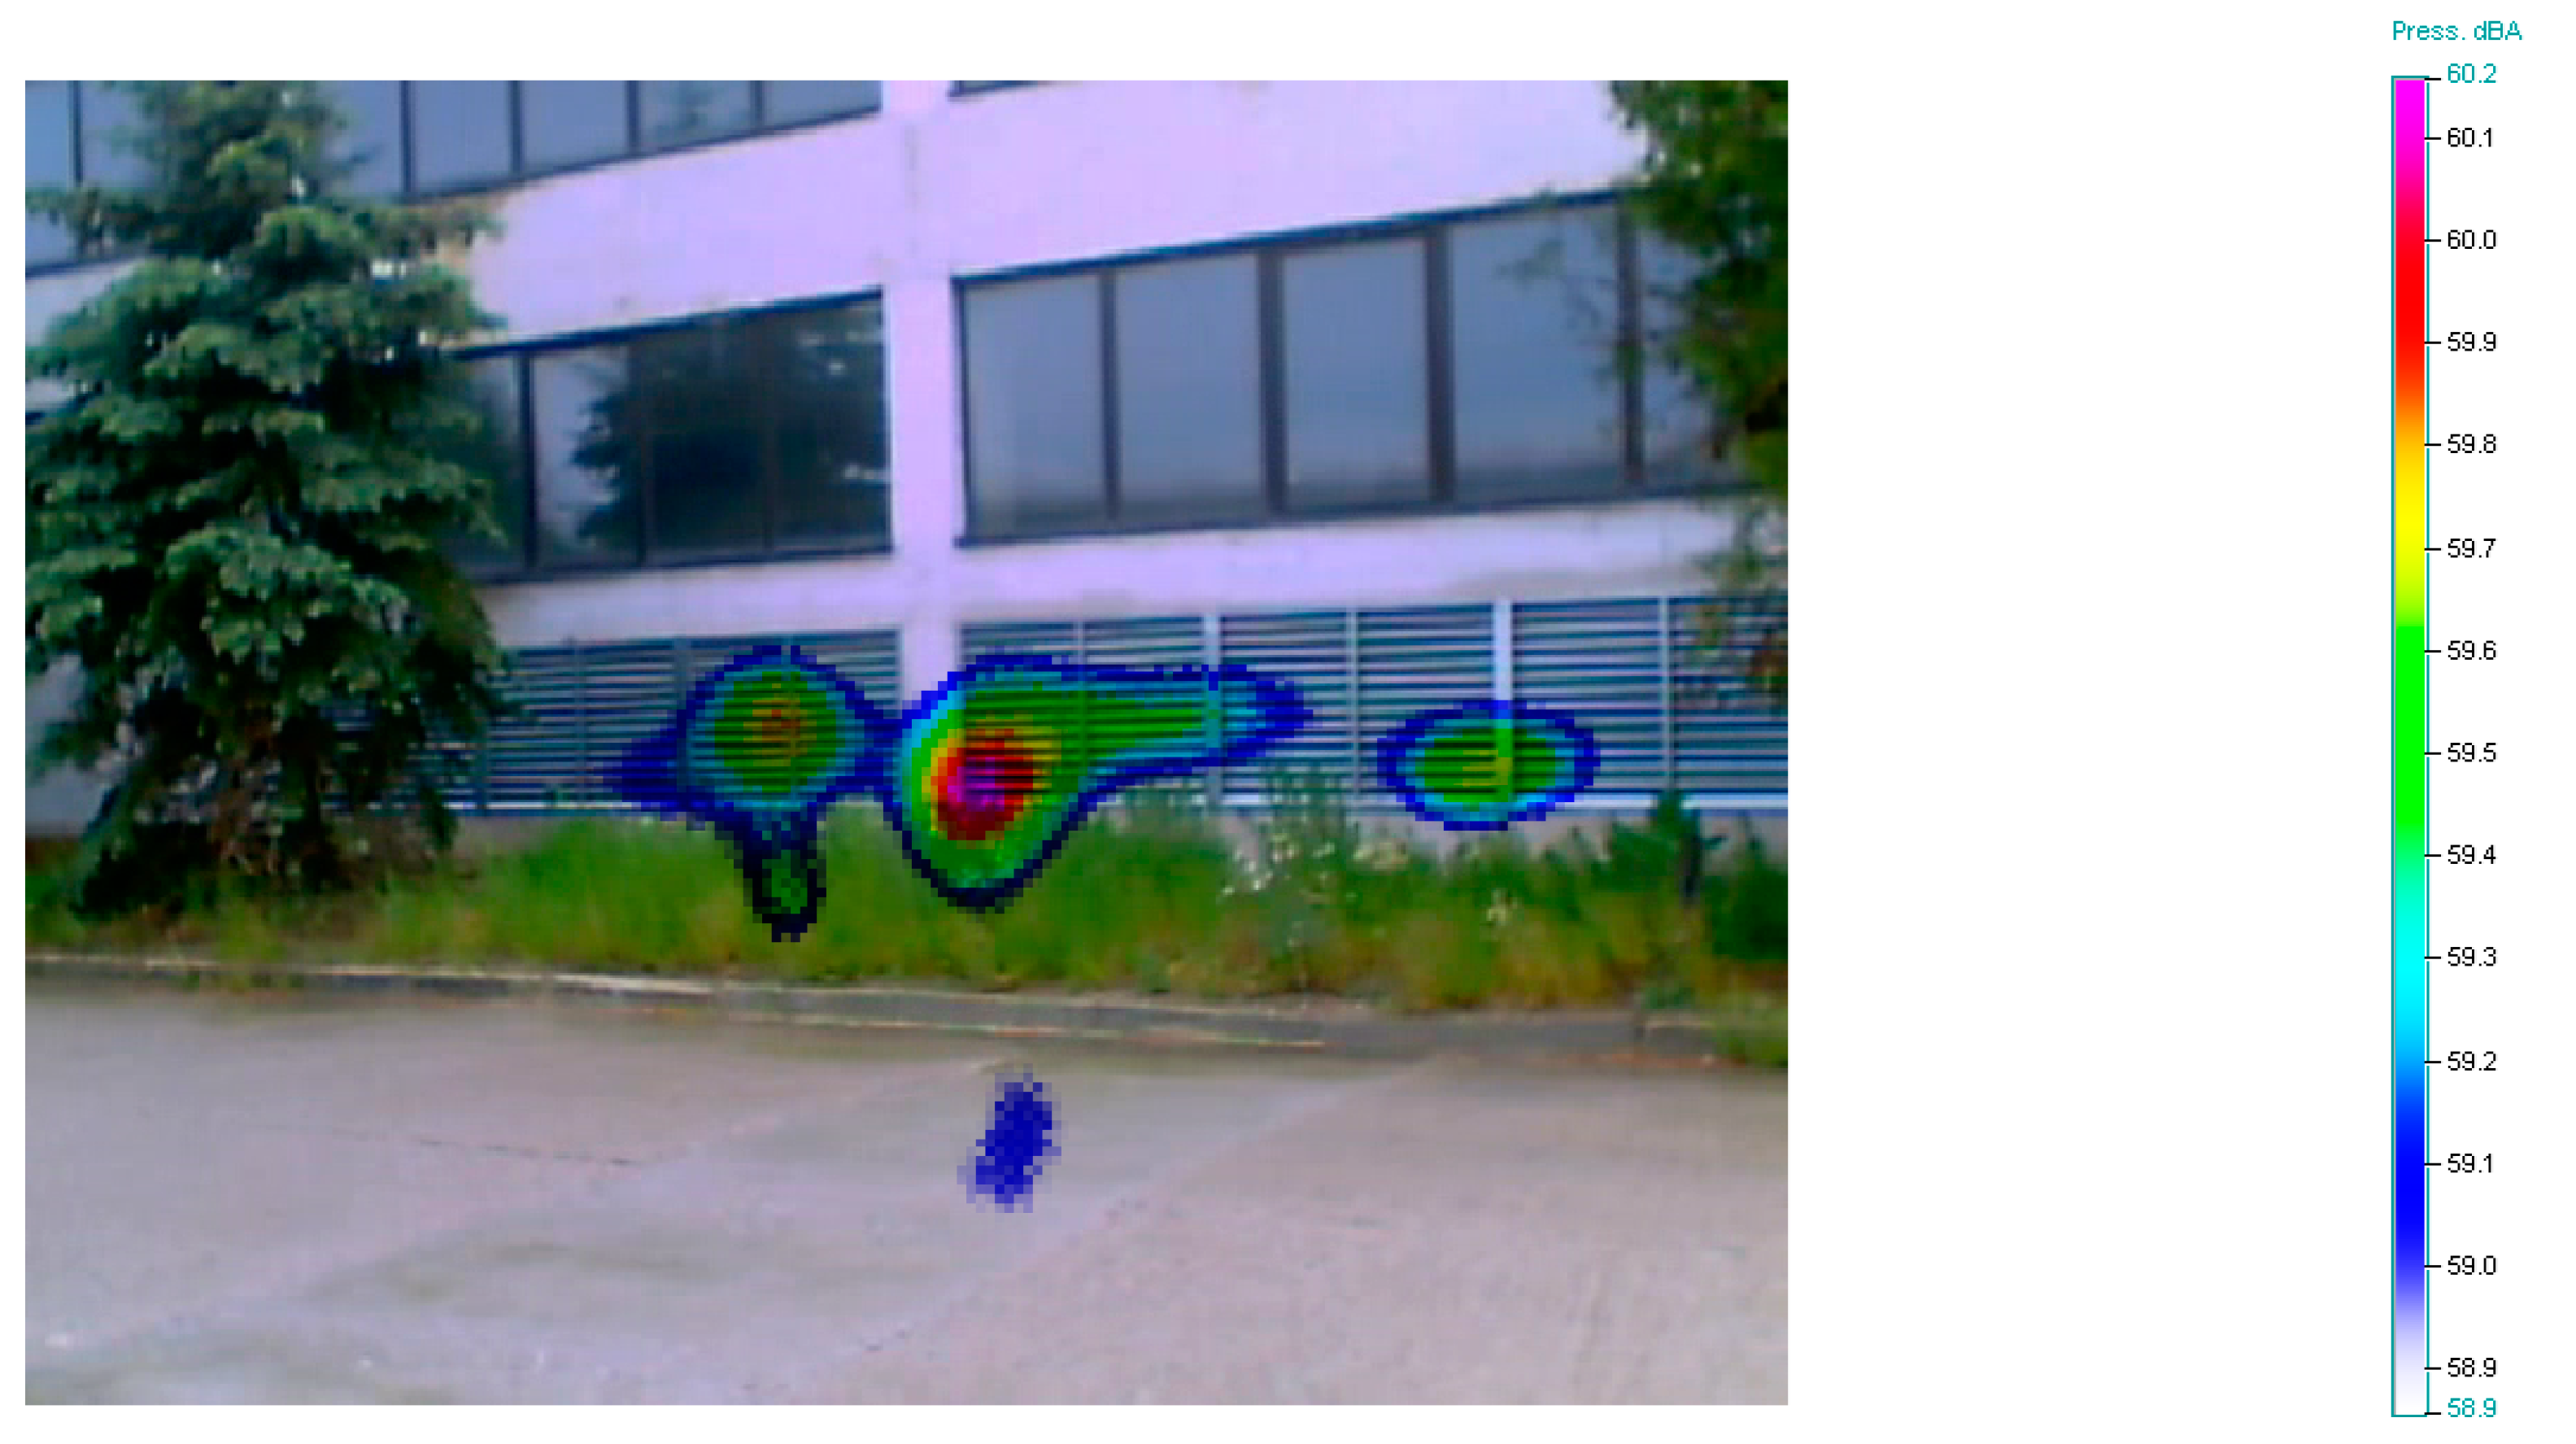
Figure 6 shows the noise emissions of the visualized object across the 740–840 Hz frequency band. The location of the integrated noise source is evident from the acoustic image presented.
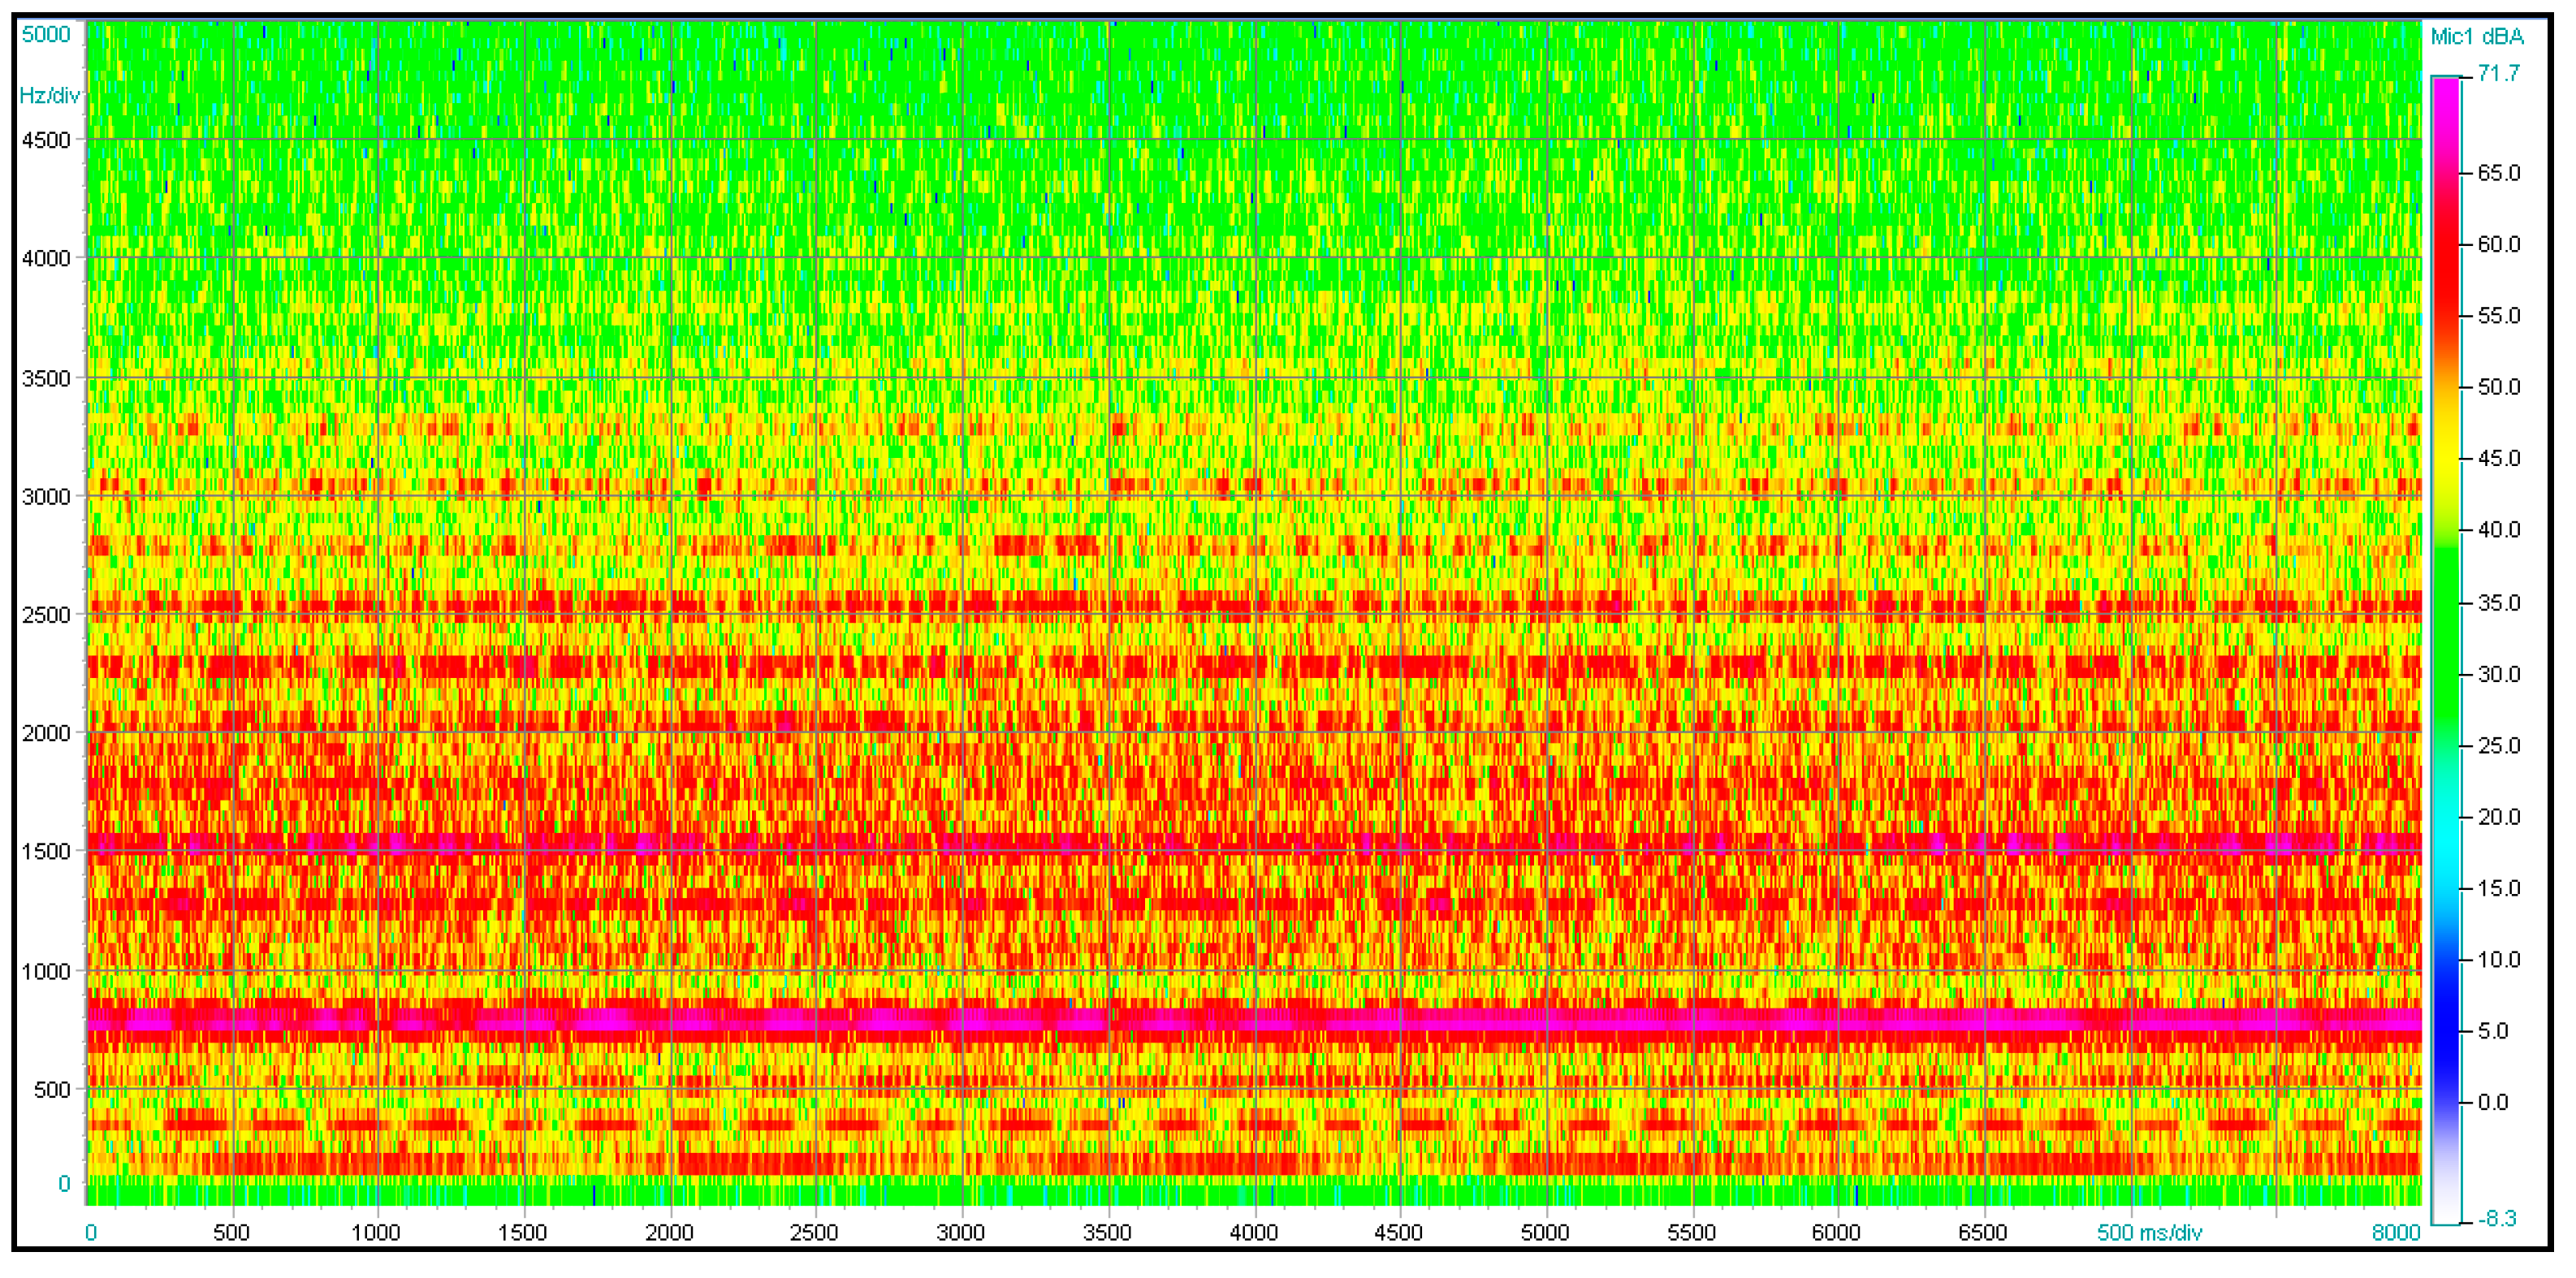
Figure 7 shows the noise spectrogram for this measurement. It is clear from the spectrogram that the dominant frequencies are in the range of 740–840 Hz.
6.2. Measurement No. 2—Blower Room Building (East Side)
Measurement no. 2 was carried out with a focus on the blower room building from the east side from a distance of 13 m.
Figure 8 shows a view of the acoustic camera installed.
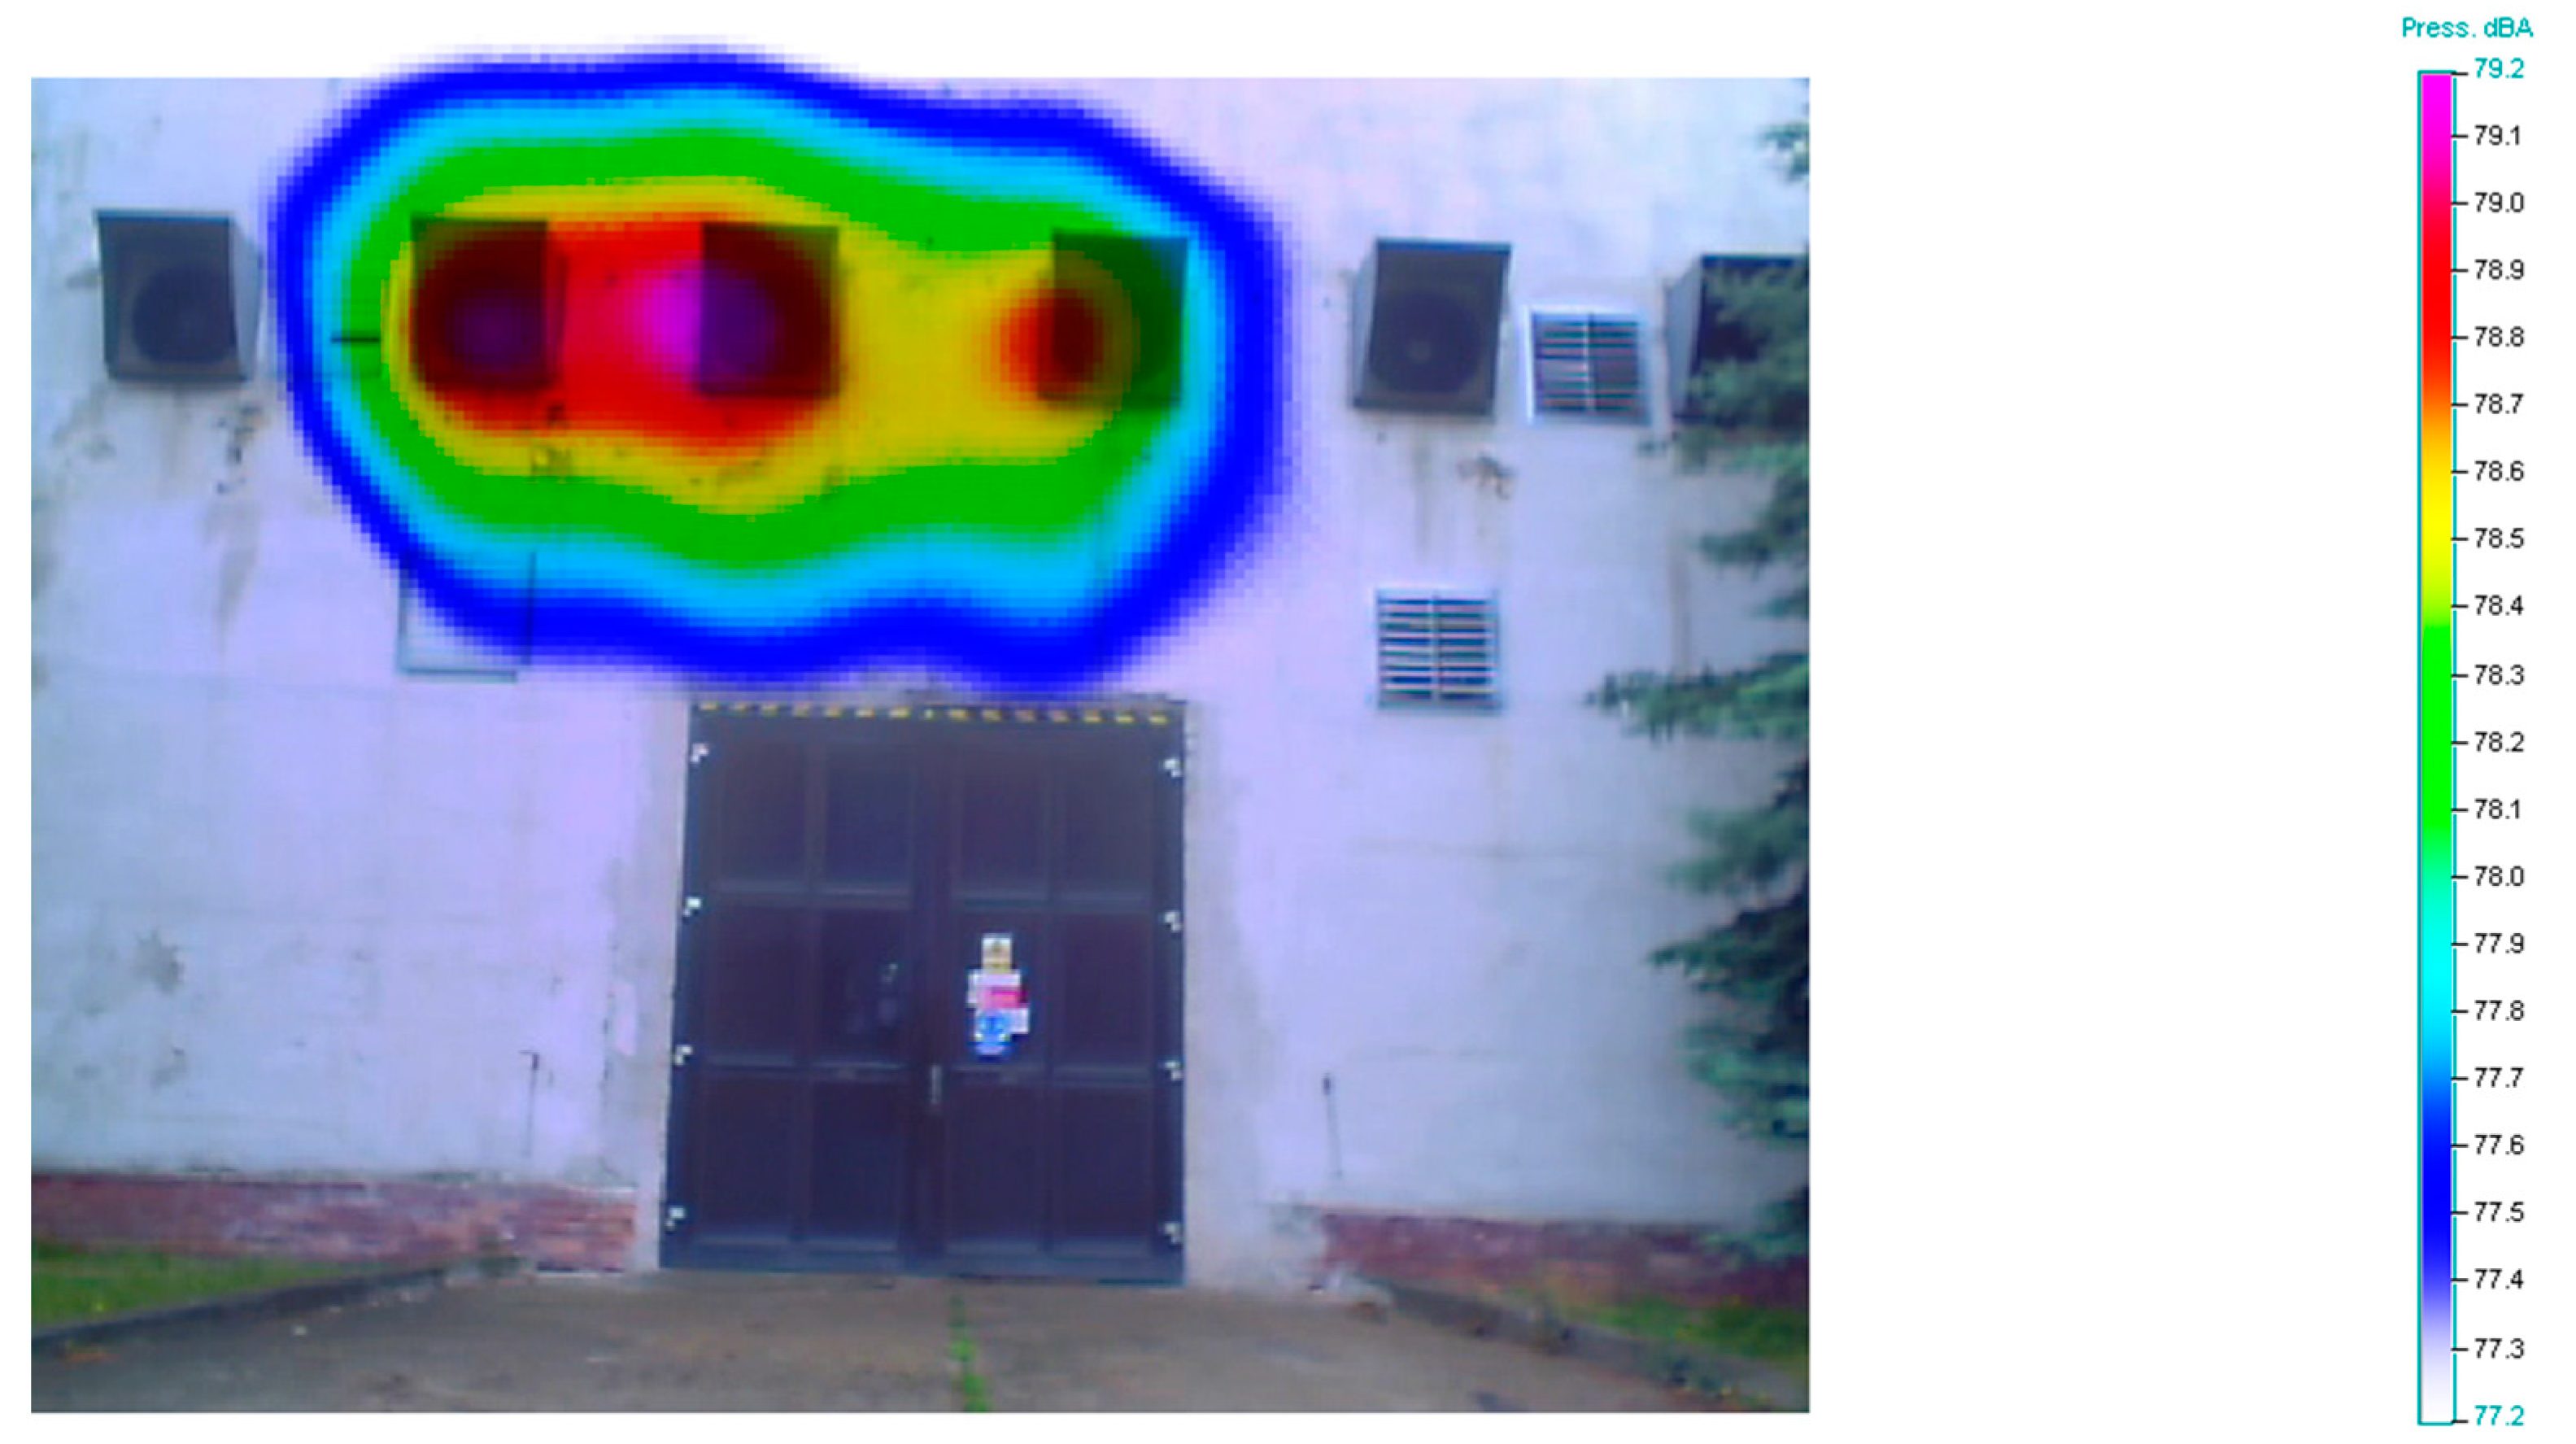
Figure 9 shows the noise emissions of the visualized object across the whole frequency band. The location of the integrated noise source is evident from the acoustic image presented.
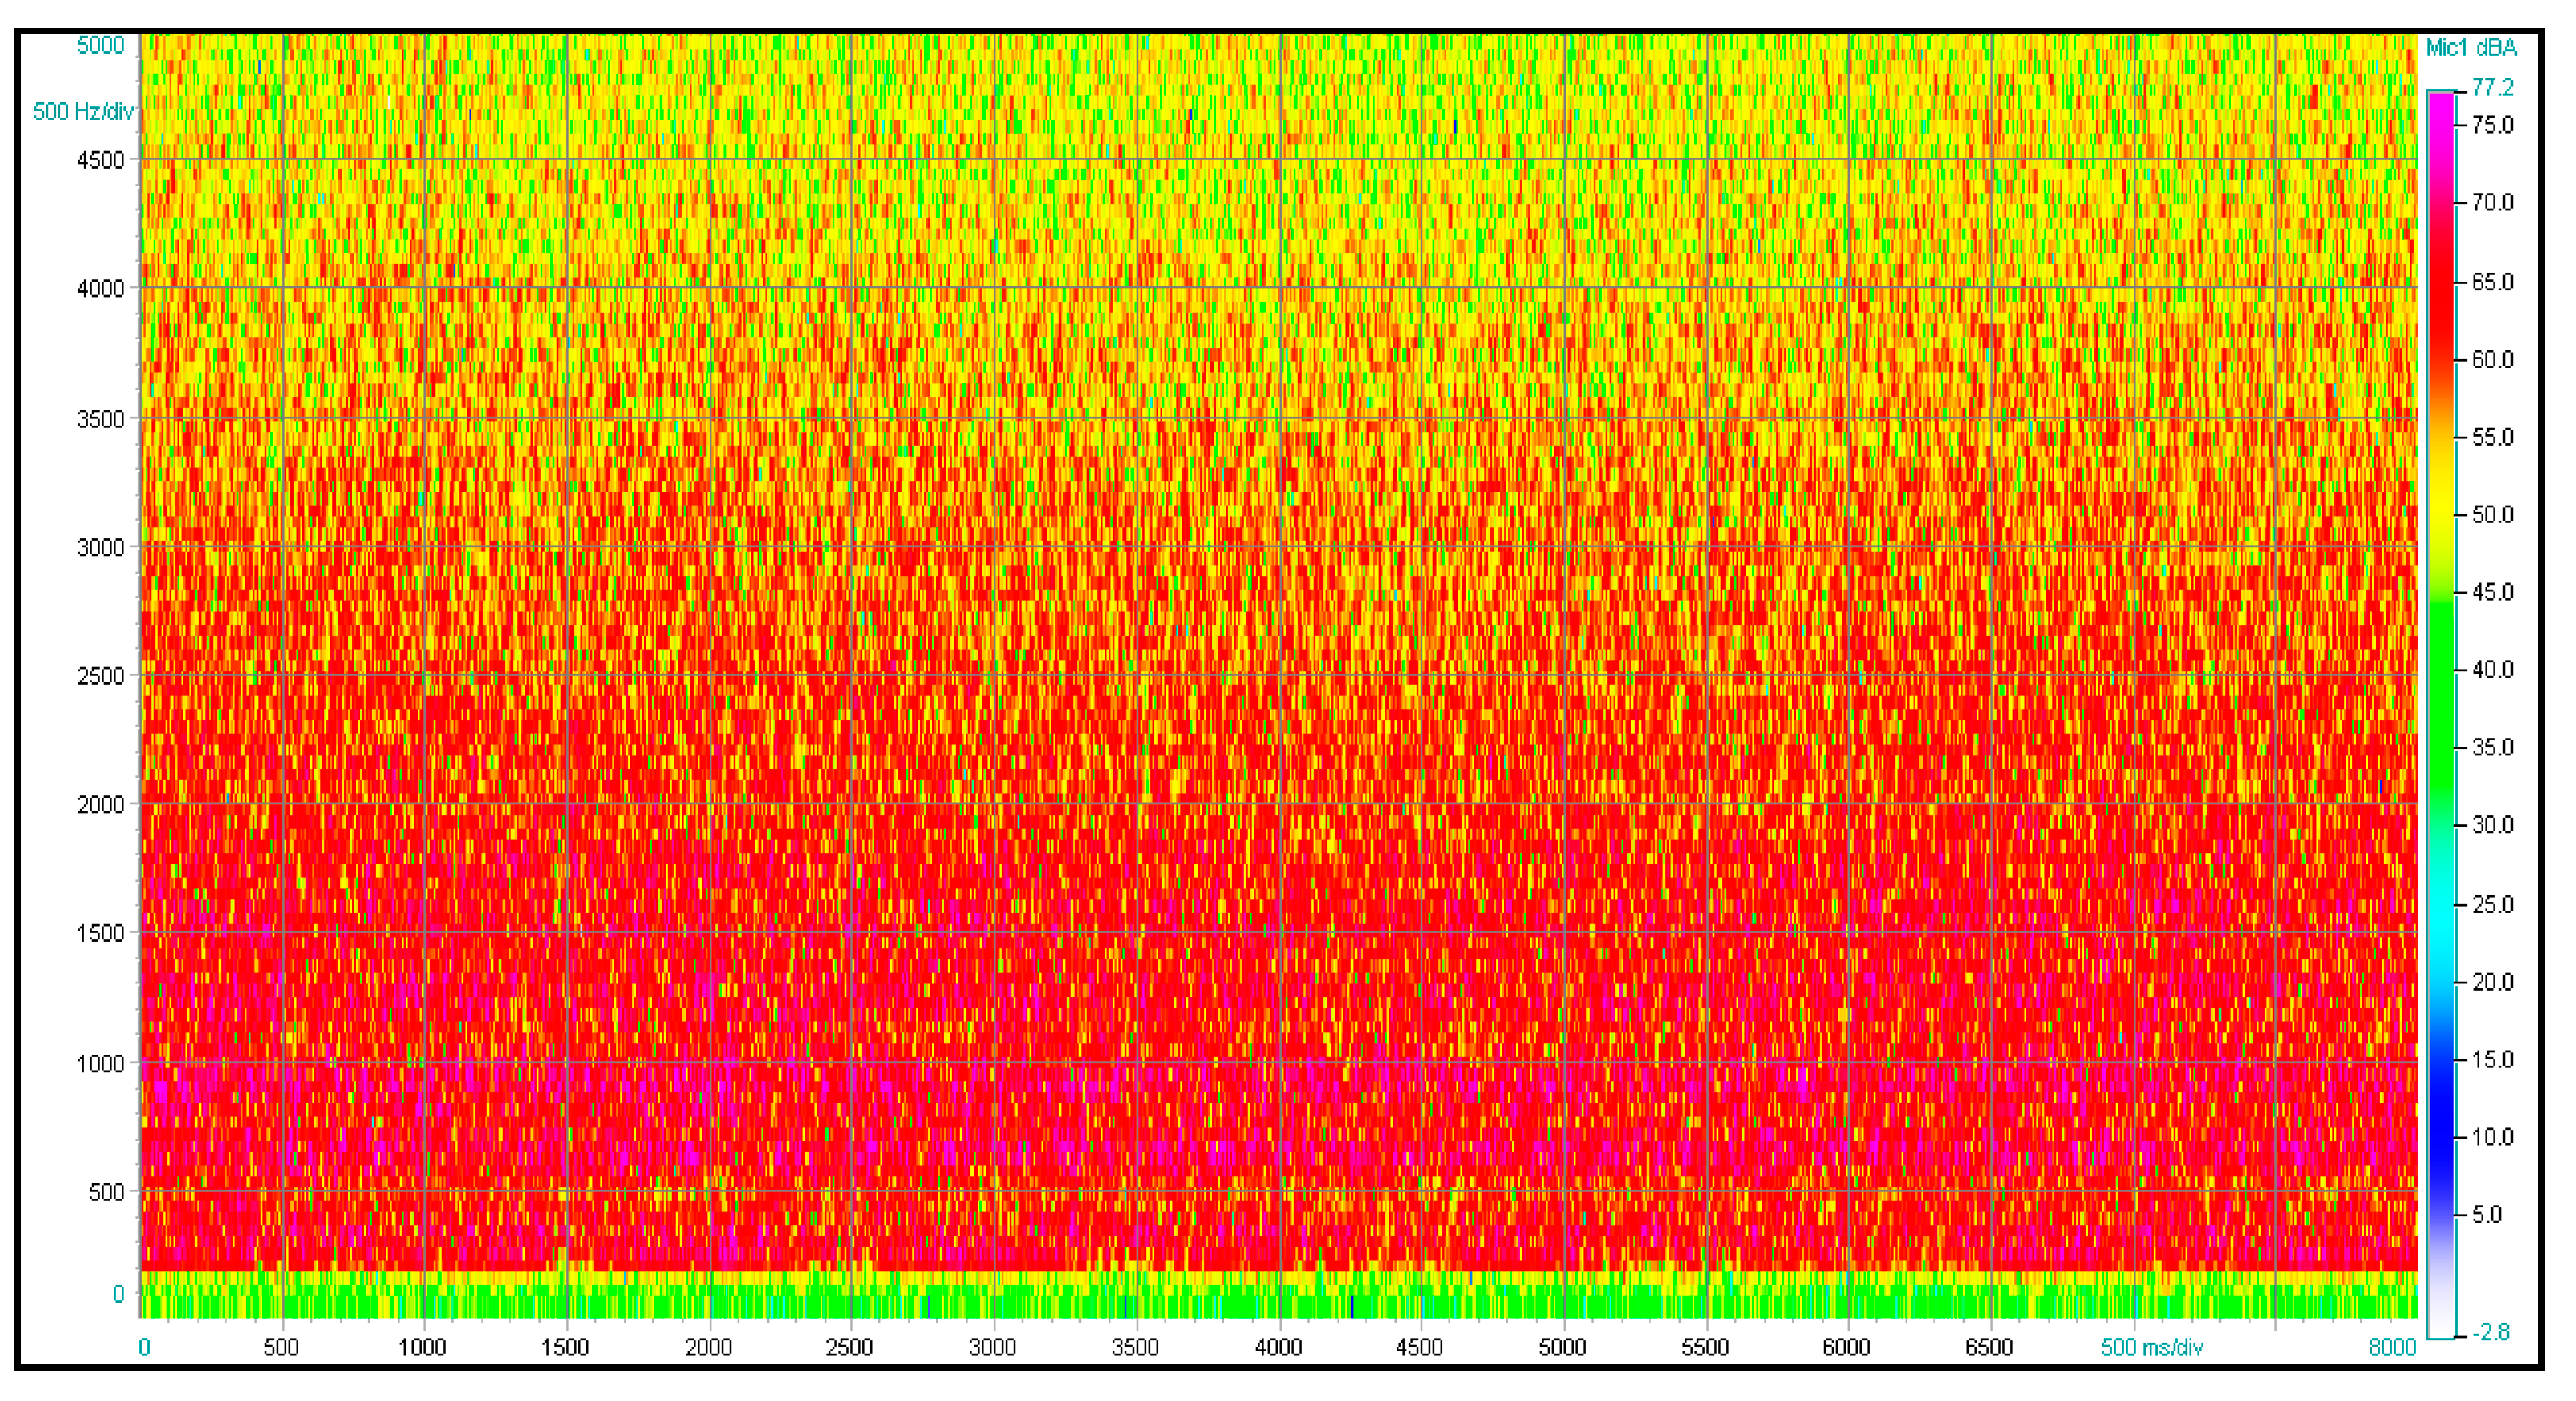
Figure 10 shows the noise spectrogram for this measurement.
It is clear from the above spectrogram that the dominant frequencies are in the ranges of 250–500 and 1500–2000 Hz.
Figure 11 shows the noise emissions of the visualized object in the 250–500 Hz frequency band, whole
Figure 12 shows the 1500–2500 Hz frequency band.
6.3. Measurement No. 3—Blower Room Building (South Side)
Measurement no. 3 was carried out with a focus on the blower room building from the south side from a distance of 11 m.
Figure 13 shows the noise emissions of the visualized object across the frequency band. The location of the integrated noise source is evident from the acoustic image presented.
Figure 14 shows the noise spectrogram for this measurement.
6.4. Measurement No. 4—Sludge Treatment
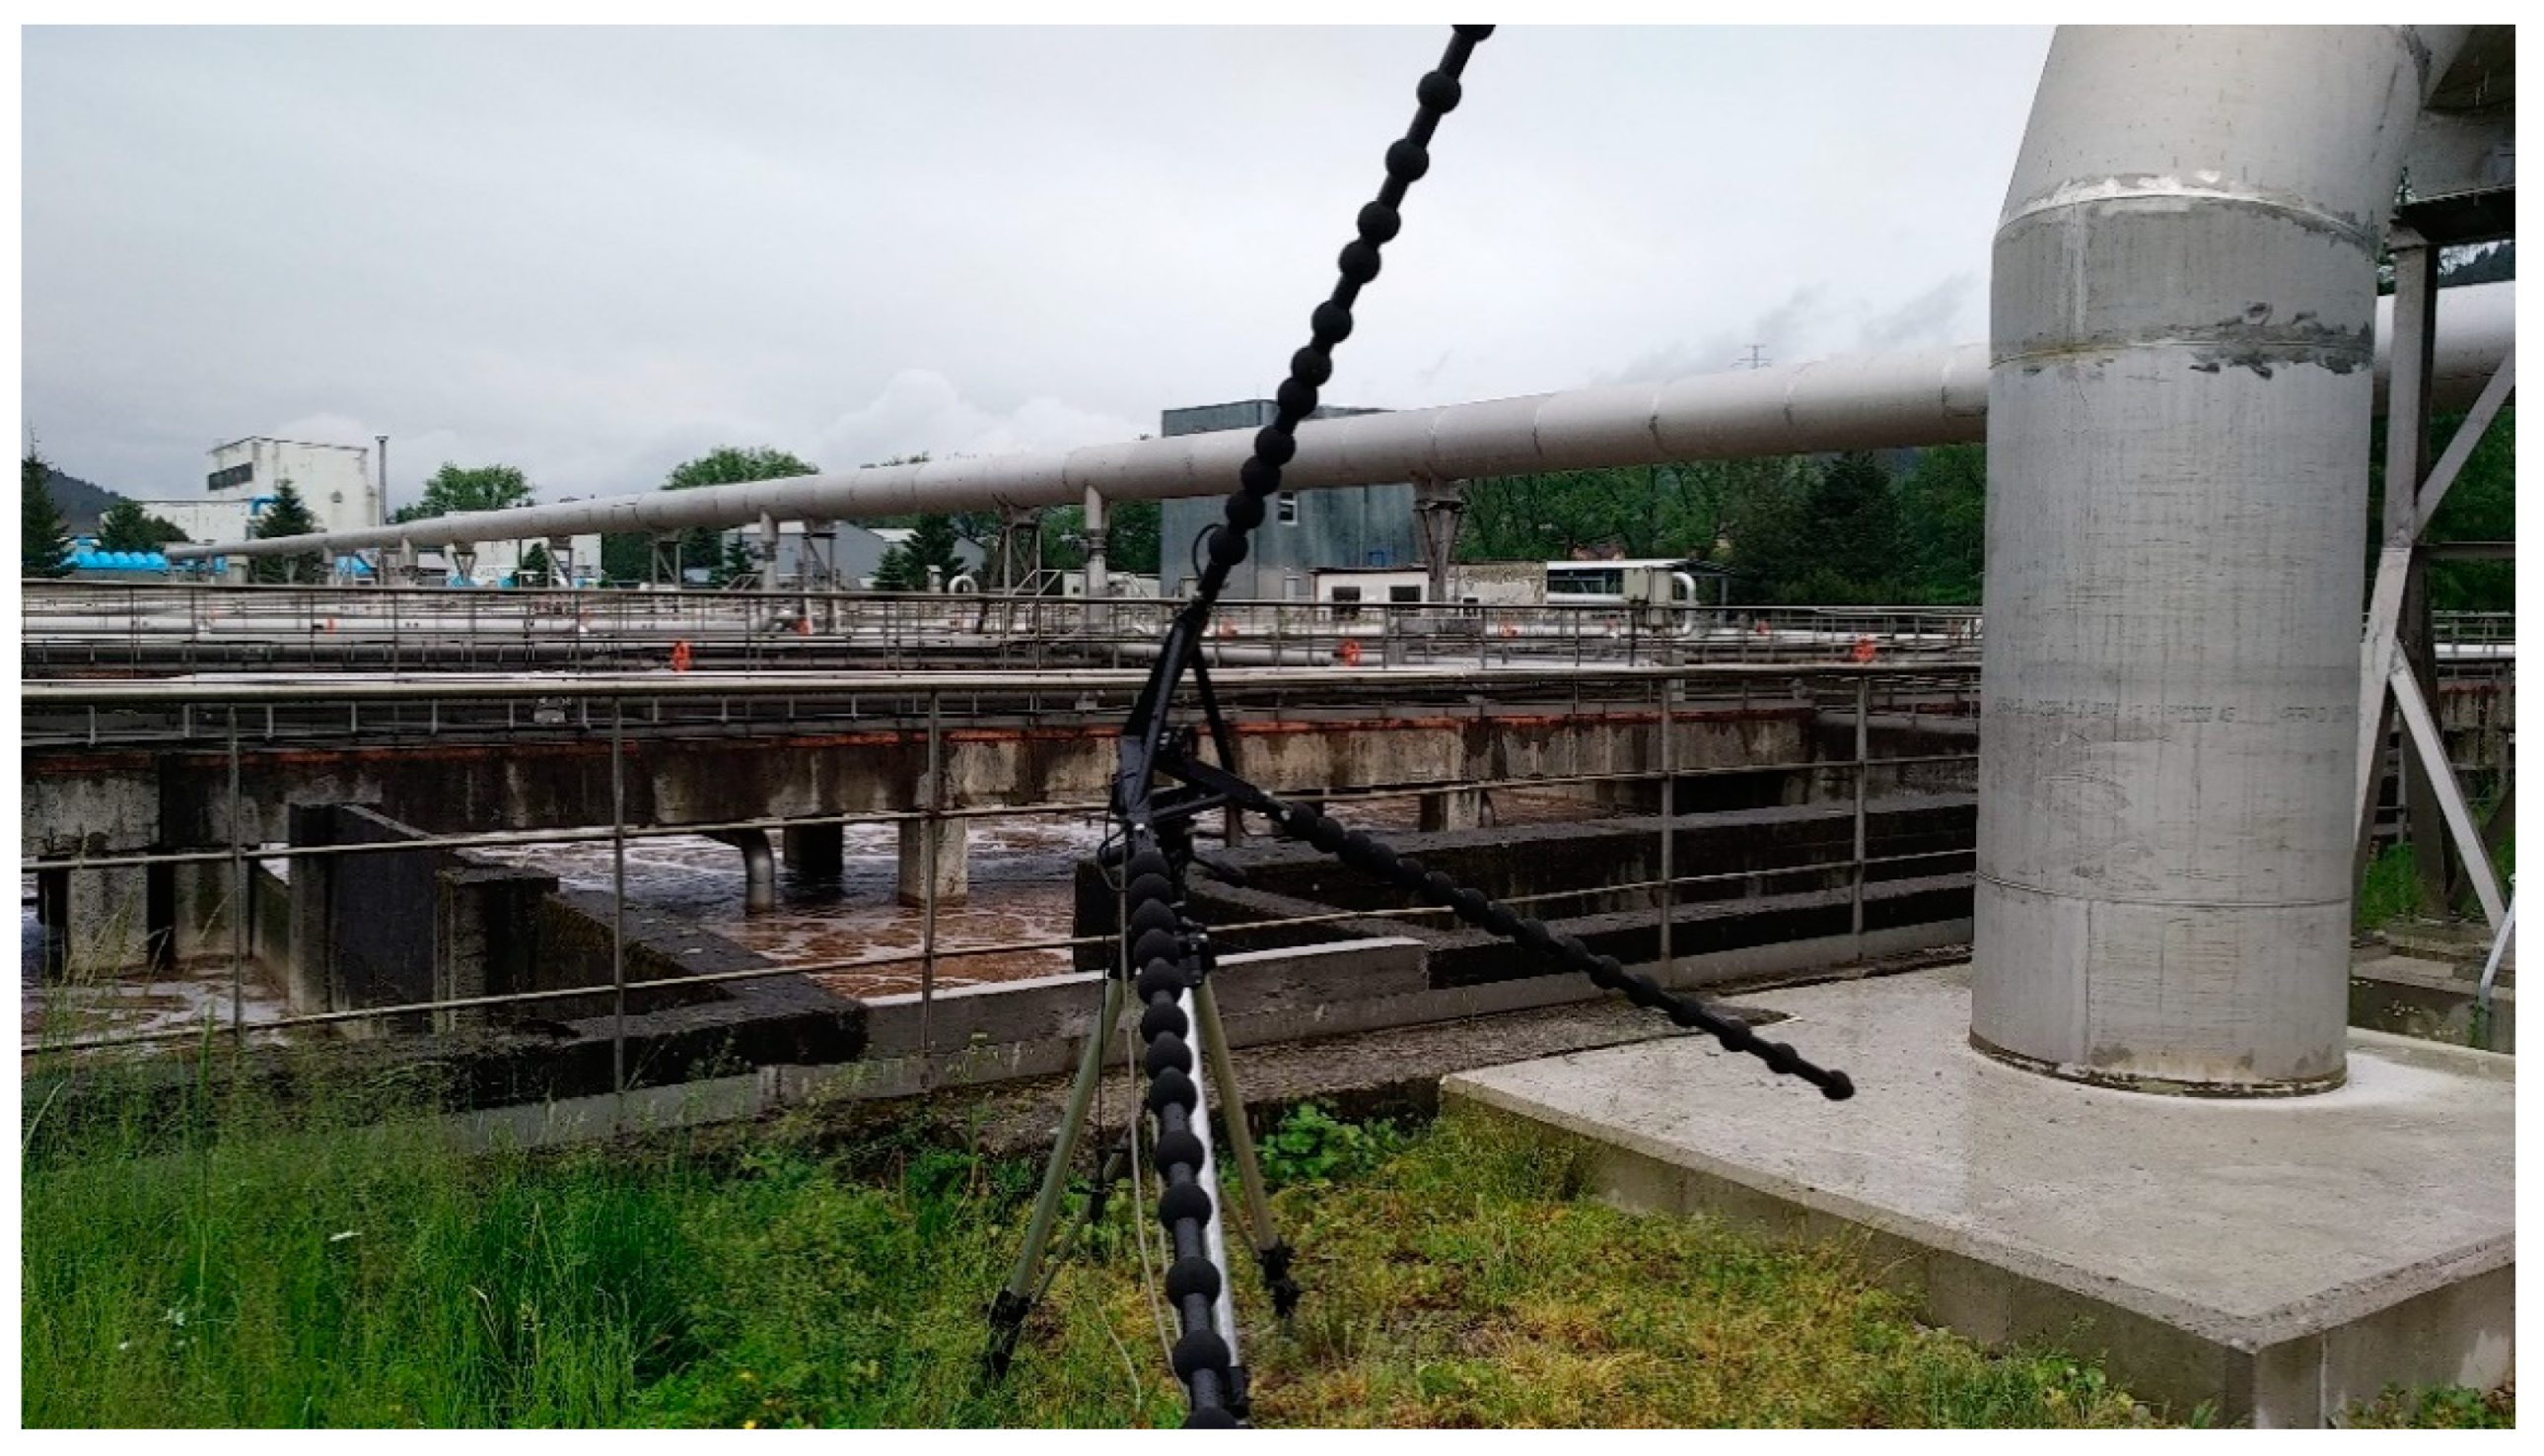
Measurement no. 4 was carried out with a focus on the object of the sludge farm from a distance of 43 m.
Figure 15 shows a view of the acoustic camera installed.
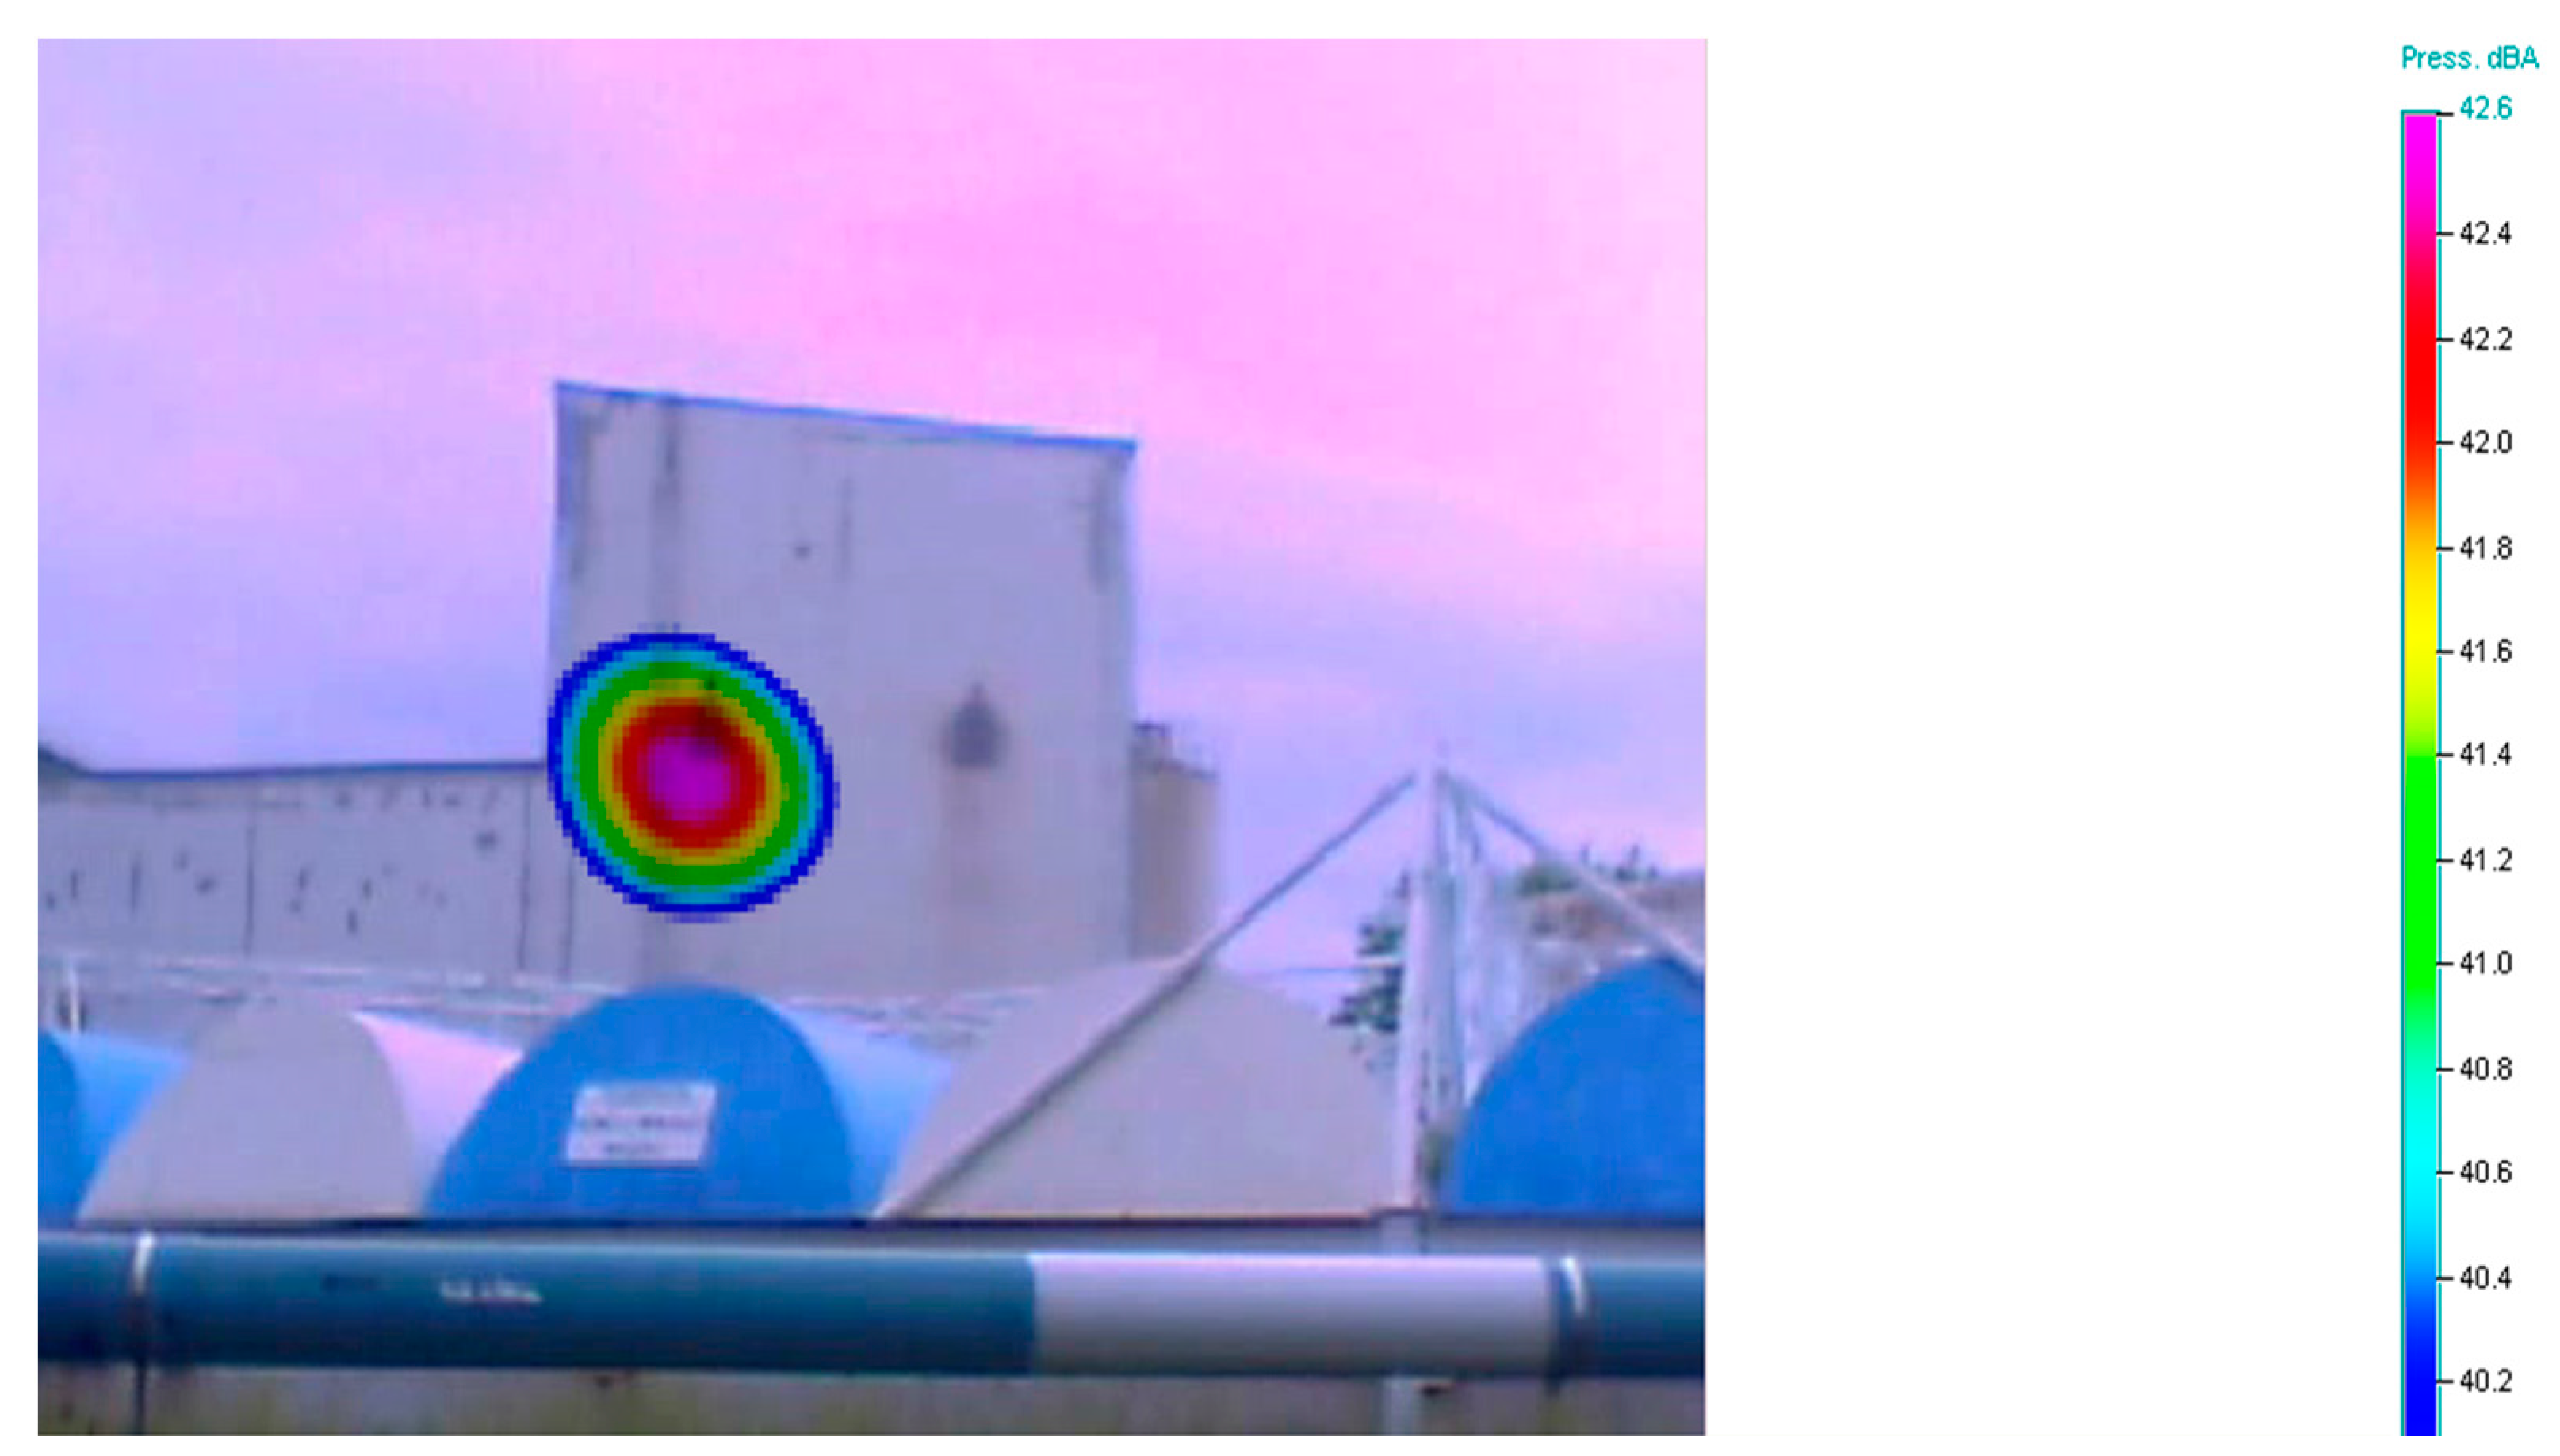
Figure 16 shows the noise emissions of the visualized object throughout the frequency band. The location of the integrated noise source is evident from the acoustic image presented.
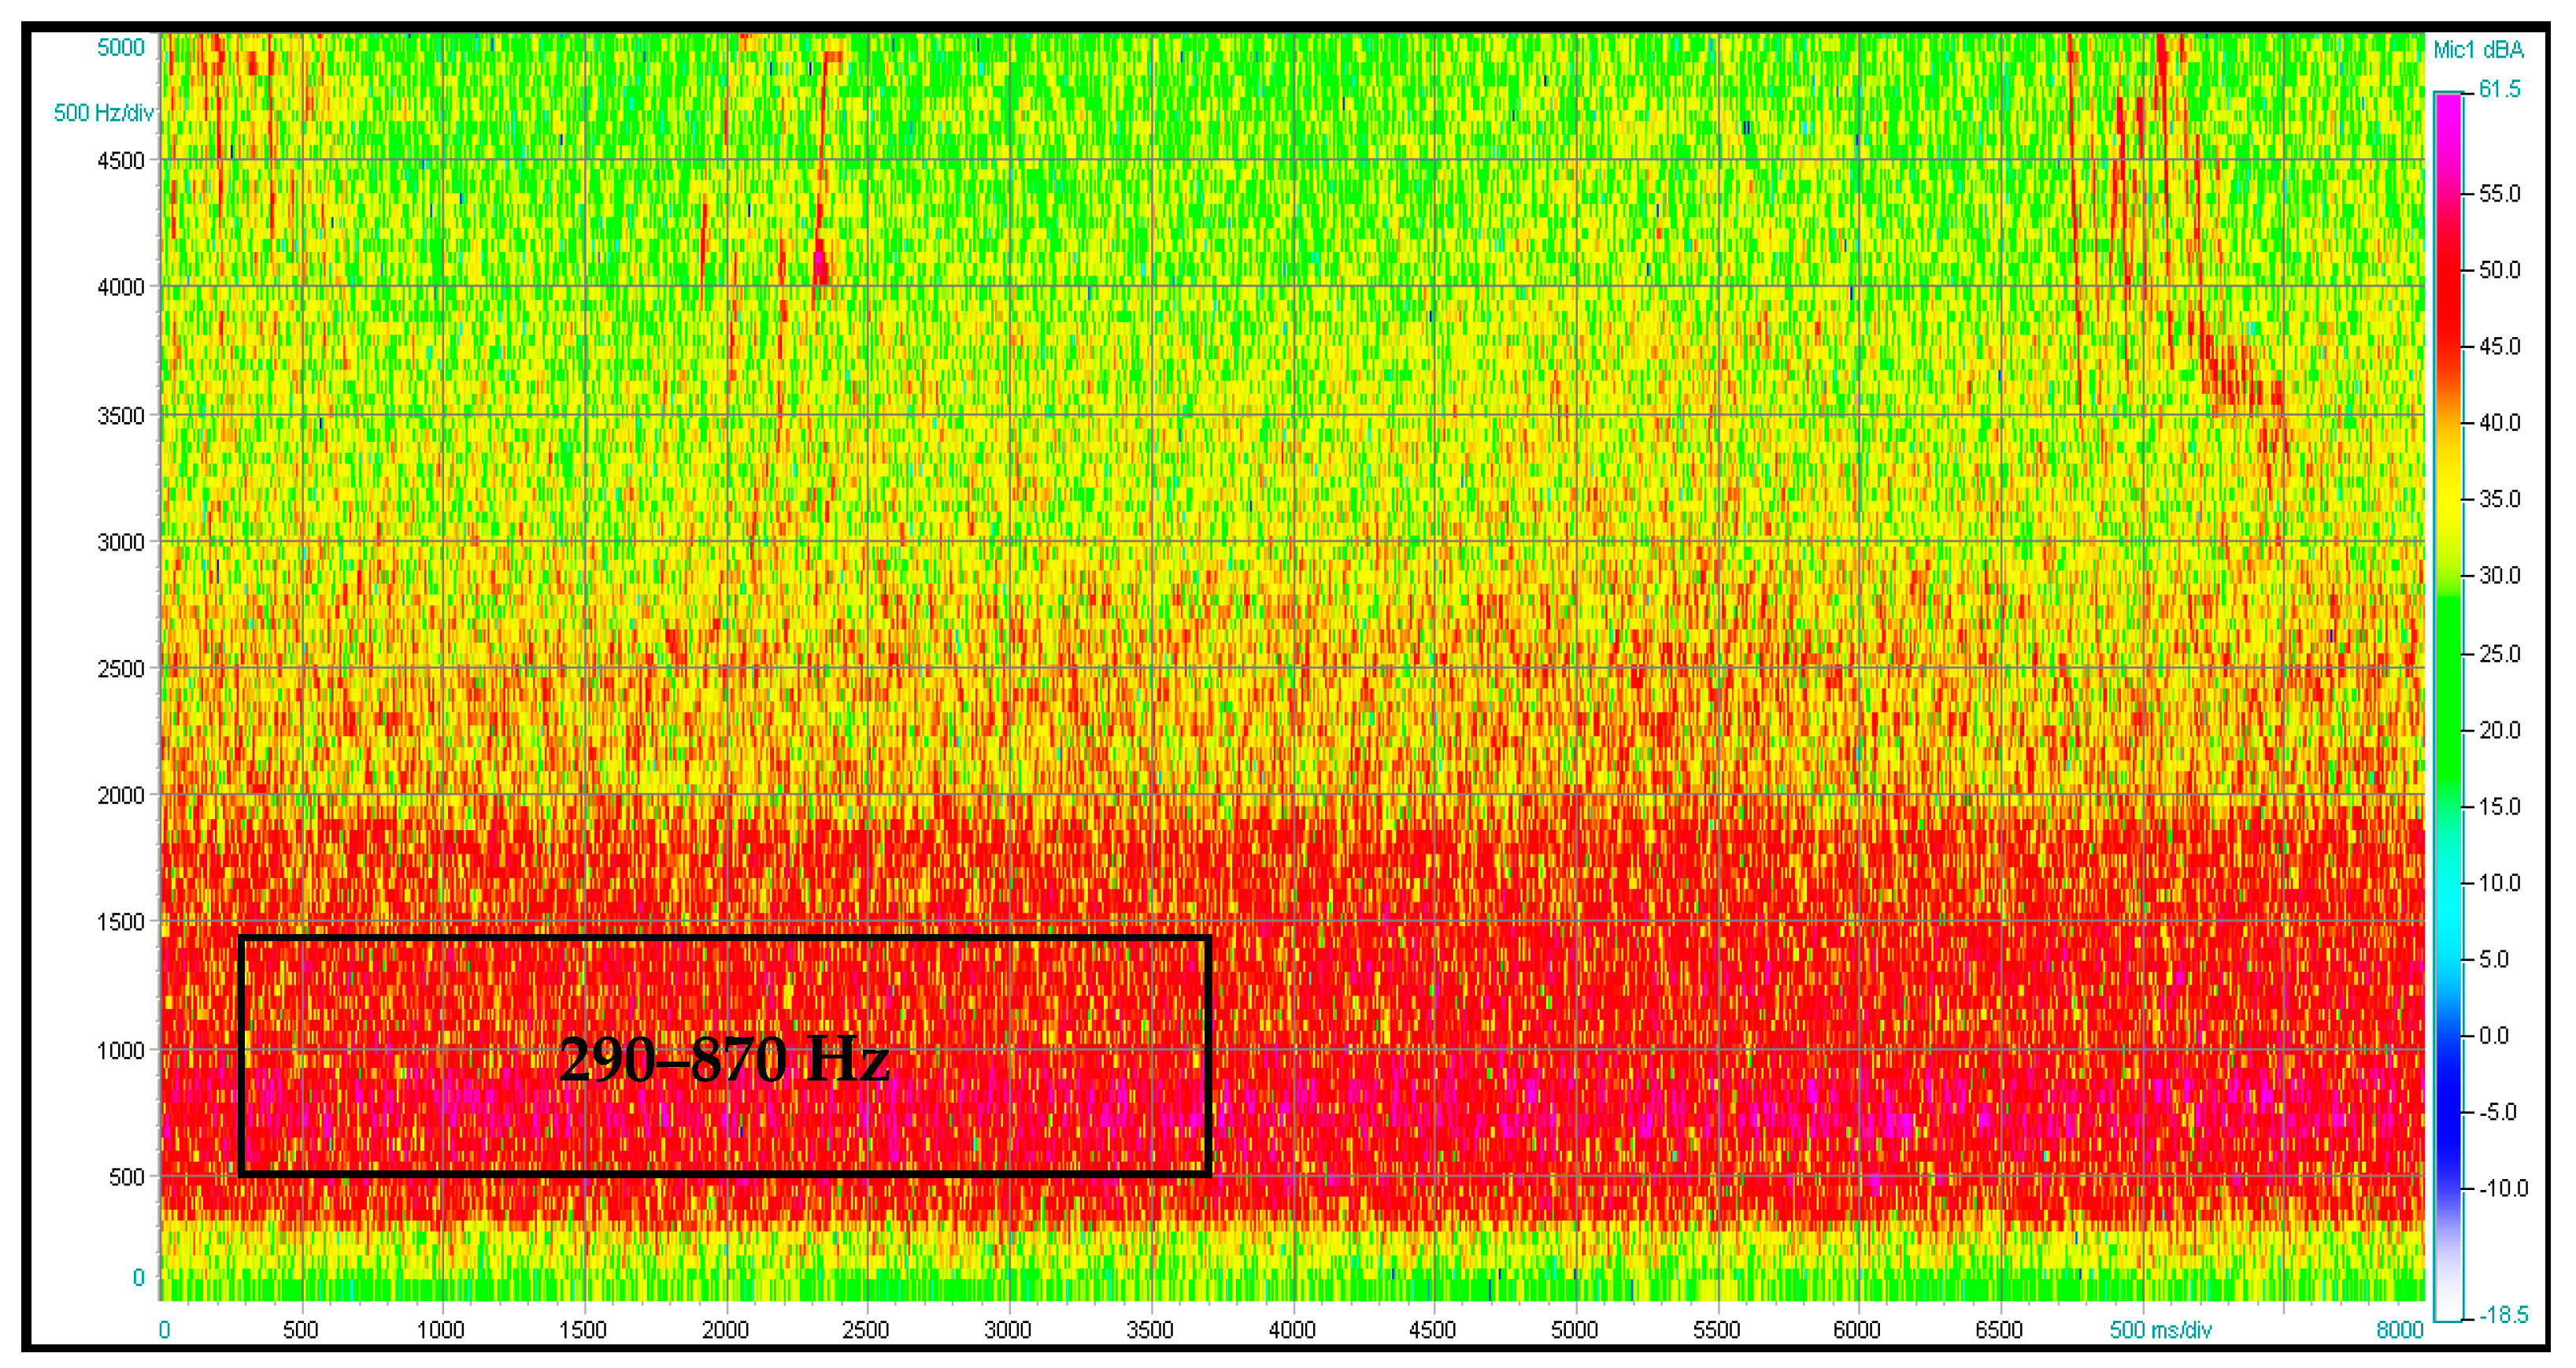
Figure 17 shows the noise spectrogram of this measurement.
Based on the measurements taken to visualize the sources of noise of the wastewater treatment plant, the following can be concluded:
Specific critical points in terms of noise emissions were visualized and identified for individual structures.
The dominant sources of noise on the WWTP (Waste Water Treatment Plant) site were confirmed to be the:
- ○
Blower room building;
- ○
Air distribution pipes;
- ○
Sludge treatment building.
The main source of noise in the air distribution pipes was the break in the pipe, where noise caused by airflow in the bend occurs.
Regarding the blower room building, the source of noise was the ventilation openings on the south and east sides.
The identified noise sources from these objects were confirmed by repeated measurements.
For the blower room building, the dominant frequency bands were 250–500 Hz and 1500–2500 Hz.
For the air distribution pipes, the dominant frequency band was 740–840 Hz.
For the sludge treatment building, the dominant frequency band was 290–870 Hz.
Knowledge of the dominant frequency bands is important in the selection of appropriate acoustically absorbent materials when implementing noise reduction measures.
7. Proposal for Measures to Reduce Noise
Based on the noise measurements and the visualizations of noise sources made, the following measures are proposed:
7.1. Acoustic Pipe Insulation
The air distribution line provides air supply to the activation tanks. The air is ducted from the blower room through a pipe with a 1200 mm diameter and a total length of 70 m under a pressure of 60–63 kPa and a flow rate of 62,000–64,000 m3/h. Herein, acoustic insulation of the pipe consisted of wrapping the full length of the air distribution pipe with mineral wool with a thickness of 120 mm and a density 60 kg.m−3, as well as application of a protective PE (polyethylene) film and an external stainless steel sheet with a thickness of 3 mm. A stainless steel sheet with a thickness of 3 mm was selected due its good weather resistance, good formability, and good price–performance ratio.
When designing acoustic insulation, it was necessary to take into account the effect of insulation in terms of changing the temperature of the air, which is ducted by pipes into the activation tanks. For this reason, the change in the temperature of the ducted air due to acoustic insulation was calculated. Based on thermodynamic conversion under the given input conditions, the increase in the air temperature in the distribution line was determined to be 2.9 °C.
After consultation with the operator, it was confirmed that the increase in the temperature of the ducted air would not have negative effects on the operation of the activation tanks.
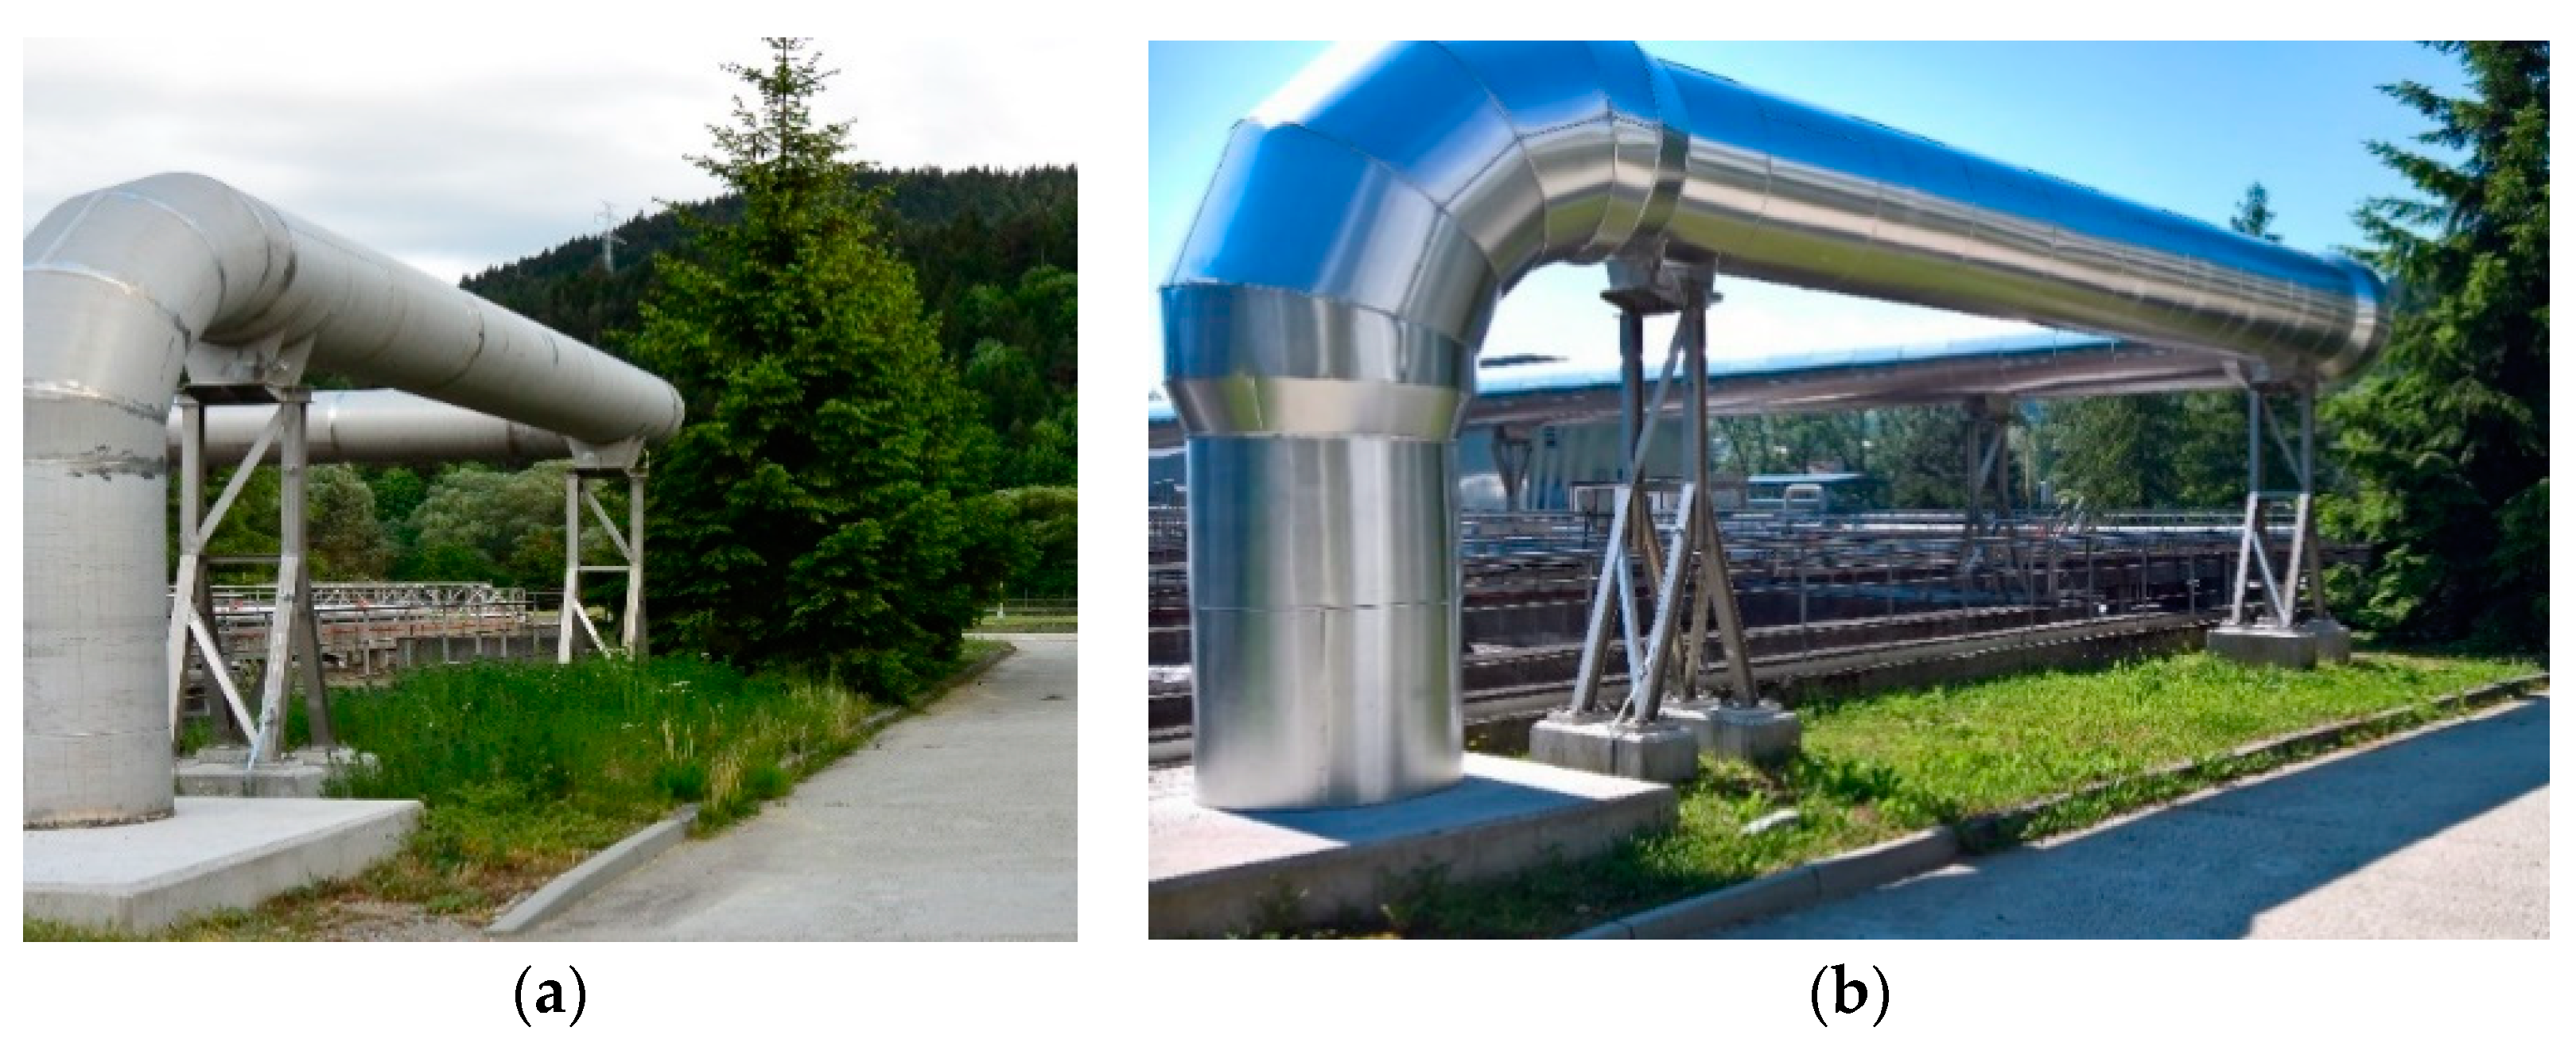
Figure 18 shows a view of the air distribution pipes before and after application measures to reduce noise.
7.2. Application of Acoustic Blinds
Acoustic blinds were applied to the ventilation openings of the blower room and sludge farm buildings. Standard available acoustic grilles were used, which were made individually as needed. The transmission loss acoustic parameter of the installed acoustic grilles is shown in
Table 3; only the transmission loss values are indicated, because each acoustic grill is different.
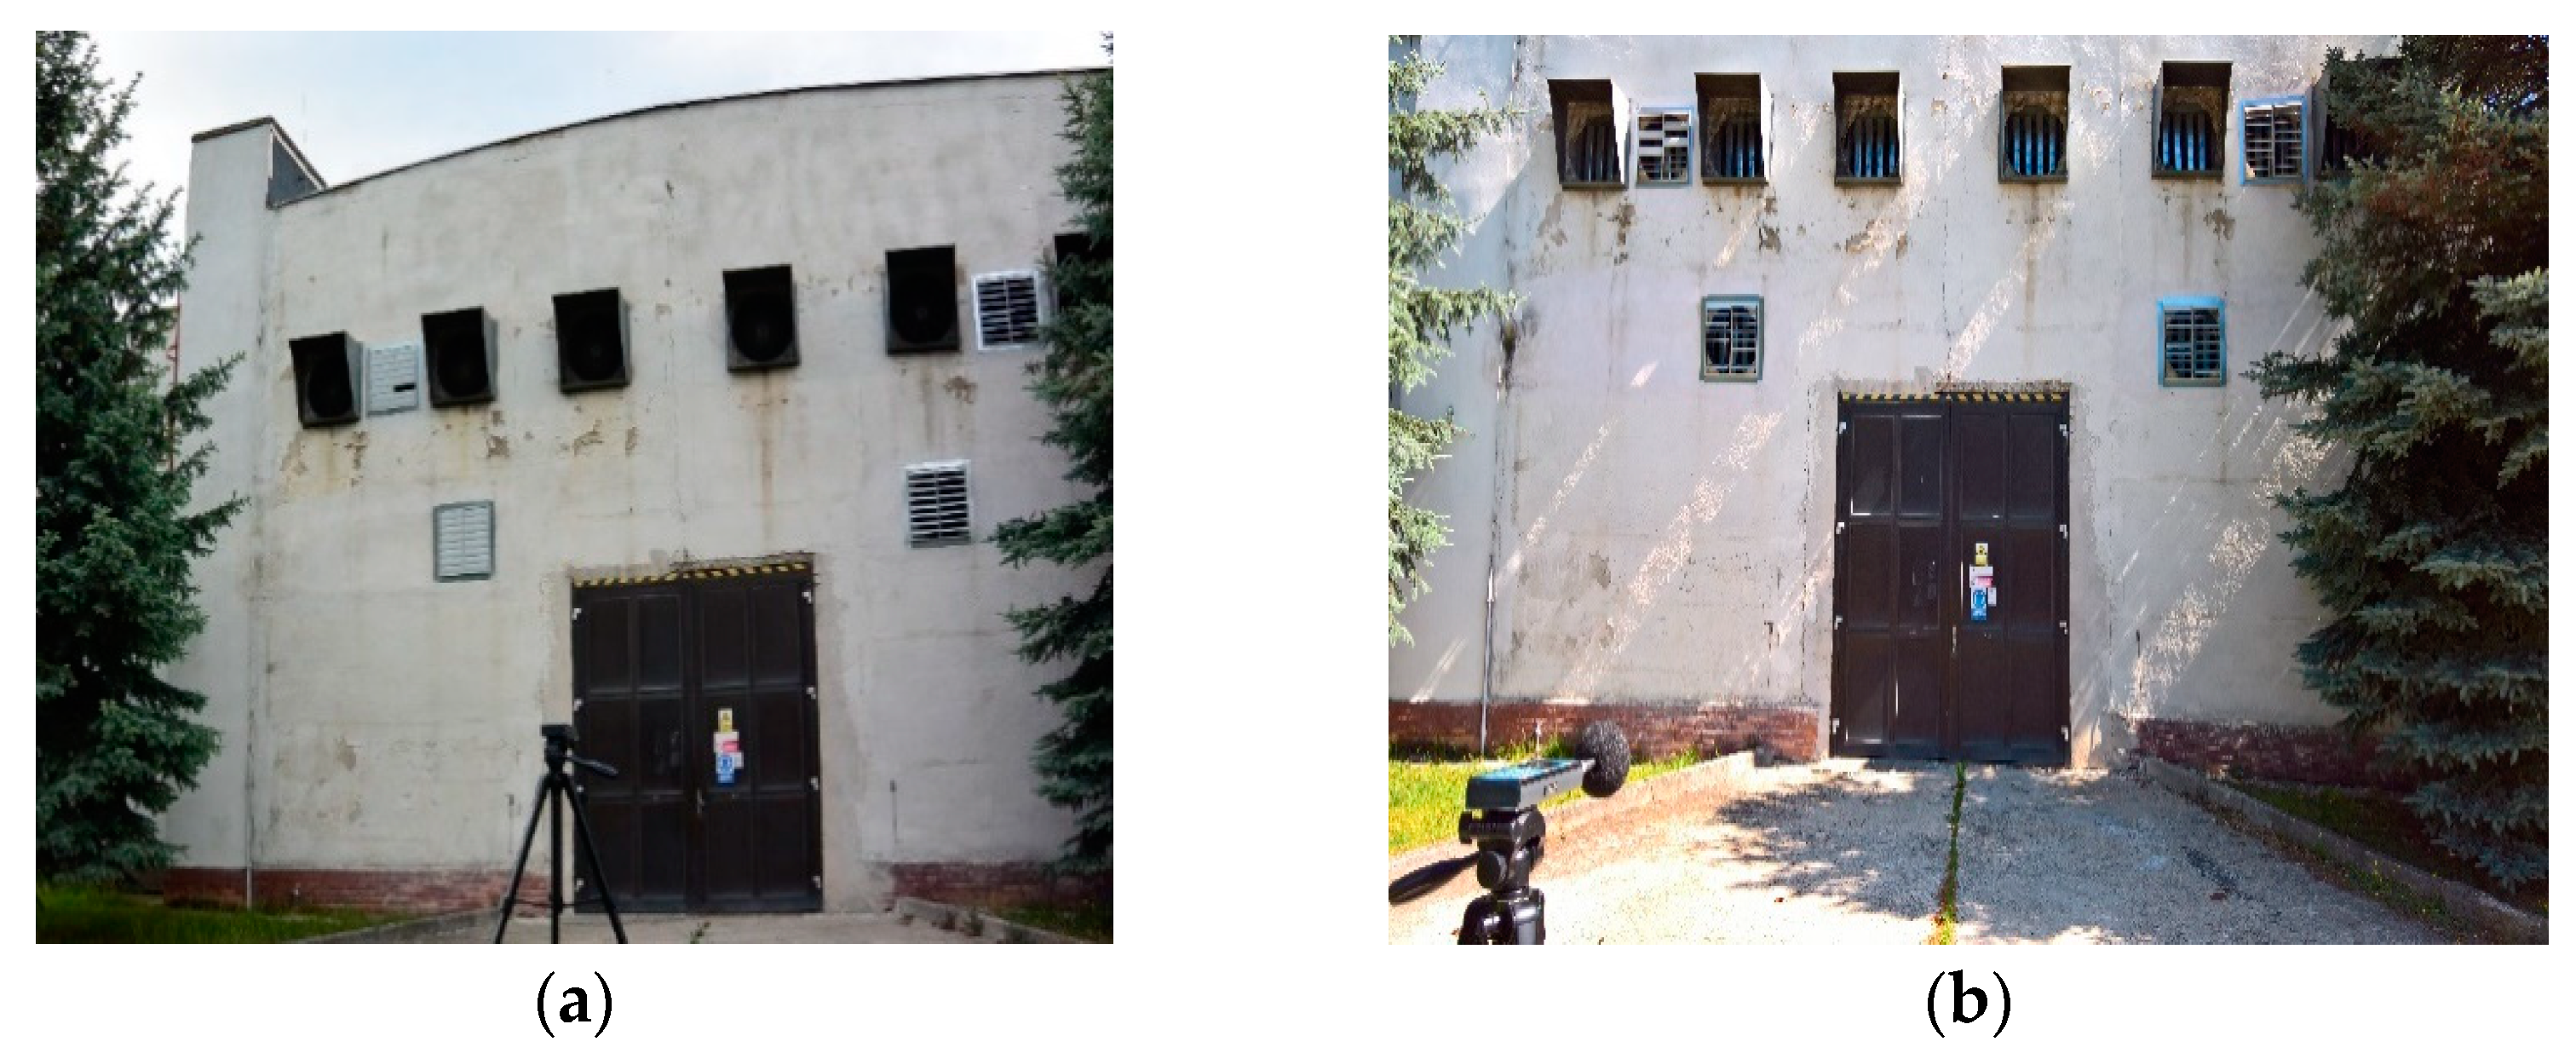
Figure 19 shows a view of the blower room before and after application measures to reduce noise.
8. Creating a Mathematical Model-Based Noise Map
The mathematical model was created using the CADNA A version 3.6.117 software package with the relevant methodologies implemented. Noise maps were created for both the current situation and as a prediction of the implemented measures to reduce noise.
The noise map of the current situation was created to understand the current noise situation in the area in question. The prediction noise map was created to verify the efficiency of the proposed adjustments to reduce noise and their impact on the distribution of sound to the surrounding environment.
In creating the analytical noise map of the equivalent noise levels in the external environment of the area of interest from the emissions of acoustic energy from the stationary industrial noise sources situated on the site of the wastewater treatment plant, the general principle of breaking down the phenomenon under consideration (i.e., noise emitted by an industrial source) to elementary phenomena was used, followed by synthesizing the effects of individual elementary phenomena at the site under consideration.
The noise maps created address the problem of the impact of noise from the operation of the wastewater treatment plant on the surrounding area. When creating the noise maps, we took into account all of the stationary noise sources contingent on the operation of the wastewater treatment plant.
The input data about sound power levels of sound sources that were used in mathematical model are presented in
Table 4.
To get an idea of noise emissions around the wastewater treatment plant, we present values of the equivalent noise level at some calculation points in
Table 5. The values relate to a distance of 1.5 m in front of the outer walls, where the calculation points were situated next to buildings. The positions of the calculation points are shown in
Figure 20.
Noise maps were created with noise isophones at a height of 1.5 or 3 m above ground level, which were then color coded in 5 dB steps. The height of the isophone and calculation points was chosen as 3 m because of the hilly terrain, in aid of better knowledge of the acoustic situation and the spread of noise at the location in question, and also because a large number of the houses have windows at this height.
Both types of noise maps were designed for the reference time intervals of day, evening, and night, in accordance with the relevant legislation; since the stationary noise sources are constant during these reference time intervals, there is no basis to create noise maps individually for these reference time intervals.
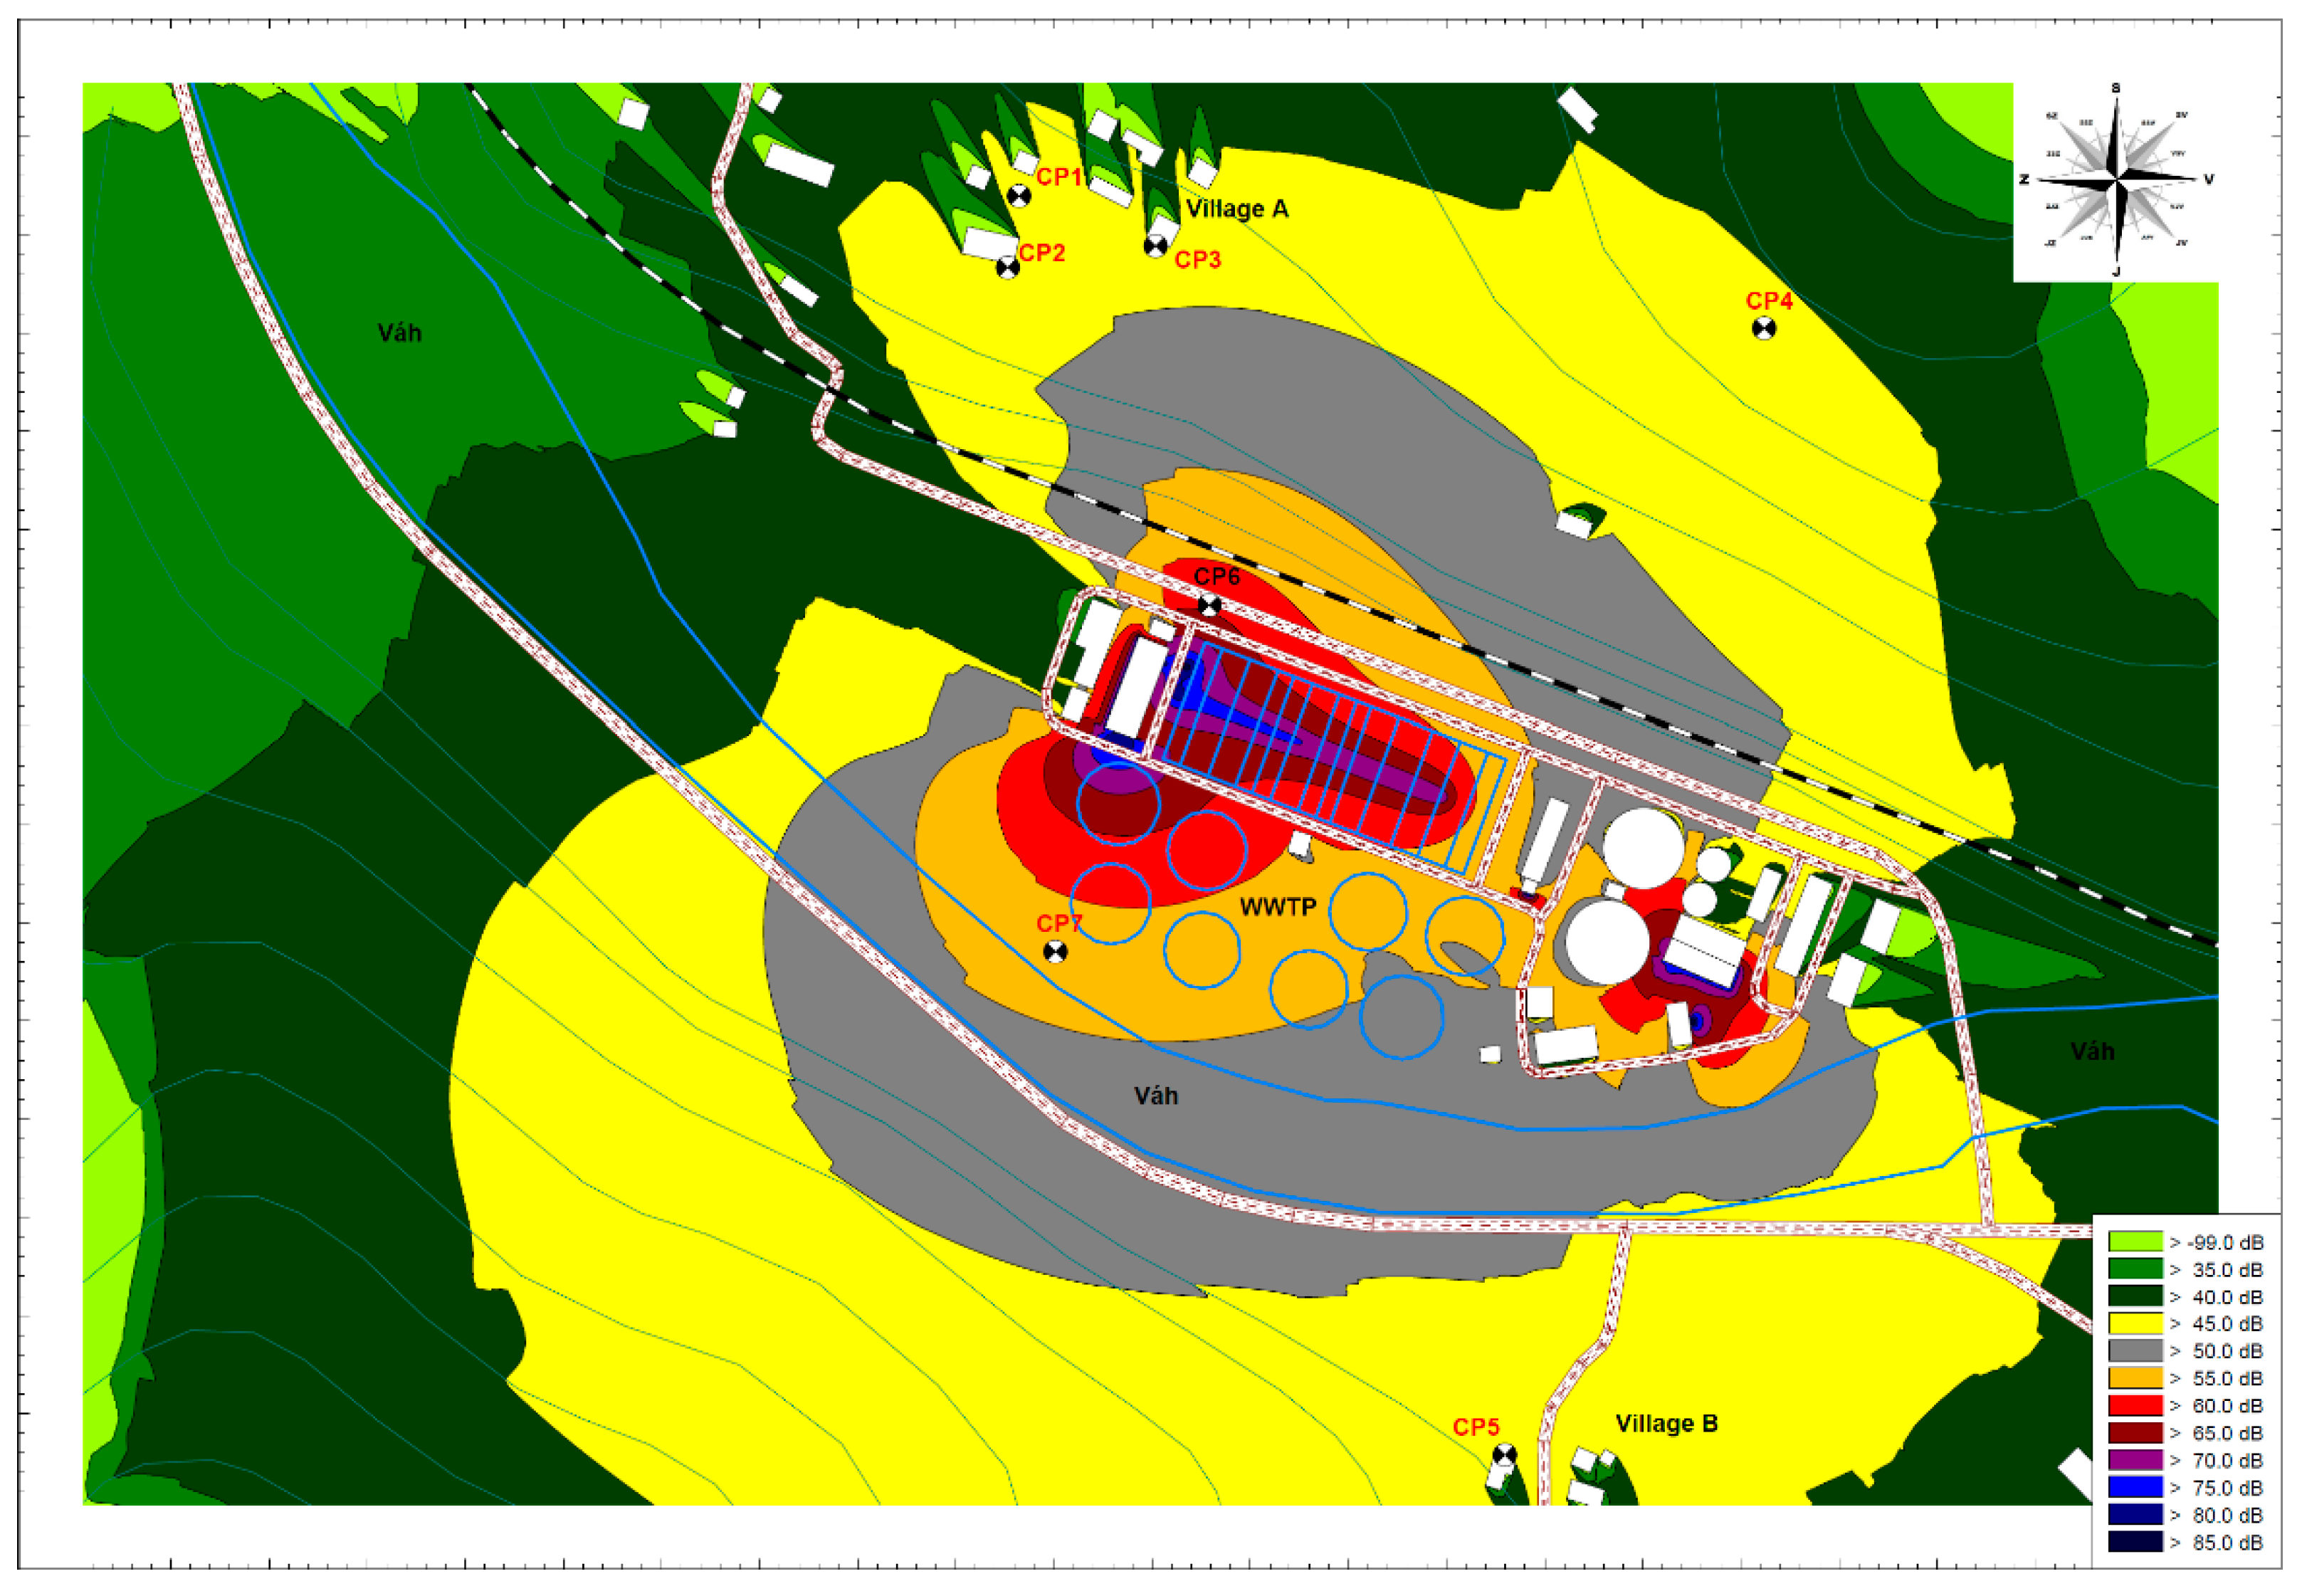
A noise map of the current situation is shown in
Figure 21, and a noise map prediction with the proposed measures to reduce noise is shown in
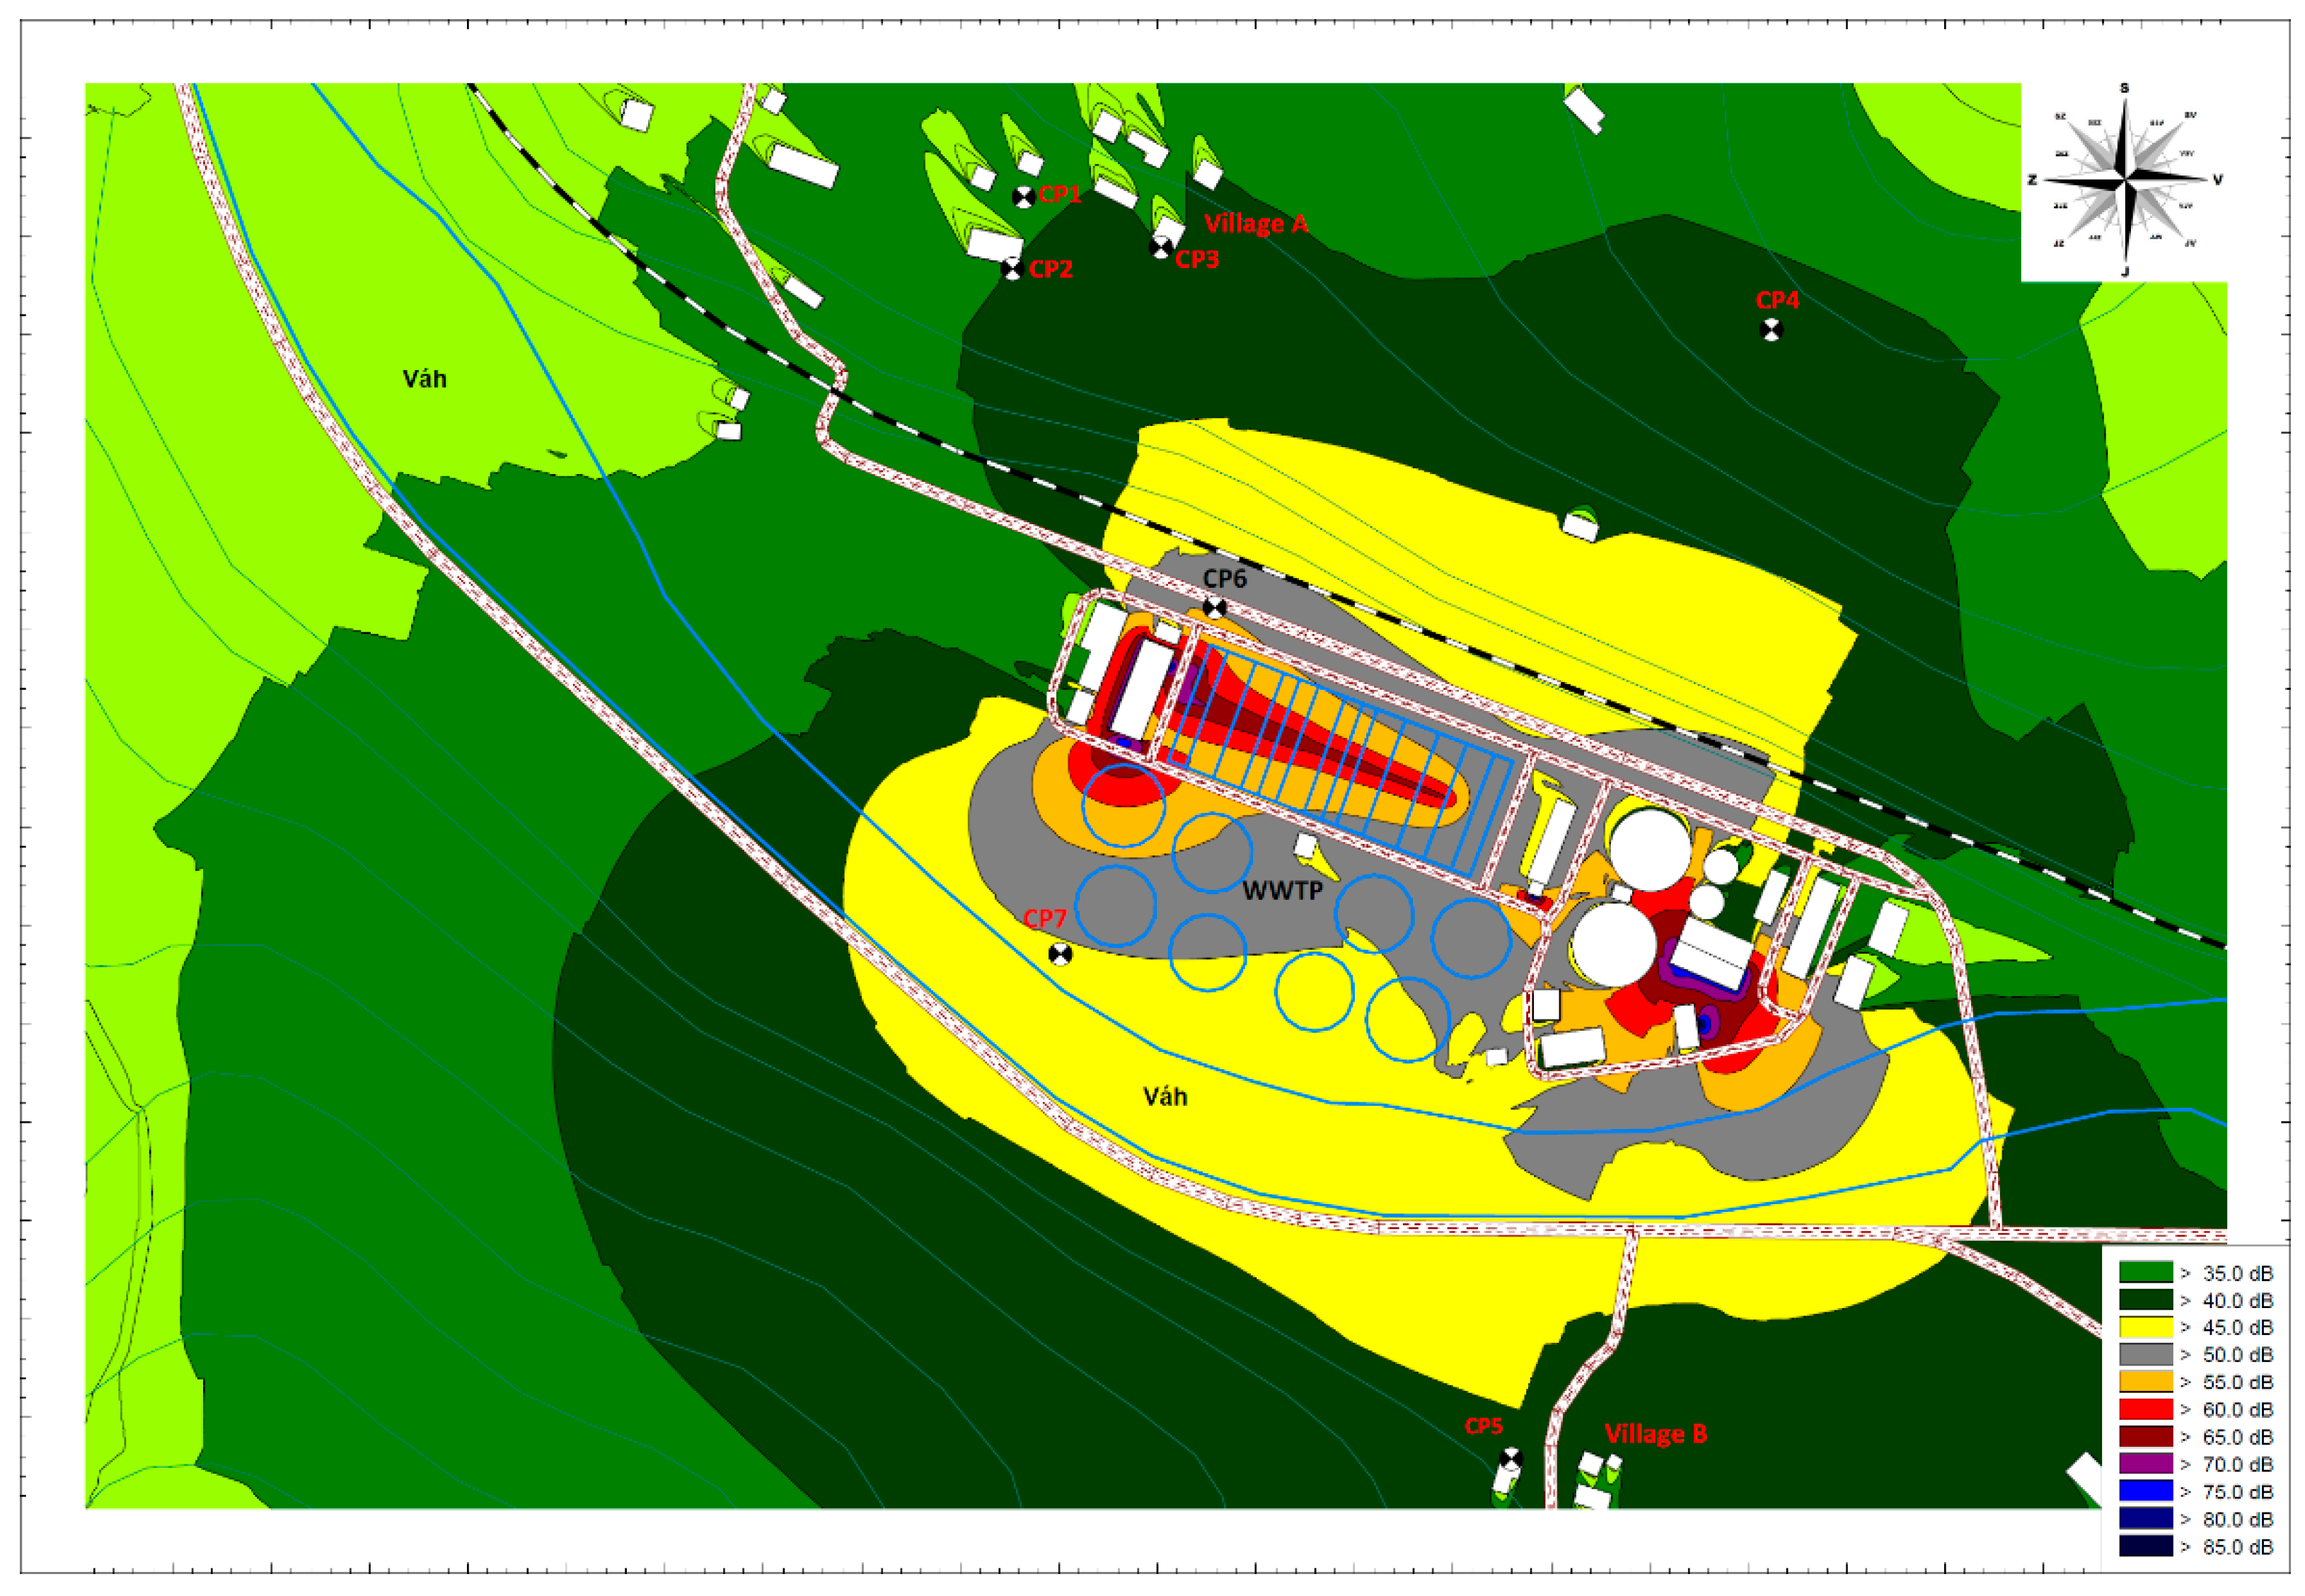
Figure 22.
9. Verification of the Effectiveness of the Measures Implemented
The proposed noise reduction measures were carried out at the wastewater treatment plant. After the measures were put into practice, further measurements were made to assess the effectiveness of the measures taken. The measurements were performed on the premises of the wastewater treatment plant and in both villages where the permissible values were exceeded. All measurements were made at identical locations to those from before the measures were implemented.
The results of measurements at the wastewater treatment plant site before and after the measures are presented in
Table 6.
The results of the measurements of the equivalent noise levels in both villages before and after the noise reduction measures were implemented are given in
Table 7. It is clear from the frequency analysis of the results of the noise measurement that the nature of the noise after the measures were taken did not contain tonal components; therefore, it was not necessary to apply a correction of 5 dB for sound with tonal components to the measured values. Positive values of wide uncertainty must be added to these values. The values can then be compared with the permissible values determining the noise levels.
It is clear from the measured values on the site of the wastewater treatment plant that, after the noise reduction measures were implemented, equivalent levels of A sound pressure were reduced at all measured locations. The reduction in noise levels was between 0.8 and 15.0 dB. In places where critical noise sources were identified, the reduction in noise levels was between 8.8 and 15 dB.
Based on the measured values at the treatment plant site and in the adjacent villages, we can conclude the modifications made to reduce noise were highly effective.
10. Conclusions
The issue of noise reduction of industrial plants is an important task, considering the increasing numbers of these sources. A significant number of industrial noise sources are located near people’s residences. It is estimated that around 800,000 people, living in urban areas in the European Union, are exposed to industry noise levels of at least 55 dB during the day evening–night period and around 400,000 to levels of at least 50 dB during the night-time period. [
33] With the increasing numbers of industrial noise sources, people are increasingly exposed to excessive noise, which is closely linked to negative effects on human health and a reduction in the quality of their housing [
33].
Reducing the noise from industrial sources and their impact on people requires a comprehensive approach. The basis is insight in of the current state of the acoustic situation using special measuring instruments. Based on these measurements, herein, critical noise sources were identified on the site of the wastewater treatment plant. The dominant sources of noise were identified as being mainly the blower room and air distribution pipes.
With thorough information-gathering, specific proposals, and measures can be taken to reduce the noise from sources in order to reduce the negative impact on people in the vicinity. Before implementing these measures, it is appropriate to model and simulate these measures and to assess their effectiveness on a preliminary basis, and making possible corrections if necessary. The next step is to then thoroughly implement the proposed measures in accordance with the technical proposal. The final step is to verify the effectiveness of the proposed noise measures, to compare them with the original situation and the model created.
In this case study, all of the above steps were taken to reduce the negative noise effects of the wastewater treatment plant on the people in the vicinity. After defining the problem in order to understand the current state of the noise situation, noise measurements were carried out in adjacent villages and directly in the area the wastewater treatment plant site.
It was clear from the measurements that the permissible noise levels in these municipalities were being exceeded due to the wastewater treatment plant. Measurements directly at the wastewater treatment plant were carried out in order to identify the partial noise sources. For more accurate analysis, a unique tool for visualizing noise was used, namely, an acoustic camera. On the basis of these measurements, the dominant noise sources were identified on the wastewater treatment plant site. Subsequently, a proposal was made to reduce the noise of the dominant noise sources, and mathematical models were created for a preliminary assessment of the efficiency—i.e., noise maps of the current state and a predictive noise map simulated with the measures. On the basis of these noise maps, it was predicted that the above proposals would contribute to reducing noise in the surrounding villages.
After the implementation of the proposed measures, noise measurements were again performed in adjacent municipalities and in the area of the wastewater treatment plant. It is clear from the noise measurements that after the measures were implemented, there was a significant reduction in noise in the surrounding villages, as well as directly in the wastewater treatment plant.
The measured values in the surrounding villages also showed a decrease in equivalent levels of A sound pressure. In Village 1, there was a decrease of 5.4 dB and the tonal component of the sound was also removed, so it was not necessary to apply a correction of +5 dB. In Village 2, equivalent levels of A sound pressure were reduced by 6.4 dB. In conclusion, the proposed measures were highly effective, with a significant reduction in the noise in nearby people’s homes, thereby significantly increasing the quality of life for these people and reducing the negative impacts on their health.
By applying the above steps in this case study in order to reduce the negative impact and to correctly implement the proposed measures to reduce noise from industrial sources, a reduction in noise based on this model can also be achieved for other industrial sources of a similar nature.
Author Contributions
Each author (M.M., M.B., N.M., L.S., J.Š., and T.D.) equally contributed to this publication. Conceptualization, M.M. and M.B.; methodology, M.B. and M.M.; validation, L.S., J.Š., and T.D.; formal analysis, N.M.; resources, N.M.; data curation, M.M.; writing—original draft preparation, M.M., M.B., and N.M.; writing—review and editing, N.M.; visualization, L.S. and T.D.; supervision, M.M. and M.B.; project administration, M.M.; funding acquisition, M.M. All authors have read and agreed to the published version of the manuscript.
Funding
This work was supported by the projects of the Scientific Grant Agency of the Ministry of Education, Science, Research and Sport of the Slovak Republic and the Slovak Academy of Sciences (project numbers VEGA 1/0638/19 and VEGA 1/0557/18), and by the projects of the Cultural and Educational Grant Agency of the Ministry of Education, Science, Research and Sport of the Slovak Republic and the Slovak Academy of Sciences (project numbers KEGA 049TUKE-4/2020, KEGA 045TUKE-4/2018 and UNIVNET 0201/0004/20).
Conflicts of Interest
The authors declare no conflict of interest.
References
- Stansfeld, S.A.; Matheson, M.P. Noise Pollution: Non-Auditory Effects on Health. Br. Med. Bull. 2003, 68, 243–257. [Google Scholar] [CrossRef]
- Miedema, H.M.; Oudshoorn, C.G. Annoyance from Transportation Noise: Relationships with Exposure Metrics DNL and DENL and Their Confidence Intervals. Environ. Health Perspect. 2001, 109, 409–416. [Google Scholar] [CrossRef]
- Basner, M.; Babisch, W.; Davis, A.; Brink, M.; Clark, C.; Janssen, S.; Stansfeld, S. Auditory and Non-Auditory Effects of Noise on Health. Lancet 2014, 383, 1325–1332. [Google Scholar] [CrossRef] [Green Version]
- Miškinytė, A.; Dėdelė, A. Evaluation and Analysis of Traffic Noise Level in Kaunas City. In Proceedings of the The 9th International Conference “Environmental Engineering 2014”, Vilnius, Lithuania, 22–23 May 2014; Vilnius Gediminas Technical University Press “Technika”: Vilnius, Lithuania, 2014. [Google Scholar]
- Directive 2002/49/EC of the European Parliament and of the Council of 25 June 2002 Relating to the Assessment and Management of Environmental Noise. Available online: https://eur-lex.europa.eu/legal-content/EN/TXT/PDF/?uri=CELEX:32002L0049&from=DE (accessed on 23 November 2020).
- Bozkurt, T.S.; Demirkale, S.Y. The Field Study and Numerical Simulation of Industrial Noise Mapping. J. Build. Eng. 2017, 9, 60–75. [Google Scholar] [CrossRef]
- Nagy, R.; Simoiu, D.; Menyhardt, K.; Bereteu, L. Noise Source Monitoring in Industrial and Residential Mixed Areas. AMM 2013, 430, 262–265. [Google Scholar] [CrossRef]
- Vasilyev, A.V. Russian Experience of Power Plants Noise and Vibration Estimation and Reduction 2019. In Proceedings of the INTER-NOISE and NOISE-CON Congress and Conference, Madrid, Spain, 16–19 June 2019; Available online: http://www.sea-acustica.es/fileadmin/INTERNOISE_2019/Fchrs/Proceedings/2099.pdf (accessed on 23 November 2020).
- Krajňák, J.; Homišin, J.; Grega, R.; Kaššay, P.; Urbanský, M. The Failures of Flexible Couplings Due to Self-Heating by Torsional Vibrations—Validation on the Heat Generation in Pneumatic Flexible Tuner of Torsional Vibrations. Eng. Fail. Anal. 2021, 119, 104977. [Google Scholar] [CrossRef]
- Krajňák, J.; Homišin, J.; Grega, R.; Urbanský, M. The Analysis of the Impact of Vibrations on Noisiness of the Mechanical System. Diagnostyka 2016, 17, 21–26. [Google Scholar]
- Moravec, M.; Liptai, P.; Dzuro, T.; Badida, M. Design and Effectiveness Verification of Sound Reduction Measures in Production Hall. Adv. Sci. Technol. Res. J. 2017, 11, 220–224. [Google Scholar]
- Badida, M.; Dzuro, T.; Badidová, A.; Moravec, M.; Sobotová, L. The Utilization of Recycled Materials from Automobiles in Noise Barrier Structures. Waste Forum: Recenzovaný Časopis Pro Výsledky Výzkumu A Vývoje Pro Odpadové Hospodářství. Praha 2019, 17–24. [Google Scholar]
- Sadler, B. Environmental Assessment in a Changing World. In Evaluating Practice to Improve Performance—Final Report; Canadian Environmental Assessment Agency: Edmonton, AB, Canada, 1996; p. 248. ISBN 0-662-24702-7. [Google Scholar]
- Moravec, M.; Ižaríková, G.; Liptai, P.; Badida, M.; Badidová, A. Development of Psychoacoustic Model Based on the Correlation of the Subjective and Objective Sound Quality Assessment of Automatic Washing Machines. Appl. Acoust. 2018, 140, 178–182. [Google Scholar] [CrossRef]
- Kukulski, B.; Wszołek, T. The Research on Impulsive Events in Railway Noise Generated During Passage Through a Railroad Switch. Arch. Acoust. 2017, 42, 441–447. [Google Scholar] [CrossRef] [Green Version]
- Tomozei, C.; Nedeff, F.; Paraschiv, G.; Irimia, O.; Ardeleanu, G.; Petrovici, A.C. Mathematical Modelling of Sound Pressure Level Attenuation Transmitted by an Acoustic Screen in Industrial Environment. Environ. Eng. Manag. J. 2014, 13, 1743–1749. [Google Scholar] [CrossRef]
- Ani, E.-C.; Cristea, V.M.; Agachi, P.S. Mathematical Models to Support Pollution Counteraction in Case of Accidents. Environ. Eng. Manag. J. 2012, 11, 13–20. [Google Scholar] [CrossRef]
- Fiebig, W.; Damian, D. Use of Acoustic Camera for Noise Sources Localization and Noise Reduction in the Industrial Plant. Arch. Acoust. 2020. [Google Scholar] [CrossRef]
- Moravec, M.; Badida, M.; Jamborova, M.; Badidova, A. Conveyor Failure Diagnostics Using Sound Visualization Technique. Adv. Sci. Technol. Res. J. 2018, 12, 144–150. [Google Scholar] [CrossRef]
- Bocher, E.; Guillaume, G.; Picaut, J.; Petit, G.; Fortin, N. NoiseModelling: An Open Source GIS Based Tool to Produce Environmental Noise Maps. IJGI 2019, 8, 130. [Google Scholar] [CrossRef] [Green Version]
- Butorina, M.; Drozdova, L.; Kuklin, D.; Sharkov, A.; Aref’ev, K.; Sopozhnikov, S.; Topazh, G.; Lyamaev, B.; Nagornyy, V.; Simonov, A.; et al. Implementation of Noise Data into Building Information Model (BIM) to Reduce Noise in the Environment and at Workplace. In IOP Conference Series: Earth and Environmental Science; IOP Publishing Ltd.: Bristol, UK, 2019; Volume 337. [Google Scholar] [CrossRef] [Green Version]
- Murphy, E.; King, E.A. Strategic Environmental Noise Mapping: Methodological Issues Concerning the Implementation of the EU Environmental Noise Directive and Their Policy Implications. Environ. Int. 2010, 36, 290–298. [Google Scholar] [CrossRef] [Green Version]
- Seong, J.C.; Park, T.H.; Ko, J.H.; Chang, S.I.; Kim, M.; Holt, J.B.; Mehdi, M.R. Modeling of Road Traffic Noise and Estimated Human Exposure in Fulton County, Georgia, USA. Environ. Int. 2011, 37, 1336–1341. [Google Scholar] [CrossRef]
- Vogiatzis, K. Airport Environmental Noise Mapping and Land Use Management as an Environmental Protection Action Policy Tool. The Case of the Larnaka International Airport (Cyprus). Sci. Total Environ. 2012, 424, 162–173. [Google Scholar] [CrossRef]
- Sari, D.; Ozkurt, N.; Akdag, A.; Kutukoglu, M.; Gurarslan, A. Measuring the Levels of Noise at the İstanbul Atatürk Airport and Comparisons with Model Simulations. Sci. Total Environ. 2014, 482–483, 472–479. [Google Scholar] [CrossRef]
- Lertsawat, K.; Tangjaitrong, S.; Areebhol, P. Prediction of Noise Emission from Power Plant by a Mathematical Model. Appl. Acoust. 1999, 58, 469–477. [Google Scholar] [CrossRef]
- Santos, L.C.; Matias, C.; Vieira, F.; Valada, F. Noise Mapping of Industrial Sources. Acústica 2008, 2008, 11–12. Available online: http://mail.sea-acustica.es/fileadmin/publicaciones/Coimbra08_id249.pdf (accessed on 23 November 2020).
- ISO 1996-1 Acoustics. Description, Measurement and Assessment of Environmental Noise. Part 1: Basic Quantities and Assessment Procedures. p. 47. Available online: https://www.iso.org/obp/ui/#iso:std:iso:1996:-1:ed-3:v1:en (accessed on 23 November 2020).
- ISO 1996-2 Acoustics. Description, Measurement and Assessment of Environmental Noise. Part 2: Determination of Sound Pressure Levels. Volume 2017, p. 60. Available online: https://www.iso.org/obp/ui/#iso:std:iso:1996:-2:ed-3:v1:en (accessed on 23 November 2020).
- Döbler, D.; Heilman, G. Perspectives of the Acoustic Camera. In Proceedings of the Internoise Conference, Rio de Janeiro, Brazil, 7–10 August 2005; pp. 1–9. Available online: https://www.researchgate.net/publication/235957582_Perspectives_of_the_Acoustic_Camera (accessed on 20 November 2020).
- Jaeckel, O.; Schröder, R. Beamforming—Zeitbereich versus Frequenzbereich. DAGA ’06. Gesellschaft zur Forderung angewandter Informatik e.V. 2006, pp. 541–542. Available online: http://pub.dega-akustik.de/DAGA_1999-2008/data/articles/002361.pdf (accessed on 23 November 2020).
- Directive 2000/60/EC of the European Parliament and of the Council of 23 October 2000 Establishing a Framework for Community Action in the Field of Water Policy. Available online: https://eur-lex.europa.eu/legal-content/EN/TXT/?uri=celex%3A32000L0060 (accessed on 20 November 2020).
- EEA. Environmental Noise in Europe—2020, No 22/2019; Publications Office of the European Union: Luxembourg, 2020; Available online: https://www.eea.europa.eu/publications/environmental-noise-in-europe (accessed on 22 November 2020).
Figure 1.
A view of the treatment plant.
Figure 1.
A view of the treatment plant.
Figure 2.
A view of the wastewater treatment plant area and the adjacent villages.
Figure 2.
A view of the wastewater treatment plant area and the adjacent villages.
Figure 3.
A weighted 1/3 octave spectrum.
Figure 3.
A weighted 1/3 octave spectrum.
Figure 4.
The locations of the measuring points on the site of the wastewater treatment plant.
Figure 4.
The locations of the measuring points on the site of the wastewater treatment plant.
Figure 5.
View of the installed acoustic camera—measurement no. 1.
Figure 5.
View of the installed acoustic camera—measurement no. 1.
Figure 6.
Noise emissions of the visualized object across the frequency band (150–13 kHz)—measurement no. 1.
Figure 6.
Noise emissions of the visualized object across the frequency band (150–13 kHz)—measurement no. 1.
Figure 7.
Spectrogram—measurement no. 1.
Figure 7.
Spectrogram—measurement no. 1.
Figure 8.
View of the installed acoustic camera—measurement no. 2.
Figure 8.
View of the installed acoustic camera—measurement no. 2.
Figure 9.
Noise emissions of the visualized object across the frequency band (150–13 kHz)—measurement no. 2.
Figure 9.
Noise emissions of the visualized object across the frequency band (150–13 kHz)—measurement no. 2.
Figure 10.
Spectrogram—measurement no. 2.
Figure 10.
Spectrogram—measurement no. 2.
Figure 11.
Noise emissions of the visualized object in the 250–500 Hz frequency band—measurement no. 2.
Figure 11.
Noise emissions of the visualized object in the 250–500 Hz frequency band—measurement no. 2.
Figure 12.
Noise emissions of the visualized object in the 1500–2500 Hz frequency band—measurement no. 2.
Figure 12.
Noise emissions of the visualized object in the 1500–2500 Hz frequency band—measurement no. 2.
Figure 13.
Noise emissions of the visualized object across the frequency band (150–13 kHz)—measurement no. 3.
Figure 13.
Noise emissions of the visualized object across the frequency band (150–13 kHz)—measurement no. 3.
Figure 14.
Spectrogram—measurement no. 3.
Figure 14.
Spectrogram—measurement no. 3.
Figure 15.
View of the installed acoustic camera—measurement no. 4.
Figure 15.
View of the installed acoustic camera—measurement no. 4.
Figure 16.
Noise emissions of the visualized object across the frequency band (150–13 kHz)—measurement no. 4.
Figure 16.
Noise emissions of the visualized object across the frequency band (150–13 kHz)—measurement no. 4.
Figure 17.
Spectrogram—measurement no. 4.
Figure 17.
Spectrogram—measurement no. 4.
Figure 18.
View of the air distribution pipes (a) before and (b) after application measures.
Figure 18.
View of the air distribution pipes (a) before and (b) after application measures.
Figure 19.
View of blower room (a) before and (b) after application measures.
Figure 19.
View of blower room (a) before and (b) after application measures.
Figure 20.
The positions of the calculation points.
Figure 20.
The positions of the calculation points.
Figure 21.
Noise map of the current situation (before application of measures).
Figure 21.
Noise map of the current situation (before application of measures).
Figure 22.
Noise map prediction (application of noise reduction measures).
Figure 22.
Noise map prediction (application of noise reduction measures).
Table 1.
The results of the noise measurements in the surrounding villages.
Table 1.
The results of the noise measurements in the surrounding villages.
| MP | Location of the Measurement Point | Equivalent Sound Pressure Level
LAeq,T
[dB] | Correction for Tonal Compound
[dB] | Uncertainty
[dB] | Assessed Value
LR,Aeq,Tref
[dB] |
|---|
| P1 | Village A, in front of house façade | 45.5 | 5 | 2.1 | 52.6 |
| P2 | Village B, in front of house façade | 52.9 | - | 2.1 | 56.0 |
Table 2.
Measurement results on the site of the wastewater treatment plant.
Table 2.
Measurement results on the site of the wastewater treatment plant.
| MP | Distance from Source
[m] | Location of the Measurement Point | LAeq,T
[dB] |
|---|
| M1 | 6 | Blower room—north side | 68.1 |
| M2 | 3 | Between blower room and air distribution pipes | 79.5 |
| M3 | 9 | Blower room—south side | 80.2 |
| M4 | 6 | Activation tanks—south side | 68.7 |
| M5 | 6 | Activation tanks—south side | 67.5 |
| M6 | 6 | Activation tanks—south side | 63.5 |
| M7 | 6 | Activation tanks—south side | 59.8 |
| M8 | 25 | Biofilter | 62.4 |
| M9 | 10 | Input pumping station | 63.6 |
| M10 | 12 | Sludge treatment | 63.2 |
| M11 | 6 | Activation tanks—north side | 61.8 |
| M12 | 3 | Air distribution pipes | 72.3 |
| M13 | 6 | Activation tanks—north side | 65.8 |
| M14 | 3 | Air distribution pipes | 74.6 |
| M15 | 3 | Air distribution pipes | 76.1 |
| M16 | 6 | Northwest border of the wastewater plant | 57.1 |
| M17 | 4 | Between blower room and transformer station | 64.5 |
| M18 | 8 | Between input pumping station and sludge treatment | 66.4 |
Table 3.
Transmission loss of the installed acoustic grilles.
Table 3.
Transmission loss of the installed acoustic grilles.
| Frequency (Hz) | 63 | 125 | 250 | 500 | 1000 | 2000 | 4000 | 8000 |
| Transmission Loss (Db) | 2 | 3 | 3 | 5 | 7 | 11 | 13 | 18 |
Table 4.
Sound power level of sound sources.
Table 4.
Sound power level of sound sources.
| Source | Type | Sound Power Level [dB] |
|---|
| Before | After |
|---|
| Blower room—north | Point | 94 | 85 |
| Blower room—south | Point | 85 | 80 |
| Air distribution pipe—knee | Point | 100 | 87 |
| Air distribution pipe | Line | 70–80 | 60–70 |
| Biofilter | Point | 80 | 80 |
| Sludge treatment | Point | 85 | 80 |
| Activation tanks | Point | 65 | 65 |
Table 5.
The calculated values of the sound pressure levels at the calculation points (CP1–CP7).
Table 5.
The calculated values of the sound pressure levels at the calculation points (CP1–CP7).
| CP | Measurement Point | Height above Ground [m] | Equivalent Sound Pressure Level | Equivalent Sound Pressure Level |
|---|
| LAeq [dB] | LAeq [dB] |
|---|
| Current Situation | Prediction |
|---|
Day
Evening
Night | Day
Evening
Night |
|---|
| CP1 | Village A, house façade | 1.5 | 46.5 | 39.4 |
| 3 | 49.2 | 42.2 |
| CP2 | Village A, kindergarten building façade | 1.5 | 47.5 | 40.1 |
| 3 | 50.1 | 42.8 |
| CP3 | Village A, house façade | 1.5 | 48.6 | 41.3 |
| 3 | 51.3 | 44.3 |
| CP4 | Village A, east part | 1.5 | 45.7 | 41.0 |
| 3 | 48.7 | 43.0 |
| CP5 | Village B, house façade | 1.5 | 47.3 | 43.0 |
| 3 | 51.2 | 46.4 |
| CP6 | North border of WWTP | 1.5 | 64.5 | 54.4 |
| 3 | - | 56.2 |
| CP7 | South border of WWTP | 1.5 | 57.5 | 49.5 |
| 3 | - | 53.0 |
Table 6.
Results of measurements at the wastewater treatment plant site before and after the measures.
Table 6.
Results of measurements at the wastewater treatment plant site before and after the measures.
| MP | Distance from Source
[m] | Location of the Measurement Point | LAeq,T
[dB] |
|---|
| Before | After |
|---|
| M1 | 6 | Blower room—north side | 68.1 | 58.7 |
| M2 | 3 | Between blower room and air distribution pipes | 79.5 | 64.5 |
| M3 | 9 | Blower room—south side | 80.2 | 66.0 |
| M4 | 6 | Activation tanks—south side | 68.7 | 60.1 |
| M5 | 6 | Activation tanks—south side | 67.5 | 61.4 |
| M6 | 6 | Activation tanks—south side | 63.5 | 60.2 |
| M7 | 6 | Activation tanks—south side | 59.8 | 59.0 |
| M8 | 25 | Biofilter | 62.4 | 58.4 |
| M9 | 10 | Input pumping station | 63.6 | 62.4 |
| M10 | 12 | Sludge treatment | 63.2 | 52.4 |
| M11 | 6 | Activation tanks—north side | 61.8 | 54.4 |
| M12 | 3 | Air distribution pipes | 72.3 | 65.4 |
| M13 | 6 | Activation tanks—north side | 65.8 | 54.8 |
| M14 | 3 | Air distribution pipes | 74.6 | 73.1 |
| M15 | 3 | Air distribution pipes | 76.1 | 67.3 |
| M16 | 6 | Northwest border of wastewater plant | 57.1 | 56.2 |
| M17 | 4 | Between blower room and transformer station | 64.5 | 63.5 |
| M18 | 8 | Between input pumping station and sludge treatment | 66.4 | 59.1 |
Table 7.
Results of measurements in both villages before and after the noise reduction measures.
Table 7.
Results of measurements in both villages before and after the noise reduction measures.
| MP | Location of the Measurement Point | Equivalent Sound Pressure Level
LAeq,T
[dB] | Correction for Tonal Compound
[dB] | Uncertainty
[dB] | Assessed Value
LR,Aeq,Tref
[dB] |
|---|
| Before | After | Before | After | | Before | After |
|---|
| P1 | Village A, in front of house façade | 45.5 | 40.1 | 5 | - | 2.1 | 52.6 | 42.2 |
| P2 | Village B, in front of house façade | 52.9 | 47.5 | - | - | 56.0 | 49.6 |
| Publisher’s Note: MDPI stays neutral with regard to jurisdictional claims in published maps and institutional affiliations. |
© 2021 by the authors. Licensee MDPI, Basel, Switzerland. This article is an open access article distributed under the terms and conditions of the Creative Commons Attribution (CC BY) license (http://creativecommons.org/licenses/by/4.0/).


 ,
, 


