
Assessing the Direct Resource Requirements of Urban Horticulture in the United Kingdom: A Citizen Science Approach


Abstract
:1. Introduction
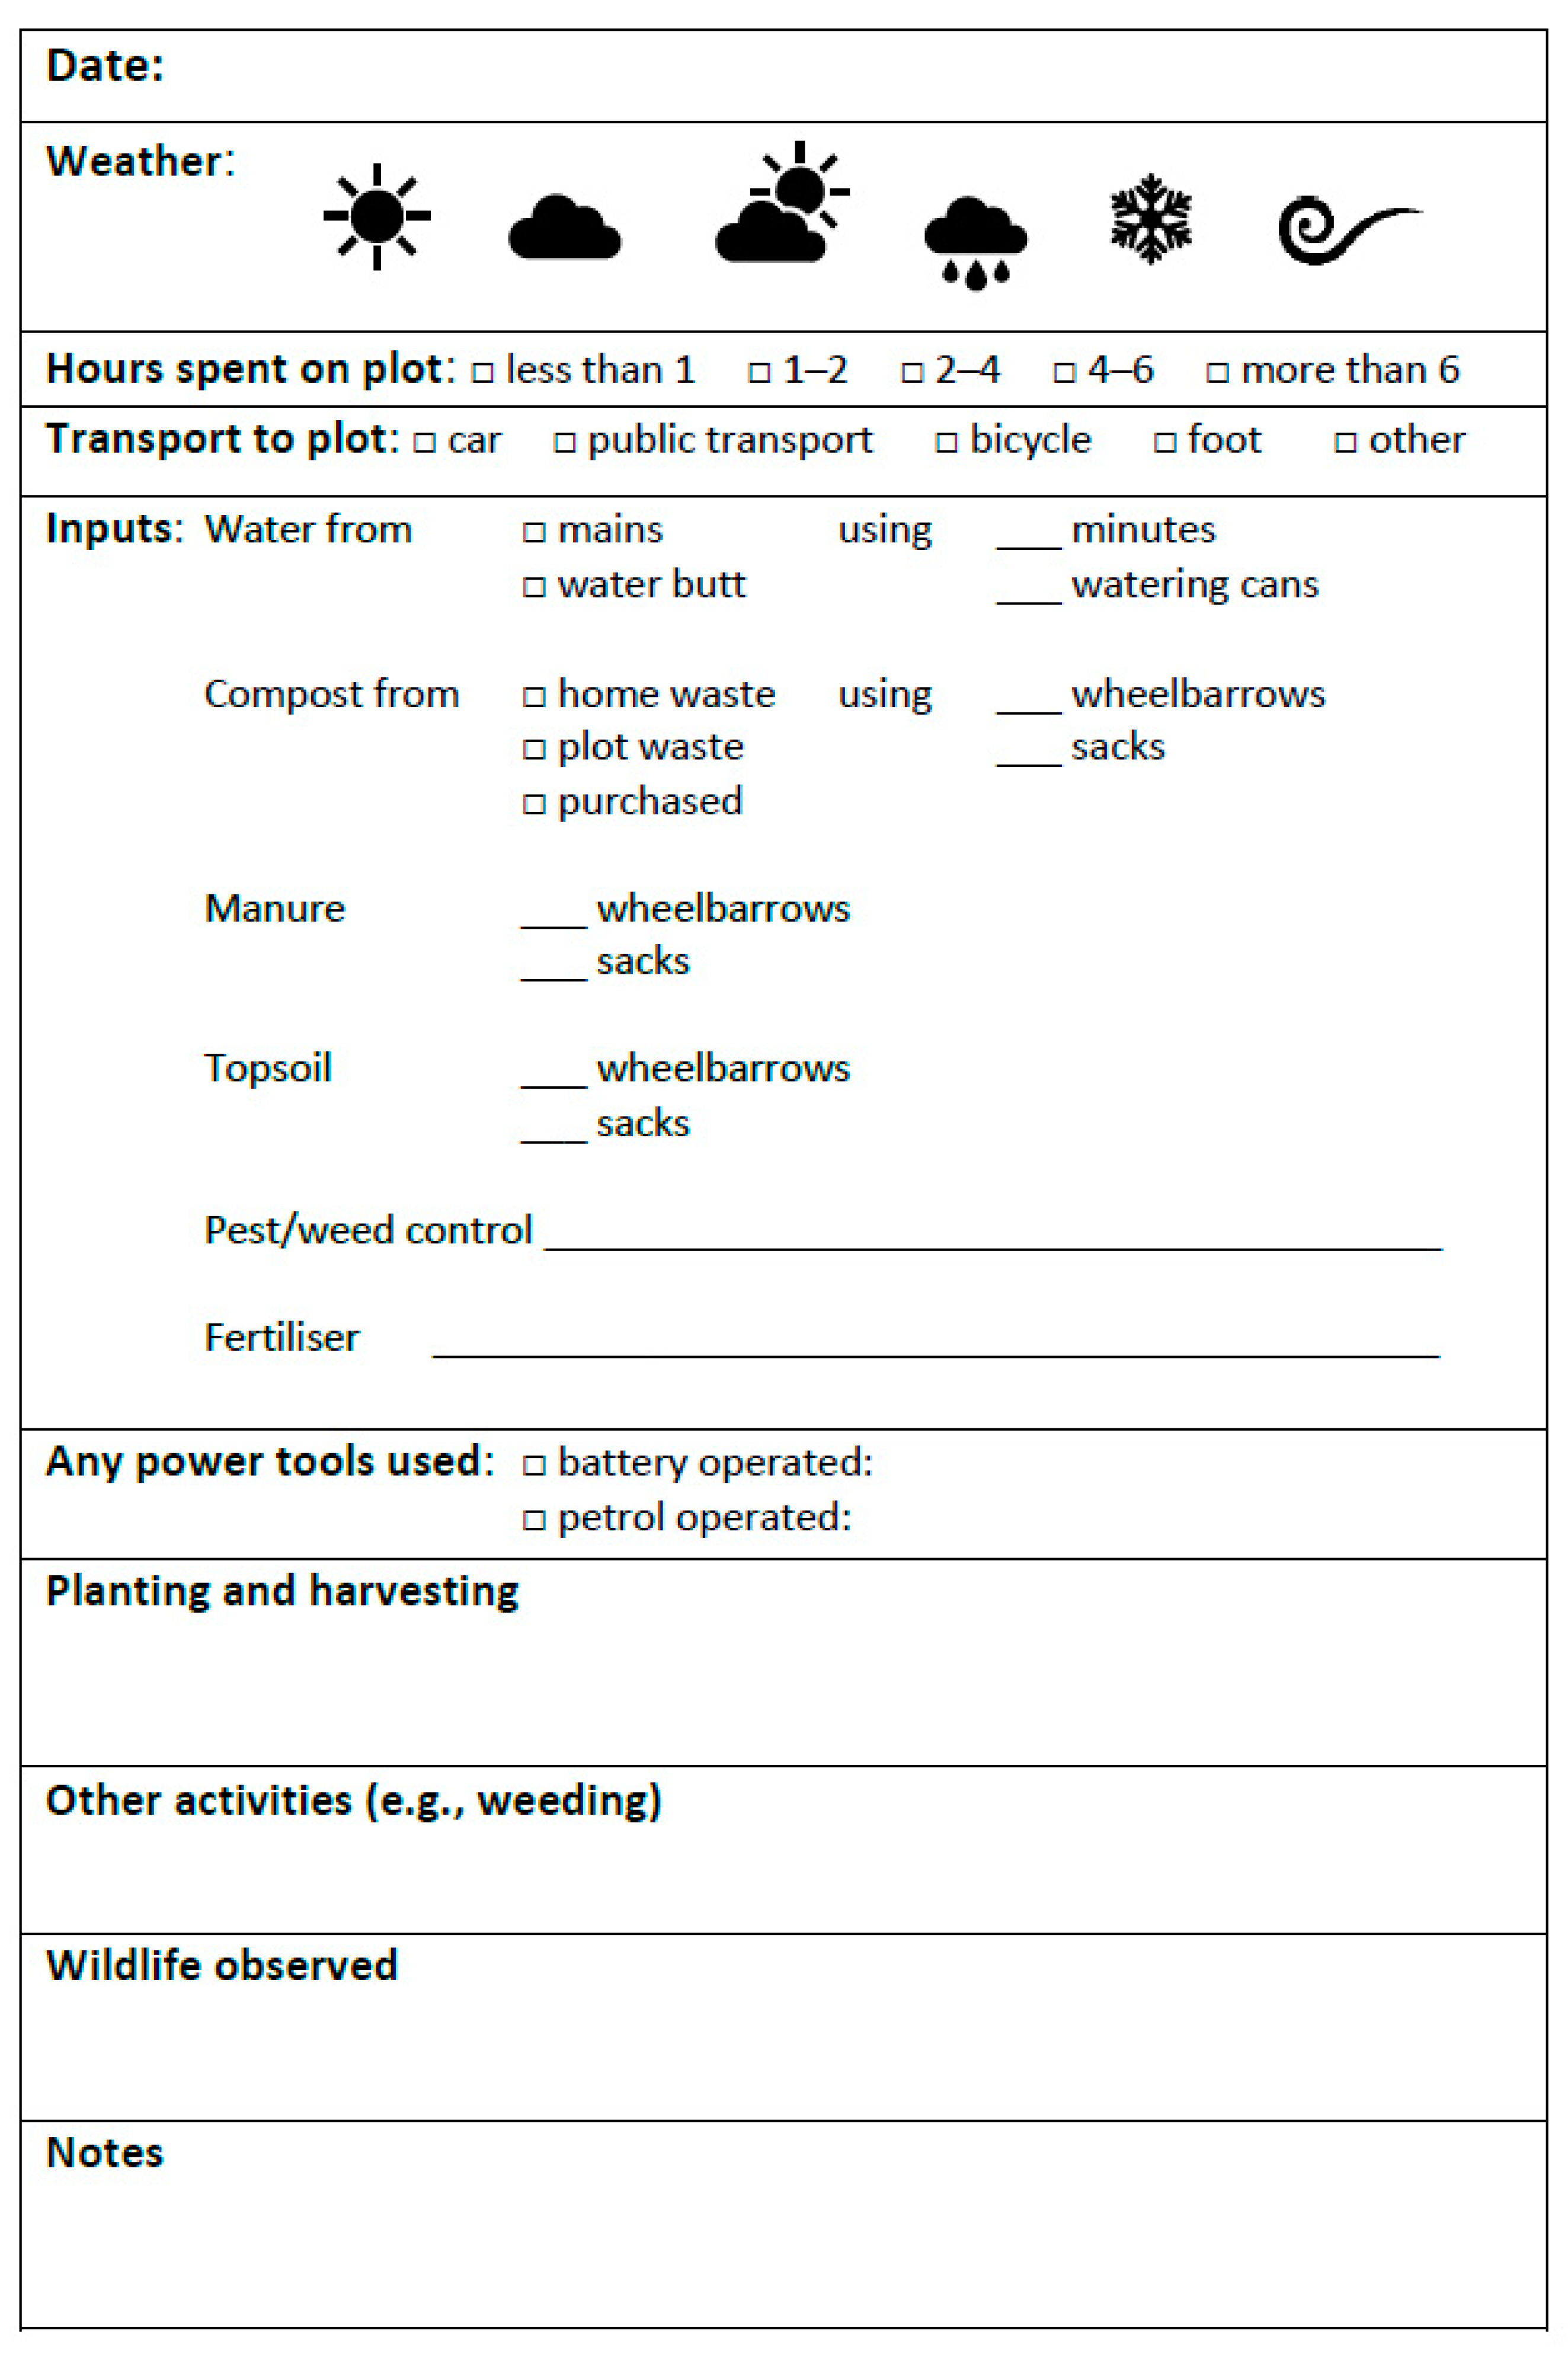
2. Materials and Methods
3. Results
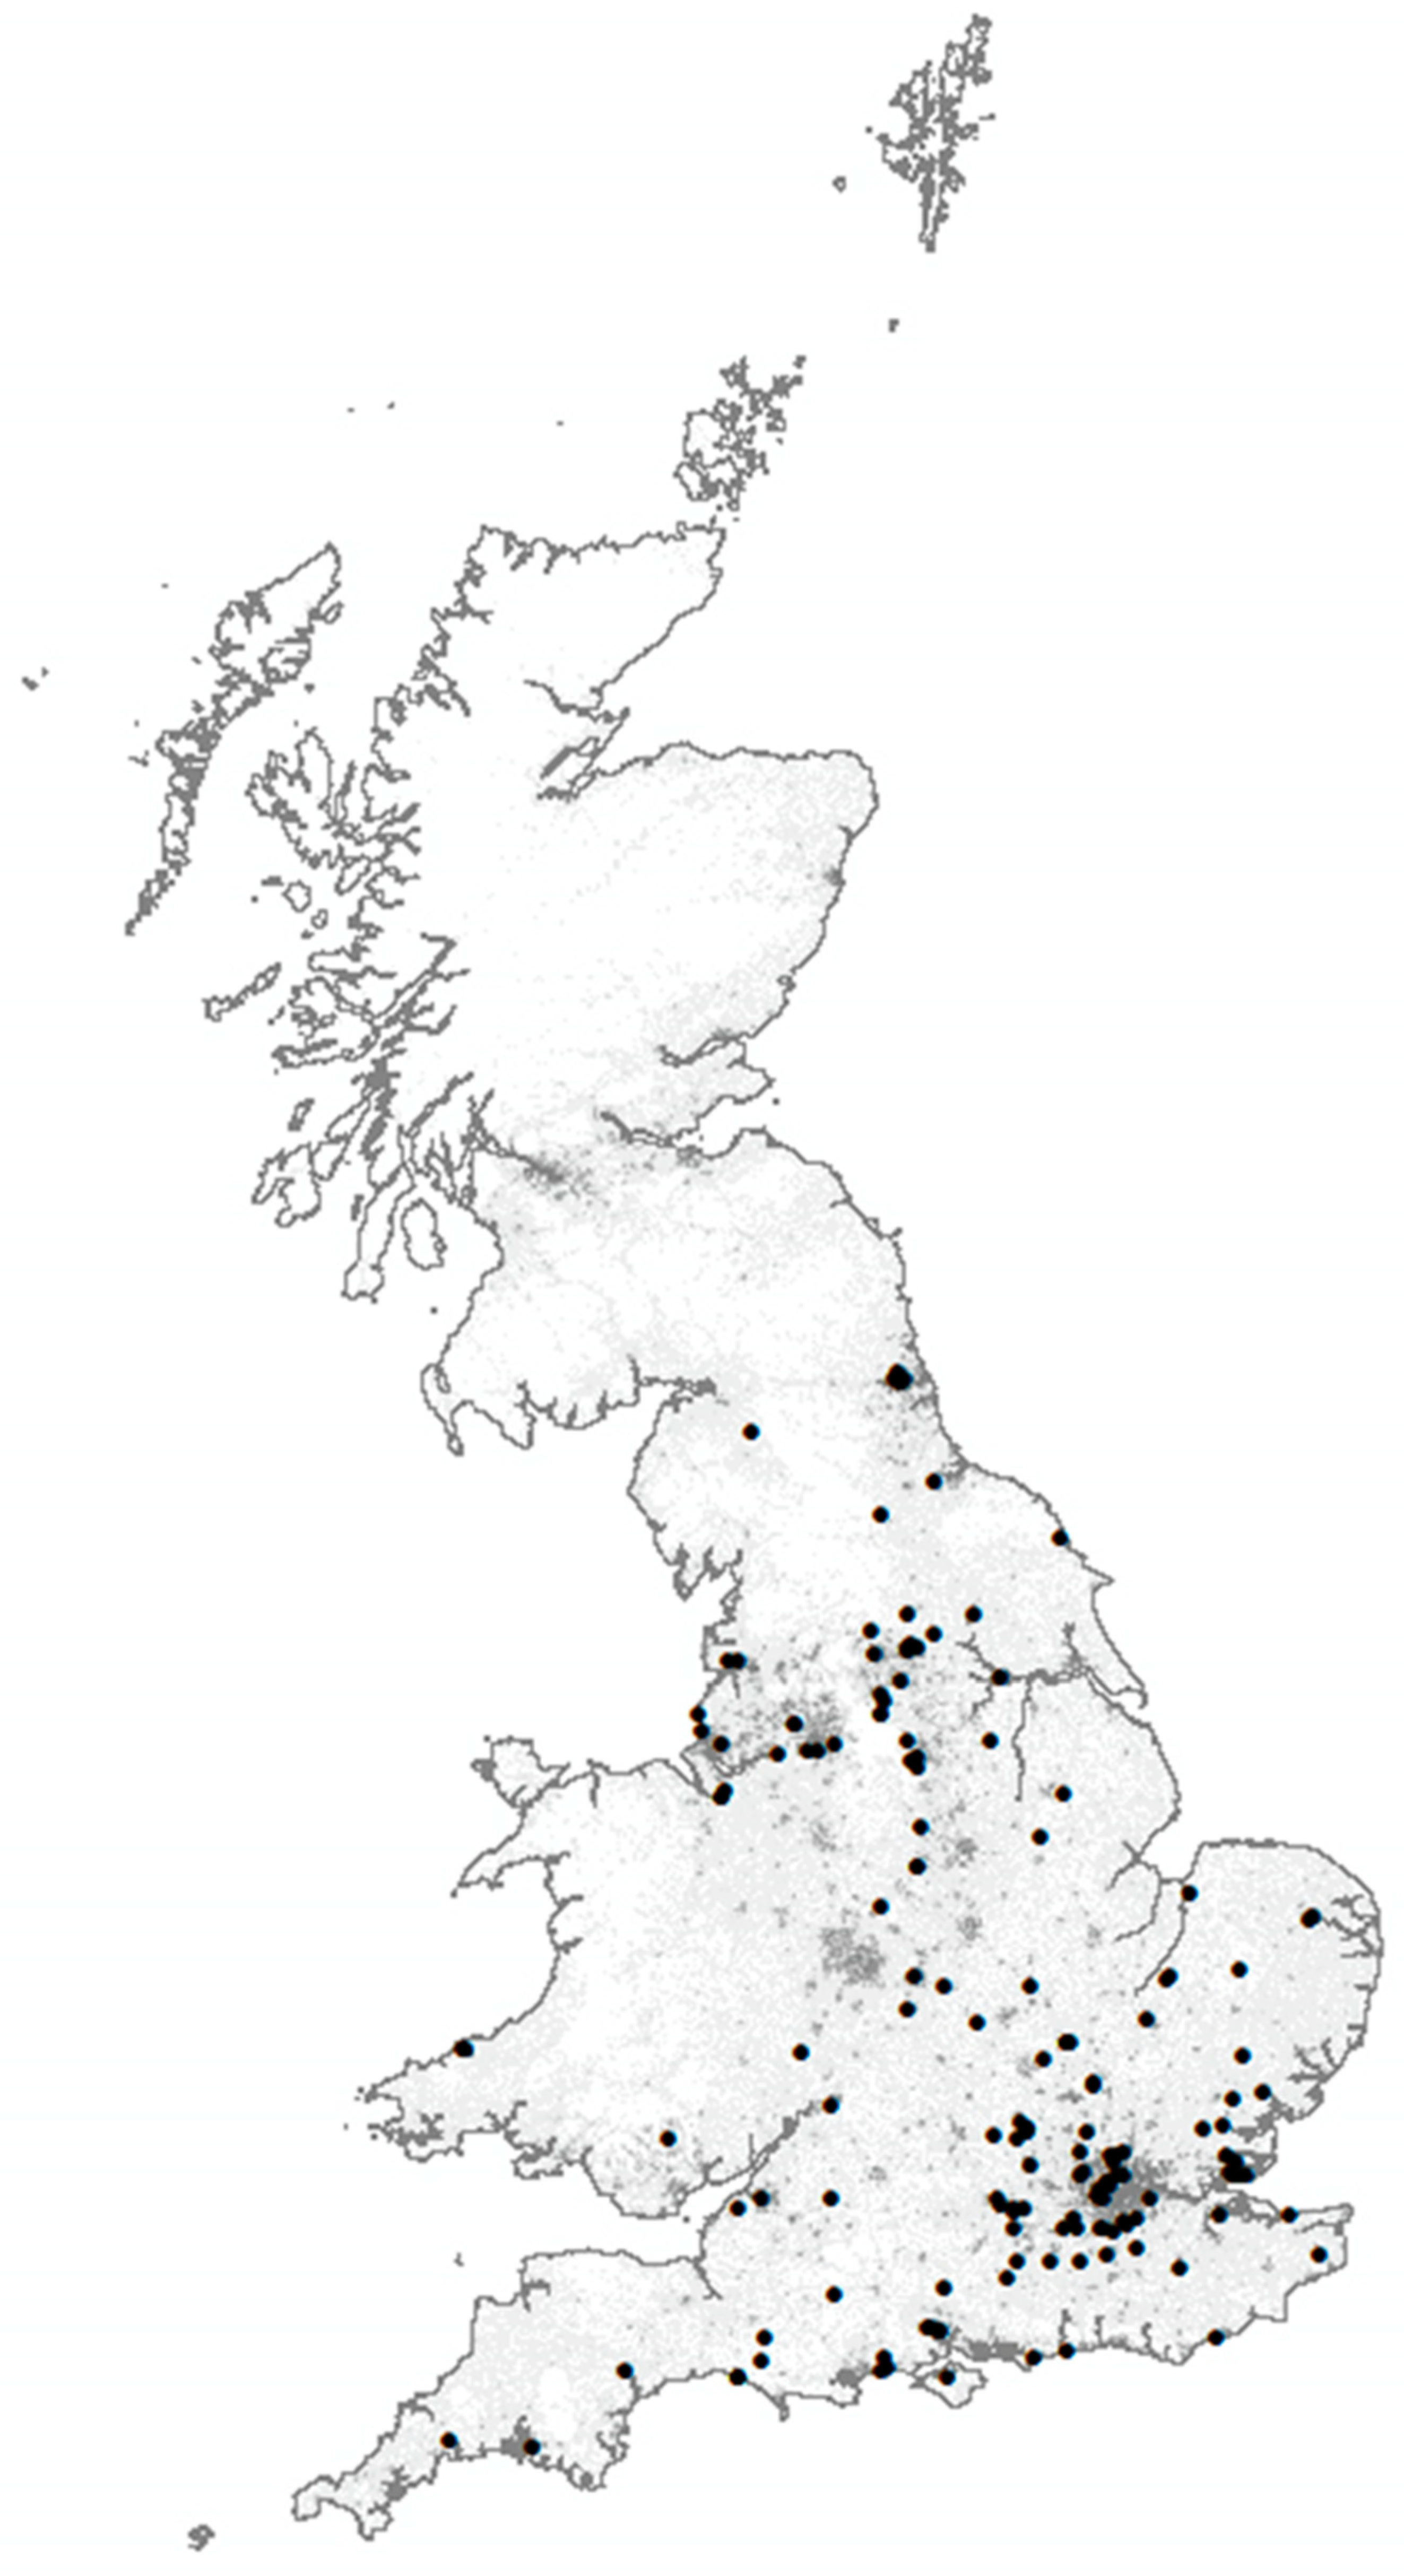
3.1. General Characteristics of Allotment Gardeners
3.2. Time Commitment
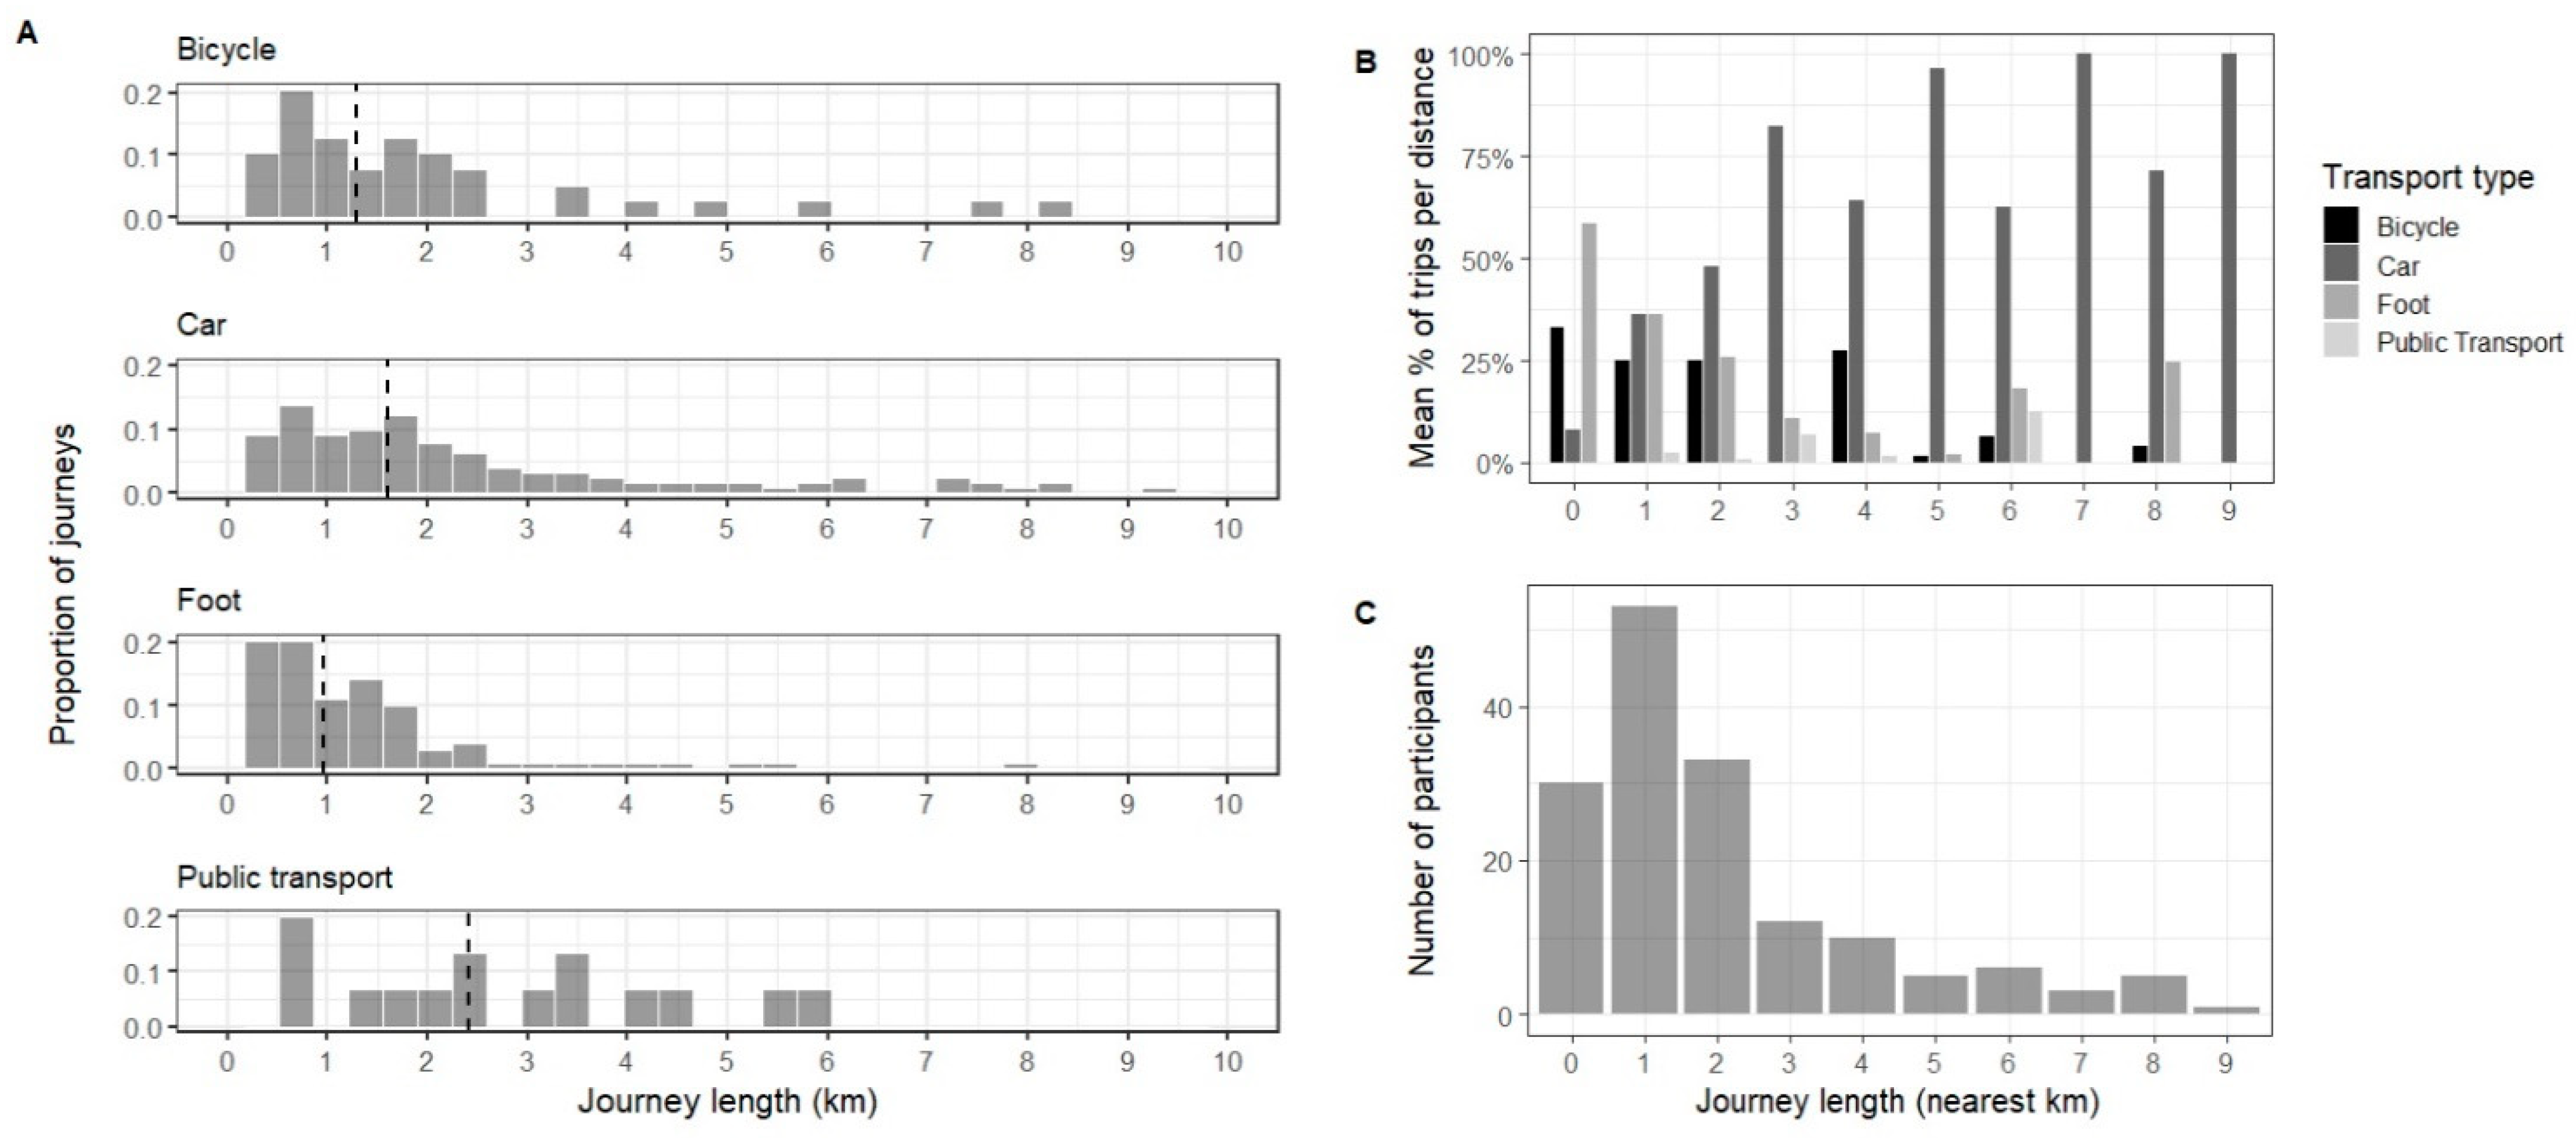
3.3. Transportation
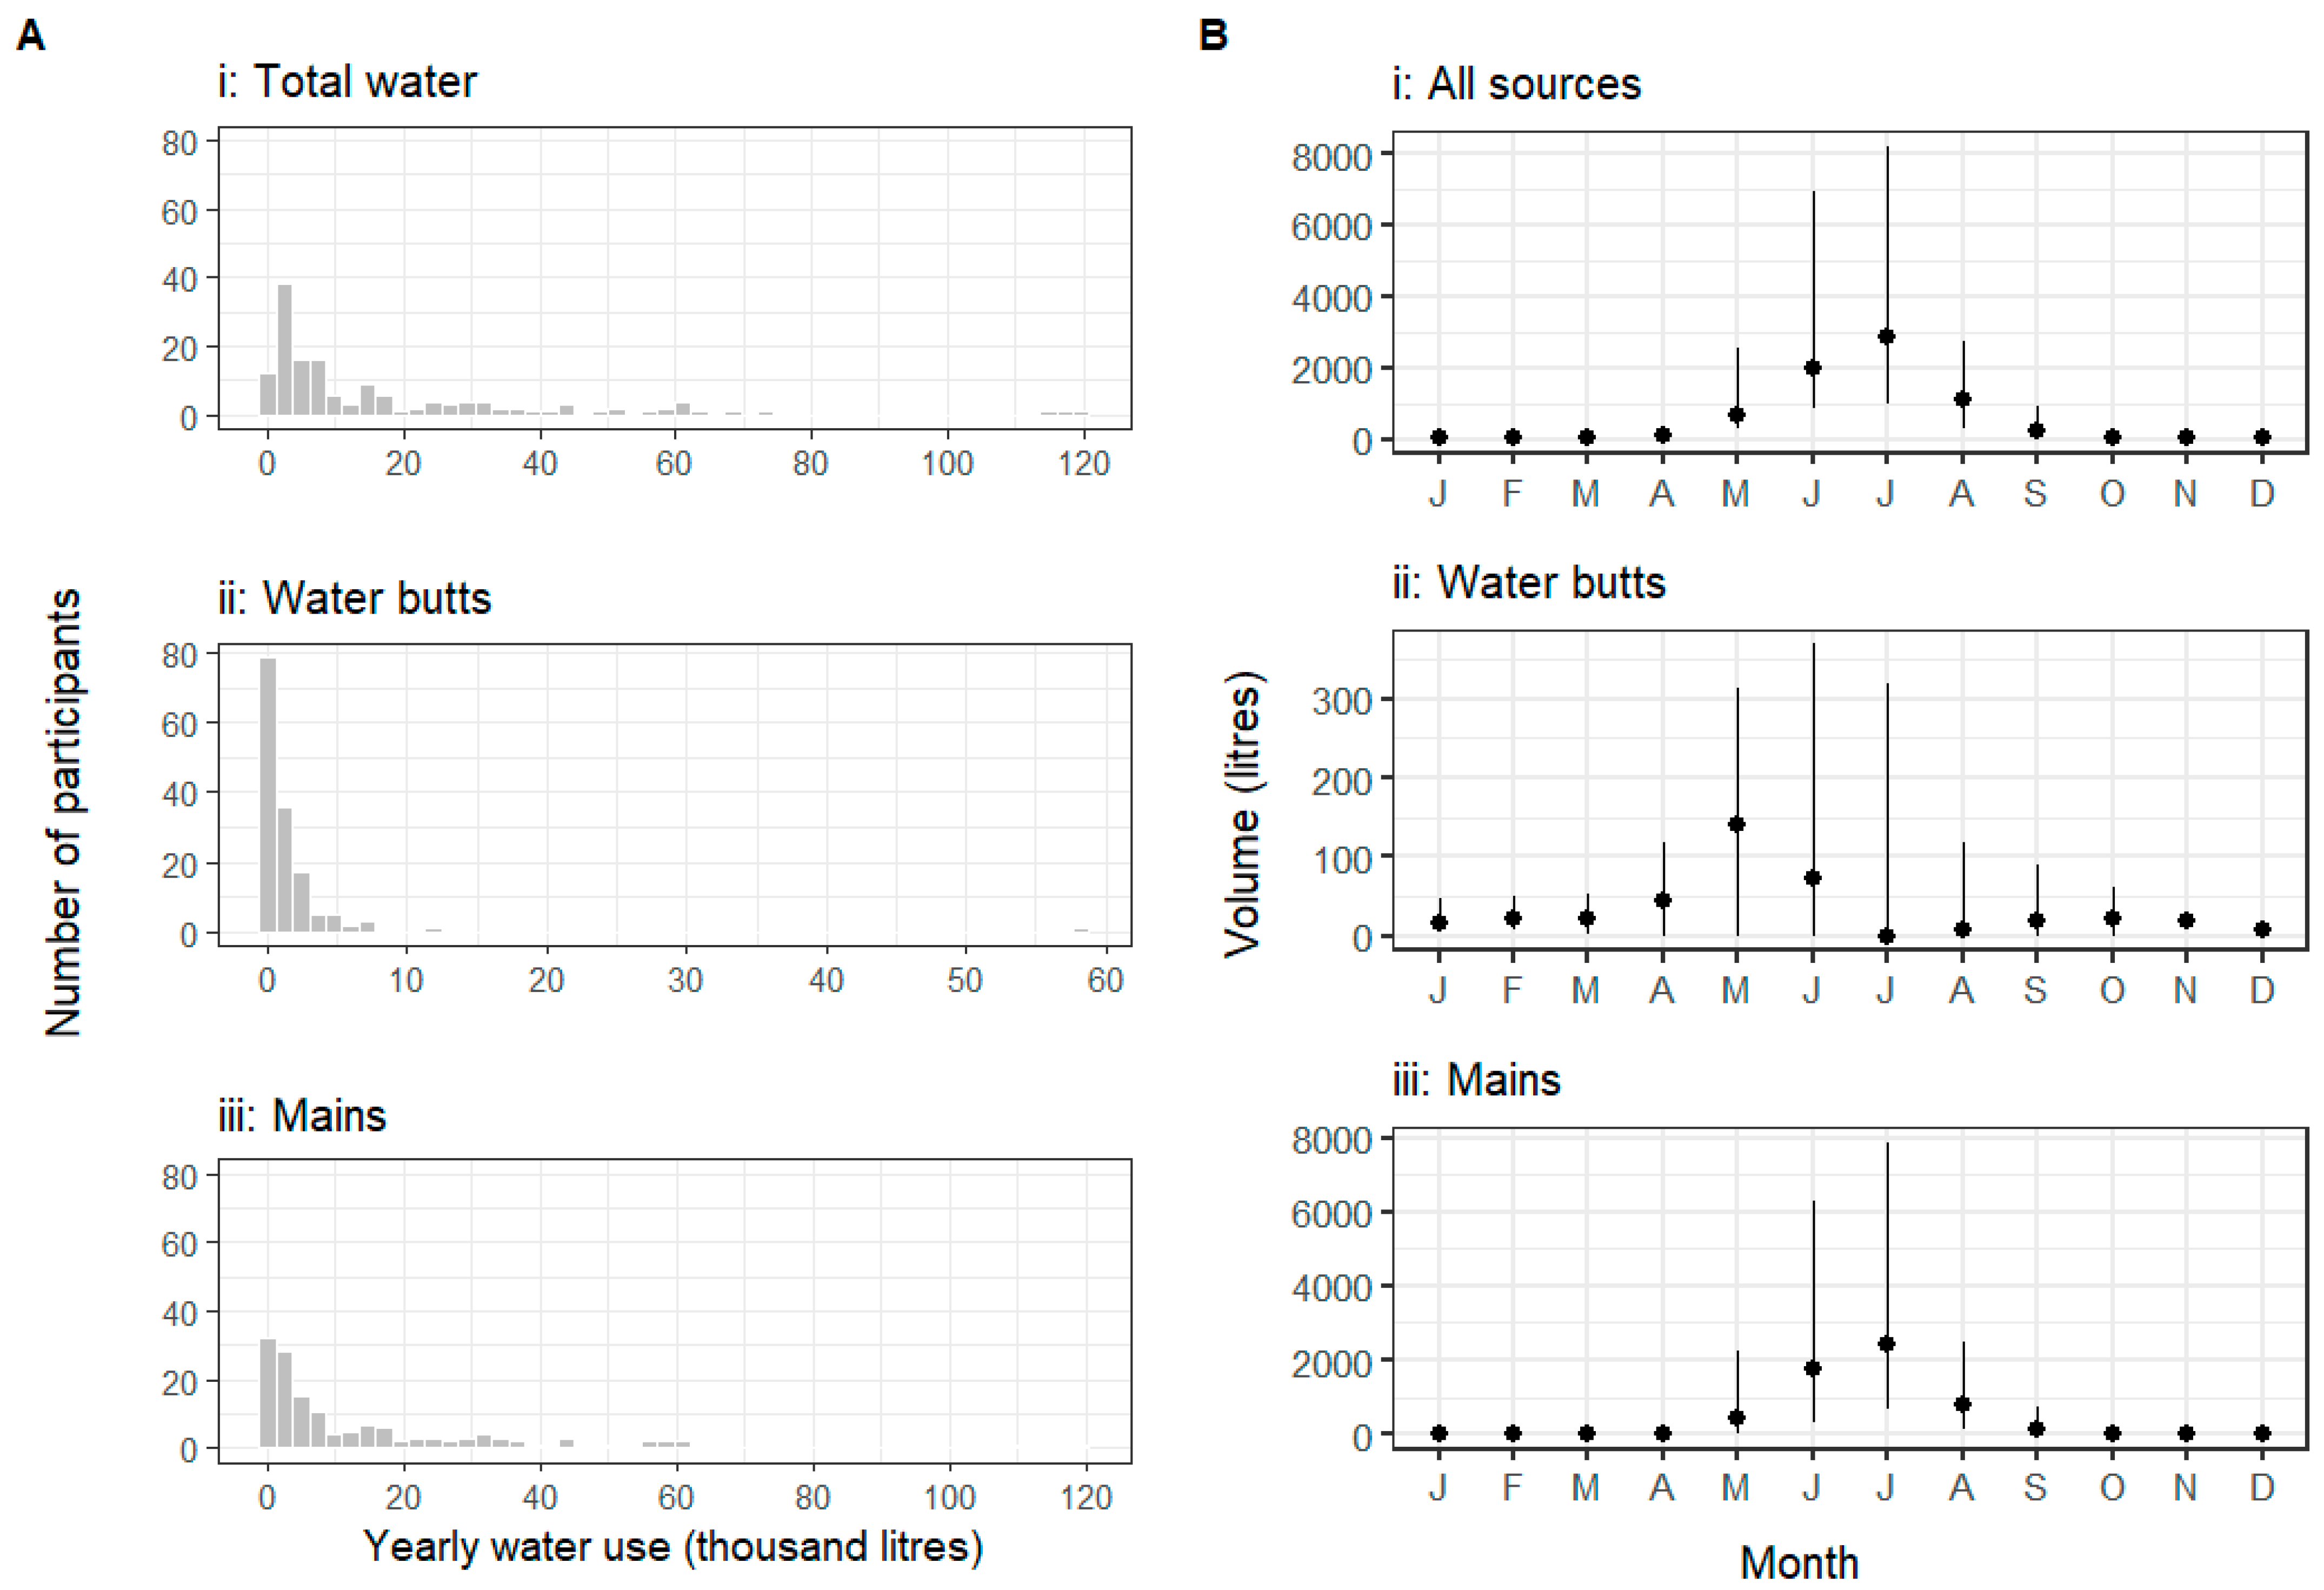
3.4. Water Use
3.5. Compost, Manure and Topsoil
3.6. Fertilisers, Pesticide and Weed Control
3.7. Overall Resource Requirements
4. Discussion
4.1. Fertilisers, Weedkillers, Pesticides and Compost
4.2. Water Use
4.3. Resource Capture and Recycling
4.4. Human Resources: Time, Money, and Travel
5. Conclusions
Supplementary Materials
Author Contributions
Funding
Institutional Review Board Statement
Informed Consent Statement
Data Availability Statement
Acknowledgments
Conflicts of Interest
References
- United Nations. World Urbanization Prospects: The 2018 Revision; United Nations Publications: New York, NY, USA, 2019. [Google Scholar]
- Food and Agriculture Organization of the United Nations. COVID-19 and the Risk to Food Supply Chains: How to Respond? FAO: Rome, Italy, 2020. [Google Scholar]
- Goldstein, B.P.; Birkved, M.; Fernandez, J.E.; Hauschild, M. Surveying the environmental footprint of urban food consumption. J. Ind. Ecol. 2017, 21, 151–165. [Google Scholar] [CrossRef] [Green Version]
- Benis, K.; Ferrão, P. Potential mitigation of the environmental impacts of food systems through urban and peri-urban agriculture (UPA)—A life cycle assessment approach. J. Clean. Prod. 2017, 140, 784–795. [Google Scholar] [CrossRef]
- Edmondson, J.L.; Cunningham, H.; Tingley, D.O.D.; Dobson, M.C.; Grafius, D.R.; Leake, J.R.; McHugh, N.; Nickles, J.; Phoenix, G.K.; Ryan, A.J.; et al. The hidden potential of urban horticulture. Nat. Food 2020, 1, 155–159. [Google Scholar] [CrossRef]
- Mcdougall, R.; Rader, R.; Kristiansen, P. Urban agriculture could provide 15% of food supply to Sydney, Australia, under expanded land use scenarios. Land Use Policy 2020, 94, 104554. [Google Scholar] [CrossRef]
- Lovell, S.T. Multifunctional urban agriculture for sustainable land use planning in the United States. Sustainability 2010, 2, 2499–2522. [Google Scholar] [CrossRef] [Green Version]
- Milan Urban Food Policy Pact. Signatory Cities. 2020. Available online: http://www.milanurbanfoodpolicypact.org/signatory-cities/ (accessed on 24 August 2020).
- Sustainable Food Places. Members. 2020. Available online: https://www.sustainablefoodplaces.org/members/ (accessed on 24 August 2020).
- McClintock, N. Why farm the city? Theorizing urban agriculture through a lens of metabolic rift. Camb. J. Reg. Econ. Soc. 2010, 3, 191–207. [Google Scholar] [CrossRef] [Green Version]
- McClintock, N.; Cooper, J.; Khandeshi, S. Assessing the potential contribution of vacant land to urban vegetable production and consumption in Oakland, California. Landsc. Urban Plan. 2013, 111, 46–58. [Google Scholar] [CrossRef] [Green Version]
- Lin, B.B.; Philpott, S.M.; Jha, S. The future of urban agriculture and biodiversity-ecosystem services: Challenges and next steps. Basic Appl. Ecol. 2015, 16, 189–201. [Google Scholar] [CrossRef]
- Speak, A.; Mizgajski, A.; Borysiak, J. Allotment gardens and parks: Provision of ecosystem services with an emphasis on biodiversity. Urban For. Urban Green. 2015, 14, 772–781. [Google Scholar] [CrossRef]
- Webber, J.; Hinds, J.; Camic, P.M. The well-being of allotment gardeners: A Mixed methodological study. Ecopsychology 2015, 7, 20–28. [Google Scholar] [CrossRef] [Green Version]
- Borysiak, J.; Mizgajski, A.; Speak, A. Floral biodiversity of allotment gardens and its contribution to urban green infrastructure. Urban Ecosyst. 2017, 20, 323–335. [Google Scholar] [CrossRef]
- Maye, D. ‘Smart food city’: Conceptual relations between smart city planning, urban food systems and innovation theory. City Cult. Soc. 2019, 16, 18–24. [Google Scholar] [CrossRef]
- Goldstein, B.; Hauschild, M.; Fernández, J.; Birkved, M. Urban versus conventional agriculture, taxonomy of resource profiles: A review. Agron. Sustain. Dev. 2016, 36, 1–19. [Google Scholar] [CrossRef]
- Kulak, M.; Graves, A.; Chatterton, J. Reducing greenhouse gas emissions with urban agriculture: A life cycle assessment perspective. Landsc. Urban Plan. 2013, 111, 68–78. [Google Scholar] [CrossRef]
- Sanyé-Mengual, E.; Oliver-Solà, J.; Montero, J.I.; Rieradevall, J. An environmental and economic life cycle assessment of rooftop greenhouse (RTG) implementation in Barcelona, Spain. Assessing new forms of urban agriculture from the greenhouse structure to the final product level. Int. J. Life Cycle Assess. 2015, 20, 350–366. [Google Scholar] [CrossRef] [Green Version]
- Sanyé-Mengual, E.; Gasperi, D.; Michelon, N.; Orsini, F.; Ponchia, G.; Gianquinto, G. Eco-efficiency assessment and food security potential of home gardening: A case study in Padua, Italy. Sustainability 2018, 10, 2124. [Google Scholar] [CrossRef] [Green Version]
- Goldstein, B.P.; Hauschild, M.Z.; Fernández, J.E.; Birkved, M. Contributions of local farming to urban sustainability in the northeast united states. Environ. Sci. Technol. 2017, 51, 7340–7349. [Google Scholar] [CrossRef] [Green Version]
- Mohareb, E.; Heller, M.; Novak, P.; Goldstein, B.; Fonoll, X.; Raskin, L. Considerations for reducing food system energy demand while scaling up urban agriculture. Environ. Res. Lett. 2017, 12, 125004. [Google Scholar] [CrossRef]
- Crouch, D.; Ward, C. The Allotment: Its Landscape and Culture; Five Leaves Publications: Nottingham, UK, 1997. [Google Scholar]
- Acton, L. Growing Space: A History of the Allotment Movement; Five Leaves Publications: Nottingham, UK, 2015. [Google Scholar]
- Campbell, M.; Campbell, I. Allotment waiting lists in England 2013. Transition Town West Kirby, National Society of Allotment and Leisure Gardeners, United Kingdom. Available online: http://www.transitiontownwestkirby.org.uk/files/ttwk_nsalg_survey_2013.pdf (accessed on 28 August 2020).
- Edmondson, J.L.; Childs, D.Z.; Dobson, M.C.; Gaston, K.J.; Warren, P.H.; Leake, J.R. Feeding a city—Leicester as a case study of the importance of allotments for horticultural production in the UK. Sci. Total Environ. 2020, 705, 135930. [Google Scholar] [CrossRef]
- Dobson, M.C.; Edmondson, J.L.; Warren, P.H. Urban food cultivation in the United Kingdom: Quantifying loss of allotment land and identifying potential for restoration. Landsc. Urban Plan. 2020, 199, 103803. [Google Scholar] [CrossRef]
- Niala, J. Dig for vitality: UK urban allotments as a health-promoting response to COVID-19. Cities Health 2020, 1–5. [Google Scholar] [CrossRef]
- Grewal, S.S.; Grewal, P.S. Can cities become self-reliant in food? Cities 2012, 29, 1–11. [Google Scholar] [CrossRef]
- Petit-Boix, A.; Llorach-Massana, P.; Sanjuan-Delmás, D.; Sierra-Pérez, J.; Vinyes, E.; Gabarrell, X.; Rieradevall, J.; Sanyé-Mengual, E. Application of life cycle thinking towards sustainable cities: A review. J. Clean. Prod. 2017, 166, 939–951. [Google Scholar] [CrossRef] [Green Version]
- Environmental Protection Agency. Composting at home. 2020. Available online: https://www.epa.gov/recycle/composting-home (accessed on 30 March 2020).
- Chen, C.; Chaudhary, A.; Mathys, A. Nutritional and environmental losses embedded in global food waste. Resour. Conserv. Recycl. 2020, 160, 104912. [Google Scholar] [CrossRef]
- Gondhalekar, D.; Ramsauer, T. Nexus city: Operationalizing the urban water-energy-food nexus for climate change adaptation in Munich, Germany. Urban Clim. 2017, 19, 28–40. [Google Scholar] [CrossRef]
- Pataki, D.E.; Carreiro, M.M.; Cherrier, J.; Grulke, N.E.; Jennings, V.; Pincetl, S.; Pouyat, R.V.; Whitlow, T.H.; Zipperer, W.C. Coupling biogeochemical cycles in urban environments: Ecosystem services, green solutions, and misconceptions. Front. Ecol. Environ. 2011, 9, 27–36. [Google Scholar] [CrossRef]
- Edmondson, J.L.; Davies, Z.G.; Gaston, K.J.; Leake, J.R. Urban cultivation in allotments maintains soil qualities adversely affected by conventional agriculture. J. Appl. Ecol. 2014, 51, 880–889. [Google Scholar] [CrossRef] [PubMed]
- Met Office. UK Climate Averages. 2021. Available online: https://www.metoffice.gov.uk/research/climate/maps-and-data/uk-climate-averages (accessed on 10 February 2021).
- Carbon Brief. England’s Growing Season Now Almost a Month Longer, Says Met Office. 2021. Available online: https://www.carbonbrief.org/englands-growing-season-now-almost-a-month-longer-says-met-office (accessed on 10 February 2021).
- Reis, S.; Liska, T.; Steinle, S.; Carnell, E.; Leave, D.; Roberts, E.; Veino, M.; Beck, R.; Dragosits, U. UK Gridded Population 2011 Based on Census 2011 and Land Cover Map 2015; UK Centre for Ecology & Hydrology: Midlothian, UK, 2017; Available online: https://0-doi-org.brum.beds.ac.uk/10.5285/0995e94d-6d42-40c1-8ed4-5090d82471e1 (accessed on 1 March 2021).
- Swan Products. The Flow Rate of a Garden Hose. 2020. Available online: https://www.swanhose.com/garden-hose-flow-rate-s/1952.htm (accessed on 8 July 2020).
- R Core Team. R: A Language and Environment for Statistical Computing; R Foundation for Statistical Computing: Vienna, Austria, 2018; Available online: https://www.R-project.org (accessed on 1 March 2021).
- Kc, K.B.; Dias, G.M.; Veeramani, A.; Swanton, C.J.; Fraser, D.; Steinke, D.; Lee, E.; Wittman, H.; Farber, J.M.; Dunfield, K.; et al. When too much isn’t enough: Does current food production meet global nutritional needs? PLoS ONE 2018, 13, e0205683. [Google Scholar] [CrossRef] [Green Version]
- Department for Environment Food and Rural Affairs. Horticulture Statistics 2019. 2020. Available online: https://assets.publishing.service.gov.uk/government/uploads/system/uploads/attachment_data/file/901689/hort-report-17jul20.pdf (accessed on 6 November 2020).
- Goldstein, B.P.; Hauschild, M.Z.; Fernández, J.; Birkved, M. Testing the environmental performance of urban agriculture as a food supply in northern climates. J. Clean. Prod. 2016, 135, 984–994. [Google Scholar] [CrossRef] [Green Version]
- Boldrin, A.; Andersen, J.K.; Møller, J.; Christensen, T.H.; Favoino, E. Composting and compost utilization: Accounting of greenhouse gases and global warming contributions. Waste Manag. Res. 2009, 27, 800–812. [Google Scholar] [CrossRef] [Green Version]
- Lorenz, K. Organic urban agriculture. Soil Sci. 2015, 180, 146–153. [Google Scholar] [CrossRef] [Green Version]
- Purvis, G.; Bannon, J.W. Non-target effects of repeated methiocarb slug pellet application on carabid beetle (Coleoptera: Carabidae) activity in winter-sown cereals. Ann. Appl. Biol. 1992, 121, 401–422. [Google Scholar] [CrossRef]
- Relyea, R.A. The lethal impact of roundup on aquatic and terrestrial amphibians. Ecol. Appl. 2005, 15, 1118–1124. [Google Scholar] [CrossRef]
- Altieri, M.A.; Companioni, N.; Cañizares, K.; Murphy, C.; Rosset, P.; Bourque, M.; Nicholls, C.I. The greening of the “barrios”: Urban agriculture for food security in Cuba. Agric. Hum. Values 1999, 16, 131–140. [Google Scholar] [CrossRef]
- Beniston, J.; Lal, R. Improving soil quality for urban agriculture in the North Central, U.S. In Carbon Sequestration in Urban Ecosystems; Augustin, B., Lal, R., Eds.; Springer International Publishing: Geneva, Switzerland, 2011; pp. 279–313. [Google Scholar]
- Garthwaite, D.; Ridley, L.; Mace, A.; Parrish, G.; Barker, I.; Rainford, J.; MacArthur, R. Pesticide Usage Survey Report 284: Arable Crops in the United Kingdom 2018. Available online: https://secure.fera.defra.gov.uk/pusstats/surveys/documents/arable2018.pdf (accessed on 6 August 2020).
- Department for Environment, Food and Rural Affairs. The British Survey of Fertiliser Practice: Fertiliser Use on Farm Crops for Crop Year 2019; Department for Environment, Food and Rural Affairs: London, UK, 2019. Available online: https://www.gov.uk/government/statistics/british-survey-of-fertiliser-practice-2019 (accessed on 6 August 2020).
- Knox, J.; Rodriguez-Diaz, J.; Weatherhead, E.K.; Kay, M. Development of a water-use strategy for horticulture in England and Wales—A case study. J. Hortic. Sci. Biotechnol. 2010, 85, 89–93. [Google Scholar] [CrossRef]
- Met Office. Chance of Summer Heatwaves Now Thirty Times More Likely. 2018. Available online: https://www.metoffice.gov.uk/about-us/press-office/news/weather-and-climate/2018/2018-uk-summer-heatwave (accessed on 8 July 2020).
- Statista. Total Monthly Rainfall in the United Kingdom (UK) from 2014 to 2020. 2021. Available online: https://0-www-statista-com.brum.beds.ac.uk/statistics/584914/monthly-rainfall-in-uk/ (accessed on 10 February 2021).
- Met Office. UK Climate Projections: Headline Findings. 2019. Available online: https://www.metoffice.gov.uk/binaries/content/assets/metofficegovuk/pdf/research/ukcp/ukcp-headline-findings-v2.pdf (accessed on 30 March 2020).
- Met Office. Record Breaking Rainfall. 2020. Available online: https://www.metoffice.gov.uk/about-us/press-office/news/weather-and-climate/2020/2020-winter-february-stats (accessed on 30 March 2020).
- Buechler, S.; Mekala, G.D.; Keraita, B. Wastewater use for urban and peri-urban agriculture. In Cities Farming for the Future: Urban Agriculture for Green and Productive Cities; van Veenhuizen, E., Ed.; FUAF Foundation: Hague, The Netherlands, 2006. [Google Scholar]
- Miller-Robbie, L.; Ramaswami, A.; Amerasinghe, P. Wastewater treatment and reuse in urban agriculture: Exploring the food, energy, water, and health nexus in Hyderabad, India. Environ. Res. Lett. 2017, 12, 075005. [Google Scholar] [CrossRef]
- De Zeeuw, H.; Van Veenhuizen, R.; Dubbeling, M. The role of urban agriculture in building resilient cities in developing countries. J. Agric. Sci. 2011, 149, 153–163. [Google Scholar] [CrossRef]
- Travaline, K.; Hunold, C. Urban agriculture and ecological citizenship in Philadelphia. Local Environ. 2010, 15, 581–590. [Google Scholar] [CrossRef]
- Milbourne, P. Everyday (in)justices and ordinary environmentalisms: Community gardening in disadvantaged urban neighbourhoods. Local Environ. 2012, 17, 943–957. [Google Scholar] [CrossRef]
- Poulsen, M.N.; Hulland, K.R.S.; Gulas, C.A.; Pham, H.; Dalglish, S.L.; Wilkinson, R.K.; Winch, P.J. Growing an urban oasis: A qualitative study of the perceived benefits of community gardening in Baltimore, Maryland. Cult. Agric. Food Environ. 2014, 36, 69–82. [Google Scholar] [CrossRef]
- Van Der Werf, H.M.G.; Knudsen, M.T.; Cederberg, C. Towards better representation of organic agriculture in life cycle assessment. Nat. Sustain. 2020, 3, 419–425. [Google Scholar] [CrossRef]
- Grafius, D.R.; Edmondson, J.L.; Norton, B.A.; Clark, R.; Mears, M.; Leake, J.R.; Corstanje, R.; Harris, J.A.; Warren, P.H. Estimating food production in an urban landscape. Sci. Rep. 2020, 10, 1–9. [Google Scholar] [CrossRef] [PubMed] [Green Version]
- Dobson, M.C.; Reynolds, C.; Warren, P.H.; Edmondson, J.L. “My little piece of the planet”: The multiplicity of well-being benefits from allotment gardening. Br. Food J. 2020, 123, 1012–1023. [Google Scholar] [CrossRef]


| Fertiliser | Pest Control | Weed Control | |||
|---|---|---|---|---|---|
| General Type | Number | General Type | Number | General Type | Number |
| Branded, e.g., Tomorite | 358 | Pellets (primarily slug) | 530 | Chemical weedkiller, e.g., Roundup | 129 |
| Seaweed, comfrey and nettles | 300 | Insecticide and poison | 91 | Bark, cardboard and woodchip | 74 |
| Chicken manure pellets | 270 | Homemade, e.g., washing up liquid spray | 46 | Fabric, mesh and carpet | 21 |
| Fish, blood and bone | 190 | Netting, fleece, and wire | 42 | Plastic | 15 |
| General (un-branded/undisclosed brand) | 184 | Traps, e.g., beer traps for slugs | 27 | ||
| Lime | 38 | Nematodes | 9 | ||
Publisher’s Note: MDPI stays neutral with regard to jurisdictional claims in published maps and institutional affiliations. |
© 2021 by the authors. Licensee MDPI, Basel, Switzerland. This article is an open access article distributed under the terms and conditions of the Creative Commons Attribution (CC BY) license (http://creativecommons.org/licenses/by/4.0/).
Share and Cite
Dobson, M.C.; Warren, P.H.; Edmondson, J.L. Assessing the Direct Resource Requirements of Urban Horticulture in the United Kingdom: A Citizen Science Approach. Sustainability 2021, 13, 2628. https://0-doi-org.brum.beds.ac.uk/10.3390/su13052628
Dobson MC, Warren PH, Edmondson JL. Assessing the Direct Resource Requirements of Urban Horticulture in the United Kingdom: A Citizen Science Approach. Sustainability. 2021; 13(5):2628. https://0-doi-org.brum.beds.ac.uk/10.3390/su13052628
Chicago/Turabian StyleDobson, Miriam C., Philip H. Warren, and Jill L. Edmondson. 2021. "Assessing the Direct Resource Requirements of Urban Horticulture in the United Kingdom: A Citizen Science Approach" Sustainability 13, no. 5: 2628. https://0-doi-org.brum.beds.ac.uk/10.3390/su13052628