
Delineating the Urban Areas of a Cross-Boundary City with Open-Access Data: Guangzhou–Foshan, South China


1
School of Geography and Planning, Sun Yat-sen University, Guangzhou 510275, China
2
School of Geography, South China Normal University, Guangzhou 510640, China
3
School of Architecture, South China University of Technology, Guangzhou 510006, China
4
Architecture and Urban Planning Design Institute, Shandong Jianzhu University, Ji’nan 250014, China
*
Author to whom correspondence should be addressed.
Sustainability 2021, 13(5), 2930; https://0-doi-org.brum.beds.ac.uk/10.3390/su13052930
Submission received: 17 December 2020
/
Revised: 2 March 2021
/
Accepted: 3 March 2021
/
Published: 8 March 2021
(This article belongs to the Collection Sustainable Built Environment)
Abstract
:Cities defined mainly from the administrative aspect can create impact and problems especially in the case of China. However, only a few researchers from China have attempted to identify urban areas from the morphology dimension. In addition, previous studies have been mostly based on the national and regional scales or a single prefecture city and have completely ignored cross-boundary cities. Defining urban areas on the basis of a single data type also has limitations. To address these problems, this study integrates point of interest and nighttime light data, applies the breaking point analysis method to determine the physical geographic scope of the Guangzhou–Foshan cross-border city, and then compares this city with Beijing and Shanghai. Results show that Guangzhou–Foshan comprises one core urban area and six suburban counties, among which the core urban area extends across the administrative boundaries of Guangzhou and Foshan. The urban area and average urban radius of Guangzhou–Foshan are larger than those of Beijing and Shanghai, and this finding contradicts the city size measurements based on the administrative division system of China and those published on traditional official statistical yearbooks. In terms of urban density value, Shanghai has the steepest profile followed by Guangzhou–Foshan and Beijing, and the profile line of Guangzhou–Foshan has a bimodal shape.
1. Introduction
Chinese scholar Yixing Zhou argued that the first scientific problem in urban research lies in the correctness of basic concepts [1]. Specifically, in urban studies, understanding how cities should be defined is a universal difficulty [2,3]. The population distribution, urban functions, and physical geographical conditions in each region vary across countries, thus challenging researchers in proposing a scientific definition of cities and comparing different regions and countries. The current global urbanization level has exceeded 50%, which suggests that people are now living in an “urban age” and that means, for the first time in human history, more than half of the global population are purportedly living in cities, transforming cities into one of the most important foundations of the global economy and society [4,5,6]. A scientific definition of cities, especially the scope of urban areas, is important in promoting the construction of urban infrastructure that can satisfy the needs of urban social and economic development. Such a definition is also crucial in conducting scientific urban research and realizing a sustainable development of cities and regions.
The definition of a city usually covers three dimensions, namely, the morphology, and functional and administrative dimensions [7,8]. An urban area (urbanized area) is a typical concept defined from the morphology dimension that refers to the distribution scope of an urban landscape with non-agricultural land and economic activities as the main body. To a certain extent, an urban area is equivalent to an urban built-up area [7,9]. From the functional dimension, a city can be considered a functional urban area with a dense core and a peripheral area as its commuting catchment, both of which reflect close social and economic connections between the urban core area and the periphery [10,11,12]. From the administrative dimension, a city is defined on the basis of the boundary range of an urban administrative jurisdiction as stipulated by the national administrative division management system. In sum, these three dimensions have different goals and connotations when defining cities.
Many developed countries such as Western Europe, North America, and Japan have formed detailed standards and constantly updated methods for defining cities from the morphological and functional dimensions. However, in China, cities are strictly defined administratively with different levels, and mismatches can be observed between the administrative definition and spatial dimension of the cities (i.e., the actual scope of urban functional activities) [7,13]. Administrative space adjustments (especially the annexation of counties by cities) are also often conducted ahead of time given China’s planning for growth [14,15]. In addition, urban statistics in China are tied to administrative regions, leading to inaccurate and ambiguous indicators, such as urban, population, and spatial scales. Therefore, some Chinese scholars have suggested that the government should define the concept of urban area from the morphology dimension [16].
The Ministry of Natural Resources has recently issued the “Standard for Delineating Urban Areas (draft for soliciting opinions),” which suggests that “in the past, there was no consensus on the definition and ways of defining an urban area, which led to the emergence of many different dimensions for urban–rural division in the National Bureau of Statistics, the Ministry of Housing and Urban Rural Development, local government departments, and within these departments. In addition, on the basis of urban areas, the analyses and discussions on the issues of urban expansion and contraction, urban development intensity, and driving forces of development have also produced different conclusions, thereby introducing uncertainty to the compilation and implementation of territorial spatial planning. Therefore, how to unify our urban area division method and standardize our statistical caliber has become a challenge” [17,18].
Although the Ministry of Natural Resources issued the “Standard for Delineating Urban Areas” as a detailed method for urban scope division, regardless of its effects or successful implementation, this policy requires years-to-decades worth of effort and a large amount of labor and financial resources. Moreover, cities are continuously expanding and their scope is ever changing, so they cannot be easily adjusted in time according to this policy.
This study aims to develop a new model for urban division instead of relying on the traditional national administrative division management system, so that highly accurate comparisons of China’s cities can be conducted, especially the large ones, with other major cities around the world. This study takes Guangzhou–Foshan, a typical cross-boundary city in the Pearl River Delta (PRD), as an empirical case. A model that delineates the urban areas of this city based on NPP/VIIRS nighttime light and point of interest (POI) data is also developed. The results are compared with Beijing and Shanghai. Beijing, Shanghai, and Guangzhou are among the largest and most economically powerful cities in China, so they have been examined in many comparative studies. However, most of these comparisons are based on official statistics for a specific jurisdiction. They view Guangzhou as an independent city and posit that its urban scale (especially its spatial and population scales) is smaller than that of Beijing and Shanghai, thereby hindering researchers from understanding the city itself. This study attempts to overcome these limitations by comparing the urban areas of the aforementioned cities.
2. Literature Review
A large number of studies have been conducted on delineating urban areas, and this topic has long been examined by urban scholars and government officials in Western Europe, North America, and Japan. A long-standing concern in the literature has been to provide a rigorous definition of urban or metropolitan areas, first relying on a notion of central places, then on integrated local labor markets [19,20], continuous development [21], or various forms of spatial interactions measured, particularly land prices [22]. A second concern in the literature has been to develop robust approaches with minimal data requirements so that urban areas can be delineated in a comparable manner over several countries [23]. Scholars have also classified the literature into two categories: bottom-up and top-down approaches [24,25]. The bottom-up approach is based on a scaling analysis of road networks, urban blocks, and buildings and a clustering technique of roads networks, urban construction modes, and urban population [26,27]. The top-down approach is based on population density and applications of remote sensing [28,29]. With the development of technology, various types of data indicators and measurement models have been used in the literature. However, an international consensus in a practical application has yet to be reached.
In practical application, many developed countries have formed a clear definition standard, and the scale of the definition is becoming increasingly refined. The standards and methods for dividing urban areas in the United States have evolved since the 1880s from the use of the threshold method of single population density to the use of composite factors to analyze fine urban physical boundaries. The employed indicators include population size, road infrastructure, land use, the number of residential units, and the range of urbanized areas and urban clusters is divided on the basis of the comprehensive criteria of the aforementioned indicators [30,31]. In Japan, urban units with a population density of more than 4000 people per km2 and a population size of more than 5000 people are divided into “densely inhabited districts” [25,32]. Countries in the European Union divide city groups with a population density of 300 people per km2 and with a population size of more than 5000 people by using unit grid data [33]. Given the variations in the economic and social environment of their cities, Denmark and Sweden adopt various division standards and define cities as areas with an urban population scale of 200 people, whereas the Netherlands defines cities as areas with a population size of up to 2000 [30,31]. In sum, huge differences can be observed in the standards adopted by each country.
In China, the central government defines cities according to the recommendations of the National Administrative Management System [34,35]. A city defined from the administrative dimension matches the statistical data published in various city statistical yearbooks and other census data published by the government. As such, Chinese scholars have mainly examined the concept of cities in the administrative sense. However, this definition does not truly reflect the actual activities of urban residents or the geographical scope of the urban functional landscape. Accordingly, urban researchers have defined cities from many aspects. The research on defining cities from the morphological dimension in China has roughly gone through the following stages:
(1) After Yixing Zhou introduced the concept of China’s urban area in 1986, several scholars performed extensive exploratory work on this topic. Apart from applying concrete methods for delineating urban areas, the minimum thresholds for population scale, the proportion of non-agricultural employment, and population density collected from statistical yearbooks and censuses were also used to establish an urban area demarcation standard [16,36,37]. However, given the limited data sources during this period, urban areas were only mapped based on low-resolution data for county/district administrative units.
(2) With the gradual penetration and popularization of GIS technology in other disciplines starting from 2000, researchers began to utilize remote sensing image and nighttime light data and proposed a variety of algorithms or models [38,39,40]. Two main research paths were observed during this period. On the one hand, the land use status of a city and its surrounding areas was extracted followed by a calculation of different landscape indexes, based on which the urban areas of a city were defined. On the other hand, urban areas were demarcated according to the employment types and social and economic activities of the urban and rural population or the spatial connection and interaction among urban elements. Compared with the previous stage, the accuracy of urban area identification was greatly improved during this period by using remote sensing images and nighttime light data in the analysis. However, many of the composite models proposed during this period were too complex to be generalized. Specifically, the empirical models developed in one city were often unable to collect the same data from other cities, thereby introducing difficulties in comparing cities based on the same benchmark.
(3) The rapid development of IT, including the Internet, the Internet of Things, cloud computing, and the integration of these three networks, in 2010 ushered in the “Big Data” era, during which the proliferation of data posed both a challenge and an opportunity for many industries [41]. These data allowed researchers to easily identify urban areas. The open-access big data that emerged during this period made up for the low-resolution data that were widely used in the previous periods. The scale of research units was refined, thus allowing researchers to measure their objects based on the activities of urban residents, which have a fundamental influence on urban areas. Several methods for dividing urban–rural boundaries were also developed on the basis of POI data [34,42], MicroBlog check-in data [43], and road network data [5,44].
Only a few studies have attempted to identify urban areas in China. Previous studies have been mostly conducted on the national and regional scales (e.g., the Beijing–Tianjin–Hebei region and the Yangtze River Delta) or on a single prefecture city. Cross-boundary cities are often ignored in these studies. In addition, defining urban areas on the basis of a single data type has certain limitations. For example, urban construction land identified on the basis of remote sensing data cannot represent the geographical scope of urban areas, especially in the PRD region given its high level of rural industrialization. Defining urban areas on the basis of nighttime light data also causes errors owing to the low spatial resolution and light spillover effect of the data [45,46]. Most of the available methods for determining urban areas either subjectively determine the boundary threshold on the basis of empirical values or construction land data published in statistical yearbooks. In terms of data quality, official statistical indicators at the community level are extremely insufficient for mapping the urban–rural boundary. Although mobile signaling data have high accuracy, this type of data cannot be easily obtained and is very expensive, thus blocking its wide application. To address these shortcomings and those mentioned above, this study combines nighttime light data with POI data and uses the breakpoint model to empirically investigate the cross-boundary city of Guangzhou–Foshan in hopes of developing a new and replicable method for defining urban areas and achieving a novel understanding of cross-boundary cities.
3. Data and Methods
3.1. Empirical Area Background
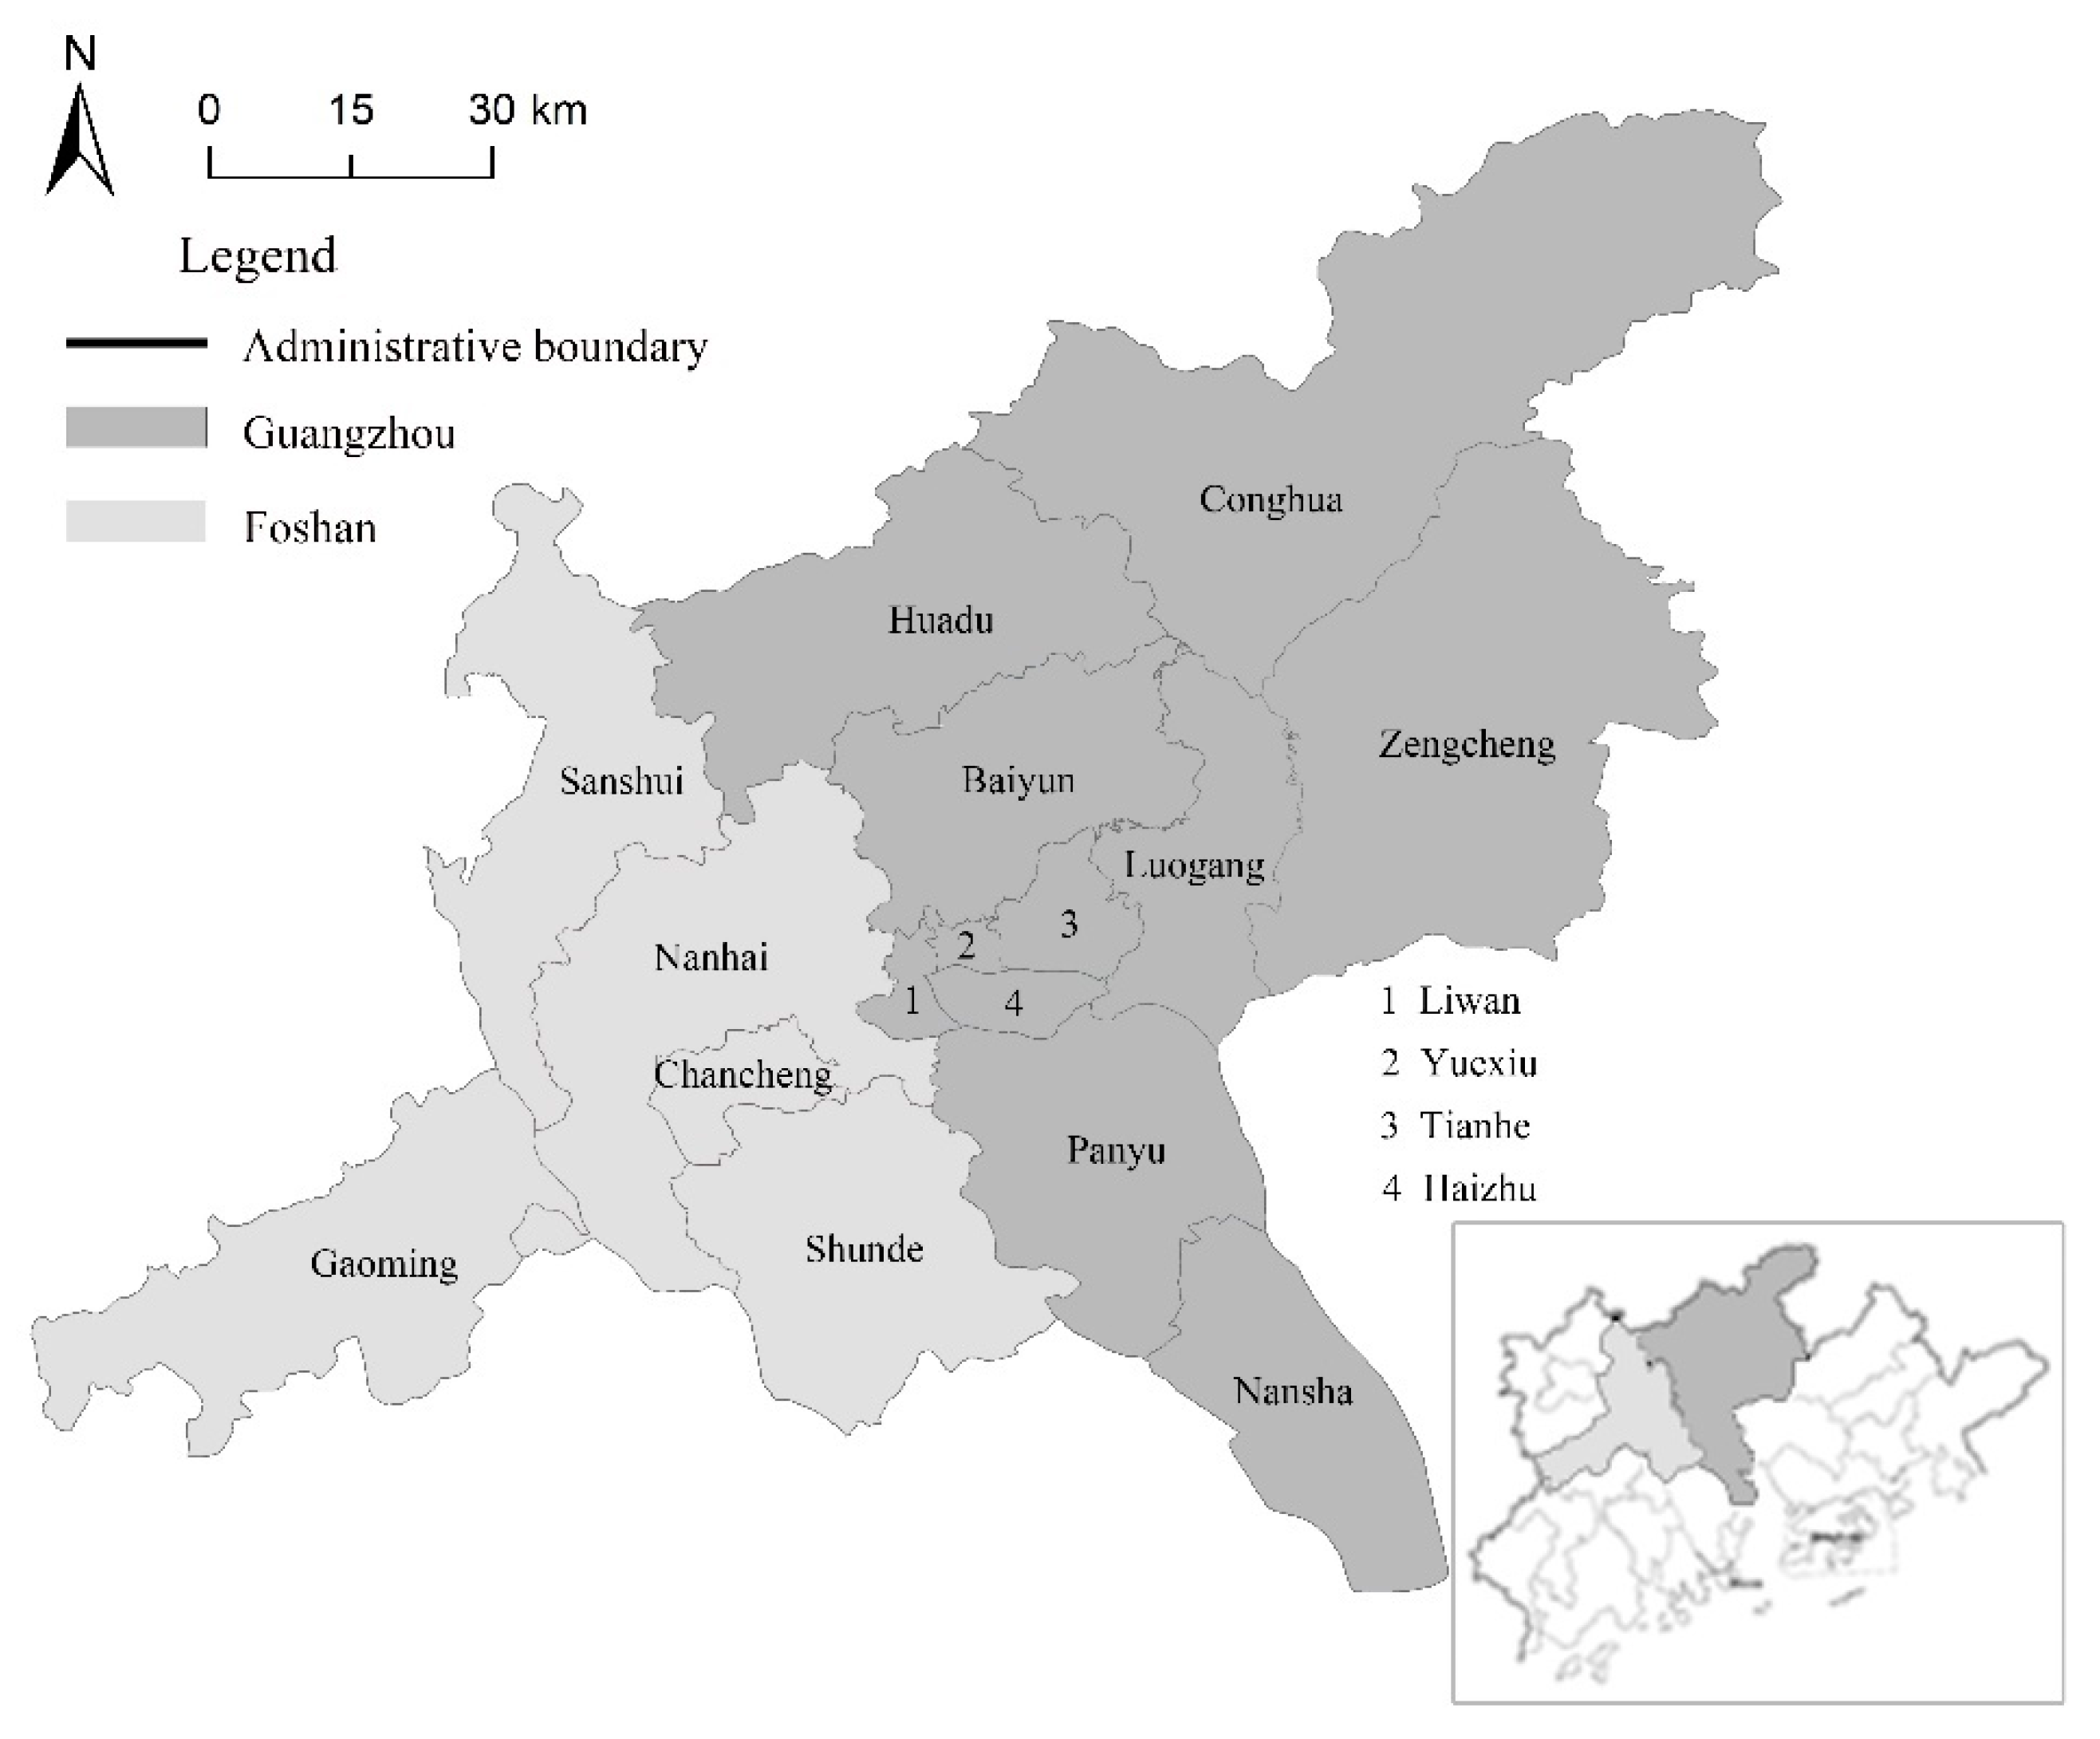
As shown in Figure 1, the prefecture-level cities of Guangzhou and Foshan are located at the core of the PRD. While the term PRD has long been used in history, the Greater Bay Area was officially introduced in the 13th Five-Year Plan (2016–2020) for the Economic and Social Development of China, which envisions a higher-level regional integration among Guangdong, Hong Kong, and Macao [47].
Since the reform and opening up, Guangzhou and Foshan underwent several adjustments in their administrative divisions. After the removal of several counties and the division of its districts in 2014, Guangzhou currently has 11 municipal districts. Meanwhile, after the adjustment of its administrative divisions by the end of 2002, Foshan currently has five municipal districts. These cities have a total area of 11,232.12 km2.
Guangzhou and Foshan have always been the core areas of the PRD impact plain that are located in a physical geographical unit connected by the same river network system. The socio-economic ties between these cities were gradually strengthened through the inland river navigation function of the river network system. During the Ming and Qing dynasties, Guangzhou was developed into a famous port city in China by virtue of its “one-line trade” policy advantage, whereas Foshan was developed into a manufacturing and inland port town due to its proximity to Guangzhou and its inland river shipping advantages. These cities already belonged to the same economic and geographical network during those periods, and the relationship between their towns was constantly adjusted throughout the years.
After the founding of the People’s Republic in 1949, the economic exchange between Guangzhou and Foshan came to a standstill because of the highly centralized planned economy proposed by the government. However, after the reform and opening up, the state gave up its planned economy, repositioned the relationship between central and local governments, decentralized its economic development initiative level by level, and encouraged competitions among local governments to kick-start the economic development of the entire country. On the one hand, this decentralized competition promoted the rapid economic development and urbanization of Guangzhou and Foshan. On the other hand, both the decentralized competition and urban management resulted in the formation of an administrative economy and vicious competitions among and within cities to attract investment, especially foreign capital.
With the advent of globalization and the information age, economic and social activities are being carried out and reconstructed on the global, regional, and local scales, and the competitive advantages of a single country or city are no longer in effect. Regions, especially the regional space across different administrative units, play an increasingly important role in the global competition and have become important spatial carriers of a new regional division of labor [48,49]. The Guangdong–Hong Kong–Macao Greater Bay Area is one of the most important starting points for China to implement its regional strategy, embed an international division of labor, and participate in international competition. The central cities of Guangzhou and Foshan were mentioned in several planning documents that aim to promote their integrated development and to drive the integration of the whole region.
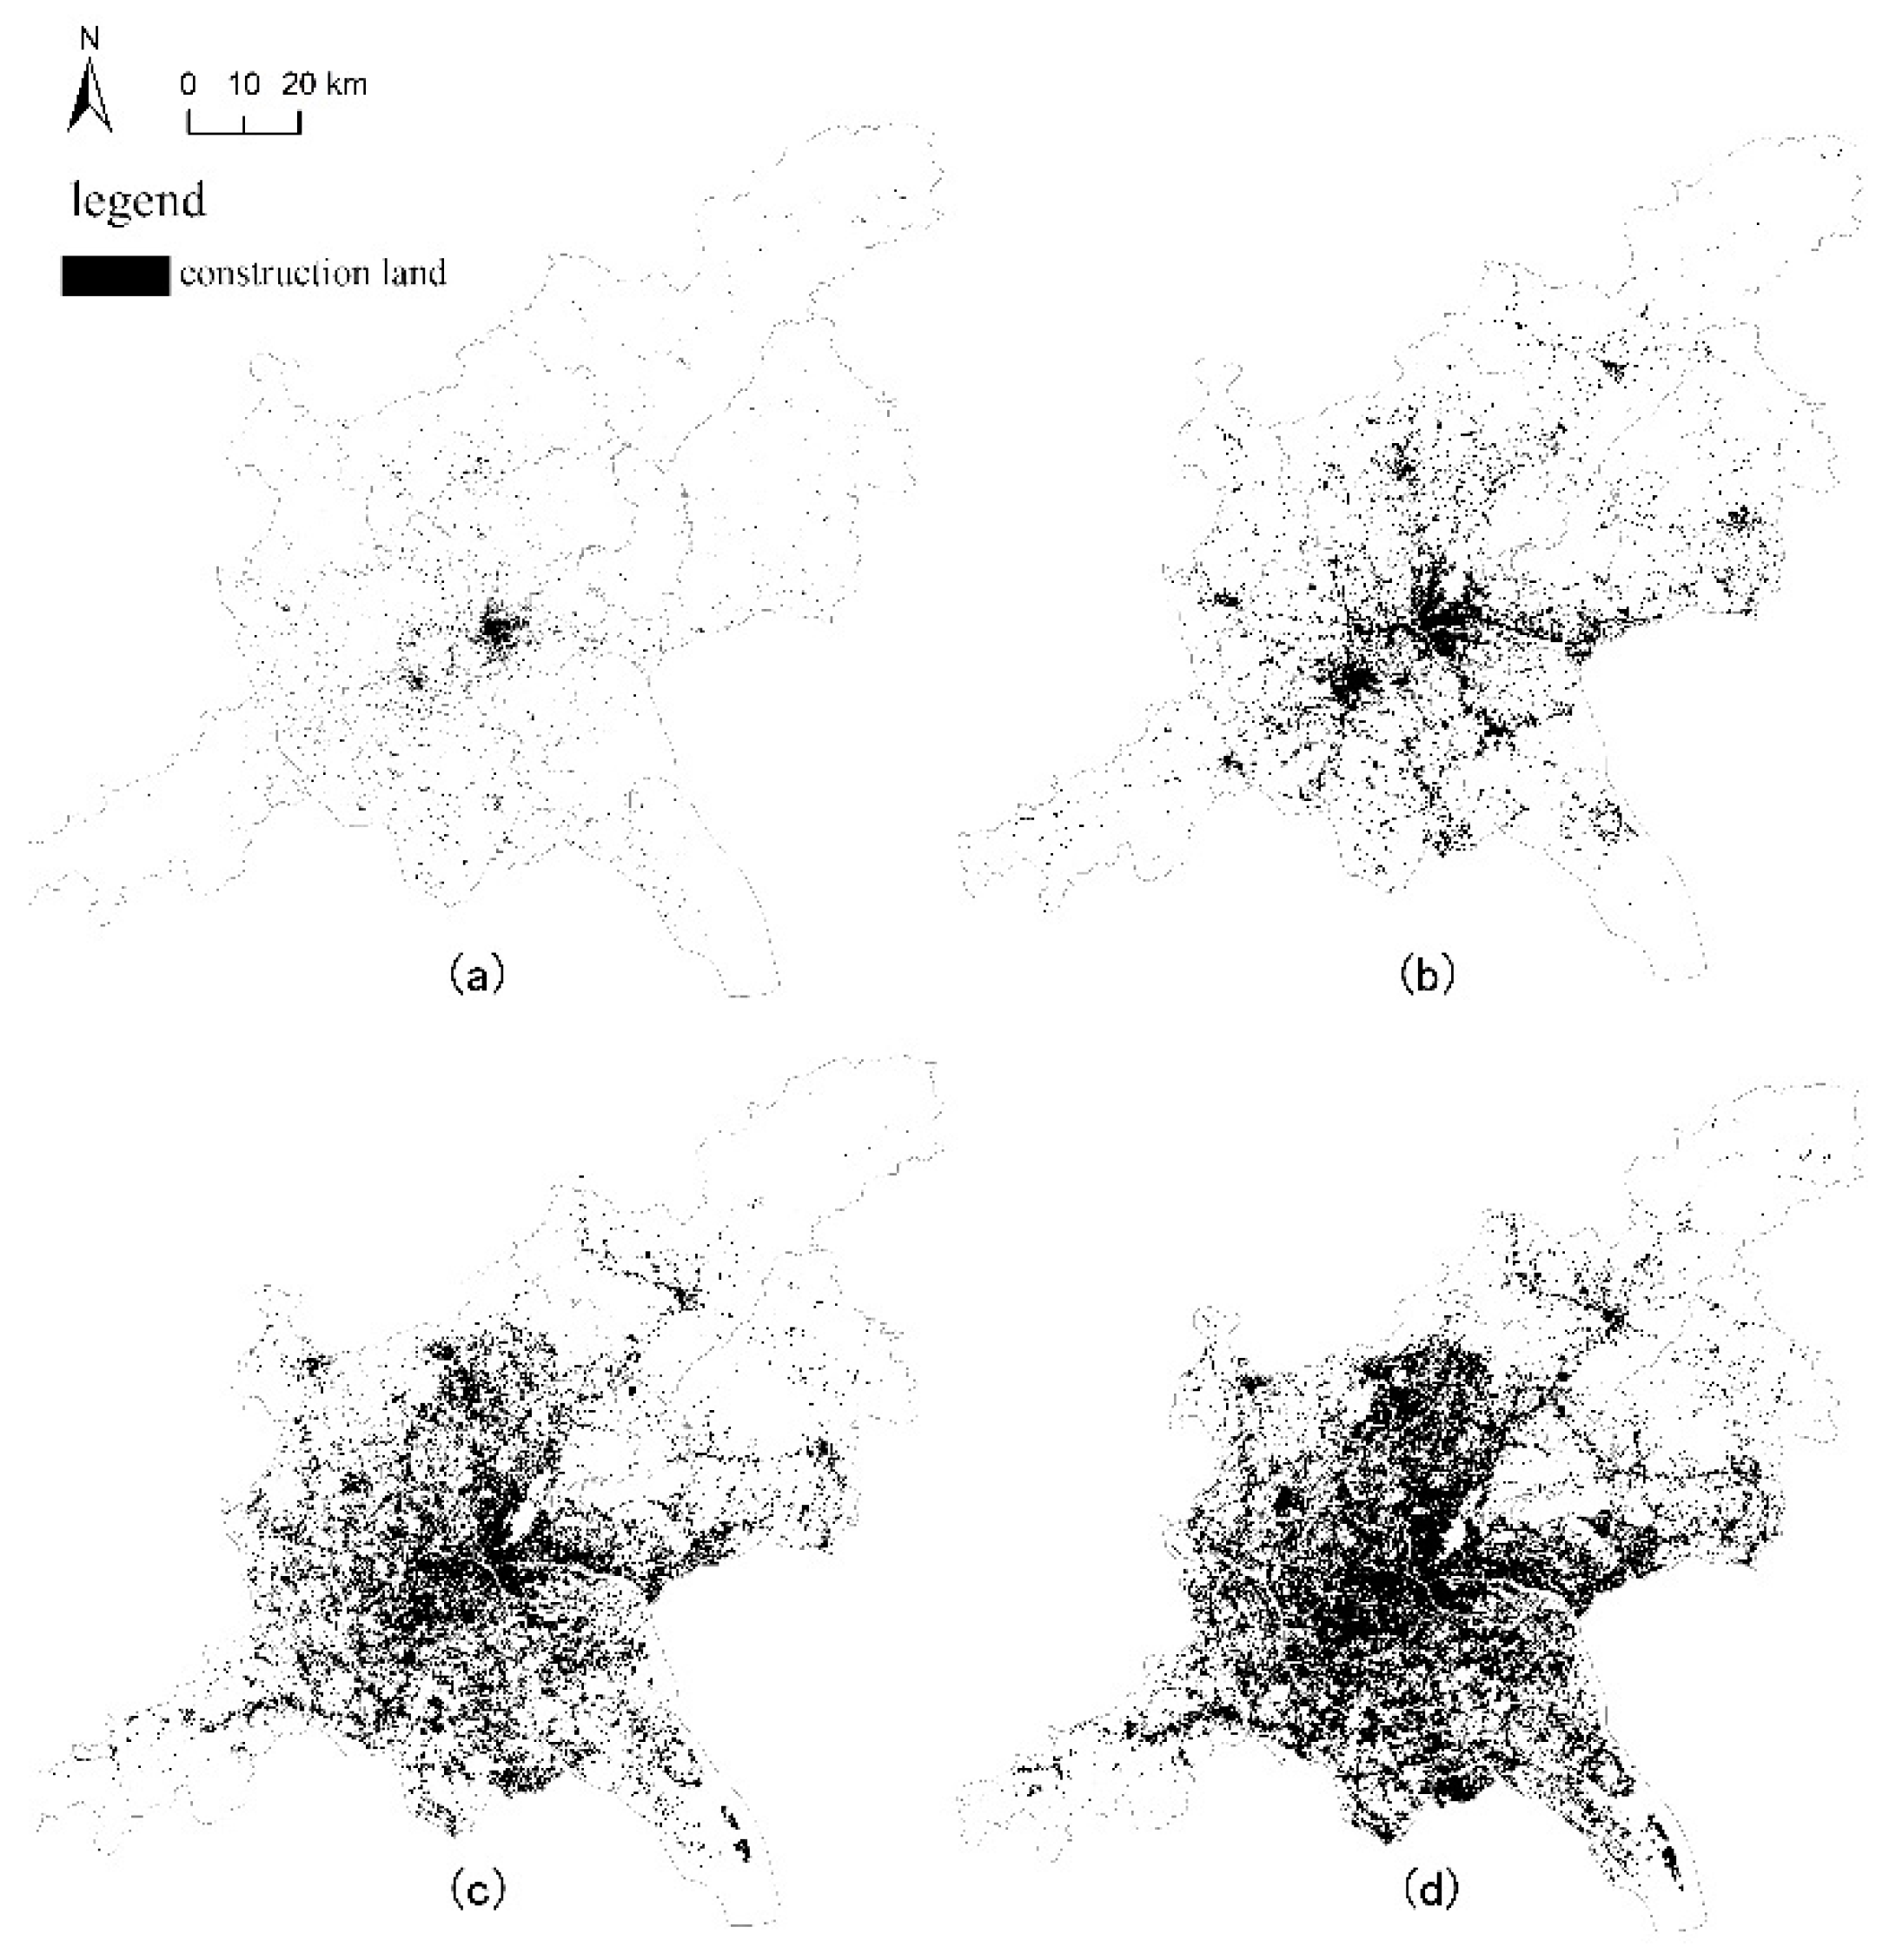
Although Guangzhou and Foshan are two different cities in the administrative sense, their built-up areas have merged into one. Remote sensing images of Guangzhou and Foshan taken in 1987, 1997, 2007, and 2017 (Figure 2) show that in 1987, their urban forms were still two relatively independent clusters, and their urban built-up areas only covered Guangzhou and the old urban area of Foshan. Since the 1990s, the built-up areas has been expanding rapidly in circles and along the main traffic axis and the Pearl River. In addition, the construction land in Guangzhou and Foshan was continuously integrated from 2007. Therefore, many scholars refer to Guangzhou and Foshan as the Guangzhou–Foshan metropolitan area. This term will be used throughout the rest of this paper to refer to both Guangzhou and Foshan.
3.2. Data Sources
This study aims to map the urban area boundary of the Guangzhou–Foshan city region by using open-access data, which mainly includes urban POI data taken in 2018, NPP/VIIRS nighttime light data taken in 2018, and the corresponding urban administrative district boundary data.
The POI classification system of Amap is divided into three levels and 12 categories, including catering, public facilities, companies, and enterprises with strong urban attributes, which were selected as the basic data for this research and were collected by running the application programming interface (API) provided in the Amap website (https://lbs.amap.com (accessed on 23 July 2018)). After cleaning the collected data, a total of 788,720 POI data for Guangzhou and Foshan were obtained. Table 1 shows the number and proportion of POI entries.
Nighttime light is emitted by satellite sensors on buildings, roads, and vehicles at nighttime. This type of data is widely used in extracting urban built-up areas. The NPP/VIIRS nighttime light data were collected from the US National Geophysical Data Center, which adopts the DNB band of the visible infrared imaging radiometer sensor (VIIRS) of the Suomi NPP satellite. This band is highly sensitive to weak light within the band range and is widely used in monitoring human activities at night. VIIRS nighttime light data have a more detailed spatial resolution (500 m) compared with DMSP/OLS nighttime light data. The NPP/VIIRS nighttime light images for 2018 used in this article were collected from the American National Geophysical Data Center (https://www.ngdc.noaa.gov/eog/viirs.html (accessed on 4 September 2020)) and have a spatial resolution of 500 m. Meanwhile, the NPP/VIIRS annual average image was obtained by calculating the integer of average image brightness from January to December 2018. The effects of cloud, fire, and other atmospheric light were also removed, and those areas without light were assigned a value of zero after radiation correction.
The administrative district boundaries of Guangzhou, Foshan, Beijing, and Shanghai were also downloaded by running the API provided on the Amap website.
3.3. Technical Route and Research Methods
3.3.1. Technical Route
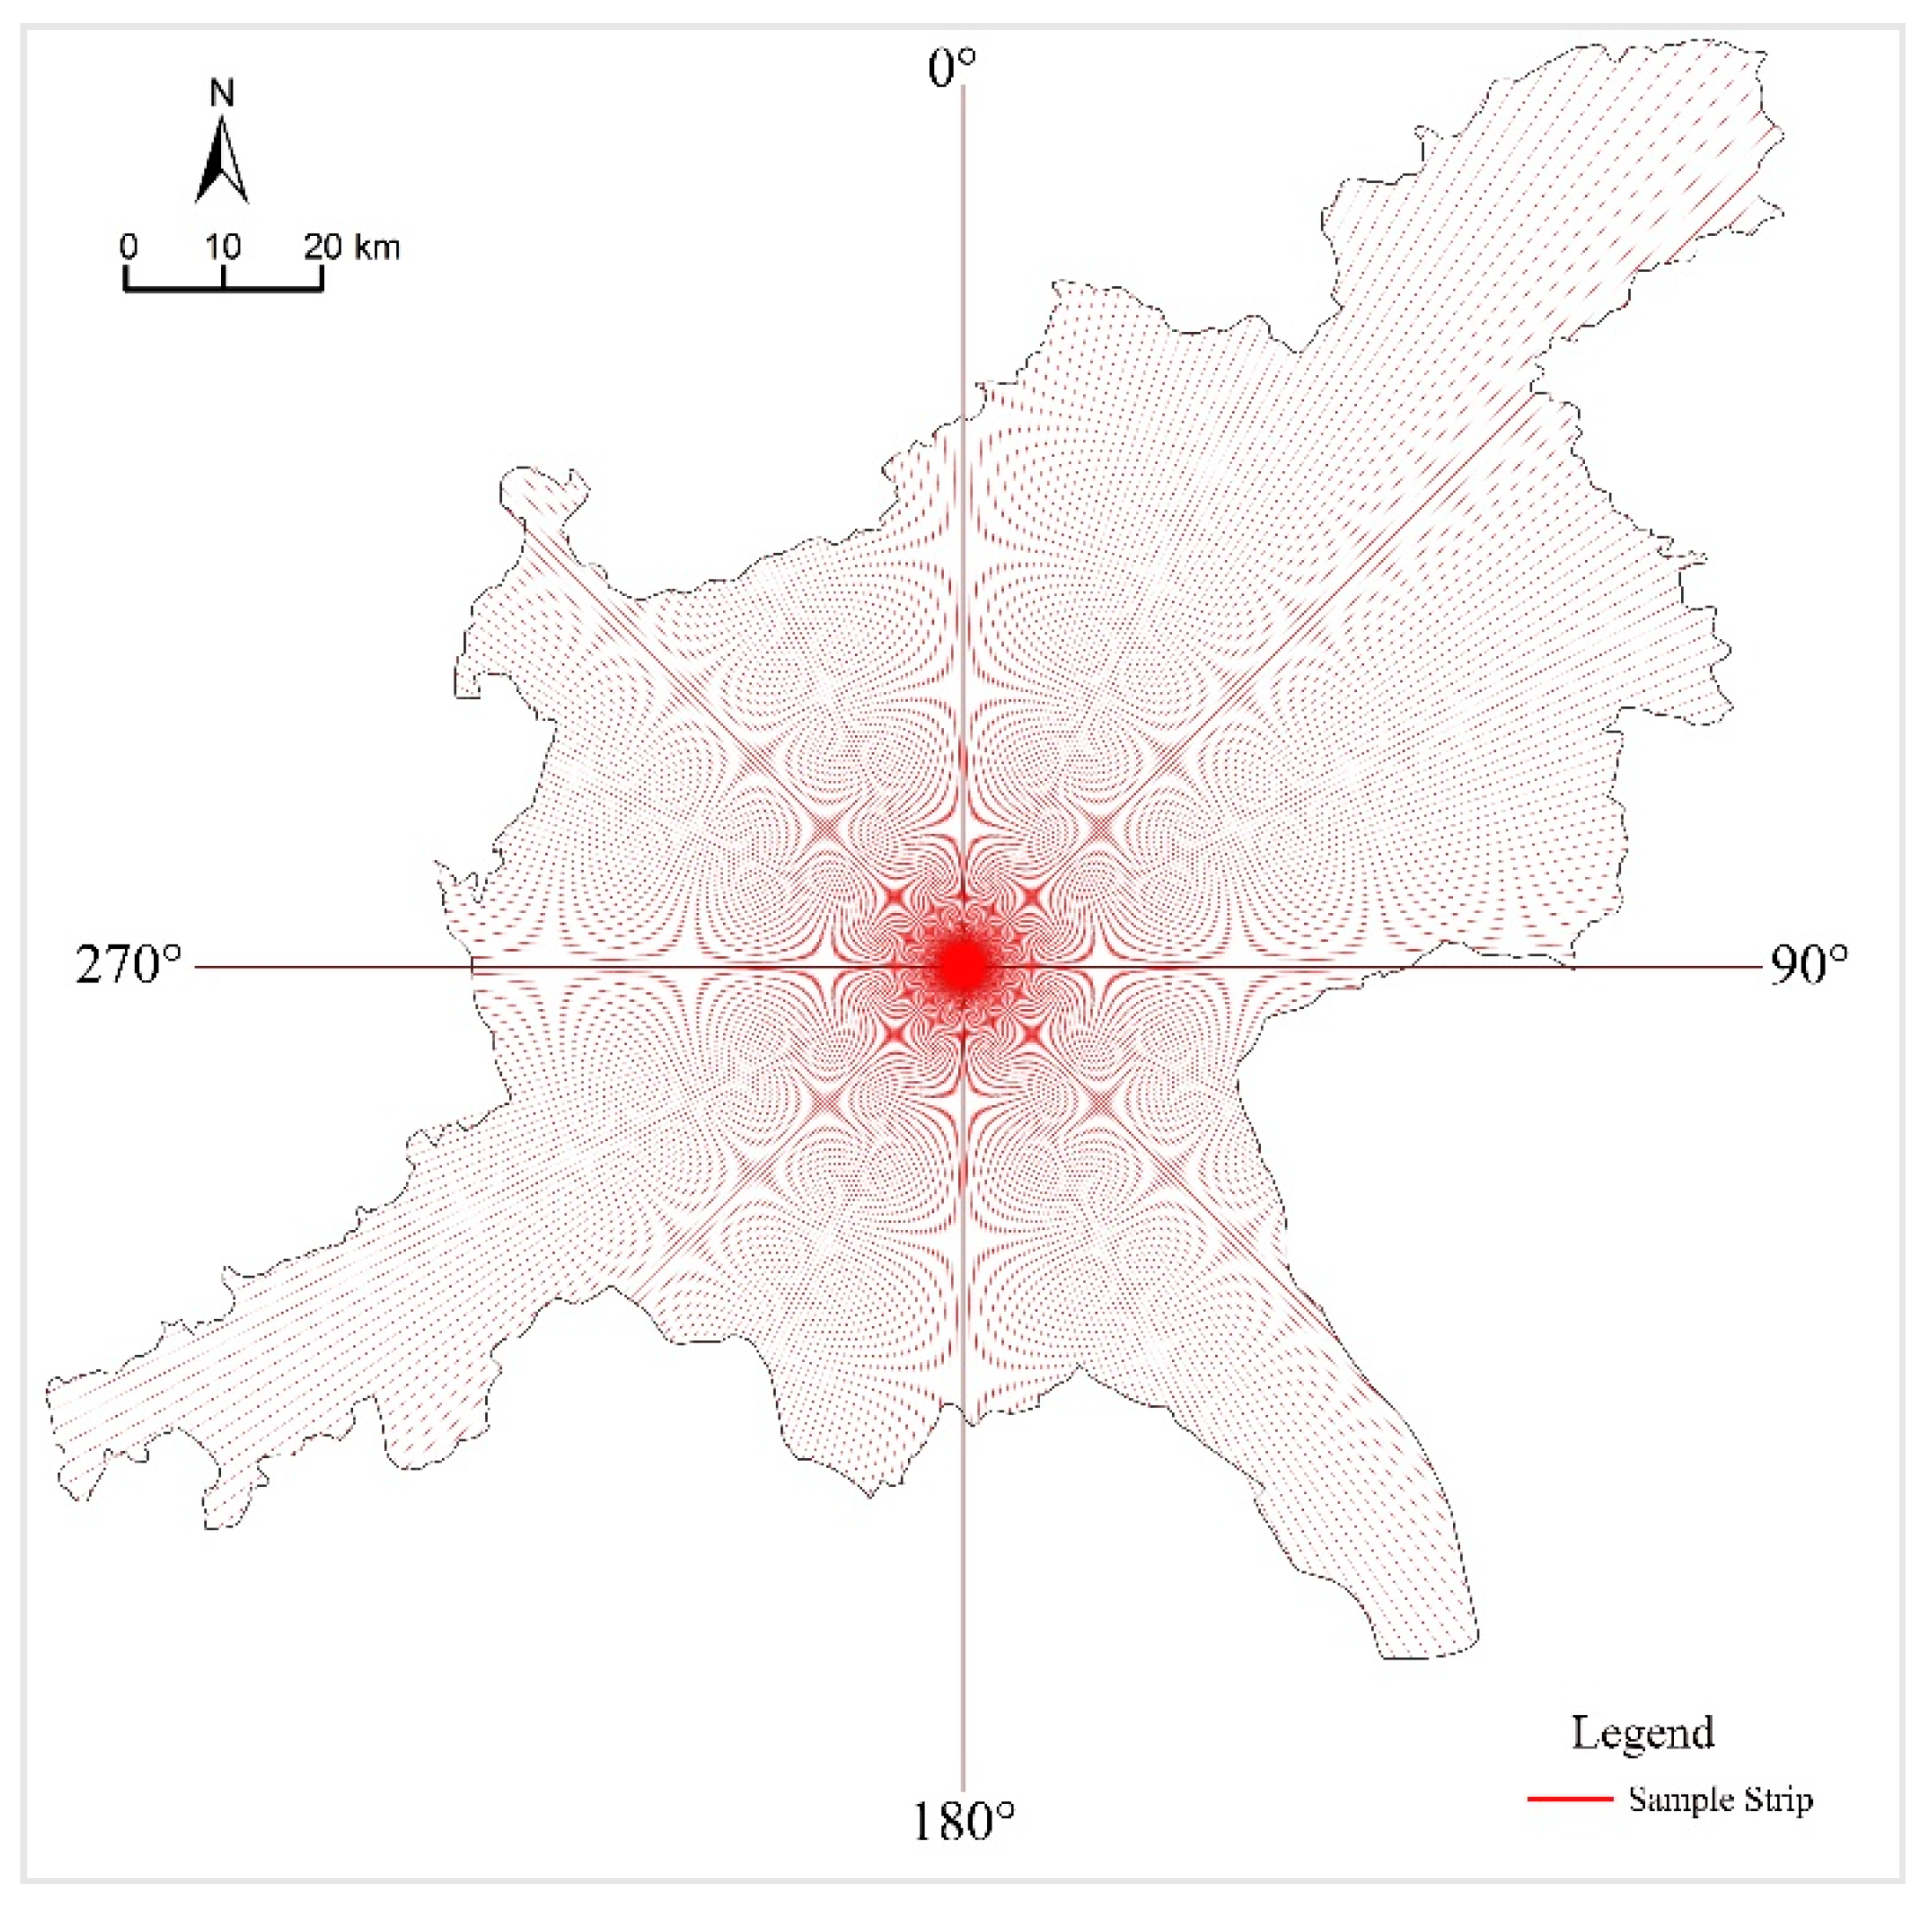
The empirical framework for delineating urban areas based on POI and DMSP/OLS nighttime light data involves four steps (see Figure 3). In the first step, the cleaned POI and NPP/VIIRS nighttime light data were divided according to city administrative boundaries and were integrated by using the mean value method to generate a new POI and NPP index core density map. In the second step, the area to be measured was divided into 360 splines at a 1° interval from the city center, and sampling points were set at 500 m intervals from the direction of no spline from the city center to the edge (see Figure 4). The constructed POI and NPP index values were assigned to each sampling point. In the third step, given that the POI and NPP index (which reflects urban density) gradually decreased from the urban core area to the urban fringe area and then to the rural area, the breakpoint model was used to find out the two breakpoints among these three areas and to connect the adjacent breakpoints into a line. In the fourth step, the area where the lines were aligned was evaluated, and the space units with a spatial discontinuity area of less than 10 km2 were removed to obtain the final result. The key steps are described in the following sections.
3.3.2. Methods
- (1)
- Kernel Density Estimation (KDE) of Urban POI Data
To convert urban POI data into the spatial density values needed to extract urban boundaries, the highly intuitive and smooth KDE method was used for the analysis. KDE explores the spatial variations in event intensity while taking into account the locational effects in the first law of geography and assigns weights to a location based on its distance from the center. KDE is among the most popular methods for measuring the variation of points from the mean [50]. This approach estimates the density at each location as the average value within the surrounding spatial window by weighing the nearby objects based on a kernel function. KDE in Euclidean distance is defined by [51]:
where represents the kernel density of the research point i, is the weight value of the research point j, is the distance between the spatial point i and research object j, r is the bandwidth, and n is the number of the research object j within the range of bandwidth r. The weight value of the research point j is the same as that in the range of bandwidth r. After repeated experiments, the bandwidth was set to 4000 m for analysis. Under this condition, the urban POI density shows good applicability and can be used to investigate the urban area boundary.
- (2)
- Constructing a Composite Urban Density Index Using POI and DMSP/OLS Nighttime Light Data
As mentioned above, when delineating urban boundaries, using nighttime light data can introduce some problems, such as difficulties in the scientific processing of the light overflow effect and its low identification accuracy. By contrast, POI data have rich and accurate location and attribute information, and their density distribution in the boundary of urban built-up areas is abrupt [52], that is, the density of POI in urban built-up areas is significantly higher than that in the surrounding rural areas and suburbs, and the boundary of built-up areas can be accurately obtained by following this law. This advantage can make up for the low resolution and light overflow effect of nighttime light data. The inherent stability and effective performance of POI data can also eliminate the influence of some transient light noise and further improve the accuracy of extracting built-up areas. Therefore, following previous studies, this paper adopts the “average value method” to synthesize the POI and nighttime light data and constructs a new composite index to accurately map the urban boundary.
The geometric mean in the “mean value method” is used to fuse the POI and nighttime light data for three reasons. First, the difference between the brightness value of nighttime light data and the estimated density value of POI data has a high order of magnitude, and the geometric mean can eliminate the impact of such a difference, well integrate the advantages of these two types of data, and remove the temporary noise in nighttime light data. In the nighttime light data, those pixels with transient noise are usually surrounded by points of no interest. The POI kernel density value of these points is zero, whereas its composite index is zero, thereby eliminating the influence of these points on the results. This approach can also reduce the inaccuracies in the results, such as building roads and railways outside the area. The geometric mean is also less affected by extreme values and can correct those points with abnormal light values. The composite index is computed as [52]:
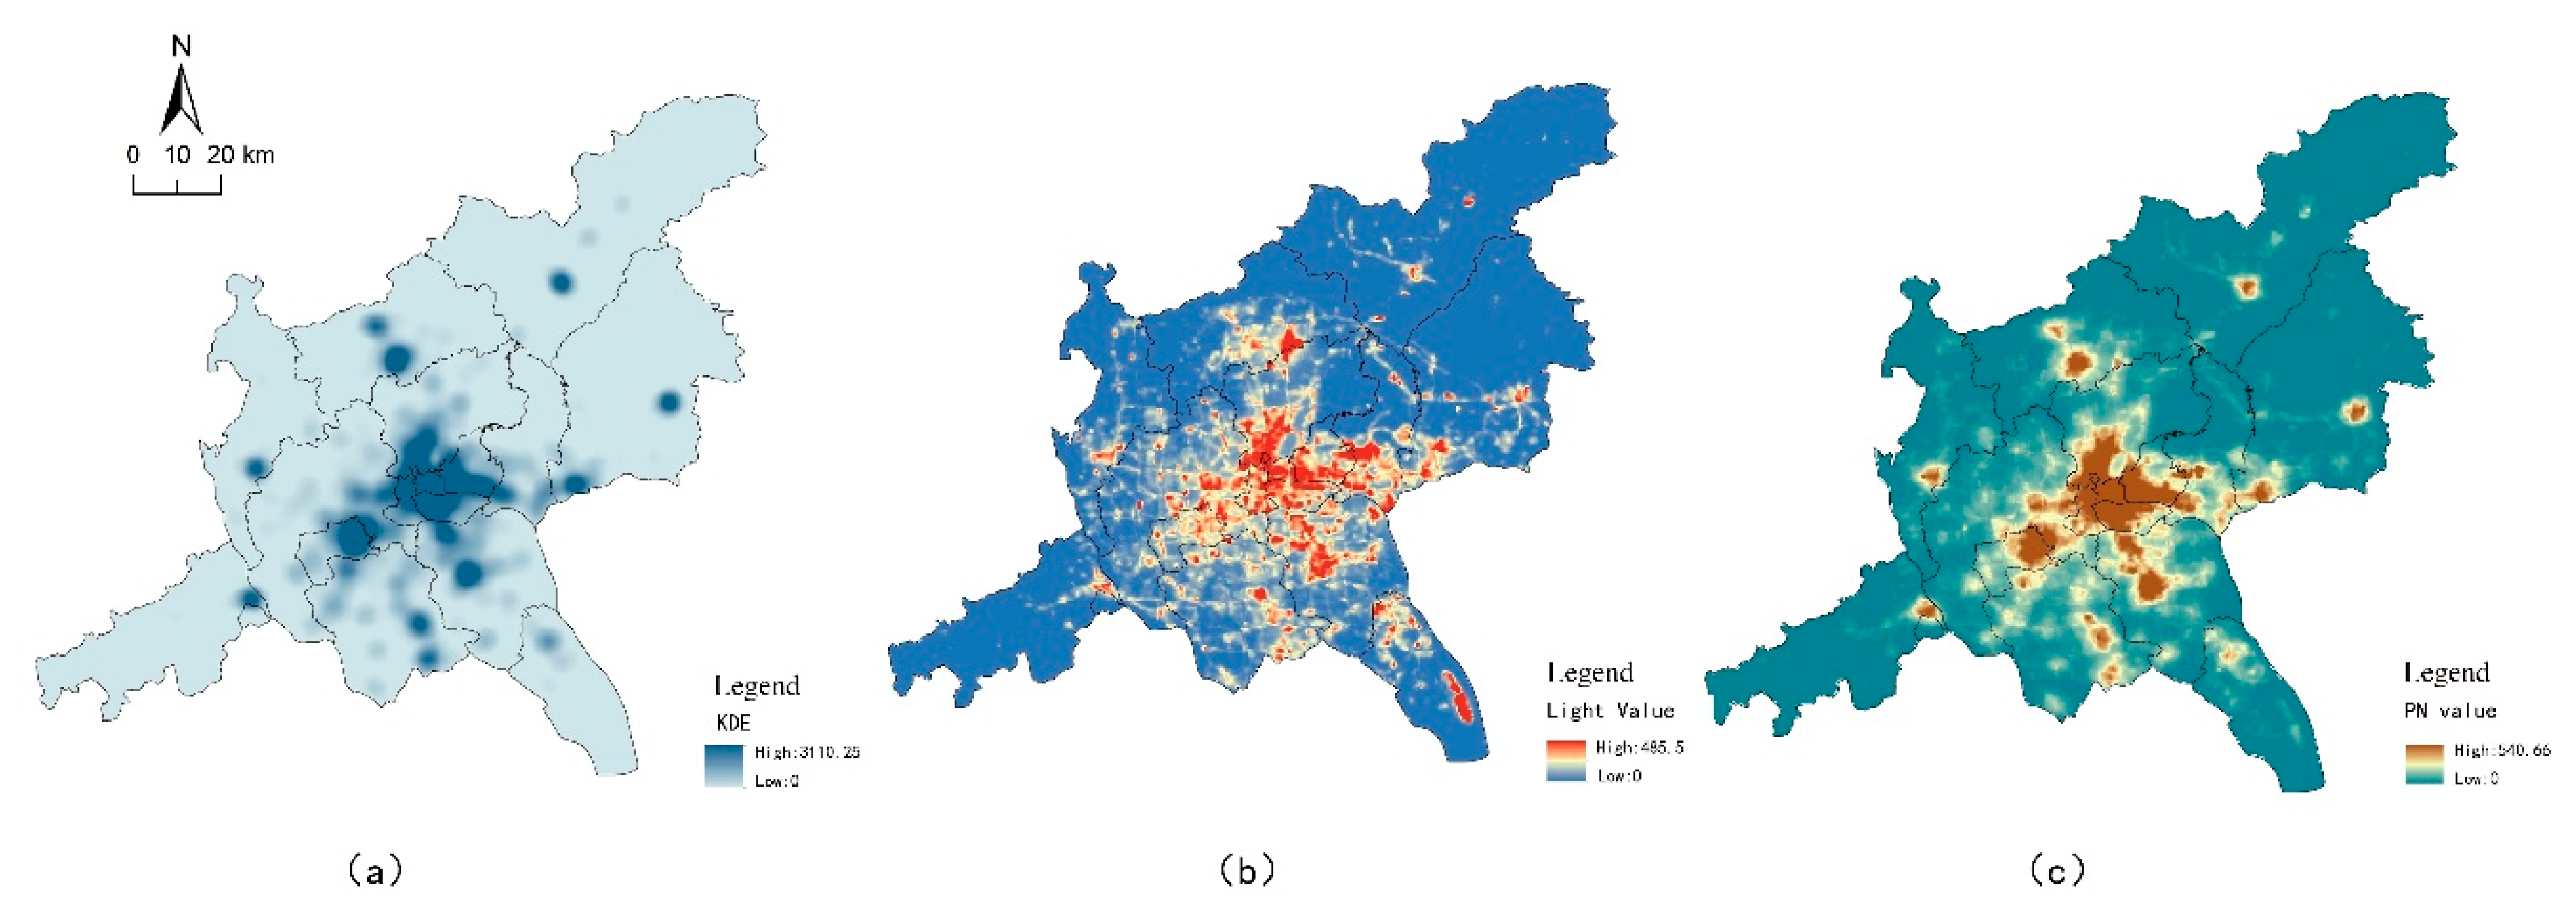
where PN is the composite index of the DMSP/OLS nighttime light data and POI data fused by using the mean value method, is the KDE value of POI at point i, and is the brightness value of DMSP/OLS nighttime light data at point i (Figure 5).
- (3)
- Dividing the Urban and Rural Boundary by Using the Breakpoint Model
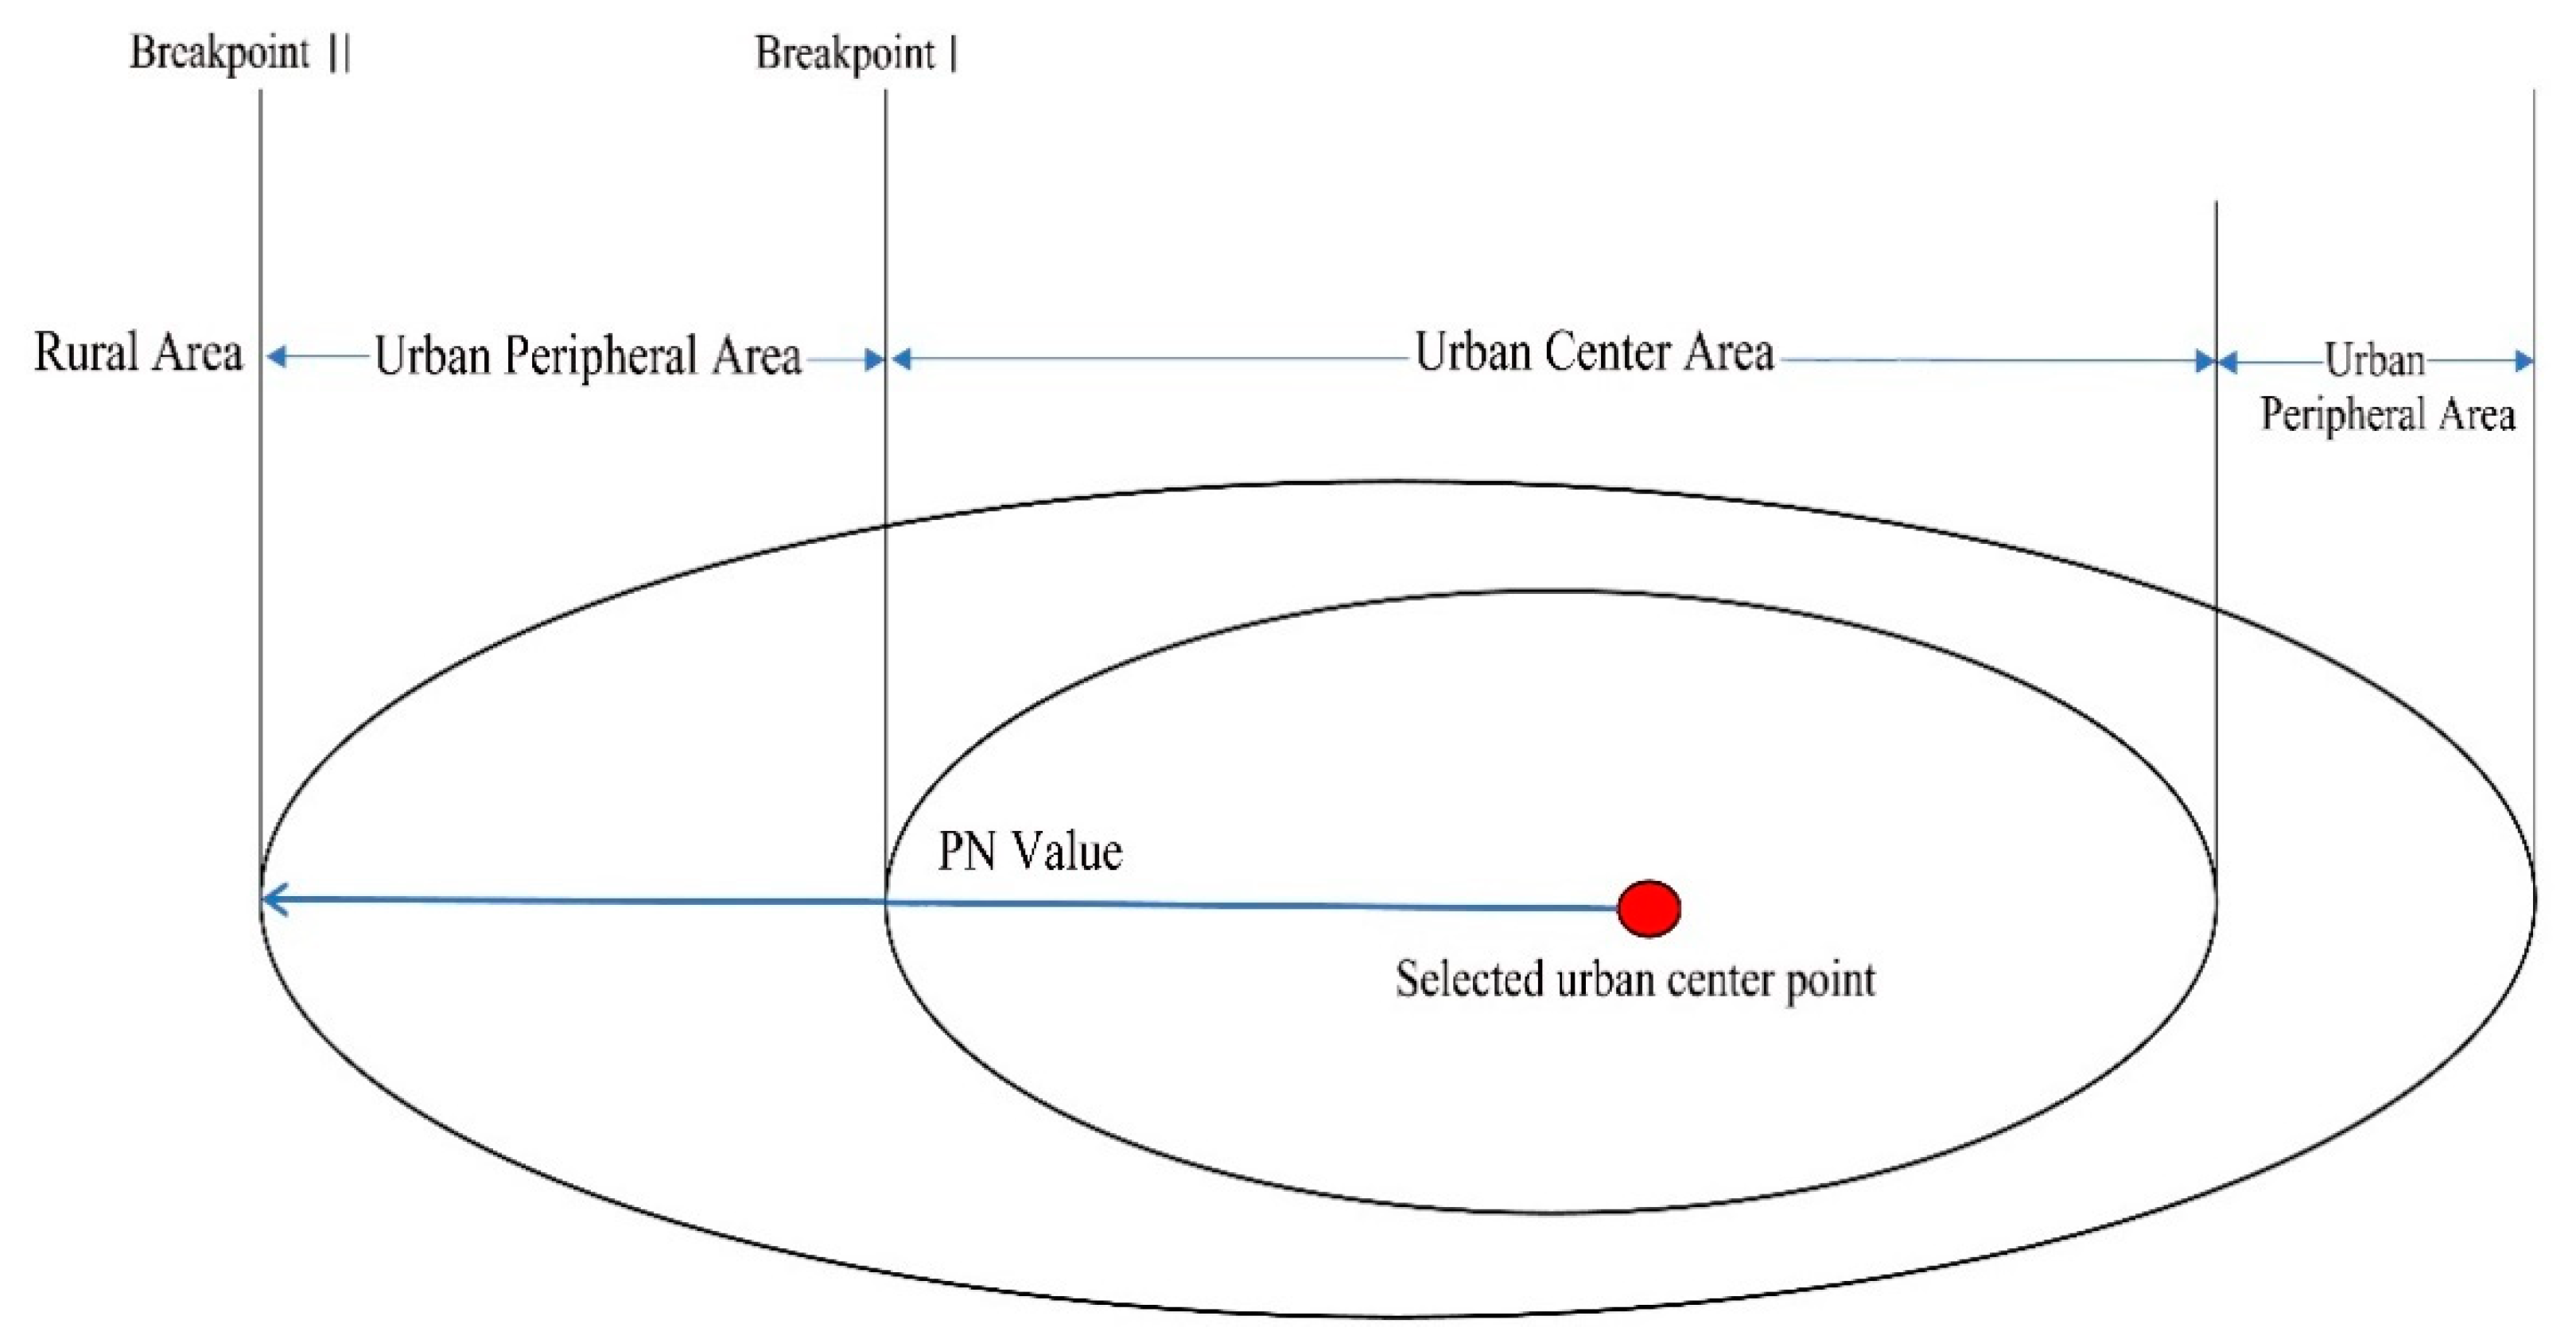
Based on the newly constructed PN composite index, the breakpoint model was used to divide the boundary between urban and rural areas and that between the urban core and urban fringe areas. Introduced by P.D.Converse on W.J. Reilly’s “Law of retail Gravity” in 1949, breakpoint theory examines the interaction between cities and regions [53]. This theory later attracted wide application in dividing the urban attraction scope, and its basic principle is to take the maximum distance attenuation mutation value of the eigenvalue representing the spatial density as the segmentation point of different interfaces within the region [54,55]. Defining the urban boundary based on the breakpoint model follows a critical requirement, that is, the selected high-value eigenvalues should be concentrated in the urban core area, and the eigenvalues from the urban core area to the peripheral rural area should show a gradual downward trend. Empirical experience shows that the spatial distribution of urban POI density and nighttime light intensity satisfies this requirement. After repeated tests, the geographical distribution of the PN composite index satisfied the basic requirements of applying the breakpoint model. The following breaking point formula was used to calculate the catastrophe point of the PN value in each sample [56]:
where is the difference between the PN composite index of two adjacent points in the j sample strip, is the PN composite index of i point in the study strip, is the average of the PN composite index of all points in the sample strip, and is the distance attenuation mutation value of the PN composite index value of each study spline. After comparing the mutation values of 360 groups of samples, the outliers were removed, and the maximum value was obtained. The catastrophe point was identified as the breaking point. Two breakpoints were selected from each sample strip, namely, the breakpoint between the urban core and urban fringe areas and that between the urban fringe and countryside areas. These breakpoints were connected into lines to constitute the inner and outer boundaries of the city (Figure 6).
4. Results
4.1. Urban Areas of the Guangzhou–Foshan City Region
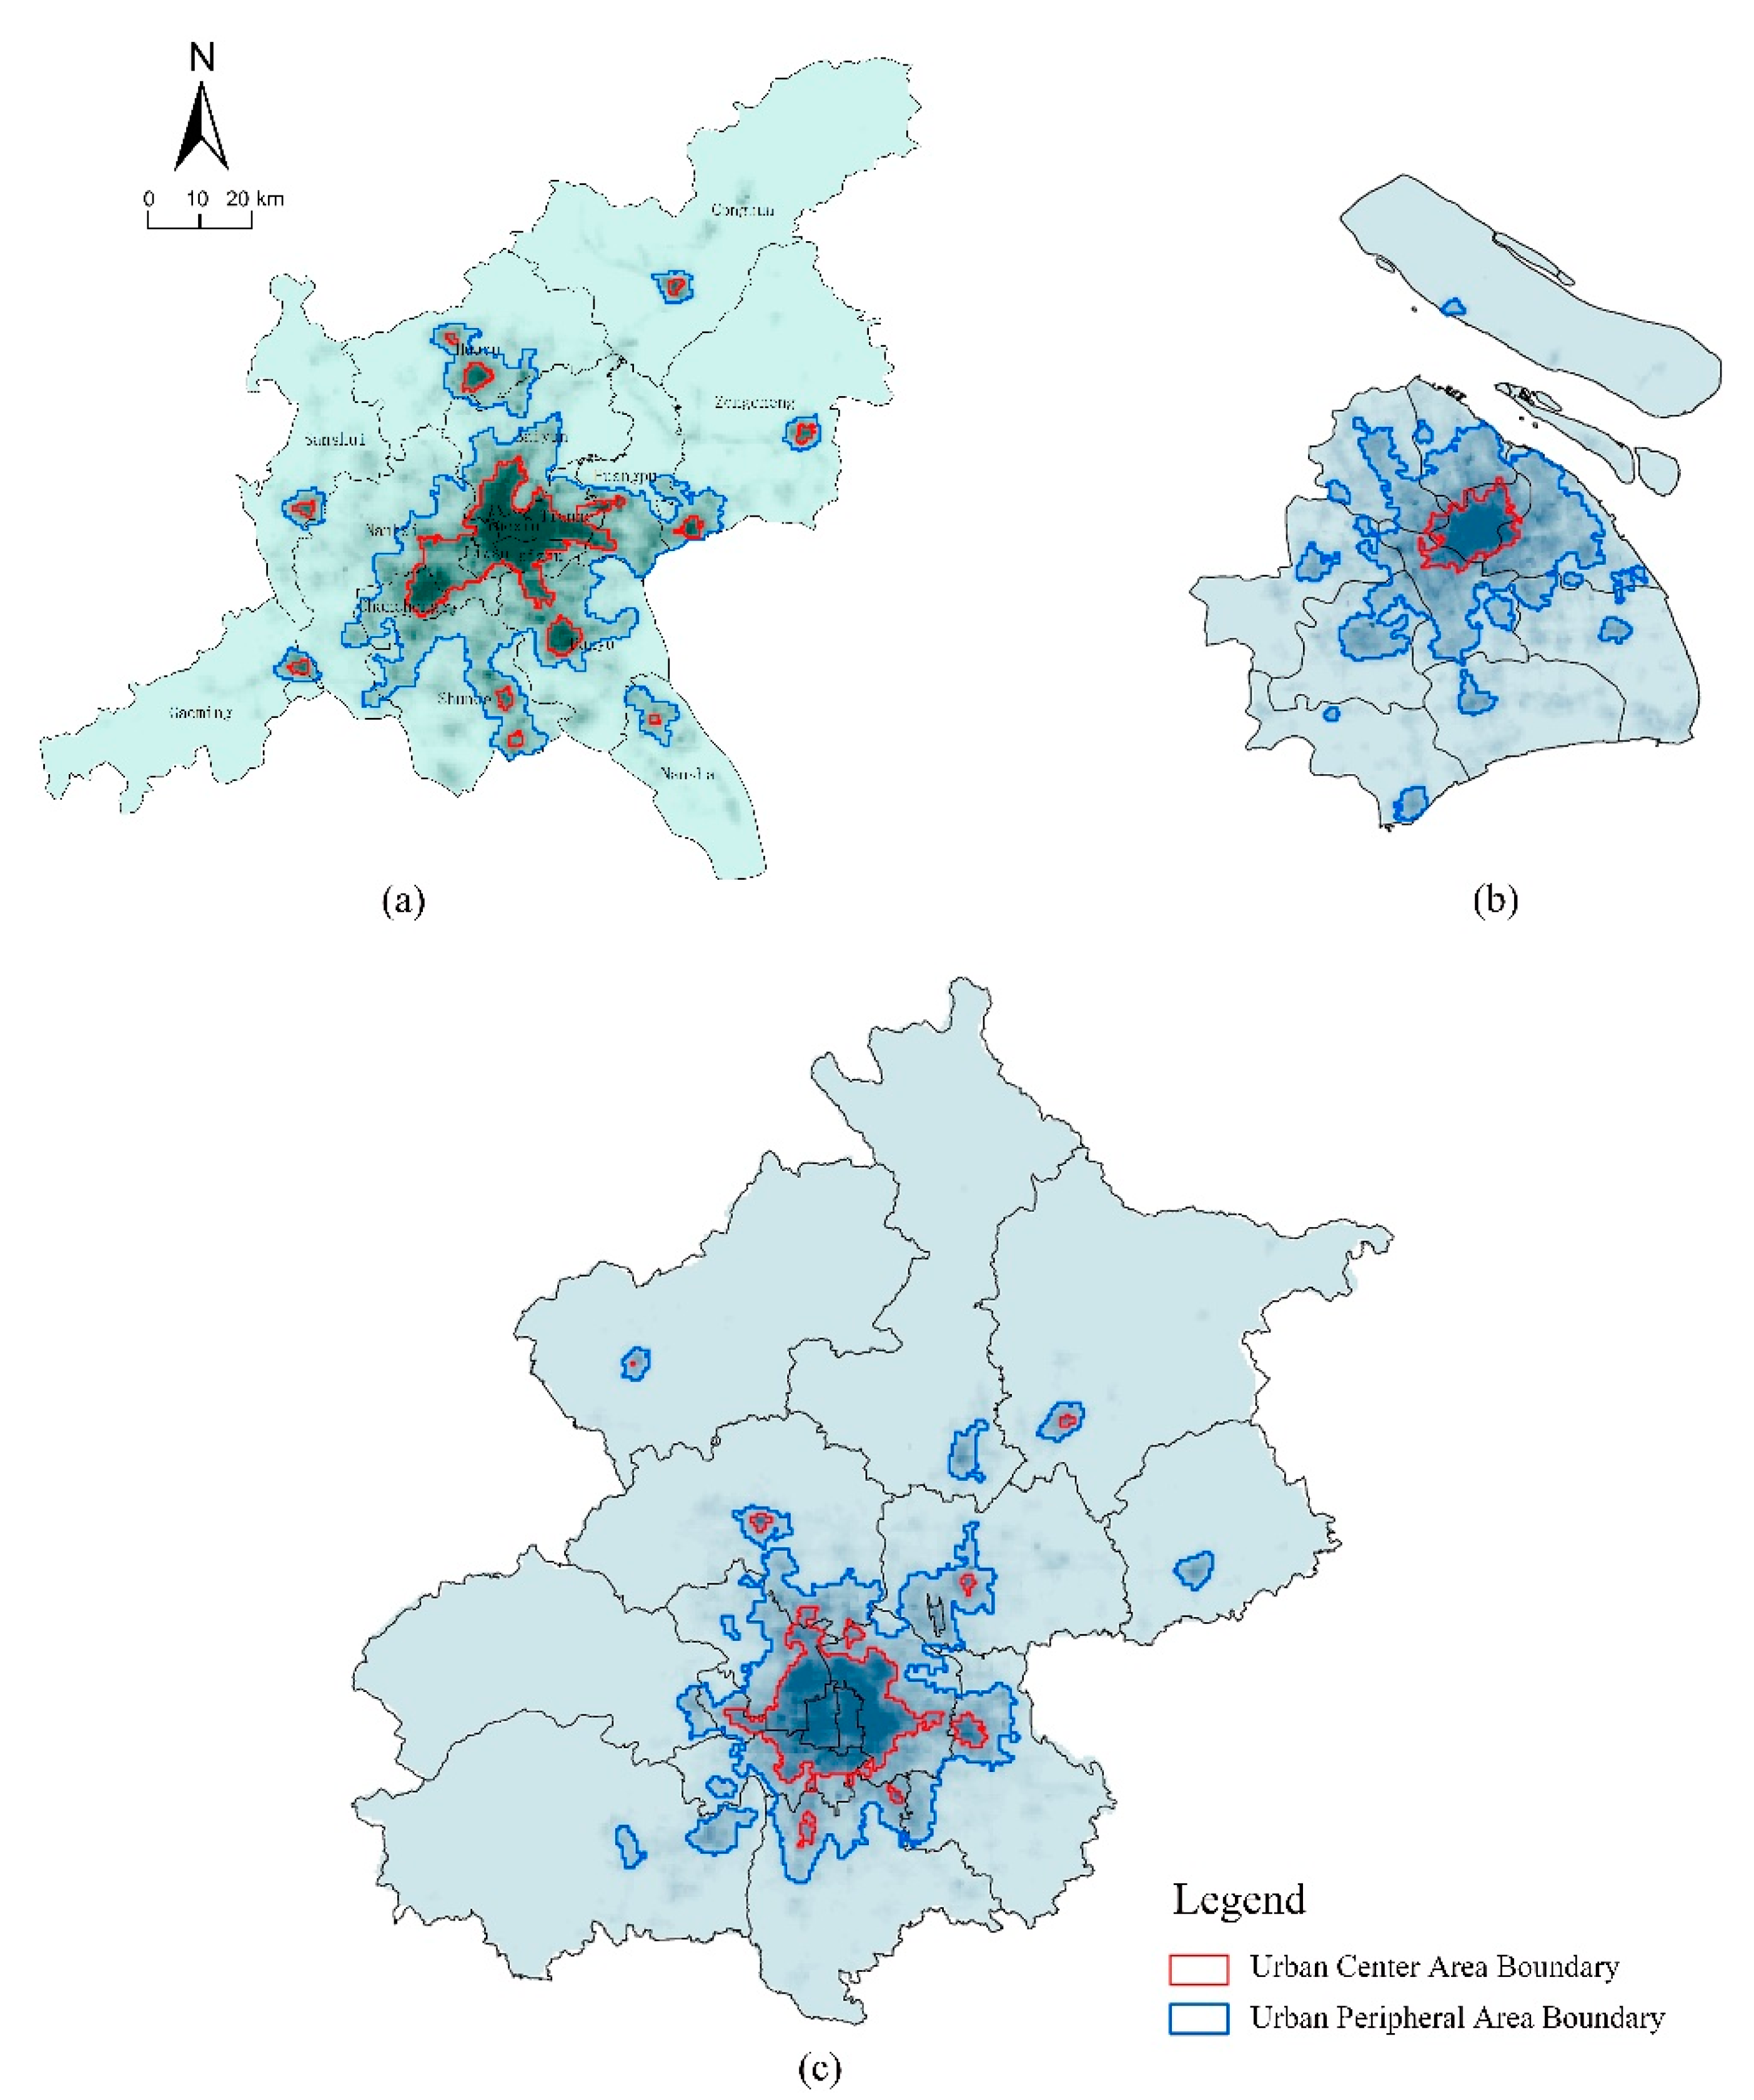
The POI and DMSP/OLS nighttime light data were used to process the administrative areas of Guangzhou and Foshan following the aforementioned technical process, and the boundary scope of the Guangzhou–Foshan urban area was obtained. As shown in Figure 7, the administrative areas of Guangzhou and Foshan consist of one center city and six suburban counties, of which the center city (Guangfo) is broken by the administrative boundary between Guangzhou and Foshan. The urban area of Guangfo mainly covers Yuexiu, Liwan, Haizhu, the north of Tianhe, the south of Baiyun, and the west of Huangpu in Guangzhou. Meanwhile, Foshan covers Chancheng, the eastern towns of Nanhai, and the northern and eastern towns of Shunde. The urban center district of Guangfo also extends from the old urban area of Guangzhou to Tianhe and part of Huangpu in the east and extends to Chancheng of Foshan and the eastern part of Nanhai in the west. The urban center district of Guangfo has three sub-centers on the urban fringe in Shunde and Zengcheng given that the former is a strong industrial county developed through a bottom-up urbanization development. Following the development trend of the Guangzhou and Foshan integration, Shunde was gradually integrated into the metropolitan development system. However, due to the path dependence of the initial development mode with small towns as the main body of development, the towns of Daliang and Ronggui maintained the double center pattern of Shunde. The six surrounding counties are Nansha, Zengcheng, Conghua, Huadu, Sanshui, and Gaoming, all of which are located in the outer suburbs of Guangfo and are developed from agricultural counties.
The urban areas of Guangzhou and Foshan city have a size of 2320.75 km2, which accounts for 20.66% of the administrative area. The center city of Guangfo has an area of 1929.25 km2 (the urban core area is 525.25 km2, whereas the edge area is 1404 km2), which accounts for 83.13% of the urban area. Most of the surrounding counties are relatively small, with Huadu being the largest given its area of 190.5 km2. The other five counties show slight differences in their area and fluctuate within the range of 32.25 km2 to 56.25 km2 with an average of 40.2 km2. These trends reflect the important influence of the administrative power of the government on the urban development of China. The center city of Guangzhou has a high administrative level, and various resources are invested in its development. Moreover, Guangzhou expanded its area by annexing the adjacent suburban counties. However, in the peripheral exurbs, except for Huadu (which has a larger development/urban area and was formed via the construction of municipal important industrial functions and key transportation infrastructure such as an airport), the other outer suburban counties are relatively weak (see Table 2 for details).
4.2. Comparison with Shanghai and Beijing
Beijing, Shanghai, and Guangzhou are among the largest and most economically powerful cities in China and have been compared in many reports. However, most of these comparisons are based on official statistics for the jurisdiction region, thereby offering a limited understanding of these cities. This study attempts to overcome this disadvantage by comparing the urban areas of these cities. The geographical scope of urban areas in Beijing and Shanghai were mapped based on POI and NPP/VIIRS nighttime light data captured in 2018.
Comparison results show that in terms of the total urban area, Guangzhou–Foshan is the largest, followed by Beijing with 1923 km2 and Shanghai with 1589.56 km2. A further comparative analysis of the largest central city in the three administrative areas reveals that Guangfo remains the largest with an area of 2320.75 km2 and an average radius of 37.11 km (among which the radius of the core area is 13.47 km, whereas that of the marginal areas is 23.54 km), followed by Beijing with an area of 1923 km2 and an average radius of 34.05 km (among which the radius of the core area is 13.01 km, whereas that of the marginal areas is 21.04 km) and Shanghai with an area of 1589.56 km2 and an average radius of 28.92 km (among which the radius of the core area is 7.89 km, whereas that of the marginal areas is 21.04 km) (see Table 3 for details).
These findings indicate that the Guangzhou administrative region has been taken as a separate city statistical unit for a long time and has been compared with other benchmark cities, such as Beijing, Shanghai, and Shenzhen. Therefore, suggesting that Guangzhou is gradually declining is unreasonable given that the most powerful cities in China are all showing a declining trend. Guangzhou did not decline but rather changed its form (i.e., cross-boundary development or regional development mode).
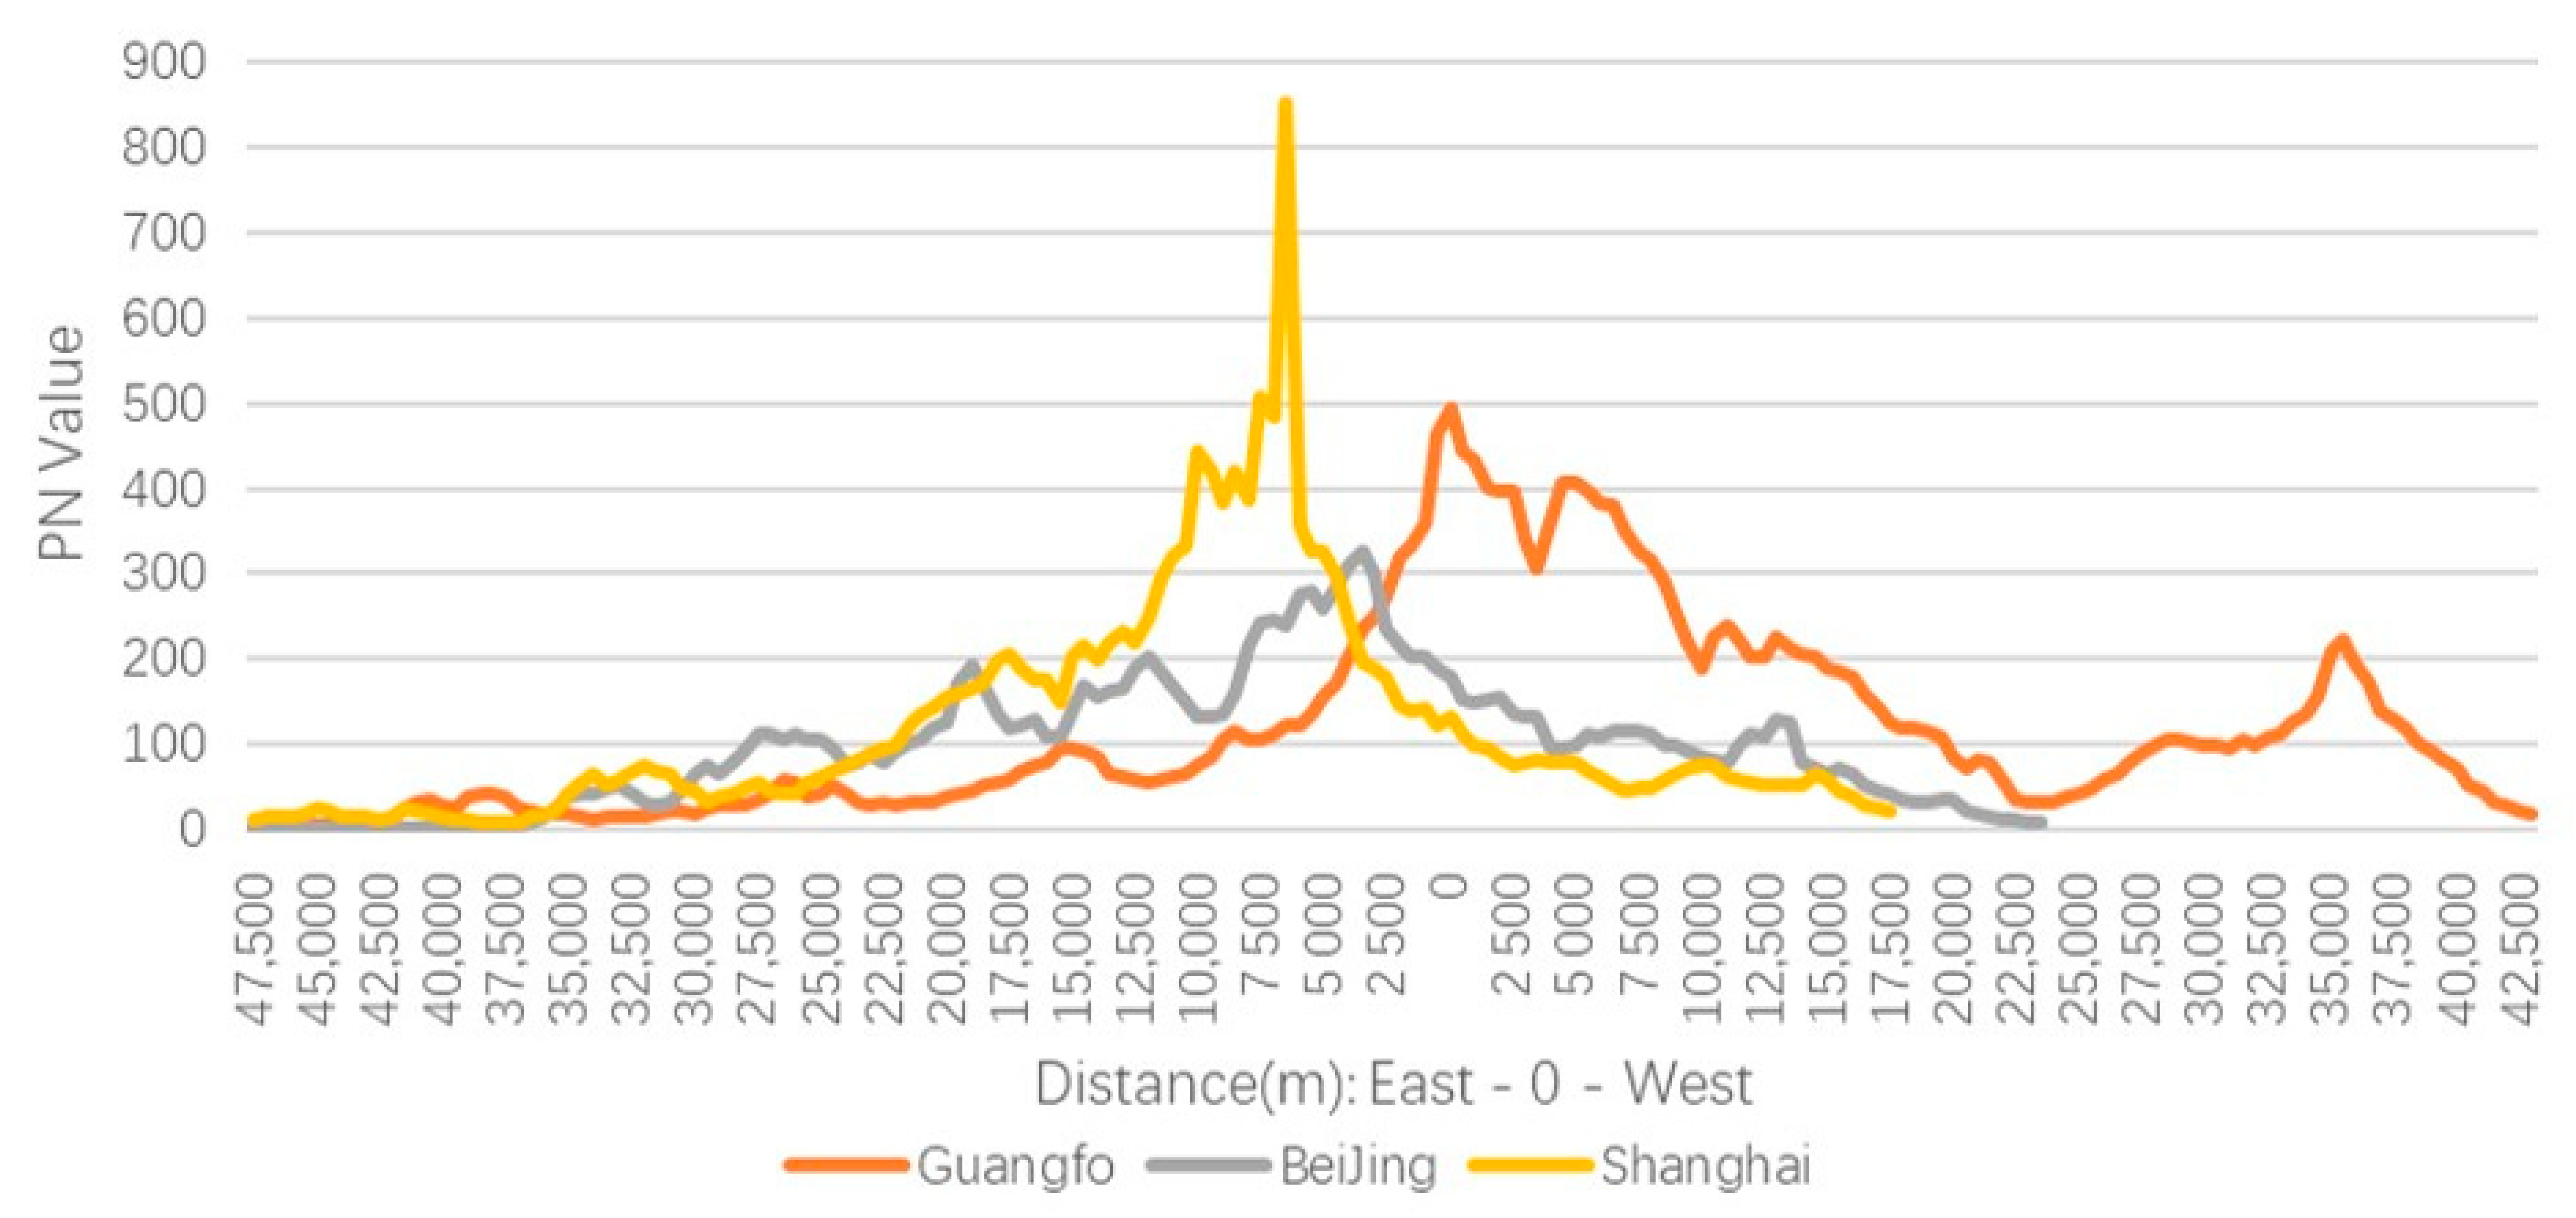
A further analysis of the PN value of the east–west sampling strips (90° and 270°) in the three cities reveals that the PN value changes rapidly from the central city to the periphery, with the steepest profiles observed in Shanghai, Guangfo (which has a relatively gentle, bimodal pattern), and Beijing (which has the gentlest pattern) (Figure 8). This result may be attributed to the specific land area and physical geographical attributes of the city. Compared with the other two cities, while Shanghai has the smallest urban area, this area mostly comprises plains that can be developed given their high land use efficiency and compactness. Guangzhou–Foshan has a relatively flat pattern because of its strong top-down development power, and Foshan can transfer a large number of functions from Guangzhou. Beijing has a vast territory, but its efficiency is not as high as that of Shanghai.
5. Concluding Remarks and Discussion
5.1. Summary
This paper proposes a methodological framework for redefining and identifying Chinese cities based on POI and NPP/VIIRS nighttime light data without relying on conventional yearbooks that have been extensively used in previous studies. This study defines cities from the morphology dimension and uses the gradient attribute of urban density distribution in the region to divide the city boundary in order to avoid subjectively determining the threshold of the urban boundary. This methodology was applied to the cross-boundary city of Guangzhou–Foshan while using POI and NPP/VIIRS nighttime light data captured in 2018. The following conclusions were obtained.
The whole administrative area of Guangzhou and Foshan comprises one core city and six suburban cities. The core city has broken the administrative boundary between Guangzhou and Foshan, and its territorial scope covers Nanhai, Panyu, Baiyun, and Huangpu besides the traditional old urban area of Guangzhou. Within the jurisdiction of Guangzhou and Foshan, the total urban area is 2320.75 km2, which accounts for 20.66% of the administrative area, of which the center city Guangfo is 1929.25 km2 (the urban core area is 525.25 km2, and the edge area is 1404 km2) or 83.13% of the urban area. Most of the surrounding counties are relatively small, with Huadu being the largest with an area of 190.5 km2. The other five counties show slight differences in their area and fluctuate within the range of 32.25 km2 to 56.25 km2 with an average of 40.2 km2.
Compared with those of Beijing and Shanghai, which are among the largest and most economically powerful cities in China, the urban area and average urban radius of the Guangzhou–Foshan core city are larger, which contradicts both the city size measurements of China’s administrative division system and the data published in official statistical yearbooks. From the east–west profile of urban density value represented by the PN composite index, the profile of Shanghai is the steepest, followed by those of Guangzhou–Foshan and Beijing. The profile line of Guangzhou–Foshan has a bimodal shape.
5.2. Academic Contributions
The contributions of this study mainly lie in the following aspects. First, the proposed methodology is straightforward in redefining a city from the spatial dimension by using ubiquitous open data, which are increasingly available to researchers. This model can also be extended to other cities in China and, if necessary, to other large cities in the world. Different cities can also be benchmarked at the same horizon. Second, this paper defines urban areas across an entire administrative region. Previous studies are based on either the scale of the whole country and large regions (e.g., the Beijing–Tianjin–Hebei city region and the Yangtze River Delta) or the scale of a single prefecture-level city administrative region. However, these studies ignore those cities with a cross-boundary development, and this gap has been explored in this paper. Third, this paper uses the breakpoint model to address the disadvantage of subjectively determining a threshold value in defining an urban area. Nighttime light data show a light spillover effect, which can be eliminated by combining these data with POI data. However, the urban boundary threshold still needs to be determined. According to the inherent properties of the density precipitous drop between urban and rural areas, the breakpoint model was used in this paper to avoid the disadvantage of using subjective empirical values to determine such a threshold.
5.3. Potential Applications
As discussed in the Introduction, China’s administrative regions that include cities and urban areas (representing the actual scope of urban functional activities) are mismatched. Moreover, under the background of China’s development system of planning for growth, a frequent adjustment of administrative divisions, especially the annexation of suburban counties, is deeply branded with the growth doctrine. The annexation of surrounding counties is often performed to obtain more land for future development ahead of the urbanization of the surrounding counties. In addition to the academic achievements mentioned above, this research is expected to match the institutional space of administrative jurisdictions as closely as possible with the urban physical regions and achieve the following real-world applications.
First, this study clarifies the functional geographical scope of actual urban activities. The proposed method should be incorporated into the management of China’s city division and correspond to official statistical data. Second, results show that the core area of Guangzhou and Foshan already comprises one city, thereby suggesting that “the urban integration of Guangzhou and Foshan” is a wrong claim. The term “urban integration” refers to “urban to urban, not city to city.” Therefore, Guangzhou and Foshan need to go from “crossing the boundaries” to “beyond the boundaries,” that is, in terms of formulating spatial development strategies and other relevant institutional arrangements, Guangzhou and Foshan should plan their development as a whole. Third, as a supplement to yearbook data, the urban situation can be monitored by using the proposed framework. This same framework can also be used as a basis for adjusting the existing urban management system with an aim to alleviate the mismatch between the city administrative region and the physical one. In sum, apart from its academic implications, the potential applications of this research are not limited to the aforementioned projects.
5.4. Potential Bias and Future Steps
This study proposes a novel model that delineates the urban boundary by using ubiquitous open data. The increasingly available open data and the straightforward methodology used in this framework highlight the merits of this approach. Nevertheless, several limitations need to be noted and examined in future research. On the one hand, the proposed model is very complex and has a time-consuming operation. While this model can be used to examine a single city, applying this model to study the urban system of the whole country will generate a huge workload. In the future, we need to further simplify this model to allow its replication in other regions. On the other hand, this study advocates breaking the restriction of administrative boundaries and objectively defining cities from the perspective of their landscape or functional activities. However, the divided urban areas lack the corresponding social and economic statistical data, thereby preventing in-depth comparisons of these areas with others. Addressing this problem requires a long-term and continuous joint effort between researchers and national statistical authorities.
Author Contributions
P.B. and Q.Y. conceived and designed the research; P.B. and W.Z. conducted this research, analyzed the data, and wrote the manuscript; P.B. and X.L. revised and reformatted the overall paper. All authors have read and agreed to the published version of the manuscript.
Funding
This research was funded by the grants from National Natural Science Foundation of China (No. 51878284), National Social Science Foundation of China (No. 20&ZD107).
Informed Consent Statement
Not applicable.
Data Availability Statement
Restrictions apply to the availability of these data. Data was obtained from [Amap] and are available [at https://lbs.amap.com, accessed on 7 March 2021] with the permission of [Amap].
Acknowledgments
The authors are thankful to three anonymous reviewers for their helpful comments.
Conflicts of Interest
The authors declare no conflict of interest.
References
- Yixing, Z. The Primary Scientific Issue of Urban Research in China Is the Correctness of Basic Urban Concepts. Urban Froum. 2006, 64. [Google Scholar] [CrossRef]
- Krugman, P. Urban Concentration: The Role of Increasing Returns and Transport Costs. Int. Reg. Sci. Rev. 1996, 19, 5–30. [Google Scholar] [CrossRef]
- Michael, B. Rank clocks. Nature 2006, 444, 592–596. [Google Scholar]
- Nations, U.; Affairs, S.; Division, P. World Urbanization Prospects: The 2014 Revision: Highlights. 2014, pp. 19–39. Available online: http://www.doc88.com/p-5019106130852.html (accessed on 6 March 2021).
- Gleeson, B. Critical Commentary. The Urban Age:Paradox and Prospect. Urban Stud. 2012, 49, 931–943. Available online: http://0-www-jstor-org.brum.beds.ac.uk/stable/26150894 (accessed on 2 March 2021). [CrossRef]
- Brenner, N.; Schmid, C. The ’urban age’ in question. Int. J. Urban Reg. Res. 2014, 38, 731–755. [Google Scholar] [CrossRef]
- Long, Y. Redefining Chinese city system with emerging new data. Appl. Geogr. 2016, 75, 36–48. [Google Scholar] [CrossRef]
- Xueqiang, X.; Yixing, Z.; Yuemin, N. Urban Geography, 2nd ed.; Higher Education Press, 2009; pp. 19–34. Available online: http://www.hep.com.cn/book/details?uuid=526932e8-1414-1000-897b-3fafc67de19c (accessed on 2 March 2021).
- Hu, Y.; Wu, Z.; Xiong, W.; Pan, C. Study of identifying urban built-up area: Taking Wuhan as an example. City Plan. Rev. 2008, 32, 88–92. [Google Scholar]
- Cottineau, C.; Hatna, E.; Arcaute, E.; Batty, M. Diverse cities or the systematic paradox of Urban Scaling Laws. Comput. Environ. Urban Syst. 2016, 59, 80–94. [Google Scholar] [CrossRef] [Green Version]
- Adams, J.S.; Vandrasek, B.J.; Phillips, E.G. Metropolitan area definition in the united states. Urban Geogr. 1999, 20, 695–726. [Google Scholar] [CrossRef]
- Ning, Y. Definition of Chinese metropolitan areas and large urban agglomerations: Role of large urban agglomerations in regional development. Sci. Geogr. Sin. 2011, 31, 257–263. [Google Scholar]
- Ma, S.; Long, Y. Functional urban area delineations of cities on the Chinese mainland using massive Didi ride-hailing records. Cities 2020, 97, 102532. [Google Scholar] [CrossRef]
- Fulong, W. Planning for Growth: Urban and Regional Planning in China; Routledge, 2015; pp. 33–178. Available online: https://0-doi-org.brum.beds.ac.uk/10.1111/1468-2427.12639 (accessed on 2 March 2021).
- Zhang, J.; Fulong, W.U. China’s changing economic governance: Administrative annexation and the reorganization of local governments in the Yangtze River Delta. Reg. Stud. 2006, 40, 3–21. [Google Scholar] [CrossRef]
- Yixing, Z.; Yulong, S. Toward establishing the concept of physical urban area in China. Acta Geogr. Sin. 1995, 50, 289–301. [Google Scholar]
- Tongji University. Standards of Urban Area Determination (Draft for comments) Writing Instructions. 2020, pp. 1–39. Available online: https://www.upr.cn/files/upload/20201110/637406047122610773.pdf (accessed on 1 March 2021).
- The Ministry of Natural Resources. Standards of Urban Area Determination (Draft for comments). 2020; pp. 1–2. Available online: https://www.upr.cn/files/upload/20201110/637406046993299208.pdf (accessed on 1 March 2021).
- Kanemoto, Y.; Kurima, R. Urban Employment Areas: Defining Japanese Metropolitan Areas and Constructing the Statistical Database for them. In GIS-Based Studies in the Humanities and Social Sciences; 2005; pp. 85–97. Available online: http://www3.grips.ac.jp/~kanemoto/MEA/MEA_CSIS_5.pdf (accessed on 2 March 2021).
- Duranton, G. A Proposal to Delineate Metropolitan Areas in Colombia. Rev. Desarro. Soc. 2015, 2015, 223–264. [Google Scholar] [CrossRef]
- Rozenfeld, H.D.; Rybski, D.; Gabaix, X.; Makse, H.A. The Area and Population of Cities: New Insights from a Different Perspective on Cities. Am. Econ. Rev. 2011, 101, 2205–2225. [Google Scholar] [CrossRef] [Green Version]
- Cörvers, F.; Hensen, M.; Bongaerts, D. The Delimitation and Coherence of Functional and Administrative Regions. Reg. Stud. 2009, 43, 19–31. [Google Scholar] [CrossRef]
- Bellefon, M.P.D.; Combes, P.P.; Duranton, G.; Gobillon, L.; Gorin, C. Delineating urban areas using building density. J. Urban Econ. 2019, 103226. Available online: https://www.nber.org/system/files/working_papers/w26482/w26482.pdf (accessed on 2 March 2021).
- Arribas-Bel, D.; Garcia-López, M.-N.; Viladecans-Marsal, E. Building(s and) cities: Delineating urban areas with a machine learning algorithm. J. Urban Econ. 2019, 103217. [Google Scholar] [CrossRef] [Green Version]
- Usui, H. A bottom-up approach for delineating urban areas minimizing the connection cost of built clusters: Comparison with top-down-based densely inhabited districts—ScienceDirect. Comput. Environ. Urban Syst. 2019, 77, 101363. [Google Scholar] [CrossRef]
- Jiang, B.; Jia, T. Zipf’s Law for All the Natural Cities in the United States: A Geospatial Perspective. Int. J. Geogr. Inf. Sci. 2011, 25, 1269–1281. [Google Scholar] [CrossRef]
- Jiang, B.; Liu, X. Scaling of geographic space from the perspective of city and field blocks and using volunteered geographic information. Int. J. Geogr. Inf. Syst. 2012, 26, 215–229. [Google Scholar] [CrossRef] [Green Version]
- Mesev, T.V.; Longley, P.A.; Batty, M.; Xie, Y. Morphology from Imagery: Detecting and Measuring the Density of Urban Land Use. Environ. Plan. A 1995, 27, 759–780. [Google Scholar] [CrossRef]
- Roessner, S.; Segl, K.; Bochow, M.; Heiden, U.; Kaufmann, H. Urban Remote Sensing: Monitoring, Synthesis and Modeling in the Urban Environment; Wiley-Blackwell, 2011; pp. 132–167. Available online: https://books.google.com.hk/books?hl=zh-CN&lr=lang_en%7Clang_zh-TW%7Clang_zh-CN&id=tqCIbjzFYIEC&oi=fnd&pg=PA1958&dq=Urban+Remote+Sensing:+Monitoring,+Synthesis+and+Modeling+in+the+Urban+Environment.+Wiley-Blackwell:+2011.&ots=ttlkPXGlPU&sig=4fzuHrYK2li2491jew5qvLkyScU&redir_esc=y#v=onepage&q=Urban%20Remote%20Sensing%3A%20Monitoring%2C%20Synthesis%20and%20Modeling%20in%20the%20Urban%20Environment.%20Wiley-Blackwell%3A%202011.&f=false (accessed on 2 March 2021).
- Knox, P.L.; Mccarthy, L.M. Urbanization: An Introduction to Urban Geography; Pearson Prentice Hall: Upper Saddle River, NJ, USA, 2005; pp. 236–317. Available online: https://evergreen.asburyseminary.edu/eg/opac/record/418885 (accessed on 2 March 2021).
- Greene, R.; Pick, J. Exploring the Urban Community: A GIS Approach; 2012; pp. 37–54. Available online: https://inspire.redlands.edu/oh_books/24/ (accessed on 2 March 2021).
- Neng, Z.; Tinghai, W. A Study of Identification and International Comparison of Urban Areas in Jing-Jin-Ji Region. Hum. Settl. 2018, 97, 60–66. [Google Scholar]
- Lewis, D.; Hugo, P. A Harmonised Definition of Cities and Rural Areas: the New Degree of Urbanisation. Regional Working Paper. 2014, pp. 2–24. Available online: http://ec.europa.eu/regional_policy/sources/docgener/work/2014_01_new_urban.pdf (accessed on 1 March 2021).
- Long, Y.; Shen, Y.; Jin, X. Mapping block-level urban areas for all Chinese cities. Ann. Am. Assoc. Geogr. 2016, 106, 96–113. [Google Scholar] [CrossRef] [Green Version]
- Wu, K.; Tang, J.; Long, Y. Delineating the Regional Economic Geography of China by the Approach of Community Detection. Sustainability 2019, 11, 6013. [Google Scholar] [CrossRef] [Green Version]
- Yixing, Z. Suggestions on the definition of urban and urban population statistics in China. City Plan. Rev. 1986, 3, 10–15. Available online: http://qikan.cqvip.com/Qikan/Article/Detail?id=1003113834 (accessed on 2 March 2021).
- Yixing, Z. Definitions of urban places and statistical standards of urban population in China: Problems and solutions. Asian Geogr. 1988, 7, 12–28. [Google Scholar]
- Xiaodong, S.; Pu, L.; Yixing, Z. Urban and Rural Area Division: Taking Shanghai as an Example. Acta Geogr. Sin. 2006, 8, 787–797. Available online: https://www.oalib.com/paper/1563119 (accessed on 2 March 2021).
- Cao, X.; Chen, J.; Imura, H.; Higashi, O. A SVM-based method to extract urban areas from DMSP-OLS and SPOT VGT data. Remote Sens. Environ. 2009, 113, 2205–2209. [Google Scholar] [CrossRef]
- He, C.; Shi, P.; Li, J.; Chen, J.; Pan, Y.; Li, J.; Zhuo, L.; Ichinose, T. Restoring urbanization process in China in the 1990s by using non-radiance-calibrated DMSP/OLS nighttime light imagery and statistical data. Chin. Sci. Bull. 2006, 51, 1614–1620. [Google Scholar] [CrossRef]
- Li, C.; Zhu, Y. The Challenges of Data Quality and Data Quality Assessment in the Big Data Era. Data Sci. J. 2015, 14, 21–23. [Google Scholar]
- Hu, C.; Liu, W.; Jia, Y.; Jin, Y. Characterization of Territorial Spatial Agglomeration Based on POI Data: A Case Study of Ningbo City, China. Sustainability 2019, 11, 5083. [Google Scholar] [CrossRef] [Green Version]
- Zhen, F.; Cao, Y.; Qin, X.; Wang, B. Delineation of an urban agglomeration boundary based on Sina Weibo microblog ‘check-in’data: A case study of the Yangtze River Delta. Cities 2017, 60, 180–191. [Google Scholar] [CrossRef]
- Zhou, Q. Comparative Study of Approaches to Delineating Built-Up Areas Using Road Network Data. Trans. Gis 2015, 19, 848–876. [Google Scholar] [CrossRef]
- Zhou, Y.; Smith, S.J.; Elvidge, C.D.; Zhao, K.; Imhoff, M. A cluster-based method to map urban area from DMSP/OLS nightlights. Remote Sens. Environ. 2014, 147, 173–185. [Google Scholar] [CrossRef]
- Marx, A.; Ziegler Rogers, M. Analysis of Panamanian DMSP/OLS nightlights corroborates suspicions of inaccurate fiscal data: A natural experiment examining the accuracy of GDP data. Remote Sens. Appl. Soc. Environ. 2017, 8, 99–104. [Google Scholar] [CrossRef]
- Chong, Z.; Pan, S. Understanding the structure and determinants of city network through intra-firm service relationships: The case of Guangdong-Hong Kong-Macao Greater Bay Area. Cities 2020, 103, 102738. [Google Scholar] [CrossRef]
- Brenner, N. Globalisation as reterritorialisation: The re-scaling of urban governance in the European Union. Urban Stud. 1999, 36, 431–451. [Google Scholar] [CrossRef]
- Scott, A.J. Regions and the World Economy: The Coming Shape of Global Production, Competition, and Political Order; Oxford University Press: Oxford, UK, 1998; Volume 82, Available online: https://pdfs.semanticscholar.org/055a/494f170f02ff9a7a5460ad601c6da276a7fa.pdf (accessed on 2 March 2021).
- Xie, Z.; Yan, J. Kernel Density Estimation of Traffic Accidents in a Network Space. Comput. Environ. Urban Syst. 2008, 32, 396–406. [Google Scholar] [CrossRef] [Green Version]
- Lloyd, C.D. Spatial Data Analysis: An Introduction for GIS Users. 2010. Available online: https://books.google.com.hk/books?hl=zh-CN&lr=lang_en%7Clang_zh-TW%7Clang_zh-CN&id=7WGcAQAAQBAJ&oi=fnd&pg=PR7&dq=Spatial+Data+Analysis:+an+Introduction+for+GIS+Users.+2010&ots=M0TdBevTRn&sig=IzpAmkn0g6lUSK6U4seURTIOgq4&redir_esc=y#v=onepage&q=Spatial%20Data%20Analysis%3A%20an%20Introduction%20for%20GIS%20Users.%202010&f=false (accessed on 2 March 2021).
- Fei, L.; Qingwu, Y.; Yajing, Z.; Baoli, L. Improving the accuracy of built-up area extraction based on nighttime light data and POI: A case study of NPP/VIIRS and Luojia 1-01 nighttime light images. Geomat. Inf. Sci.Wuhan Univ. 2019, 1–14. [Google Scholar] [CrossRef]
- Converse, P.D. New laws of retail gravitation. J. Mark. 1949, 14, 379–384. [Google Scholar] [CrossRef]
- Aoyama, Y.; Kondo, A. A Utility Theory Approach to the Gravity Law: Consumer Shopping Behavior and Trade Areas of Shopping Centers. Stud. Reg. Sci. 1986, 17, 55–69. [Google Scholar] [CrossRef] [Green Version]
- Joseph, L.; Kuby, M. Gravity Modeling and Its Impacts on Location Analysis; Springer: Boston, MA, USA, 2011; pp. 423–443. Available online: http://repository.bilkent.edu.tr/bitstream/handle/11693/38348/Hub%20location%20problems%20The%20location%20of%20interacting%20facilities.pdf?sequence=1#page=422 (accessed on 2 March 2021).
- Youqi, C. Discuss the Urban and Rural Ecotone and Its Features and Functions. Econ. Geogr. 1996, 16, 27–31. Available online: http://www.cnki.com.cn/Article/CJFDTotal-JJDL199603005.htm) (accessed on 2 March 2021).
Figure 1.
Location of Guangzhou–Foshan Metropolitan in PRD and the composition of its internal administrative areas.
Figure 1.
Location of Guangzhou–Foshan Metropolitan in PRD and the composition of its internal administrative areas.

Figure 2.
Growth of the built-up area in Guangzhou–Foshan Metropolitan: (a) 1987, (b) 1997, (c) 2007, and (d) 2017. Source: derived from satellite remote sensing maps at: datamirror.csdb.cn/admin/introLandsat.jsp (accessed on 5 March 2018).
Figure 2.
Growth of the built-up area in Guangzhou–Foshan Metropolitan: (a) 1987, (b) 1997, (c) 2007, and (d) 2017. Source: derived from satellite remote sensing maps at: datamirror.csdb.cn/admin/introLandsat.jsp (accessed on 5 March 2018).

Figure 3.
Flowchart of the proposed framework.

Figure 4.
The study sample strip in Guangzhou and Foshan.

Figure 5.
(a) POI kernel density estimation diagram, (b) DMSP/OLS nighttime light data figure, (c) PN composite index of urban density.
Figure 5.
(a) POI kernel density estimation diagram, (b) DMSP/OLS nighttime light data figure, (c) PN composite index of urban density.

Figure 6.
Schematic diagram of urban and rural spatial interface division.

Figure 7.
Urban areas within the administrative area: (a) Guangzhou and Foshan, (b) Shanghai, (c) Beijing.
Figure 7.
Urban areas within the administrative area: (a) Guangzhou and Foshan, (b) Shanghai, (c) Beijing.

Figure 8.
Comparison of PN value profile in Guangfo, Beijing, and Shanghai.


Table 1.
Classification of point of interest types.
| Type | Number | Percentage (%) |
|---|---|---|
| Dining sites | 127,427 | 16.16 |
| Communal facilities | 9268 | 1.18 |
| Incorporated business | 230,956 | 29.28 |
| Shopping sites | 12,012 | 1.52 |
| Transport facilities | 63,166 | 8.01 |
| Financial insurance service | 22,015 | 2.79 |
| Educational and cultural services | 68,347 | 8.67 |
| Commercial housing | 46,483 | 5.89 |
| Life services | 97,861 | 12.41 |
| Sports and leisure services | 37,390 | 4.74 |
| Government agencies and social organizations | 45,507 | 5.77 |
| Accommodation services | 28,288 | 3.59 |
| Total | 788,720 | 100.00 |
Table 2.
Statistics of various urban areas within the Guangzhou and Foshan administrative area.
| Urban Name | Area (km2) | Percentage (%) |
|---|---|---|
| Guangfo | 1929.25 | 83.13 |
| Nansha | 56.25 | 2.42 |
| Zengcheng | 34 | 1.47 |
| Conghua | 32.25 | 1.39 |
| Huadu | 190.5 | 8.21 |
| Sanshui | 42.25 | 1.82 |
| Gaoming | 36.25 | 1.56 |
| Total | 2320.75 | 100.00 |
Table 3.
Statistical comparison of urban areas in Guangfo, Beijing, and Shanghai.
| City Region | Urban Area Radius (km) | Urban Core Area (km2) | Urban Fringe Area (km2) | Administrative Region Area (km2) | Urban Area Percentage (%) |
|---|---|---|---|---|---|
| Guangzhou and Foshan | 37.11 (13.47/23.54) | 579.25 | 1741.50 | 11,126.14 | 20.85 |
| Shanghai | 28.92 (7.98/21.03) | 200.25 | 1389.31 | 6882.05 | 23.09 |
| Beijing | 34.05 (13.01/21.04) | 531.75 | 1391.25 | 16,393.90 | 11.73 |
Publisher’s Note: MDPI stays neutral with regard to jurisdictional claims in published maps and institutional affiliations. |
© 2021 by the authors. Licensee MDPI, Basel, Switzerland. This article is an open access article distributed under the terms and conditions of the Creative Commons Attribution (CC BY) license (http://creativecommons.org/licenses/by/4.0/).
Share and Cite
MDPI and ACS Style
Ban, P.; Zhan, W.; Yuan, Q.; Li, X. Delineating the Urban Areas of a Cross-Boundary City with Open-Access Data: Guangzhou–Foshan, South China. Sustainability 2021, 13, 2930. https://0-doi-org.brum.beds.ac.uk/10.3390/su13052930
AMA Style
Ban P, Zhan W, Yuan Q, Li X. Delineating the Urban Areas of a Cross-Boundary City with Open-Access Data: Guangzhou–Foshan, South China. Sustainability. 2021; 13(5):2930. https://0-doi-org.brum.beds.ac.uk/10.3390/su13052930
Chicago/Turabian StyleBan, Pengfei, Wei Zhan, Qifeng Yuan, and Xiaojian Li. 2021. "Delineating the Urban Areas of a Cross-Boundary City with Open-Access Data: Guangzhou–Foshan, South China" Sustainability 13, no. 5: 2930. https://0-doi-org.brum.beds.ac.uk/10.3390/su13052930
Note that from the first issue of 2016, this journal uses article numbers instead of page numbers. See further details here.