
Influence of Service Valuation and Package Cost on Market Segmentation: The Case of Online Demand for Spanish and Andorra Ski Resorts


Abstract
:1. Introduction
2. Literature Review
3. Data and Method
3.1. Method
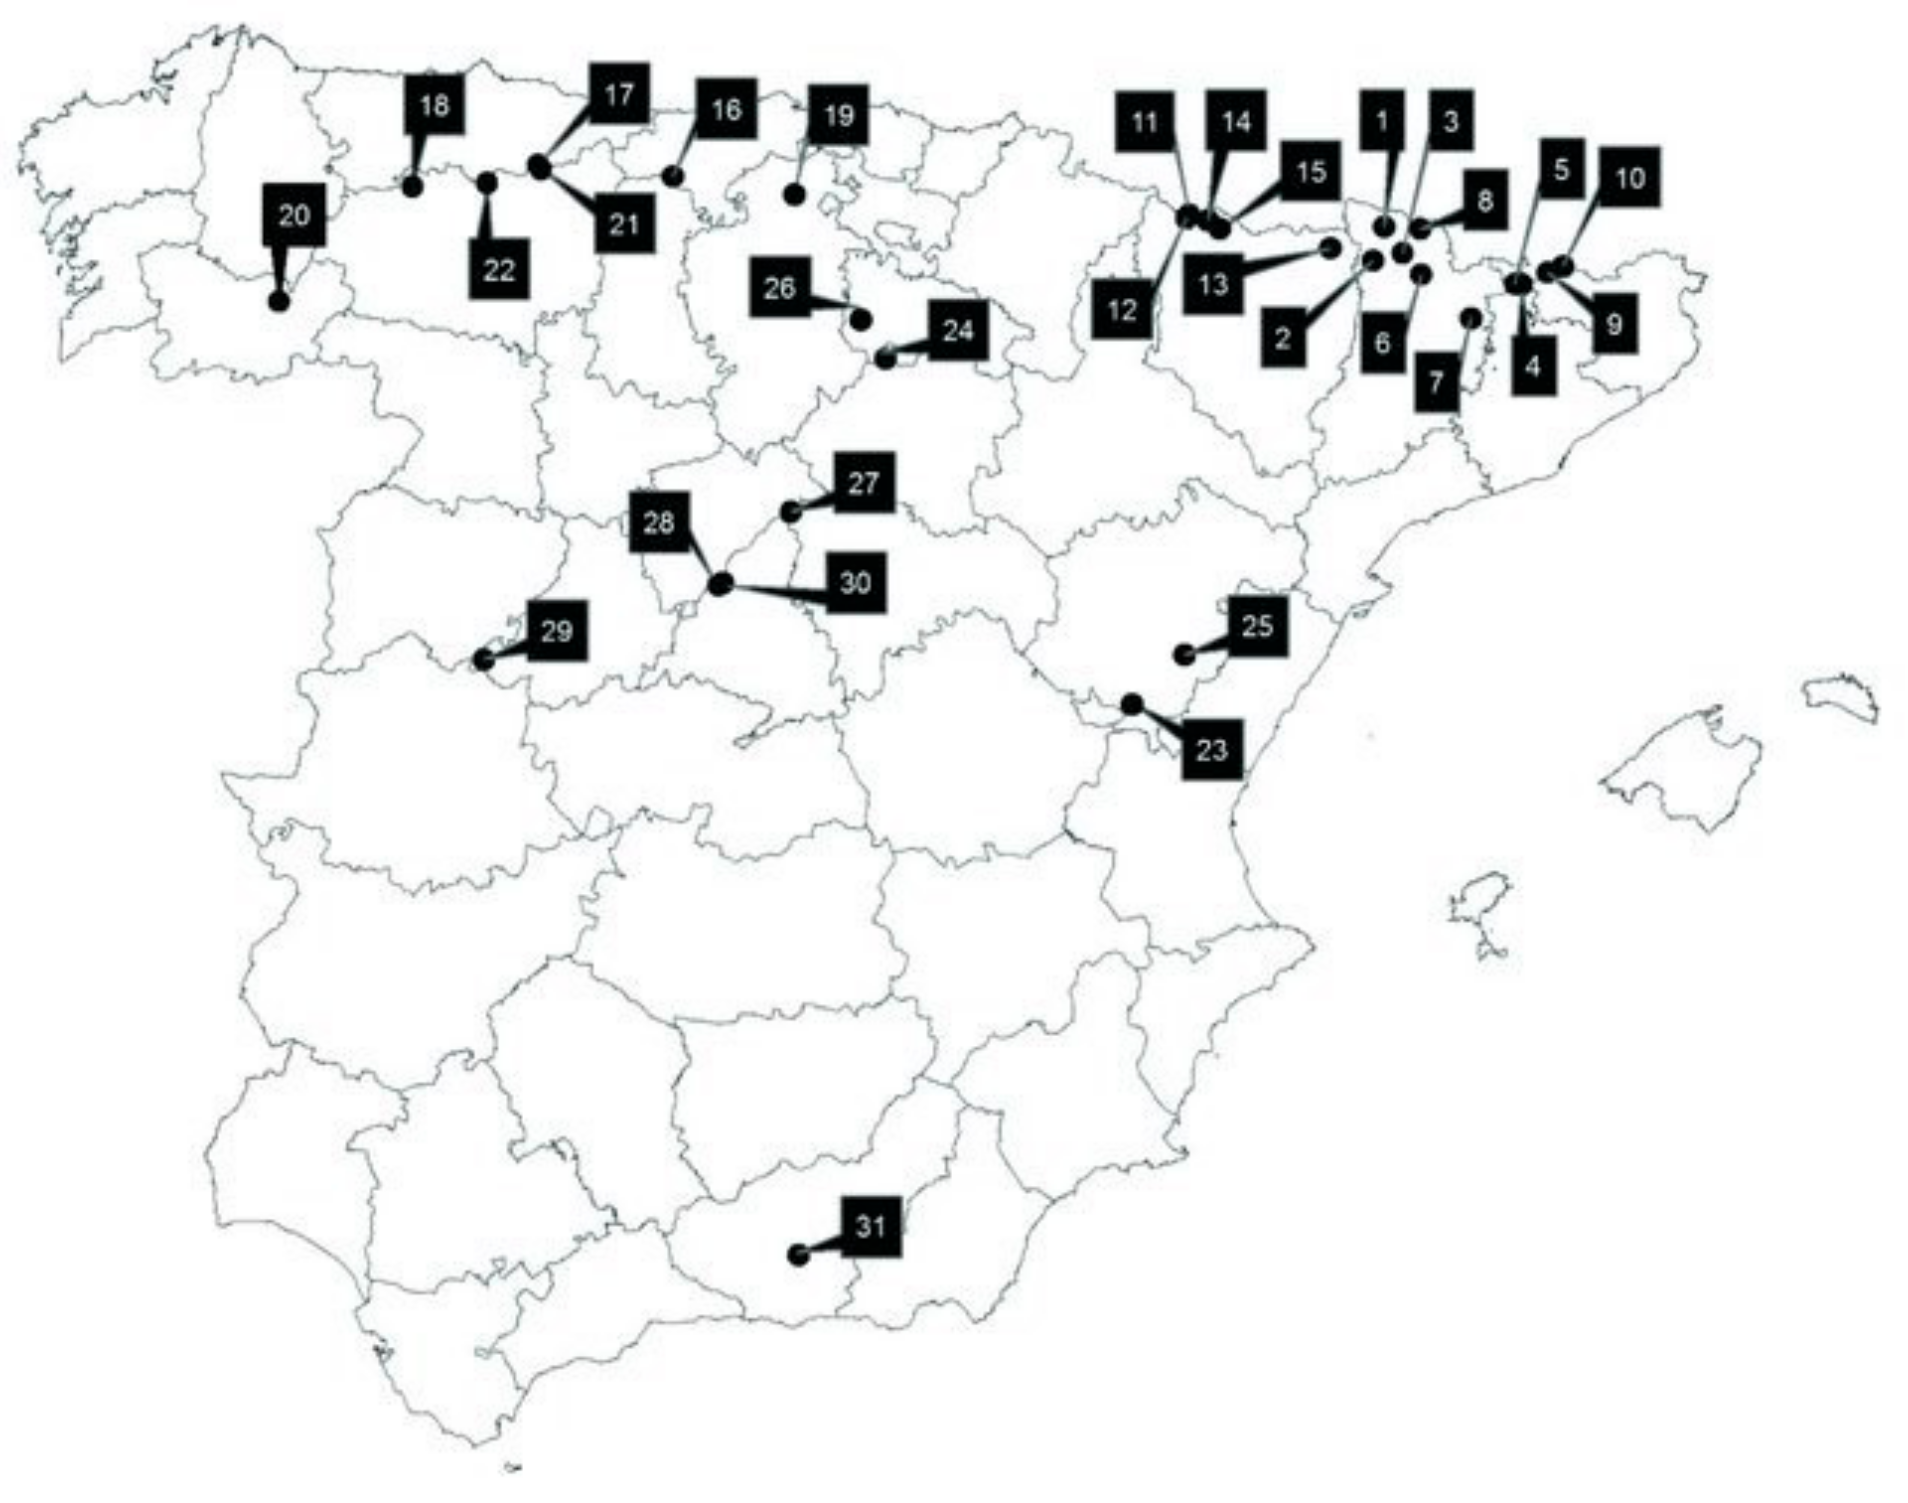
3.2. Data
3.2.1. Manifest Variables
3.2.2. Covariates
4. Results
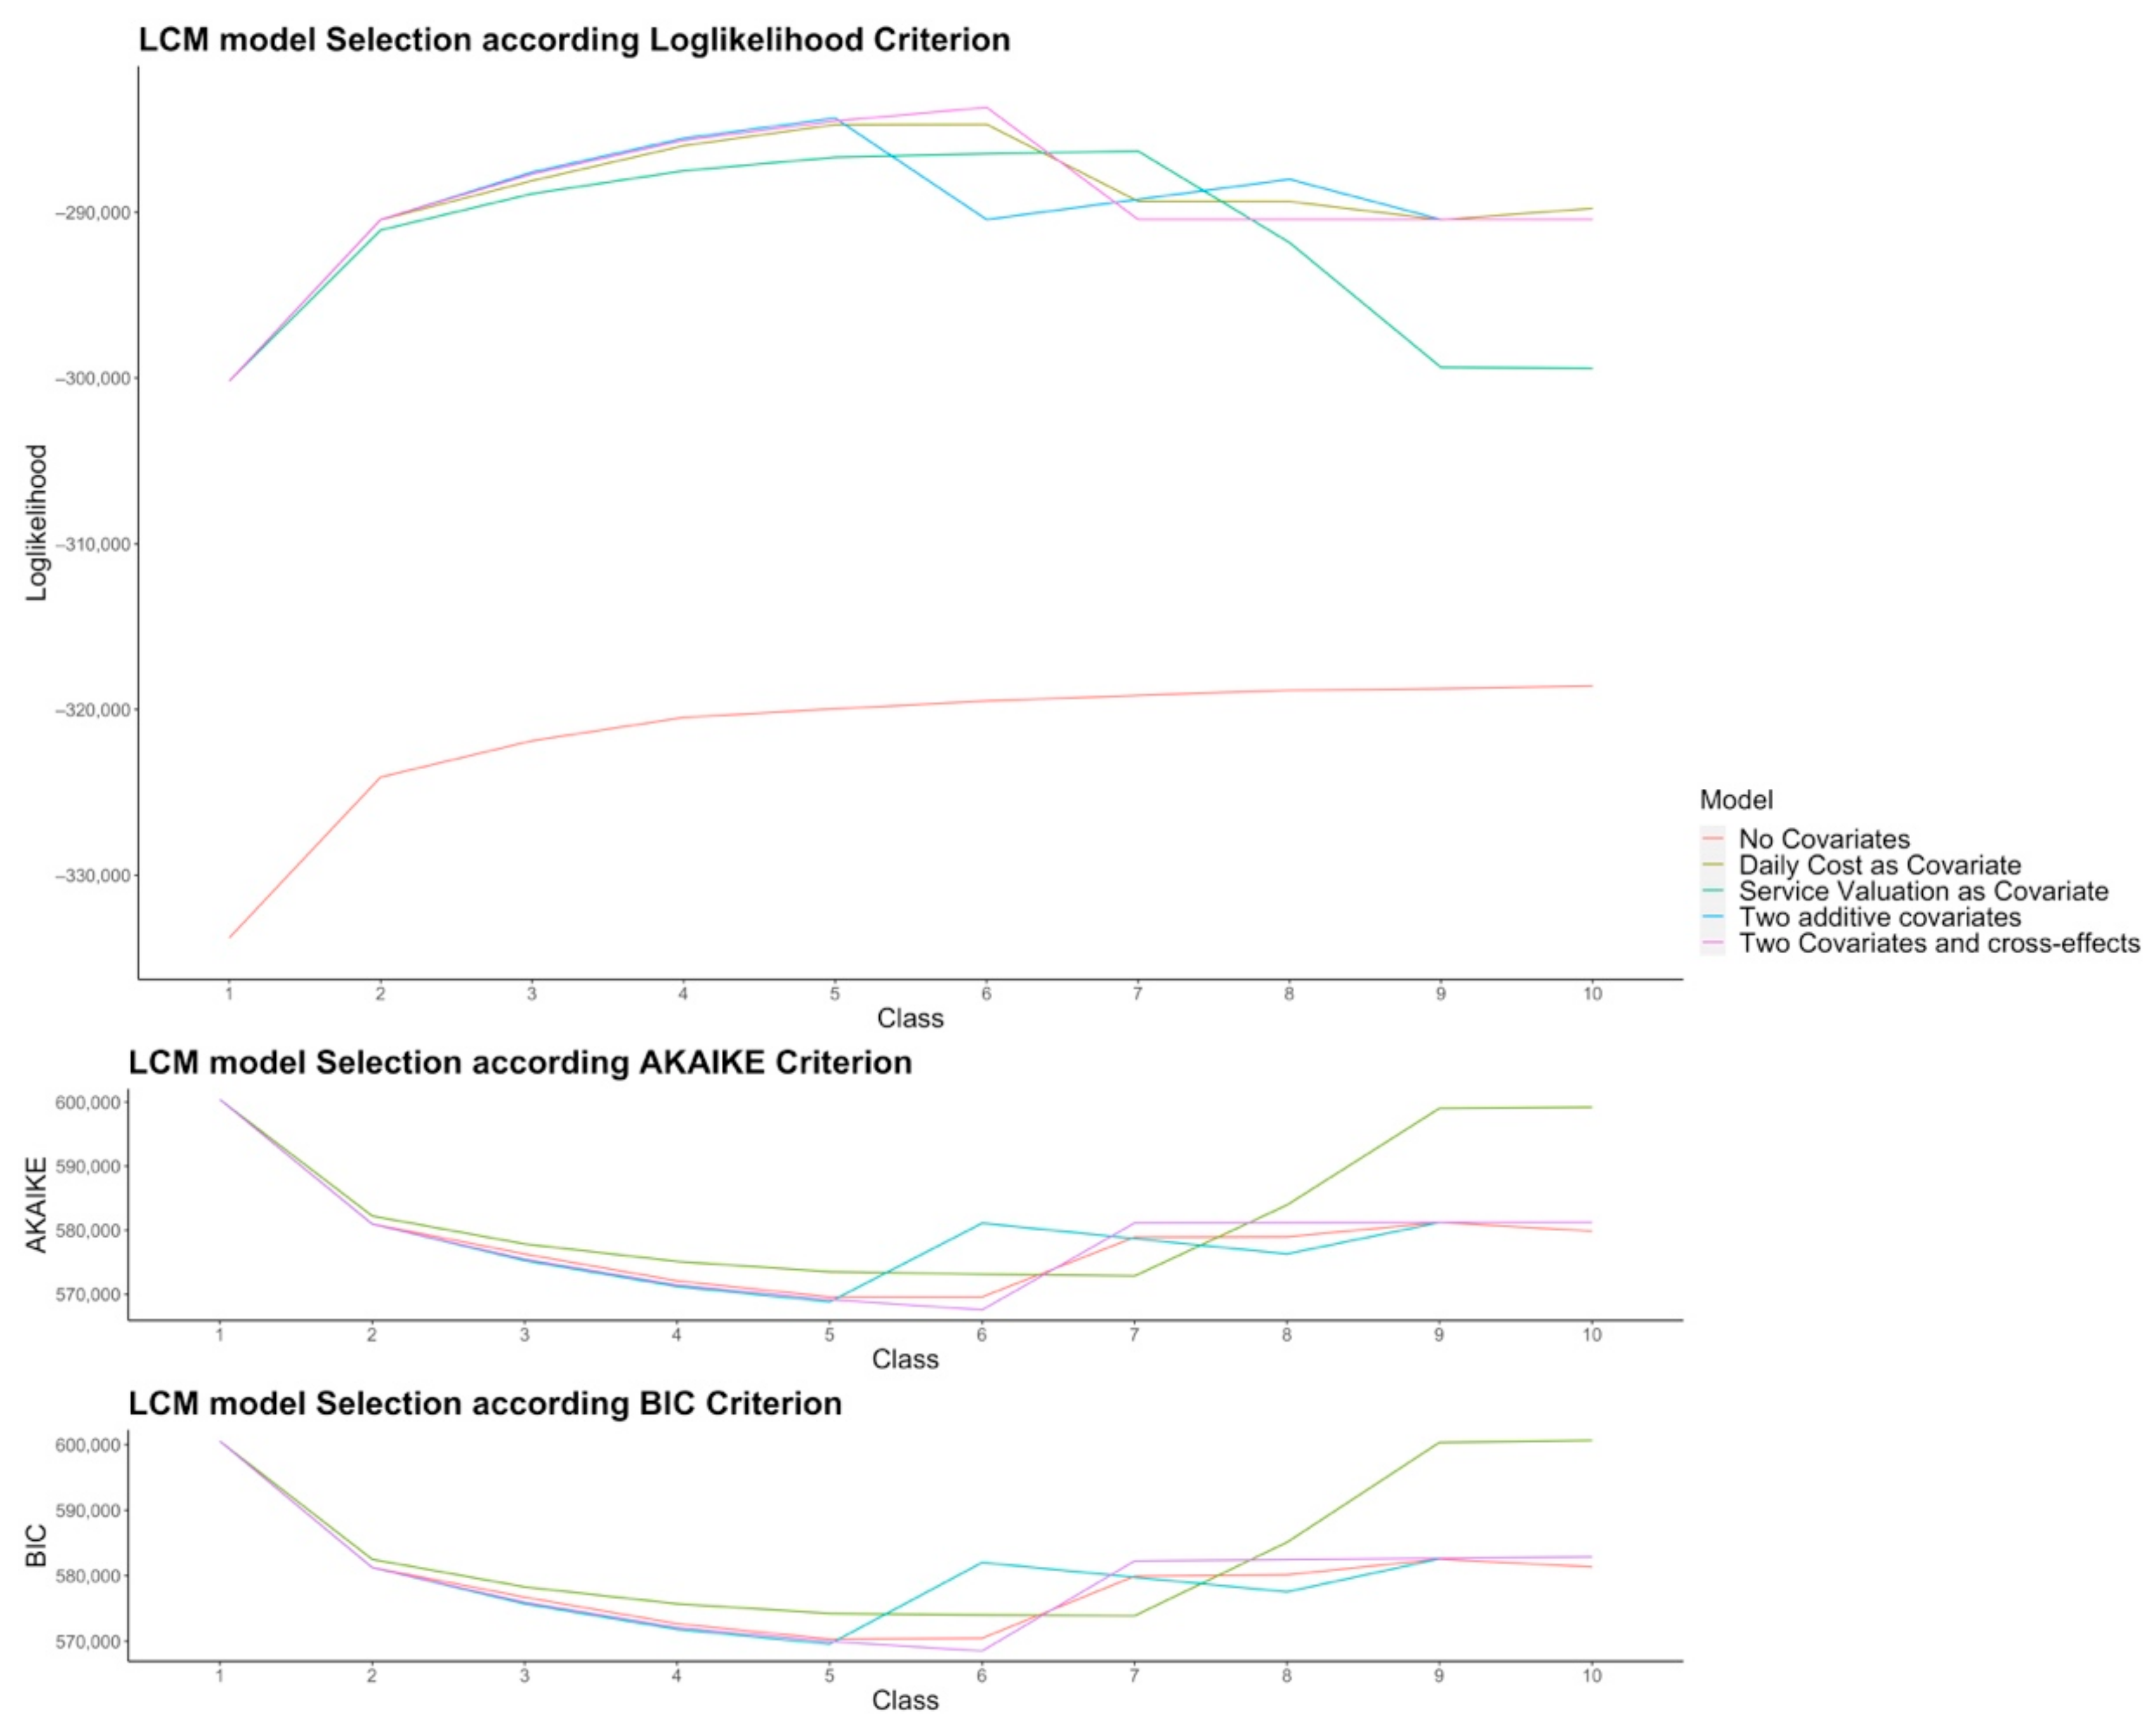
4.1. Model Selection and Number of Classes
4.2. Description of Classes
- Class 1: Low-to-average accommodation type.
- Class 2: Young Spanish tourists who travel in couple.
- Class 3: Average-to-old, mainly Spanish travelers who stay at upper-level accommodation.
- Class 4: Old and young (but not intermediate-aged) foreigners (mainly UK and French) who travel in couple.
- Class 5: Couples of all ages, Spanish or foreign, first-time users of the portal website esquiades.com, who choose good accommodation for a short stay.
- Class 6: Similar but with a slightly higher percentage of Spaniards, intermediate age category, higher focus on intermediate accommodation, and larger average group size.
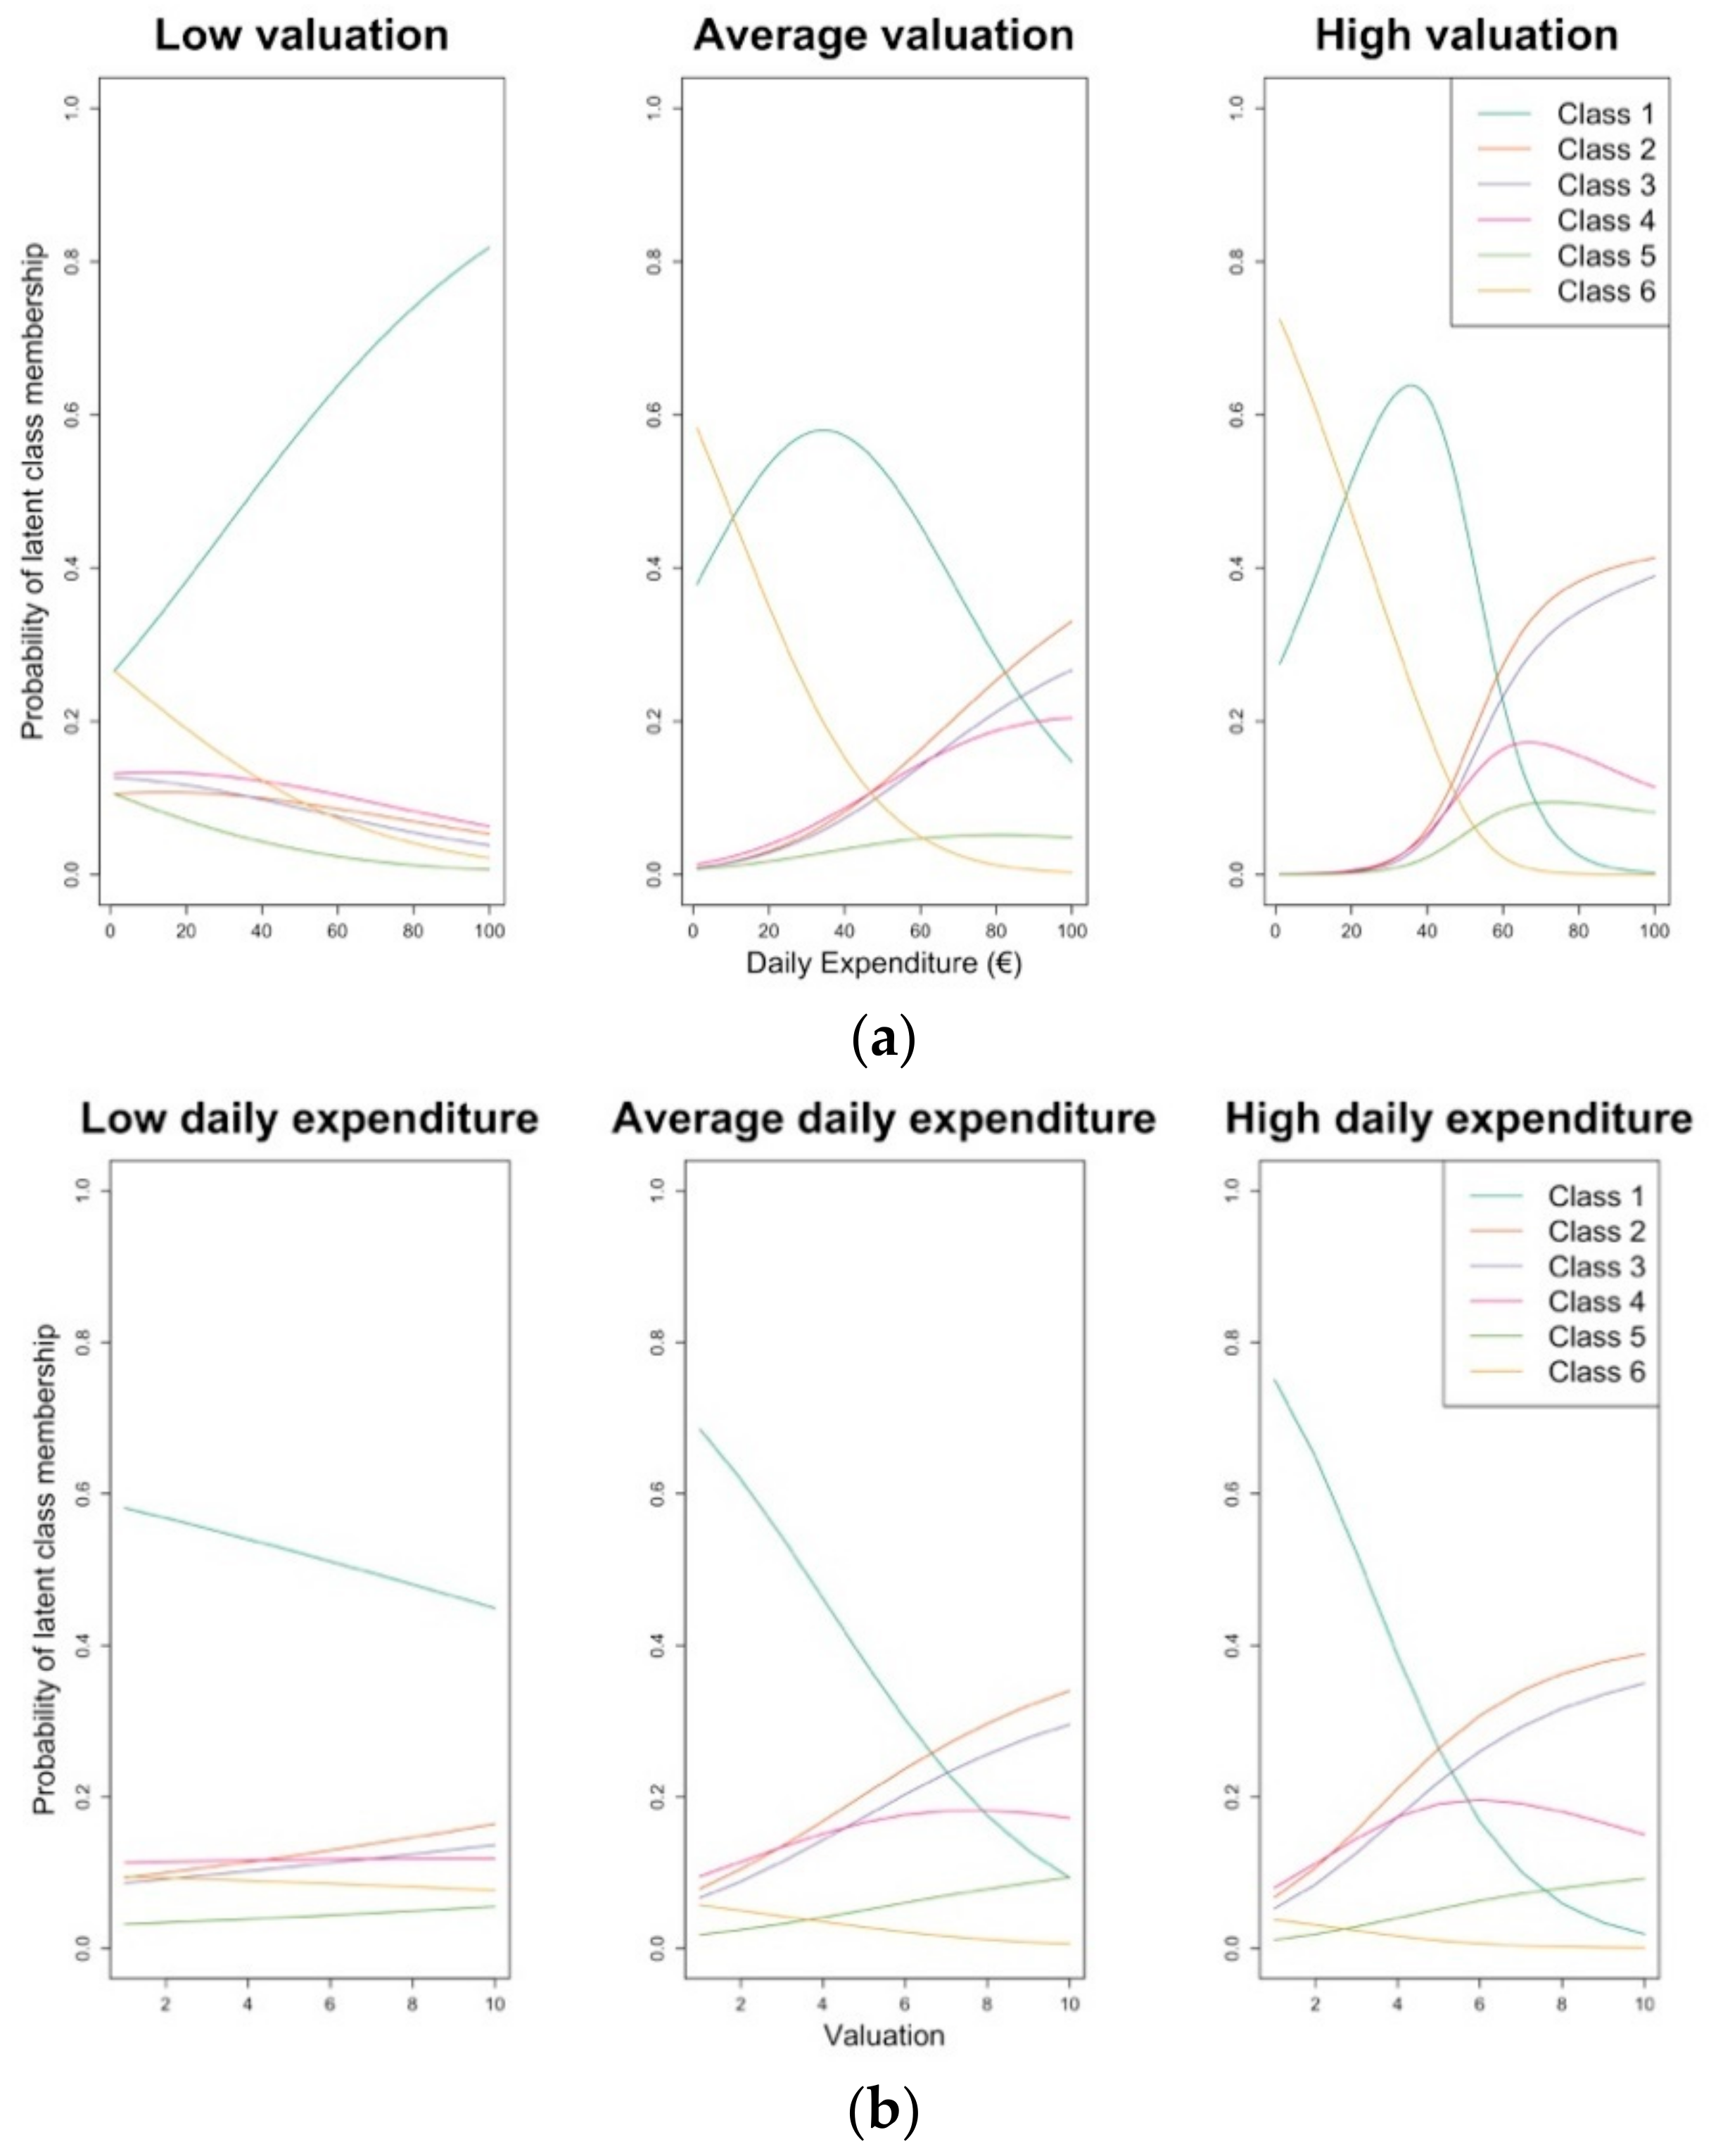
4.3. Probability of Class Membership
- Travelers with a low expenditure have a roughly 0.5 probability of belonging to class 1, and this is relatively independent of the valuation they give to the travel product. The remaining 0.5 probability is more or less evenly divided over the remaining classes.
- For average and high daily expenditure, very similar results are found. In particular, travelers who give a low valuation have a high probability (0.4–0.6) of belonging to class 1. As their valuation increases, they tend more and more (up to 0.3–0.4) to belong to classes 2 or 3. There is also a non-negligible probability of belonging to class 4, especially at intermediate valuations.
- For low valuation, at very low daily expenditure there is a probability of roughly 0.25 of belonging to class 1 and likewise for class 6; the remaining 0.5 is equally divided over the remaining classes. As the expenditure increases, the probability of belonging to class 6 decreases rapidly in favour of class 1.
- For intermediate and high valuation, a complex picture emerges. For low to intermediate expenditure profiles, classes 1 and 6 again dominate. However, as the expenditure increases, classes 2 and 3 become more important. Class 4 is also present, with probabilities up to 0.2, at high expenditures in the intermediate valuation range, and at intermediate-to-high expenditures in the high valuation category. Finally, there is a non-negligible contribution (∼0.1) from class 5 for high valuation and high expenditure.
5. Discussion
6. Conclusions
Author Contributions
Funding
Institutional Review Board Statement
Informed Consent Statement
Data Availability Statement
Conflicts of Interest
Appendix A. Latent Class Model
References
- Economic Policy Committee; European Commission. The Impact of Ageing on Public Expenditure: Projections for the EU-25 Member States on Pensions, Healthcare, Long-Term Care, Education and Unemployment transfers (2004–2050). Office for Official Publications of the European Communities. 2006. Available online: https://op.europa.eu/en/publication-detail/-/publication/9b3ed30f-ec24-4c49-8daf-03aa494242c2 (accessed on 22 January 2021).
- Henderson, J.C. Corporate social responsibility and tourism: Hotel companies in Phuket, Thailand, after the Indian Ocean tsunami. Int. J. Hosp. Manag. 2007, 26, 228–239. [Google Scholar] [CrossRef]
- Fatma, M.; Rahman, Z.; Khan, I. Measuring consumer perception of CSR in tourism industry: Scale development and validation. J. Hosp. Tour. Manag. 2016, 27, 39–48. [Google Scholar] [CrossRef]
- Bigné, E.; Zanfardini, M.; Andreu, L. How online reviews of destination responsibility influence tourists’ evaluations: An exploratory study of mountain tourism. J. Sustain. Tour. 2020, 28, 686–704. [Google Scholar] [CrossRef]
- Jeon, M.M.; Lee, S.; Jeong, M. Perceived corporate social responsibility and customers’ behaviors in the ridesharing service industry. Int. J. Hosp. Manag. 2020, 84, 102341. [Google Scholar] [CrossRef]
- Su, L.; Pan, Y.; Chen, X. Corporate social responsibility: Findings from the Chinese hospitality industry. J. Retail. Consum. Serv. 2017, 34, 240–247. [Google Scholar] [CrossRef]
- Kim, H.; Woo, E.; Uysal, M.; Kwon, N. The effects of corporate social responsibility (CSR) on employee well-being in the hospitality industry. Int. J. Contemp. Hosp. Manag. 2018, 30, 1584–1600. [Google Scholar] [CrossRef]
- Taheri, B.; Thompson, J. Generating socially responsible events at ski resorts. Int. J. Hosp. Manag. 2020, 91, 102695. [Google Scholar] [CrossRef]
- Franco, S.; Caroli, M.G.; Cappa, F.; Chiappa, G.D. Are you good enough? CSR, quality management and corporate financial performance in the hospitality industry. Int. J. Hosp. Manag. 2020, 88, 102395. [Google Scholar] [CrossRef]
- Lin, C.S.; Chang, R.Y.; Dang, V.T. An integrated model to explain how corporate social responsibility affects corporate financial performance. Sustainability 2015, 7, 8292–8311. [Google Scholar] [CrossRef] [Green Version]
- Svermova, P.; Cernik, M. Corporate Social Responsibility of Companies Producing PFOA Containing Waxes for Cross-Country Skiing. Sustainability 2020, 12, 5141. [Google Scholar] [CrossRef]
- Buckley, R. Perceived Resource Quality as a Framework to Analyze Impacts of Climate Change on Adventure Tourism: Snow, Surf, Wind, and Whitewater. Tour. Rev. Int. 2017, 21, 241–254. [Google Scholar] [CrossRef] [Green Version]
- Moreno-Gené, J.; Sánchez-Pulido, L.; Cristobal-Fransi, E.; Daries, N. The economic sustainability of snow tourism: The case of ski resorts in Austria, France, and Italy. Sustainability 2018, 10, 3012. [Google Scholar] [CrossRef] [Green Version]
- Rossello-Nadal, J. How to evaluate the effects of climate change on tourism? Tour. Manag. 2014, 42, 334–340. [Google Scholar] [CrossRef]
- Cristobal-Fransi, E.; Daries, N.; Serra-Cantallops, A.; Ramón-Cardona, J.; Zorzano, M. Ski tourism and web marketing strategies: The case of ski resorts in France and Spain. Sustainability 2018, 10, 2920. [Google Scholar] [CrossRef] [Green Version]
- Lasanta, T.; Laguna, M.; Vicente-Serrano, S.M. Do tourism-based ski resorts contribute to the homogeneous development of the Mediterranean mountains? A case study in the Central Spanish Pyrenees. Tour. Manag. 2007, 28, 1326–1339. [Google Scholar] [CrossRef]
- Daries, N.; Cristóbal-Fransi, E.; Martin-Fuentes, E.; Marine-Roig, E. e-Commerce adoption in mountain and snow tourism: Analysis of ski resort web presence through the eMICA model. Cuad. Tour. 2016, 37, 483–487. [Google Scholar] [CrossRef] [Green Version]
- ATUDEM (Asociación Turística de Estaciones de Esquí y Montaña). ATUDEM Guide 2018–2019. Available online: http://www.atudem.es/20190318/temporada-esqui.aspx (accessed on 15 November 2019).
- Cristobal-Fransi, E.; Daries-Ramon, N.; Mariné-Roig, E.; Martín-Fuentes, E. Implementation of Web 2.0 in the snow tourism industry: Analysis of the online presence and e-commerce of ski resorts. Span. J. Mark. Esic 2017, 21, 117–130. [Google Scholar] [CrossRef]
- Departament d’Estadística del Govern d’Andorra. Andorra en Xifres. Available online: https://www.estadistica.ad/serveiestudis/publicacions/Publicacions/Andorra%20en%20Xifres_cat.pdf (accessed on 8 October 2020).
- Vanat, L. 2020 International Report on Snow & Mountain Tourism. Overview of the Key Industry Figures for Ski Resorts. Available online: https://www.vanat.ch/RM-world-report-2020.pdf (accessed on 10 January 2021).
- Campos Rodrigues, L.; Freire-González, J.; González Puig, A.; Puig-Ventosa, I. Climate change adaptation of Alpine ski tourism in Spain. Climate 2018, 6, 29. [Google Scholar] [CrossRef] [Green Version]
- Pelegrina, A.; Ocaña-Peinado, F.M.; Henares-Civantos, I.; Rosúa-Campos, J.L.; Serrano-Bernardo, F.A. Analyzing social perception as a key factor in the management of protected areas: The case of the Sierra Nevada Protected Area. J. Environ. Plan. Manag. 2018, 61, 124–142. [Google Scholar] [CrossRef]
- Steiger, R.; Scott, D.; Abegg, B.; Pons, M.; Aall, C. A critical review of climate change risk for ski tourism. Curr. Issues Tour. 2019, 22, 1343–1379. [Google Scholar] [CrossRef] [Green Version]
- Gonçalves, O.; Robinot, E.; Michel, H. Does it pay to be green? The case of French ski resorts. J. Travel Res. 2016, 55, 889–903. [Google Scholar] [CrossRef] [Green Version]
- Morrison, C.; Pickering, C.M. Perceptions of climate change impacts, adaptation and limits to adaption in the Australian Alps: The ski-tourism industry and key stakeholders. J. Sustain. Tour. 2013, 21, 173–191. [Google Scholar] [CrossRef] [Green Version]
- Moreno-Gene, J.; Sánchez-Pulido, L.; Cristobal-Fransi, E.; Daries, N. Snow tourism and sustainability: The economic situation of ski resorts in Spain. Appl. Econ. 2020, 52, 5726–5774. [Google Scholar] [CrossRef]
- Damm, A.; Köberl, J.; Prettenthaler, F. Does Artificial Snow Production Pay under Future Climate conditions?—A Case Study for a Vulnerable Ski Area in Austria. Tour. Manag. 2014, 43, 8–21. [Google Scholar] [CrossRef]
- Gómez-Martín, M.B.; Armesto-López, X.; Amelung, B. Tourism, climate change and the mass media: The representation of the issue in Spain. Curr. Issues Tour. 2016, 19, 174–198. [Google Scholar] [CrossRef]
- Bausch, T.; Unseld, C. Winter tourism in Germany is much more than skiing! Consumer motives and implications to Alpine destination marketing. J. Vacat. Mark. 2008, 24, 203–217. [Google Scholar] [CrossRef]
- Falk, M. A dynamic panel data analysis of snow depth and winter tourism. Tour. Manag. 2020, 31, 912–924. [Google Scholar] [CrossRef]
- Pearce, P.L. Tourist Behaviour: Themes and Conceptual Schemes; Channel View: Clevedon, UK, 2005. [Google Scholar]
- Matzler, K.; Siller, H.J. Linking travel motivations with perceptions of destinations: The case of youth travelers in Alpine summer and winter tourism. Tour. Rev. 2003, 58, 6–11. [Google Scholar] [CrossRef]
- Khan, H.; Yusuf, M.D.; Hakeem, A.; Md, S.; Naumov, N. The use of branding and market segmentation in hotel marketing: A Conceptual Review. J. Tour. Intell. Smartness 2018, 1, 12–23. [Google Scholar]
- Li, J.J.; Bonn, M.; Kim, J.H. A latent class segmentation analysis of gamblers in a gambling destination. J. Destin. Mark. Manag. 2020, 16, 100433. [Google Scholar] [CrossRef]
- Kastenholz, E.; Eusébio, C.; Carneiro, M.J. Segmenting the rural tourist market by sustainable travel behaviour: Insights from village visitors in Portugal. J. Destin. Mark. Manag. 2018, 10, 132–142. [Google Scholar] [CrossRef]
- Bojanic, D.C.; Warnick, R.B. Segmenting the market for winter vacations. J. Travel Tour. Mark. 1996, 4, 85–95. [Google Scholar] [CrossRef]
- Mills, A.S.; Couturier, H.; Snepenger, D.J. Segmenting Texas snow skiers. J. Travel Res. 1986, 25, 19–23. [Google Scholar] [CrossRef]
- Perdue, R.R. Target market selection and marketing strategy: The Colorado downhill skiing industry. J. Travel Res. 1996, 34, 39–46. [Google Scholar] [CrossRef]
- Godfrey, K. Attributes of Destination Choice: British Skiing in Canada. J. Vacat. Mark. 1999, 5, 18–30. [Google Scholar] [CrossRef]
- Joppe, M.; Elliot, S.; Durand, L. From ski market to ski traveller: A multidimensional segmentation approach. Anatolia 2013, 24, 40–51. [Google Scholar] [CrossRef]
- Konu, H.; Laukkanen, T.; Komppula, R. Using ski destination choice criteria to segment Finnish ski resort customers. Tour. Manag. 2011, 32, 1096–1105. [Google Scholar] [CrossRef]
- Alexandris, K.; Kouthouris, C.; Funk, D.; Chatzigianni, E. Examining the relationships between leisure constraints, involvement and attitudinal loyalty among Greek recreational skiers. Eur. Sport Manag. Q. 2008, 8, 247–264. [Google Scholar] [CrossRef]
- Hall, J.; O’Mahony, B.; Gayler, J. Modelling the relationship between attribute satisfaction, overall satisfaction, and behavioural intententions in Australian ski resorts. J. Travel Tour. Mark. 2016, 34, 764–778. [Google Scholar] [CrossRef]
- Hudson, S.; Shephard, G. Measuring Service Quality at Tourist Destinations: An Application of Importance-Performance Analysis to an Alpine Ski Resort. J. Travel Tour. Mark. 1998, 7, 61–77. [Google Scholar] [CrossRef]
- Matzler, K.; Füller, J.; Faullant, R. Customer satisfaction and loyalty to Alpine ski resorts: The moderating effect of lifestyle, spending and customers’ skiing skills. Int. J. Tour. Res. 2007, 9, 409–421. [Google Scholar] [CrossRef]
- Kotler, P.; Bowen, J.; Makens, J.; Baloglu, S. Marketing for Hospitality and Tourism, 7th ed.; Pearson Education: Boston, MA, USA, 2017. [Google Scholar]
- Daries, N.; Cristobal-Fransi, E.; Ferrer-Rosell, B.; Marine-Roig, E. Behaviour of Culinary Tourists: A segmentation study of diners at Top-Level Restaurants. Intang. Cap. 2018, 14, 332–355. [Google Scholar] [CrossRef] [Green Version]
- Pearce, P.L. Australian contributions to tourist behaviour studies. J. Hosp. Tour. Manag. 2016, 26, 84–90. [Google Scholar] [CrossRef]
- Yfantidou, G.; Nikou, M.; Matsouka, O. Winter tourism in Greece: An approach to tourists’ behavior and needs. Geoj. Tour. Geosites 2018, 21, 74–87. [Google Scholar]
- Dolnicar, S. Market segmentation analysis in tourism: A perspective paper. Tour. Rev. 2019, 75, 45–48. [Google Scholar] [CrossRef]
- Won, D.; Bang, H.; Shonk, D.J. Relative importance of factors involved in choosing a regional ski destination: Influence of consumption situation and recreation specialization. J. Sport Tour. 2008, 13, 249–271. [Google Scholar] [CrossRef]
- Dickson, T.J.; Faulks, P. Exploring Overseas Snowsport Participation by Australian Skiers and Snowboarders. Tour. Rev. 2007, 62, 7–14. [Google Scholar] [CrossRef]
- Miragaia, D.A.M.; Martins, M.A.B. Mix between satisfaction and attributes destination choice: A segmentation criterion to understand the ski resorts consumers. Int. J. Tour. Res. 2015, 17, 313–324. [Google Scholar] [CrossRef]
- Tkaczynski, A.; Rundle-Thiele, S.R.; Beaumont, N. Segmentation: A Tourism Stakeholder View. Tour. Manag. 2009, 30, 169–175. [Google Scholar] [CrossRef] [Green Version]
- Alexandris, K.; Kouthouris, C.; Funk, D.; Giovani, C. Segmenting winter sport tourists by motivation: The case of recreational skiers. J. Hosp. Mark. Manag. 2009, 18, 480–499. [Google Scholar] [CrossRef]
- Hall, T.E.; Seekamp, E.; Cole, D. Do Recreation Motivations and Wilderness Involvement Relate to Support for Wilderness Management? A Segmentation Analysis. Leis. Sci. 2010, 32, 109–124. [Google Scholar] [CrossRef]
- Hudson, S.; Ritchi, B.; Timur, S. Measuring destination competitiveness: An empirical study of Canadian ski resorts. Tour. Hosp. Plan. Dev. 2004, 1, 79–94. [Google Scholar] [CrossRef]
- Priporas, C.V.; Vassiliadis, C.A.; Bellou, V.; Andronikidis, A. Exploring the constraint profile of winter sports resort tourist segments. J. Travel Res. 2015, 54, 659–671. [Google Scholar] [CrossRef] [Green Version]
- Vassiliadis, C.A.; Bellou, V.; Priporas, C.V.; Andronikidis, A. Exploring the negotiation thesis application among ski resort tourists: A segmentation approach. J. Hosp. Tour. Res. 2018, 42, 716–739. [Google Scholar] [CrossRef]
- Tsiotsou, R. Using visit frequency to segment ski resorts customers. J. Vacat. Mark. 2005, 12, 15–26. [Google Scholar] [CrossRef]
- Tumbat, G. Skiing into modernity: A cultural and environmental history. Consum. Mark. Cult. 2017, 20, 178–180. [Google Scholar] [CrossRef]
- R Core Team. R: A Language and Environment for Statistical Computing (Version 3.5.0); R Foundation for Statistical Computing: Vienna, Austria, 2018; Available online: https://www.R-project.org/ (accessed on 15 November 2019).
- Linzer, D.; Lewis, J. polCA: An r package for polytomous variable latent class analysis. J. Stat. Softw. 2011, 42, 1–29. [Google Scholar] [CrossRef] [Green Version]
- Xia, J.C.; Evans, F.H.; Spilsbury, K.; Ciesielski, V.; Arrowsmith, C.; Wright, G. Market segments based on the dominant movement patterns of tourists. Tour. Manag. 2010, 31, 464–469. [Google Scholar] [CrossRef] [Green Version]
- Ferrer-Rosell, B.; Coenders, G.; Martínez-Garcia, E. Segmentation by tourist expenditure composition: An approach with compositional data analysis and latent classes. Tour. Anal. 2016, 21, 589–602. [Google Scholar] [CrossRef]
- Neuts, B.; Romao, J.; Nijkamp, P.; Shikida, A. Market segmentation and their potential economic impacts in an ecotourism destination: An applied modelling study on Hokkaido, Japan. Tour. Econ. 2016, 22, 793–808. [Google Scholar] [CrossRef]
- Akaike, H. Information Theory and an Extension of the Maximum Likelihood Principle; Springer: New York, NY, USA, 1973; pp. 199–213. [Google Scholar]
- Schwarz, G. Estimating the dimension of a model. Ann. Stat. 1978, 6, 461–464. [Google Scholar] [CrossRef]
- Spanish National Institute of Statistics (INE). Índice de Precios Hoteleros (IPH). Available online: https://www.ine.es/jaxiT3/Tabla.htm?t=12156&L=0 (accessed on 8 October 2020).
- Aranda-Cuéllar, P.; López-Morales, J.M.; Such-Devesa, M.J. Winter Tourism Dependence: A Cyclical and Cointegration Analysis. Case Study for the Alps. Available online: https://0-journals-sagepub-com.brum.beds.ac.uk/doi/abs/10.1177/1354816620932007 (accessed on 1 January 2021).
- Falk, M.; Scaglione, M. Effects of ski lift ticket discounts on local tourism demand. Tour. Rev. 2018, 73, 480–491. [Google Scholar] [CrossRef]
- Kotler, P.; Keller, K.L. Marketing Management, 15th ed.; Pearson Education: Edinburgh Gate, Harlow, UK, 2016. [Google Scholar]
- Holmgren, M.A.; McCracken, V.A.; McCluskey, J.J. Should I ski today? The economics of ski resort season passes. Leisure/Loisir 2016, 40, 131–148. [Google Scholar] [CrossRef]
- Malasevska, I.; Haugom, E.; Hinterhuber, A.; Lien, G.; Mydland, Ø. Dynamic pricing assuming demand shifting: The alpine skiing industry. J. Travel Tour. Mark. 2020, 37, 785–803. [Google Scholar] [CrossRef]
- Grisolía, J.M.; Willis, K.G. A latent class model of theatre demand. J. Cult. Econ. 2012, 36, 113–139. [Google Scholar] [CrossRef]
- Mäntymaa, E.; Ovaskainen, V.; Juutinen, A.; Tyrväinen, L. Integrating nature-based tourism and forestry in private lands under heterogeneous visitor preferences for forest attributes. J. Environ. Plan. Manag. 2018, 61, 724–746. [Google Scholar] [CrossRef]
- Zhu, H.; Guan, H.; Han, Y.; Li, W. A study of tourists’ holiday rush-hour avoidance travel behavior considering psychographic segmentation. Sustainability 2019, 11, 3755. [Google Scholar] [CrossRef] [Green Version]
- Araña, J.E.; León, C.J. The Role of Tour-Operators as Intermediaries of Tourists’ Preferences for Corporate Social Responsibility. Available online: https://0-onlinelibrary-wiley-com.brum.beds.ac.uk/doi/abs/10.1002/jtr.2418 (accessed on 1 January 2021).
- Font, X.; Lynes, J. Corporate social responsibility in tourism and hospitality. J. Sustain. Tour. 2018, 26, 1027–1042. [Google Scholar] [CrossRef] [Green Version]


| Variables | Level | Definition | Description | Observations |
|---|---|---|---|---|
| Accommodation | 1 | Class 1 | Hotels of 1 or 2 stars and Apartments of 1 or 2 keys | 9091 |
| 2 | Class 2 | Hotels of 3 stars and Apartments of 3 keys | 18,588 | |
| 3 | Class 3 | Hotels of 4 or 5 stars and Apartments of 4 keys | 17,039 | |
| Age | 1 | Young | Up to 33 years | 22,225 |
| 2 | Middle age | 34 to 49 years | 18,800 | |
| 3 | Senior | Over 50 years | 9681 | |
| Group size | 1 | Solo | A tourist travelling alone | 1233 |
| 2 | Couple | 2 persons | 25,634 | |
| 3 | Family | 3 or 4 persons | 17,067 | |
| 4 | Group | 5 persons or more | 6772 | |
| Nationality | 1 | Spanish | Tourists from Spain | 31,955 |
| 2 | Non-Spanish | Other countries | 18,751 | |
| Package | 1 | Accommodation + ski pass | Hotel or apartment + Ski pass | 45,431 |
| 2 | Accommodation only | No ski pass | 5275 | |
| Previous experience | 1 | No | Never bought a package on esquiades.com before | 24,669 |
| 2 | Yes | Bought a package at least once before | 26,037 | |
| Season | 1 | Winter | January to March | 36,254 |
| 2 | Spring | April to June | 2666 | |
| 3 | Summer | July to September | 1867 | |
| 4 | Autumn | October to December | 9919 | |
| Length of Stay | 1 | Short | 1 or 2 days | 24,901 |
| 2 | Intermediate | 3 days or more | 25,805 |
| Covariate | Mean | Standard Deviation | Median | Skewness | Kurtosis |
|---|---|---|---|---|---|
| Deflated daily expenditure per tourism (DDET) | 68.73 | 26.25 | 64.66 | 0.93 | 1.22 |
| Service valuation (SV) | 8.64 | 1.86 | 9.00 | −1.29 | 2.34 |
| MODEL | Covariates |
|---|---|
| Latent class model (LCM) without covariates | Not included |
| LCM with daily expenditure as covariate | DDET |
| LCM with service valuation as covariate | SV |
| LCM with 2 additive covariates | DDET + SV |
| LCM with 2 covariates with cross-effects | DDET + SV + (DDET*SV) |
| Estimated Class Population Shares | |||||
| Class 1 | Class 2 | Class 3 | Class 4 | Class 5 | Class 6 |
| 26.12% | 25.97% | 22.34% | 14.17% | 6.07% | 5.33% |
| Fit for 6 latent classes: | |||||
| 2/1 | Coefficient βr,i | Std. error | t value | p(>|t|) | |
| Intercept | −0.452 | 0.003 | −142.042 | 0.000 | |
| DDET | −0.027 | 0.002 | −16.750 | 0.000 | |
| SV | −0.650 | 0.019 | −33.499 | 0.000 | |
| DDET*SV | 0.015 | 0.000 | 34.556 | 0.000 | |
| 3/1 | Coefficient βr,i | Std. error | t value | p(>|t|) | |
| Intercept | −0.293 | 0.003 | −93.694 | 0.000 | |
| DDET | −0.033 | 0.002 | −18.785 | 0.000 | |
| SV | −0.700 | 0.020 | −34.649 | 0.000 | |
| DDET*SV | 0.016 | 0.000 | 35.320 | 0.000 | |
| 4/1 | Coefficient βr,i | Std. error | t value | p(>|t|) | |
| Intercept | 0.122 | 0.005 | 26.706 | 0.000 | |
| DDET | −0.029 | 0.002 | −18.756 | 0.000 | |
| SV | −0.637 | 0.019 | −33.051 | 0.000 | |
| DDET*SV | 0.013 | 0.000 | 30.801 | 0.000 | |
| 5/1 | Coefficient βr,i | Std. error | t value | p(>|t|) | |
| Intercept | 0.148 | 0.003 | 42.488 | 0.000 | |
| DDET | −0.056 | 0.002 | −27.973 | 0.000 | |
| SV | −0.775 | 0.021 | −36.207 | 0.000 | |
| DDET*SV | 0.017 | 0.001 | 35.703 | 0.000 | |
| 6/1 | Coefficient βr,i | Std. error | t value | p(>|t|) | |
| Intercept | 0.108 | 0.004 | 24.720 | 0.000 | |
| DDET | −0.039 | 0.002 | −16.004 | 0.000 | |
| SV | 0.089 | 0.012 | 7.173 | 0.000 | |
| DDET*SV | −0.001 | 0.001 | −3.288 | 0.001 | |
| Number of observations: 44,718 Number of estimated parameters: 110 Maximum log-likelihood: −283,358.4 | |||||
Publisher’s Note: MDPI stays neutral with regard to jurisdictional claims in published maps and institutional affiliations. |
© 2021 by the authors. Licensee MDPI, Basel, Switzerland. This article is an open access article distributed under the terms and conditions of the Creative Commons Attribution (CC BY) license (http://creativecommons.org/licenses/by/4.0/).
Share and Cite
Barreal, J.; Ferrer-Rosell, B.; Cristobal-Fransi, E.; Jannes, G. Influence of Service Valuation and Package Cost on Market Segmentation: The Case of Online Demand for Spanish and Andorra Ski Resorts. Sustainability 2021, 13, 2938. https://0-doi-org.brum.beds.ac.uk/10.3390/su13052938
Barreal J, Ferrer-Rosell B, Cristobal-Fransi E, Jannes G. Influence of Service Valuation and Package Cost on Market Segmentation: The Case of Online Demand for Spanish and Andorra Ski Resorts. Sustainability. 2021; 13(5):2938. https://0-doi-org.brum.beds.ac.uk/10.3390/su13052938
Chicago/Turabian StyleBarreal, Jesús, Berta Ferrer-Rosell, Eduard Cristobal-Fransi, and Gil Jannes. 2021. "Influence of Service Valuation and Package Cost on Market Segmentation: The Case of Online Demand for Spanish and Andorra Ski Resorts" Sustainability 13, no. 5: 2938. https://0-doi-org.brum.beds.ac.uk/10.3390/su13052938