
Monitoring Land Use/Cover Change Using Remotely Sensed Data in Guangzhou of China


1
Guangzhou Urban Planning & Design Survey Research Institute, Guangzhou 440100, China
2
Key Laboratory of Digital Earth, Aerospace Information Research Institute, Chinese Academy of Sciences, Beijing 100094, China
*
Author to whom correspondence should be addressed.
Sustainability 2021, 13(5), 2944; https://0-doi-org.brum.beds.ac.uk/10.3390/su13052944
Submission received: 13 January 2021
/
Revised: 21 February 2021
/
Accepted: 3 March 2021
/
Published: 8 March 2021
(This article belongs to the Special Issue Policy, Land Use and Management of Natural Resources)
Abstract
:Land use/cover change (LUCC) has a crucial influence on ecosystem function, environmental change and decision support. Rapid and precise monitoring of land use/cover change information is essential for utilization and management of land resources. The objectives of this study were to monitor land use/cover change of Guangzhou of China from 1986 to 2018 using remotely sensed data, and analyze the correlation between artificial surface expansion and the gross domestic product (GDP) growth. Supervised classification was performed using Random Forest classifier, and the overall accuracy (OA) ranged from 86.42% to 96.58% and kappa coefficient (K) ranged from 0.8079 to 0.9499. The results show that the built-up area of Guangzhou of China from 1986 to 2018 continued to increase. However, the vegetation area continued to decrease during 32 years. The built-up area increased by 1315.56 km2 (increased by 439.34%) with an average growth of 41.11 km2/year. The vegetation area reduced by 1290.78 km2 (reduced by 19.99%) with an average reduction of 40.34 km2/year. Research has shown that the reduced vegetation area was mainly converted into built-up area. The area of water bodies and bare lands was relatively stable and had a little change. The results indicate that the GDP had a strong positive correlation with built-up area (R2 = 0.98). However, there is a strong negative correlation between the GDP and vegetation area (R2 = 0.97) in Guangzhou City, China. As a consequence, the increase of built-up area was at the cost of the reduction of vegetation area.
Keywords:
land use/cover change; remote sensing; classification; Landsat; Hyperion; Sentinel-1; random forest; GDP1. Introduction
Land use/cover change (LUCC) contains very important information for global environmental change and human-environmental science [1,2,3,4,5,6]. LUCC can directly reflect on the way humans utilize the land and the influence of human activities on the ecological environment of Earth surface [7,8]. There is an increasing need for LUCC information to promote the sustainable development of ecological environment and natural resources [9]. In recent years, LUCC has been changing at a vertiginous pace, especially in urban areas, mainly due to rapid industrialization and urbanization [4,10]. With urban expansion, more and more agricultural land, forest and water bodies are being converted to urban land [10], with serious implications on food production, biodiversity, environmental change, human health and natural hazards [11,12].
The expansion of cities promotes rapid economic development, however, urban expansion induces economic growth often at the expense of environmental degradation in developing countries [13]. Therefore, rapid and precise monitoring of land use/cover change information is essential for utilization and management of land resources [14,15,16,17].
Remote sensing systems are an efficient tool for acquiring land cover information and monitoring land use/cover change [15,18,19,20]. Spaceborne sensors can quickly and periodically acquire remotely sensed data over large areas [21]. These data provide economical and reliable data source for monitoring land use/cover change periodically [6]. Remote sensing systems are divided into passive and active remote sensing. Passive remote sensing data are mainly an optical imagery with a usually high spatial resolution and rich texture information. It helps to easily identify the type and status of the ground object through visual interpretation [22]. Passive remote sensing sensors have a wide spectrum range, which can comprehensively observe ground features, however, optical images are easily affected by cloud conditions [23,24]. Active remote sensing sensor emits a certain form of electromagnetic waves to a target, and then the sensor receives and records the reflected waves, such as synthetic aperture radar (SAR) [25] and Light Detection and Ranging (LiDAR) [26]. SAR sensor has the advantage of all-weather collecting data and can continuously monitor the target [23,27]. Moreover, SAR has a certain penetration ability to the target object and cloud, and therefore can reduce the influence of rain, snow and cloud [28]. LiDAR can quickly obtain the three-dimensional information of ground objects, and the pulses emitted by the LiDAR systems can penetrate the vegetation canopy to the ground [29]. LiDAR data have been widely used in 3D modeling and estimation of vegetation structure parameters [30,31].
Using remotely sensed data can objectively obtain LUCC information. Many studies have been successfully conducted on LUCC using remotely sensed data [6]. Calderón-Loor, et al. [32] assessed LUCC from 1985 to 2015 using Landsat images and results showed that the method presented by the authors is feasible for monitoring LUCC over large areas. Mallupattu and Sreenivasula Reddy [14] studied LUCC using remotely sensed data in urban areas and found that it was significant from 1976 to 2003. However, optical remote sensing images can only be suitable for cloud-free conditions. SAR data are able to overcome this problem and have great potential for land use change detection [33]. In recent years, the number of researchers using SAR data to study land cover has significantly increased [34,35]. Nevertheless, SAR sensors cannot obtain spectral information of target object [36]. To make use of both data sources, some researchers used combined optical images and SAR data to study LUCC and study results indicated that the combined data could produce better results for land cover classification and information extraction than single remotely sensed data [37,38,39].
China’s reform and opening-up policies started at the end of 1978, which referred to two important policy areas: internal reforms within China itself and the active external opening-up to the rest of the world. The reform and opening-up policies introduced private business and market incentives to what was a state-led communist system. Since the reform and opening up, Guangzhou’s economy has been developing rapidly and continuously, and the GDP reached 2.3 trillion CNY in 2018. Guangzhou’s GDP ranks the 4th in China, and GDP per capita was about 154,000 CNY in 2018. With the development of economy, the urbanization level of Guangzhou City has been rapidly developed. Therefore, the built-up area has been greatly expanded. LUCC research has been performed for studying urban expansion in Guangzhou City. For example, Wu et al. (2016) classified land cover using Landsat images and investigated the influence of urban expansion on LUCC [40].
In this study, we will study the feasibility of using multi-source remote sensing data to monitor LUCC and the correlation between the urban expansion and the GDP in Guangzhou. We first preprocessed the remote sensing images in this study. And then, the remote sensing images were classified into vegetation, build-up, water bodies and bare lands using Random Forest classifier, and classification accuracy was assessed using the indicators of overall accuracy and kappa coefficient. Finally, we analyzed LUCC and investigated the influence of urban expansion on the GDP growth. The main objectives of this study are (1) to comprehensively utilize passive optical images and active radar data to monitor LUCC of Guangzhou City from 1986 to 2018; and (2) analyze the correlation between artificial surface expansion and the gross domestic product (GDP) growth.
2. Materials and Methods
2.1. Study Area
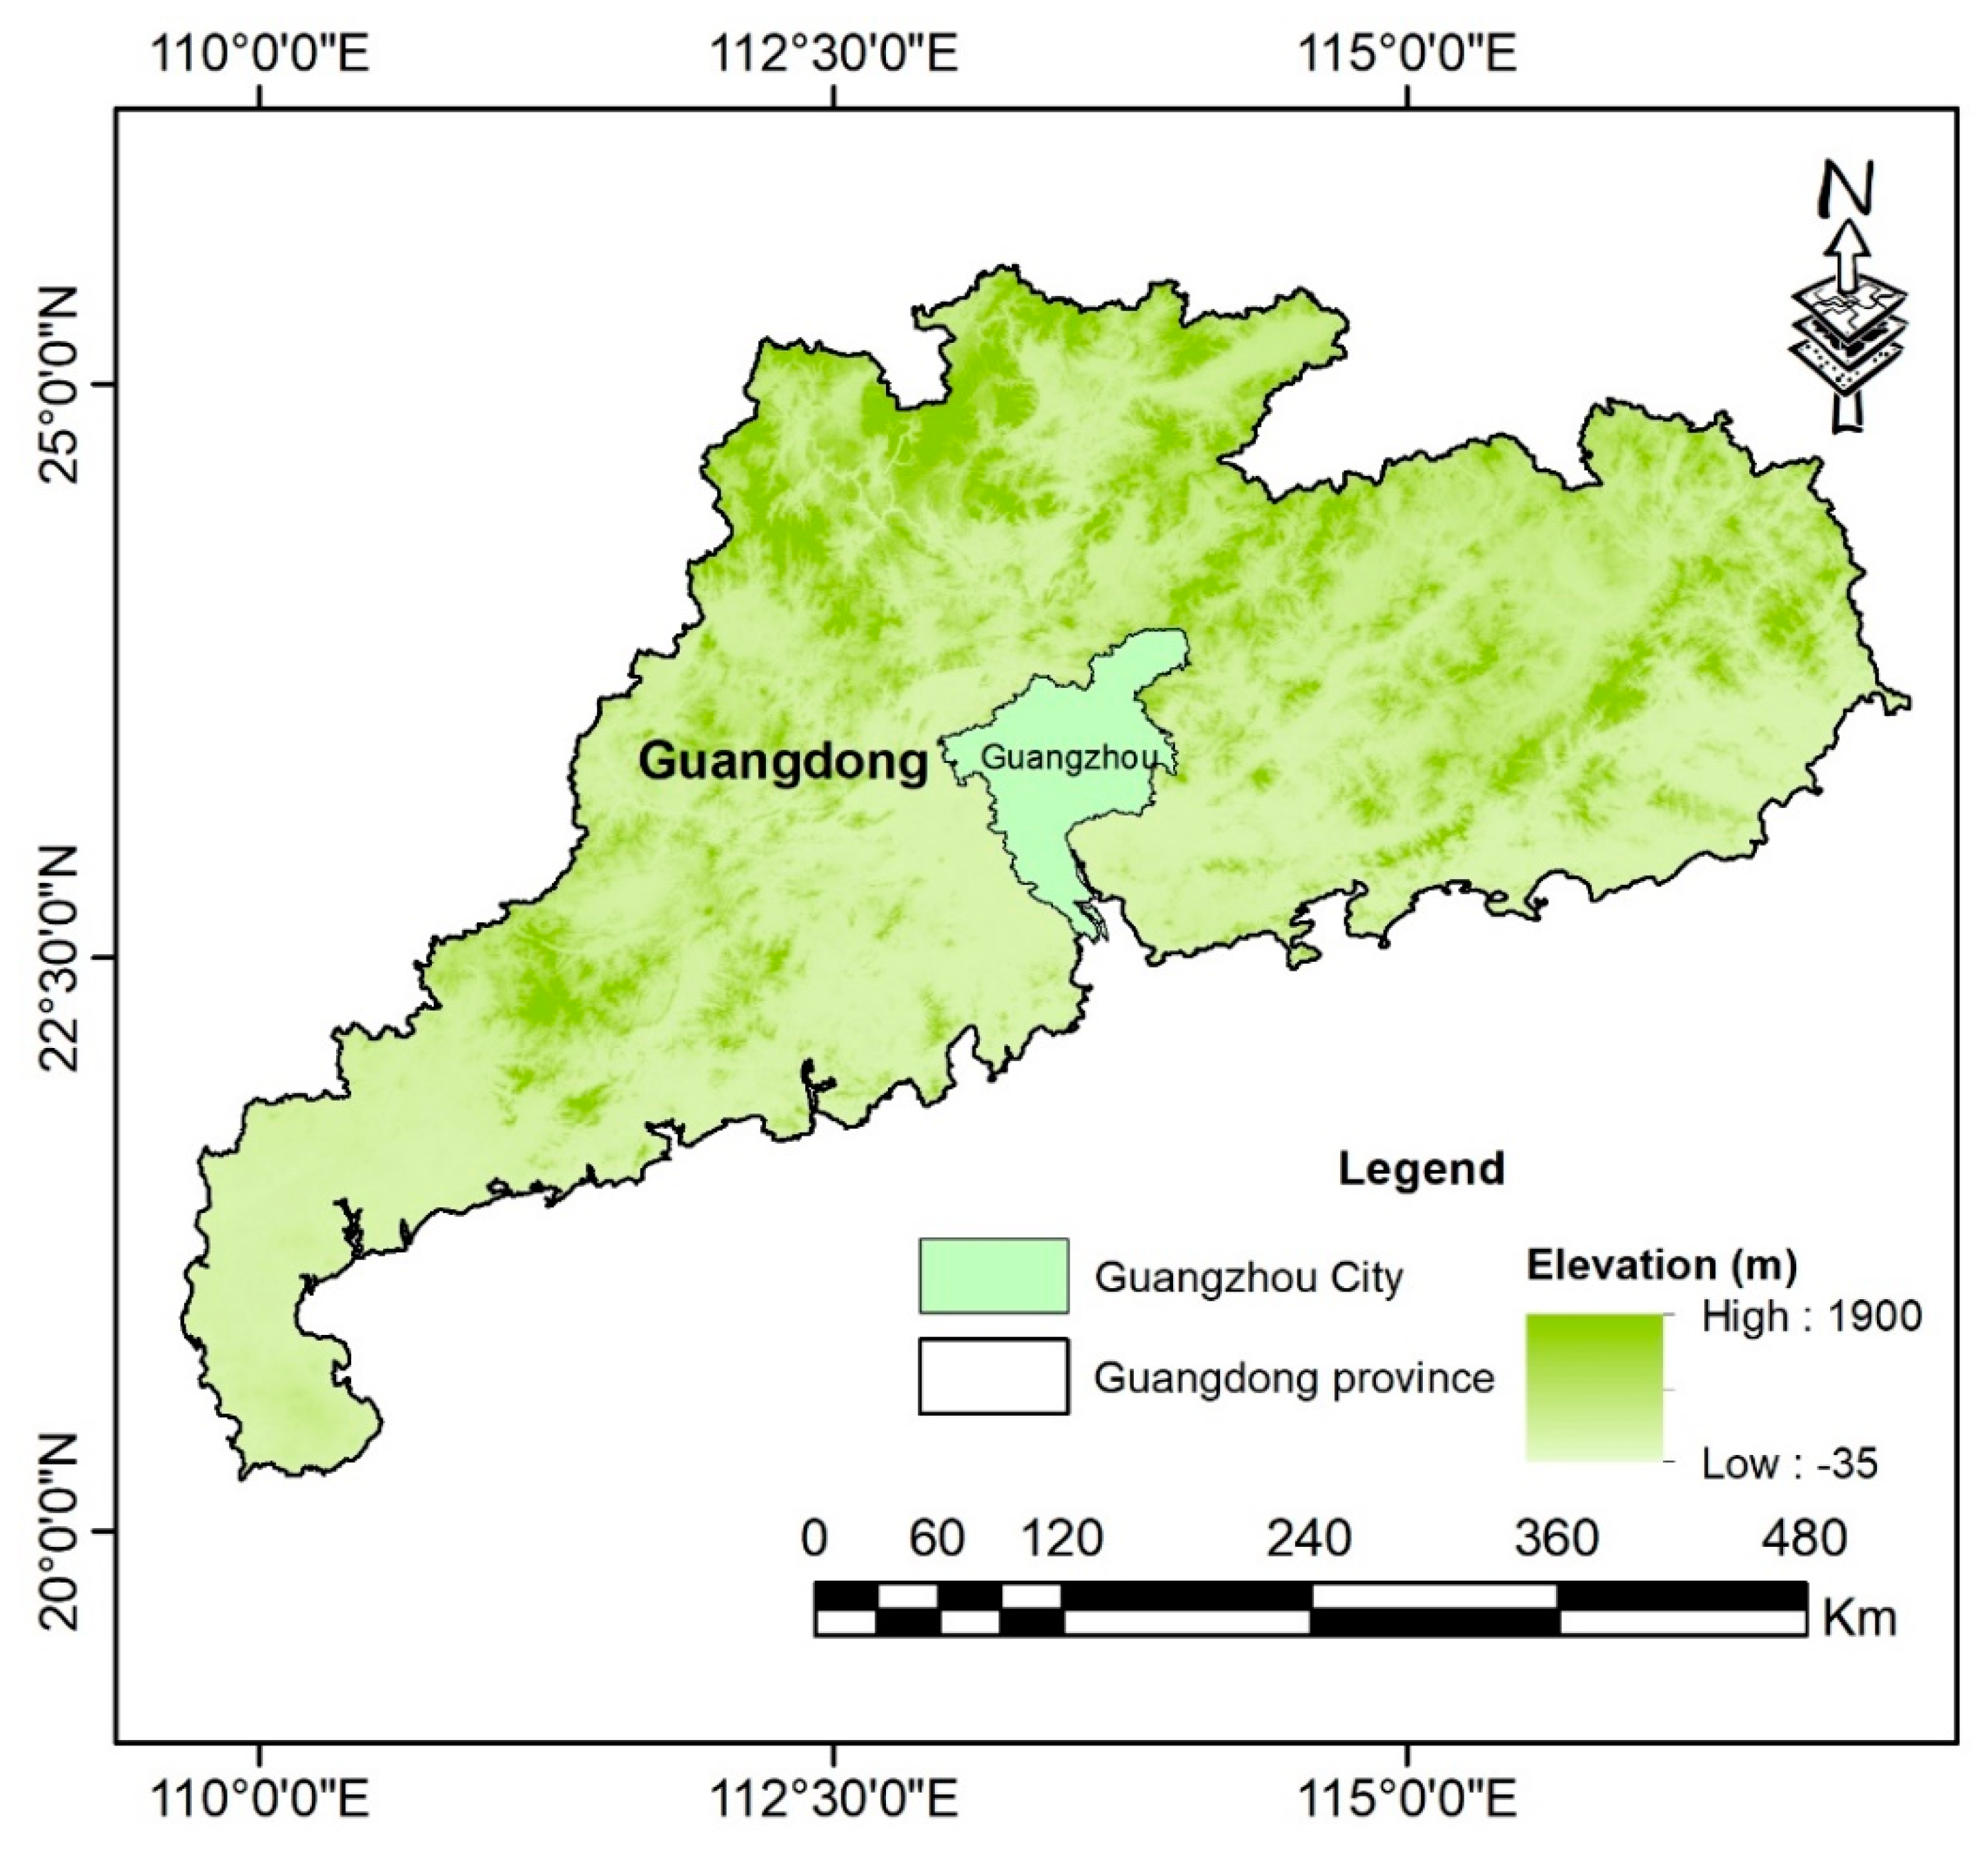
The research area is located in Guangzhou of Guangdong Province, China (Figure 1). Guangzhou City is the capital in Guangdong province, adjacent to Hong Kong and Macao. Guangzhou belongs to hilly area with frequent cloud and rain coverage. Guangzhou is the maritime subtropical monsoon climate. The annual average temperature is 20–22 ℃ and annual rainfall is about 1720 mm with average relative humidity of 77%. Guangzhou City is rich in vegetation types and has abundant rainfall, which is conducive to plant growth. The vegetation in Guangzhou is evergreen all year round. Guangzhou Development Zone was established in 1984 and is one of the first batch of national economic and technological development zones. Guangzhou is a hub of land, sea and air transportation in southern China, which is known as the South Gate of the motherland. Moreover, it is an important coastal port city opened to the outside world and a famous tourist city in southern China. Guangzhou City is a megacity and a national central city, which is an international business center. Guangzhou City has a permanent population of 15.3 million with a GDP of 2.3 trillion CNY in 2018. China is a developing country. In recent years, more and more people from rural areas are moving into cities, which brings abundant labor force to China’s industry and promotes the rapid development of China’s economy. The rapid urbanization rate and economic growth of Guangzhou, together its challenging climatic conditions, made it the ideal scenario to use remotely sensed data to monitor LUCC. The economy of Guangzhou has maintained a high speed and healthy development. Guangzhou’s GDP has ranked third in China for 27 consecutive years, from 1989 to 2016.
2.2. Remotely Sensed Data and Preprocessing
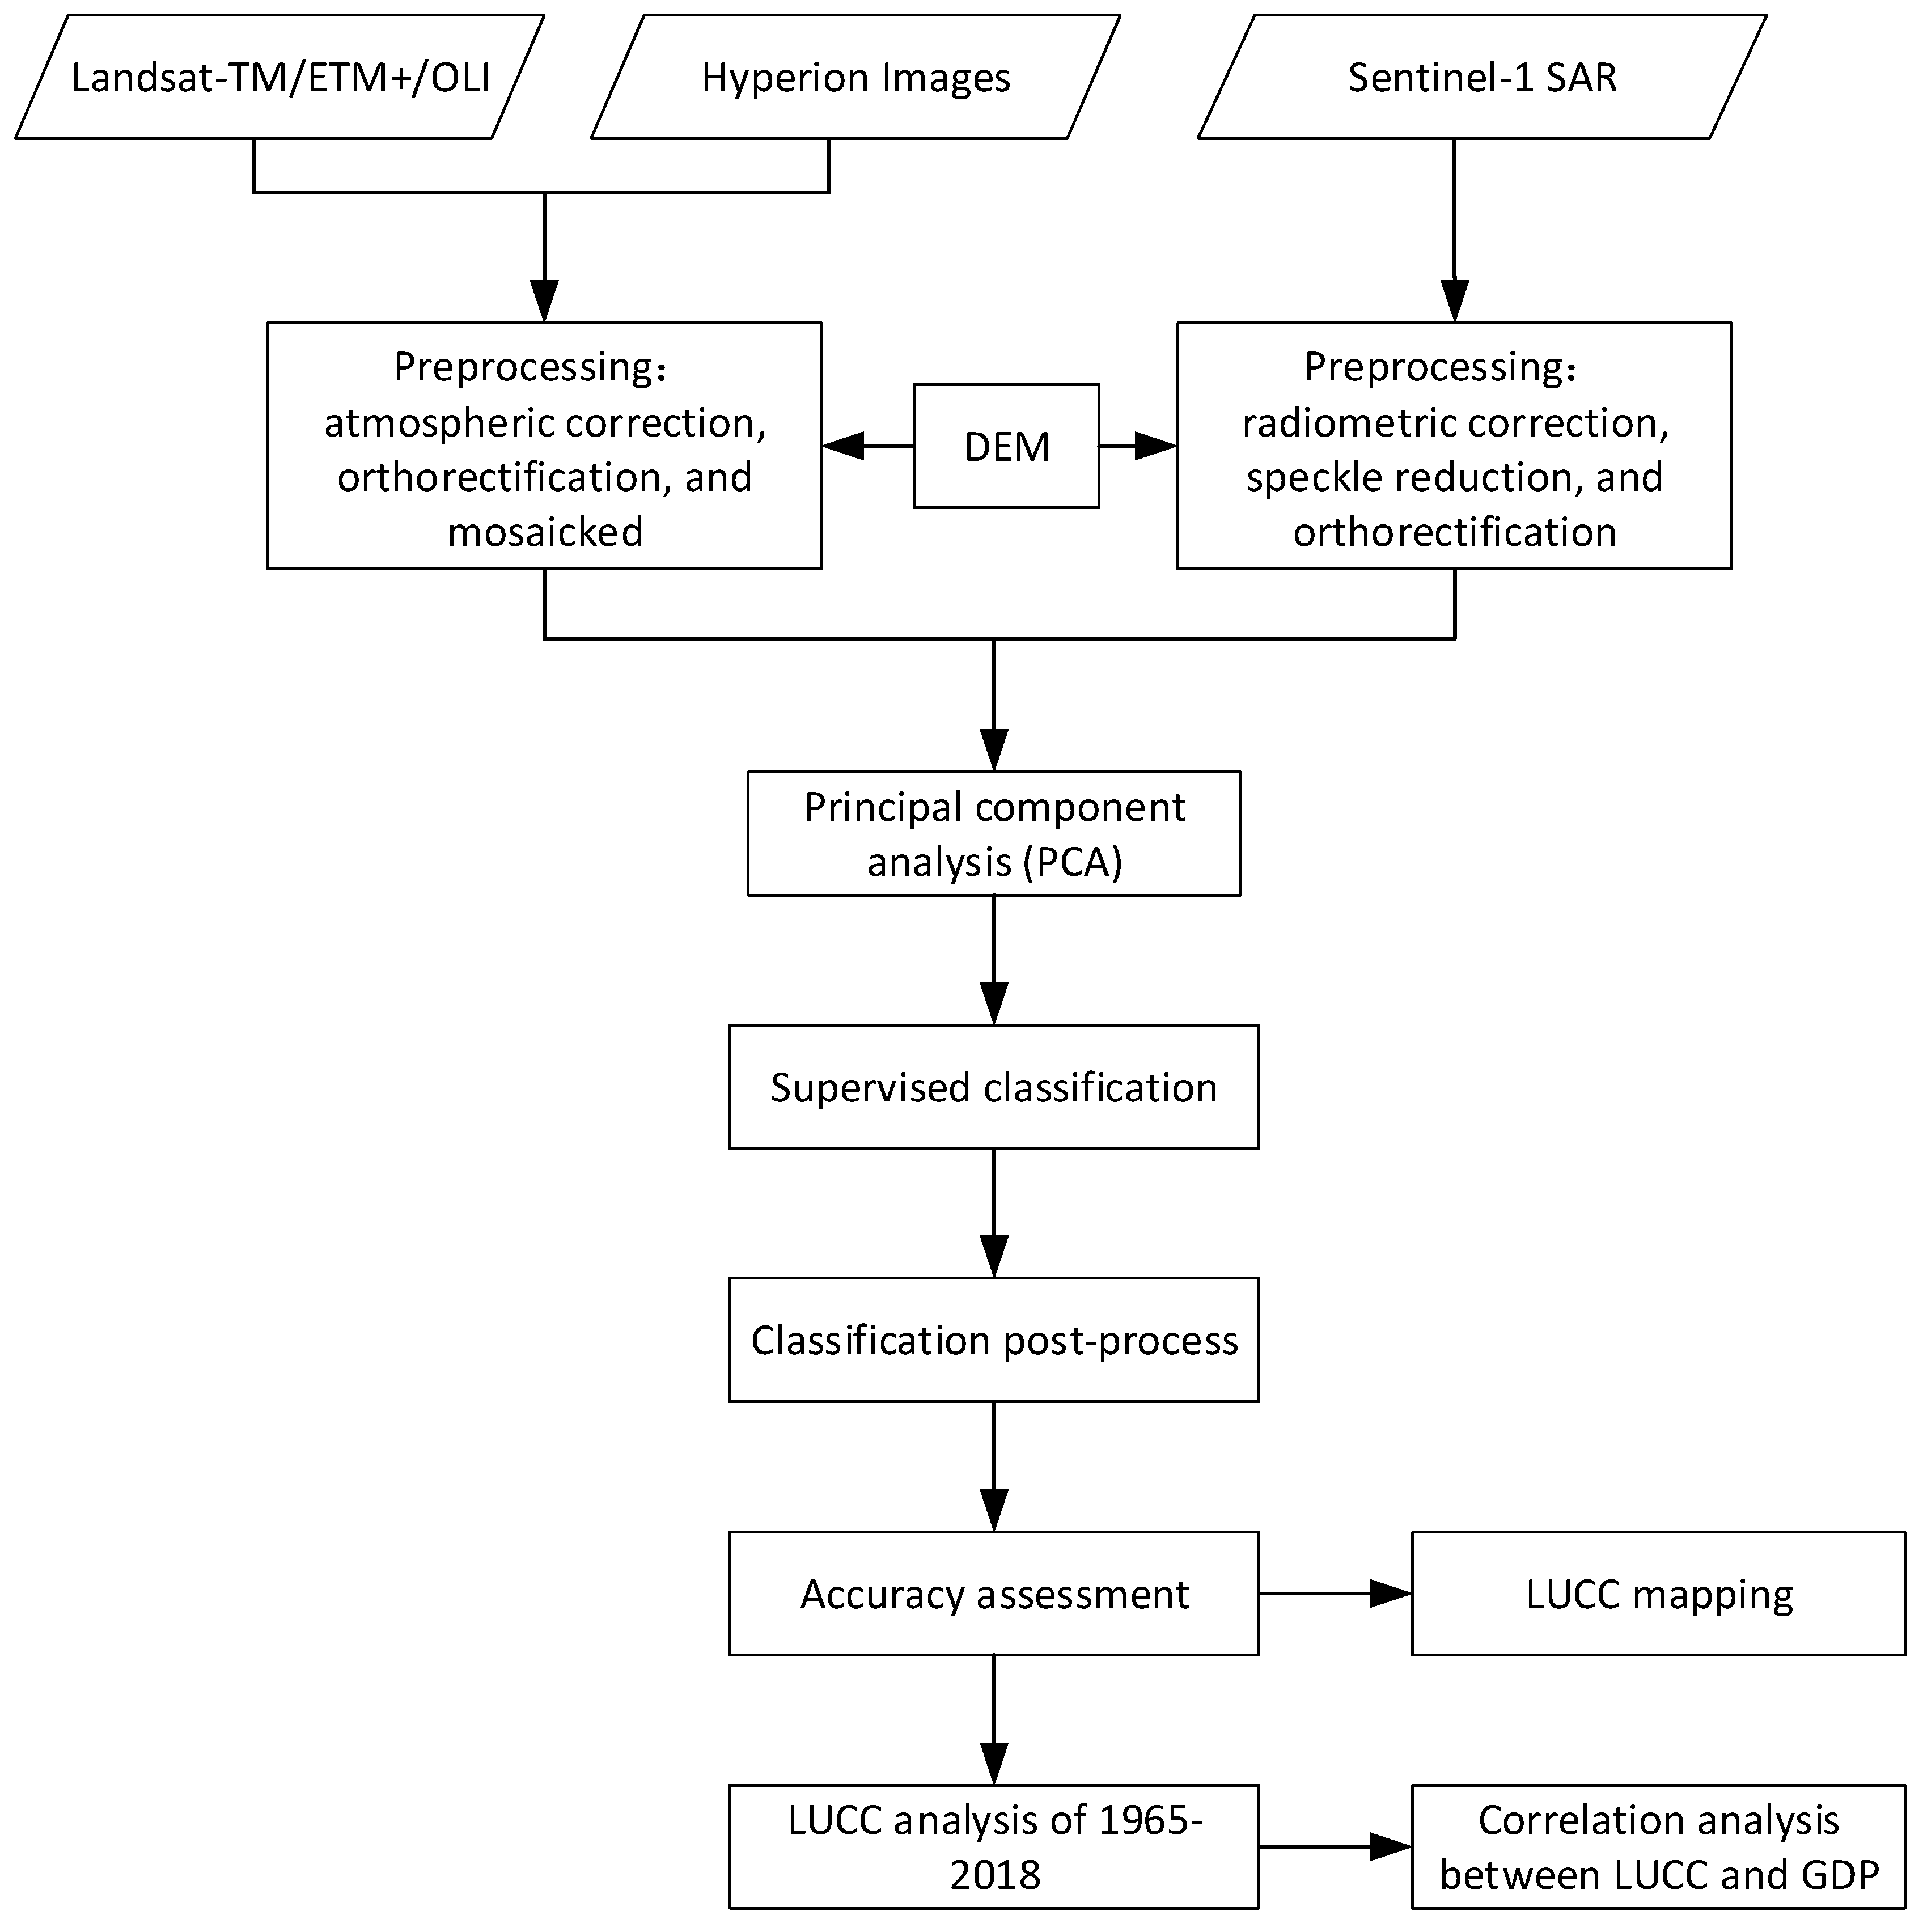
Landsat images (TM/ETM+/OLI) are a moderate resolution (30 m) remote sensing data. In this study, optical images from 1986 to 2018 were acquired from USGS Global Visualization Viewer (GloVis) [41]. We selected remote sensing images with no or less cloud cover to improve accuracy of land cover classification. The study area of Guangzhou City needs two scene images. Landsat path/row numbers are 122/43 and 122/44. We only used the bands with a resolution of 30 m. Therefore, a total of 66 scenes remote sensing data were downloaded. Hyperion data were collected by the hyperspectral sensor on the EO-1 Earth Observation satellite. The Hyperion image has 242 spectral bands with a spatial resolution of 30 m. Sentinel-1 provides data with four different modes. Sentinel-1 SAR data were downloaded from European Space Agency website [42], which were C-band data in Interferometric Wide Swath mode [43]. Sentinel-1 SAR images collected were high-resolution (HR) Ground Range Detected (GRD) product with a pixel spacing of 10 m [44] and were resampled to 30 m to be consistent with Landsat data. Landsat data were radiometrically corrected firstly. And then, atmospheric correction was performed to remove the effect of atmosphere. Finally, geometric rectification and orthorectification were taken on Landsat data. Moreover, the remote sensing data of each year from 1986 to 2018 were mosaicked and cropped to cover the whole study area. Preprocessing of Hyperion data included noise removal, stripes removal, atmospheric correction, geometric rectification and orthorectification. We used a minimum noise fraction (MNF) to smooth the data. The atmospheric correction was performed using Line-of-sight Atmospheric Analysis of Spectral Hypercubes (FLAASH) in ENVI software. Sentinel-1 SAR images were processed using the software of Sentinel Application Platforms (SNAP) provided by the European Space Agency. The preprocessing of SAR images included radiometric correction, speckle reduction and terrain-correction. Radiometric calibration was performed to convert SAR image pixel values to radar intensity backscatter coefficient. Lee Filter of 3 × 3 pixel size was used to reduce the speckle effect in the image. Terrain-correction was performed using the Range-Doppler Terrain Correction Tool in SNAP. All data were orthorectified using a digital elevation model (DEM) with a spatial resolution of 12.5 m. Principal component analysis (PCA) was performed for each pre-processed data source. PCA transformation is based on the variance and covariance of the data set [45], which transforms the data to a new coordinate system to reduce the multidimensional datasets into lower dimensions [46]. PCA transformation will produce some uncorrelated variables called principal components, and only the first few principal components may account for meaningful amounts of variance in the original data [47]. The flow chart of this study is shown in Figure 2.
2.3. Classification of Land Cover and Post Process
In this study, land cover was classified into four classes: vegetation, build-up (artificial surfaces), water bodies and bare lands. Remote sensing images could be classified according to supervised and unsupervised classification methods. Supervised classification method is to select some representative training samples to train the classifier, and then automatically classify the data of the whole study area according to the classifier. Unsupervised classification generates clusters based on similar spectral characteristics inherent in the image. Unsupervised classification method classifies the image without providing training samples. In the study, we used supervised classification method to extract land cover information. Random forest (RF) classifier is an ensemble learning algorithm, which can be used as classification and regression. Researchers have used RF to classify land cover such as Mahdianpari, Salehi, Mohammadimanesh and Motagh [35], Onojeghuo and Onojeghuo [48],Pitkänen and Käyhkö [49]. Previous study results showed that RF classifier has a higher classification accuracy compared with traditional classifiers [50,51]. Therefore, we used RF classifier to perform land cover classification in this study. We selected 1578, 1291, 836 and 1125 training samples for vegetation, build-up, water bodies and bare lands, respectively. The samples were selected through visual on screen, and the selected samples were irregular polygons with different sizes. Training samples were distributed evenly throughout the study area. The classification procedure of remote sensing image usually produces some small and isolated spots [52]. Regardless of the perspective of thematic mapping or the perspective of practical application, they need to be eliminated by classification post-process method. However, the classification accuracy was affected by remote sensing image quality and cloud cover, and therefore, the classification errors varied in different years. The errors in time series of land cover classification can also cause LUCC errors. We used Majority Analysis and Minority Analysis to eliminate small spots. The classification accuracies were assessed using the indicators of overall accuracy (OA) and kappa coefficient (K). Overall accuracy assessed the correctly classified areas for the whole image and is computed using the ratio of the total number of correct classifications to the total number of sample points (Equation (1)). The kappa coefficient (Equation (2)) represents the degree of concordance between reference data and classified data [35].
where n is the total number of sample points, nc is the correctly classified points, i is the class number, ni,i is the number of values belonging to the truth class i that have also been classified as class i, n+i is the total number of truth values belonging to class i, ni+ is the total number of predicted values belonging to class i.
3. Results and Discussion
3.1. Land Use/Cover Change
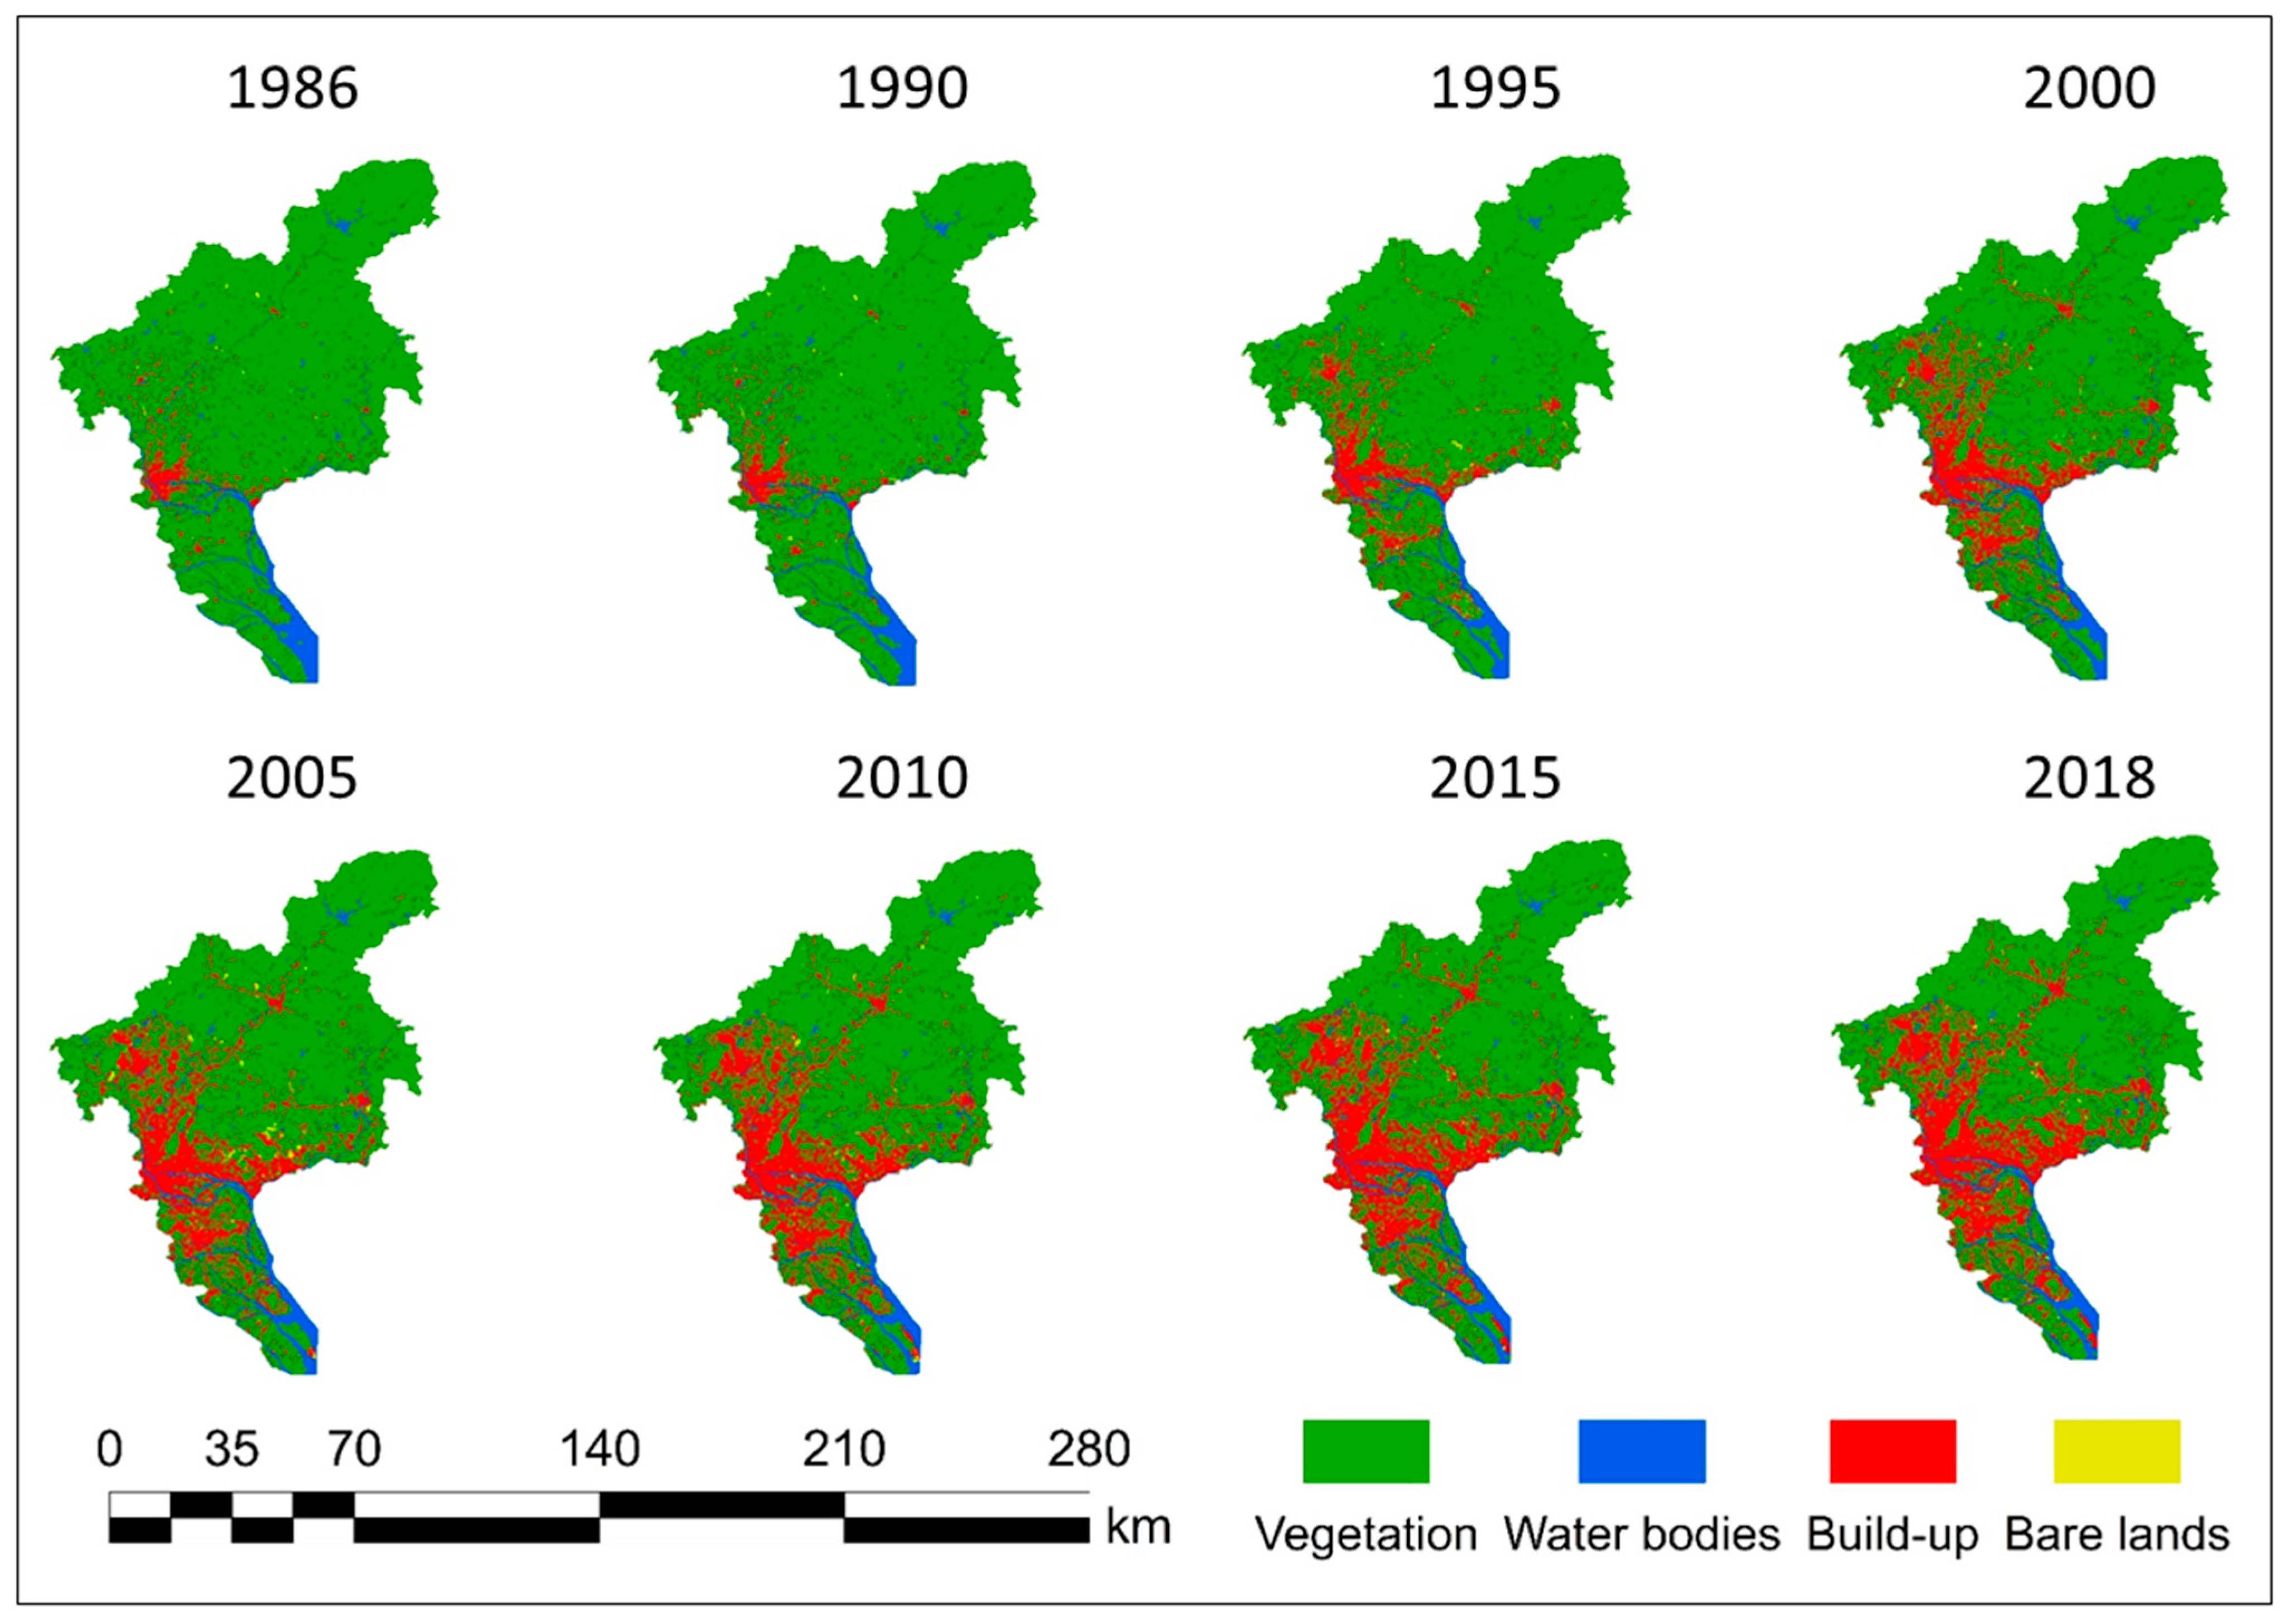
A consistent time-series land cover classification was performed for Guangzhou City from 1986 to 2018. The accuracies of land use classification were assessed. The overall accuracy varied from 86.42% to 96.58% with kappa coefficient from 0.8079 to 0.9499. The variations in classification accuracy may be attributed to differences in temporal or quality of remote sensing data. Our classification accuracies were comparable with previous studies, such as Calderón-Loor, et al. [32], Mahdianpari, et al. [35] and Tadele, et al. [53]. Our classification accuracies were comparable with these previous studies, and therefore, our study is acceptable in accuracy for monitoring LUCC of Guangzhou City. The classification accuracy of each year is shown in Table 1. The LUCC maps of Guangzhou City, China from 1986 to 2018 are shown in Figure 3. We could find that the built-up area has been continuously expanding from 1986 to 2018, and correspondingly, the vegetation area has been decreasing (Figure 3).
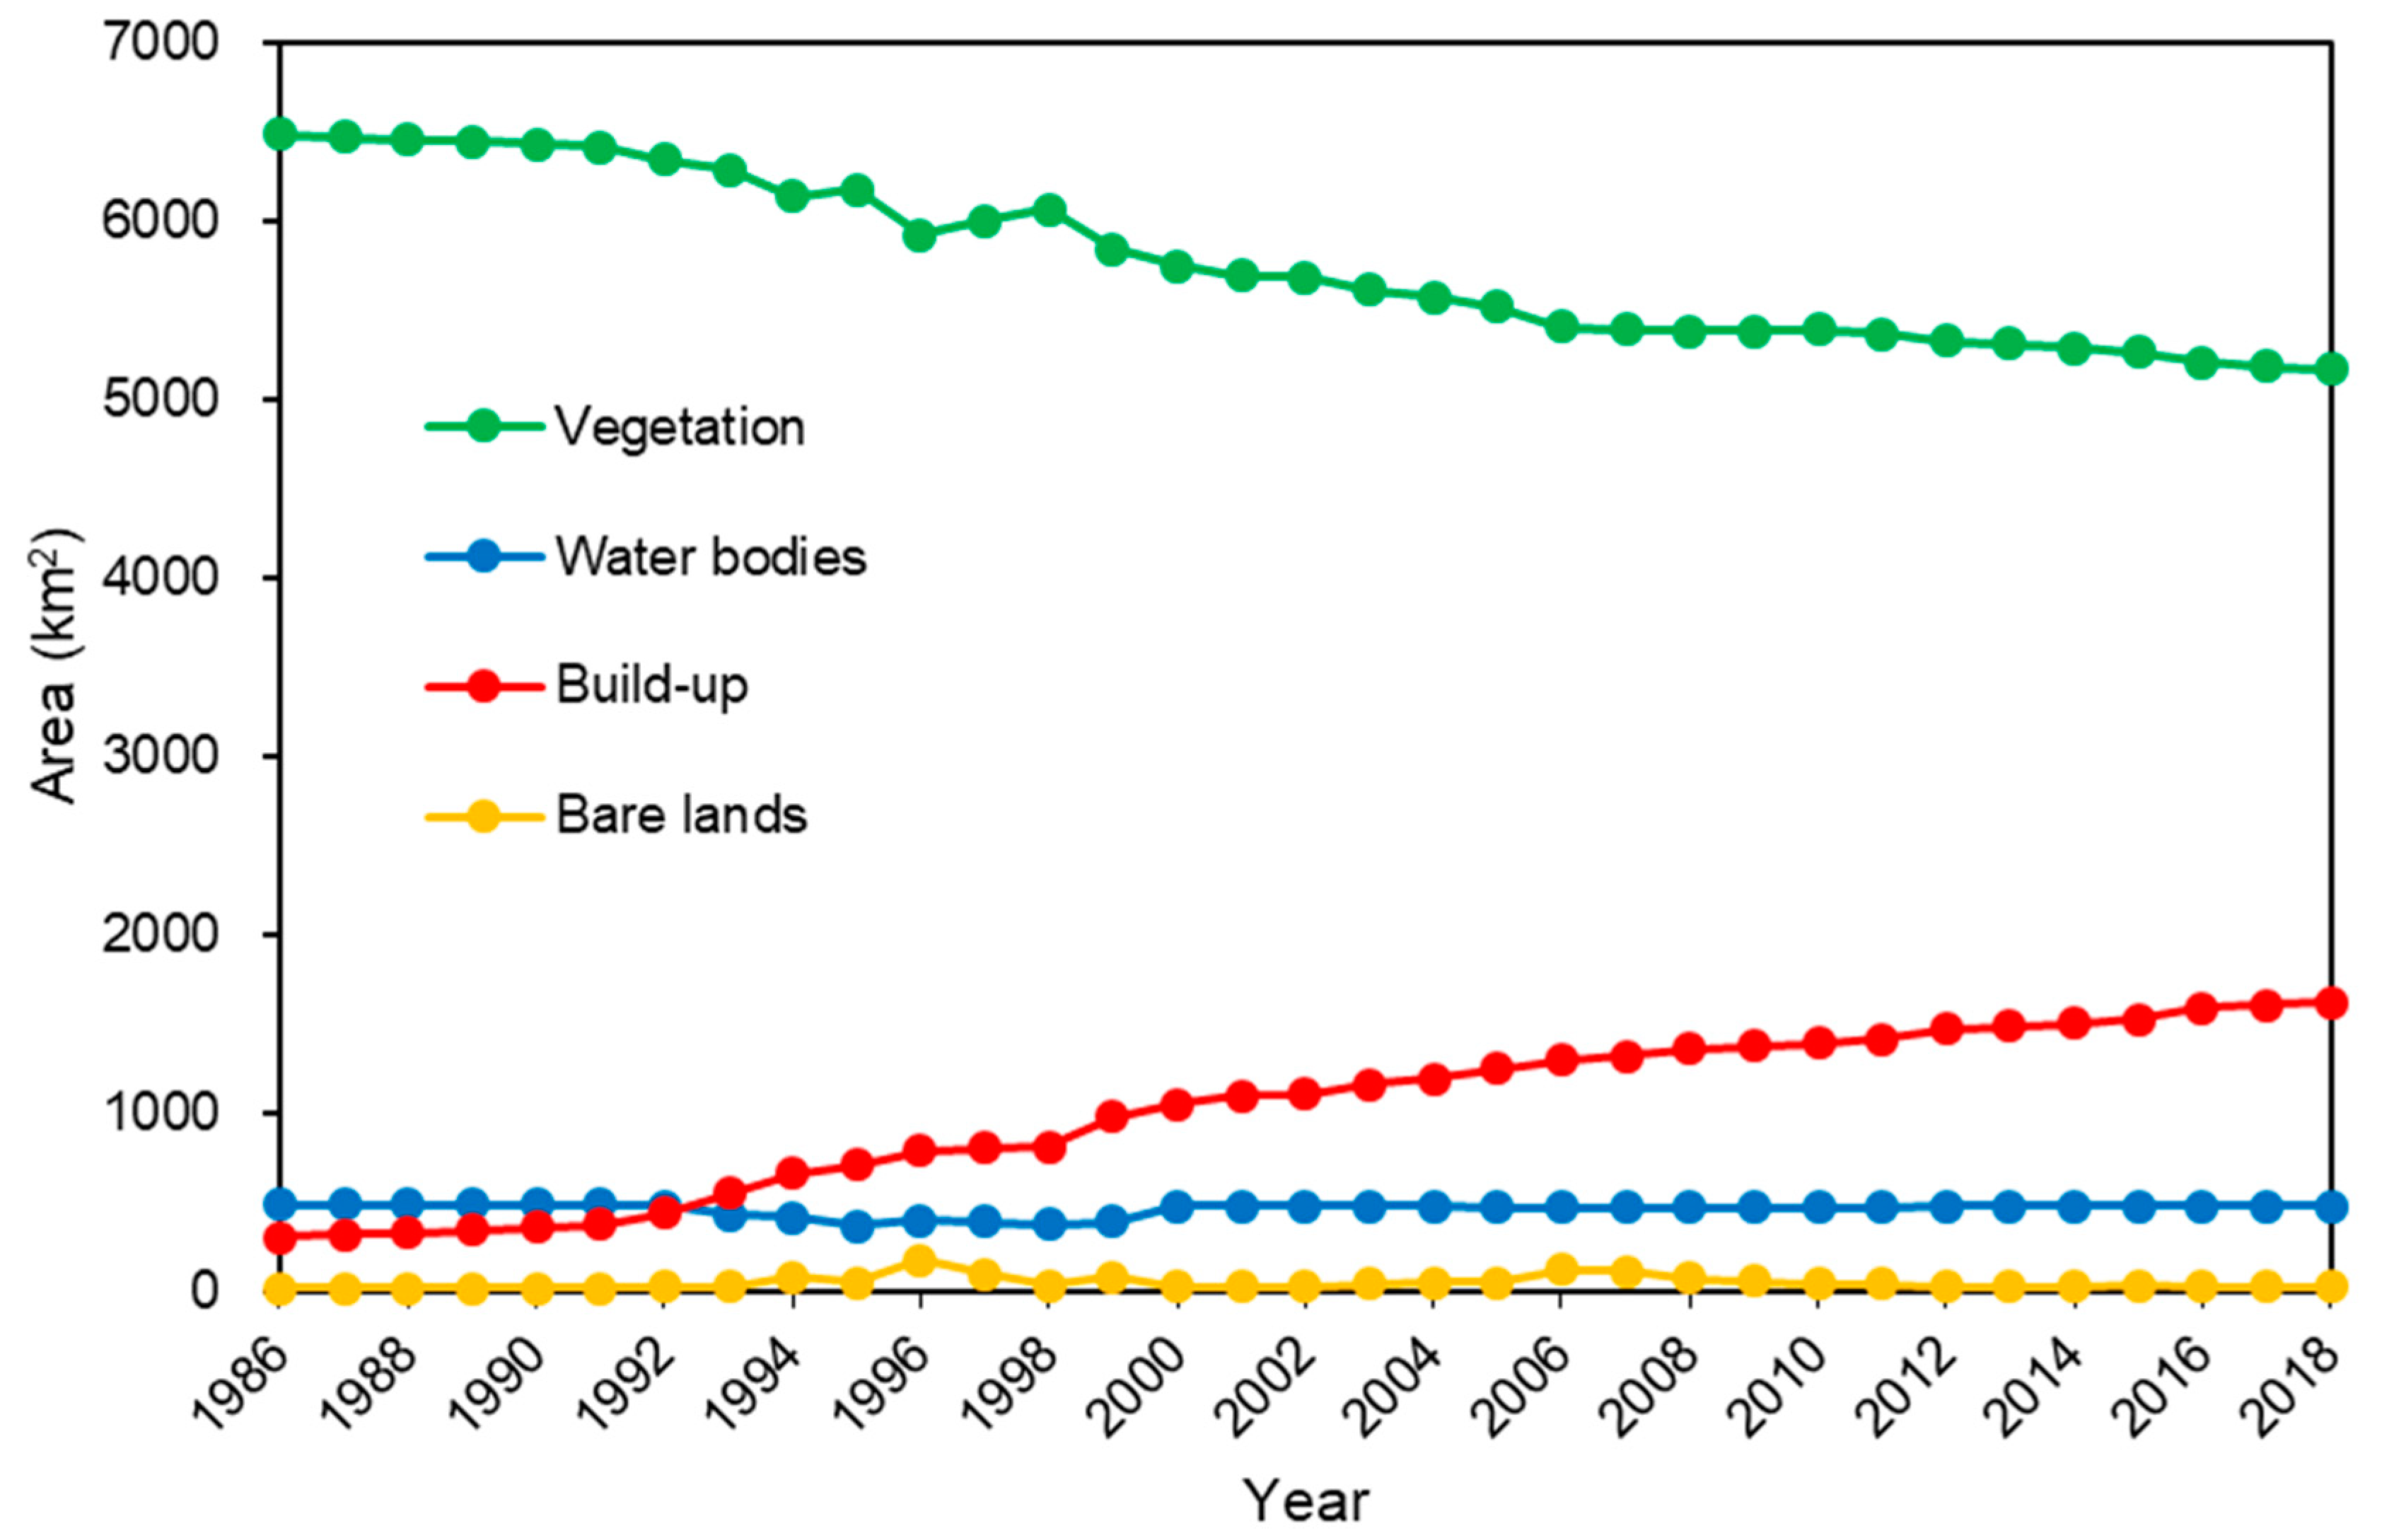
The changes of area in the build-up, vegetation, water bodies and bare lands of Guangzhou City from 1986 to 2018 are shown in Figure 4. As shown in Figure 4, the built-up area continually increased from 1986 to 2018, while the vegetation area has been consistently declining from 1986 to 2018, despite slight fluctuations between 1995 and 1998. These variations coincided with a minor slow down on the growth rate of the built-up area, which peaked again in 2000. The area of water bodies and bare lands was relatively stable and had little change in them.
With the development of economy and the increase of urban residents, the urban land of Guangzhou has expanded rapidly. Urban expansion will cause great transformation in LUCC [54], which can lead to an increase in natural disasters and destruction of natural habitats. Moreover, more and more agricultural land is being converted to urban land use, which will cause a reduction in food production and threaten food security. China is an agricultural country and also a country with large population. In China, grain is always the most important agricultural product concerning the national economy and people’s livelihood. However, China per capita arable land is less than half of the global average. Therefore, it is imperative to protect arable land to achieve sustainable agricultural development but also, to protect forest land to fulfill the international principles of sustainable forest management, declining deforestation and desertification.
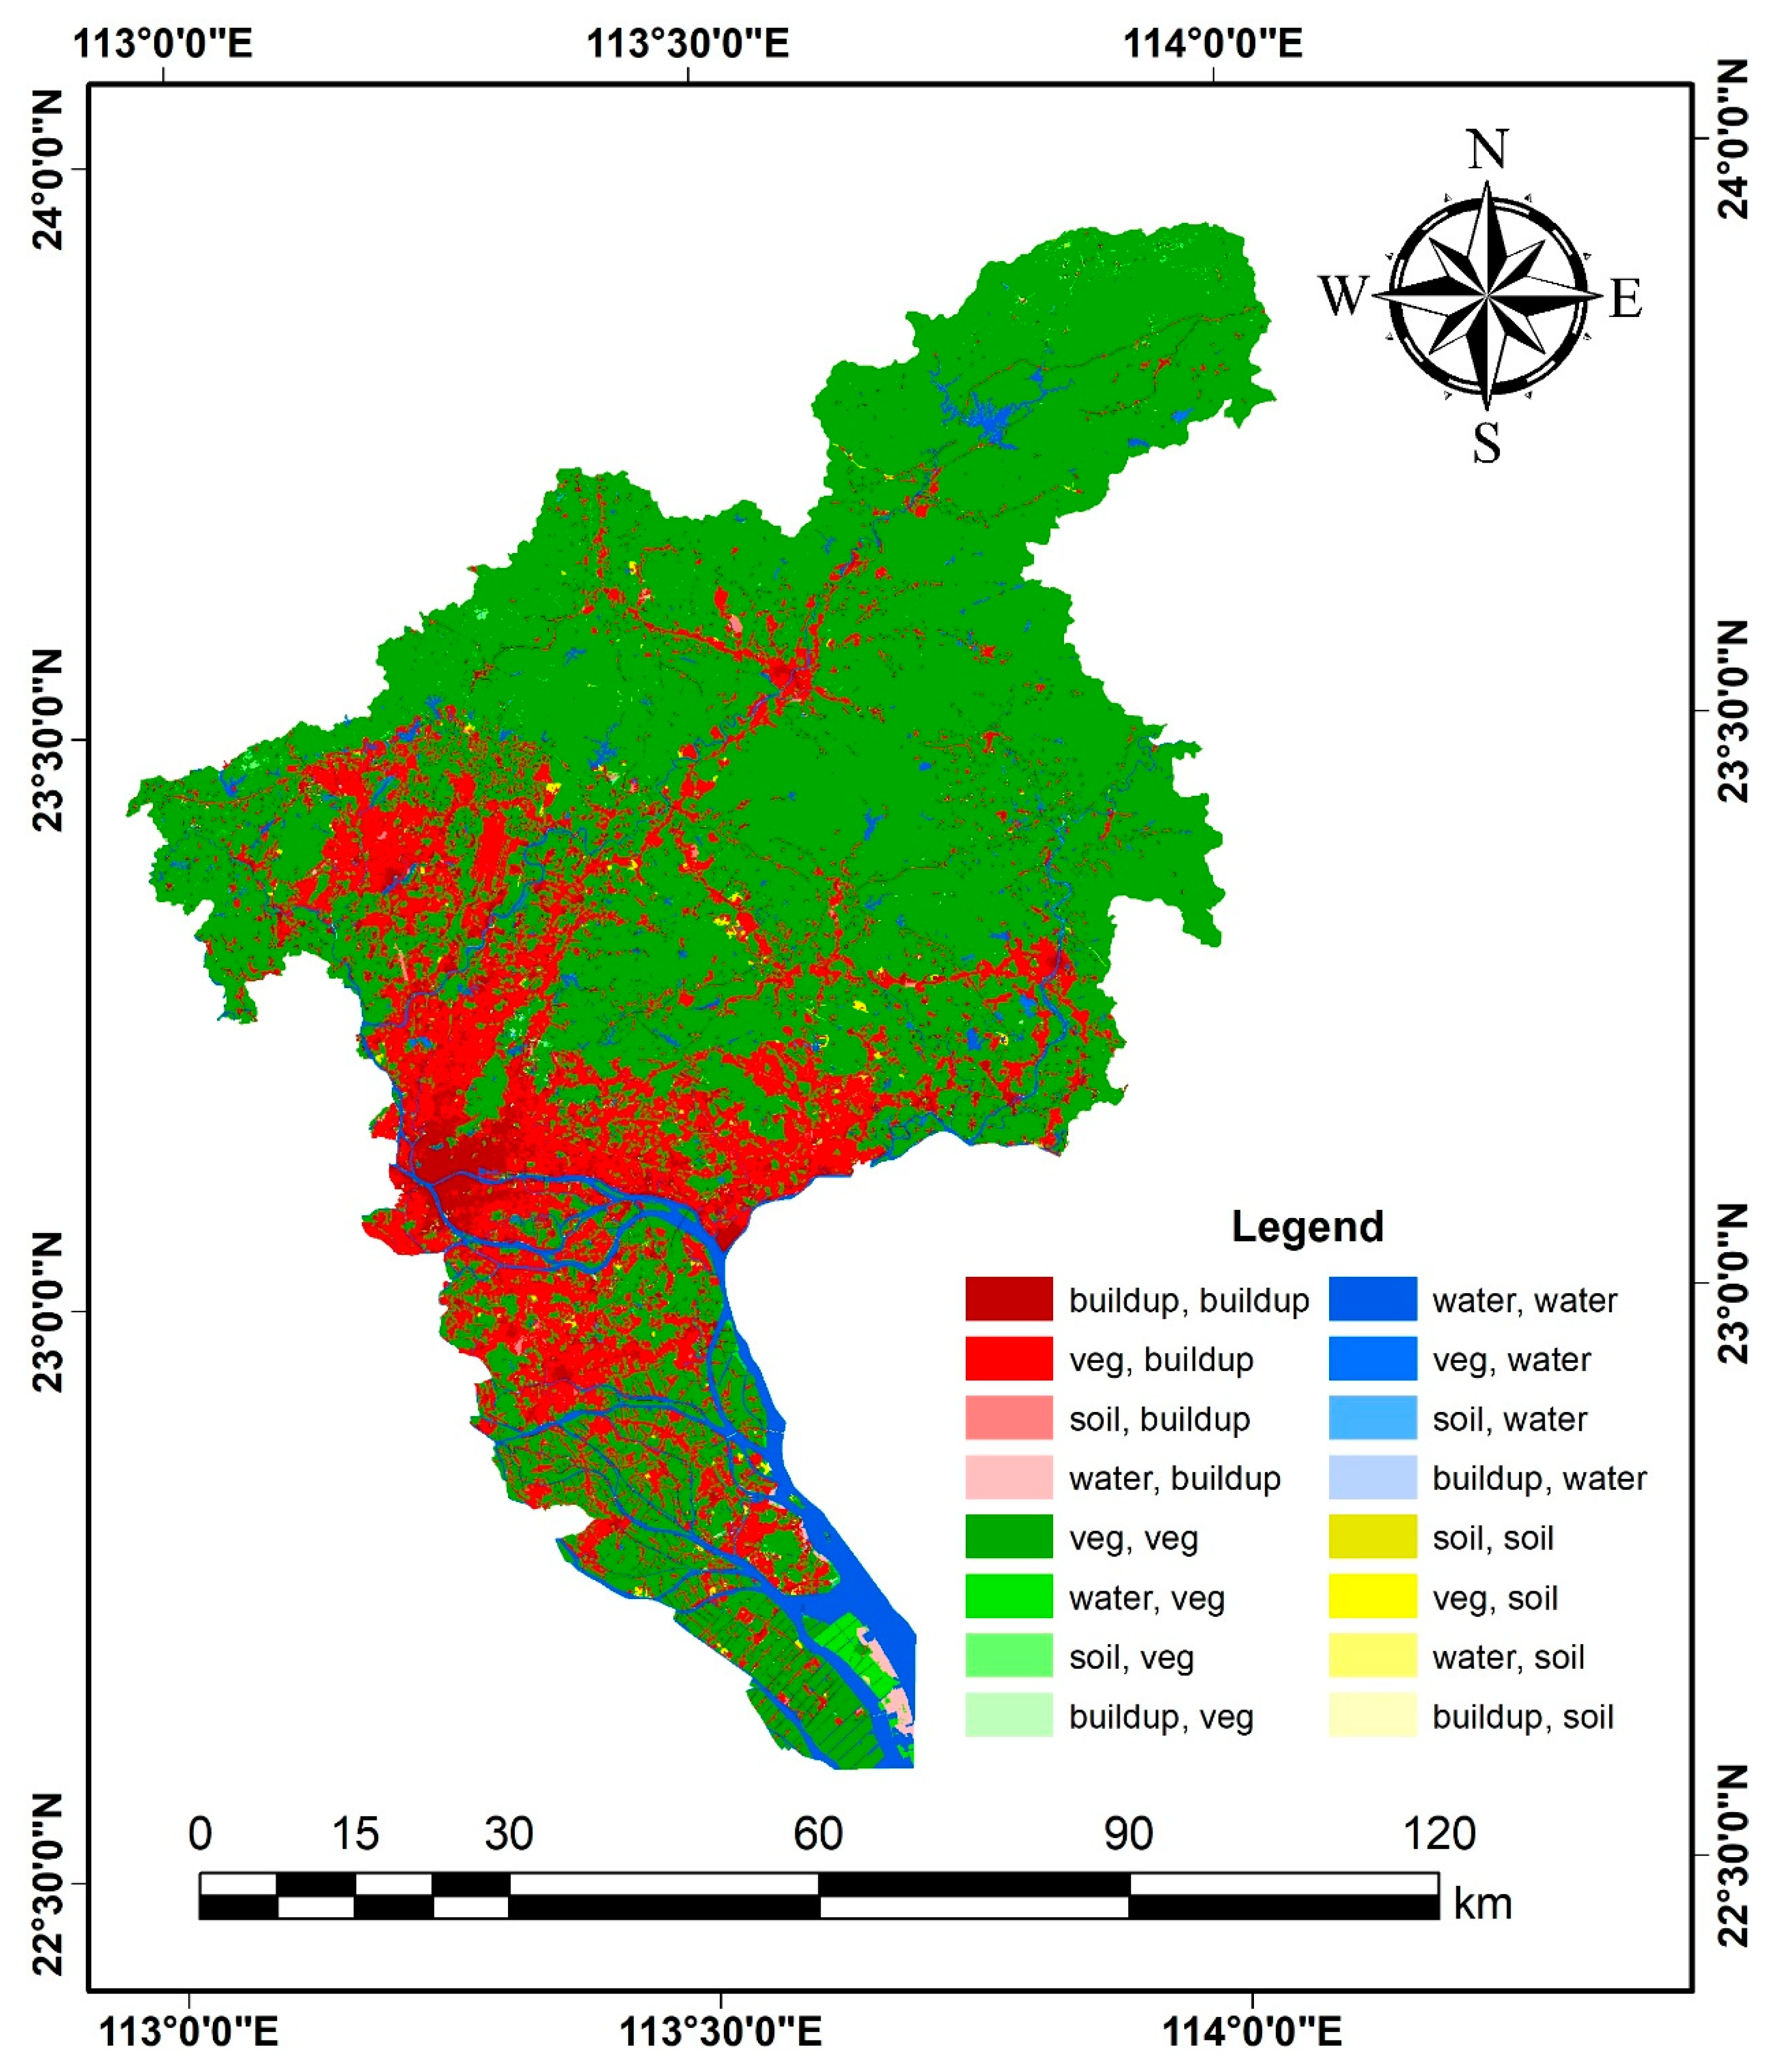
The LUCC of Guangzhou city from 1986 to 2018 was monitored through multi-temporal remotely sensed data. The results show that remote sensing technology could quickly and reliably monitor LUCC at low cost. The spatial changes of land use/cover from 1986 to 2018 is shown in Figure 5. As shown in Figure 5, Guangzhou City expanded greatly in 32 years. We found that a large amount of vegetated land was converted to built-up land, and the increase in built-up area was mainly converted from vegetation area in Guangzhou City. However, only a few water bodies and bare lands were converted to built-up area. There were relatively few changes among other land types.
Table 2 shows the transition matrix of LUCC in Guangzhou City between 1986 and 2018. There was a continuous increase in the built-up area. From 1986 to 2018, the built-up area increased by 1315.56 km2 from 299.44 km2 in 1986 to 1615.00 km2 in 2018. During 32 years, the built-up area increased by 439.34% with an average growth rate of 41.11 km2/year. Research has shown that the expansion of built-up areas was mainly accomplished through expanding over vegetation (1291.56 km2) and, to a significantly lower extent, over water bodies and bare lands. The average reduction rate of vegetation area during 32 years from 1986 to 2018 was 41.07 km2/year. The area of water bodies decreased by 8.75 km2 in 32 years, mainly due to seasonal dry and high water periods, land reclamation, and construction of fish ponds and artificial lakes. The area of bare lands decreased by 16.02 km2 during in years, mainly due to seasonal vegetation changes, afforestation, crop planting and harvesting, and engineering construction. In short, the expansion of built-up area was at the cost of the vegetation area.
Land ownership in China is divided into two categories: State-owned land and collectively-owned land, and there is no private ownership of land in China. Therefore, urban growth and LUCC are greatly affected by government intervention and urban development policies. Moreover, three control lines (permanent basic farmland red line, urban development boundary, and ecological red line) are being put in place in China. The delineation of the three control lines will help better protect the ecological environment, save land and prevent the disorderly development of cities. As a consequence, the era of endless urban expansion is over in China. We can anticipate that, in the future, Guangzhou City will develop scientifically and methodically without substantial expansion.
3.2. Correlation Analysis between Build-Up and GDP Growth
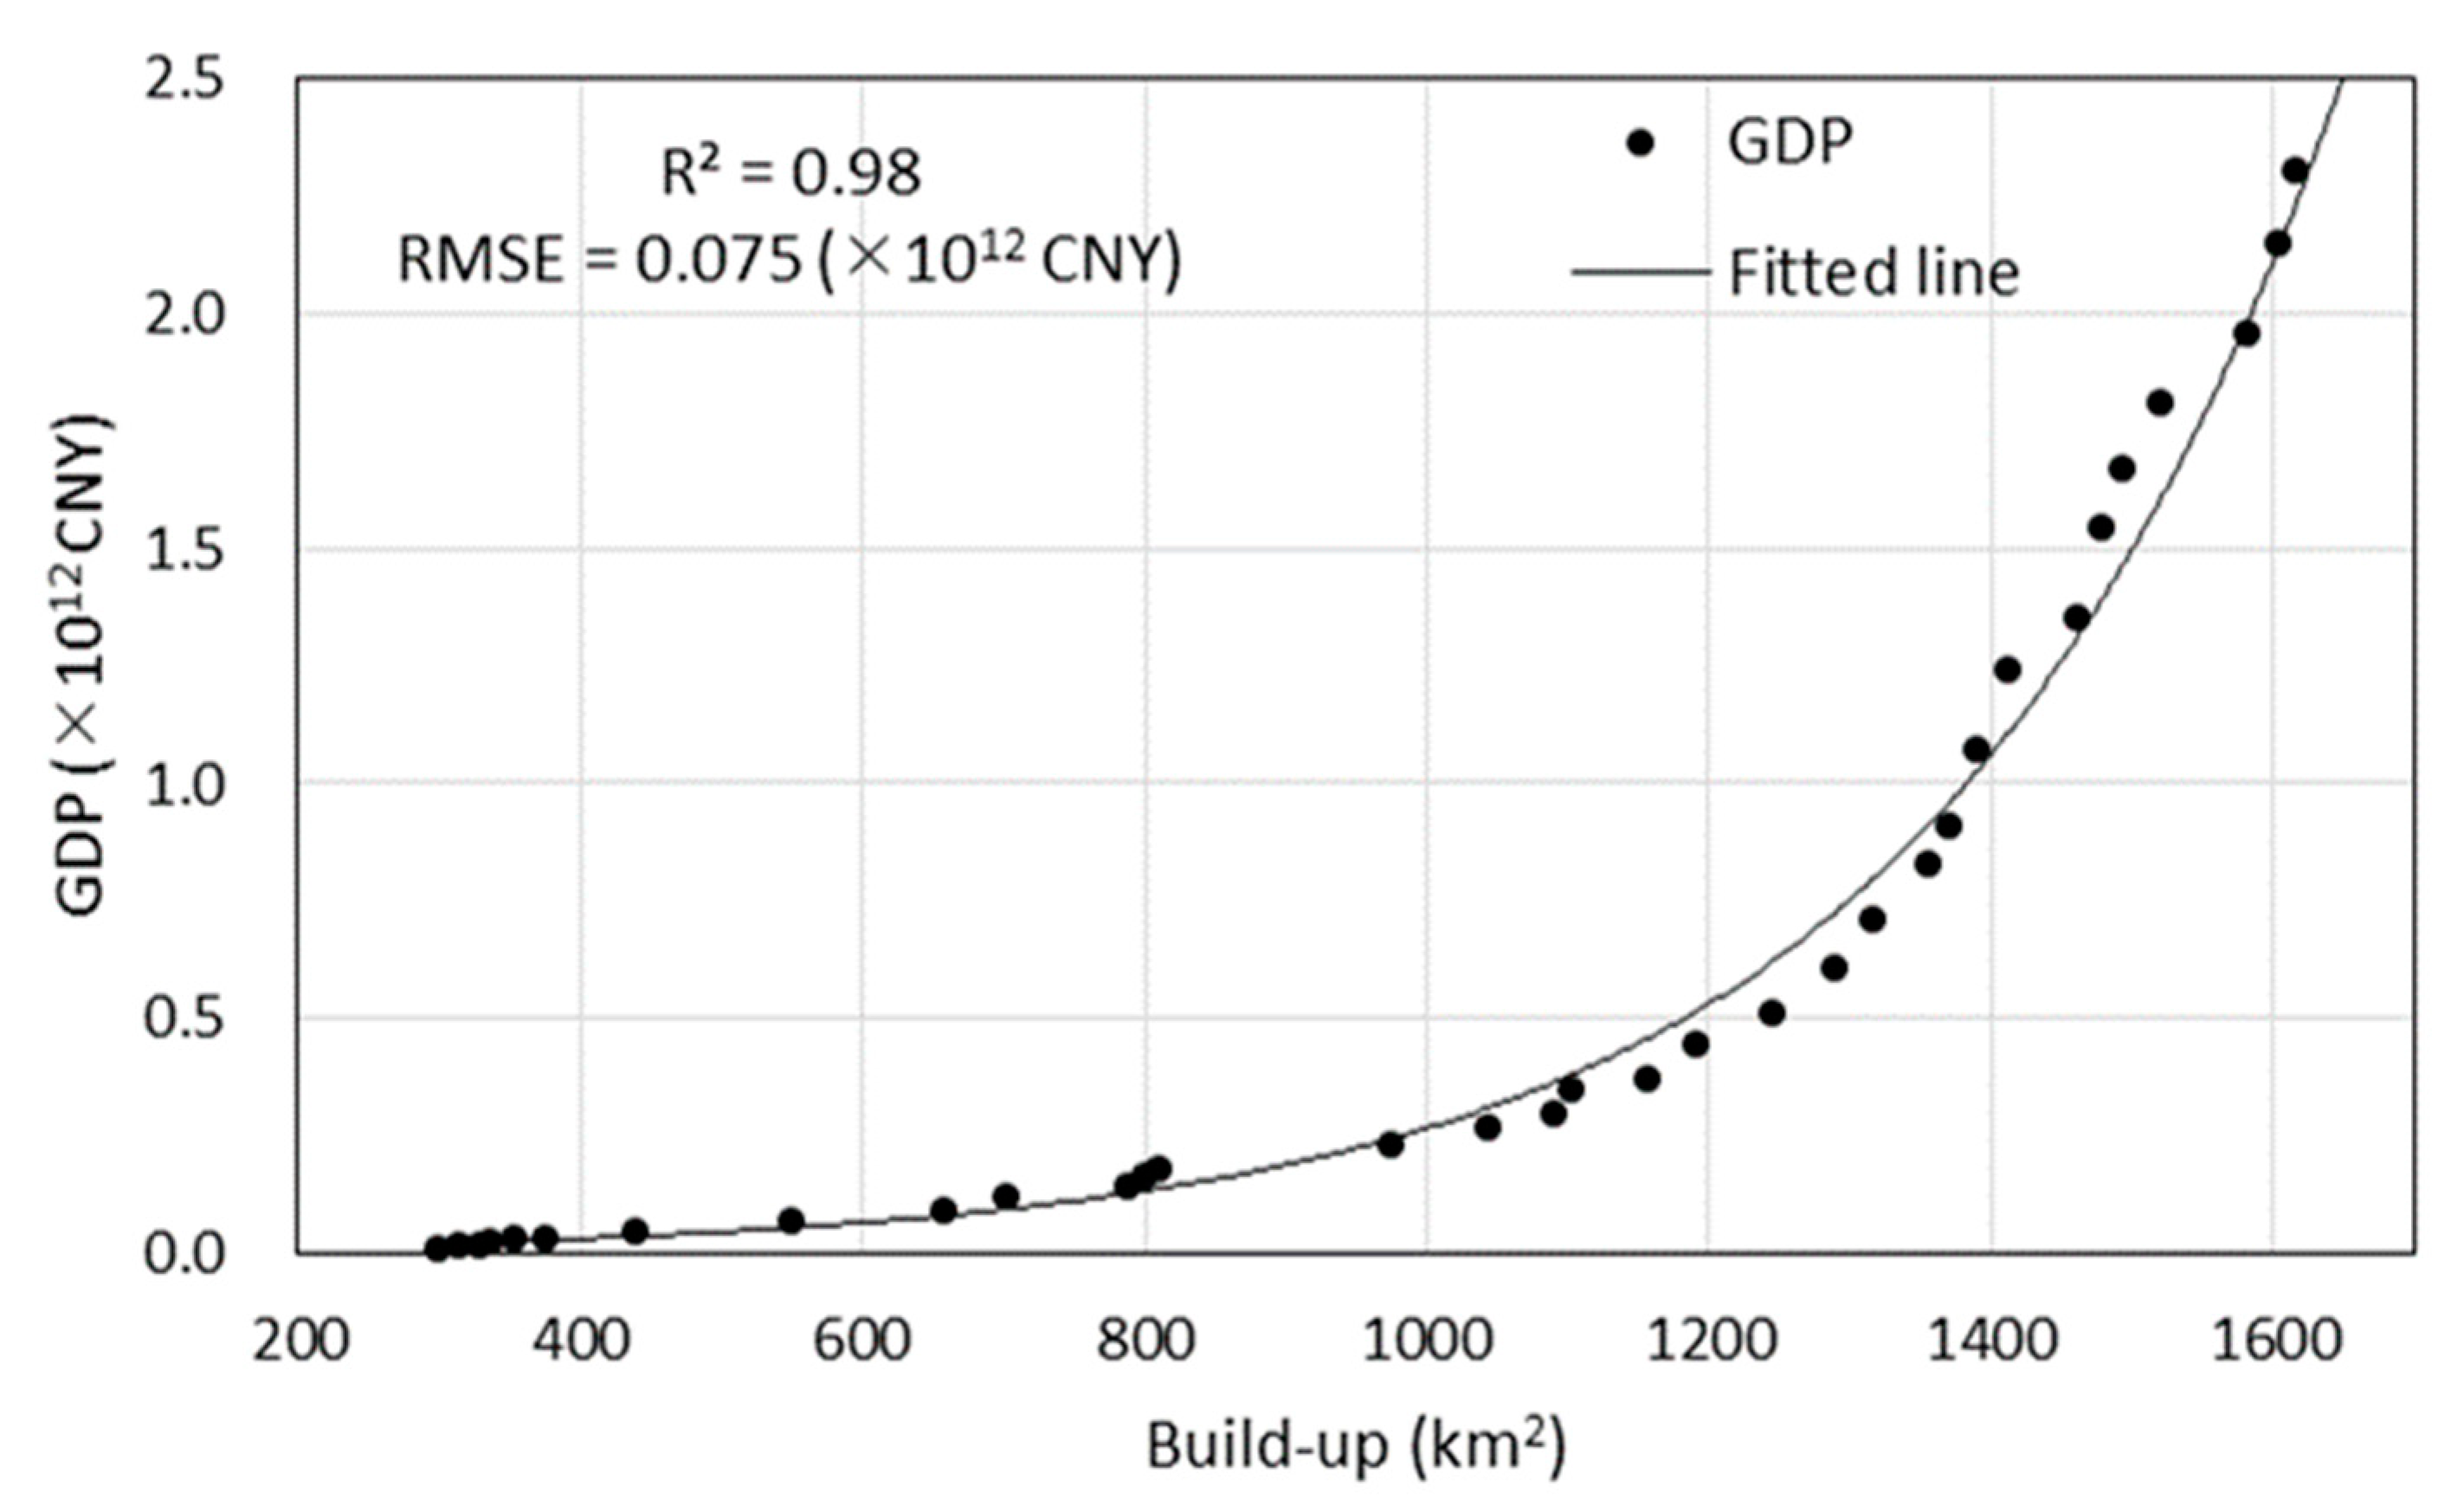
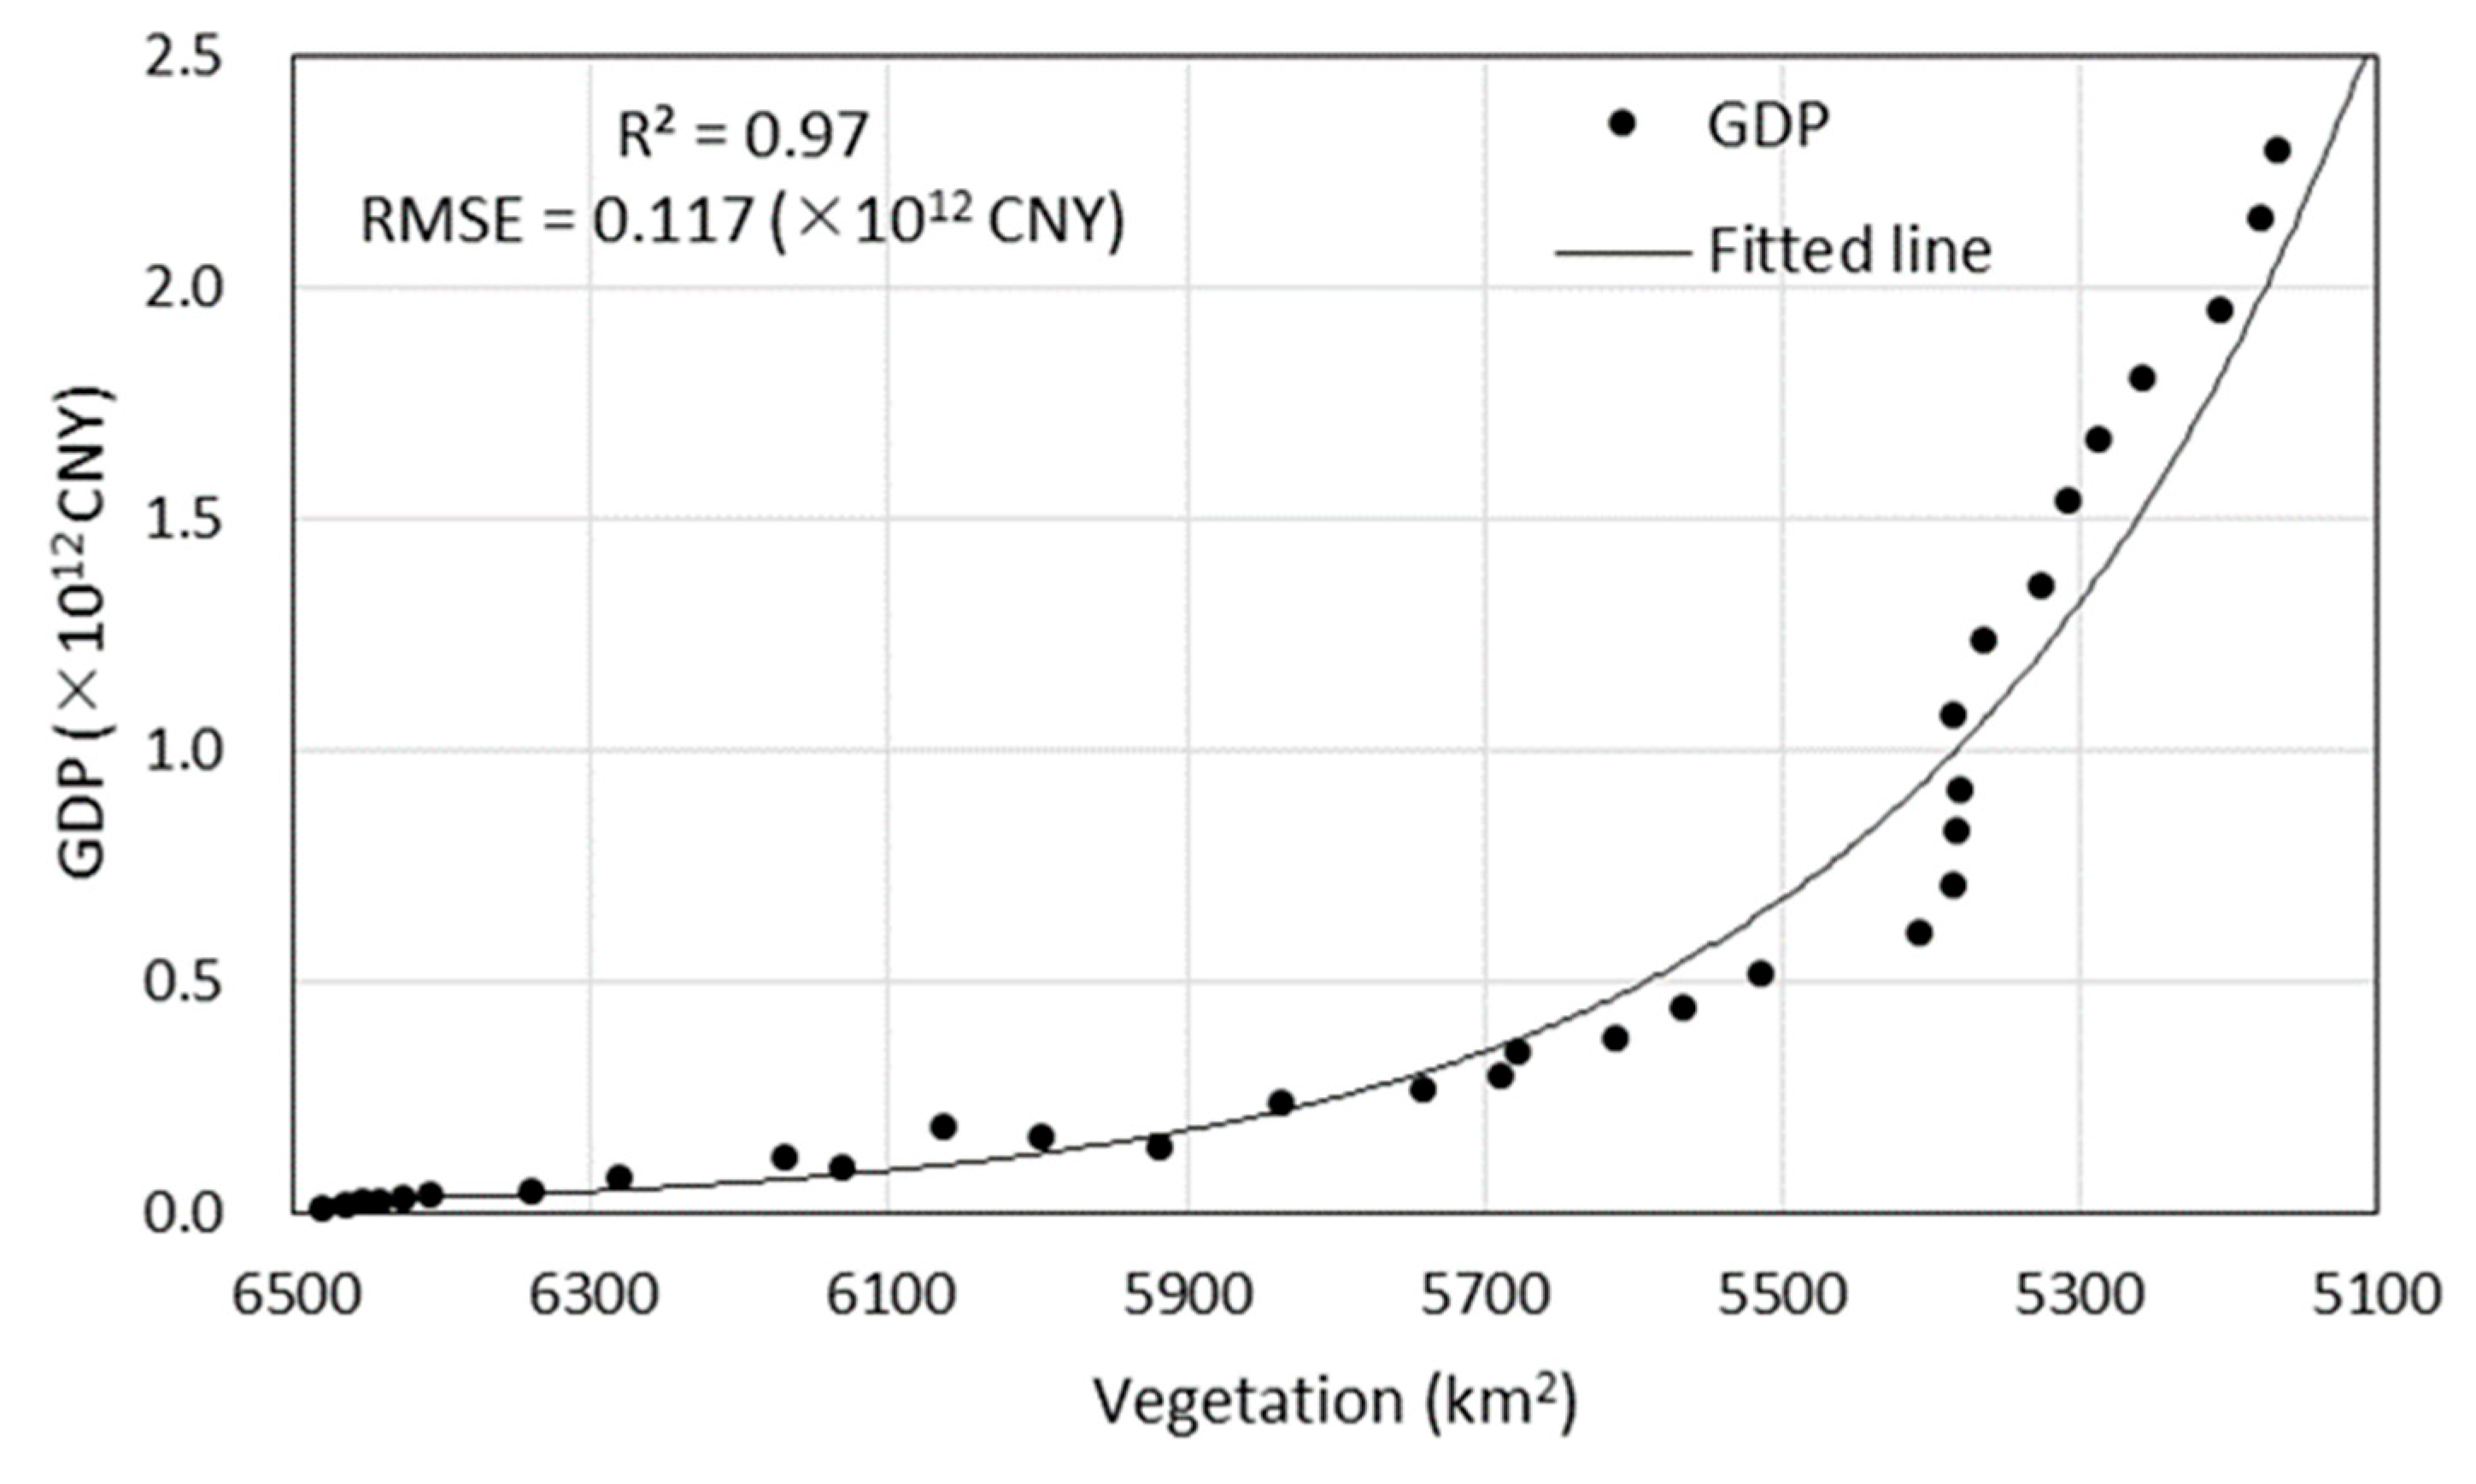
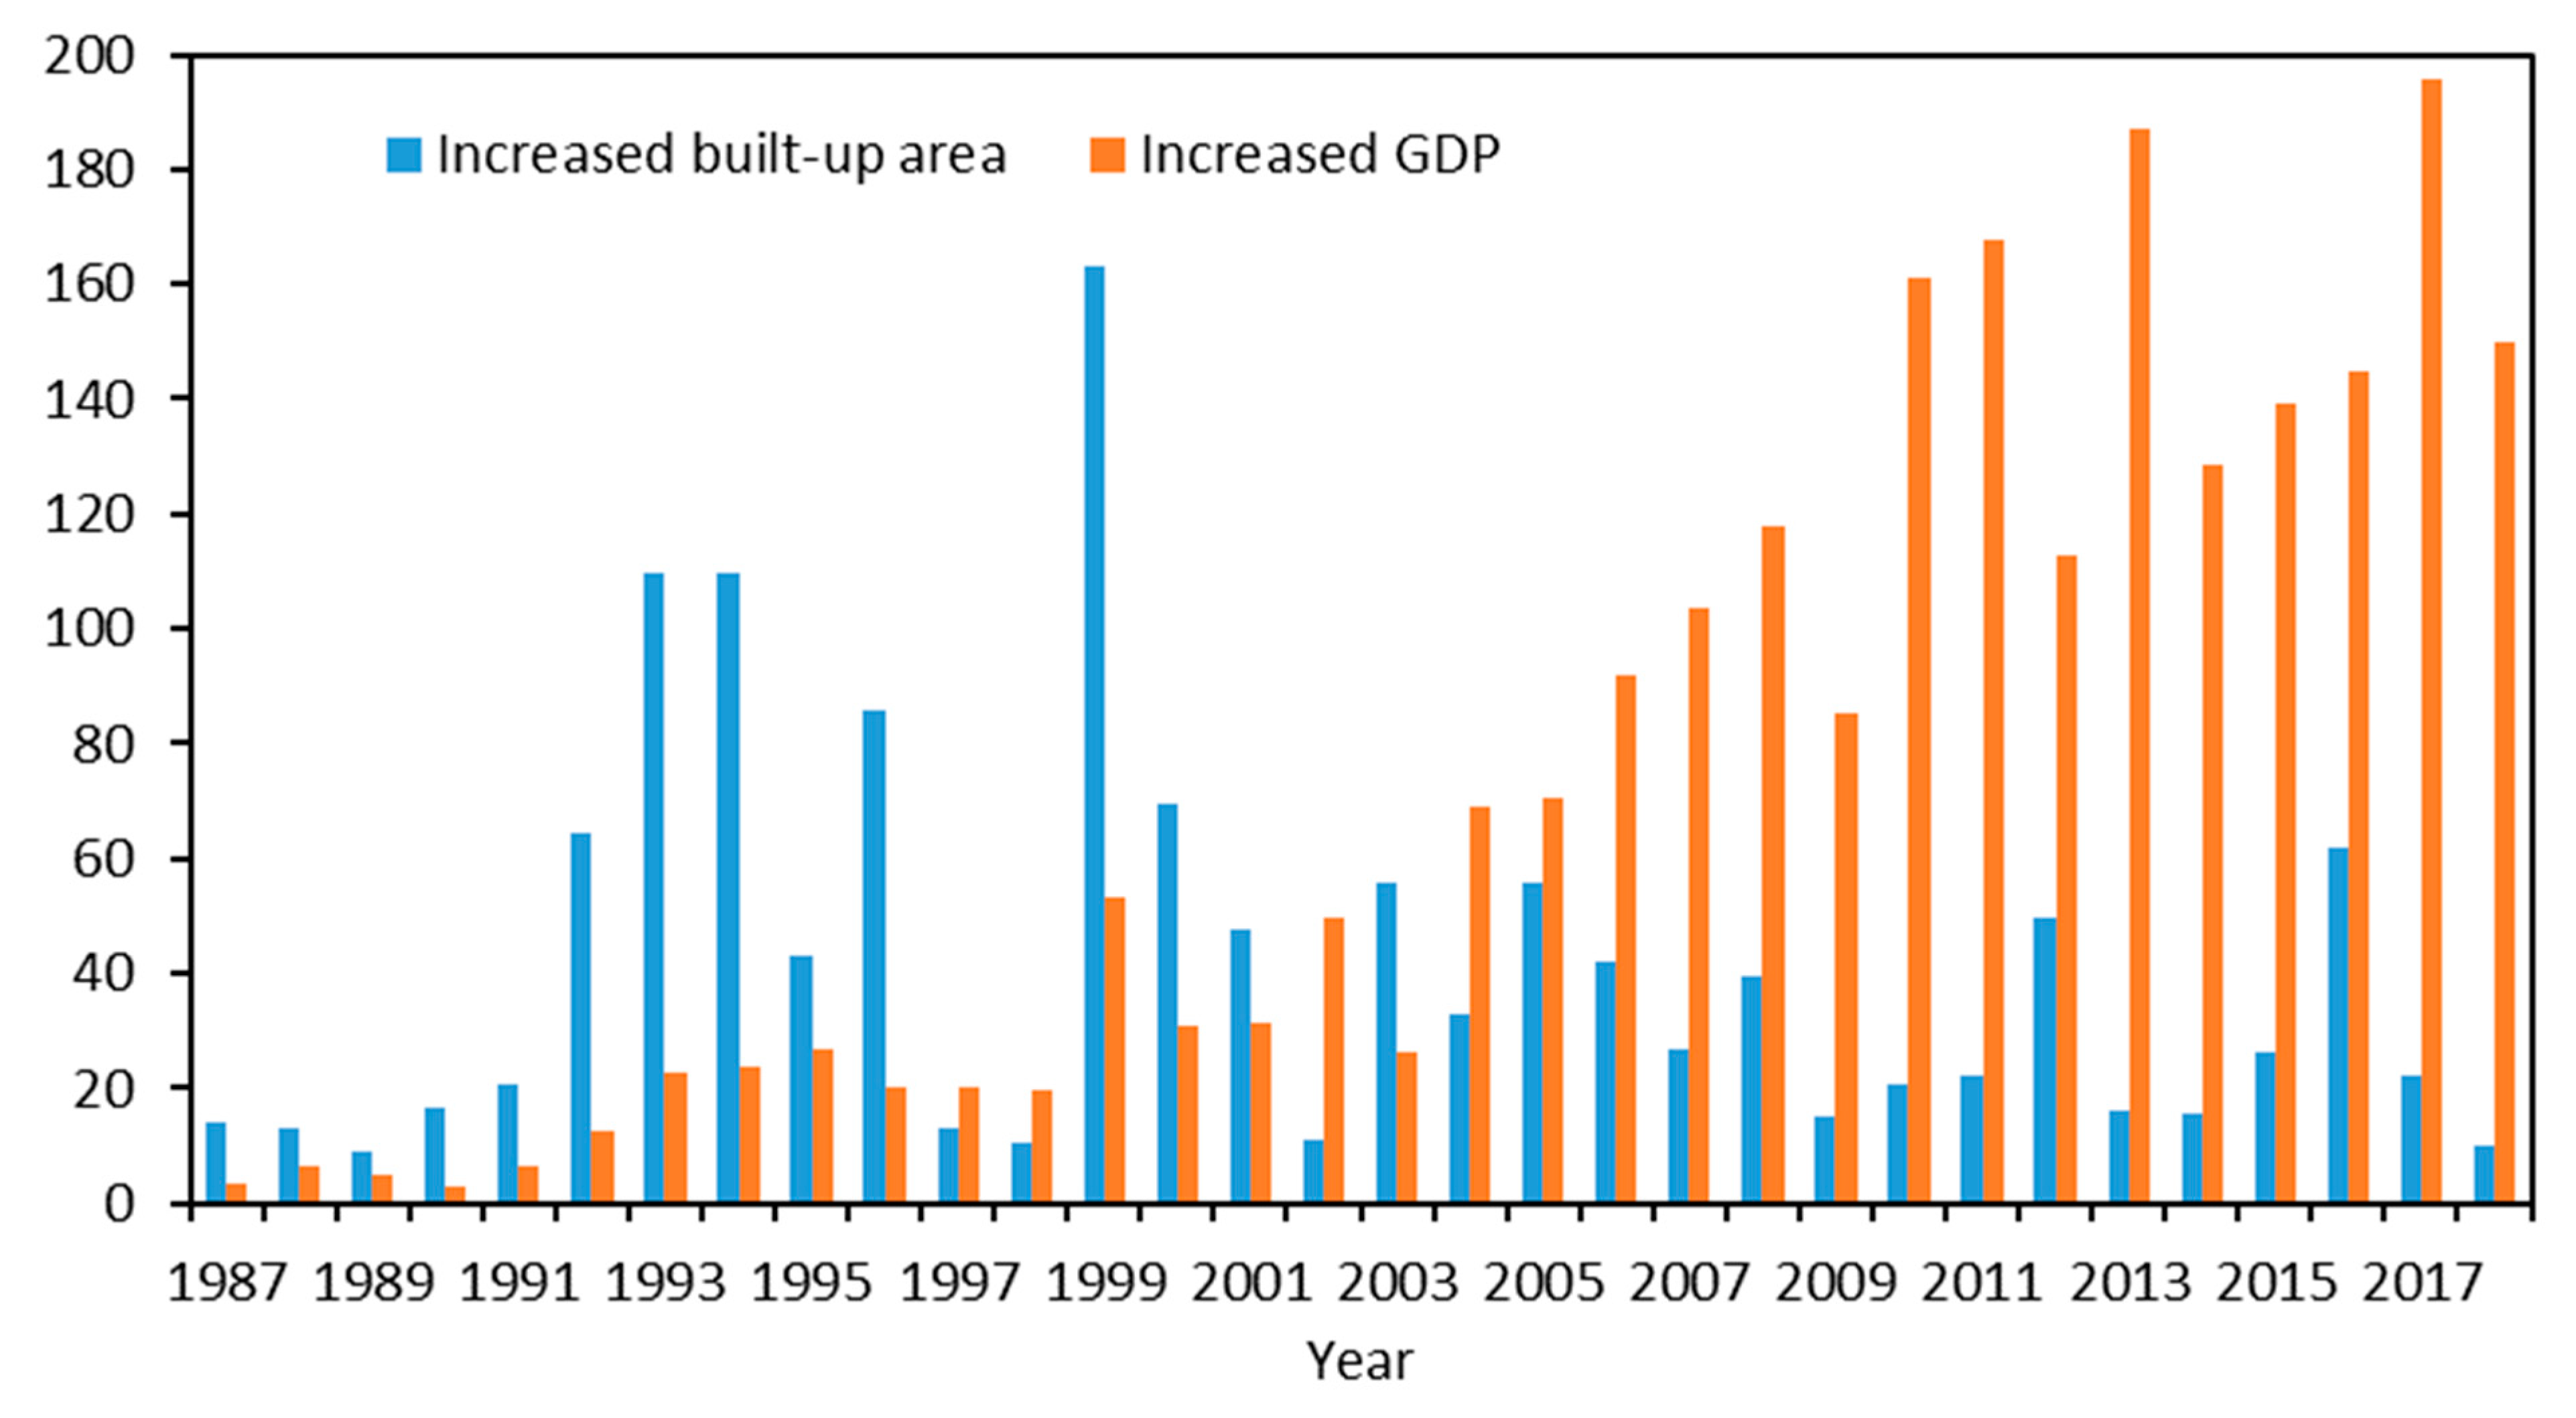
We analyzed the correlation between economic development and the urbanization of Guangzhou City, China. The gross domestic product (GDP) data of Guangzhou from 1986 to 2018 were obtained from website of Guangzhou statistics bureau (http://tjj.gz.gov.cn/ (accessed on 13 January 2021)). The GDP of Guangzhou City increased by 2271.98 billion CNY (increased by 162.81 times) from 13.955 billion CNY in 1986 to 2285.935 billion CNY in 2018. The GDP increased by 71.439 billion per year (increased by 5.1 times per year). The average annual growth rate of GDP was 17.64%. In 32 years, the GDP per capita increased by 155155.43 CNY, an increase of 62.75 times. The correlation analysis between the GDP and the built-up area and the vegetation area obtained from remote sensing interpretation was carried out, respectively. As shown in Figure 6, the GDP rapidly grew with the increase of built-up area, and the GDP had a strong positive correlation with built-up area (R2 = 0.98). However, the GDP did not increase linearly with the built-up area. Similar findings were reported by Wu, Li and Yu [40], who found that urban land was highly correlated with the GDP. However, Figure 7 shows a strong negative correlation between the GDP and vegetation area (R2 = 0.97) in Guangzhou City. The GDP increased rapidly with the decrease of vegetation area. Figure 8 indicates the increments of built-up area (km2) and GDP (billion CNY) relative to the previous year. We found that the built-up area expanded the fastest in 1999, and the built-up area increased by 163.13 km2 compared with 1998. The GDP had the fastest growth rate in 2017, with an increase of 195.57 billion CNY compared with 2016. As shown in the Figure 8, the economy has grown rapidly since 2014. However, the growth of GDP was not directly proportional to the growth of built-up area. Therefore, the growth of built-up area is only one of the factors of the GDP growth. Urban expansion can drive real estate, construction, commerce, etc., and can effectively stimulate domestic demand and promote economic development. As a consequence, urban expands with economic development, and in turn, urban expansion has a huge role in promoting economic development in Guangzhou City. We find that the GDP increased by 3.16% when the built-up area increased by 1% in Guangzhou City. Therefore, the expansion of built-up area can contribute to the rapid development of economy.
Urban expansion is a complex process and is affected by many factors, such as economy, environment, and policy. Economic development played an important role in urban growth and LUCC. With the implementation of the reform and opening up policies, Guangzhou’s economy has developed rapidly, which has attracted a large number of people to work and live in Guangzhou City, so more housing and infrastructure are needed. In order to meet the development of the city, the construction land in Guangzhou is constantly increasing. Therefore, economic development has an important influence on urban expansion and LUCC of Guangzhou City. As shown in Figure 7, the strong relationship exists between GDP and built-up area. Our findings were also supported by a previous study conducted by Wu, Li and Yu [40]. Urban expansion is not only the result of economic development, but also closely related to local policies [55]. At the same time, the expansion of Guangzhou City also promoted the rapid economy development. However, the growth of GDP is caused by many factors, such as labor force and consumption. The growth of built-up area is only one factor of GDP growth. However, urban expansion leads to the accelerated loss of agricultural and forestry land, which affects the sustainable development of agroforestry. Moreover, GDP is not the only indicator to measure the economy. The ecological environment is also an important indicator to measure the high-quality economic development. Therefore, balancing economic growth with ecological environment protection is beneficial to preventing excessive urban expansion to ensure the scientific and sustainable development of cities.
4. Conclusions
Land use and land cover change was monitored in Guangzhou City, China from 1986 to 2018. Research has shown that the built-up area of Guangzhou had a continuous expansion from 1986 to 2018, and peaked during 1990 to 2000. In total, the built-up area increased by 1315.56 km2 in the studied time frame. The built-up area increased by 1315.56 km2 from 1986 to 2018. However, the vegetation area reduced by 1290.78 km2, and a total of 1291.56 km2 of vegetation was converted into build-up. The following conclusions can be drawn:
- Remotely sensed data could be reliably used to classify land use/cover and monitor LUCC in Guangzhou City.
- The correlation between the GDP and build-up was investigated. The results indicate that the GDP had a strong positive correlation with built-up area. Therefore, the development of urbanization was closely related to the economic development of Guangzhou City, China.
The results of this study will provide valuable information of LUCC for urban planning and land use management. However, further research is required to study how the built-up area affects Guangzhou’s GPD and how much the built-up area contributes to Guangzhou’s GDP. Moreover, urban expansion brings a series of problems, such as endangering national food security and reducing biodiversity. We should prevent the excessive expansion of the city and mitigate the damage of urban expansion to the ecological environment. As a consequence, further research should be carried out to investigate the impact of urban expansion on agriculture, ecology, environment and economy.
Author Contributions
Conceptualization, L.G. and X.X.; methodology, L.G., X.X. and L.L.; software, L.L.; validation, L.G., X.X. and W.Y.; formal analysis, X.X., L.L. and W.Y.; investigation, L.G., L.L. and X.X.; writing—original draft preparation, L.G. and X.X.; writing—review and editing, W.Y. and L.L.; visualization, W.Y. and L.L. All authors have read and agreed to the published version of the manuscript.
Funding
This research was funded by the provincial and ministerial program of Guangzhou (Grant No. CGJL-GZ-2019-030).
Institutional Review Board Statement
Not applicable.
Informed Consent Statement
Not applicable.
Data Availability Statement
Please contact corresponding author.
Acknowledgments
The authors would like to thank three anonymous reviewers for their thoughtful comments and suggestions on the manuscript.
Conflicts of Interest
The authors declare no conflict of interest.
References
- Hu, Y.; Zhen, L.; Zhuang, D. Assessment of land-use and land-cover change in Guangxi, China. Sci. Rep. 2019, 9, 1–13. [Google Scholar] [CrossRef] [Green Version]
- Foody, G.M. Assessing the accuracy of land cover change with imperfect ground reference data. Remote Sens. Environ. 2010, 114, 2271–2285. [Google Scholar] [CrossRef] [Green Version]
- Turner, B.L., II; Lambin, E.F.; Reenberg, A. The emergence of land change science for global environmental change and sustainability. Proc. Natl. Acad. Sci. USA 2007, 104, 20666–20671. [Google Scholar] [CrossRef] [Green Version]
- Samal, D.R.; Gedam, S.S. Monitoring land use changes associated with urbanization: An object based image analysis approach. Eur. J. Remot. Sens. 2015, 48, 85–99. [Google Scholar] [CrossRef]
- Rajendran, G.B.; Kumarasamy, U.M.; Zarro, C.; Divakarachari, P.B.; Ullo, S.L. Land-use and land-cover classification using a human group-based particle swarm optimization algorithm with an LSTM Classifier on hybrid pre-processing remote-sensing images. Remote Sens. 2020, 12, 4135. [Google Scholar] [CrossRef]
- Vinayak, B.; Lee, H.S.; Gedem, S. Prediction of land use and land cover changes in Mumbai City, India, using remote sensing data and a multilayer perceptron neural network-based markov chain model. Sustainability 2021, 13, 471. [Google Scholar] [CrossRef]
- Lu, M.; Chen, J.; Tang, H.; Rao, Y.; Yang, P.; Wu, W. Land cover change detection by integrating object-based data blending model of Landsat and MODIS. Remote Sens. Environ. 2016, 184, 374–386. [Google Scholar] [CrossRef]
- Zhao, L.; Huang, W.; Chen, J.; Dong, Y.; Ren, B.; Geng, Y. Land use/cover changes in the Oriental migratory locust area of China: Implications for ecological control and monitoring of locust area. Agric. Ecosyst. Environ. 2020, 303, 107110. [Google Scholar] [CrossRef]
- Moisen, G.G.; McConville, K.S.; Schroeder, T.A.; Healey, S.P.; Finco, M.V.; Frescino, T.S. Estimating land use and land cover change in North Central Georgia: Can remote sensing observations augment traditional forest inventory data? Forests 2020, 11, 856. [Google Scholar] [CrossRef]
- Choudhury, D.; Das, K.; Das, A. Assessment of land use land cover changes and its impact on variations of land surface temperature in Asansol-Durgapur development region. Egypt. J. Remote. Sens. Space Sci. 2019, 22, 203–218. [Google Scholar] [CrossRef]
- Mialhe, F.; Gunnell, Y.; Ignacio, J.A.F.; Delbart, N.; Ogania, J.L.; Henry, S. Monitoring land-use change by combining participatory land-use maps with standard remote sensing techniques: Showcase from a remote forest catchment on Mindanao, Philippines. Int. J. Appl. Earth Obs. Geoinf. 2015, 36, 69–82. [Google Scholar] [CrossRef]
- Adnan, M.S.G.; Abdullah, A.Y.M.; Dewan, A.; Hall, J.W. The effects of changing land use and flood hazard on poverty in coastal Bangladesh. Land Use Policy 2020, 99, 104868. [Google Scholar] [CrossRef]
- Paul, S.; Saxena, K.G.; Nagendra, H.; Lele, N. Tracing land use and land cover change in peri-urban Delhi, India, over 1973–2017 period. Environ. Monit. Assess. 2021, 193, 1–12. [Google Scholar] [CrossRef] [PubMed]
- Mallupattu, P.K.; Reddy, J.R.S. Analysis of land use/land cover changes using remote sensing data and GIS at an urban area, Tirupati, India. Sci. World J. 2013, 2013, 1–6. [Google Scholar] [CrossRef] [Green Version]
- Yan, W.Y.; Shaker, A.; El-Ashmawy, N. Urban land cover classification using airborne LiDAR data: A review. Remote Sens. Environ. 2015, 158, 295–310. [Google Scholar] [CrossRef]
- Mohammadi, A.; Karimzadeh, S.; Kamran, K.V.; Matsuoka, M. Extraction of land information, future landscape changes and seismic hazard assessment: A case study of Tabriz, Iran. Sensors 2020, 20, 7010. [Google Scholar] [CrossRef] [PubMed]
- Gudmann, A.; Csikós, N.; Szilassi, P.; Mucsi, L. Improvement in satellite image-based land cover classification with landscape metrics. Remote Sens. 2020, 12, 3580. [Google Scholar] [CrossRef]
- Luo, S.; Wang, C.; Xi, X.; Zeng, H.; Li, D.; Xia, S.; Wang, P. Fusion of airborne discrete-return LiDAR and hyperspectral data for land cover classification. Remote Sens. 2016, 8, 3. [Google Scholar] [CrossRef] [Green Version]
- Zhang, D.-D.; Zhang, L. Land cover change in the central region of the Lower Yangtze river based on landsat imagery and the google earth engine: A case study in Nanjing, China. Sensors 2020, 20, 2091. [Google Scholar] [CrossRef] [PubMed] [Green Version]
- Chen, C.; He, X.; Liu, Z.; Sun, W.; Dong, H.; Chu, Y. Analysis of regional economic development based on land use and land cover change information derived from Landsat imagery. Sci. Rep. 2020, 10, 1–16. [Google Scholar] [CrossRef]
- Montesano, P.; Cook, B.; Sun, G.; Simard, M.; Nelson, R.; Ranson, K.; Zhang, Z.; Luthcke, S.B. Achieving accuracy requirements for forest biomass mapping: A spaceborne data fusion method for estimating forest biomass and LiDAR sampling error. Remote Sens. Environ. 2013, 130, 153–170. [Google Scholar] [CrossRef]
- Jensen, J.L.; Humes, K.S.; Vierling, L.A.; Hudak, A.T. Discrete return lidar-based prediction of leaf area index in two conifer forests. Remote Sens. Environ. 2008, 112, 3947–3957. [Google Scholar] [CrossRef] [Green Version]
- Hosseini, M.; McNairn, H.; Merzouki, A.; Pacheco, A. Estimation of leaf area index (LAI) in corn and soybeans using multi-polarization C- and L-band radar data. Remote Sens. Environ. 2015, 170, 77–89. [Google Scholar] [CrossRef]
- Gargiulo, M.; Dell’Aglio, D.A.G.; Iodice, A.; Riccio, D.; Ruello, G. Integration of sentinel-1 and sentinel-2 data for land cover mapping using W-Net. Sensors 2020, 20, 2969. [Google Scholar] [CrossRef] [PubMed]
- Santi, E.; Paloscia, S.; Pettinato, S.; Fontanelli, G.; Mura, M.; Zolli, C.; Maselli, F.; Chiesi, M.; Bottai, L.; Chirici, G.; et al. The potential of multifrequency SAR images for estimating forest biomass in Mediterranean areas. Remote Sens. Environ. 2017, 200, 63–73. [Google Scholar] [CrossRef]
- Shi, Y.; Wang, T.; Skidmore, A.K.; Heurich, M. Improving LiDAR-based tree species mapping in Central European mixed forests using multi-temporal digital aerial colour-infrared photographs. Int. J. Appl. Earth Obs. Geoinf. 2020, 84, 101970. [Google Scholar] [CrossRef]
- Tsui, O.W.; Coops, N.C.; Wulder, M.A.; Marshall, P.L. Integrating airborne LiDAR and space-borne radar via multivariate kriging to estimate above-ground biomass. Remote Sens. Environ. 2013, 139, 340–352. [Google Scholar] [CrossRef]
- Wittke, S.; Yu, X.; Karjalainen, M.; Hyyppä, J.; Puttonen, E. Comparison of two-dimensional multitemporal Sentinel-2 data with three-dimensional remote sensing data sources for forest inventory parameter estimation over a boreal forest. Int. J. Appl. Earth Obs. Geoinf. 2019, 76, 167–178. [Google Scholar] [CrossRef]
- Luo, S.; Wang, C.; Xi, X.; Nie, S.; Fan, X.; Chen, H.; Ma, D.; Liu, J.; Zou, J.; Lin, Y.; et al. Estimating forest aboveground biomass using small-footprint full-waveform airborne LiDAR data. Int. J. Appl. Earth Obs. Geoinf. 2019, 83. [Google Scholar] [CrossRef]
- Mielcarek, M.; Stereńczak, K.; Khosravipour, A. Testing and evaluating different LiDAR-derived canopy height model generation methods for tree height estimation. Int. J. Appl. Earth Obs. Geoinf. 2018, 71, 132–143. [Google Scholar] [CrossRef]
- Nie, S.; Wang, C.; Zeng, H.; Xi, X.; Li, G. Above-ground biomass estimation using airborne discrete-return and full-waveform LiDAR data in a coniferous forest. Ecol. Indic. 2017, 78, 221–228. [Google Scholar] [CrossRef]
- Calderón-Loor, M.; Hadjikakou, M.; Bryan, B.A. High-resolution wall-to-wall land-cover mapping and land change assessment for Australia from 1985 to 2015. Remote Sens. Environ. 2021, 252, 112148. [Google Scholar] [CrossRef]
- Hagensieker, R.; Roscher, R.; Rosentreter, J.; Jakimow, B.; Waske, B. Tropical land use land cover mapping in Pará (Brazil) using discriminative Markov random fields and multi-temporal TerraSAR-X data. Int. J. Appl. Earth Obs. Geoinf. 2017, 63, 244–256. [Google Scholar] [CrossRef] [Green Version]
- Lv, Q.; Dou, Y.; Niu, X.; Xu, J.; Xu, J.; Xia, F. Urban land use and land cover classification using remotely sensed SAR data through deep belief networks. J. Sens. 2015, 2015, 1–10. [Google Scholar] [CrossRef] [Green Version]
- Mahdianpari, M.; Salehi, B.; Mohammadimanesh, F.; Motagh, M. Random forest wetland classification using ALOS-2 L-band, RADARSAT-2 C-band, and TerraSAR-X imagery. ISPRS J. Photogramm. Remote. Sens. 2017, 130, 13–31. [Google Scholar] [CrossRef]
- Joshi, N.; Baumann, M.; Ehammer, A.; Fensholt, R.; Grogan, K.; Hostert, P.; Jepsen, M.R.; Kuemmerle, T.; Meyfroidt, P.; Mitchard, E.T.A.; et al. A review of the application of optical and radar remote sensing data fusion to land use mapping and monitoring. Remote Sens. 2016, 8, 70. [Google Scholar] [CrossRef] [Green Version]
- Otukei, J.R.; Blaschke, T.; Collins, M. Fusion of TerraSAR-x and Landsat ETM+ data for protected area mapping in Uganda. Int. J. Appl. Earth Obs. Geoinf. 2015, 38, 99–104. [Google Scholar] [CrossRef]
- Zhang, H.; Xu, R. Exploring the optimal integration levels between SAR and optical data for better urban land cover mapping in the Pearl River Delta. Int. J. Appl. Earth Obs. Geoinf. 2018, 64, 87–95. [Google Scholar] [CrossRef]
- Gessner, U.; Machwitz, M.; Esch, T.; Tillack, A.; Naeimi, V.; Kuenzer, C.; Dech, S. Multi-sensor mapping of West African land cover using MODIS, ASAR and TanDEM-X/TerraSAR-X data. Remote Sens. Environ. 2015, 164, 282–297. [Google Scholar] [CrossRef]
- Wu, Y.; Li, S.; Yu, S. Monitoring urban expansion and its effects on land use and land cover changes in Guangzhou city, China. Environ. Monit. Assess. 2015, 188, 54. [Google Scholar] [CrossRef] [PubMed]
- Global Visualization Viewer, Earth Resources Observation and Science Center. Available online: http://glovis.usgs.gov (accessed on 13 January 2021).
- European Space Agency. Available online: https://scihub.copernicus.eu (accessed on 13 January 2021).
- Ayehu, G.; Tadesse, T.; Gessesse, B.; Yigrem, Y.; Melesse, A.M. Combined use of sentinel-1 SAR and landsat sensors products for residual soil moisture retrieval over agricultural fields in the Upper Blue Nile Basin, Ethiopia. Sensors 2020, 20, 3282. [Google Scholar] [CrossRef]
- Castillo, J.A.A.; Apan, A.A.; Maraseni, T.N.; Salmo, S.G. Estimation and mapping of above-ground biomass of mangrove forests and their replacement land uses in the Philippines using Sentinel imagery. ISPRS J. Photogramm. Remote Sens. 2017, 134, 70–85. [Google Scholar] [CrossRef]
- Mutlu, M.; Popescu, S.C.; Stripling, C.; Spencer, T. Mapping surface fuel models using lidar and multispectral data fusion for fire behavior. Remote Sens. Environ. 2008, 112, 274–285. [Google Scholar] [CrossRef]
- Dopido, I.; Villa, A.; Plaza, A.; Gamba, P. A quantitative and comparative assessment of unmixing-based feature extraction techniques for hyperspectral image classification. IEEE J. Sel. Top. Appl. Earth Obs. Remote Sens. 2012, 5, 421–435. [Google Scholar] [CrossRef]
- Huang, B.; Zhang, H.; Yu, L. Improving landsat ETM+ urban area mapping via spatial and angular fusion with MISR multi-angle observations. IEEE J. Sel. Top. Appl. Earth Obs. Remote Sens. 2012, 5, 101–109. [Google Scholar] [CrossRef]
- Onojeghuo, A.O.; Onojeghuo, A.R. Object-based habitat mapping using very high spatial resolution multispectral and hyperspectral imagery with LiDAR data. Int. J. Appl. Earth Obs. Geoinf. 2017, 59, 79–91. [Google Scholar] [CrossRef]
- Pitkänen, T.; Käyhkö, N. Reducing classification error of grassland overgrowth by combing low-density lidar acquisitions and optical remote sensing data. ISPRS J. Photogramm. Remote Sens. 2017, 130, 150–161. [Google Scholar] [CrossRef]
- Ghimire, B.; Rogan, J.; Galiano, V.R.; Panday, P.; Neeti, N. An evaluation of bagging, boosting, and random forests for land-cover classification in Cape Cod, Massachusetts, USA. GIScience Remote Sens. 2012, 49, 623–643. [Google Scholar] [CrossRef]
- Rodriguez-Galiano, V.; Ghimire, B.; Rogan, J.; Chica-Olmo, M.; Rigol-Sanchez, J. An assessment of the effectiveness of a random forest classifier for land-cover classification. ISPRS J. Photogramm. Remote Sens. 2012, 67, 93–104. [Google Scholar] [CrossRef]
- Sensing, R.; Change, L.C.; Areas, U.; Detection, C. Remote sensing-based urban land use/land cover change detection and monitoring. J. Remote Sens. GIS 2017, 6. [Google Scholar] [CrossRef]
- Tadele, H.; Mekuriaw, A.; Selassie, Y.G.; Tsegaye, L. Land use/land cover factor values and accuracy assessment using a GIS and remote sensing in the case of the Quashay Watershed in Northwestern Ethiopia. J. Nat. Resour. Dev. 2017, 38–44. [Google Scholar] [CrossRef] [Green Version]
- Yang, J.; Li, S.; Lu, H. Quantitative influence of land-use changes and urban expansion intensity on landscape pattern in Qingdao, China: Implications for urban sustainability. Sustainability 2019, 11, 6174. [Google Scholar] [CrossRef] [Green Version]
- Chen, B.; Wu, C.; Huang, X.; Yang, X. Examining the relationship between urban land expansion and economic linkage using coupling analysis: A case study of the Yangtze river economic Belt, China. Sustainability 2020, 12, 1227. [Google Scholar] [CrossRef] [Green Version]
Figure 1.
Location of study area of Guangzhou in Guangdong Province of China.

Figure 2.
Flow chart of monitoring land use/cover change in the study.

Figure 3.
Land use/cover classification maps of Guangzhou City, China from 1986 to 2018.

Figure 4.
Changes of area in the build-up, vegetation, water bodies and bare lands of Guangzhou City, China from 1986 to 2018.
Figure 4.
Changes of area in the build-up, vegetation, water bodies and bare lands of Guangzhou City, China from 1986 to 2018.

Figure 5.
Land use/cover change map of Guangzhou City from 1986 to 2018. In the legend, ‘veg’ represents vegetation, and ‘veg, buildup’ represents the conversion of vegetation area into built-up area.
Figure 5.
Land use/cover change map of Guangzhou City from 1986 to 2018. In the legend, ‘veg’ represents vegetation, and ‘veg, buildup’ represents the conversion of vegetation area into built-up area.

Figure 6.
Fitting analysis of GDP and built-up area of Guangzhou City from 1986 to 2018.

Figure 7.
Fitting analysis of GDP and vegetation area in Guangzhou City, China from 1986 to 2018.

Figure 8.
The increments of built-up area (km2) and GDP (billion CNY) relative to the previous year.
Figure 8.
The increments of built-up area (km2) and GDP (billion CNY) relative to the previous year.


Table 1.
The overall accuracy (OA) and kappa coefficient (K) of land cover classification Guangzhou City, China from 1986 to 2018.
Table 1.
The overall accuracy (OA) and kappa coefficient (K) of land cover classification Guangzhou City, China from 1986 to 2018.
| Year | OA | K | Year | OA | K | Year | OA | K |
|---|---|---|---|---|---|---|---|---|
| 1986 | 92.50% | 0.8791 | 1997 | 91.42% | 0.8978 | 2008 | 91.18% | 0.8857 |
| 1987 | 90.77% | 0.8865 | 1998 | 86.42% | 0.8079 | 2009 | 89.23% | 0.8653 |
| 1988 | 95.12% | 0.9460 | 1999 | 91.73% | 0.8955 | 2010 | 90.00% | 0.8890 |
| 1989 | 92.64% | 0.9257 | 2000 | 90.13% | 0.8735 | 2011 | 90.36% | 0.8745 |
| 1990 | 92.13% | 0.9026 | 2001 | 93.05% | 0.8971 | 2012 | 90.68% | 0.8569 |
| 1991 | 93.25% | 0.9108 | 2002 | 92.41% | 0.8986 | 2013 | 94.19% | 0.9276 |
| 1992 | 96.58% | 0.9499 | 2003 | 88.91% | 0.8529 | 2014 | 89.69% | 0.8542 |
| 1993 | 93.30% | 0.9206 | 2004 | 90.13% | 0.8901 | 2015 | 92.82% | 0.9127 |
| 1994 | 91.55% | 0.8999 | 2005 | 88.46% | 0.8431 | 2016 | 94.44% | 0.9192 |
| 1995 | 91.72% | 0.8906 | 2006 | 91.50% | 0.8998 | 2017 | 96.40% | 0.9517 |
| 1996 | 95.44% | 0.9393 | 2007 | 92.32% | 0.8796 | 2018 | 94.51% | 0.9336 |
Table 2.
Transition matrix of LUCC in Guangzhou City between 1986 and 2018 (km2).
| 2018 | Vegetation | Water Bodies | Build-Up | Bare Lands | Total | |
|---|---|---|---|---|---|---|
| 1986 | ||||||
| Vegetation | 5112.65 (79.18%) | 29.86 (0.46%) | 1291.56 (20.00%) | 23.01 (0.36%) | 6457.08 | |
| Water bodies | 28.57 (5.96%) | 433.75 (90.43%) | 16.87 (3.52%) | 0.45 (0.09%) | 479.63 | |
| Build-up | 7.73 (2.58%) | 1.17 (0.39%) | 290.49 (97.01%) | 0.05 (0.02%) | 299.44 | |
| Bare lands | 17.35 (42.95%) | 6.10 (15.10%) | 16.09 (39.83%) | 0.87 (2.15%) | 40.40 | |
| Total | 5166.30 (80.01%) | 470.88 (98.18%) | 1615.00 (539.34%) | 24.38 (60.35%) | 7276.56 | |
Publisher’s Note: MDPI stays neutral with regard to jurisdictional claims in published maps and institutional affiliations. |
© 2021 by the authors. Licensee MDPI, Basel, Switzerland. This article is an open access article distributed under the terms and conditions of the Creative Commons Attribution (CC BY) license (http://creativecommons.org/licenses/by/4.0/).
Share and Cite
MDPI and ACS Style
Guo, L.; Xi, X.; Yang, W.; Liang, L. Monitoring Land Use/Cover Change Using Remotely Sensed Data in Guangzhou of China. Sustainability 2021, 13, 2944. https://0-doi-org.brum.beds.ac.uk/10.3390/su13052944
AMA Style
Guo L, Xi X, Yang W, Liang L. Monitoring Land Use/Cover Change Using Remotely Sensed Data in Guangzhou of China. Sustainability. 2021; 13(5):2944. https://0-doi-org.brum.beds.ac.uk/10.3390/su13052944
Chicago/Turabian StyleGuo, Liang, Xiaohuan Xi, Weijun Yang, and Lei Liang. 2021. "Monitoring Land Use/Cover Change Using Remotely Sensed Data in Guangzhou of China" Sustainability 13, no. 5: 2944. https://0-doi-org.brum.beds.ac.uk/10.3390/su13052944
Note that from the first issue of 2016, this journal uses article numbers instead of page numbers. See further details here.