Article

Simulation Method to Assess Thermal Comfort in Historical Buildings with High-Volume Interior Spaces—The Case of the Gothic Basilica of Sta. Maria del Mar in Barcelona

1
Architecture Technology Department, Barcelona School of Architecture, Polytechnic University of Catalonia, 08028 Barcelona, Spain
2
Association of Architects of Catalonia, 08005 Barcelona, Spain
*
Author to whom correspondence should be addressed.
Sustainability 2021, 13(5), 2980; https://0-doi-org.brum.beds.ac.uk/10.3390/su13052980
Submission received: 2 February 2021 / Revised: 26 February 2021 / Accepted: 2 March 2021 / Published: 9 March 2021

Abstract

:
Concerns about the energy performance of heritage buildings have grown exponentially over the last decade. However, actions have been limited to reducing energy consumption and carbon emissions. Another perspective must be studied—the thermal comfort of users, for human welfare and health. The assessment of thermal comfort inside a historic building with a single, large volume interior space is not easy. The complexity increases if the building has high cultural protection and its envelope cannot be altered, to preserve its historical values. This paper focuses on this kind of building and describes a dynamic simulation method used to assess thermal comfort in the Gothic Basilica of Sta. Maria del Mar in Barcelona. The basilica’s interior thermal conditions are intense cold during the winter and extreme heat and sultriness during the summer. Several simulation scenarios were considered to highlight the failure to obtain thermal comfort for users through passive strategies during the summer period. When all the factors are considered, the only valid strategy is to introduce an active system. This must be minimized according to three criteria: reducing operational periods, considering just the air volume next to users and adjusting the level of comfort requirement.

1. Introduction

It is difficult to establish the energy behavior of historical buildings, and even harder if we want to relate this behavior to the welfare of users. Consequently, an assessment method is required that considers the specific characteristics of historical buildings without insulation, and users’ sensations depending on their activity, clothes and even their comprehension and perception of the historical building.
In mild and continental climates, the feeling of lack of thermal comfort inside historical buildings used to be very high during winter and very low or nonexistent during summer, due to the wall thickness and the small surface area of windows. However, the case chosen to illustrate the proposed method, the Basilica of Santa Maria del Mar in Barcelona, does not provide thermal comfort during winter or summer. In fact, discomfort is particularly high during the summer. The issue is important, as climate change experts recommend considering scenarios with a 70-year horizon [1] in which the winter season will be increasingly mild while the summer season will be ever warmer. The change in the summer season will cause overheating and an increase of energy loads and carbon emissions [2]. This phenomenon is intensified within historic city centers, where the combination of pollution, modification of atmosphere conditions and covering of the soil surface produces urban heat islands (UHI) [3]. This is a serious problem for Mediterranean countries where high consumption peaks already exist due to cooling systems during summer months [4,5] and cooling requirement makes it impossible to achieve a near-zero energy building without energy recovery [6]. For heritage buildings, climate change is a great challenge, since the risk of inside overheating and the damage caused by increased relative humidity (RH) affects not only the building or the thermal comfort of users, but also the preservation of artworks that are usually kept inside the buildings [7].
Martínez Molina et al. highlighted the importance of reaching thermal comfort in public use buildings [8]. In fact, this is one of the main objectives when buildings are retrofitted, especially if they are historical buildings. What is more, “the assessment of thermal comfort inside buildings occupies a flourishing line of research due, to some extent, to the scarce available verified data” (Translation by author from the Spanish original) [9] (p. 1817–1818). The difficulty of this kind of “thermal” intervention has been explored by several researchers. All of them agree that it is a very challenging subject because these buildings are key to improving the local economy in tourist centers [10]. However, there are many intervention constraints due to regulations on the preservation of the buildings’ values and the fact that historical properties are often excluded from compliance with regulatory requirements, as legislation recognizes that historic values are the priority [11,12,13].
Historical buildings have no thermal insulation on their envelope, but considerable thermal inertia derived from the thickness of their masonry walls, which have a high capacity for heat storage. In general, when we consider the summer period, the inertia of the envelope walls maintains the levels of temperature (T) and Relative Humidity (RH), while during the winter this effect cannot provide thermal comfort. However, there is no simple method for establishing the thermal transmittance of the envelope that considers solar absorption, wind direction and speed [14,15,16].
The most common passive solution that has been studied is adding thermal insulation to the building envelope [5,17,18]. However, in historic buildings, it is not always feasible to insulate the envelope, since the preservation of their architectural characteristics does not allow such modifications. In addition, some authors have verified that retrofit interventions by insulation could reduce the drying capacity of walls and modify the temperature gradient. This could undermine the conservation of historic envelopes [19].
Another passive strategy can be implemented—natural ventilation as a much more effective method for reducing cooling than reducing the thermal transmittance of the envelope [20]. It has been demonstrated that the overheating risk that can occur in this kind of buildings, may be reduced with night ventilation [21,22]. Other authors investigated the case of a historical building in Catania, in which they combined a high thermal inertia mass with natural ventilation to prevent overheating and provide good comfort levels. This reduced the need for cooling systems during the summer. However, the same authors highlighted several setbacks that can arise in night ventilation strategies, for example when the thermal oscillation between day and night is lower than 10 °C. In addition, even though this is the most economical solution for the natural cooling of buildings, it is very difficult to control since the directionality and intensity of air flows change with the climate [23,24,25]. Balocco et al. explained that annual variation in hygrothermal parameters inside and outside of historical buildings are characterized by slow differences that can produce minor changes, in contrast to impulsive seasonal variations that are much faster, for instance the effects of intense artificial lighting or even heating, ventilation and air conditioning, both without control [26,27].
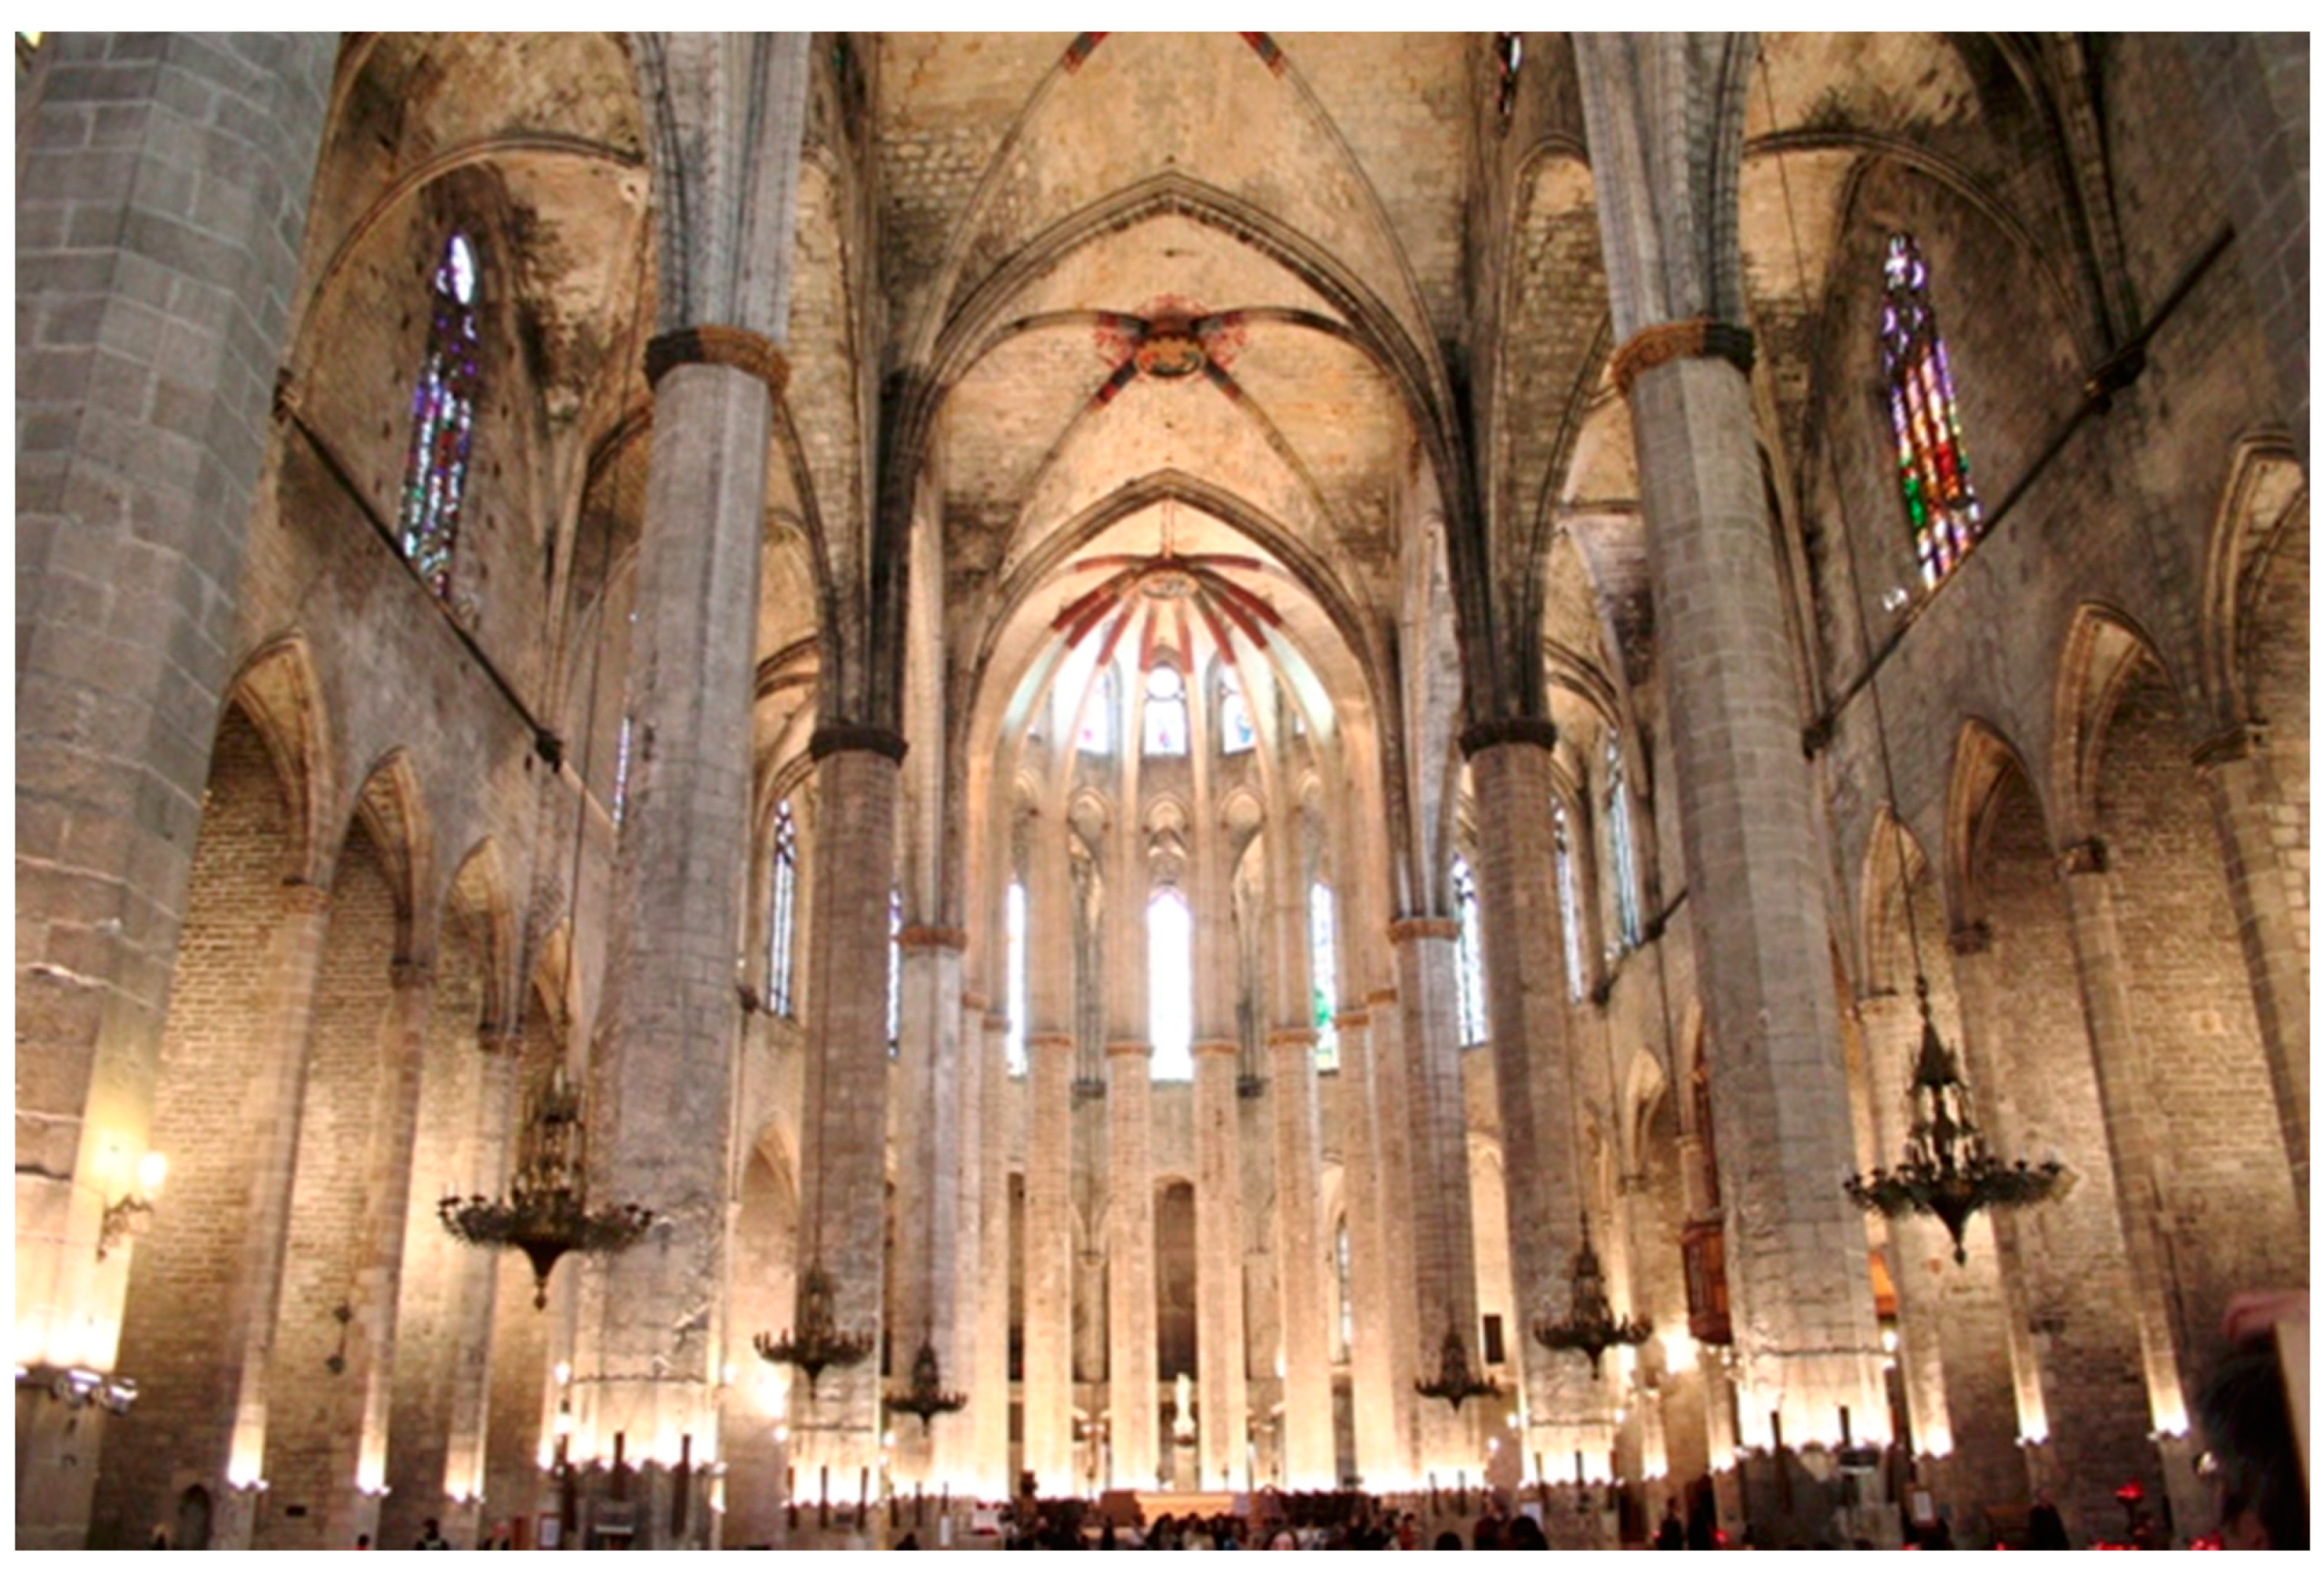
The characteristics of the interior space of the Santa Maria del Mar building are great height and a large inside air volume. Few authors deal with such an important factor. Muñoz-González et al. refer to several studies on thermal comfort in religious buildings that have this type of nave space. They note that most of them are in continental climates, with harsh winter periods. Accordingly, facilities that may be introduced, such as radiant floor heating, thermal benches or electric carpets, are designed to heat the buildings during winter, rather than to counter the effects of the extreme heat and sultriness that are typical of Mediterranean cities in the summer. The same author states that the implementation of only passive systems in these buildings does not completely eliminate the risk of thermal discomfort, and mechanical and biological degradation. A combination of active and passive strategies improves all these aspects when it functions 24 h a day but has the disadvantage of very high energy consumption. In some cases, only active strategies can be used, to preserve the cultural values of the building envelope. If their use is reduced to 12 h a day, energy savings can reach 38%. When their use is limited to the short time of celebrating mass, savings reach 90%. However, if we consider the preservation of artworks, air systems with relative humidity (RH) control are preferred for 24 h periods, to maintain the stability of environmental conditions [28,29].
To establish the user’s comfort, the system’s performance and its energy consumption, the information should be processed through a simulation software tool that can model the historic building characteristics and its behavior to raise several performance hypotheses [30]. A steady state or dynamic state calculation can be used. Dynamic state calculations consider short time intervals to distinguish heat and ventilation flows during use of the building. The last years some interesting publications about dynamic simulations on existing buildings have been carried out. Amirkhani et al. used the simulation software TAS (Thermal Analysis Software) version 9.4.4 in order to assess different strategies to improve their energy efficiency. Some strategies were based upon improving the energy performance of the own building elements, for instance, adding insulation on the inside face of the envelope or changing the windows incorporating low-e windows films. [31,32]. Other strategies consisted on modifying the active systems of the buildings, for example using splits with a high Energy Efficiency Ratio cogeneration or trigeneration [33,34,35]. Alwetaishi used the same software after gathering qualitative data and monitoring onsite [36]. Other thermal behavior simulation software has been used, with the aim of reducing energy consumption. Examples are DOE-2 program, a software developed by University of California and Hirsch, that can predict the energy use for all types of buildings [37]; the ThermoSem model, which is a thermophysiological model to predict thermal sensation in the built environment to obtain a more individualized assessment [38] and the well-known Design builder.
This last is frequently used to develop dynamic simulations to analyze thermal comfort in historical buildings. Muñoz-González et al. performed a dynamic simulation to analyze the heat transfer processes, the air-conditioning systems and other factors related to energy consumption in a church in southern Spain. They concluded that, during the summer, the church achieved thermal comfort 95% of the time and the need for air conditioning was reduced to winter heating. They noted the huge energy consumption of winter heating, due to the large inside air volume and the thermal inertia of the envelope walls [28].
Other authors, such as Gagliano et al., simulated the thermal performance of a traditional massive building in a Mediterranean city. They found that the building envelope maintained inside temperature except for minor oscillations. The need for air-conditioning was largely avoided, and night ventilation even accounted for 30% of cooling [16].
Cornaro et al. have been working on a method based on in situ monitoring and dynamic simulation to assess the most suitable solutions for rehabilitation of buildings that have great historical and artistic value. Their research differed from the case study in this paper, as they examined a multi-story building, with multiple rooms of usual height and volume, whose main problem was the need for heating during the winter period [39].
D’Agostino and Congedo analyzed the crypt of Lecce Cathedral through 20 CFD (Computational Fluid Dynamics) 3D models and 5 ventilation scenarios to find a solution that could generate an optimal interior microclimate for the preservation of the building. The scenarios were simulated by combining diverse hygrothermal exterior conditions and several entrances for ventilation air flows, which resulted in several air layers, depending on density, moving at different temperatures under the force of gravity [40].
Litti 2015 focused on microclimate comfort people (MCP) and included parameters that could affect artwork, like RH [41].
Muñoz et al. simulated a few Baroque churches in southern Europe from the perspective of the climate change foreseen for 2050. They carried out monitoring campaigns to validate the dynamic simulation. The churches showed a rising demand for cooling and a fall in demand for heating. The researchers identified an increase in use of active systems, which functioned for periods of at least 12 h to assure human comfort and artwork preservation [7].
Most of the above authors considered that the main thermal discomfort problem inside historical buildings with thick inertial walls occurs during the winter. During the summer, thermal comfort is acceptable even without cooling, if it is possible to protect against solar gains and heating loads and natural ventilation is controlled, especially at night [42]. However, there are very few studies on the main thermal discomfort problem in Mediterranean climates, during summer season, inside historical buildings, and particularly those characterized by high relative humidity. Additionally, there is a lack of scientific literature about thermal comfort in historical buildings with interior spaces of great height, huge air volumes and a considerable level of cultural protection. It must not be forgotten that this protection prevents interventions on the building envelope that could alter the historical value.
Considering the above, the hypotheses that will be discussed in this paper are the following:
For historic buildings in Mediterranean climates, which are characterized by high RH, the thermal discomfort level during the summer period is not negligible. It reaches levels that can be much higher than winter thermal discomfort levels.
In these cases, when the envelope cannot be altered because of cultural protection of the building, the only feasible passive strategy to improve thermal comfort is natural ventilation. However, when temperature and RH conditions are very similar inside and outside the building, neither natural ventilation nor just mechanical ventilation are effective.
Several criteria must be considered to minimize the impact on the historic building of the facilities that are required to achieve thermal comfort: operating periods, air volume and the required level of thermal comfort.
This paper considers all these aspects and proposes a methodology based on three steps: strict characterization of the building and the climate, onsite monitoring, and dynamic simulation. All of these steps are followed to analyze users’ thermal comfort inside historical buildings of great height and volume located in humid Mediterranean climates, particularly during the summer period when the hygrothermal conditions are harsh and will become even harsher if the long-term forecasts come true. The main aim is to establish several strategies to achieve thermal comfort at a less demanding level than that required in modern buildings, that are used for long periods, and considering that any intervention cannot affect the building envelope, to preserve its cultural values.

2. Materials and Methods

2.1. Case Study

The Basilica of Santa Maria del Mar is a Gothic temple built between 1329 and 1383 in the Ribera neighborhood. It was given the name “del Mar” (of the sea) due to its proximity to the sea. The Basilica has great historical, sentimental and identity value for the people of Barcelona. It competes with its simplicity and beauty with the nearby Barcelona Cathedral, built between 1298 and 1417.
The master builders of Santa Maria were first Berenguer de Montagut and then Ramon Despuig. The building is in the style of Mediterranean Gothic and follows the model of a “hall” church. In hall churches, the naves are of almost the same height and are just separated by slim columns, which contributes to the visual perception of a unitary space. This is in contrast to French Gothic, in which the central nave is always higher than the lateral naves. This is one of the main singularities of this church, together with its quick construction. It had a direct impact on the thermal and lightning conditions, since the main windows are on the façades of the lateral naves and have restricted dimensions to avoid excessive solar gains, as can be seen Figure 1. This is another difference with French Gothic churches, where the main windows are on the main nave façades and have large surfaces to improve natural lighting conditions.
The exhibited artworks are mostly made of stone as the fire of 1936 burnt most of those that were made of wood.
Santa Maria del Mar was declared a heritage building with national cultural protection in 1931.

2.2. Method for Assessing Thermal Comfort Conditions

The method to assess users’ thermal comfort inside historical buildings with large volume spaces was developed following these steps. In the first phase, data are collected on the building, the climate and environment, and the users’ activity and clothing. In a second stage, onsite monitoring of hygrothermal data takes place. In the final phase, a dynamic simulation with Design Builder software, with the powerful calculation engine Energyplus, is carried out for different scenarios of use and ventilation.
These steps are described in detail in the following sections and developed for the case study of Santa Maria del Mar in Barcelona.

2.2.1. Data Collection on the Building and Users

The Basilica is located in the Ribera neighborhood, also called the Born, and is characterized by high building density, narrow streets and buildings five or six stories high, as can be observed in Figure 2. All these factors contribute to the urban heat island effect.
The basilica is oriented in the usual direction, the apse looking to the east and the main entrance on the west façade, the east façade is partially adjacent to another building.
In research on thermal comfort inside a building, it is essential to obtain deep knowledge of its construction. Santa Maria del Mar is 33 m wide, 33 m high and 80 m deep. It was built of Montjuïc stone shaped into small ashlars for the façade walls that are 80 cm thick, and small blocks for the ribbed vaults that are 40 cm thick. All these stone elements are bare, without any kind of coating.
The main nave is covered by a flat roof. A gap was left between the vault and the roof, which is full of empty clay vases to make an air chamber and consequently reduce the horizontal thrust of the main nave vaults. The lateral naves are covered by a flat roof over solid vaults, to increase their horizontal thrust and compensate for those of the central nave. Every vault has openings connected to the roofs, which formed the historical ventilation system. These orifices are usually open and must be closed before rainy days.
The façades are characterized by a greater proportion of massive walls than openings, as can be seen on the plans of the building in Figure 3. Windows are Gothic roses for the central nave and rectangular shapes topped with a pointed arch for lateral naves and chapels. Only a small part of the windows can open, adding up to a total of 7.20 m2 of ventilation surface. The four doors made of wood are the four entrances to the temple and comprise a total of 16.50 m2 of ventilation surface.
The floor of the basilica is comprised of stone paving without any kind of insulation below.
Another key factor in user thermal comfort is occupancy according to the time of day. The parish of Santa Maria del Mar provided data on worship use and exceptional use, referring the maximums and minimums, as summarized in the following table.
In parallel to worship occupancy and during the remaining opening times of the temple, cultural visits take place. The flow of visitors is variable and difficult to specify but is much greater during the summer, when there are more tourists in Barcelona.
To assess thermal comfort, the user’s activity and the degree of physical movement that it implies must be specified. In this case, light activity was considered that involves standing up, a relaxed cultural visit in which visitors walk slowly through the temple, and church masses. This movement intensity is correlated with a metabolic rate of 93 W/m2. (ISO 7730:2006/Appendix A/Table 1).
Finally, clothing must be defined, which depends on climate. For the summer, 0.5 clo was considered (light clothing). For the winter, 1.5 clo was defined, which implies a thick jacket. For the rest of the year, the values have been interpolated.

2.2.2. Onsite Monitoring

On three occasions during the summer of 2020, monitoring was carried out inside and outside the basilica to measure the hygrothermal air parameters. A data logger RS-PRO 1.160 was used to obtain the dry-bulb temperature and the relative humidity of air. Figure 4 shows where several measurements were made inside and outside the temple, some in the central corridor and the others at the four main entrances, which are both indoors and outdoors. Table 2 outlines the monitoring data.
These data have been compared with data from a nearby weather station—those obtained the same day of the year in the previous five years and those obtained during the rest of the days of the same month and year. The statistics for the results are shown below on Table 3 and Table 4.
For Monitoring 1 (27 July 2020), compared to the rest of the days of the same month, there were 35% of days with a higher minimum temperature, 3% of days with higher maximum temperature and 55% of days with a higher RH. Clearly, this was a hot day for the month. It was not so wet and was not far from the conditions in the previous five years on the same day. It must be underlined that thermal amplitude between night and day had a very low value.
For Monitoring 2 and 3 (12 August 2020), compared to the rest of the days of the same month, there were 3% of days with a higher minimum temperature, 25.5% of days with a higher maximum temperature and 58% of days with a higher RH. It was a warmer day than the same day in the previous five years, and less wet. Again, the thermal amplitude between night and day had a low value.
If we turn to the indoors monitoring on Table 2, several parameters on it should be highlighted because of their importance in the justification of this research. First, occupancy was unusually low compared with regular occupancy for the summer period. This was a direct consequence of the COVID-19 health crisis and the lack of cultural visitors. Secondly, the perception of sultriness should be highlighted. This depends mostly on the T and HR as shown in Figure 5, which we usually call the Heat index. The index represents what the temperature feels like to the human body when RH is combined with the air temperature. When atmospheric moisture content is high, the rate of evaporation from the body to regulate its temperature decreases, so it feels warmer.
The data from Table 2 were transferred to the table in Figure 5. It can be seen that for Monitoring 1, with a maximum temperature of 31 °C and 64% RH, thermal perception is 36 °C; for Monitoring 2, with 29 °C and 70% RH, the perception is 33 °C; and for Monitoring 3, with 31 °C and 60% RH, the perception is 35 °C. All these data are located on the “Extreme caution” area of the table. Surprisingly, the sultriness perception was higher for Monitoring 2, with the lowest heat index. As a hypothesis, this could be attributed to the high RH registered in contrast to outside RH and the T early in the morning.
This information should be reviewed considering the usual occupancy data, which uses to be much higher than that of 2020. Theoretically, more visitors during the summer period would mean a latent heat increase, which would result in higher RH. If this is above 80%, with the same T that was monitored, the thermal perception could be above 40 °C. This corresponds to the “Danger” area of the table.

2.2.3. Dynamic Simulation

The dynamic simulation software used was Design Builder, which runs with the calculation motor engine Energyplus v8.9. Data were introduced progressively in following order—first the building configuration, then the occupancy, activity and clothing of users, followed by the climate data, and finally the simulation scenarios. Each one of these phases are described below in detail.
The first step consisted of modelling the building, specifying the interior air volume and the surfaces of the envelope elements that are responsible for the thermal exchange, as well as the materials and their theoretical thermal performance, as shown in Figure 6 and Table 5.
Then, the occupancy data, user’s activity and clothing were introduced. Specifically, the air volume in the users’ space was studied, in around the first 3 m above the floor, with an expected occupation of 384 people. This number was determined by the simulation software for a public use building, like a museum, considering 0.15 people/m2. This last item of data gives an approximation of the occupancy during the summer period, with a great influx of visitors. These parameters are detailed in Table 6.
Afterwards, climate data were introduced and were calibrated according to two factors—climate data (T, RH) provided by a near weather station, which should reflect the urban heat island effect characteristic of dense historical urban centers, and data corresponding to onsite monitoring outside the temple.
Lastly, simulation scenarios need to be defined to establish the degree of user thermal comfort, particularly during the summer, and to identify corrective strategies that should affect only the air volume around the user up to a maximum of 3 m height and not affect the building envelope, to preserve its cultural values.
The proposed scenarios should depart from the most similar situation to reality. Strategies must be added gradually according to two criteria—the energy consumption and the impact on the monument. The first scenario (A) is the point of departure, the current state with no ventilation at all, which implies no energy consumption and no impact. The second scenario (B) considers the only passive strategy that can be implemented without altering the envelope of the building, which is natural ventilation through opening windows and doors. The third scenario (C) proposes mechanical ventilation and several sub-scenarios depending on the ventilation flow rate. This is the beginning of energy consumption and impact. The fourth and last scenario (D) considers mechanical ventilation with cooling, also with several sub-scenarios, that leads to more consumption but probably the same impact as the previous scenario.
At this point, the concept of thermal comfort should be defined. For this research, the criteria of the Fanger method were applied, which consider thermal comfort depending on two indices: the predicted mean vote (PMV) and predicted percentage dissatisfied (PPD). These show respectively the medium thermal sensation inside a building, and the percentage of people who will feel uncomfortable. A PPD < 6% was considered equivalent to a PMV near 0 and very strict thermal comfort; PPD < 10% is related to PMV from −0.5 to +0.5 and ideal thermal comfort; PPD < 20% corresponds to PMV from −1 to +1 and acceptable thermal comfort. The latter was chosen as suitable for this case study, as it was considered an adequate comfort level for short occupancies, like a cultural visit or church mass. In addition, it was considered that users understand that is not possible to be as demanding with thermal comfort inside a historical building of cultural value as inside a new building.

3. Results

Below are the results for the four scenarios.

3.1. Scenario A: Current State

In the absence of any natural or mechanical ventilation, the degree of thermal discomfort during the summer months widely exceeded the value PMV+1, and even reached the value of PMV+2 in August, which was unacceptable according to the code ISO 7730:2006. In the graphics of Figure 7, the red line shows the limits for PMV+1.

3.2. Scenario B: Natural Ventilation (NV)

This scenario considered the air flow rate through the doors and windows during the opening hours of the basilica, from 9 a.m. to 8.30 p.m. Night ventilation is not an option, as there is no night-time surveillance, and the opening of doors and windows may cause unwanted intrusion.
As can be seen in Figure 8, scenario B barely changed from scenario A and a very similar number of thermal comfort hours was obtained.
These data can be interpreted when we consider the onsite monitoring of T and RH inside and outside of the basilica. It can be seen that any variations in these parameters indoors/outdoors were almost imperceptible, so efficient natural ventilation was not obtained.

3.3. Scenarios C: Mechanical Ventilation (MV)

This case simulated and analyzed the effectiveness of a mechanical ventilation system to renovate the air volume of the temple, strictly in the area from the floor up to 3 m height. The total air volume of the church, which is 33 m high, was not considered, as only the three lower meters are occupied.
To establish the ventilation air flow rate, the requirements of the Spanish law on heating, ventilation and air conditioning systems (RITE) were taken into account. For church mass occupancy or cultural visits, air quality IDA2 would be sufficient, but for exceptional concerts and celebrations air quality IDA3 would be required. Figure 9 shows the required ventilation air flow rates to guarantee good quality of interior air.
Several sub-scenarios were considered depending on the operating hours of the machines. Scenario C.1 considered mechanical ventilation between 9 a.m. and 8.30 p.m. Scenario C.2 contemplated mechanical ventilation between 5 a.m. and 8.30 p.m. For both cases, the simulation took different air flow rates, to identify different degrees of thermal comfort, and the electrical power that would be necessary: 2500 l/s (a), 8750 l/s (b) and 10,000 l/s (c).
For the first timing, scenarios C.1.a (2500 l/s), C.1.b (8750 l/s) and C.1.c (10,000 l/s), the percentage of acceptable thermal comfort hours was 69%, which means 750 h with PMV > +1 or discomfort hours. Figure 10 shows the comparison between the original scenario, A, and the scenarios C.1.a, C.1.b and C.1.b for the month of September.
For the second option of machine operating hours between 5 a.m. and 20.30 p.m., and the same air flow rates reflected in scenarios C.2.a, C.2.b and C.2.c, 700 h of thermal discomfort still remained. Therefore, it could be concluded that even when it operates most of the day, mechanical ventilation is not enough to overcome thermal discomfort.

3.4. Scenarios D: Mechanical Ventilation with Cooling (MVR)

Once the thermal dissatisfaction described in the previous sections had been verified, it was considered necessary to go one step further and simulate the effectiveness of a mechanical ventilation system with the capacity to add active cooling. As in scenario C, the area of renovated air was limited to the lower 3 m. There are also two operating schedules, from 9 a.m. to 8.30 p.m. for scenario D.1, and from 5 a.m. to 8.30 p.m. for scenario D.2. Three options for renovating air flow were evaluated: 2500 l/s (a), 8750 l/s (b) and 10,000 l/s (c).
Figure 11 shows that, for operating hours from 9 a.m. to 8.30 p.m., when a renovating air flow of 8.750 l/s (scenario D.1.b) was considered, the result was 98% of ideal thermal comfort hours (−0.5 < PMV < +0.5) and 2% of acceptable thermal comfort hours (−1 < PMV < +1).
Figure 12 shows that for operating hours from 9 a.m. to 8.30 p.m. with a renovating air flow of 2500 l/s (scenario D.1.a) acceptable thermal comfort can be achieved most of the time, although 45 h surpass this situation. When the same renovating air flow but a time schedule from 5 a.m. to 8.30 p.m. (scenario D.2.a) is considered, only 5 h exceed PMV+1.
Table 7 consists of a summary table of scenarios D, their percentage of thermal comfort, ideal or admissible, the occupancy hours under each comfort type and the improvement with regard to the current state.

4. Discussion

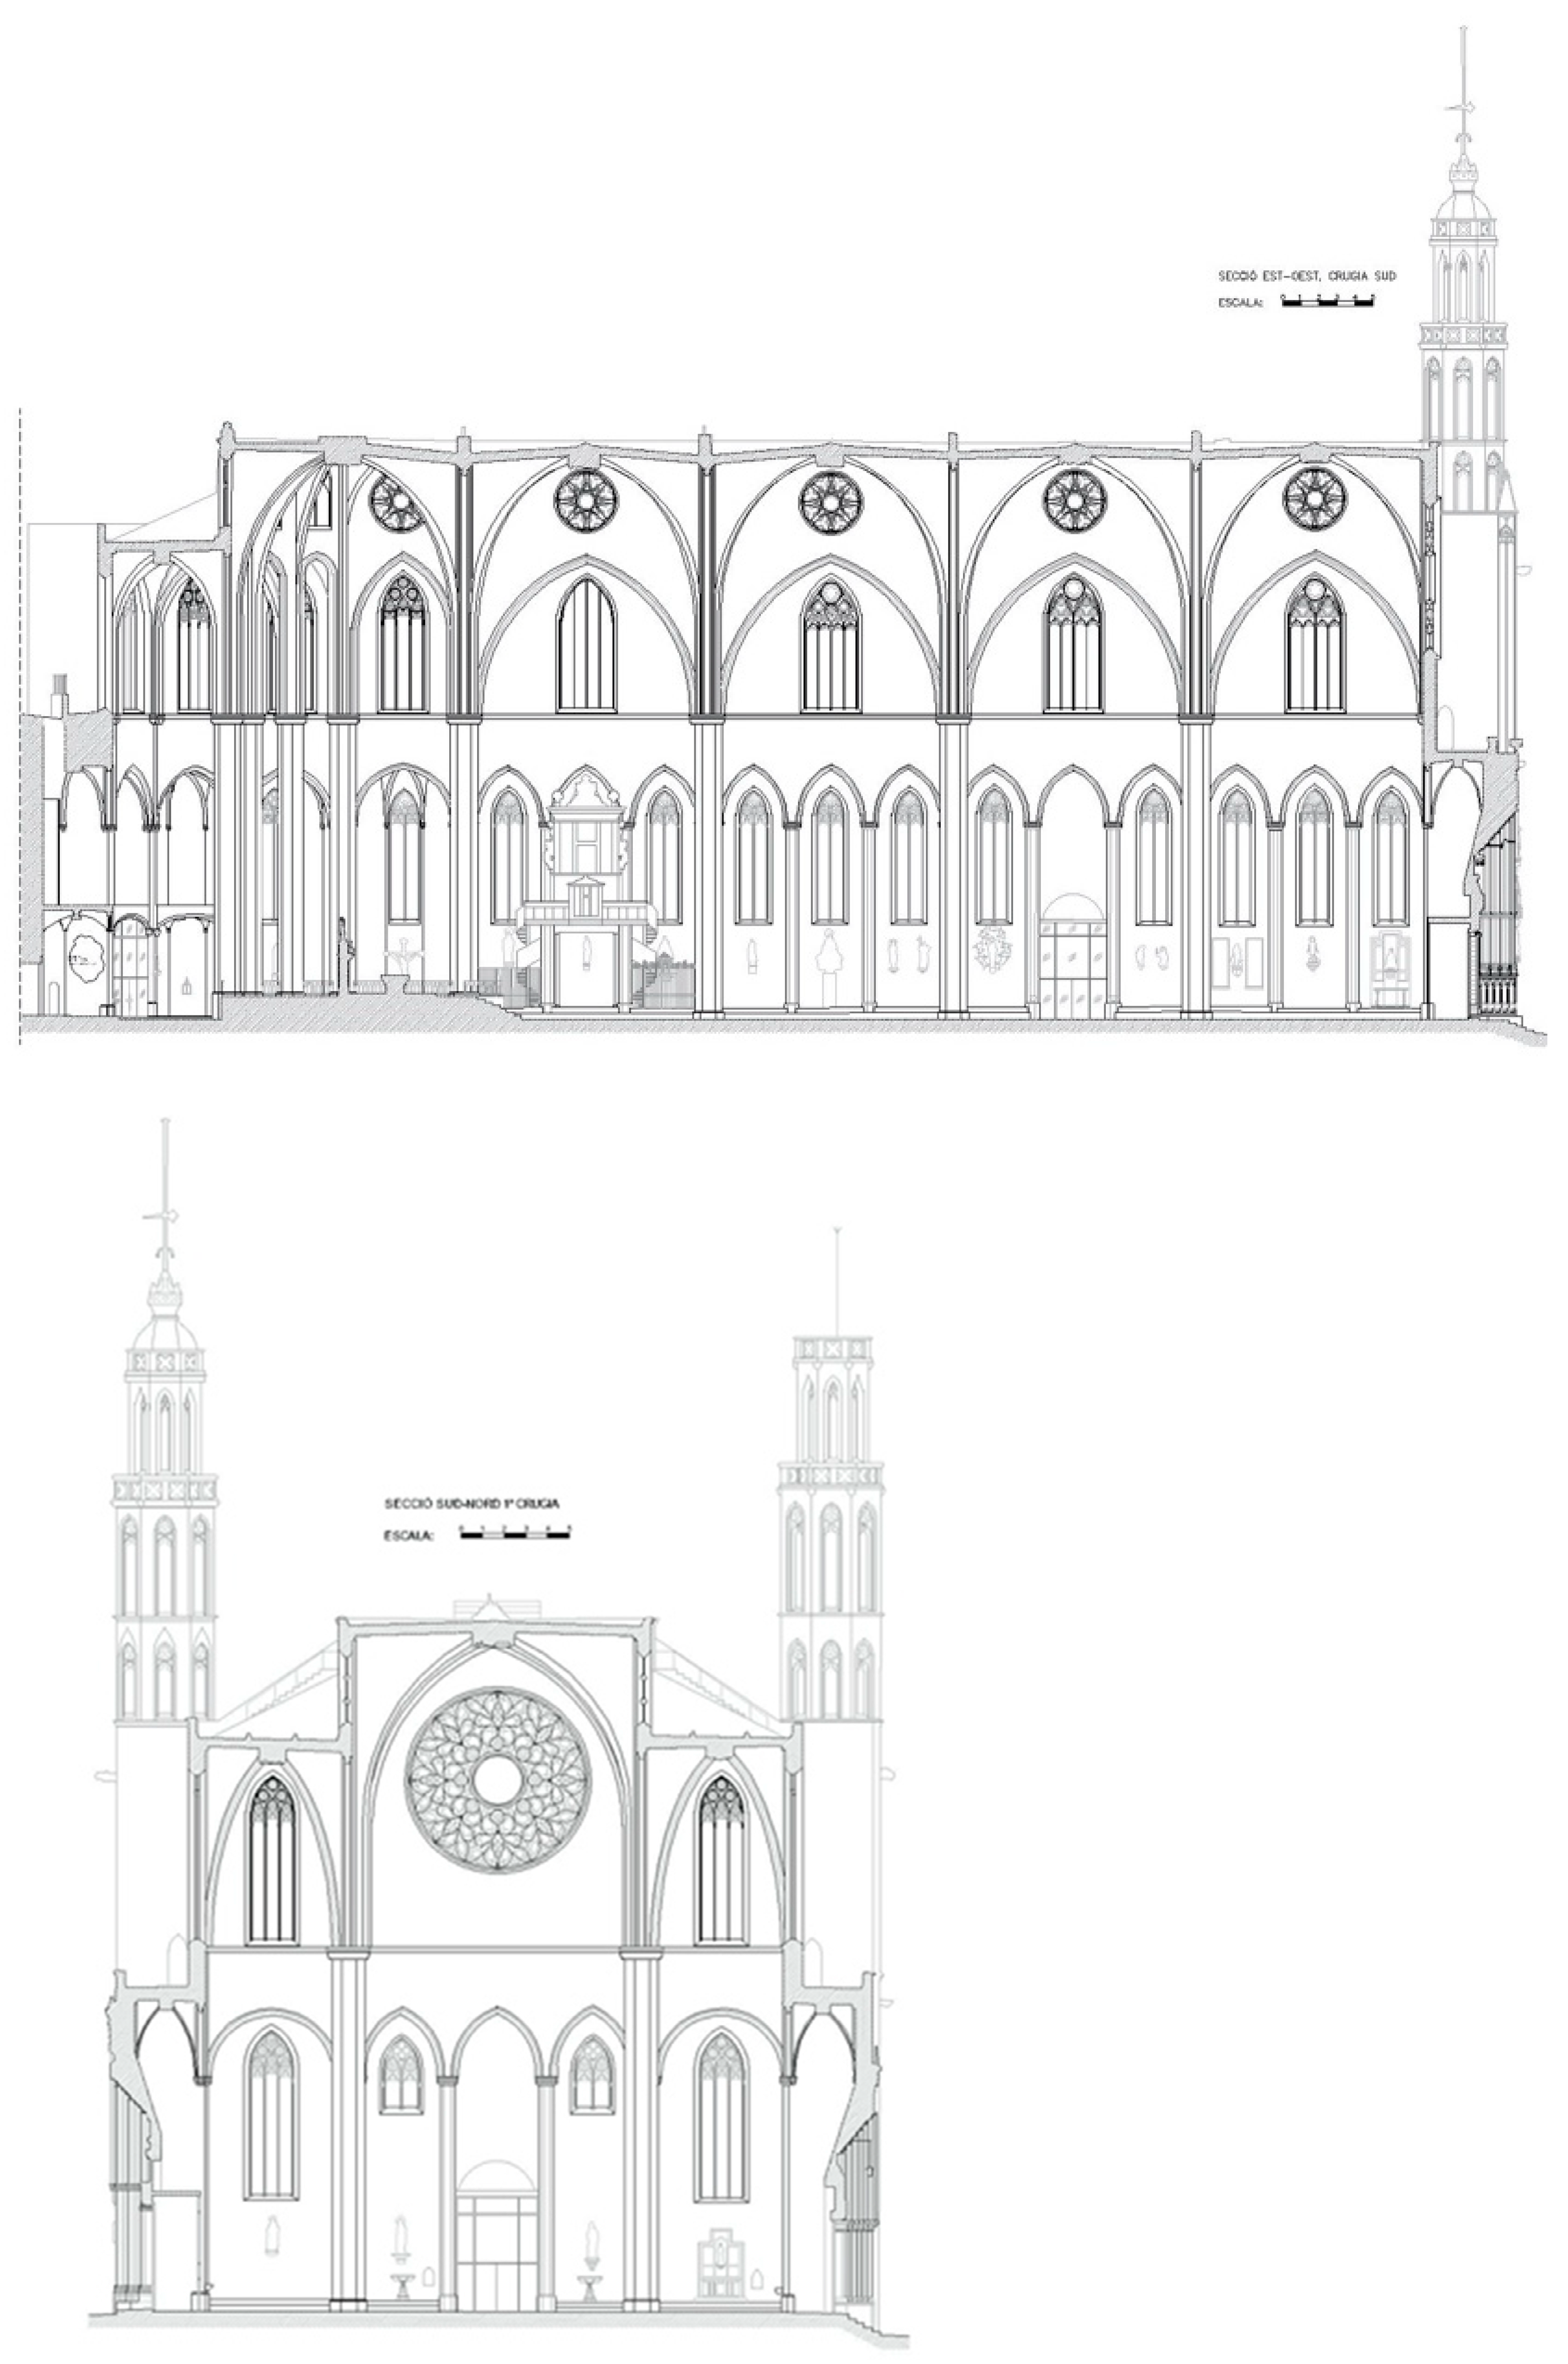
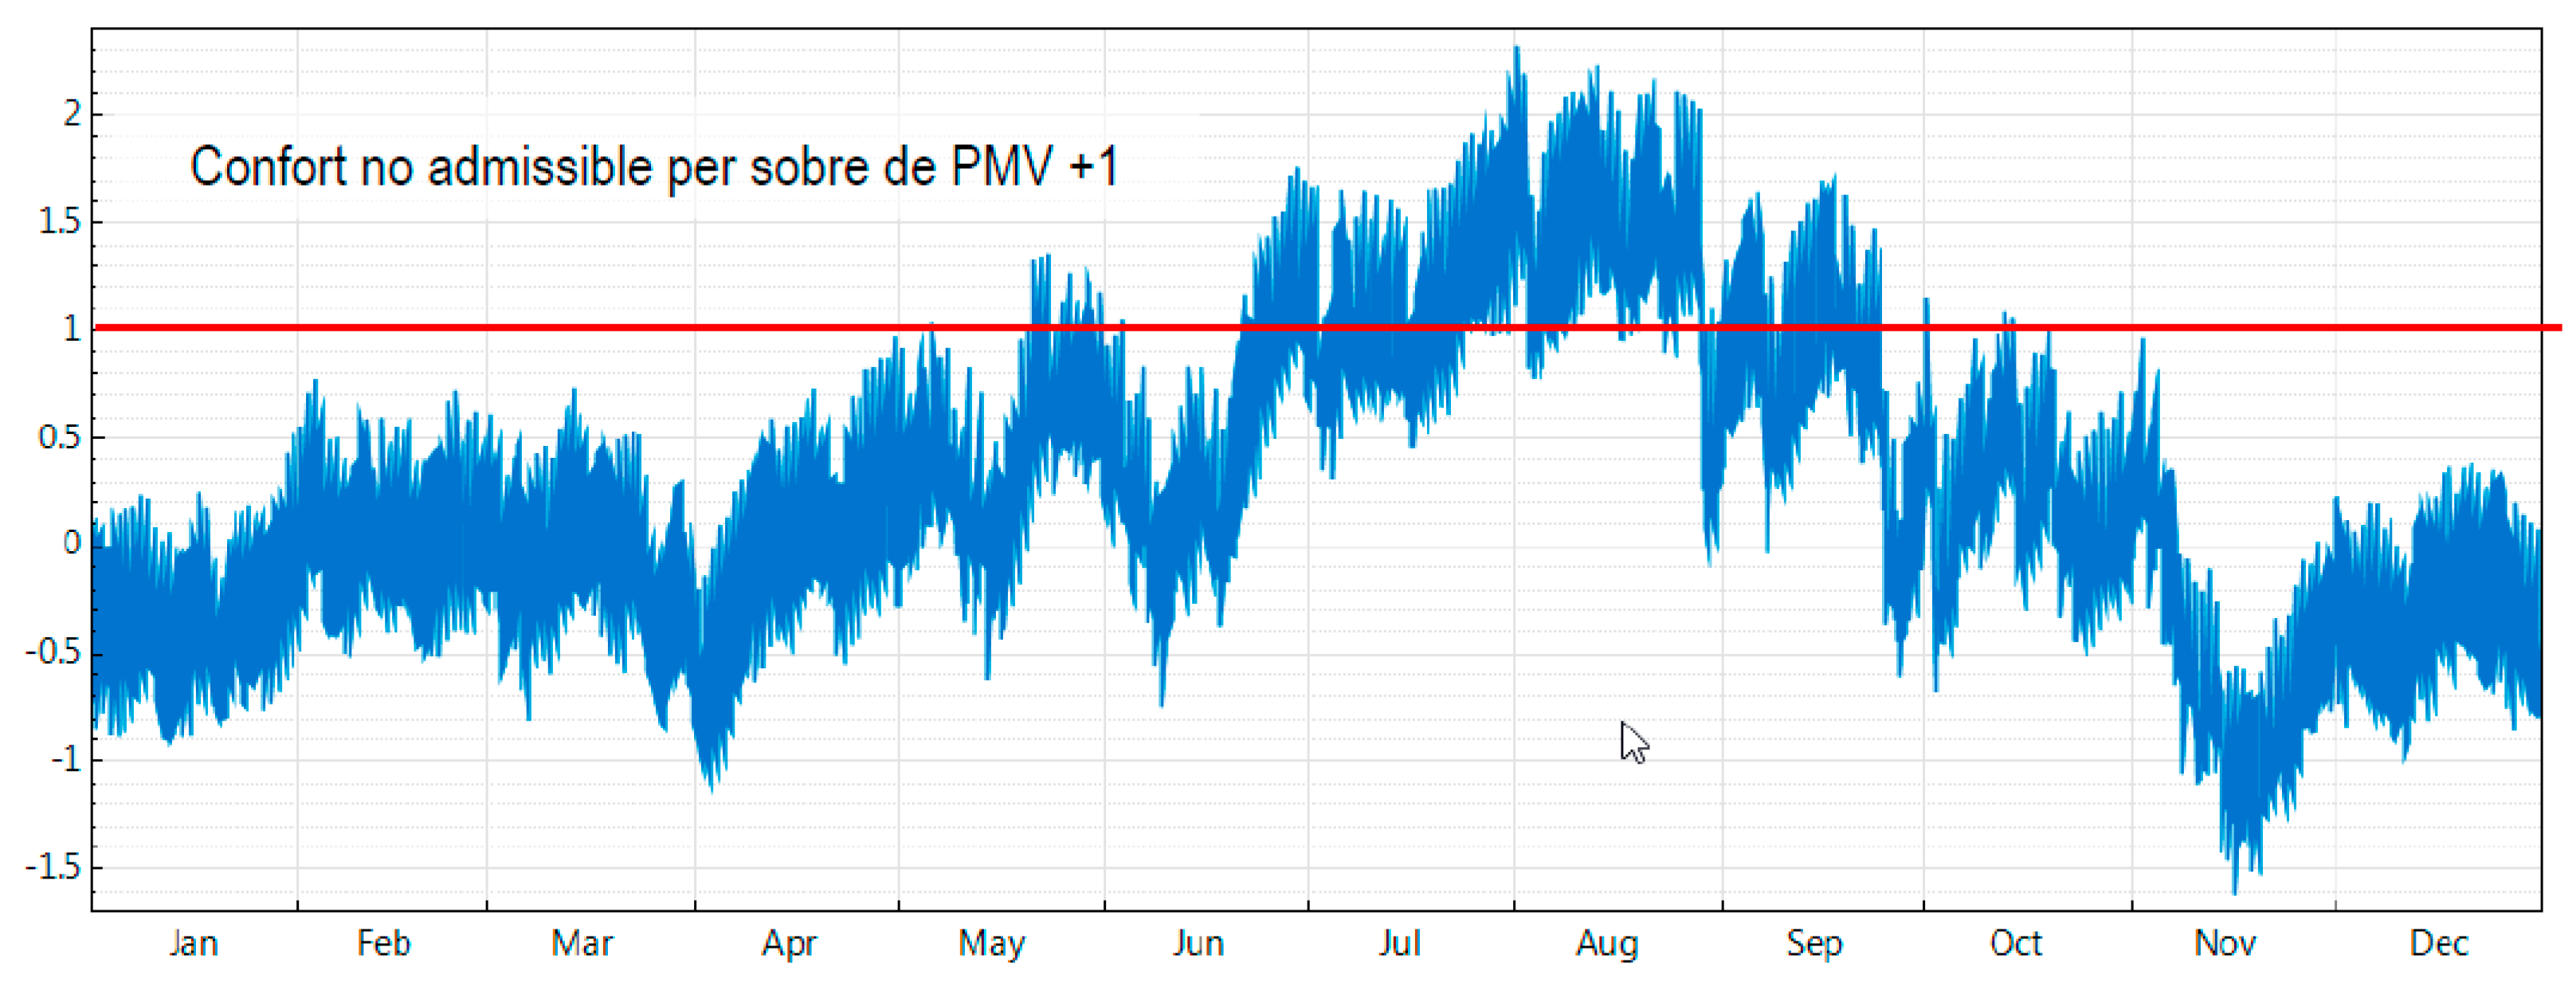
As mentioned at the start of this paper, this historical building, with massive façade walls 80 cm thick, high thermal inertia and natural ventilation during the summer, does not behave as these kinds of buildings are thought to. Thermal comfort is not achieved, although most studies, mentioned earlier in this paper, have noted the summer benefits of thermal inertia. It has been verified that thermal conditions inside the temple during the harshest days of this period, which coincide with the highest number of visitors, are extremely sultry.
This is probably due to the extremely difficult renovation of inside air, and this effect results from the very small difference between temperature and relative humidity indoors with regard to temperature and relative humidity outdoors, as shown by onsite monitoring. The reasons are multiple, for example the lack of tightness and insulation on the envelope that results in air leaks and high transmittance, particularly in the flat roofs that have great solar gains during the summer months, and the simple glass of the stained-glass gothic windows. Also, the small thermal oscillation throughout the day in this neighborhood, between 3 and 5 °C, is a key issue. In fact, some authors have demonstrated that energy saving, connected to the effects of thermal inertia and night ventilation, tends to be more evident when thermal oscillation exceeds 10 °C, varying from small percentages to more than 80% [15]. Neither must we forget the heat island effect, which usually provokes an increase of environmental night temperatures.
Some researchers suggest night ventilation to avoid indoors overheating during the daytime [21,22]. In this case study, night ventilation is not an option due to risk of intrusion. This strategy is not always a feasible option for heritage buildings that house works of art, so conditions that could make it suitable when night surveillance is not affordable must be studied.
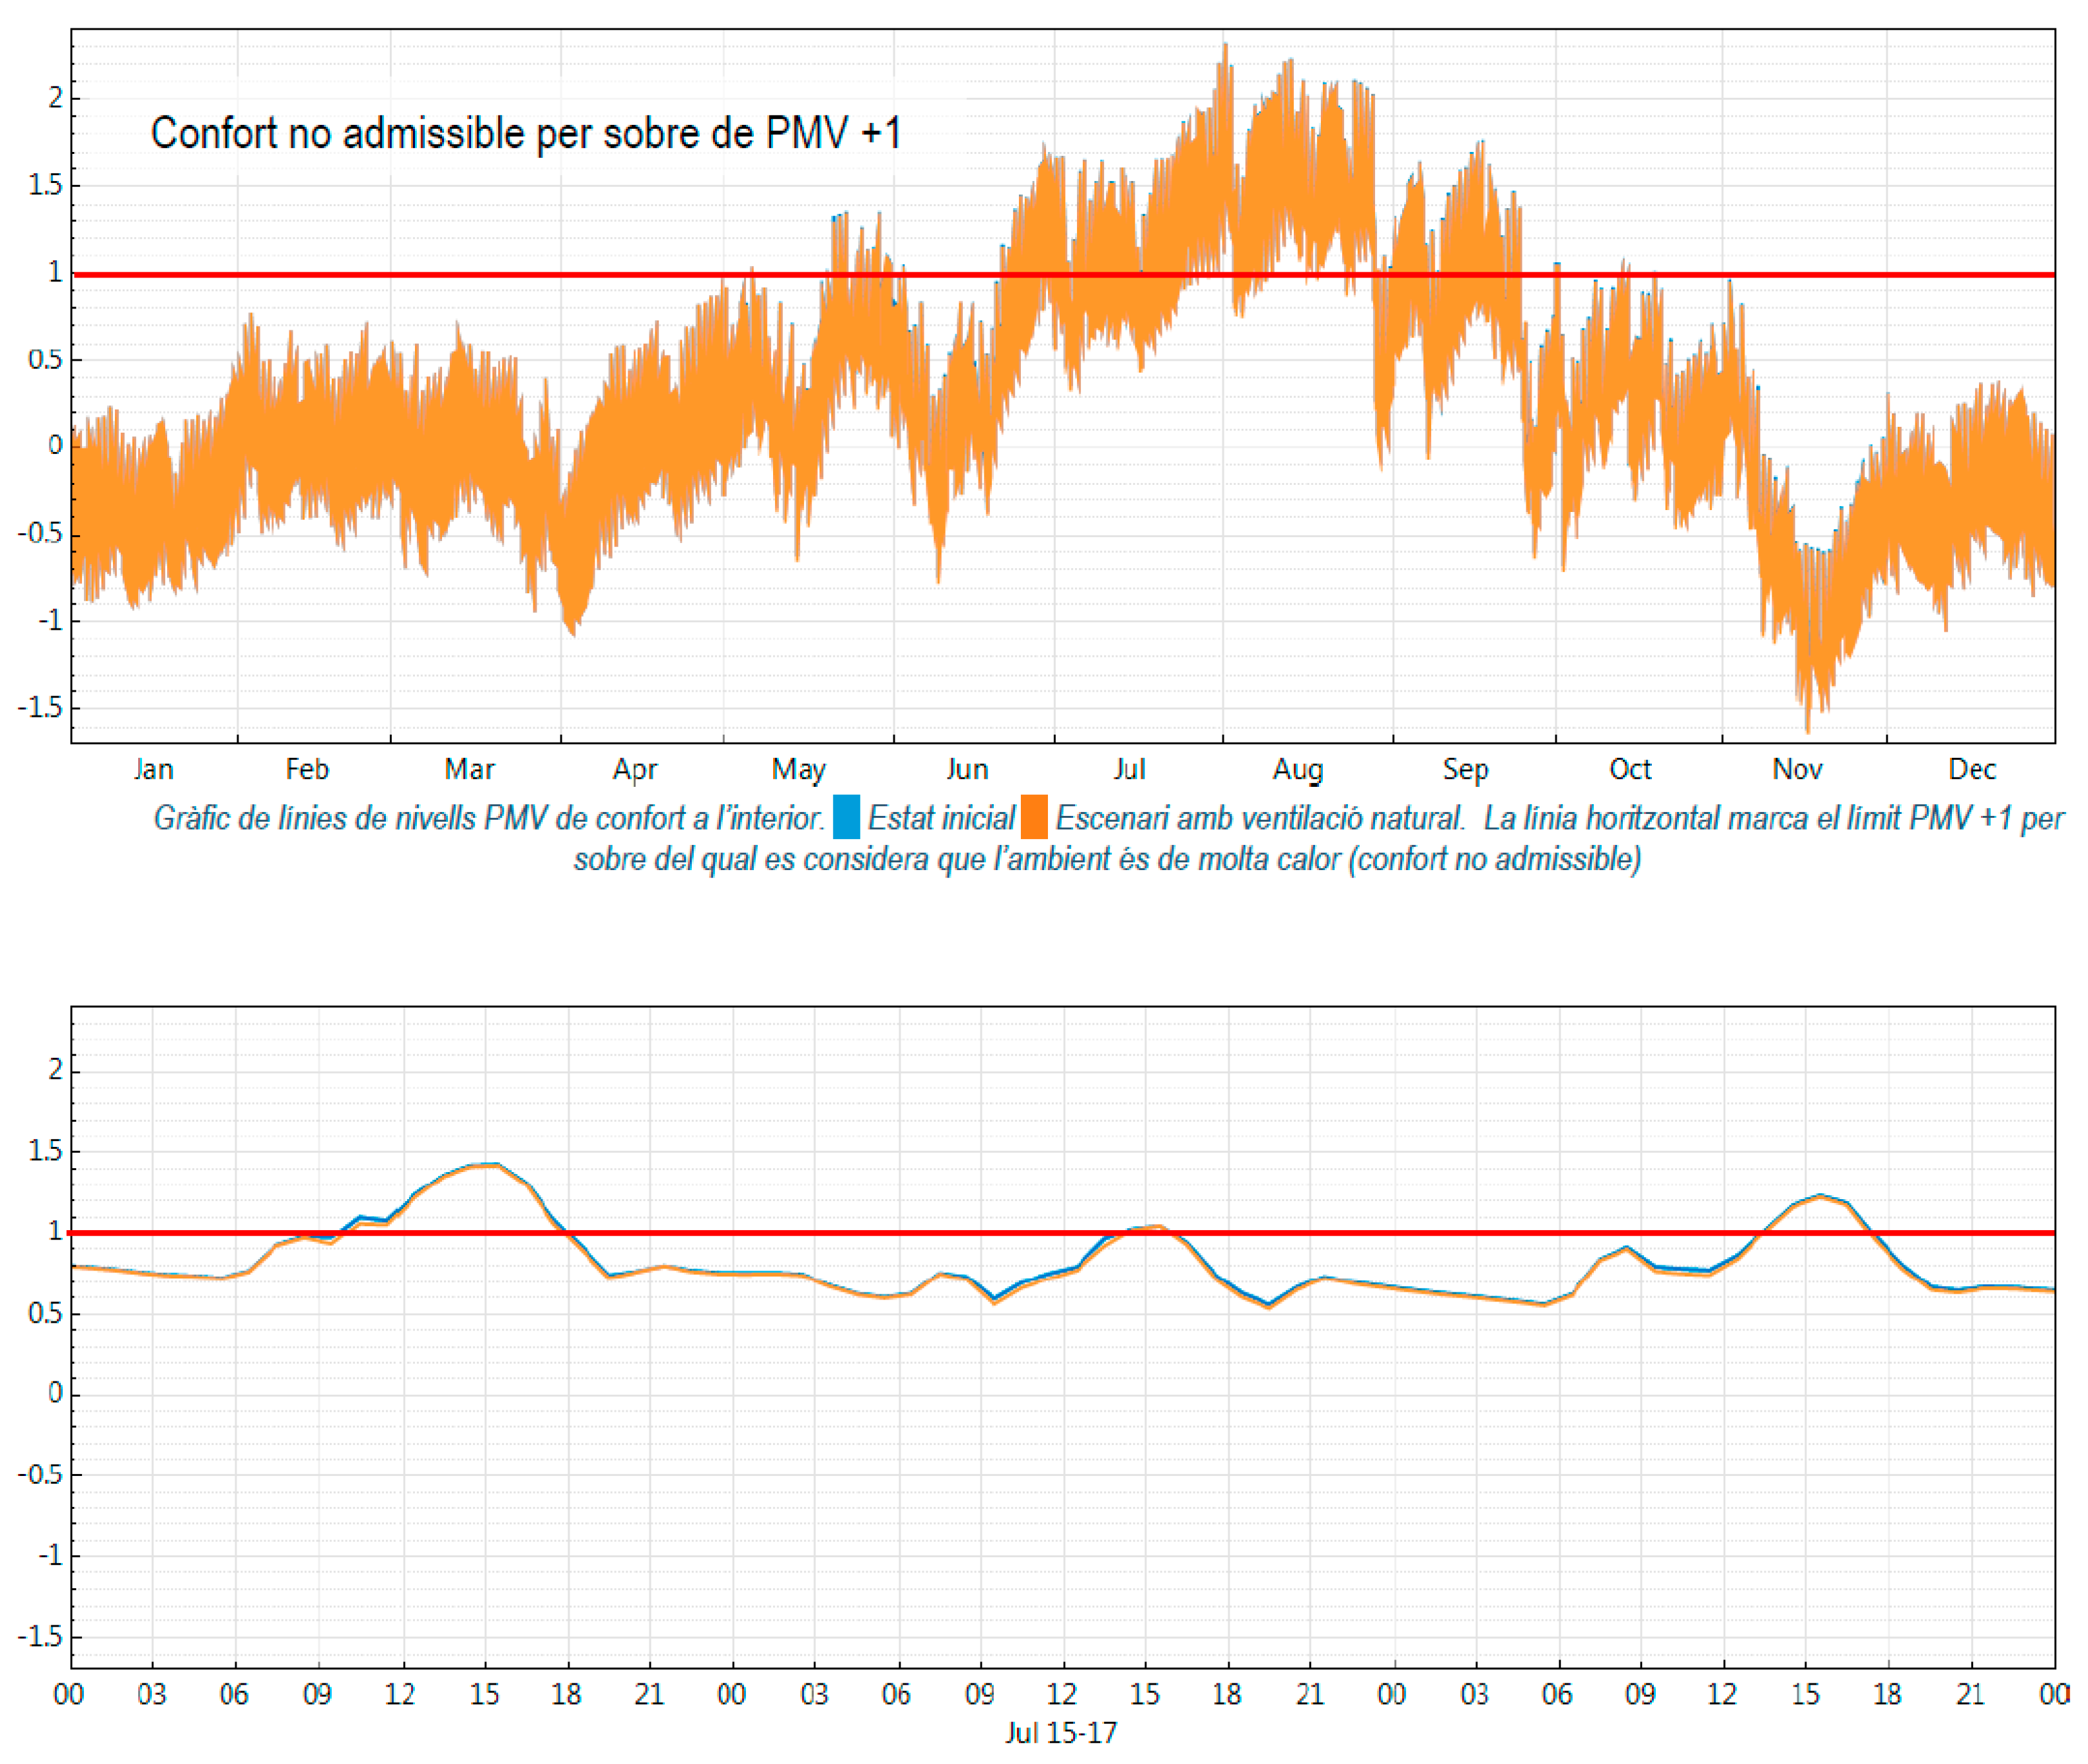
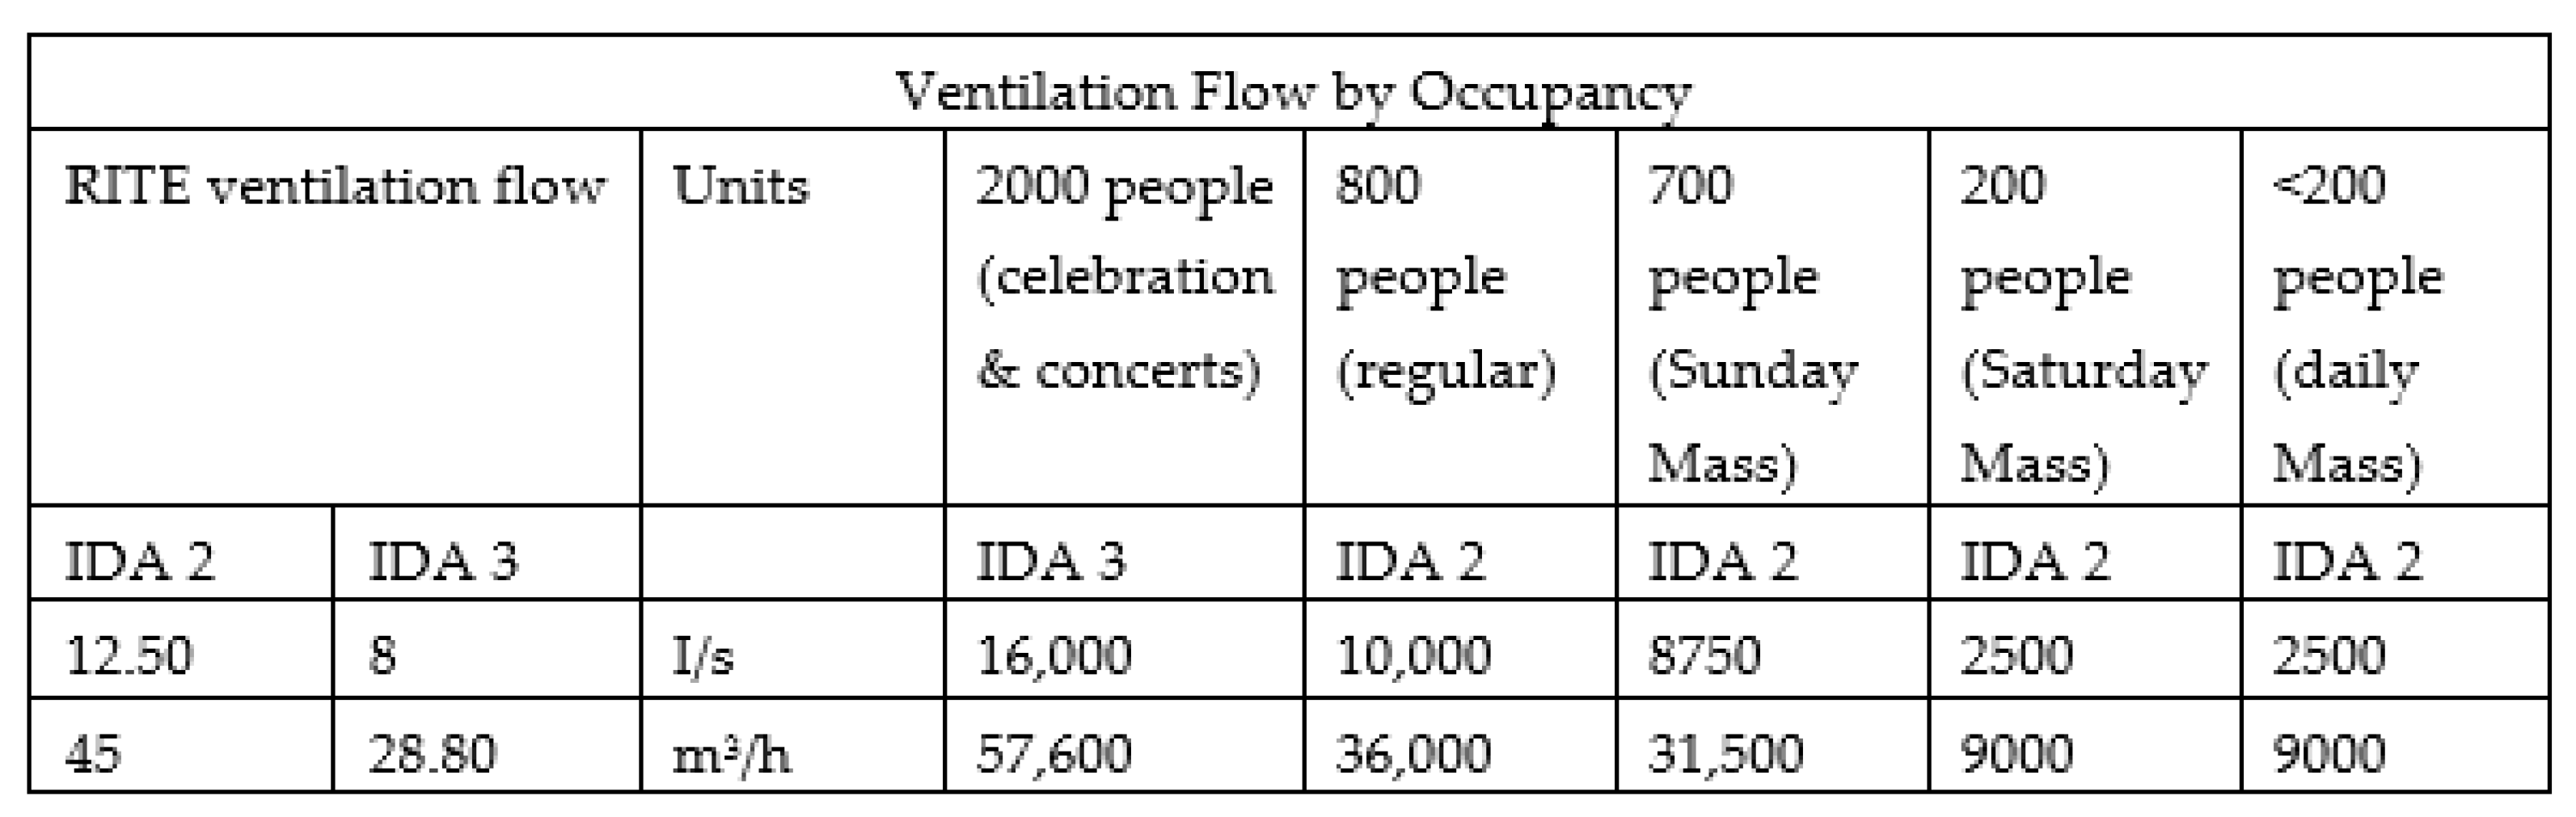
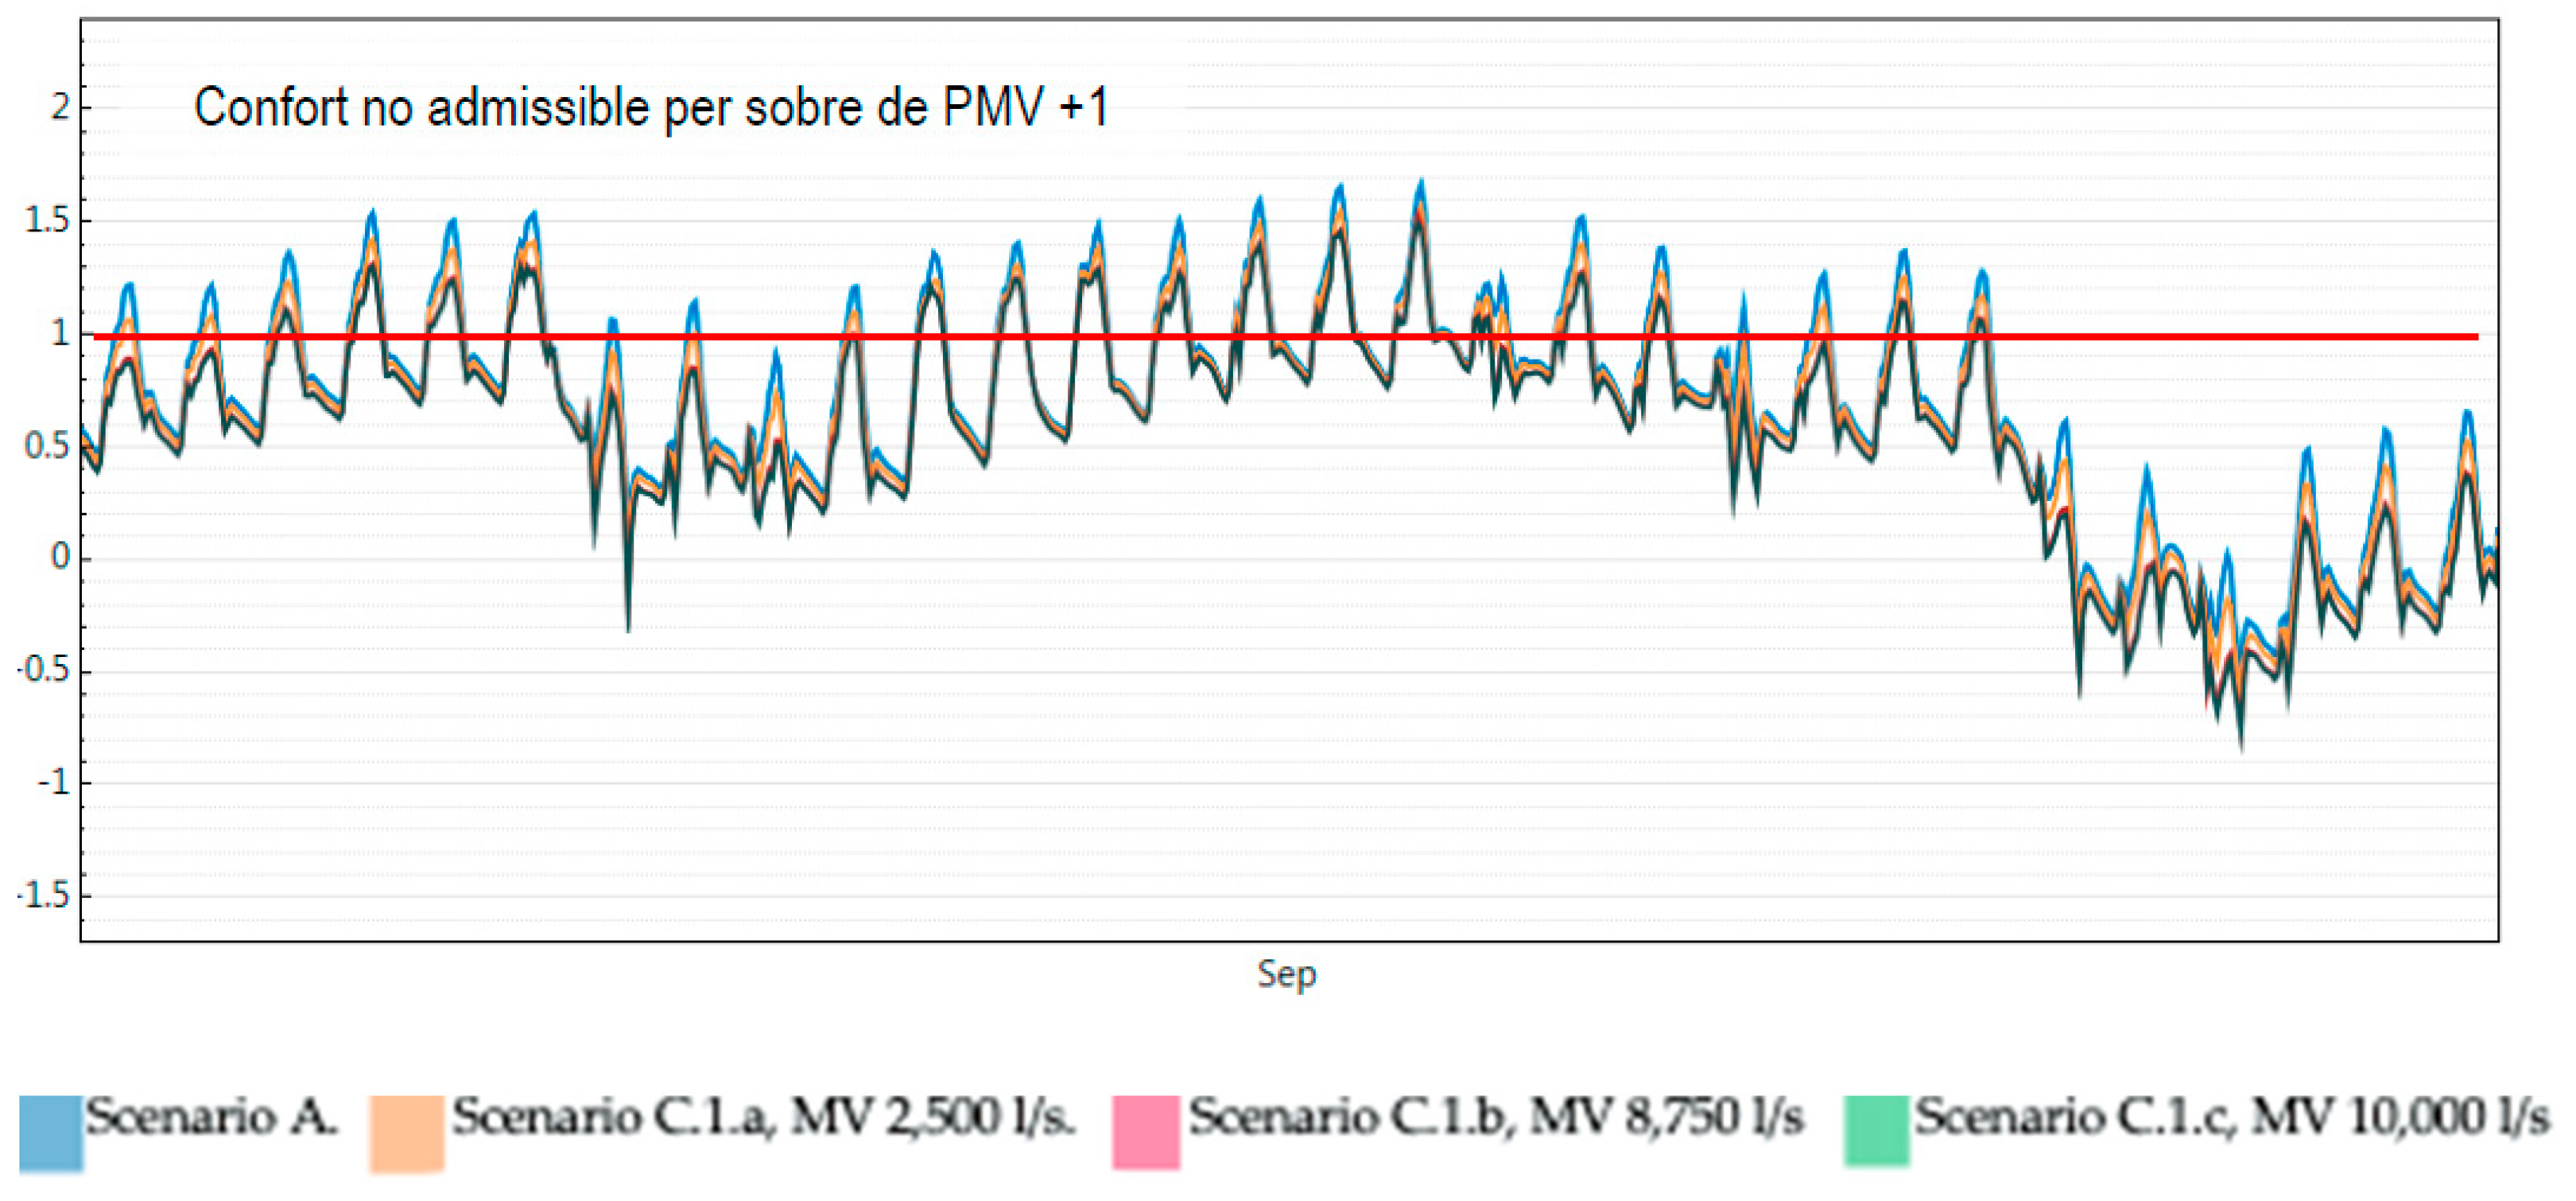
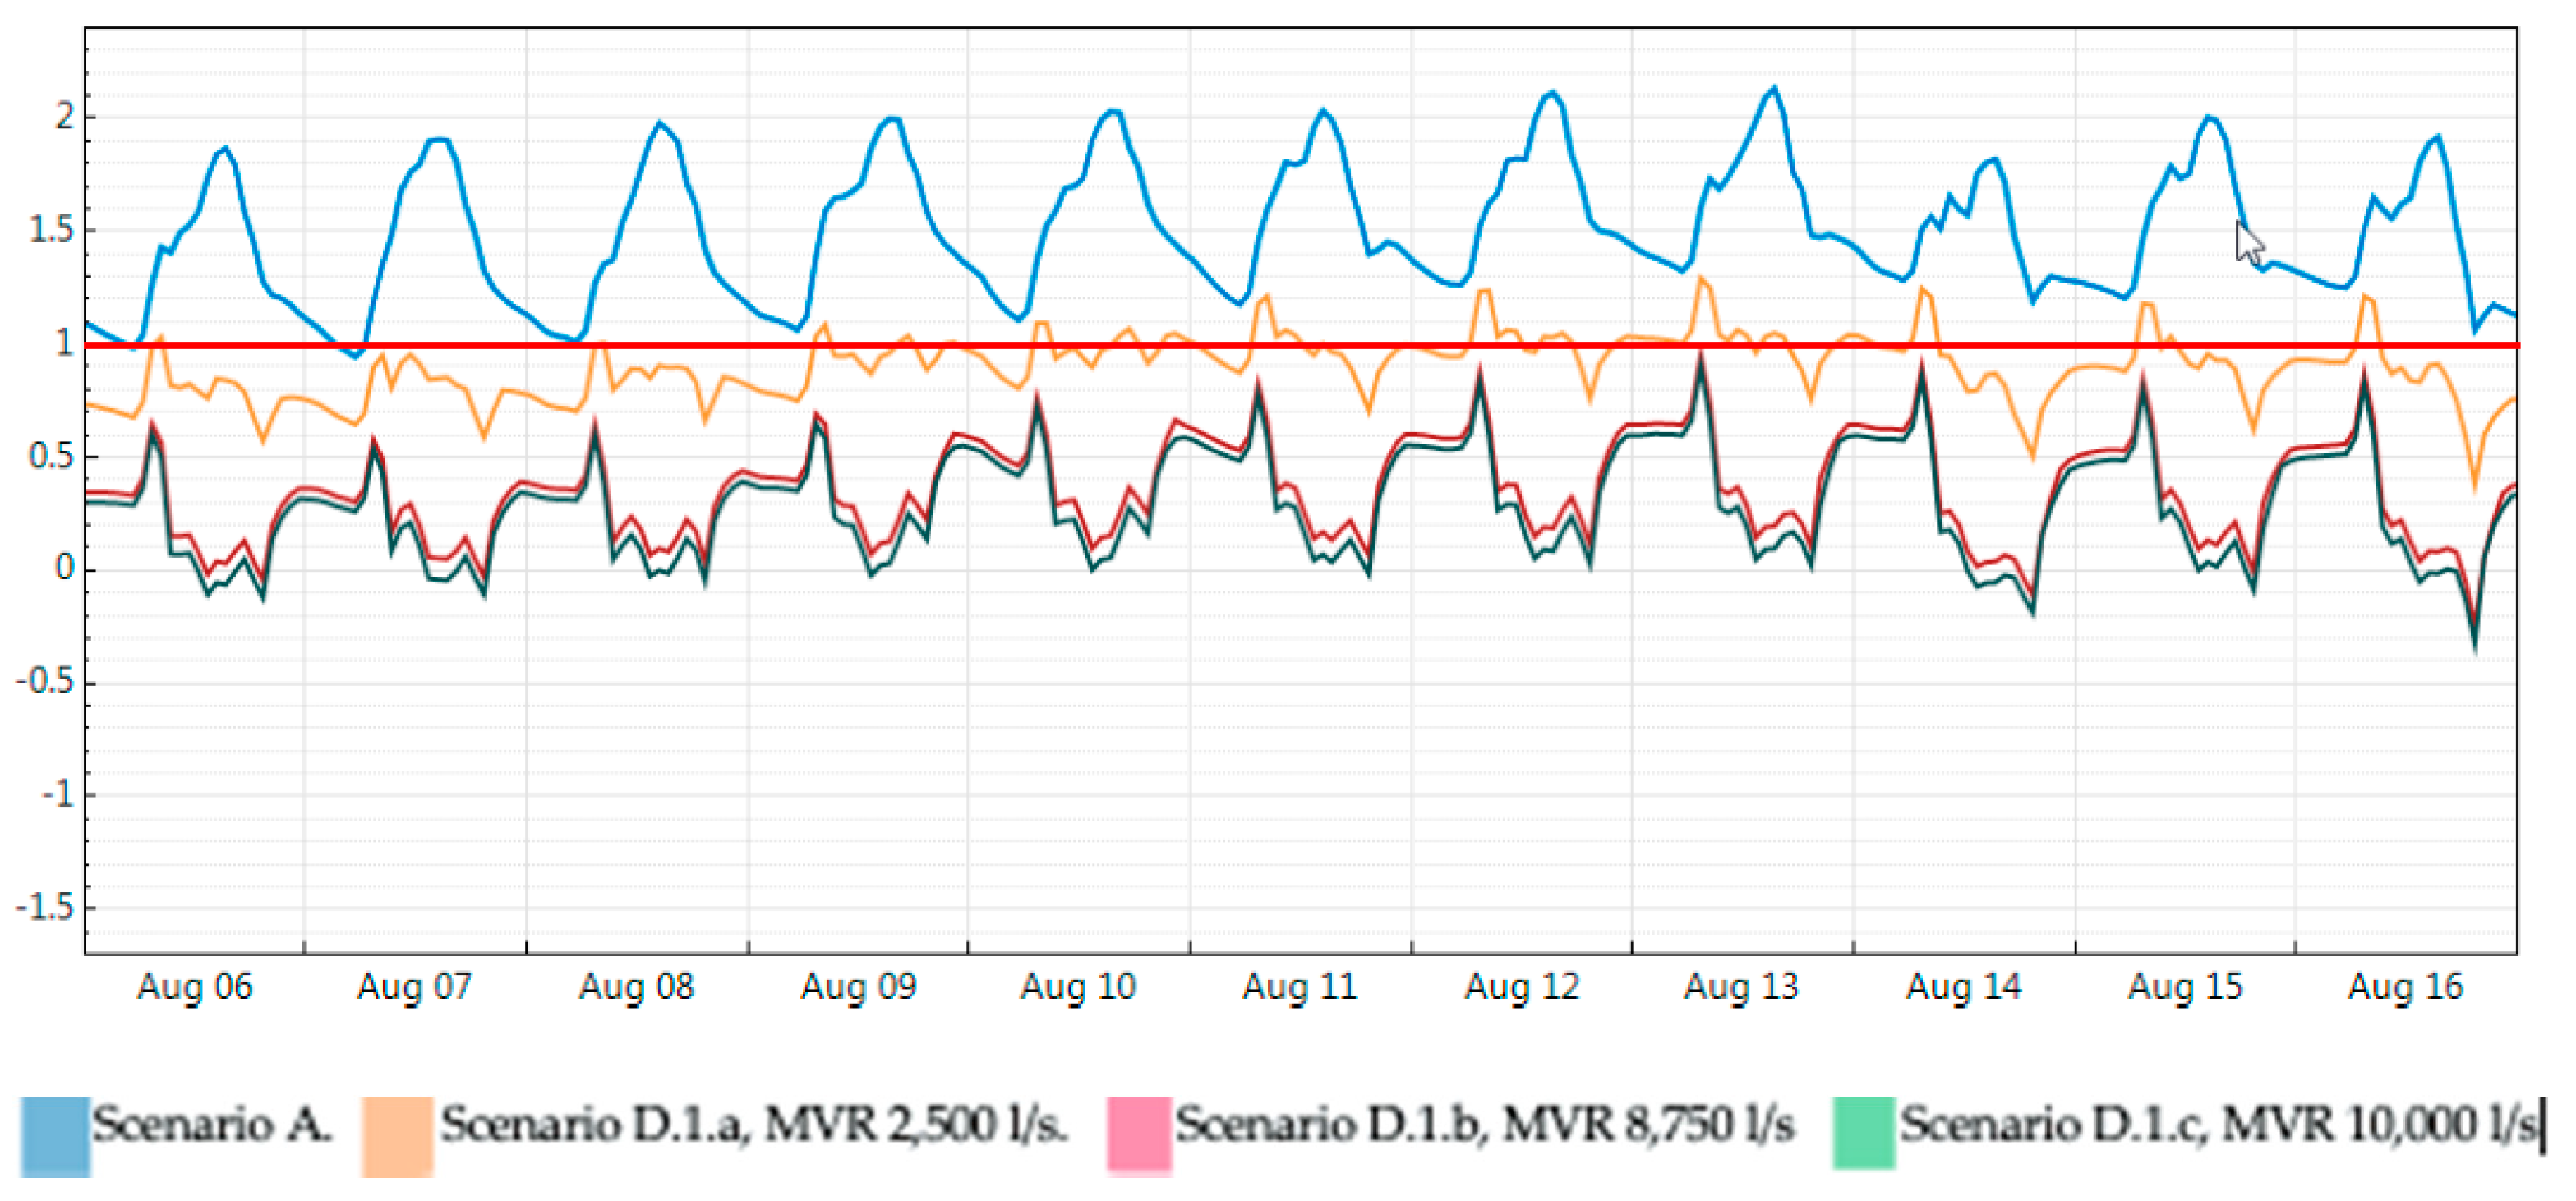
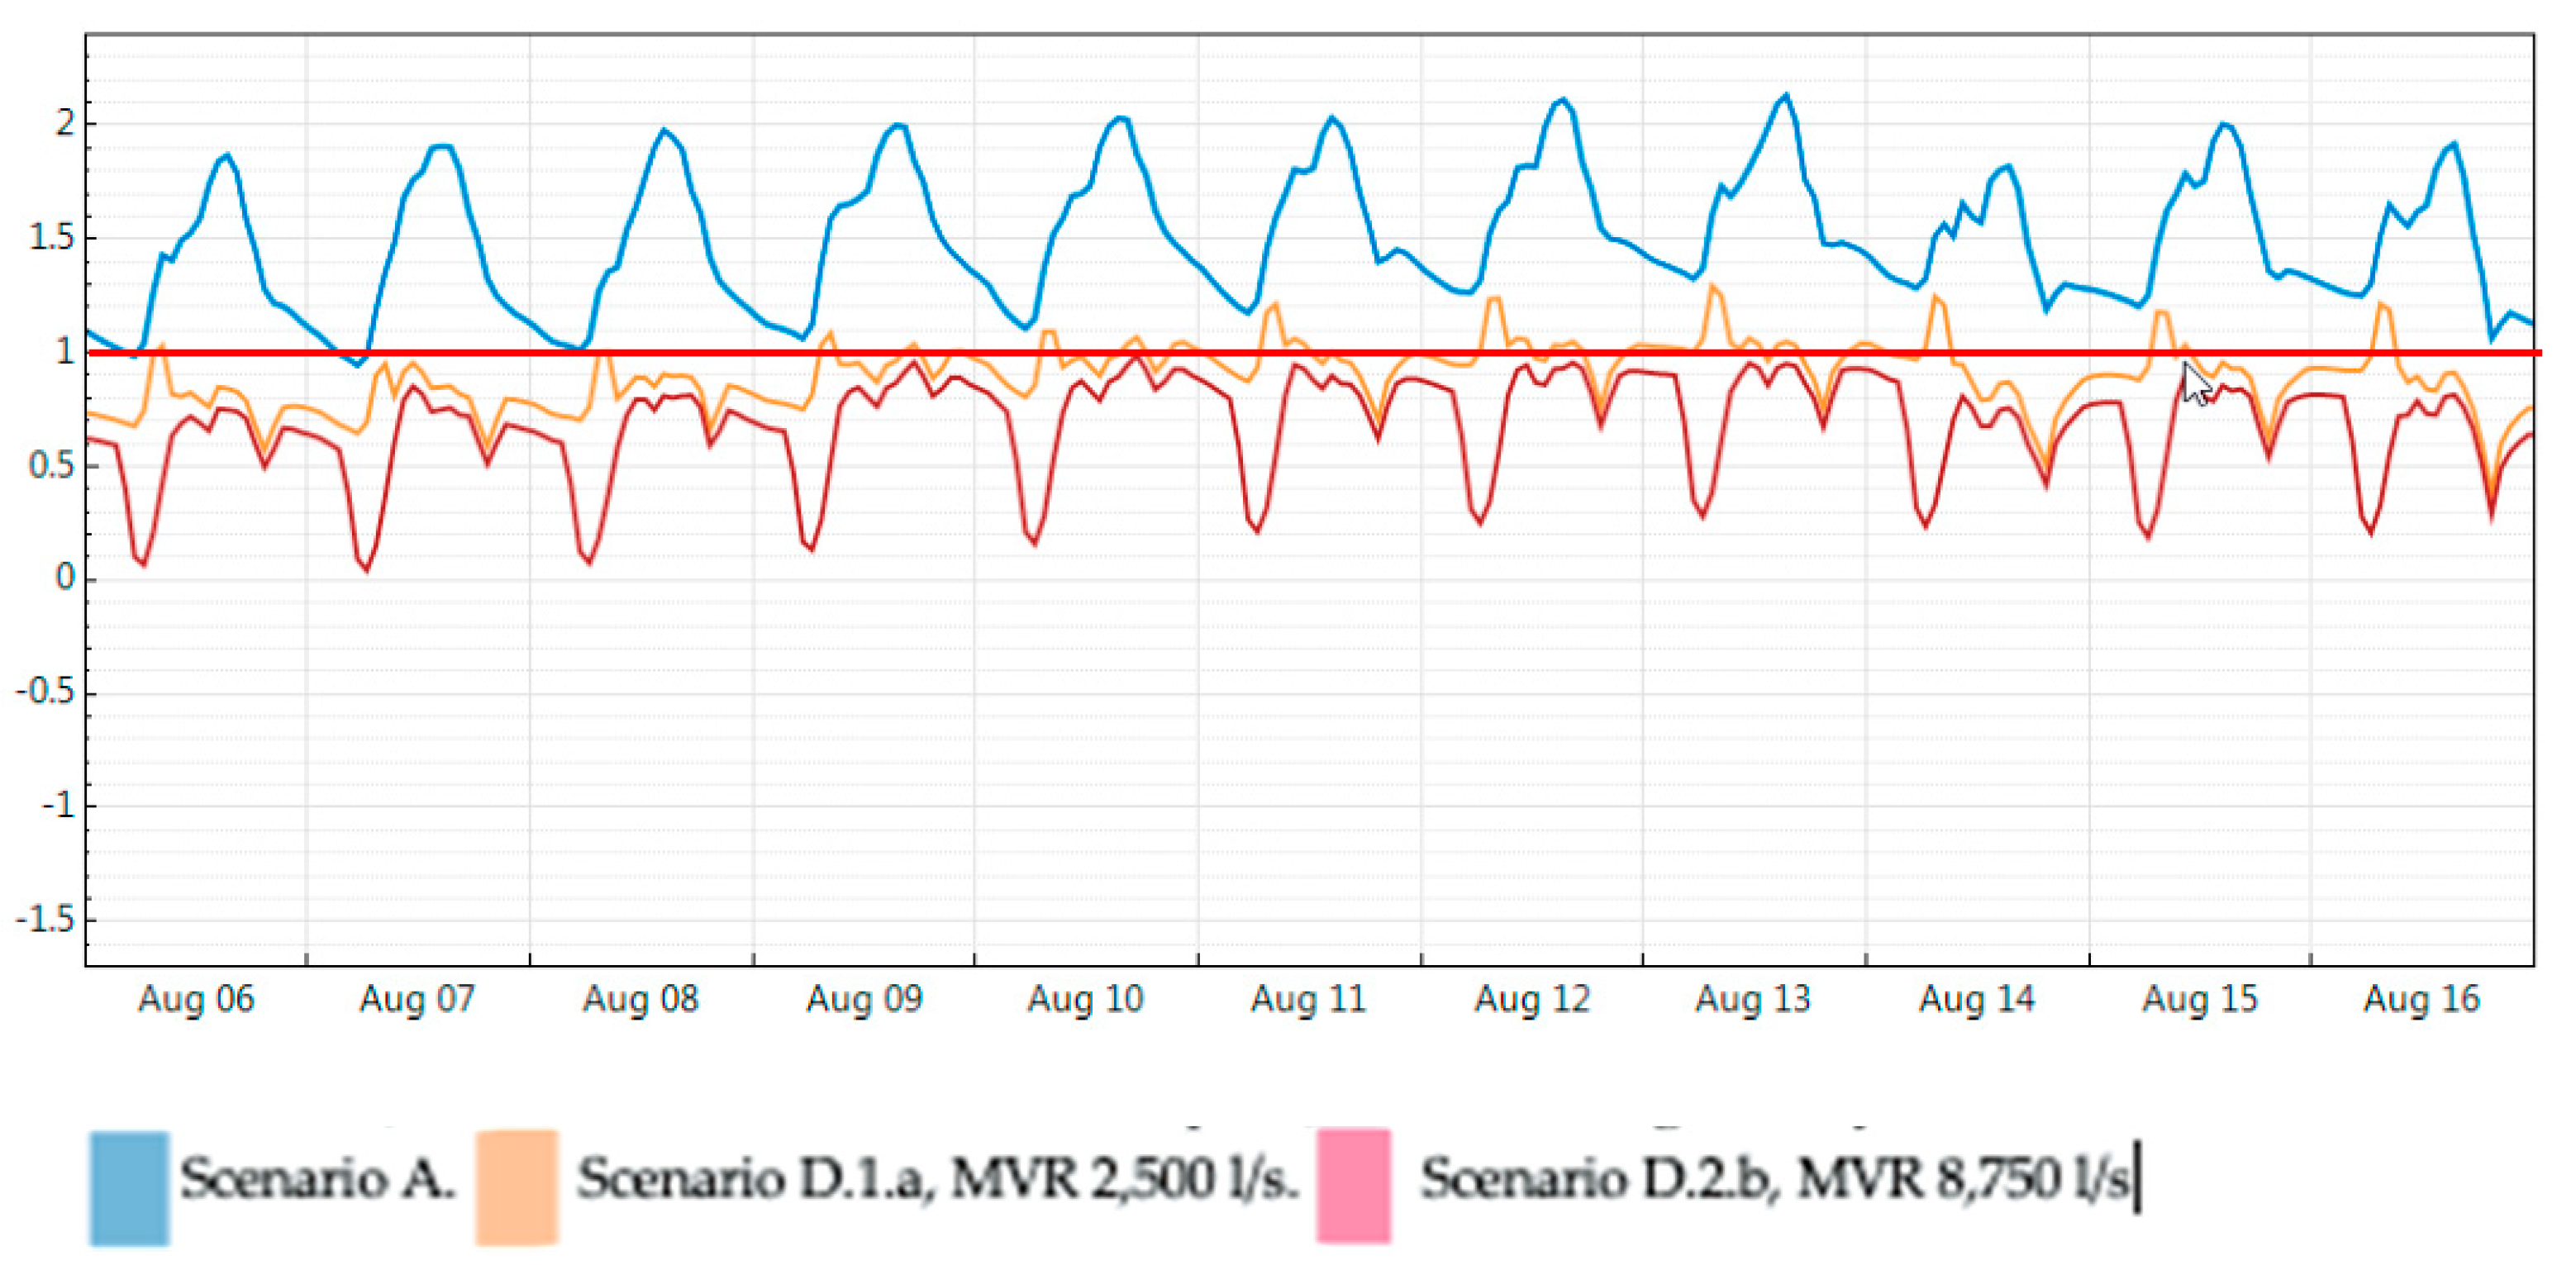
This assessment method to establish thermal comfort inside historical buildings that have a large interior air volume demonstrated that acceptable thermal comfort for users during summer months is not possible with natural ventilation alone. In these cases, no other passive strategies can be developed if they affect the building envelope, as they could alter the building’s cultural value. Consequently, the only possible solution is to develop active strategies such as mechanical ventilation with cooling. In fact, to achieve ideal thermal comfort during the summer months (PMV < +0.5) in the lower 3 m that corresponds to the air volume near users, ventilation air flows are required that are equal to or greater than 8750 l/s from 9 a.m. to 8.30 p.m. However, greater tolerance of users, which means acceptable comfort (PMV < +1) instead of ideal comfort for the same period of the year but considering operating hours between 5 a.m. and 8.30 p.m., would allow ventilation air flow to be reduced to 2500 l/s. The volume of air flow is not a minor issue, as larger air flows imply higher energy consumption, increase of noise and bigger machines that must be integrated inside the historical building, aspects that always have some kind of impact on the user.

5. Conclusions

The method used to analyze thermal comfort inside historic buildings verifies the hypotheses stated at the beginning of this paper.
Firstly, onsite monitoring showed that, for historic buildings located in Mediterranean climates, characterized by a large RH and a small thermal amplitude, the thermal discomfort level during the summer period is very high. In fact, it greatly exceeds the thermal discomfort level of winter days.
The most common passive strategies to improve the energy performance behavior of historic buildings are based on reducing the thermal transmittance of the envelope, protecting from solar gains and increasing the air tightness of the whole building. When the building to be retrofitted is protected by law because of its historic and cultural values and it has a bare “skin,” meaning masonry walls without coating, the only passive strategy to improve thermal comfort is natural ventilation.
The dynamic simulation demonstrated that natural ventilation does not work properly when the difference in hygrothermal conditions inside and outside the building is very small. Mechanical ventilation does not work either. The only solution that solves the envelope preservation and improves thermal comfort during summer months is mechanical ventilation with cooling.
The next step will necessarily be to study in-depth the impact of the facilities that provide it. For this purpose, the collaboration of architects will be required who are specialized in heritage preservation and engineers experienced in the design of air-conditioning systems for large inside air volumes that are highly efficient. To minimize the size of these machines, and therefore the consumption costs and the visual impact, the following criteria, considered and verified by previous dynamic simulation, should be considered:
-
To maintain stable conditions, it is preferable to choose the smallest machine functioning for long periods of time rather than large machines functioning for short periods.
-
The main aim is to attain thermal comfort for users, hence the systems to be used must work on the air volume around users, which means the lower 3 m of the inside air volume instead of the total height of the building. This is a feasible option when cooling, as fresh air uses to stay in the lower layer.
-
The thermal comfort degree can be less demanding (−1 < PMV <+ 1) as occupancy is short term and users are more tolerant when they note the building’s historical value. Another obvious criterion can be added that contradicts heritage authorities—when active systems are required inside public buildings, renewable energies should be used. As a consequence, a study of integration between historic building and capturing systems of renewable sources must be developed.
At this point, we should consider whether this solution could be extrapolated to other historical buildings with this typology. These are defined as buildings with large, high inside spaces and large air volumes, like churches, factories or markets, characterized by thick massive walls without insulation, high transmittance values for windows, roofs and façades and, most importantly, with no opportunity to alter the building envelope, so as to preserve its cultural value. The answer is that the thermal behavior of this kind of buildings has not been studied extensively. However, we can establish that this method to assess and simulate the most suitable solution to improve energy performance and thermal comfort is valid, since it has been successfully used to assess existing buildings, both historic and modern, with different uses, areas, volumes and even different levels of cultural protection [43,44].
In related and future research, some considerations must be taken into account.
To guarantee correspondence between real building’s thermal performance and its simulation, it would be interesting to measure the real transmittance of the envelope elements with flowmeters. Some authors emphasize the complexity of obtaining accurate data on the envelope, and the challenge of developing solutions that improve thermal comfort without altering the documentary or cultural values of the building [13,45]. Some researchers have already verified that thermal conductivity of the building envelope can be much higher than stated in theoretical values [46,47].
After the building retrofitting, surveys and monitoring should be carried out to determine the real degree of users’ thermal comfort.
Thermal comfort is not sufficient to achieve full wellbeing of people. The challenge is to improve relations between the energy performance of the building and the indoor environmental quality (IEQ) [48,49]. Occupant needs and behavior must be studied more carefully [24].
Recent health circumstances associated with the COVID-19 pandemic have highlighted that appropriate air renovation inside public buildings is key to human health. As Balocco et al. stated, the concept of sustainability should also be acknowledged as well as people’s health, safety and wellbeing [44]. Therefore, considering the uncertain future health situation, it is important to pay special attention to interior air quality, to install mechanical ventilation and add detection and control systems to diagnose the presence of microorganisms in a building’s internal atmosphere and on the internal surfaces of the building construction elements [50]. However, even more important is the need to incorporate these systems as legal requirements.

Author Contributions

Conceptualization, B.O. and A.D.; methodology, B.O. and A.D.; formal analysis, B.O. and A.D.; investigation, B.O. and A.D.; resources, B.O. and A.D.; data curation, B.O. and A.D.; writing—review and editing, B.O. and A.D. All authors have read and agreed to the published version of the manuscript.

Funding

This research received no external funding.

Institutional Review Board Statement

Not applicable.

Informed Consent Statement

Not applicable.

Data Availability Statement

Data available in a publicly accessible repository that does not issue DOIs. This data can be found here: https://futur.upc.edu/cercar/t/b25lY2hh.

Acknowledgments

The authors appreciate the contributions of J. Portal, Architect-Curator of Sta. Maria del Mar, and the collaboration of Architect M. Tarrida with the dynamic simulation.

Conflicts of Interest

The authors declare no conflict of interest.

References

  1. Luxan García de Diego, M.; Gómez Múñoz, G.; Román López, E. Cuentas energéticas no habituales en edificación residencial. Inf. Construcción 2015, 67. [Google Scholar] [CrossRef] [Green Version]
  2. Sajjadian, S.M. Risk identification in the early design stage using thermal simulations—A case study. Sustainability 2018, 10, 262. [Google Scholar] [CrossRef] [Green Version]
  3. Antonaia, A.; Ascione, F.; Castaldo, A.; D’Angelo, A.; De Masi, R.F.; Ferrara, M.; Vanoli, G.P.; Vitiello, G. Cool materials for reducing summer energy consumptions in Mediterranean climate: In-lab experiments and numerical analysis of a new coating based on acrylic paint. Appl. Therm. Eng. 2016, 102, 91–107. [Google Scholar] [CrossRef]
  4. Tribuiani, C.; Tarabelli, L.; Summa, S.; Di Perna, C. Thermal performance of a massive wall in the Mediterranean climate: Experimental and analytical research. Appl. Sci. 2020, 10, 4611. [Google Scholar] [CrossRef]
  5. Rosso, F.; Pisello, A.L.; Castaldo, V.L.; Ferrero, M.; Cotana, F. On Innovative Cool-Colored Materials for Building Envelopes: Balancing the Architectural Appearance and the Thermal-Energy Performance in Historical Districts. Sustainability 2017, 9, 2319. [Google Scholar] [CrossRef] [Green Version]
  6. Guillén-Lambea, S.; Rodríguez-Soria, B.; Marín, J.M. Review of European ventilation strategies to meet the cooling and heating demands of nearly zero energy buildings (nZEB)/Passivhaus. Comparison with the USA. Renew. Sustain. Energy Rev. 2016, 62, 561–574. [Google Scholar] [CrossRef]
  7. Muñóz González, C.M.; León Rodríguez, A.L.; Suárez Medina, R.; Ruiz Jaramillo, J. Effects of future climate change on the preservation of artworks, thermal comfort and energy consumption in historic buildings. Appl. Energy 2020, 276, 115483. [Google Scholar] [CrossRef]
  8. Martínez-Molina, A.; Tort-Ausina, I.; Cho, S.; Vivancos, J.L. Energy efficiency and thermal comfort in historic buildings: A review. Renew. Sustain. Energy Rev. 2016, 61, 70–85. [Google Scholar] [CrossRef]
  9. Martínez Molina, A.; Tort Ausina, I.; Mendoza, C.; Cerra Rubio, S.; Vivancos Bono, J.L. Thermal confort and occupants’ feedback. Literature review in Historical and non-Historical Buildings. In Proceedings of the 19th International Congress on Project Management and Engineering, Granada, Spain, 15–17 July 2015. [Google Scholar]
  10. Dias Pereira, L.; Tavares, V.; Soares, N. Up-to-date challenges for the conservation, rehabilitation and energy retrofitting of higher education cultural heritage buildings. Sustainability 2021, 13, 2061. [Google Scholar] [CrossRef]
  11. Galatioto, A.; Ricciu, R.; Salem, T.; Kinab, E. Energy and economic analysis on retrofit actions for Italian public historic buildings. Energy 2019, 176, 58–66. [Google Scholar] [CrossRef]
  12. Ruggeri, A.G.; Calzolari, M.; Scarpa, M.; Gabrielli, L.; Davoli, P. Planning energy retrofit on historic building stocks: A score-driven decision support system. Energy Build. 2020, 224, 110066. [Google Scholar] [CrossRef]
  13. Lucchi, E. Sostenibilidad y eficiencia energética de los edificios históricos. Rev. Inst. Andal. Patrim. Histórico 2015, 88, 230–242. [Google Scholar] [CrossRef]
  14. Assem, E.O. Correlating thermal transmittance limits of walls and roofs to orientation and solar absorption. Energy Build. 2011, 43, 3173–3180. [Google Scholar] [CrossRef]
  15. Aste, N.; Angelotti, A.; Buzzetti, M. The Influence of the External Walls Thermal Inertia on the Energy Performance of Well Insulated Buildings. Energy Build. 2009, 41, 1181–1187. [Google Scholar] [CrossRef]
  16. Gagliano, A.; Nocera, F.; Patania, F.; Moschella, A.; Detommaso, M.; Evola, G. Synergic effects of thermal mass and natural ventilation on the thermal behavior of traditional massive buildings. Int. J. Sustain. Energy 2014. [Google Scholar] [CrossRef]
  17. Ascione, F.; De Masi, R.F.; De Rossi, F.; Ruggiero, S.; Vanoli, G.P. NZEB target for existing buildings: Case study of historical educational building in Mediterranean climate. Energy Procedia 2017, 140, 194–206. [Google Scholar] [CrossRef]
  18. Salem, R.; Bahadori-Jahromi, A.; Mylona, A.; Godfrey, P.; Cook, D. Investigating the potential impact of energy-efficient measures for retrofitting existing UK hotels to reach the nearly zero energy building (nZEB) standard. Energy Effic. 2019. [Google Scholar] [CrossRef]
  19. Hao, L.; Herrera-Avellanosa, D.; Del Pero, C.; Troi, A. What are the implications of climate change for retrofitted historic buildings? A literature review. Sustainability 2020, 12, 7557. [Google Scholar] [CrossRef]
  20. Pérez-Fargallo, A.; Rubio-Bellido, C.; Pulido-Arcas, J.A.; Gallego-Maya, I.; Guevara-García, F.J. Influence of adaptative comfort models on energy improvement for housing in cold areas. Sustainability 2018, 10, 859. [Google Scholar] [CrossRef] [Green Version]
  21. Gamero-Salinas, J.C.; Monge-Barrio, A.; Sanchez-Ostiz, A. Overheating risk assessment of different dwellings during the hottest season of a warm tropical climate. Build. Environ. 2020, 171, 106664. [Google Scholar] [CrossRef]
  22. Shaviv, E.; Yezioro, A.; Capeluto, I.G. Thermal mass and night ventilation as passive cooling design strategy. Renew. Energy 2001, 24, 445–452. [Google Scholar] [CrossRef]
  23. Gagliano, A.; Patania, F.; Nocera, F.; Signorello, C. Assessment of the dynamic thermal performance of massive buildings. Energy Build. 2013, 72, 361–370. [Google Scholar] [CrossRef]
  24. Ortiz, M.; Itard, L.; Bluyssen, P.M. Indoor environmental quality related risk factors with energy-efficient retrofitting of housing: A literature review. Energy Build. 2020, 221. [Google Scholar] [CrossRef]
  25. Sandberg, M.; Lundström, H.; Nilsson, O.; Stymne, H. Experimental methods in ventilation. Adv. Build. Energy Res. 2008, 2, 159–210. [Google Scholar] [CrossRef]
  26. Balocco, C.; Colaianni, A. Assessment of Energy Sustainable Operations on a Historical Building. The Dante Alighieri High School in Florence. Sustainability 2018, 10, 2054. [Google Scholar] [CrossRef] [Green Version]
  27. Balocco, C.; Colaianni, A. Modelling of Reversible Plant System Operations in a Cultural Heritage School Building for Indoor Thermal Comfort. Sustainability 2018, 10, 3776. [Google Scholar] [CrossRef] [Green Version]
  28. Muñoz-González, C.M.; León-Rodríguez, A.L.; Navarro-Casas, J. Air conditioning and passive environmental techniques in historic churches in Mediterranean climate. A proposed method to assess damage risk and thermal comfort pre-intervention, simulation-based. Energy Build. 2016, 130, 567–577. [Google Scholar] [CrossRef]
  29. Múñoz-González, C.M.; León-Rodríguez, A.L.; Suárez Medina, R.C.; Teeling, C. Hygrothermal performance of worship spaces: Preservation, comfort and energy consumption. Sustainability 2018, 10, 3838. [Google Scholar] [CrossRef] [Green Version]
  30. Webb, A.L. Energy retrofits in historic and traditional buildings: A review of problems and methods. Renew. Sustain. Energy Rev. 2017, 77, 748–759. [Google Scholar] [CrossRef]
  31. Amirkhani, S.; Bahadori-Jahromi, A.; Mylona, A.; Godfrey, P.; Cook, D. Impact of Low-E Window Films on Energy Consumption and CO2 Emissions of an Existing UK Hotel Building. Sustainability 2019, 11, 4265. [Google Scholar] [CrossRef] [Green Version]
  32. Bahadori-Jahromi, A.; Rotimi, A.; Mylona, A.; Godfrey, P.; Cook, D. Impact of Window Films on the Overall Energy Consumption of Existing UK Hotel Buildings. Sustainability 2017, 9, 731. [Google Scholar] [CrossRef] [Green Version]
  33. Amirkhani, S.; Bahadori-Jahromi, A.; Mylona, A.; Godfrey, P.; Cook, D. Impact of Adding Comfort Cooling Systems on the Energy Consumption and EPC Rating of an Existing UK Hotel. Sustainability 2020, 12, 2950. [Google Scholar] [CrossRef] [Green Version]
  34. Rotimi, A.; Bahadori-Jahromi, A.; Mylona, A.; Godfrey, P.; Cook, D. Optimum Size Selection of CHP Retrofitting in Existing UK Hotel Building. Sustainability 2018, 10, 2044. [Google Scholar] [CrossRef] [Green Version]
  35. Salem, R.; Bahadori-Jahromi, A.; Mylona, A.; Godfrey, P.; Cook, D. Comparison and Evaluation of the Potential Energy, Carbon Emissions, and Financial Impacts from the Incorporation of CHP and CCHP Systems in Existing UK Hotel Buildings. Energies 2018, 11, 1219. [Google Scholar] [CrossRef] [Green Version]
  36. Alwetaishi, M.; Balabel, A.; Abdelhafiz, A.; Issa, U.; Sharaky, I.; Shamseldin, A.; Al-Surf, M.; Al-Harthi, M.; Gadi, M. User thermal comfort in historic buildings: Evaluation of the potential of thermal mass, orientation, evaporative cooling and ventilation. Sustainability 2020, 12, 9672. [Google Scholar] [CrossRef]
  37. Panraluk, C.; Sreshthaputra, A. Developing guidelines for thermal comfort and energy savings during hot season of multipurpose senior centers in Thailand. Sustainability 2020, 12, 170. [Google Scholar] [CrossRef] [Green Version]
  38. Schellen, L.; Loomans, M.G.L.C.; Kingma, B.R.M.; de Wit, M.H.; Frijns, A.J.H. The use of a thermophysiological model in the built environment to predict thermal sensation. Coupling with the indoor environment and thermal sensation. Build. Environ. 2013, 59, 10–22. [Google Scholar] [CrossRef]
  39. Cornaro, C.; Puggioni, V.A.; Stollo, R.M. Dynamic simulation and on-site measurements for energy retrofit of complex historic buildings: Villa Mondragone case study. J. Build. Eng. 2016, 6. [Google Scholar] [CrossRef]
  40. D’Agostino, D.; Congedo, P.M. CFD modeling and moisture dynamics implications of ventilation scenarios in historical buildings. Build. Environ. 2014, 79, 181–193. [Google Scholar] [CrossRef]
  41. Litti, G.; Audenaert, A.; Braet, J.; Fabbri, K.; Weeren, A. Synthetic Scan and Simultaneous Index aimed at the Indoor Environmental Quality evaluation and certification for people and artworks in heritage buildings. Energy Procedia 2015, 78, 1365–1370. [Google Scholar] [CrossRef] [Green Version]
  42. Di Perna, C.; Stazi, F.; Ursini Casalena, A.; Orazio, M.D. Influence of the internal inertia of the building envelope on summertime comfort in buildings with high internal heat loads. Energy Build. 2010, 43, 200–206. [Google Scholar] [CrossRef]
  43. Rotimi, A.; Bahadori-Jahromi, A.; Mylona, A.; Godfrey, P.; Cook, D. Estimation and Validation of Energy Consumption in UK Existing Hotel Building Using Dynamic Simulation SOftware. Sustainability 2017, 9, 1391. [Google Scholar] [CrossRef] [Green Version]
  44. Balocco, C.; Leoncini, L. Energy Cost for Effective Ventilation and Air Quality for Healthy Buildings: Plant Proposals for a Historic Building School Reopening in the Covid-19 Era. Sustainability 2020, 12, 8737. [Google Scholar] [CrossRef]
  45. Nilsson, H. Thermal comfort evaluation with virtual manikin methods. Build. Environ. 2007, 42, 4000–4005. [Google Scholar] [CrossRef]
  46. Evola, G.; Marletta, L.; Natarajan, S.; Patanè, E.M. Thermal inertia of heavyweight traditional buildings: Experimental measurements and simulated scenarios. Energy Procedia 2017, 133, 42–52. [Google Scholar] [CrossRef]
  47. Dotor, A.; González, J.L.; Olona, J.; Onecha, B. Eficiència energética i valors patrimonials: Conflictes i solucions. Inf. Coll. Aparell. Arquit. Tècnics Barc. 2013, 336, 84–87. [Google Scholar]
  48. Fabbri, K.; Tronchin, L. Indoor environmental quality in low energy buildings. Energy Procedia 2015, 78, 2778–2783. [Google Scholar] [CrossRef] [Green Version]
  49. Martínez-Molina, A.; Alamaniotis, M. Enhancing historic building performance with the use of fuzzy inference system to control the electric cooling system. Sustainability 2020, 12, 5848. [Google Scholar] [CrossRef]
  50. Svajlenka, J.; Kozlovská, M.; Posiváková, T. Assessment and biomonitoring indoor environment of buildings. Int. J. Environ. Health Res. 2017, 27, 427–439. [Google Scholar] [CrossRef]
Figure 1. Interior view of Santa María del Mar Basilica. Source: veclus.cat.
Sustainability 13 02980 g001
Figure 2. Aerial view of the basilica in the historical Ribera neighborhood.
Sustainability 13 02980 g002
Figure 3. Building plans: longitudinal section and cross-section.
Sustainability 13 02980 g003
Figure 4. Position of monitoring points on the basilica plan.
Sustainability 13 02980 g004
Figure 5. Heat Index chart and corresponding health impacts. Source: National Weather Service (www.weather.gov, accessed on 31 December 2020).
Sustainability 13 02980 g005
Figure 6. Overall view of the building with elements of the environment and shadows and a view of thermal surfaces of the envelope colored by typology.
Sustainability 13 02980 g006
Figure 7. PMV value throughout the year with no ventilation.
Sustainability 13 02980 g007
Figure 8. Comparison between scenarios A (blue) and B (orange) for the entire year and detailed for 3 days in July.
Sustainability 13 02980 g008
Figure 9. Air flow rates by occupancy.
Sustainability 13 02980 g009
Figure 10. Comparison between scenarios A, C.1.a (2500 l/s), C.1.b (8750 l/s) and C.1.c (10,000 l/s) for the month of September and machines operating between 9 a.m. and 8.30 p.m.
Sustainability 13 02980 g010
Figure 11. Comparison between scenarios A (current state) and D.1.a, D.1.b, D.1.c (MVR = Mechanical Ventilation with cooling) for the days of mid-August.
Sustainability 13 02980 g011
Figure 12. Comparison between scenario A (current state), D.1.a (MVR, 2500 l/s, 9 a.m. to 8.30 p.m.) and D.2.a (MVR, 2500 l/s, 5 a.m. to 8.30 p.m.) for mid-August days.
Sustainability 13 02980 g012
Table 1. Opening hours and occupancy data.
Opening hoursMonday to Friday9 a.m. to 8.30 p.m.
Saturday and Sunday10 a.m. to 8.30 p.m.
Occupancy dataExceptional (concerts or celebrations)2000 people
Daily mass (7.30 p.m.)<200 people
Saturday mass (7.30 p.m.)200 people
Sunday mass (12 p.m. and 7.30 p.m.)700 people
Cultural visitVariable, larger number in the summer
Table 2. Onsite Temperature and relative humidity (RH) monitoring, corresponding PMV (Predicted Mean Vote) and PPD (Predicted Percent of Dissatisfied people).
Monitoring 1Monitoring 2Monitoring 3
Date27 July 202012 August 202012 August 2020
Time5.30 p.m.9.30 a.m.5.30 p.m.
Occupancy6–8 people6–8 people15–20 people
Passive systems4 doors opened4 doors opened4 doors opened
Active systems--4 small fans
Temperature 29–31 °C28–29 °C30–31 °C
HR56–64%65–70%57–60%
SultrinessMediumHighMedium
PMV/PPD1.60/54%1.50/51%1.60/55%
Table 3. T and RH for 7 July in the last five years. Average compared to the rest of days.
DateTm (°C)Tmax (°C)Tmin (°C)HRm (%)Taverage Month (°C)Tmax Absolute Month (°C)Tmin Absolute Month (°C)Thermal Amplitude Average MonthHRm Month (%)
27 July 202027.931.924.564262923.6364.61
27 July 201924.126.518.37726.433.518.36.166
27 July 201827.831.624.75926.533.520.26.164
27 July 20172629.822.36725.428.522.95.567
27 July 201626.429.124.36625.732.219.65.862
Table 4. T and RH on 12 August in the last five years. Average for the rest of the days.
DateTm (°C)Tmax (°C)Tmin (°C)HRm (%)Taverage Month (°C)Tmax Absolute Month (°C)Tmin Absolute Month (°C)Thermal Amplitude Average MonthHRm Month (%)
12 August 202028.231.726.66626.632.8185.765.3
12 August 201925.328.220.26326.532.519.45.863
12 August 201827.630.925.16727.136.918.3662
12 August 201723.826.4216026.129.423.55.965
12 August 201624.828.1226025.733.5215.663
Table 5. Parameters of the envelope elements.
Envelope ElementsTheoretical Thermal Transmittance, U (W/m2 °C)Enclosure Thickness (cm)Solar Heat Gain Coefficient
Stone wall1.2080
Roof with air chamber1.17130
Solid roof1.6260
Pavement0.2533.5
Door2.673.5
Massive element3.0290
Window (low ratio opaque/transparent)6.78 0.32
Window (high ratio opaque/transparent)5.78 0.22
Table 6. Area, volume, occupancy and clothing.
Public area ground floor, m22565
Total air volume, m361,853
Visitors’ air volume, m37694
Lower area air volume, m338,022
Intermediate area air volume, m319,475
Higher area air volume, m34356
Lightning internal loads ground floor, W/m21
Simulation occupancy384
Clothing insulation (clo)Range of values interpolated month after month, from 0.5 for the summer to 1.5 for the winter
Table 7. Summary table of hours and percentage improvement for different D scenarios of MV+R.
MV+R MV+R MV+R MV+R MV+R MV+R
D.1.aD.2.aD.1.bD.2.bD.1.cD.2.c
2500 l/s 2500 l/s 8750 l/s 8750 l/s 10,000 l/s 10,000 l/s
9 a.m. to 8.30 p.m.5 a.m. to 8.30 p.m.9 a.m. to 8.30 p.m.5 a.m. to 8.30 p.m.9 a.m. to 8.30 p.m.5 a.m. to 8.30 p.m.
PMV ≤ 0.5
Occupancy hours of ideal comfort3415 h3606 h4290 h4290 h4290 h 4290 h
0.5 < PMV < 1
Occupancy hours of acceptable comfort920 h769 h90 h90 h90 h90 h
PMV > 1
Occupancy hours over acceptable comfort45 h5 h0 h0 h0 h0 h
PMV ≤ 0.5
% occupancy hours ideal comfort78%82%98%98%98%98%
0.5 < PMV < 1
% occupancy hours acceptable comfort21%18%2%2%2%2%
PMV > 1
% occupancy hours over acceptable comfort1%0%0%0%0%0%
% Improvement with regard to current state95.1%99.5%100%100%100%100%
Publisher’s Note: MDPI stays neutral with regard to jurisdictional claims in published maps and institutional affiliations.

