Article

Cooling Degree Models and Future Energy Demand in the Residential Sector. A Seven-Country Case Study

by
Raúl Castaño-Rosa
1,2,*,
Roberto Barrella
3,
Carmen Sánchez-Guevara
4,
Ricardo Barbosa
5,
Ioanna Kyprianou
6,
Eleftheria Paschalidou
7,
Nikolaos S. Thomaidis
7,
Dusana Dokupilova
8,
João Pedro Gouveia
9,
József Kádár
10,11,
Tareq Abu Hamed
11 and
Pedro Palma
9
1
Department of Electrical Engineering, University Carlos III of Madrid, Avenue of the University 30, 28911 Leganés, Spain
2
Faculty of the Built Environment, Tampere University, Korkeakoulunkatu 1, 33720 Tampere, Finland
3
Chair of Energy and Poverty—ICAI School of Engineering, Comillas Pontifical University, C. Alberto Aguilera, 25, 28015 Madrid, Spain
4
School of Architecture (ETSAM), Universidad Politécnica de Madrid (UPM), Spain, Avda. Juan de Herrera 4, 28040 Madrid, Spain
5
ISISE, Department of Civil Engineering, University of Minho, 4800-058 Guimarães, Portugal
6
Energy, Environment, Water Research Centre (EEWRC), The Cyprus Institute, 20 Konstantinou Kavafi Street, Nicosia 2121, Cyprus
7
Applied Economics Laboratory (AELab), School of Economics, Aristotle University of Thessaloniki, 541 24 Thessaloniki, Greece
8
Institute for Forecasting, Centre of Social and Psychological Studies, Slovak Academy of Sciences, 811 05 Bratislava, Slovakia
9
CENSE—Center for Environmental and Sustainability Research, NOVA School of Science and Technology, NOVA University Lisbon, 2829-516 Caparica, Portugal
10
Haifa Center for German and European Studies, University of Haifa, Abba Khoushy Ave 199, Haifa 3498838, Israel
11
Arava Institute for Environmental Studies, and The Dead Sea and Arava Science Center, Kibbutz Ketura, D.N. Hevel Eilot 88840, Israel
*
Author to whom correspondence should be addressed.
Sustainability 2021, 13(5), 2987; https://0-doi-org.brum.beds.ac.uk/10.3390/su13052987
Submission received: 6 January 2021 / Revised: 3 March 2021 / Accepted: 3 March 2021 / Published: 9 March 2021

Abstract

:
The intensity and duration of hot weather and the number of extreme weather events, such as heatwaves, are increasing, leading to a growing need for space cooling energy demand. Together with the building stock’s low energy performance, this phenomenon may also increase households’ energy consumption. On the other hand, the low level of ownership of cooling equipment can cause low energy consumption, leading to a lack of indoor thermal comfort and several health-related problems, yet increasing the risk of energy poverty in summer. Understanding future temperature variations and the associated impacts on building cooling demand will allow mitigating future issues related to a warmer climate. In this respect, this paper analyses the effects of change in temperatures in the residential sector cooling demand in 2050 for a case study of nineteen cities across seven countries: Cyprus, Finland, Greece, Israel, Portugal, Slovakia, and Spain, by estimating cooling degree days and hours (CDD and CDH). CDD and CDH are calculated using both fixed and adaptive thermal comfort temperature thresholds for 2020 and 2050, understanding their strengths and weaknesses to assess the effects of warmer temperatures. Results suggest a noticeable average increase in CDD and CDH values, up to double, by using both thresholds for 2050, with a particular interest in northern countries where structural modifications in the building stock and occupants’ behavior should be anticipated. Furthermore, the use of the adaptive thermal comfort threshold shows that the projected temperature increases for 2050 might affect people’s capability to adapt their comfort band (i.e., indoor habitability) as temperatures would be higher than the maximum admissible values for people’s comfort and health.

1. Introduction

According to the NOAA’s National Centers for Environmental Information, July 2020 was the hottest month ever in the Northern Hemisphere, exceeding July 2019, where the previous highest record was set [1]. Similarly, with an increase of 1.9 °C (global mean, 1.03 °C), the last decade (2010–2019) has been the warmest decade on record in Europe, highlighting that annual mean temperature increase in Europe has been higher than the global average [2]. Furthermore, a 2 °C increase in global average temperature is expected if global emissions are not reduced by 2030 [3], leading to increased intensity and duration of hot weather and a higher frequency of extreme weather events (heatwaves and cold spells). Extreme weather events can generate many health and wellbeing implications, such as health-related stress, mental health issues, and asthma [4].
Energy poverty, understood as a situation in which households cannot afford the appropriate amount of energy to satisfy their domestic needs [5], has traditionally been associated with countries with cold and long winter seasons and households with low income living in poor energy-efficiency dwellings. However, a limited number of studies show the impacts of a warmer climate in the residential sector and the consequences for European citizens’ well-being concerning energy poverty in summer [6]. Summer energy poverty refers to the impossibility to keep homes adequately cool in summer, with a focus on Central and Southern Europe and the Mediterranean regions [7,8,9,10]. Some studies show how projected climate warming events and heatwaves are expected to increase both in frequency and intensity, leading to severe health impacts on urban dwellers [11] and affecting disproportionately vulnerable population groups (i.e., elderly, low-income households) due to their inability to keep the adequate cooling level in their homes [12]. According to Jessel et al. [10], symptoms of arthritis, pulmonary, cardiovascular, and respiratory illnesses deteriorate in houses that are not adequately cool. Similarly, Taylor et al. [13] show that increased mortality rates in the UK are directly related to severe weather conditions and, consequently, to extremely high temperatures inside the house. In this respect, a warmer world will imply that more people will need access to cooling systems worldwide to live in a healthy indoor environment [14]. Therefore, the built environment, where people live, work and spend most of their time, plays a crucial role in climate change mitigation.
Climate change will impact residential energy demand due to extreme weather and the increase in average temperature and cooling needs. However, it is difficult to assess the impacts of climate change on residential electricity consumption, as it strongly depends on a wide range of factors, for instance, socio-economic and environmental [15]. Damm et al. [16] estimated the impacts of climate change in mean annual electricity demand in the +2 °C periods for the Representative Concentration Pathways (RCP) RCP2.6, RCP4.5, and RCP8.5 in 26 European countries. Overall, the peak of electricity consumption decreases in most countries, whereas an increase in monthly cooling electricity demand for each country is expected (highlighting Finland, Sweden, and Italy). These results must be taken carefully into consideration due to the sociodemographic and environmental factors being different depending on each context [16]. In Portugal, Gouveia et al. [17] projected a potential variation of space cooling energy services demand for 2050 ranging from −10% to +83% of current levels depending on indoor thermal comfort conditions, also corroborated by the findings of Figueiredo et al. [15], who projected that space cooling consumption might increase as much as 20-fold. These findings suggest that total residential electricity demand could potentially increase from 5% to 60%. Similarly, Jankovic et al. [18] investigated the potential demand changes using cooling degree days (CDD) in Serbia at the end of the 21st century under the climatic scenario A1B (medium emissions) and A2 (high emissions). Although some limitations have been associated with the use of CDD to evaluate cooling demand in the building sector, it is widely used at both global and national levels [19,20]. Results show an increase of CDD is expected all over Serbia up to 44.35% for 2100 under scenario A2. Additionally, Jakubcionis and Carlsson [21] used CDD to assess the potential of residential cooling demand in Europe, expecting Portugal’s total cooling residential demand to increase in a range of 13- to 36-fold by 2050.
In the European Union (EU), the residential sector is responsible for more than one-quarter of the total primary cooling energy demand [22]. It is expected to increase up to 74.5% by 2050 [23], mainly due to the low energy-efficiency characteristics of the existing building stock, which was built before the first energy-efficiency regulation, also lacking evaluation in the form of the Energy Performance Certificate (EPC) [24]. Therefore, a significant increase in the electric energy consumption for residential cooling may be expected, from about 35 TWh in 2015 to 137 TWh in 2050 [23]. Similarly, by using EU-28 aggregated residential data, Andreou et al. [25] analyzed the potential cooling energy and total electricity consumption. Results showed growth from 16 TWh/y in 2015 to 38–104 TWh/y in 2050 in space cooling energy demand, increasing the share of cooling consumption in final electricity use from 2% in 2015 to 4–12% in 2050. However, discrepancies between cooling appliances related to energy consumption projections from the IEA [26] and JRC [27] have arisen, as cooling appliances usage increase in the future is not projected. In this respect, it is important to understand how different models (CDD or CDH, fixed or adaptive thermal comfort temperature thresholds) affect the projected scenarios on temperature change and, consequently, residential cooling demand to ultimately recommend suitable actions towards mitigation adaptation of the built environment. Furthermore, this type of analysis sheds light on the nexus between building standards and cooling demand increase, addressing the need to improve the energy efficiency of existing building stock as an instrument to address climate warming, greenhouse gas emissions, and cooling demand increase [28,29].
Different climate variables, such as merely using the current climate’s characteristics [30] or choosing a warm past year to represent climate warming [31], have been used to determine future electricity demand in the residential sector. However, parametric (based on the relationship between demand and temperature) [32], energy balance (based on heat gains and losses of buildings using building simulation tools) [33], and degree day (based on relating temperature with the heating/cooling requirements) [34] models are the most common methods used to determine the future residential energy demand. These studies predominantly assume a fixed threshold to calculate CDD and, subsequently, cooling demand, neglecting the impacts of using adaptive thermal comfort temperature thresholds on the cooling demand reduction [35,36]. In this way, it is possible to fail to understand the effect of adaptive actions taken by building users to adapt to increasing air temperatures while maintaining indoor thermal comfort levels. In this respect, G. Ciulla et al. [37] investigated the use of Artificial Neural Networks to predict the thermal energy demand associated with winter air conditioning of non-residential buildings, providing a novel method to quickly estimate the thermal load needed.
Thermal comfort is a complex subject. The adaptive perspective; unlike the analytical model developed by Fanger [38], which is the basis for the majority of fixed thresholds considered in regulations; takes into consideration that people have a response to change and are willing to act in order to restore thermal comfort conditions, extending their comfort zone [39]. Thus, more researchers are using cooling degree hours (CDH) to estimate residential energy consumption. Unlike CDD, CDH (the sum of the differences between hourly average temperatures and the base temperature; hourly data) fit with occupants’ thermal requirements and take into considerations the effects of latent loads, i.e., the necessary amount of energy to dehumidify the air, without change of indoor temperature [40]. The latent load is a significant aspect when indoor humidity is controlled, specifically in humid climates and hot conditions [41].
Furthermore, the CDH index enables relatively effortless estimation of part-time operation for each month (season), average cooling load profiles for day and night-time independently, when cooling is needed; and simpler and more effective than other prediction models [42]. Kyritsi and Michael [43] used CDH to assess the effectiveness of different ventilation strategies and opening patterns for each part of the day. Results showed that night-time ventilation is the most effective cooling strategy in contrast to day-time ventilation when indoor temperatures are over the acceptability limits. Furthermore, Papakostas and Kyriakis [44] calculated the differences in CDH values between Thessaloniki and Athens (Greece), showing that the higher the base temperature, the higher the differences in CDH values between both cities (i.e., about 41% at 27.5 °C, in contrast to 31% at 25 °C), and highlighting the role of location (climatic characteristics) in CDH values.
In the end, it is shown that the model, temperature base, and climatic database influence the accuracy of predicted residential energy requirements [45], by that means the potential to reduce building energy needs [46]. However, no studies assess the feasibility of using CDD or CDH indexes and fixed or adaptive thermal comfort models to understand future building cooling demand changes. More often, studies are designed based on data availability or the researchers’ interests—rather than selecting the most appropriate method relative to the intended purpose. Furthermore, the effects of a warmer climate in Nordic residential cooling demand, compared with other EU countries, using CDD and CDH indexes have not been investigated yet, leading future building cooling demand to be neglected. Note that the authors of this study acknowledge that the cooling demand in buildings depends on a wide range of factors, e.g., humidity, window size, irradiation, occupants’ behavior [46], but this analysis falls outside the scope of this work.
In this respect, this paper aims to investigate the effects of a warmer climate in the residential sector cooling demand for 2050 on a case study of nineteen cities across seven countries: Cyprus, Finland, Greece, Israel, Portugal, Slovakia, and Spain, and how it may differ depending on the model used for the analysis. Furthermore, the feasibility of using the CDD and CDH indexes, and fixed and adaptive thermal comfort temperature thresholds, to assess the effects of temperature changes in the building cooling demand is analyzed in the seven countries. To do this, CDD and CDH indexes are calculated for 2020 and 2050, using nineteen European cities across seven countries, accounting for ten different climate zones of the Köppen-Geiger climate classification [47]. The novelty of this work consists not only in the use of two different thermal comfort temperature thresholds (a fixed threshold based on the Eurostat standard [48], and an adaptive one by using the adaptive thermal comfort ASHRAE standard 55-2017 [49]) but also the calculation of two different indexes (CDD and CDH), making it possible to understand the strengths and weaknesses of each method to estimate the potential residential cooling demand changes for 2050. Furthermore, unlike existing studies that focus on southern countries, this paper investigates for the first time which of the proposed methodologies better assess residential cooling demand tendency by comparing northern, southern, and south-eastern countries.
This paper is organized as follows: Section 1 introduces the paper and research question; the methodology used along with the case studies characterization is presented in Section 2; results are presented and explained in Section 3, followed by a discussion in Section 4; conclusions are provided in Section 5.

2. Materials and Methods

This work calculates CDD and CDH values by using a fixed and adaptive thermal comfort temperature threshold (Note that the adaptive thermal comfort temperature threshold approach uses a base temperature that adapts to the occupants’ thermal comfort needs.), providing insights on the strengths and weaknesses of each standard to estimate the potential residential energy demand for 2050.
Firstly, a case study characterization to provide an overview of main climatic and residential building stock characteristics in the seven countries selected is shown in Section 2.1. Secondly, Section 2.2 describes the climate data and the selected thermal comfort criteria. Finally, the values of CDD and CDH in nineteen cities of the countries analyzed are calculated by applying two different approaches, i.e., the Eurostat and the adaptive thermal comfort methodologies (Section 2.3).

2.1. Case Study Characterisation

To accommodate diversity in spatial, climate, buildings, and socio-economic profiles across EU, nineteen cities of seven countries, accounting for ten different climate zones of the Köppen-Geiger climate classification [47], have been selected for this work, i.e., Cyprus (Paphos), Finland (Oulu, Sodankylä, Turku), Greece (Athens, Thessaloniki, Tripoli), Israel (Gilat), Portugal (Lisbon, Oporto), Slovakia (Bratislava, Trebisov, Poprad) and Spain (Oviedo, Granada, Leon, Madrid, Pamplona, Sevilla). This section presents a clear profile of the nineteen cities and seven countries that compose this case study regarding the climatic characteristics and future climatic scenarios, and the residential sector characterization. Figure 1 shows the location of the nineteen cities analyzed overlaid with the Köppen-Geiger climate classification.

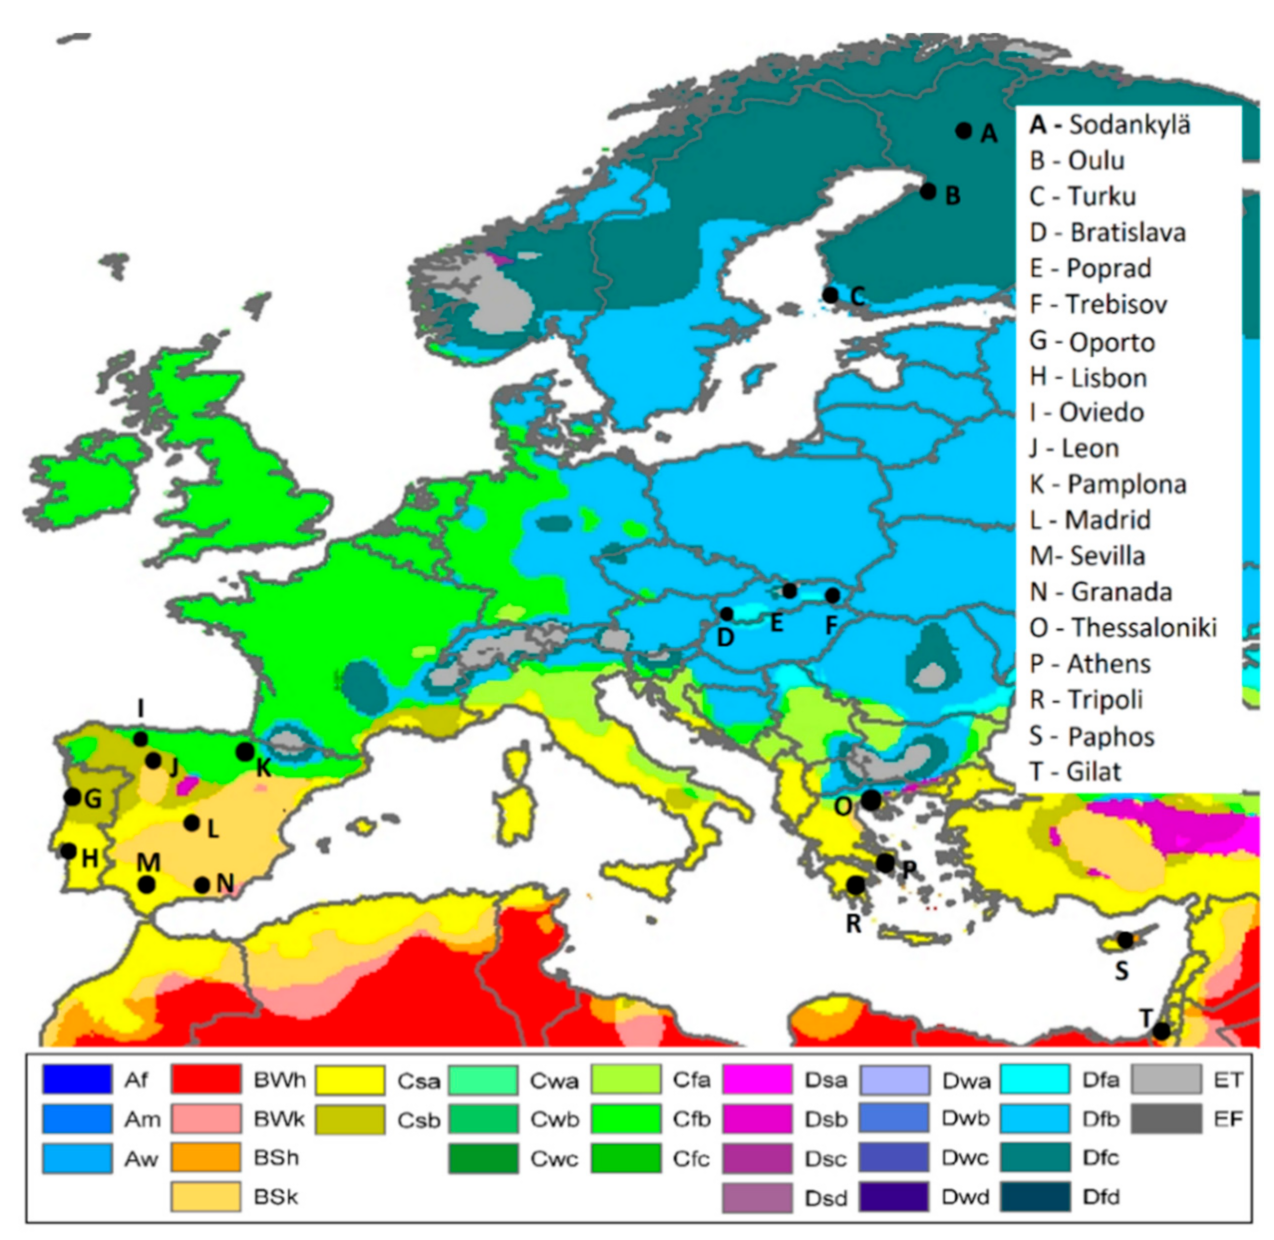
2.1.1. Climatic Perspective: Characteristics and Climatic Scenarios

This section describes the current climatic characteristics and temperature trends for the countries of this study and unique features that should be considered in result interpretation. Minimum and maximum temperatures throughout the year are presented in Figure 2, illustrating the examined locations’ highly diverse profiles. For instance, in January 2019, the minimum temperature in Sodankylä reached −21 °C, and during this period, Gilat had a minimum temperature of 9.7 °C (see Figure 2).
Cyprus is an island located in the Eastern Mediterranean with mild winters and hot summers, which is considered a climate change hotspot [50]. The database used for all cities in this study only included the city of Paphos for this member state and was therefore used here to ensure uniformity of data. As for the projected temperature increase, it is estimated gradual and relatively strong warming of about 3.5–7 °C for the period 2070–2099, compared to the reference period 1961–1990 [51]. However, it should be noted that, compared to Cyprus’s capital Nicosia where peak temperatures above 40 °C are frequently recorded in July and August, Paphos is a coastal and relatively cool city where peak temperatures reached 33.7 °C, July, and 33.5 °C, August in 2019 (see Figure 2).
Finland has a much milder climate than the other regions located as far north, where peak temperatures reached 23.4 °C in July (Turku) in 2019 (see Figure 2). However, it is experiencing a significant impact on temperature increase due to climate change, and it will become even worse in the forthcoming years. Average temperatures have risen approximately by a total of 2 °C from 1847 to 2013 [52]. Similarly, Ruosteenoja et al. [53] provide different updated climatic projections for Finland based on the CMIP5 climate model [54], arguing that the predicted temperature increase will vary from 1.6 °C to 5.6 °C depending on the RCP (Representative Concentrations Pathway) scenario.
Greece has a wide range of temperatures between coastal and northern areas (see Figure 2). Average annual temperatures have increased by 0.5–2.2 °C above the average values of 1971–2000, depicting an upward trend [55].
Israel is located on the south-eastern shore of the Mediterranean Sea and the Red Sea’s northern shore. The North part of Israel is a warm Mediterranean climate; the central west is characterized by a semi-arid (steppe) hot climate; the central east is described as a semi-arid (steppe) cold climate, and south Israel is a warm desert climate. Israel observed many heatwaves in the last years; for instance, in September 2020, Israel faced one of the toughest heat waves since 1930, where the peak temperature reached 48.9 °C in Eilat [56]. The city of Gilat was selected to represent Israel’s climate giving its hot desert climate [57], where peak temperatures reached 37.6 °C in July in 2019 (see Figure 2).
Portugal has two main climatic areas: one with a temperate climate with rainy winter and dry and hot summer, and the other with a temperate climate with rainy winter and dry and not very hot summer. In 2017, Portugal registered its second-highest temperature ever with a deviation of +1.1 °C compared to the national average for the reference period, with the warmest year being 1997 [58]. In 2019, peak temperatures reached 27.8 °C (Lisbon) in July (see Figure 2).
Slovakia is located in central Europe and is considered one of the countries with the highest risk of suffering climate-change impacts. The average temperatures can increase by at least 2 °C in urban areas and 0.5 °C in rural areas [3]. Furthermore, it is predicted that the average temperature in the south of the country can increase from 2 to 5 °C, depending on the scenario by the end of the century [3]. In 2019, peak temperatures reached 27 °C (Bratislava) in July (see Figure 2).
Spain is another country with a broad climatic variability: Mediterranean, continental, maritime, desert, high mountain, and even a subtropical climate. Nevertheless, the progressiveness of warming is almost linear in all the regions. In most regions, the rhythm of the increase in mean temperatures is 2 °C every 30 years in the winter and 3 °C in summer [59]. In 2019, peak temperatures reached 36.2 °C (Seville, southern) and 25.8 °C (Oviedo, northern) in July (see Figure 2).

2.1.2. Residential Sector Profiles

Several indicators regarding building characteristics and energy efficiency are analyzed to better understand existing residential sector characteristics, how they might be affected by a warmer climate, and identify potential impacts related to a cooling demand increase. Note that these indicators have been selected according to the data available in the selected cities.
Share of residential buildings built before 1980. This indicator may be considered a relevant proxy to characterize building stock energy performance, as, unlike in Finland (Despite first energy efficiency regulations have been in place since 1976, it was not until 1990 when a series of energy saving programs were established, meaning that those buildings built before 1980 have poor energy-efficiency characteristics [60].), no energy efficiency regulation was approved before 1980. This means that it is very likely that buildings that were built before this date have no energy-efficiency measures implemented. Overall, the existing residential sector is old and with very low energy efficiency performance. In the selected countries, Slovakia has a 67% share of the total residential sector built before 1980 [61]. In our analysis, it is the country with the highest rate of buildings built before 1980, while Cyprus has the lowest rate with 40% [62]. The second position is for Greece (58.4%) [63], followed by Spain (54.1%) [64], Finland (53.8%) [65] and Portugal (53.5%) [66].
Energy Performance Certificates (EPC) in the residential sector. The Energy Performance of Buildings Directive 2018/844/EU [67] and Directive 2012/27/EU [68] are the EU’s legislative frameworks to boost and regulate buildings’ energy performance. Furthermore, EU countries must implement a long-term renovation strategy [69], with milestones for 2030, 2040, and 2050, aiming at decarbonizing the national building stocks by 2050. However, considering existing data, perspectives are somewhat discouraging, as not too much has been done to achieve the targets. Table 1 shows an overview of the share of EPC in the residential sector in the studied countries in 2019. Finland, with 44.8%, is the country with the highest rate of residential buildings with EPC. However, 68% out of total buildings with EPC have a class “D” or lower. Highlight the case of Cyprus in which there is no official database on issued EPCs; it is only known that 10% of new constructions have EPCs. This is similar in the other countries where the vast majority of existing issued EPCs represent “new buildings” (built after 1980); for instance, in Portugal, around 75% of the residential building stock has an inefficient class equal to or below “C” [70]. Therefore, special attention is needed when more than 50% of existing residential buildings were built before 1980, and only up to 23% out of the total share of buildings with EPC (in the best-case scenario) has an EPC rate ‘C’ or higher. Note that, unlike in the different countries analyzed in this work, currently, there are no EPC records in Israel. However, from March 2022, all new buildings must be built following Standard 5282 [71] for buildings’ energy rating, which is not currently mandatory.
Share of households with air conditioning (AC). The use of AC and electric fans is increasing rapidly, especially in the hottest regions, representing 10% of global electricity consumption [72]. Households use cooling systems to overcome hot temperatures, create a comfortable environment at home, and reduce potential health impacts of heat stress. Thus, space cooling is becoming a basic energy service to potentially protect people from health issues related to high temperatures and, consequently, reduce mortality risks [73]. Table 2 shows the share of households with AC in 2017. It is interesting to highlight that Spain and Portugal, where main cities can reach the highest summer temperature record across Europe, have a lower share of households with AC, justified by lower incomes, cultural habitats, and alternative passive measures being used. Furthermore, Finland does not have a record at all, as neither cooling needs reduction nor cooling system installation is considered in the national building energy-efficiency regulation [74].
Proportion of inhabitants who are living in a dwelling not comfortably cool in summer. Although Eurostat no longer collects this indicator under the EU-SILC [81], a fact which has been criticized by academics and researchers [82,83], it is especially relevant because it implies a higher risk of heat stress and potential subsequent health impacts. That is because although a high number of people may have AC in their houses, it does not mean that all of them can afford to use it—e.g., 84% of households have AC in Cyprus (see Table 2), but a total of 28.2% cannot keep comfortably cool in their houses (see Table 3), possibly because they cannot afford to pay their energy bills or to pay for the AC system maintenance. Gouveia et al. [84] identified this issue in a Portuguese region (i.e., Évora) with very hot summers, showing increased vulnerability to climate change impacts. Furthermore, attention is drawn to the case of Finland, where cooling active and passive solutions are not mandatory by regulation, and up to 25.2% of households cannot keep comfortably cool in their houses, mainly because buildings have traditionally been built to withstand cold winters without taking into account future cooling needs.

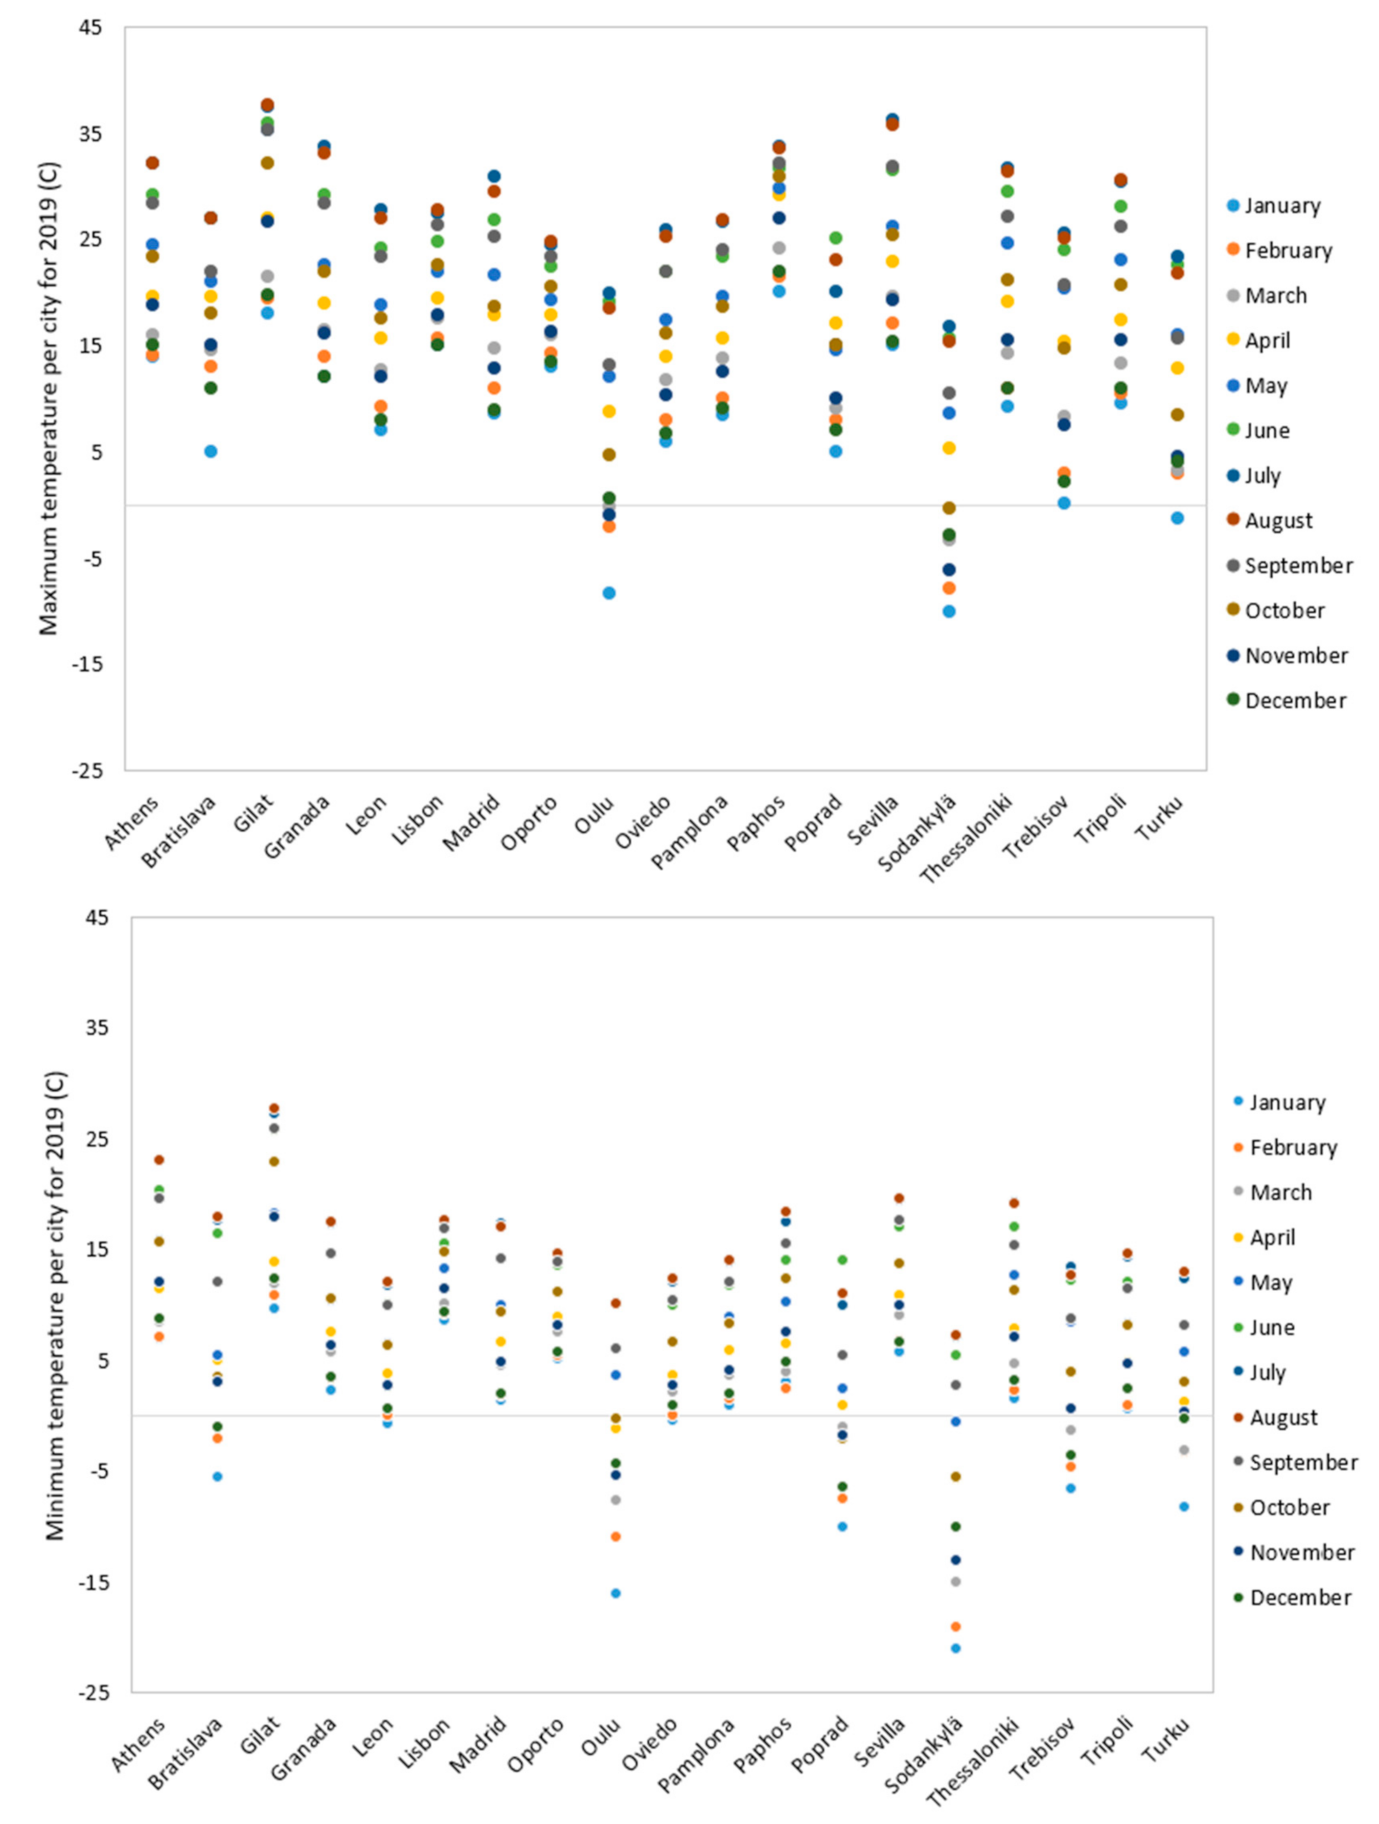
2.2. Climate Data and Thermal Comfort

To obtain a broad overview of the significant variety of climate conditions and changes, representative cities in each country were selected according to the Koppen-Geiger climate classification [47]. Temperatures in each of the selected cities were calculated in accordance with the 2000 Special Report on Emission Scenarios (SRES) A2 scenario (The A2 scenario presents a very heterogeneous world, considering a value of 16.5 GtC/year (gigatones of carbon per year) of CO2 emissions from fossil fuels, and 595 1018J/year (Joule per year) of primary energy for 2050 in relation to 1990 [86].) of greenhouse gas emissions; known as ‘high’ forcing scenario, it considers a 2.2 higher CO2 concentration than the present values by the end of the 21st century. To obtain climatic data adapted to climate change (according to scenario A2) for any location in the world for 2020 and 2050, this paper uses Meteonorm software, a calculation tool with a combination of reliable data sources that generates accurate and representative typical years for any place in the world [87]. The Metonorm software and climatological database are broadly used to create monthly, daily, and hourly time series of future scenarios by considering variations of radiation, precipitation, and temperature [88].
It is important for this work to highlight that the SRES A2 was the only scenario available for use in the Meteonorm software at the time of the analysis. In 2013, the Intergovernmental Panel on Climate Change released the Fifth Assessment Report, based on the fifth phase of the Coupled Model Intercomparison Project (CMIP5). The report incorporates the latest versions of climate models and scenarios and introduces the 2010 Representative Concentration Pathways (RCP) [89], which became the standard for climate change analysis. Although this analysis is not based on the latest and updated scenarios, it is important to clarify that the IPCC’s Fifth Assessment also uses results from the SRES CMIP3 modeling and therefore identifies similar scenarios from each set. In particular, in the last part of the XXI century, the SRES A2 presents a similar path to RCP 8.5 (which represents a very pessimistic scenario). Both scenarios are very similar in terms of global radiation (about 8 W/m2) and similar changes in global mean temperature. RCP8.5 indicates global mean surface temperatures for 2081 to 2100, compared with those for 1986 to 2005, to be likely in the range of 2.6 °C to 4.8 °C higher, with a calculated mean increase of 3.7 °C [90]. The projected increase in temperatures for SRES A2 for the 2090 to 2099 period, relative to 1980 to 1999, is presented as 2.0 °C to 5.9 °C, with a calculated mean increase of 3.4 °C [91]. Hence, for the analysis performed in this study, the results are deemed valid and useful. However, potential future research is the use of RCP scenarios (using downscaling methodologies) in order to be able to compare results.
Regarding the upper thermal comfort temperature threshold used for the CDD and CDH calculations for each country’s most representative cities, this was calculated in two ways. The first one was calculated according to the principles in ASHRAE standard 55-2017 [49], in which indoor comfort temperatures depend on external temperatures of the previous days. Generally, two thermal comfort temperature thresholds can be calculated depending on the people’s level of acceptability (80% acceptability limits are for a normal level of expectation—it is used for new buildings—and 90% acceptability limits are for a moderate level of expectation; it is used in existing buildings) [49]. Taking into considerations vulnerable energy households (elderly, children, or people with chronic diseases), who spend most of their time at home and typically have higher thermal needs, as well as the issue of energy poverty in summer, 90% of acceptability was used in this work to calculate the upper limit of thermal comfort temperature thresholds, which is determined by Equation (1), according to the ASHRAE standard 55-2017 [49]:
To = 0.31 × Tpma + 17.8 + 2.5,
where To is acceptable upper operative temperature, and Tpma is the prevailing mean outdoor temperature of the previous 7 days. This standard is also aligned with the European regulation EN 16798-1:2019 [56] for designing and assessing buildings’ energy performance addressing indoor air quality and thermal environment. Note that the standard for calculating the prevailing mean outdoor temperature (Tpma) is only applicable when it is greater than 10 °C and less than 33.5 °C [49]. Otherwise, Tpma has to be set, respectively, at 10 °C and 33.5 °C.
The second approach in calculating the upper indoor thermal comfort threshold is fixed and calculated according to the Eurostat methodology [39]. Unlike the adaptive methodology, the indoor thermal comfort temperature does not vary along the different days of the year when using this approach.

2.3. Calculation of CDD and CDH

According to the Eurostat methodology (“fixed threshold”) [39], the CDD index depicts the severity of the heat in a specific period taking into consideration daily outdoor temperature and average room temperature (in other words, the need for space cooling per day). On the other hand, the CDH assesses the severity of heat considering hourly outdoor temperature and, using Equation (1), estimating the need for cooling per hour.
The calculation of CDD, according to the Eurostat methodology, relies on the base temperature (Tb), defined as the highest daily mean outside dry-bulb temperature, not leading to indoor cooling. The value of the base temperature (Tb) depends on several factors associated with the built environment. Using a general climatological approach, the base temperature (Tb) is set to a constant value of 24 °C in the CDD calculation [39]. If the Mean Outside Dry-Bulb Temperature of the day (Tm) is greater than or equal to Tb for that day, the value of the CDD index is Tm-To [48], where To is the indoor comfort temperature, which is set to 21 °C. Otherwise, if the daily mean air temperature is lower than Tb for that day, the CDD index is 0. Therefore, the calculation of CDD according to the Eurostat methodology can be expressed by Equation (2):
If (Tm ≥ 24 °C; Tm − 21 °C; 0)
On the other hand, the CDH calculation is customarily carried out by using the upper adaptive indoor comfort temperature (To in Equation (1)). Unlike the Eurostat methodology, the adaptive thermal comfort methodology does not use a fixed base temperature (Tb) and indoor comfort temperature (To), rather an acceptable upper operative temperature calculated by Equation (1). The adaptive comfort criterion is considered appropriate for this study because climatic differences across the seven selected countries are considered. In addition, this standard analyses the people’s capability to adapt to different indoor environments; it sets a wide range of temperature thresholds for adaptability, and it reflects maximum thermal habitability conditions, which is especially common among vulnerable people. The calculation of CDH adjusted to the upper adaptive indoor comfort temperature (Equation (1)) is shown by Equation (3):
If (TmTo; TmTo; 0)
As a novelty of this work, the CDD and CDH calculations have also been carried out, adopting the methodologies not usually encountered in the literature (see Section 1). Usually, CDD values are calculated on a fixed thermal comfort model and CDH values on an adaptive thermal comfort model (which has been explained for this study). Here, CDD values are also calculated following the adaptive thermal comfort approach, and CDH values are estimated based on a fixed thermal comfort threshold. This means that for the CDD calculation by using the adaptive thermal comfort approach, the base temperature (Tb) and indoor comfort temperature (To) are not set to a constant value of 24 °C and 21 °C, respectively, as in Equation (2), rather both values are set by using the upper adaptive indoor thermal comfort temperature threshold defined in Equation (1), meaning that Tm and To have the same value. Then, the calculation of CDD by using the adaptive thermal comfort approach [49] is defined by Equation (3), which in this case is applied to the average daily temperature.
Regarding the calculation of the CDH by using the Eurostat methodology (fixed thermal comfort threshold), it differs from the adaptive thermal comfort approach in how the indoor thermal comfort temperature (To) and base temperature (Tb) are set. Unlike with the adaptive thermal comfort approach, in the Eurostat methodology, the indoor thermal comfort temperature (To) is fixed to 21 °C and the base temperature (Tb) to 24 °C [48]. Thus, similarly to the CDD calculation by using the Eurostat methodology, the calculation of CDH values is defined by Equation (2) but applied to each hour of the year rather than each day (in other words, it is calculated by using hourly rather than daily values).

3. Results

This section presents the results of the CDD and CDH values for 2020 and 2050 by using a fixed and adaptive thermal comfort temperature threshold, explained in Section 3.1 and Section 3.2. Furthermore, a comparison analysis between the results for CDD and CDH indexes is provided in Section 3.3.

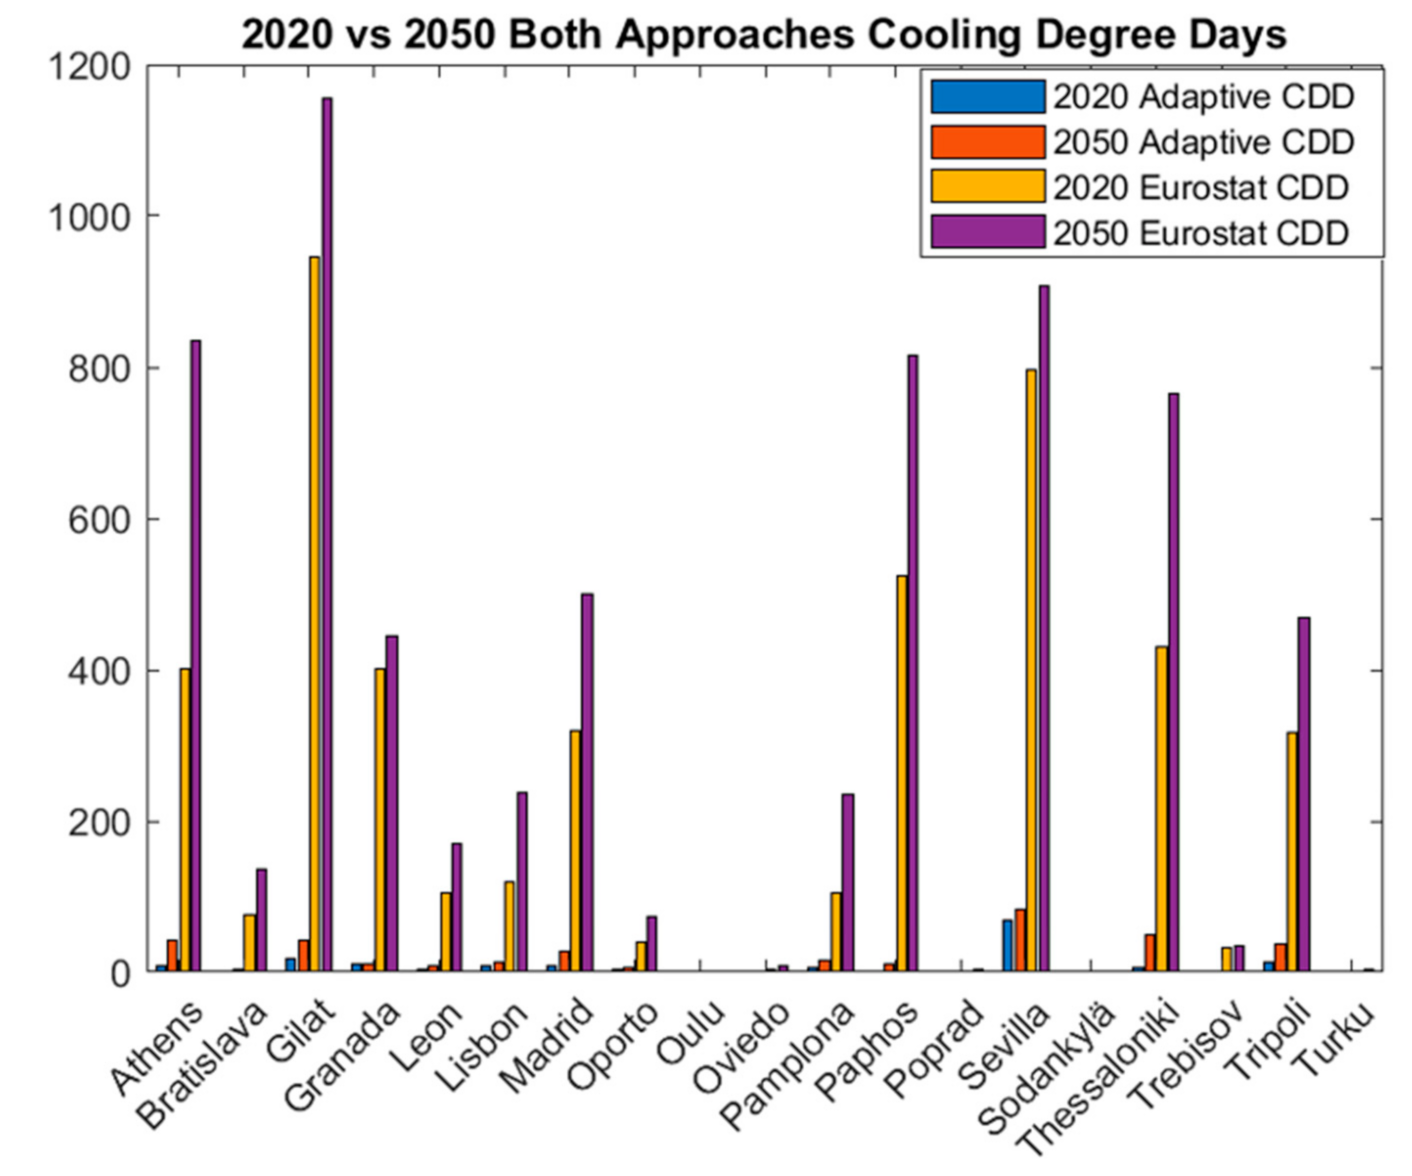
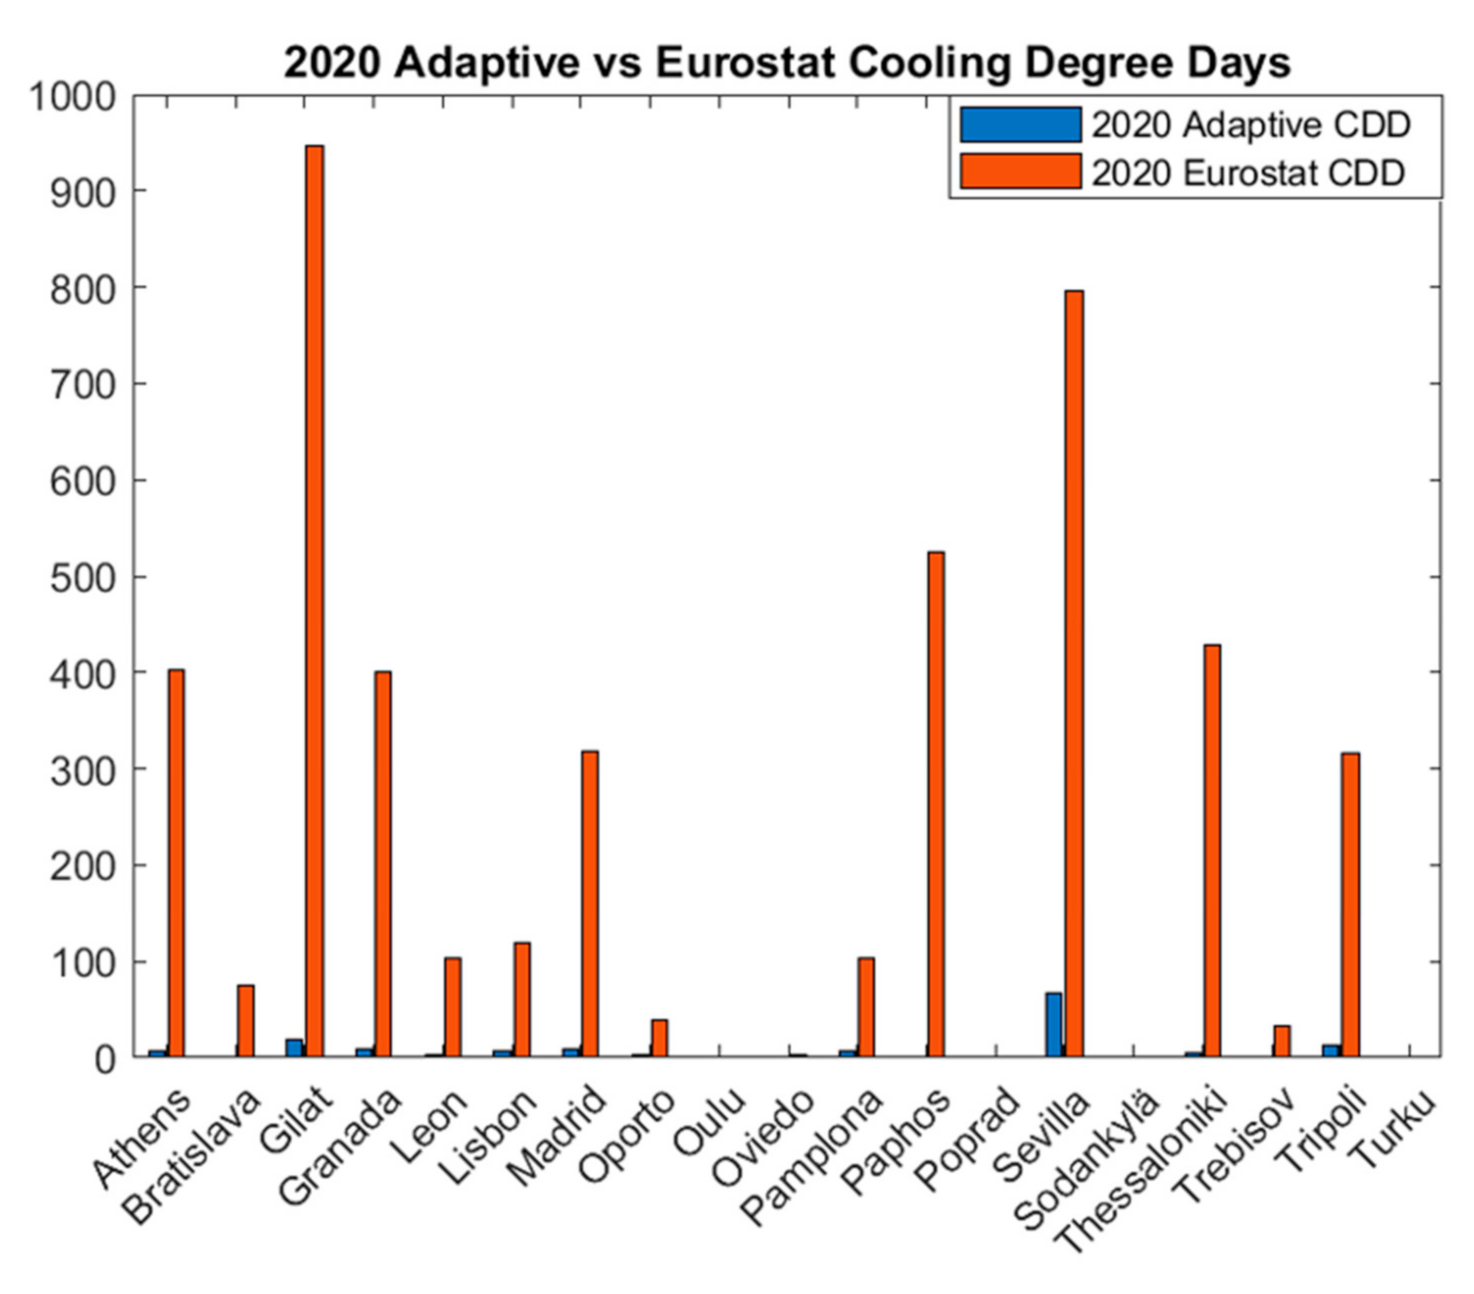
3.1. CDD Values for 2020 and 2050

Figure 3 shows the CDD values of the selected cities in 2020 and 2050 calculated by applying the Eurostat (fixed thermal comfort temperature threshold) and adaptive thermal comfort (variable thermal comfort temperature threshold) methods explained above (see Section 2.2 and Section 2.3 for further details). Blue and yellow bars represent the CDD values for 2020 by using the adaptive thermal comfort and Eurostat methods, respectively, and the orange and purple ones represent the CDD values for 2050 by using the adaptive thermal comfort and Eurostat methods. Overall, both figures show a CDD value increase for 2050, with different percentages depending on the city. For instance, Gilat has the highest CDD values for 2020 and 2050 using the Eurostat method, while Oulu has no CDD values for 2020 and 2050. However, analyzing the CDD values for 2020 and 2050 by using the adaptive method, Sevilla has the highest values instead of Gilat.
Figure 4 represents the CDD values only for 2020, calculated by applying the Eurostat and the adaptive thermal comfort methods to better understand the effects of using a fixed or adaptive thermal comfort threshold. Blue bars represent the CDD values according to the adaptive thermal comfort method, and the orange ones represent CDD values according to the Eurostat one. Analyzing Figure 4, it is shown that the highest value of CDD by using the adaptive thermal comfort method is calculated for the city of Sevilla (68.18), whereas, according to the Eurostat method, Gilat is the hottest city (946.80). On the other hand, the lowest values of CDD by using the adaptive thermal comfort method (i.e., 0) is obtained for the five coldest cities (Oviedo, Poprad, Oulu, Sodankylae, and Turku), whereas, according to the Eurostat method, only four of these five cities present a CDD value equal to 0 (note that Oviedo has a CDD value equal to 3.23). In this respect, it can be highlighted that the adaptive thermal comfort method provides much lower values of CDD than the Eurostat one (the median ratio between the Eurostat method values and the adaptive thermal comfort ones is 37). This means that the Eurostat method neglects the effects of building users’ adaptive actions to adapt to indoor air temperatures.

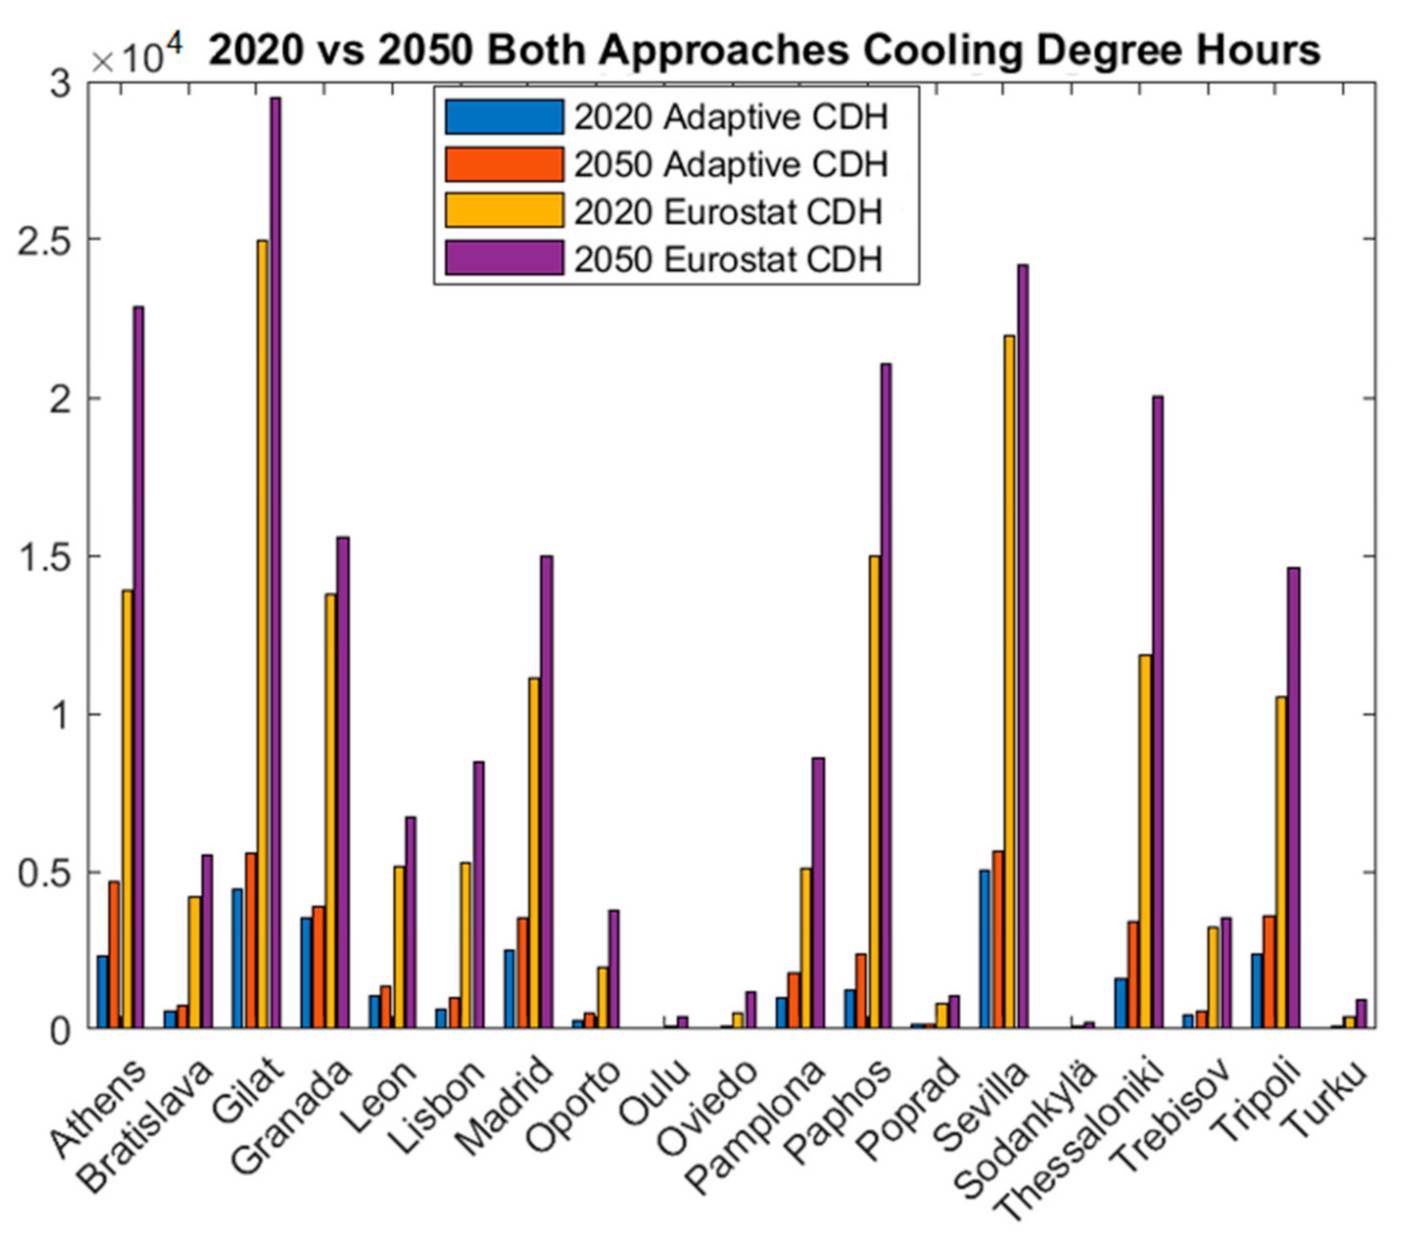
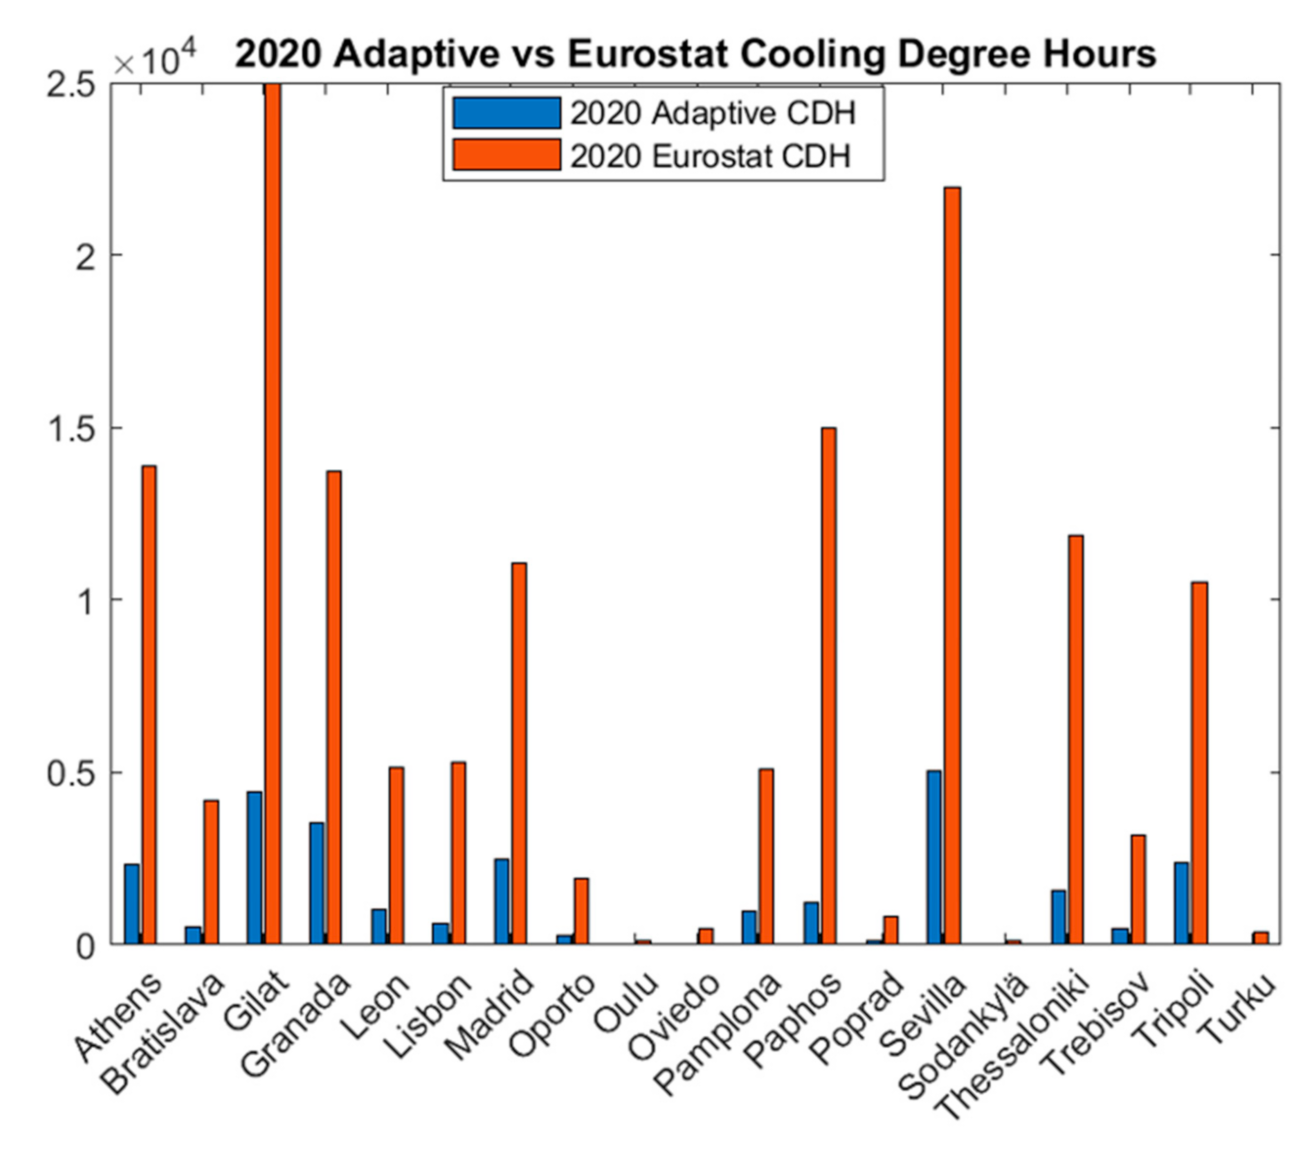
3.2. CDH Values for 2020 and 2050

Figure 5 shows the CDH values of the selected cities in 2020 and 2050 calculated by applying, respectively, the Eurostat and adaptive thermal comfort methods explained above (see Section 2.2 and Section 2.3 for further details). Blue and yellow bars represent the CDH values for 2020 by using the adaptive thermal comfort and Eurostat methods, respectively, and the orange and purple ones represent the CDH values for 2050 by using the adaptive thermal comfort and Eurostat methods. Overall, both figures show a CDH value increase for 2050, with different percentages depending on the city. For instance, Gilat has the highest CDH values for 2020 and 2050 by using the Eurostat method, while Oulu has the lowest values for 2020 and 2050. However, unlike the CDD values, analyzing the CDH values for 2020 and 2050 by using the adaptive thermal comfort method, Gilat and Sevilla have similar values (see Section 3.1). This means that the CDH index, which considers hourly outdoor temperatures, enables an accurate assessment of the cooling needs.
To provide a better understanding of the effects of using a fixed or an adaptive thermal comfort threshold on the CDH calculation, Figure 6 shows the CDH values only for 2020 calculated by applying the Eurostat and the adaptive thermal comfort methods. Blue bars represent the CDH values according to the adaptive thermal comfort method, and the orange ones represent the CDH values according to the Eurostat one. Analyzing Figure 6, it is shown that the city of Seville has the highest value of CDH by using the adaptive method (5037.27). At the same time, Gilat is the hottest city when using the Eurostat method (24,952.90), just like in the CDD index (see Section 3.1 for further details). It is important to note here that the difference between using the adaptive thermal comfort and the Eurostat methods is almost double in the CDD methodology than in the CDH one (467% and 222%, respectively). This is mainly because the CDD index uses daily outdoor temperatures and the CDH one uses hourly outdoor temperatures. On the other hand, the lowest value of CDH for the adaptive thermal comfort method corresponds to the city of Oulu, whereas, using a fixed threshold (Eurostat), Sodankylae has the lowest CDH value. In this respect, it can be said that the adaptive CDH values are significantly lower than the Eurostat ones (the median ratio between the Eurostat method values and the adaptive ones is 6).

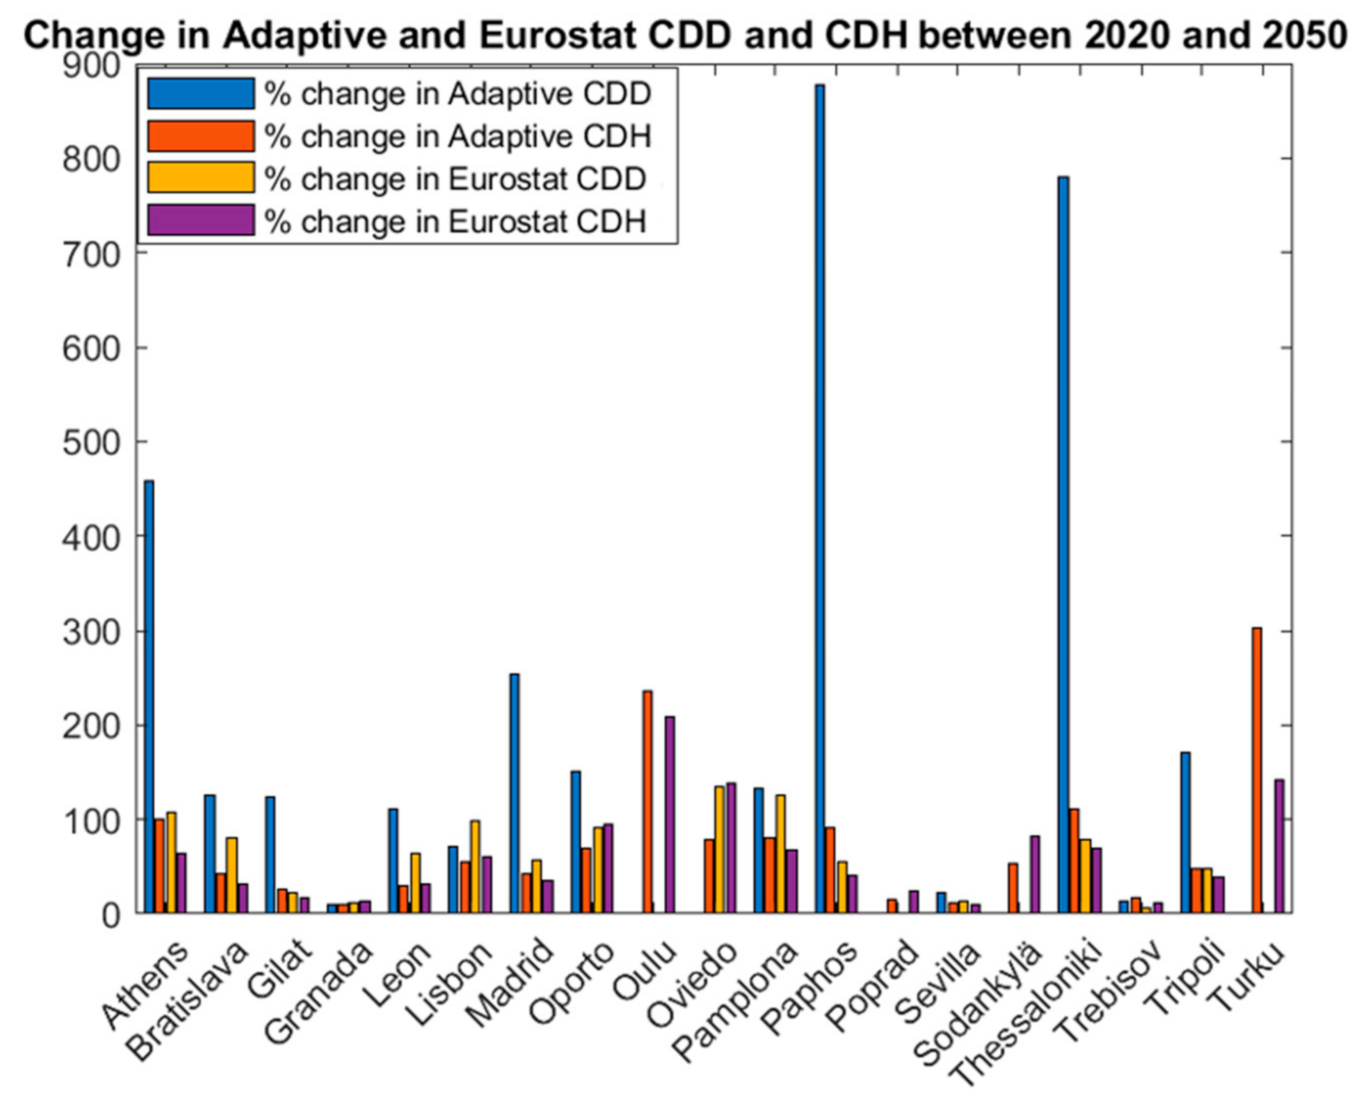
3.3. Comparison between CDD and CDH Indexes

It is also possible to compare results for CDD and CDH indexes. Figure 7 shows the percentage change between CDD and CDH values for 2020 and 2050 for adaptive thermal comfort and Eurostat methods. Blue and orange bars show how CDD and CDH values vary between 2020 and 205 when using the adaptive thermal comfort method, and yellow and purple bars when using the Eurostat method.
The CDD index in Figure 7 indicates that several cities in different countries have no cooling requirements (Propad, Oulu, Sodankylae, and Turku). These findings appear to be contradictory to the heatwave experienced in 2019 when Oulu and Turku recorded temperatures higher than 19 °C in June and July and even higher than 22 °C in Turku (see Figure 2). These unprecedented temperatures for this part of the world ascertain the actual need for cooling in critical times. On the other hand, using an hourly based index (CDH), there is no city with null values, and there are different CDH values among the cities, even among the coldest ones (CDH values for Oulu, Sodankylae, and Turku by using the adaptive thermal comfort methodology are 11.01, 15.27 and 24.87, respectively).
Secondly, when comparing the average increase between 2020 and 2050, CDD values present a noticeable median increase by using both methods: 54% in the calculation with the Eurostat method and 112% in the values calculated using the adaptive thermal comfort temperature threshold. On the other hand, the CDH values increase by 41% for the Eurostat method and 55% for the adaptive one. It is interesting to highlight that the CDH values increase is relatively similar to the CDD values when using the Eurostat method (a fixed thermal comfort temperature threshold), but very different (almost double) when using the adaptive thermal comfort method, in which CDD values experience a two-fold increase with regards to the CDH values. This shows that, unlike the CDH index, the CDD index does not provide accurate values when using the adaptive thermal comfort method, neglecting hourly changes in temperatures (i.e., between day and night).

4. Discussion

In this section, several aspects of the results are discussed: (1) the difference between the CDD and CDH indexes and the methodology used for the calculation; (2) the implications of results for further research; (3) the implications of results for energy poverty mitigation in summer, and (4) the implications of results for policy formulation.

4.1. Discussion of the Difference in the Models

The main difference between the CDD and CDH indexes is that the CDD index uses daily average temperature in contrast to the CDH index, which uses hourly average temperature, meaning that the CDH index provides a more reliable and accurate assessment of the effect temperature variations have on the cooling demand. This aspect is shown in Figure 4 and Figure 6, where the CDD values are significantly lower than the CDH ones (i.e., Gilat had a CDD value of 946.80 and a CDH value 24,952.90 in 2020 by using the Eurostat methodology). In this respect, unlike the CDD values, it can be said that the CDH values consider the high cooling needs that inhabitants in Gilat experienced in different periods of the day in 2020.
Secondly, results show the methodology’s importance (meaning the thermal comfort temperature threshold) used to calculate the CDD and CDH values. For instance, Eurostat imposes that, to consider the average outdoor temperature (Tm) of the day in calculating CDD, this has to be equal to or higher than 24 °C. Furthermore, it must meet that the base temperature (Tb) is equal to 24 °C (Tb = 24 °C), neglecting that the base temperature for the adaptive thermal comfort method changes among the days in the warmer months, and it is usually higher than the Eurostat one (see Section 2.3 for further details). Therefore, the Eurostat values of CDD/CDH are higher than those of the adaptive thermal comfort method’s ones (i.e., Gilat has a CDD and CDH value of 946.80 and 24,952.90 in 2020 by using the Eurostat methodology, while only a CDD and CDH value of 18.86 and 4422.11 when using the adaptive thermal comfort methodology; see Figure 4 and Figure 6). Moreover, the Eurostat method can represent the temperature trend; however, it cannot consider people’s ability to progressively adapt their thermal comfort band according to the climate of the location and the average temperature of the previous days.
On the other hand, the adaptive method can detect this phenomenon, then avoiding the overestimation of cooling needs. Interestingly, results for the adaptive thermal comfort method suggest that there is no direct correspondence to the values calculated with the Eurostat one, which can be interpreted as a result of the non-linearity between the temperature change considered in the model and the people’s adaptability among the different climates. This calls for careful consideration of a study’s methodology, according to the project’s aims, as results and implications may be quite different.
More in detail, when comparing the CDD and CDH values, the CDD values in the coldest cities were equal to 0 in 2020 independently of the thermal comfort temperature threshold used (Eurostat or adaptive thermal comfort), whereas the CDH values in the same cities are not null, and differ among the cities (i.e., Oulu, Sodankylae and Turku; see Figure 3 and Figure 5). Furthermore, it can be noted that the CDD index fails to detect smaller changes in temperatures, as it uses daily average temperature rather than hourly. For instance, the CDD values of Poprad, Oulu, Sodankylae, and Turku do not change between 2020 and 2050 according to the two thresholds (Eurostat or adaptive thermal comfort); see values of the % CDD changes in Table 4. However, according to the CDH index, Poprad, Oulu, Sodankylae, and Turku will experience an increase in the values for 2050 independently of the threshold used (Eurostat or adaptive thermal comfort); see values of the % CDH changes in Table 4. In other words, the CDH index represents the cooling needs of each city more realistically and can detect the differences even in the cities with cold climates. The CDH index can therefore be considered a more accurate index because it considers hourly changes in temperatures, which can affect people’s thermal comfort. This is an important fact when analyzing those cities with a wide range of temperatures between day and night (i.e., southern cities in Nordic regions, and inner and southern cities in Slovakia and Spain), where people’s capability to adapt to the indoor environment plays a key role in the energy needs.
In the end, it can be said that the CDD index highlights the effects of climate warming in those countries that are already experiencing intense summers, while the CDH index sheds light on the future implications in those countries with cold and mild summers, such as Nordic regions; see Table 4). Thus, one method should not be prioritized over the other; instead, one should combine them to get a better perspective from the analysis.

4.2. Discussion on Implications of Results for Further Research

Results from this study confirm previous work results on the potential effect of climate change regarding energy demand increase and indoor thermal comfort implications, estimating an overall increase of cooling demand up to 2050, in the range of 54–112% (see Table 4), depending on the methodology employed. Aebischer et al. [92] evaluated the impact of a temperature increase in summer cooling demand based on CDD values and the Eurostat thermal comfort threshold across Europe. Their results showed a 115% CDD increase for 2035 and an associated electricity energy consumption increase of 46%. Similarly, Larsen et al. [93] analyzed cooling demand trends with outdoor temperature changes for different climate models and scenarios at the European level, showing a general CDD increase, with a higher incidence in Nordic regions (i.e., Sweden, Norway, and Finland). In relation to other studies using CDD values based on the Eurostat method, results show that the percentage increase on CDD values provided in this work are similar. This work shows the importance of the thermal comfort temperature threshold used when calculating CDD and CDH values, as the results may be quite different, suggesting that the method and threshold used for the calculation should be based on the analyzed case study and research’s aims. For instance, looking at the % CDD change values for Finland in Table 4 (i.e., values equal to 0), it can be said that climate warming will not affect either cooling demand or people’s thermal comfort. However, the % CDH change values show that Finland will suffer at least a 50% cooling demand increase by 2050, being higher depending on the city (i.e., Sodankylä will suffer a 54% increase while Oulu a 235% according to the adaptive thermal comfort temperature threshold). Hence, these results have important implications for further research on climate warming impacts in the Finnish building stock and people’s thermal comfort, and Nordic regions in general, when considering that 25.5 of households were uncomfortable cool in summer, 53.8% of existing residential building stock were built before 1908 with poor energy-efficiency characteristics, and there is neither record nor culture of AC usage (see Table 4).
On the other hand, unlike the CDD index, the use of the CDH index shows that the expected values of building cooling demand might not happen finally. For instance, several studies in Portugal [15,17,21] estimate a potential cooling demand increase of up to 83% for 2050. Similarly, according to the ‘An EU Strategy on Heating and Cooling’ report from the European Commission [23], a 74.5% increase in the cooling energy demand is expected across the EU countries by 2050. However, the results of this work, by using the CDH index and adaptive thermal comfort temperature threshold, show a potential building cooling demand ranging from 56–69% in Portugal depending on the region (see Table 4 for further details), and an average 55% building cooling demand increase across different EU countries (see Figure 7 in Section 3.3).
In the end, as the novelty of this work, the comparative analysis presented provides a better understanding of the potential implications of using each of the methodologies analyzed in terms of the final values; the CDD index, through the use of average daily temperatures, overestimates the potential cooling demand in countries with hot summers and neglects meaningful changes in countries with relatively cold and mild summers, i.e., northern countries. On the other hand, the CDH index, which uses average hourly temperatures, provides lower cooling demand values in countries with hot summers and accurate analysis of the potential cooling demand increase in those countries which are currently out of the framework, i.e., Nordic regions.

4.3. Discussion of the Implications of Results for Energy Poverty Mitigation in Summer

The results of both indexes suggest that there is a noticeable average increase in both CDD and CDH values in 2050 (up to double in some of the studied cities). There is a limited number of studies on the consequences of an increase in CDD and CDH values for European citizens’ well-being concerning energy poverty in summer. Atsalis et al. [94], in a case study in Greece, showed that mortality is positively-correlated with higher CDD values. Relevant implications when considering results of this work, which show a considerable increase in CDD values for 2050: 108% and 459% in Athens; 78% and 779% in Thessaloniki; and 48% and 170% in Tripoli according to the fixed and adaptive thermal comfort temperature threshold, respectively. This means that households will need to use cooling systems in order to overcome high indoor temperatures and stay healthy at home, yet this will increase energy consumption, potentially creating social justice issues among vulnerable population groups (i.e., elderly, low-income households, etc.) such as energy poverty [95]. In this respect, Eskeland and Mideksa [96] estimated that one unit increase in CDD could lead to an electricity consumption raise of 0.04%, meaning, for instance, that for the case study of Greece, households will see an increase in their electricity consumption in summer of 11.34% in Athens, 17.14% in Thessaloniki, and 4.36% in Tripoli. However, it should be noted for this work that the electricity consumption increase might be lower according to the CDH values (which considers people’s capability to adapt the thermal comfort band without using the cooling system): 3.28% in Athens, in 3.62% Thessaloniki, and 1.74% in Tripoli. This comparison relates to the implementation of communication strategies to assist most vulnerable households with their energy use as an effective measure to reduce households’ energy consumption and, subsequently, energy poverty.
Unlike energy poverty in winter, which has been embedded within decision-makers’ discourse among European countries, the importance of summertime cooling poverty has relatively been neglected. In this respect, it is important to highlight for this work the case study of Finland, where up to a two-fold increase in the CDH values is expected in 2050. As shown in Table 4, national building energy-efficiency regulation does not consider the installation of cooling system during either the design or retrofitting process, and up to 53.8% of buildings were built before 1980, which is possibly leading 25.2% of households to not live comfortably cool in summer. In this context, those households with low incomes who live in housing predisposed to high temperatures (i.e., existing residential building stock is old and with low energy-efficiency characteristics) and are unable to afford to install neither passive nor active cooling measures (i.e., low share of households with AC and low-income level) will witness exacerbated effects of summer heat [9,82]. Important implications for Nordic regions in general where the social welfare model does not reflect the impacts of projected climate warming in citizens’ wellbeing, relatively absent within the discourse of decision-makers [83].
Cities located in southern countries, already experiencing intense summers, are expected to face even harsher conditions and will be called to adapt to hazardous environments (i.e., Paphos, Thessaloniki, Athens, Madrid; see Table 4). Nevertheless, the shock that northern countries will experience should not be overlooked. Their CDD and CDH values may not be comparable to those of southern countries; however, population and dwellings are not adapted at all (i.e., 84% of households have AC in Cyprus, and 59.5% in Greece, but there is no record in Finland; see Table 4). For this reason, structural modifications in the building stock and occupant behavior should be anticipated for northern countries, whereas for southern countries, there should be a ramp-up of existing renovation techniques.
In conclusion, unlike existing studies, this work shows a relevant connection between climate warming, cooling demand, and the risk of energy poverty in summer, and this must therefore be considered within the energy and building policy-making process.

4.4. Discussion on Implications of Results for Policy Formulation

Findings of this work indicate that the absolute values of CDD/CDH based on the adaptive thermal comfort method are lower than the Eurostat method ones. Therefore, the absolute variation of CDD/CDH values between 2020 and 2050 by using the adaptive thermal comfort method is lower than the variation calculated using the Eurostat one. On the other hand, the relative variation calculated with the adaptive thermal comfort method is on average higher than the Eurostat one (see Table 4). This means that the temperature increases projected in this paper for 2050 could affect the “habitability of residences” because, even considering the people’s capability to adapt their comfort band, the temperature values in 2050 would be higher than the adaptive thermal comfort temperature threshold values, specifically over 55% (see Section 3.3). In 2012, an average of 20% of households were uncomfortably cool in summer, and over 58% of buildings were built before 1980 with poor energy-efficiency quality in the studied countries (see Table 4), which might lead to a two-fold increase in the share of households who live uncomfortably cool in summer in 2050 according to this work’s results. Similarly, based on findings from the literature [23,72,73,79,82], this is very likely to increase the adoption of air conditioning and energy consumption in the summer, especially in southern European countries. Nevertheless, these changes might not be as significant as the expected impacts of other factors (e.g., household size, income, electricity prices, occupant thermal comfort patterns, socio-economic particularities) [29]. Therefore, interpretation of results in that regard should be cautious.
These results shed light on the need for building design and building refurbishment to be based on the implications of projected climatic scenarios in the cooling demand increase rather than on past climatic data. Building location and the type of ventilation system (i.e., natural, mechanical, or a combination of both) can play an important role in cooling mitigation, specifically to provide natural ventilation at night, decrease cooling load and increase thermal comfort [97]. The uses of the adaptive thermal comfort method, which considers occupants’ capability to adapt to different indoor conditions, shows that energy-efficiency solutions must be occupant-centered rather than solely mechanically oriented since the latter does not allow occupants to adapt to different indoor thermal comfort conditions. This can also have potential societal implications when designing social housing and/or retrofitting vulnerable households’ dwellings to mitigate energy poverty, prioritizing cheaper solutions that reduce household energy consumption rather than only installing a cooling system to provide an adequate indoor thermal comfort environment.
In this respect, these results provide key insights that may support policymakers to define future building regulations concerning the Renovation Wave for Europe [98], which aims to double the annual energy renovation rate of residential and non-residential buildings by 2030 and foster deep energy renovation, maintaining the renovation level until 2050, when EU-wide climate neutrality must be achieved. Passive and technical solutions to reduce cooling energy demand in buildings, which enable occupants to interact with building’s systems to adapt to the indoor environment, must be taken into consideration (as has already been done for heating systems such as heat pumps [99]), and adaptive thermal methods have the potential to assess the effectiveness of these measures.

5. Conclusions

Cooling energy demand in buildings is largely overlooked in many attempts to achieve climate change mitigation and related carbon neutrality targets. In this respect, this work analyses the effects of a warmer climate in the residential cooling demand for 2050 on a case study of nineteen cities across seven countries: Cyprus, Finland, Greece, Portugal, Slovakia, Spain, and Israel. To do that, cooling degree days and hours (CDD and CDH) are calculated using both fixed and adaptive thermal comfort temperature thresholds for 2020 and 2050.
Results suggest that there is a noticeable average increase in both CDD and CDH values by using both thresholds for 2050. However, it can be noticed that the CDD values fail to detect smaller changes in temperatures. For instance, in the Nordic cities of Oulu, Sodankylae, and Turku, CDD values are equal to 0 for 2020 and 2050, regardless of the model used. In this respect, it can be said that the CDH index better represents the cooling needs of each city and can detect the differences even between cities with cold climates. Unlike the CDD index, which uses daily average temperatures, the CDH index can therefore be considered a more accurate methodology to assess the impacts of projected climate warming in the residential cooling demand, as it calculates hourly changes in temperatures, which can affect people’s thermal comfort.
In terms of methodology, results show that, unlike the adaptive thermal comfort methodology, the Eurostat methodology is less likely to consider people’s ability to progressively adapt their thermal comfort band according to the climate characteristics of the location, leading then to an overestimation of the cooling needs. This fact can be seen in Figure 4 and Figure 6, where CDD and CDH values by using the Eurostat methodology are significantly higher than if the adaptive thermal comfort methodology is used. This is mainly because the Eurostat methodology does not consider daily temperature changes (i.e., base temperature (Tb) and indoor operative temperature (To) are set at 24 °C and 21 °C, respectively; see Equation (2) in Section 2.3), neglecting that outdoor temperatures (Tb) vary among the days, and between day and night, and the capability of people to adapt to the indoor thermal comfort conditions (To); this fact is considered in the adaptive thermal comfort methodology (see Equation (3) in Section 2.3). It is important to note that the results for the adaptive method suggest that there is not a direct correspondence to the values calculated with the Eurostat one, which can be interpreted as a result of the non-linearity between the temperature change considered in the model and the people’s adaptability among the different climates.
Although the results from this study are aligned with the evidence found in other studies concerning the potential effect of climate change regarding cooling demand and thermal comfort, in particular, they must be carefully considered, given the complexity to assess thermal comfort and the impossibility to predict occupants’ behavior and capability of adaptation to future scenarios, given the temperature increase velocity. Thus, further research is needed in order to be able to evaluate the results of this paper (e.g., the use of RCP scenarios using downscaling methodologies).
Regarding policy implications, this work sheds light on the need for building design to be based on the implications of projected climatic scenario in the cooling energy demand rather than on past climatic data. Furthermore, it shows that energy-efficiency solutions must be occupant-centered rather than solely focused on technology, thus enabling occupants to adapt to different indoor thermal comfort conditions. As it is discussed in Section 4, this can lead to reducing cooling demand and possibly energy consumption; people might adapt to the indoor thermal comfort conditions opening windows rather than using the cooling system (AC). This can also have potential societal implications when improving the energy efficiency of most vulnerable households in order to mitigate energy poverty in summer. As discussed above, a 0.04% electricity consumption increase per CDD value is expected, meaning, for instance, an 11.34%, 17.14%, and 4.36% electricity consumption increase for households located in Athens, Thessaloniki, and Tripoli in the summertime. Low-income households who live in housing predisposed to high temperatures (old and low energy-efficient residential building stock) and are unable to afford to install cooling measures or/and pay the associated costs will more severely experience the effects of heat and, as a result, have a higher risk of suffering energy poverty in summer. For this reason, structural modifications in the building stock and occupant behavior must be considered within the policy-making process and anticipated for northern regions, where populations and dwellings are not adapted at all, while a ramp-up of existing renovation techniques is encouraged for southern countries. In this respect, building design and refurbishment must be based on projected climate changes during the building life cycle rather than on past and present climatic data. Furthermore, a mix of methods to assess the impact of a warmer climate on cooling demand should be used rather than only one, because as this work shows, results can be quite different depending on the method used.
In conclusion, this paper shows that the effects of change in temperatures and intensity in the residential cooling demand may differ depending on the model used for the analysis and that the adaptive thermal comfort models have the potential to provide an analysis closer to the reality, as occupants’ capability to adapt to different indoor environments is considered. Furthermore, it shows that projected temperature increases for 2050 might affect people’s ability to adapt their comfort band (i.e., indoor habitability) as temperatures would be higher than the maximum admissible values for comfort and health.

Author Contributions

Conceptualization, R.C.-R., R.B. (Roberto Barrella), C.S.-G., R.B. (Ricardo Barbosa), I.K., E.P., N.S.T., D.D., J.P.G., J.K., T.A.H. and P.P.; methodology, R.C.-R., R.B. (Roberto Barrella), C.S.-G., R.B. (Ricardo Barbosa), I.K., E.P., N.S.T., D.D., J.P.G., J.K., T.A.H. and P.P.; software, C.S.-G.; validation, R.C.-R.; formal analysis, R.C.-R., R.B. (Roberto Barrella), C.S.-G. and R.B. (Ricardo Barbosa); investigation, R.C.-R., R.B. (Roberto Barrella), R.B. (Ricardo Barbosa), I.K., E.P., N.S.T., D.D., J.P.G., J.K., T.A.H. and P.P.; writing—original draft preparation, R.C.-R., R.B., R.B.; writing—review and editing, R.C.-R., R.B. (Roberto Barrella), C.S.-G., R.B. (Ricardo Barbosa), I.K., E.P., N.S.T., D.D., J.P.G., J.K., T.A.H. and P.P.; visualization, R.C.-R., E.P., N.S.T. and D.D.; supervision, R.C.-R.; project administration, R.C.-R. All authors have read and agreed to the published version of the manuscript.

Funding

The APC was funded by the COST Action ‘European Energy Poverty: Agenda Co-Creation and Knowledge Innovation’ (ENGAGER 2017–2021, CA16232) funded by European Cooperation in Science and Technology—www.cost.eu” (accessed 5 December 2020), and the EPIU- Energy poverty intelligence unit (Funded by UE-European Regional Development Fund, UIA04-212 (EPIU)—https://hogaressaludables.getafe.es/ (accessed 5 December 2020).

Institutional Review Board Statement

Not applicable.

Informed Consent Statement

Not applicable.

Data Availability Statement

No new data were created or analyzed in this study. Data sharing is not applicable to this article.

Acknowledgments

The paper stems from collaborative work within COST Action ‘European Energy Poverty: Agenda Co-Creation and Knowledge Innovation’ (ENGAGER 2017–2021, CA16232) funded by European Cooperation in Science and Technology—www.cost.eu (5 December 2020). João Pedro Gouveia and Pedro Palma acknowledge and are thankful for the support provided to CENSE by the Portuguese Foundation for Science and Technology (FCT) through the strategic project UIDB/04085/2020 and through the scholarship SFRH/BD/146732/2019 provided to Pedro). Ricardo Barbosa acknowledges the support for this work, which was partly financed by FCT/MCTES through national funds (PIDDAC) under the R&D Unit Institute for Sustainability and Innovation in Structural Engineering (ISISE), under reference UIDB/04029/2020.

Conflicts of Interest

The authors declare no conflict of interest. The funders had no role in the design of the study; in the collection, analyses, or interpretation of data; in the writing of the manuscript, or in the decision to publish the results.

References

  1. National Centers for Environmental Information. Assessing the Global Climate in July 2020; National Centers for Environmental Information: Asheville, NC, USA, 2020.
  2. EEA Global and European Temperatures. Indicator Assessment; European Environmental Agency: Copenhagen, Denmark, 2020. [Google Scholar]
  3. Masson-Delmotte, V.; Zhai, P.; Pörtner, H.-O.; Roberts, D.; Skea, J.; Shukla, P.R.; Pirani, A.; Moufouma-Okia, W.; Péan, C.; Pidcock, R.; et al. IPCC, 2018: Global Warming of 1.5 °C. An IPCC Special Report on the Impacts of Global Warming of 1.5 °C above Pre-Industrial Levels and Related Global Greenhouse Gas Emission Pathways, in the Context of Strengthening the Global Response to the Threat of Climate Change, Sustainable Development, and Efforts to Eradicate Poverty; IPCC: Geneva, Switzerland, 2019. [Google Scholar]
  4. Watts, N.; Amann, M.; Arnell, N.; Ayeb-Karlsson, S.; Belesova, K.; Boykoff, M.; Byass, P.; Cai, W.; Campbell-Lendrum, D.; Capstick, S.; et al. The 2019 report of The Lancet Countdown on health and climate change: Ensuring that the health of a child born today is not defined by a changing climate. Lancet 2019, 394, 1836–1878. [Google Scholar] [CrossRef] [Green Version]
  5. Llera-Sastresa, E.; Scarpellini, S.; Rivera-Torres, P.; Aranda, J.; Zabalza-Bribián, I.; Aranda-Usón, A. Energy vulnerability composite index in social housing, from a household energy poverty perspective. Sustainability 2017, 9, 691. [Google Scholar] [CrossRef] [Green Version]
  6. Castaño-Rosa, R.; Solís-Guzmán, J.; Rubio-Bellido, C.; Marrero, M. Towards a multiple-indicator approach to Energy Poverty in the European Union: A review. Energy Build. 2019, 193, 36–48. [Google Scholar] [CrossRef]
  7. Castaño-Rosa, R.; Solís-Guzmán, J.; Marrero, M. Energy poverty goes south? Understanding the costs of energy poverty with the index of vulnerable homes in Spain. Energy Res. Soc. Sci. 2020, 60, 101325. [Google Scholar] [CrossRef]
  8. Sanchez-Guevara, C.; Núñez Peiró, M.; Taylor, J.; Mavrogianni, A.; Neila González, J. Assessing population vulnerability towards summer energy poverty: Case studies of Madrid and London. Energy Build. 2019, 190, 132–143. [Google Scholar] [CrossRef] [Green Version]
  9. Thomson, H.; Simcock, N.; Bouzarovski, S.; Petrova, S. Energy poverty and indoor cooling: An overlooked issue in Europe. Energy Build. 2019, 196, 21–29. [Google Scholar] [CrossRef] [Green Version]
  10. Jessel, S.; Sawyer, S.; Hernández, D. Energy, Poverty, and Health in Climate Change: A Comprehensive Review of an Emerging Literature. Front. Public Health 2019, 7. [Google Scholar] [CrossRef] [Green Version]
  11. Pyrgou, A.; Santamouris, M. Increasing probability of heat-related mortality in a mediterranean city Due to urban warming. Int. J. Environ. Res. Public Health 2018, 15, 1571. [Google Scholar] [CrossRef] [Green Version]
  12. Heaviside, C.; Tsangari, H.; Paschalidou, A.; Vardoulakis, S.; Kassomenos, P.; Georgiou, K.E.; Yamasaki, E.N. Heat-related mortality in Cyprus for current and future climate scenarios. Sci. Total Environ. 2016, 569–570, 627–633. [Google Scholar] [CrossRef]
  13. Taylor, J.; Symonds, P.; Wilkinson, P.; Heaviside, C.; Macintyre, H.; Davies, M.; Mavrogianni, A.; Hutchinson, E. Estimating the Influence of Housing Energy Efficiency and Overheating Adaptations on Heat-Related Mortality in the West Midlands, UK. Atmosphere 2018, 9, 190. [Google Scholar] [CrossRef] [Green Version]
  14. Sustainable Energy for All (SEforALL). Available online: https://www.seforall.org/ (accessed on 2 December 2020).
  15. Figueiredo, R.; Nunes, P.; Panão, M.J.N.O.; Brito, M.C. Country residential building stock electricity demand in future climate—Portuguese case study. Energy Build. 2020, 209, 109694. [Google Scholar] [CrossRef]
  16. Damm, A.; Köberl, J.; Prettenthaler, F.; Rogler, N.; Töglhofer, C. Impacts of +2°C global warming on electricity demand in Europe. Clim. Serv. 2017, 7, 12–30. [Google Scholar] [CrossRef] [Green Version]
  17. Gouveia, J.P.; Fortes, P.; Seixas, J. Projections of energy services demand for residential buildings: Insights from a bottom-up methodology. Energy 2012, 47, 430–442. [Google Scholar] [CrossRef]
  18. Jankovic, A.; Podrascanin, Z.; Djurdjevic, V. Future climate change impacts on residential heating and cooling degree days in Serbia. Idojaras 2019, 123, 351–370. [Google Scholar] [CrossRef] [Green Version]
  19. Isaac, M.; van Vuuren, D.P. Modeling global residential sector energy demand for heating and air conditioning in the context of climate change. Energy Policy 2009, 37, 507–521. [Google Scholar] [CrossRef]
  20. Spinoni, J.; Vogt, J.V.; Barbosa, P.; Dosio, A.; McCormick, N.; Bigano, A.; Füssel, H.-M. Changes of heating and cooling degree-days in Europe from 1981 to 2100. Int. J. Climatol. 2018, 38, e191–e208. [Google Scholar] [CrossRef]
  21. Jakubcionis, M.; Carlsson, J. Estimation of European Union residential sector space cooling potential. Energy Policy 2017, 101, 225–235. [Google Scholar] [CrossRef]
  22. Founda, D.; Pierros, F.; Katavoutas, G.; Keramitsoglou, I. Observed Trends in Thermal Stress at European Cities with Different Background Climates. Atmosphere 2019, 10, 436. [Google Scholar] [CrossRef] [Green Version]
  23. European Commission. An EU Strategy on Heating and Cooling; European Commission: Brussels, Belgium, 2016. [Google Scholar]
  24. Birchall, S.; Wallis, I.; Churcher, D.; Pezzutto, S.; Fedrizzi, R.; Causse, E. D2.1a Survey on the Energy Needs and Architectural Features of the EU Building Stock (iNSPiRe Project); European Commission: Brussels, Belgium, 2014. [Google Scholar]
  25. Andreou, A.; Barrett, J.; Taylor, P.G.; Brockway, P.E.; Wadud, Z. Decomposing the drivers of residential space cooling energy consumption in EU-28 countries using a panel data approach. Energy Built Environ. 2020, 1, 432–442. [Google Scholar] [CrossRef]
  26. International Energy Agency. Energy Technology Perspectives 2017. Catalysing Energy Technology Transformations; International Energy Agency: Paris, France, 2017; p. 443. ISBN 9789264275973.
  27. Rózsai, M.; Wiesenthal, T.; Mantzos, L.; Neuwahl, F. The POTEnCIA Central Scenario: An EU Energy Outlook to 2050; European Commission, Joint Research Centre: Luxembourg, 2019; p. 346. [Google Scholar]
  28. Enker, R.A.; Morrison, G.M. The potential contribution of building codes to climate change response policies for the built environment. Energy Effic. 2020, 13, 789–807. [Google Scholar] [CrossRef]
  29. Bezerra, P.; da Silva, F.; Cruz, T.; Mistry, M.; Vasquez-Arroyo, E.; Magalar, L.; De Cian, E.; Lucena, A.F.P.; Schaeffer, R. Impacts of a warmer world on space cooling demand in Brazilian households. Energy Build. 2021, 234, 110696. [Google Scholar] [CrossRef]
  30. Yuan, S.; Stainsby, W.; Li, M.; Xu, K.; Waite, M.; Zimmerle, D.; Feiock, R.; Ramaswami, A.; Modi, V. Future energy scenarios with distributed technology options for residential city blocks in three climate regions of the United States. Appl. Energy 2019, 237, 60–69. [Google Scholar] [CrossRef]
  31. Van Hooff, T.; Blocken, B.; Hensen, J.L.M.; Timmermans, H.J.P. Reprint of: On the predicted effectiveness of climate adaptation measures for residential buildings. Build. Environ. 2015, 83, 142–158. [Google Scholar] [CrossRef] [Green Version]
  32. Yi, C.Y.; Peng, C. Correlating cooling energy use with urban microclimate data for projecting future peak cooling energy demands: Residential neighbourhoods in Seoul. Sustain. Cities Soc. 2017, 35, 645–659. [Google Scholar] [CrossRef] [Green Version]
  33. Hwang, R.-L.; Lin, C.-Y.; Huang, K.-T. Spatial and temporal analysis of urban heat island and global warming on residential thermal comfort and cooling energy in Taiwan. Energy Build. 2017, 152, 804–812. [Google Scholar] [CrossRef]
  34. Tettey, U.Y.A.; Dodoo, A.; Gustavsson, L. Energy use implications of different design strategies for multi-storey residential buildings under future climates. Energy 2017, 138, 846–860. [Google Scholar] [CrossRef]
  35. McGilligan, C.; Natarajan, S.; Nikolopoulou, M. Adaptive Comfort Degree-Days: A metric to compare adaptive comfort standards and estimate changes in energy consumption for future UK climates. Energy Build. 2011, 43, 2767–2778. [Google Scholar] [CrossRef] [Green Version]
  36. Roshan, G.R.; Ghanghermeh, A.A.; Attia, S. Determining new threshold temperatures for cooling and heating degree day index of different climatic zones of Iran. Renew. Energy 2017, 101, 156–167. [Google Scholar] [CrossRef] [Green Version]
  37. Ciulla, G.; D’Amico, A.; Lo Brano, V.; Traverso, M. Application of optimized artificial intelligence algorithm to evaluate the heating energy demand of non-residential buildings at European level. Energy 2019, 176, 380–391. [Google Scholar] [CrossRef]
  38. Fanger, P.O. Thermal Comfort. Analysis and Applications in Environmental Engineering; Danish Technical Press: Copenhagen, Denmark, 1970. [Google Scholar]
  39. Sadat Korsavi, S.; Montazami, A.; Brusey, J. Developing a design framework to facilitate adaptive behaviours. Energy Build. 2018, 179, 360–373. [Google Scholar] [CrossRef]
  40. Assawamartbunlue, K. An Investigation of Cooling and Heating Degree-Hours in Thailand. J. Clean Energy Technol. 2013, 87–90. [Google Scholar] [CrossRef] [Green Version]
  41. Krese, G.; Prek, M.; Butala, V. Incorporation of latent loads into the cooling degree days concept. Energy Build. 2011, 43, 1757–1764. [Google Scholar] [CrossRef]
  42. Oktay, Z.; Coskun, C.; Dincer, I. A new approach for predicting cooling degree-hours and energy requirements in buildings. Energy 2011, 36, 4855–4863. [Google Scholar] [CrossRef]
  43. Kyritsi, E.; Michael, A. An assessment of the impact of natural ventilation strategies and window opening patterns in office buildings in the mediterranean basin. Build. Environ. 2020, 175, 106384. [Google Scholar] [CrossRef]
  44. Papakostas, K.; Kyriakis, N. Heating and cooling degree-hours for Athens and Thessaloniki, Greece. Renew. Energy 2005, 30, 1873–1880. [Google Scholar] [CrossRef]
  45. Chiesa, G.; Grosso, M. The Influence of Different Hourly Typical Meteorological Years on Dynamic Simulation of Buildings. Energy Procedia 2015, 78, 2560–2565. [Google Scholar] [CrossRef] [Green Version]
  46. Harvey, L.D.D. Using modified multiple heating-degree-day (HDD) and cooling-degree-day (CDD) indices to estimate building heating and cooling loads. Energy Build. 2020, 229, 110475. [Google Scholar] [CrossRef]
  47. Arnfield, A.J. Köppen Climate Classification; Encyclopædia Britannica, Inc.: Chicago, IL, USA, 2020. [Google Scholar]
  48. Eurostat, the Statistical Office of the European Union. Energy Statistics—Cooling and Heating Degree Days; E5: Energy Statistics. Eurostat: Luxembourg. Available online: https://ec.europa.eu/eurostat/cache/metadata/en/nrg_chdd_esms.htm (accessed on 2 December 2020).
  49. Approved American National Standard ANSI/ASHRAE 55-2017. Thermal Environmental Conditions for Human Occupancy; ASHRAE: Atlanta, GA, USA, 2017; p. 59.
  50. Department of Meteorology (Ministry of Agriculture). The Climate of Cyprus. Available online: http://www.moa.gov.cy/moa/ms/ms.nsf/DMLcyclimate_en/DMLcyclimate_en?OpenDocument (accessed on 22 July 2020).
  51. Lelieveld, J.; Hadjinicolaou, P.; Kostopoulou, E.; Chenoweth, J.; El Maayar, M.; Giannakopoulos, C.; Hannides, C.; Lange, M.A.; Tanarhte, M.; Tyrlis, E.; et al. Climate change and impacts in the Eastern Mediterranean and the Middle East. Clim. Chang. 2012, 114, 667–687. [Google Scholar] [CrossRef] [Green Version]
  52. Mikkonen, S.; Laine, M.; Mäkelä, H.M.; Gregow, H.; Tuomenvirta, H.; Lahtinen, M.; Laaksonen, A. Trends in the average temperature in Finland, 1847–2013. Stoch. Environ. Res. Risk Assess. 2015, 29, 1521–1529. [Google Scholar] [CrossRef] [Green Version]
  53. Ruosteenoja, K.; Jylhä, K.; Kämäräinen, M. Climate Projections for Finland under the RCP Forcing Scenarios. Geophysica 2016, 51, 17–50. [Google Scholar]
  54. Karl E., T.; Stouffer, R.; Gerald A., M. An overview of CMIP5 and the Experiment Design. Bull. Am. Meteorol. Soc. 2011, 93, 485–498. [Google Scholar] [CrossRef] [Green Version]
  55. Mamara, A.; Chatziapostolou, E.; Karatarakis, N. Annual Bulletin on the Climate in Greece 2019; Hellenic National Meteorological Service: Athens, Greece, 2019.
  56. Israel Government Meteorological Data. Available online: https://ims.data.gov.il/he/ims/2 (accessed on 26 July 2020).
  57. Cohen, P.; Shashua-Bar, L.; Keller, R.; Gil-Ad, R.; Yaakov, Y.; Lukyanov, V.; Bar (Kutiel), P.; Tanny, J.; Cohen, S.; Potchter, O. Urban outdoor thermal perception in hot arid Beer Sheva, Israel: Methodological and gender aspects. Build. Environ. 2019, 160, 106169. [Google Scholar] [CrossRef]
  58. NOAA—National Oceanic and Atmospheric Administration. Global Climate Report—Annual 2019; National Oceanic and Atmospheric Administration: Washington, DC, USA, 2019.
  59. Castro, M.; Martin-Vide, J.; Alonso, S. The climate of Spain: Past, present and scenarios for the 21st century. In A Preliminary General Assessment of the Impacts in Spain Due to the Effects of Climate Change; Spanish Ministry of Environment: Madrid, Spain, 2005; pp. 1–62. [Google Scholar]
  60. Ministry of Economic Affairs and Employment, Ministry of the Environment, Ministry of Agriculture and Forestry, Ministry of Transport and Communications, M. of F. Finland’s Integrated Energy and Climate Plan; Ministry of Economic Affairs and Employment 2019; Ministry of Economic Affairs and Employment: Helsinki, Finland, 2019.
  61. Statistical Office of Slovak Republic (SOBD). Census of Population, Houses and Dwellings; Statistical Office of Slovak Republic: Bratislava, Slovakia, 2011.
  62. Economidou, M.; Zangheri, P.; Müller, A.; Kranzl, L. Financing the renovation of the Cypriot building stock: An assessment of the energy saving potential of different policy scenarios based on the INVERT/EE-lab model. Energies 2018, 11, 3071. [Google Scholar] [CrossRef] [Green Version]
  63. Hellenic Statistical Authority. Census of Building Stock; Hellenic Statistical Authority: Pireas, Greece, 2015.
  64. Instituto Nacional de Estadísticas (INE) [Spanish National Statistic Institute]; Population and Housing Census. Available online: https://www.ine.es/censos2011_datos/cen11_datos_inicio.htm (accessed on 5 February 2021).
  65. European Commission Long-term renovation strategy 2020–2050 Finland. Article 2a of Directive (2010/31/EU); European Commission: Brussels, Belgium, 2020. [Google Scholar]
  66. Instituto Nacional de Estatística. Population and Housing Census; Instituto Nacional de Estatística Statistics: Lisbon, Portugal, 2011. Available online: www.ine.pt (accessed on 5 February 2021).
  67. European Parliament; Council of the European Union. Directive (EU) 2018/844 of the European Parliament and of the Council of 30 May 2018 Amending Directive 2010/31/EU on the Energy Performance of Buildings and Directive 2012/27/EU on Energy Efficiency; European Parliament: Brussels, Belgium, 2018. [Google Scholar]
  68. The European Parliament; The Council of the European Union. Directive 2012/27/EU of the European Parliament and of the Council of 25 October 2012 on Energy Efficiency 2012. Off. J. Eur. Union 2012, L315-1, 12–33. [Google Scholar]
  69. European Commission Long-Term Renovation Strategies. Available online: https://ec.europa.eu/energy/topics/energy-efficiency/energy-efficient-buildings/long-term-renovation-strategies_en?redir=1 (accessed on 27 July 2020).
  70. SEC. Certificar é Valorizar. Certificação Energética dos Edifícios [Energy Certification of Buildings]. Available online: https://www.sce.pt/certificacao-energetica-de-edificios-3/consumidores/ (accessed on 6 December 2020).
  71. Israel Ministry of Environmental Protection. Standard SI 5282; The Standards Institution of Israel (SII): Jerusalem, Israel, 2005.
  72. International Energy Agency. The Future of Cooling. Opportunities for Energy-Efficient Air Conditioning, Paris. 2018. Available online: https://www.iea.org/reports/the-future-of-cooling (accessed on 26 November 2020).
  73. Randazzo, T.; De Cian, E.; Mistry, M.N. Air conditioning and electricity expenditure: The role of climate in temperate countries. Econ. Model. 2020, 90, 273–287. [Google Scholar] [CrossRef]
  74. The Minister of the Environment. 1010/2017 Decree of the Ministry of the Environment on the Energy Performance of New Buildings. Ministry of Economic Affairs and Employment of Finland: Helsinki, Finland, 2017; p. 18. [Google Scholar]
  75. Republic of Cyprus; Percentage of Households with AC Units. Available online: https://www.mof.gov.cy/mof/cystat/statistics.nsf/index_en/index_en?OpenDocument (accessed on 27 July 2020).
  76. Hellenic Statistical Authority. Press Release: Survey on Energy Consumption in Households, 2011–2012; Hellenic Statistical Authority: Athens, Greece, 2013.
  77. The State of Israel Central Bureau of Statistics. Available online: https://old.cbs.gov.il/reader/cw_usr_view_Folder?ID=141 (accessed on 6 December 2020).
  78. Statistics Portugal Instituto Nacional de Estadísticas (INE). Available online: https://www.ine.pt/xportal/xmain?xpid=INE&xpgid=ine_publicacoes&PUBLICACOESpub_boui=298558245&PUBLICACOESmodo=2&xlang=pt (accessed on 27 July 2020).
  79. Filčák, R.; Dokupilová, D. Concept of energy poverty in Slovakia. Progn. PRÁCE—PP (FORESIGHT, Anal. Recomm. - FAR) 2019, 11. [Google Scholar] [CrossRef]
  80. Instituto Nacional de Estadísticas (INE) [Spanish National Statistic Institute]. Porcentaje de Viviendas que Disponen de Aire Acondicionado [Share of Households with air Conditioning]. Available online: https://www.ine.es/jaxi/Datos.htm?path=/t25/p500/2008/p01/l0/&file=01013c.px#!tabs-tabla (accessed on 27 July 2020).
  81. European Commission. European Union Statistics on Income and Living Conditions (EU-SILC); European Commission: Brussels, Belgium, 2020. [Google Scholar]
  82. Simcock, N.; Thomson, H.; Petrova, S.; Bouzarovski, S. Heatwaves Can Kill—Research Uncovers the Homes Most Vulnerable to Overheating; The University of Manchester: Manchester, UK, 2020. [Google Scholar]
  83. Castaño-Rosa, R.; Pelsmakers, S.; Sukanen, H. Rethinking the building environment: Climate change mitigation and adaptation in a Nordic climate. In Proceedings of the Beyond 2020, World Sustainable Built Environment Conference, Gothenburg, Sweden, 2–4 November 2020; p. 6. [Google Scholar]
  84. Gouveia, J.P.; Seixas, J.; Mestre, A. Daily electricity consumption profiles from smart meters - Proxies of behavior for space heating and cooling. Energy 2017, 141, 108–122. [Google Scholar] [CrossRef]
  85. Dokupilová, D.; Gerbery, D.; Filčák, R. Energetická Chudoba na Slovensku 2020: Od Analýz k Odporúčaniam pre Verejné Politiky; SAV: Bratislava, Slovenská, 2020. [Google Scholar]
  86. Nakicenovic, N.; Swart, R. IPCC Emissions Scenarios; Cambridge University Press: Cambridge, UK, 2000; p. 570. Available online: https://www.ipcc.ch/report/emissions-scenarios/ (accessed on 26 November 2020).
  87. Meteotest Meteonorm. Available online: https://meteonorm.com/en/meteonorm-features (accessed on 1 August 2020).
  88. Remund, J.; Müller, S.; Schilter, C.; Rihm, B. The use of Meteonorm weather generator for climate change studies. In Proceedings of the EMS Annual Meeting Abstract, Zurich, Switzerland, 13–17 September 2010; p. 7. [Google Scholar]
  89. van Vuuren, D.P.; Edmonds, J.; Kainuma, M.; Riahi, K.; Thomson, A.; Hibbard, K.; Hurtt, G.C.; Kram, T.; Krey, V.; Lamarque, J.-F.; et al. The representative concentration pathways: An overview. Clim. Chang. 2011, 109, 5. [Google Scholar] [CrossRef]
  90. Stocker, T.F.; Qin, D.; Plattner, G.-K.; Tignor, M.; Allen, S.K.; Boschung, J.; Nauels, A.; Xia, Y.; Bex, V.; Midgley, P.M. Climate Change 2013: The Physical Science Basis. Contribution of Working Group I to the Fifth Assessment Report of the Intergovernmental Panel on Climate Change; IPCC: Cambridge, UK; New York, NY, USA, 2013. [Google Scholar]
  91. Solomon, S.; Qin, D.; Manning, M.; Chen, Z.; Marquis, M.; Averyt, K.B.; Tignor, M.; Miller, H. Summary for Policymakers. In Climate Change 2007: The Physical Science Basis. Contribution of Working Group I to the Fourth Assessment Report of the Intergovernmental Panel on Climate Change; IPCC: Cambridge, UK; New York, NY, USA, 2007. [Google Scholar]
  92. Aebischer, B.; Jakob, M.; Catenazzi, G. Impact of climate change on thermal comfort, heating and cooling energy demand in Europe. In Proceedings of the ECEEE Summer Study, La Colle sur Loup, Côte d‘Azur, France, 4–9 June 2007; pp. 859–870. [Google Scholar]
  93. Larsen, M.A.D.; Petrović, S.; Radoszynski, A.M.; McKenna, R.; Balyk, O. Climate change impacts on trends and extremes in future heating and cooling demands over Europe. Energy Build. 2020, 226, 110397. [Google Scholar] [CrossRef]
  94. Atsalis, A.; Mirasgedis, S.; Tourkolias, C.; Diakoulaki, D. Fuel poverty in Greece: Quantitative analysis and implications for policy. Energy Build. 2016, 131. [Google Scholar] [CrossRef]
  95. Schünemann, C.; Olfert, A.; Schiela, D.; Gruhler, K.; Ortlepp, R. Mitigation and adaptation in multifamily housing: Overheating and climate justice. Build. Cities 2020, 1, 36–55. [Google Scholar] [CrossRef]
  96. Eskeland, G.S.; Mideksa, T.K. Electricity demand in a changing climate. Mitig. Adapt. Strateg. Glob. Chang. 2010, 15, 877–897. [Google Scholar] [CrossRef]
  97. Chen, D. Overheating in residential buildings: Challenges and opportunities. Indoor Built Environ. 2019, 28, 1303–1306. [Google Scholar] [CrossRef]
  98. European Commission. A Renovation Wave for Europe—Greening Our Buildings, Creating Jobs, Improving Lives; European Commission: Brussels, Belgium, 2020; p. 27. [Google Scholar]
  99. Barrella, R.; Priego, I.; Linares, J.I.; Arenas, E.; Romero, J.C.; Centeno, E. Feasibility Study of a Centralised Electrically Driven Air Source Heat Pump Water Heater to Face Energy Poverty in Block Dwellings in Madrid (Spain). Energies 2020, 13, 2723. [Google Scholar] [CrossRef]
Figure 1. Location of the analyzed cities overlaid with the Köppen-Geiger climate classification (authors’ contribution).
Sustainability 13 02987 g001
Figure 2. Minimum and maximum temperatures for each city in 2019 [55,56,57,58,59,60,61].
Sustainability 13 02987 g002
Figure 3. CDD values for 2020 and 2050 according to the Eurostat and adaptive thermal comfort methods (authors’ contribution).
Sustainability 13 02987 g003
Figure 4. CDD values for 2020 by using the adaptive thermal comfort and Eurostat methods (authors’ contribution).
Sustainability 13 02987 g004
Figure 5. CDH values for 2020 and 2050 according to the Eurostat and adaptive thermal comfort methods (authors’ contribution).
Sustainability 13 02987 g005
Figure 6. CDH values for 2020 by using the adaptive thermal comfort and Eurostat methods (authors’ contribution).
Sustainability 13 02987 g006
Figure 7. Adaptive and Eurostat CDD and CDH values variation between 2020 and 2050 (authors’ contribution).
Sustainability 13 02987 g007
Table 1. Share of EPC in the residential sector in 2019 [67,68,69].
CountryShare of EPC (%)Total (%)
ABCD or Lower
Cyprus----10.0
Finland32.068.044.8
Greece2.935.761.421.8
Israel-----
Portugal11.917.523.047.728.4
Slovakia8.867.818.05.418.0
Spain0.41.23.894.513.0
Table 2. Share of households with AC in 2017.
Cyprus [75]FinlandGreece [76]Israel [77]Portugal [78]Slovakia [79]Spain [80]
84.0%N/A59.5%92.0%13.8%13.8%35.5%
Table 3. Share of households who live in a dwelling not comfortable cool in summer, 2012 [80].
CyprusGreeceFinlandIsraelPortugalSlovakiaSpain
28.2%34.0%25.2%25.0%35.7%21.0%25.6%
Note that, according to a survey carried out by Dokupilová et al. [85] in June 2020, 40% of households were living in a dwelling not comfortably cool in summer, highlighting over two-fold increase in the share of households in the last 7 years.
Table 4. Summary of results and main building characteristics in the studied cities (authors’ contribution).
% CDD Change% CDH ChangeUncomfortable in Summer (%)Share Households with AC (%)Built before 1980 (%)
EurostatAdaptiveEurostatAdaptive
CyprusPaphos55878419128.284.040.0
FinlandOulu0020823525.2N/A53.8
Sodankylä008254
Turku00142302
GreeceAthens1084596410034.059.558.4
Thessaloniki7877969112
Tripoli481703948
IsraelGilat22123182625.092.080.0
PortugalLisbon9971615635.713.853.5
Oporto911519469
SlovakiaBratislava81126324321.013.867.0
Trebisov6141118
Poprad002416
SpainGranada1110131025.635.554.1
Leon651123129
Madrid572543542
Oviedo135013979
Pamplona1251326780
Sevilla14231012
Publisher’s Note: MDPI stays neutral with regard to jurisdictional claims in published maps and institutional affiliations.

