
Emergy-Based Assessment and Suggestions for Sustainable Development of Regional Ecological Economy: A Case Study of Anhui Province, China


Abstract
:1. Introduction
2. Emergy Model and Evaluation Index
2.1. Method
2.2. Evaluation Index
2.2.1. Structural Index
- (1)
- Emergy self-sufficiency ratio (ESR) is the ratio of the local emergy input to the total input energy of a region. The formula is
- (2)
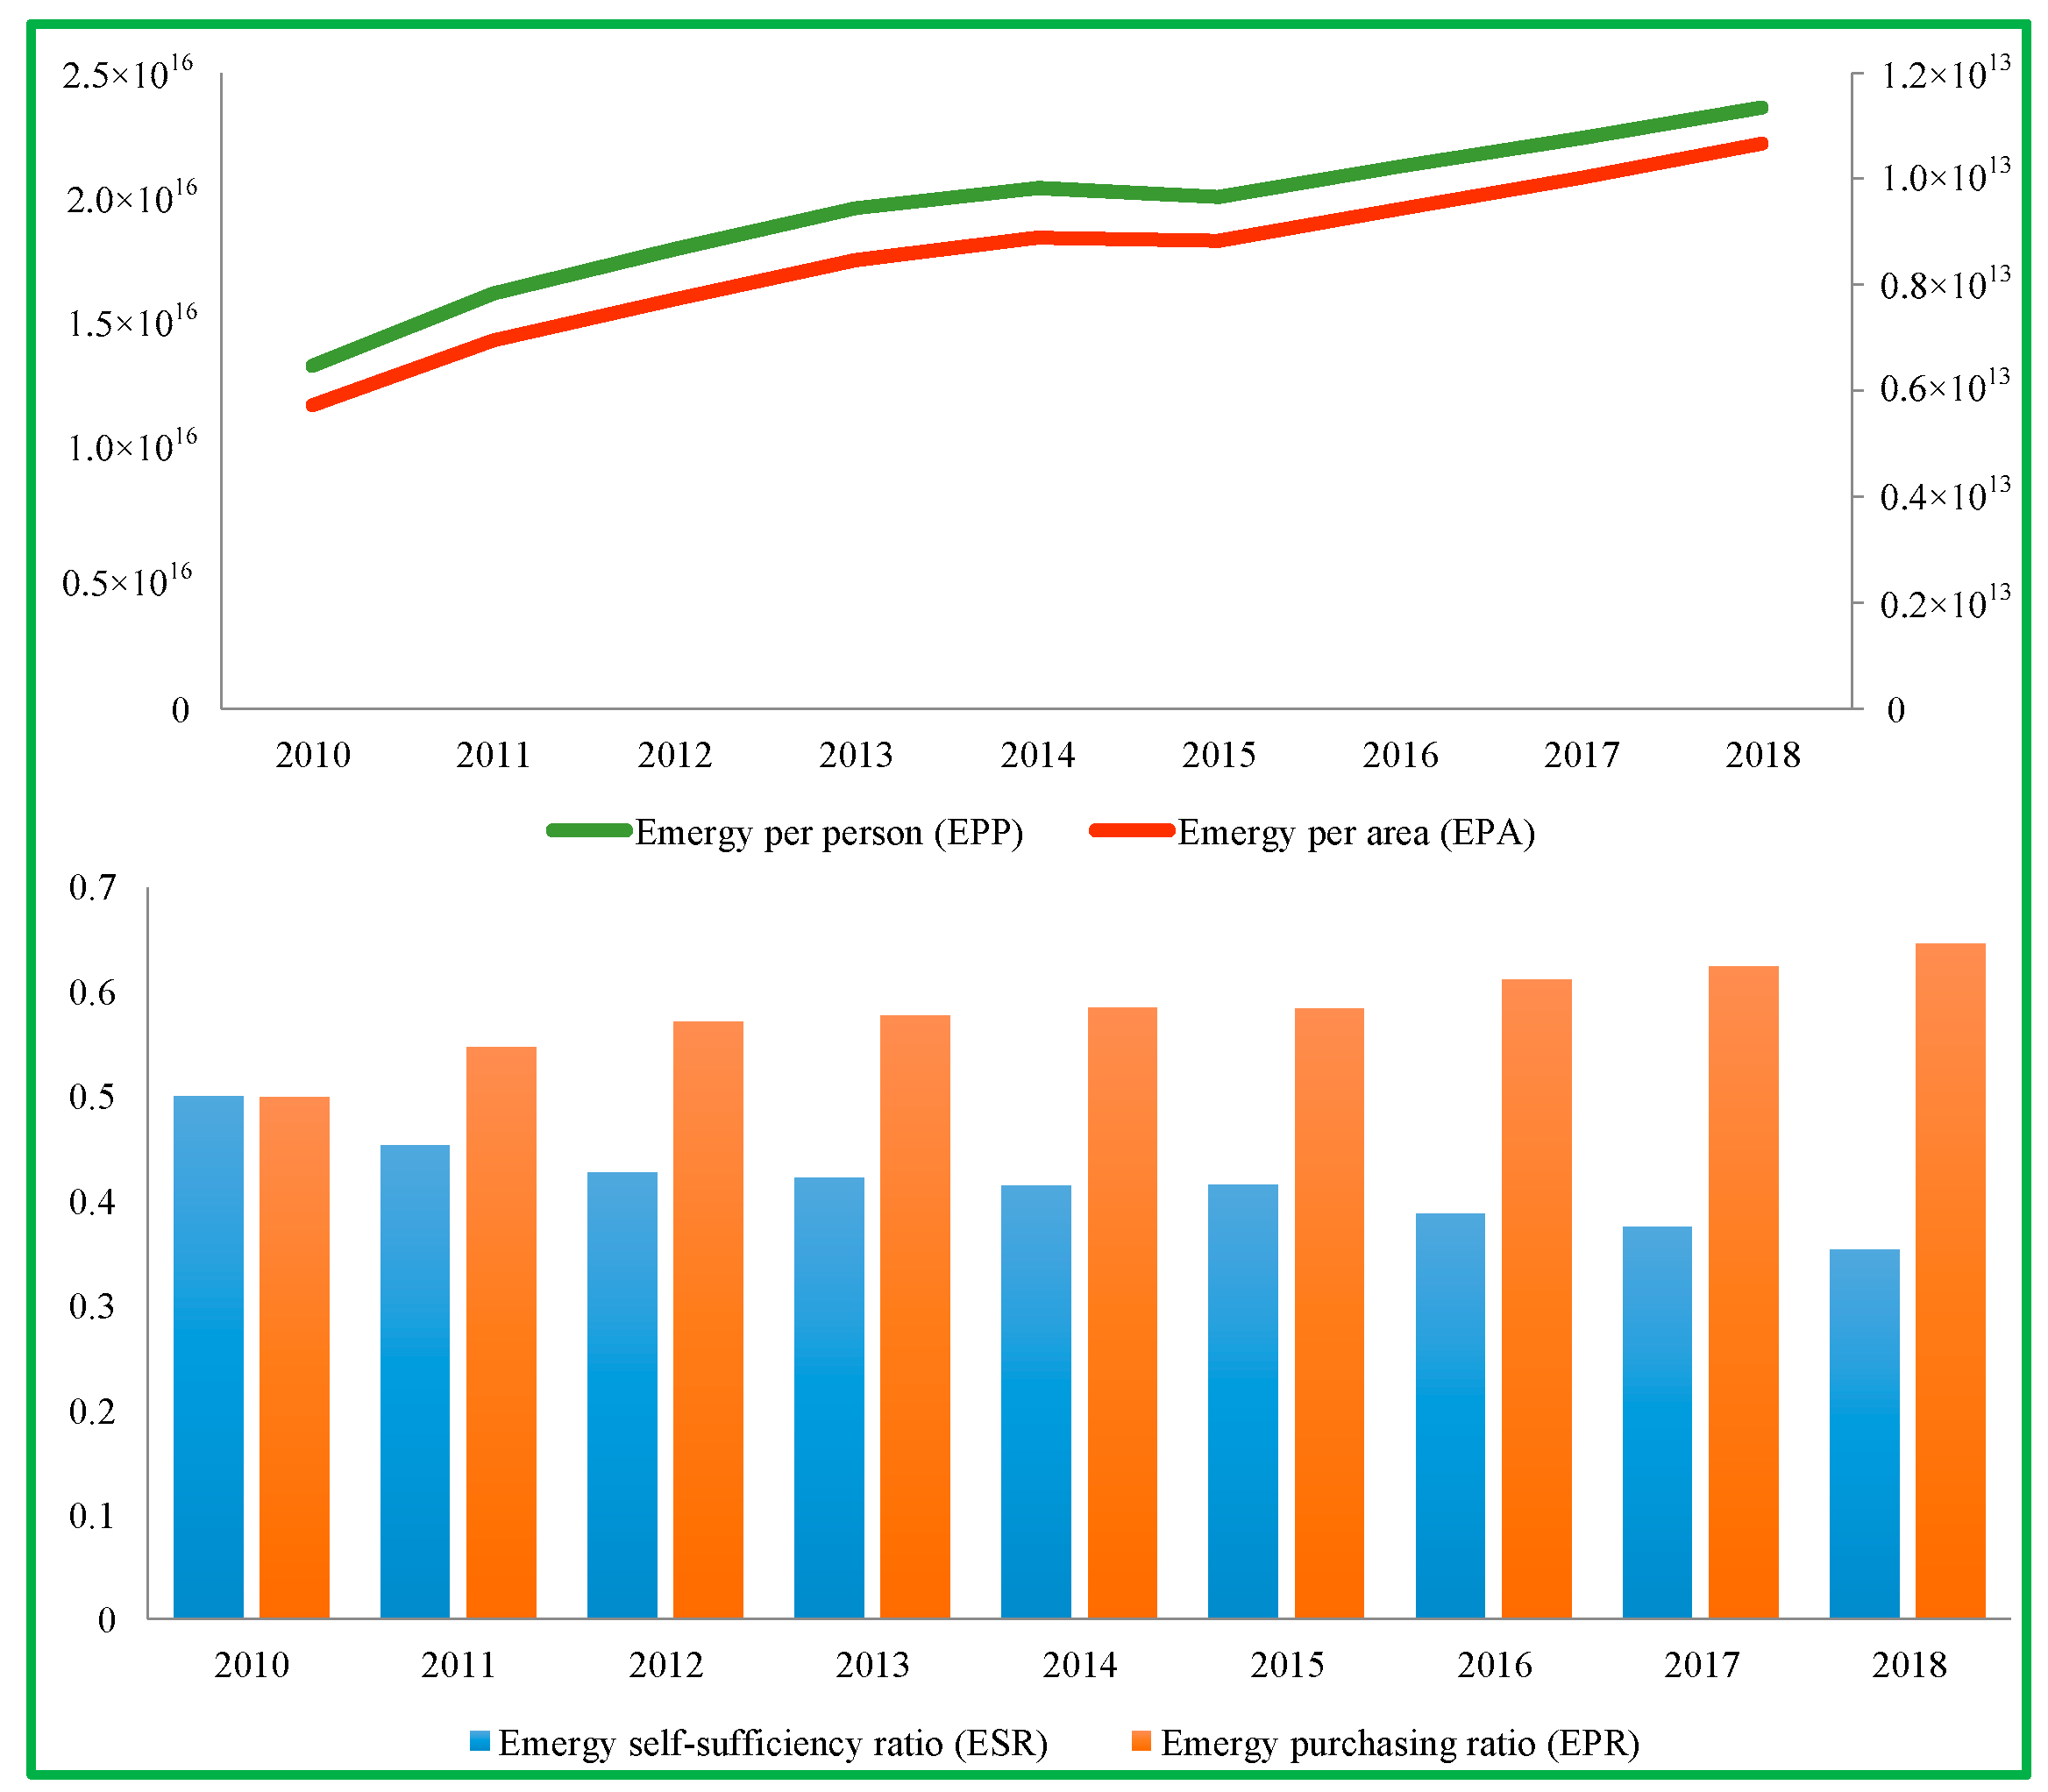
- Emergy purchasing ratio (EPR) is the ratio of the emergy input from outside the region to the total energy input from the region.
- (3)
- Emergy per area (EPA) refers to the ratio of the total emergy utilization of a region to the land area of this region.
- (4)
- Emergy per person (EPP) refers to the per capita utilization of emergy in a region, which is an index to evaluate people’s standard of living. The calculation formula is as follows:
2.2.2. Functional Index
- (1)
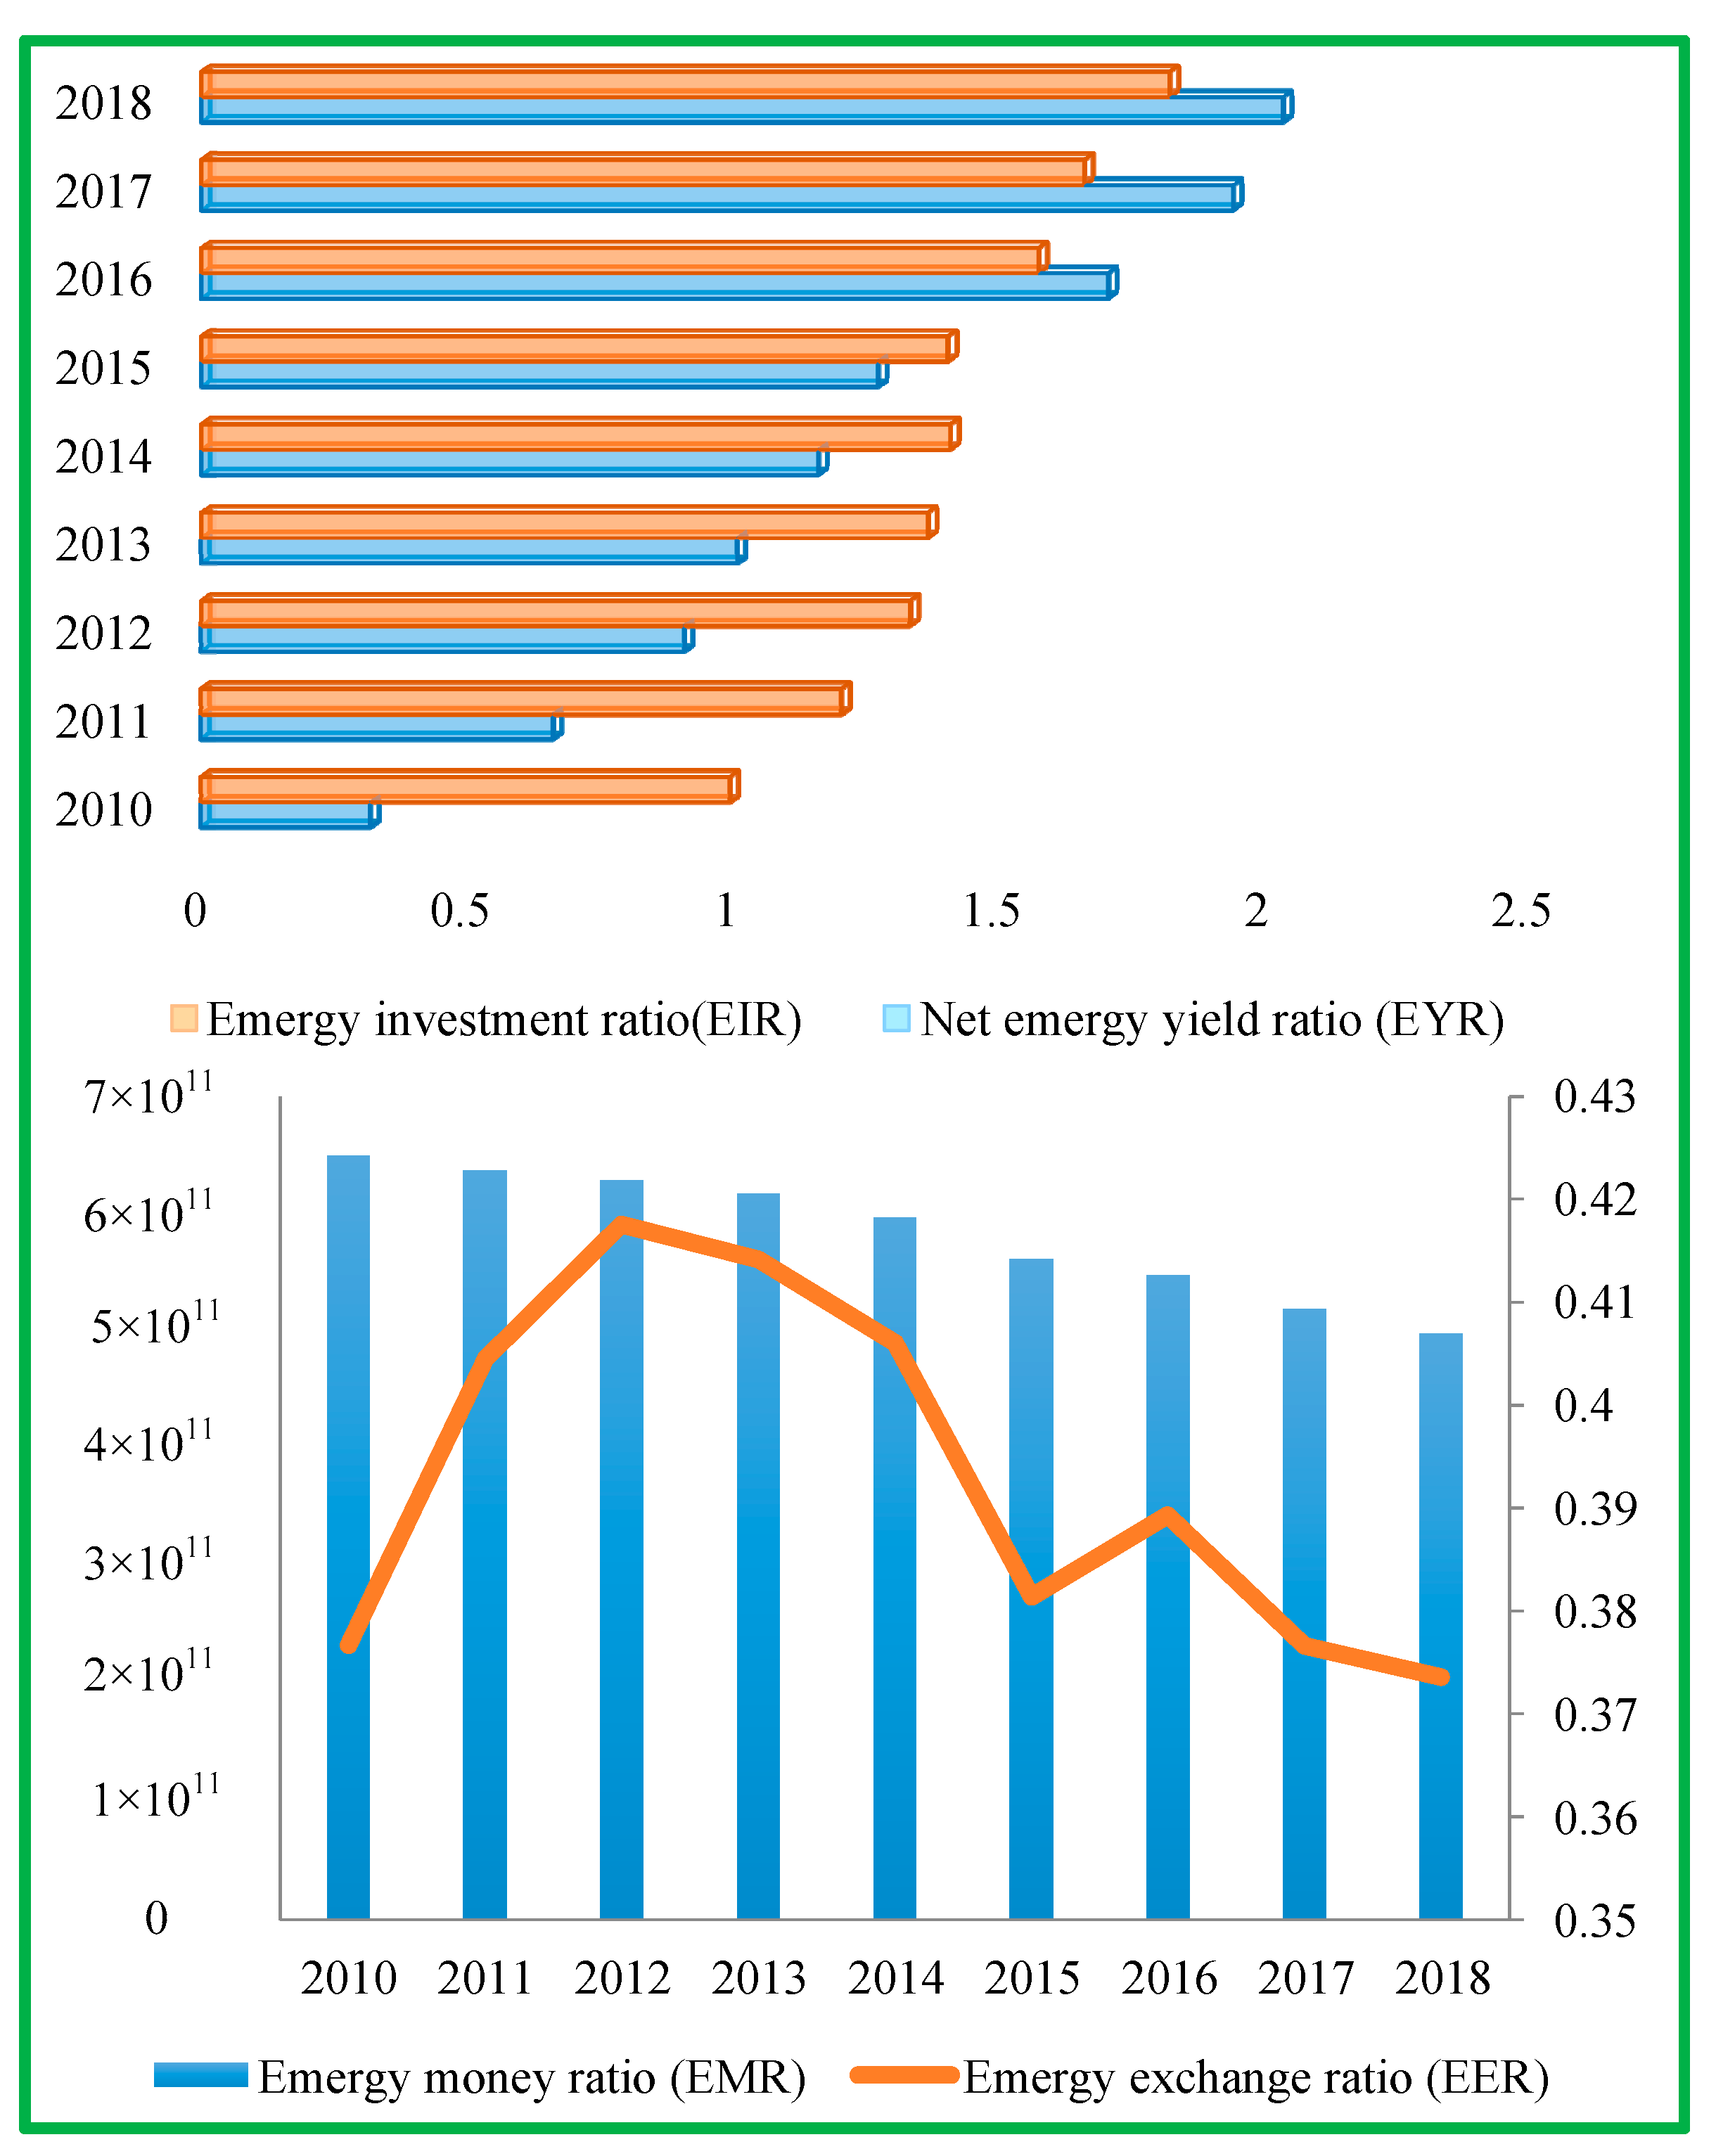
- Emergy money ratio (EMR) refers to the amount of emergy corresponding to the unit currency of a region, that is, the value of wealth measured by emergy. The calculation formula is the total emergy of the region in the current year divided by the industrial added value, which can be expressed as
- (2)
- Net emergy yield ratio (EYR) is the ratio of region output emergy to region external input emergy, where output emergy refers to the net output of all kinds of emergy generated through labor production in the region minus all kinds of wastes. The calculation formula is as follows:
- (3)
- Emergy investment ratio (EIR) is the ratio of emergy from economic feedback to that from natural environment input.
- (4)
- Emergy exchange ratio (EER) refers to the ratio of commodity emergy (the emergy obtained by the buyer) to the emergy of the currency paid by the buyer. When measuring the gain and loss of regional foreign trade, EER is expressed as the ratio of emergy obtained while trading to the emergy output. Its expression can be described as
2.2.3. Ecological Efficiency Index
- (1)
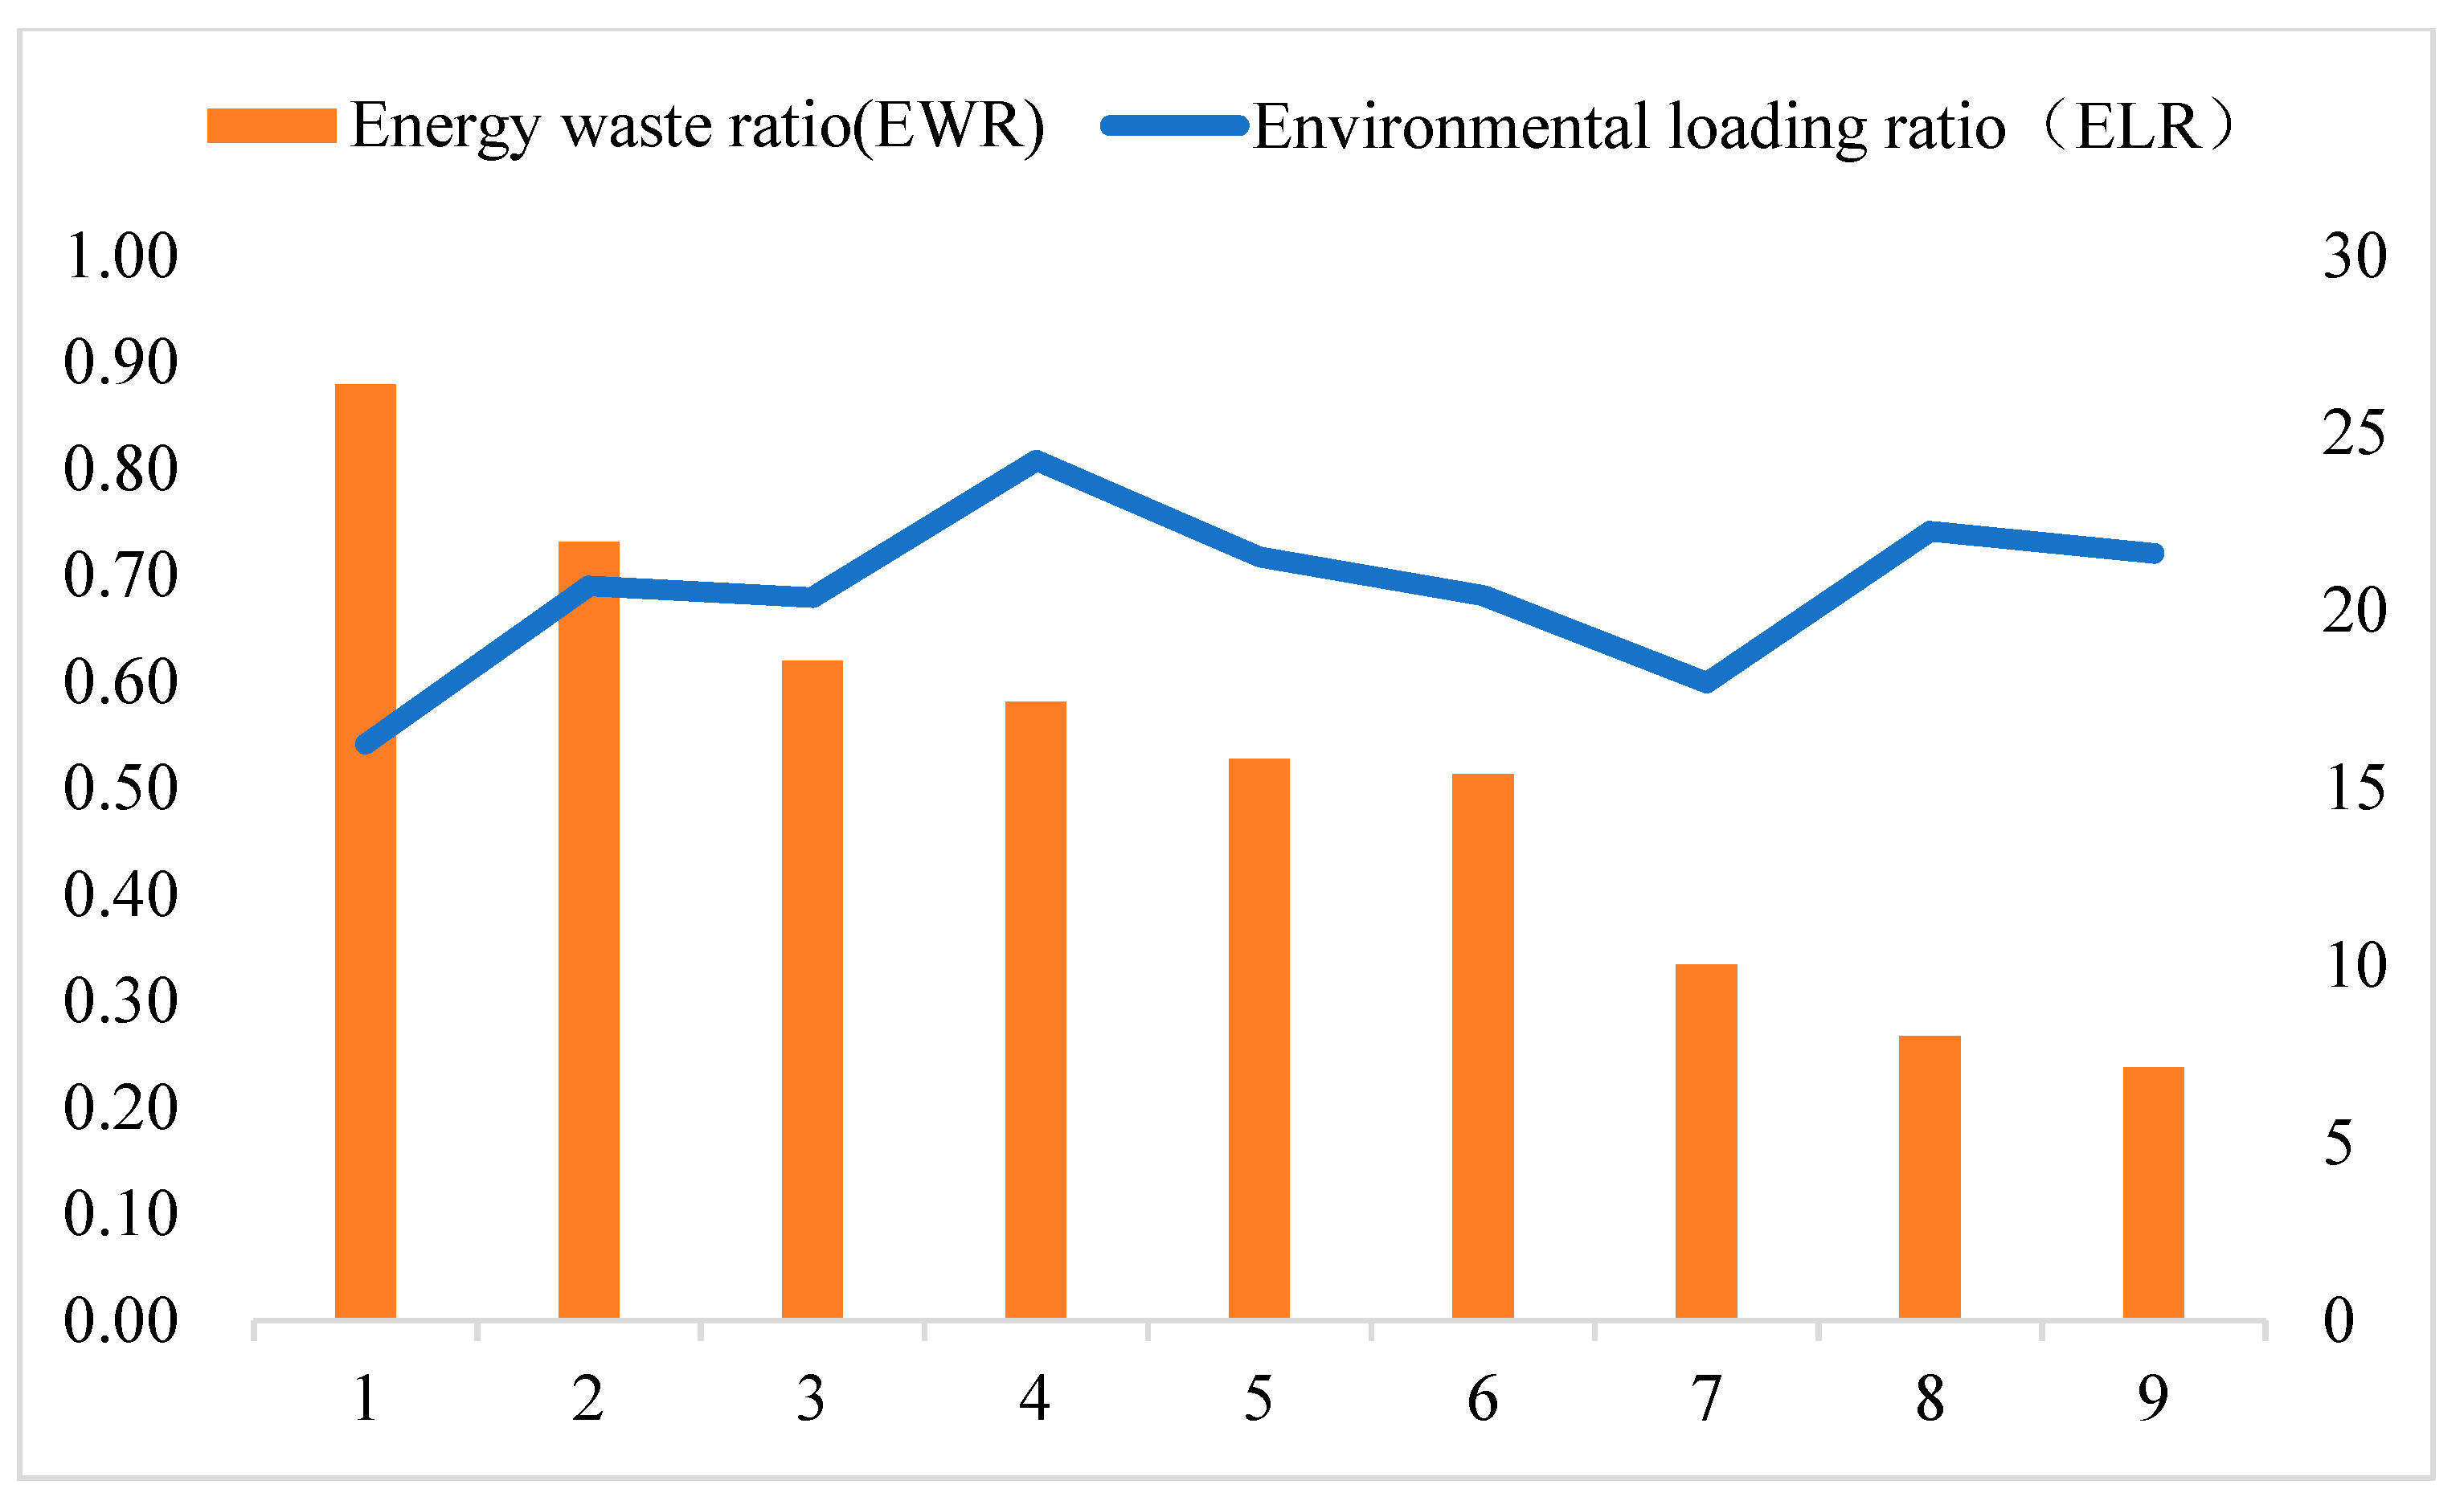
- Environmental loading ratio (ELR) is the ratio of the total input of non-renewable emergy to the total input of renewable emergy.
- (2)
- Emergy waste ratio (EWR) refers to the ratio of the emergy value of waste generated in the process of regional economic activities to the total emergy value of the system, that is,
2.2.4. Sustainable Development Index
3. Eco-Economic System Evaluation of Anhui Province
3.1. Background of Anhui Province
3.2. Data Calculation and Results
3.3. Index Evaluation and Analysis
3.4. Management Suggestions
4. Conclusions
Author Contributions
Funding
Institutional Review Board Statement
Informed Consent Statement
Data Availability Statement
Acknowledgments
Conflicts of Interest
References
- Fan, Y.; Fang, C.; Zhang, Q. Coupling coordinated development between social economy and ecological environment in Chinese provincial capital cities-assessment and policy implications. J. Clean. Prod. 2019, 229, 289–298. [Google Scholar] [CrossRef]
- Scherer, L.; Behrens, P.; de Koning, A.; Heijungs, R.; Sprecher, B.; Tukker, A. Trade-offs between social and environmental Sustainable Development Goals. Environ. Sci. Policy 2018, 90, 65–72. [Google Scholar] [CrossRef]
- Jing, Z.; Wang, J. Sustainable development evaluation of the society–economy–environment in a resource-based city of China:A complex network approach. J. Clean. Prod. 2020, 263, 121510. [Google Scholar] [CrossRef]
- Lin, B.; Zhu, J. Impact of energy saving and emission reduction policy on urban sustainable development: Empirical evidence from China. Appl. Energy 2019, 239, 12–22. [Google Scholar] [CrossRef]
- Gao, S.; Zhang, H. Urban planning for low-carbon sustainable development. Sustain. Comput. Inform. Syst. 2020, 28, 100398. [Google Scholar] [CrossRef]
- Li, X.; Yang, H.; Jia, J.; Shen, Y.; Liu, J. Index system of sustainable rural development based on the concept of ecological livability. Environ. Impact Assess. Rev. 2021, 86, 106478. [Google Scholar] [CrossRef]
- Chang, Y.; Hou, K.; Wu, Y.P.; Li, X.X.; Zhang, J.L. A conceptual framework for establishing the index system of ecological envi-ronment evaluation-A case study of the upper Hanjiang River, China. Ecol. Ind. 2019, 107, 105568. [Google Scholar] [CrossRef]
- Wang, C.; Wang, L.; Dai, S.F. An indicator approach to industrial sustainability assessment: The case of China’s Capital Economic Circle. J. Clean. Prod. 2018, 194, 473–482. [Google Scholar] [CrossRef]
- Nilashi, M.; Rupani, P.F.; Rupani, M.M.; Kamyab, H.; Shao, W.; Ahmadi, H.; Rashid, T.A.; Aljojo, N. Measuring sustainability through ecological sustainability and human sustainability: A machine learning approach. J. Clean. Prod. 2019, 240, 118162. [Google Scholar] [CrossRef]
- Wei, Y.G.; Li, Y.; Wu, M.Y.; Li, Y.B. Progressing sustainable development of “the Belt and Road countries”: Estimating envi-ronmental efficiency based on the Super-slack-based measure model. Sustain. Dev. 2019, 28, 521–539. [Google Scholar] [CrossRef]
- Hou, Y.; Long, R.; Zhang, L.; Wu, M. Dynamic analysis of the sustainable development capability of coal cities. Resour. Policy 2020, 66, 101607. [Google Scholar] [CrossRef]
- Zhou, C.; Shi, C.; Wang, S.; Zhang, G. Estimation of eco-efficiency and its influencing factors in Guangdong province based on Super-SBM and panel regression models. Ecol. Indic. 2018, 86, 67–80. [Google Scholar] [CrossRef]
- Zhang, J.R.; Zeng, W.H.; Wang, J.N.; Yang, F.L.; Jiang, H.Q. Regional low-carbon economy efficiency in China: Analysis based on the Super-SBM model with CO2 emissions. J. Clean. Prod. 2017, 163, 202–211. [Google Scholar] [CrossRef]
- Zhang, J.; Ma, L.; Yan, Y. A Dynamic Comparison Sustainability Study of Standard Wastewater Treatment System in the Straw Pulp Papermaking Process and Printing & Dyeing Papermaking Process Based on the Hybrid Neural Network and Emergy Framework. Water 2020, 12, 1781. [Google Scholar] [CrossRef]
- Yang, W.; Lu, Z.; Wang, D.; Shao, Y.; Shi, J. Sustainable Evolution of China’s Regional Energy Efficiency Based on a Weighted SBM Model with Energy Substitutability. Sustainability 2020, 12, 10073. [Google Scholar] [CrossRef]
- Moroke, T.; Schoeman, C.; Schoeman, I. Developing a neighbourhood sustainability assessment model: An ap-proach to sustainable urban development. Sustain. Cities Soc. 2019, 48, 101433. [Google Scholar] [CrossRef]
- Allen, C.; Nejdawi, R.; El-Baba, J.; Hamati, K.; Metternicht, G.; Wiedmann, T. Indicator-based assessments of progress towards the sustainable development goals (SDGs): A case study from the Arab region. Sustain. Sci. 2017, 12, 975–989. [Google Scholar] [CrossRef]
- Maksimova, O.A.; Ledashcheva, T.N.; Shcherbakova, N.S. Prospects for Sustainable Development of Kazan Considering the Assessment of Key Indicators. IOP Conf. Series: Earth Environ. Sci. 2020, 459, 4. [Google Scholar] [CrossRef] [Green Version]
- Huan, Y.; Liang, T.; Li, H.; Zhang, C. A systematic method for assessing progress of achieving sustainable development goals: A case study of 15 countries. Sci. Total. Environ. 2021, 752, 141875. [Google Scholar] [CrossRef]
- Mateusz, P.; Danuta, M.; Malgorzata, L.; Mariusz, B.; Kesra, N. TOPSIS and VIKOR methods in study of sustainable development in the EU countries. Proc. Comp. Sci. 2018, 126, 1683–1692. [Google Scholar] [CrossRef]
- Odum, T. Environmental Accounting: Emergy and Environ-Mental Decision Making; Wiley: Hoboken, NJ, USA, 1996. [Google Scholar]
- Tang, M.; Hong, J.; Wang, X.; He, R. Sustainability accounting of neighborhood metabolism and its applications for urban renewal based on emergy analysis and SBM-DEA. J. Environ. Manag. 2020, 275, 111177. [Google Scholar] [CrossRef] [PubMed]
- Spagnolo, S.; Chinellato, G.; Cristiano, S.; Zucaro, A.; Gonella, F. Sustainability assessment of bioenergy at different scales: An emergy analysis of biogas power production. J. Clean. Prod. 2020, 277, 124038. [Google Scholar] [CrossRef]
- Zhang, J.; Wang, S.; Yang, P.; Fan, F.; Wang, X. Analysis of Scale Factors on China’s Sustainable Development Efficiency Based on Three-Stage DEA and a Double Threshold Test. Sustainability 2020, 12, 2225. [Google Scholar] [CrossRef] [Green Version]
- Cortés-Martínez, R.; Font Prieur, D.Y.; Lobelles Sardiñas, G.O. Evaluation of gas fractionation in the re-finerÍa cienfuegos S.A sustainability through emergy analysis. Centro Azúcar 2020, 6, 74–85. [Google Scholar]
- Ali, M.; Liu, L.; Geng, Y.; Khokhar, S. Emergy based sustainability evaluation of a hydroelectric dam proposal in South Asia. J. Clean. Prod. 2020, 264, 121496. [Google Scholar] [CrossRef]
- Chen, J.; Mei, Y.; Ben, Y.; Hu, T. Emergy-based sustainability evaluation of two hydropower projects on the Tibetan Plateau. Ecol. Eng. 2020, 150, 105838. [Google Scholar] [CrossRef]
- Cai, W.; Liu, C.H.; Jia, S.; Chan, F.T.S.; Ma, M.D.; Ma, X. An emergy-based sustainability evaluation method for outsourcing ma-chining resources. J. Clean. Prod. 2020, 245, 118849. [Google Scholar] [CrossRef]
- Liu, C.H.; Cai, W.; Dinolov, O.; Zhang, C.X.; Rao, W.Z.; Jia, S.; Li, L.; Chan, F.T.S. Emergy based sustainability evaluation of re-manufacturing machining systems. Energy 2018, 150, 670–680. [Google Scholar] [CrossRef]
- Liu, C.; Cai, W.; Jia, S.; Zhang, M.; Guo, H.; Hu, L.; Jiang, Z. Emergy-based evaluation and improvement for sustainable manufacturing systems considering resource efficiency and environment performance. Energy Convers. Manag. 2018, 177, 176–189. [Google Scholar] [CrossRef]
- Wang, C.; Liu, H.; Yu, L.; Wang, H. Study on the Sustainability Evaluation Method of Logistics Parks Based on Emergy. Processes 2020, 8, 1247. [Google Scholar] [CrossRef]
- Bergquist, D.; Garcia-Caro, D.; Joosse, S.; Granvik, M.; Peniche, F. The Sustainability of Living in a “Green” Urban District: An Emergy Perspective. Sustainability 2020, 12, 5661. [Google Scholar] [CrossRef]
- Thomas, T.; Praveen, A. Emergy parameters for ensuring sustainable use of building materials. J. Clean. Prod. 2020, 276, 122382. [Google Scholar] [CrossRef]
- Patrizi, N.; Bruno, M.; Saladini, F.; Parisi, M.L.; Pulselli, R.M.; Bjerre, A.B.; Bastianoni, S. Sustainability Assessment of Biorefinery Systems Based on Two Food Residues in Africa. Front. Sustain. Food Syst. 2020, 4, 522614. [Google Scholar] [CrossRef]
- Su, Y.; He, S.; Wang, K.; Shahtahmassebi, A.R.; Zhang, L.; Zhang, J.; Zhang, M.; Gan, M. Quantifying the sustainability of three types of agricultural production in China: An emergy analysis with the integration of environmental pollution. J. Clean. Prod. 2020, 252, 119650. [Google Scholar] [CrossRef]
- Amini, S.; Rohani, A.; Aghkhani, M.H.; Abbaspour-Fard, M.H.; Asgharipour, M.R. Sustainability assessment of rice production systems in Mazandaran Province, Iran with emergy analysis and fuzzy logic. Sustain. Energy Technol. Assess. 2020, 40, 100744. [Google Scholar] [CrossRef]
- Asgharipour, M.R.; Amiri, Z.; Campbell, D.E. Evaluation of the sustainability of four greenhouse vegetable production eco-systems based on an analysis of emergy and social characteristics. Ecol. Modell. 2020, 424, 109021. [Google Scholar] [CrossRef]
- Zhao, Z.; Chen, J.; Bai, Y.; Wang, P. Assessing the sustainability of grass-based livestock husbandry in Hulun Buir, China. Phys. Chem. Earth Parts A/B/C 2020, 120, 102907. [Google Scholar] [CrossRef]
- Fang, W.; An, H.; Li, H.; Gao, X.; Sun, X.; Zhong, W. Accessing on the sustainability of urban ecological-economic systems by means of a coupled emergy and system dynamics model: A case study of Beijing. Energy Policy 2017, 100, 326–337. [Google Scholar] [CrossRef]
- Ma, W.J.; Liu, J. Evaluation of sustainable development of eco-economic systems in China based on emergy analysis. Chin. J. Appl. Ecol. 2020, 31, 2029–2038. [Google Scholar]
- Lee, Y.-C.; Liao, P.-T. The effect of tourism on teleconnected ecosystem services and urban sustainability: An emergy approach. Ecol. Model. 2021, 439, 109343. [Google Scholar] [CrossRef]
- Wei, Y.; Li, Y.; Liu, X.; Wu, M. Sustainable development and green gross domestic product assessments in megacities based on the emergy analysis method—A case study of Wuhan. Sustain. Dev. 2020, 28, 294–307. [Google Scholar] [CrossRef]
- Peng, W.; Wang, X.; Li, X.; He, C. Sustainability evaluation based on the emergy ecological footprint method: A case study of Qingdao, China, from 2004 to 2014. Ecol. Indic. 2018, 85, 1249–1261. [Google Scholar] [CrossRef]
- Wang, Z.Y.; Ma, J.J.; Li, P.F.; Zhao, D.; Teng, T.; Yang, Y.C. Study on sustainability of three developed core districts in Xi’an based on emergy analysis. J. Earth Environ. 2018, 9, 210–222. [Google Scholar]
- National Bureau of Statistics. Available online: https://data.stats.gov.cn/easyquery.htm?cn=C01 (accessed on 10 December 2020).
- Anhui Provincial Bureau of Statistics. Available online: http://tjj.ah.gov.cn/ssah/qwfbjd/tjnj/index.html (accessed on 10 December 2020).
- Anhui Provincial People’s Government. Available online: http://www.ah.gov.cn/zfsj/index.html (accessed on 15 December 2020).
- Department of Ecology and Environment of Anhui Province. Available online: http://sthjt.ah.gov.cn/ (accessed on 15 December 2020).
- Liu, C.; Gao, M.; Zhu, G.; Zhang, C.; Zhang, P.; Chen, J.; Cai, W. Data driven eco-efficiency evaluation and optimization in industrial production. Energy 2021, 224, 120170. [Google Scholar] [CrossRef]
- Brown, M.T.; Ulgiati, S. Emergy Analysis and Environmental Accounting. Encycl. Energy 2004, 329–354. [Google Scholar] [CrossRef]
- Brown, M.T.; Ulgiati, S. Emergy-based indices and rations to evaluate sustainability: Monitoring economics and technology toward environmentally sound innovation. Ecol. Eng. 1997, 5, 51–69. [Google Scholar] [CrossRef]


| Emergy Index | Expression | Remark |
|---|---|---|
| Flow index | ||
| Renewable resource emergy | EMR | Renewable emergy from nature, such as solar, wind, and rain energy |
| Non-renewable resource emergy | EMN | All kinds of non-renewable emergy from nature, such as coal, oil, and natural gas |
| Economic feedback emergy | EMI | Emergy from outside the economic system, such as products, information, technology, and services |
| Output emergy | EMO | Products and services exported by the system and various wastes |
| Total emergy | EMU = EMR + EMN + EMI | Sum of various input emergy |
| Waste emergy | EMW | Wastewater, waste gas, and solid waste formed in the process of production and service |
| Structural index | ||
| Emergy self-sufficiency ratio (ESR) | ESR = (EMR + EMN)/EMU | The supporting capacity of natural environment |
| Emergy purchasing ratio (EPR) | EPR = EMI/EMU | Reflects the degree of dependence on the external environment |
| Emergy per person (EPP) | EPP = EMU/P | Reflects the people’s standard of living |
| Emergy per area | EPA = EMU/A | Reflects the land-use efficiency |
| Functional index | ||
| Emergy money ratio (EMR) | EMR = EMU/GDP | Evaluates the development degree of the regional economy |
| Net emergy yield ratio (EYR) | EYR = (EMo − EMW)/EMI | Measures the contribution of system output to the economy |
| Emergy exchange ratio (EER) | EER = EMI/EMO | Evaluates the gains and losses in the external exchange |
| Emergy investment ratio | EIR = EMI/(EMR + EMN) | Measures the degree of economic development and environmental load |
| Ecological efficiency index | ||
| Environmental loading ratio (ELR) | ELR = (EMI + EMN)/EMR | Evaluates the impact of activities on the environment |
| Emergy waste ratio (EWR) | EWR = EMW/EMU | Reflects the pollution degree of the regional economy to the natural environment |
| Sustainable development index | ||
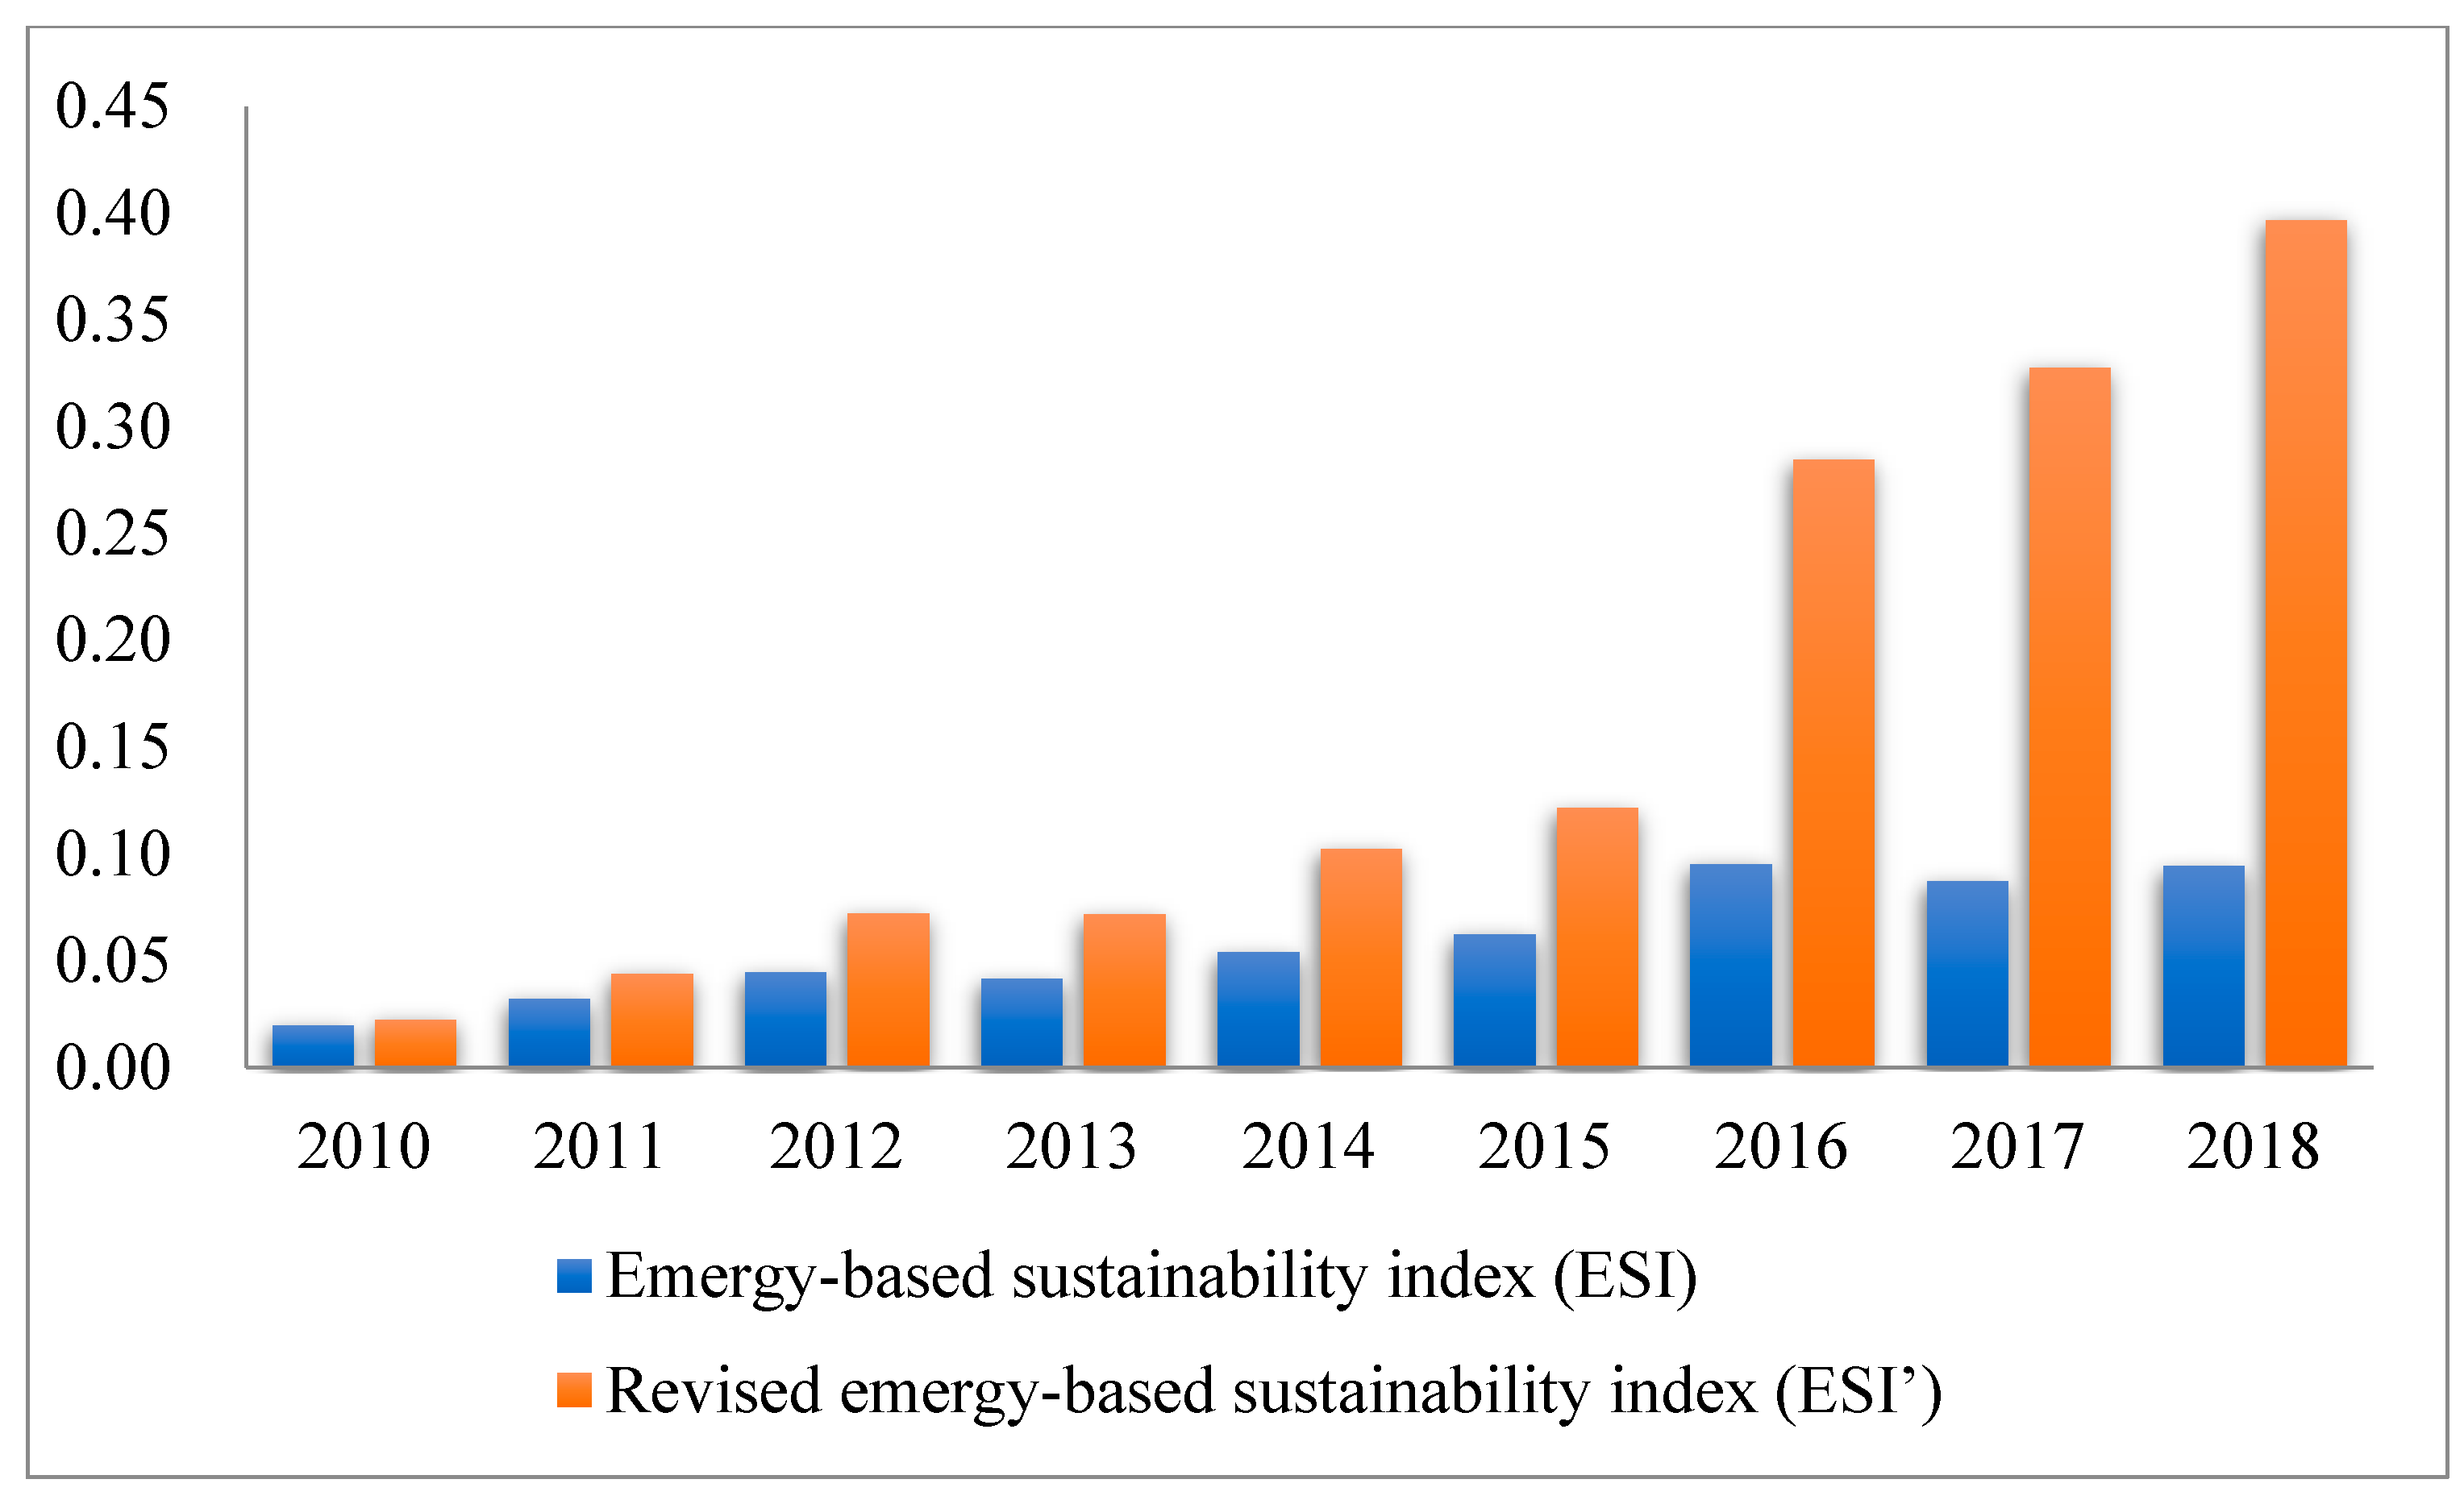
| Emergy-based sustainability index (ESI) | ESI = EYR/ELR | Measures the status and level of sustainable development |
| Revised emergy-based sustainability index (ESI’) | ESI’ = EYR/(ELR × EWR) | Comprehensively reflects the level of sustainable development |
| Collection Object | Original Data | Emergy Conversion Rate (Sej/Unit) | References | ||||||||
|---|---|---|---|---|---|---|---|---|---|---|---|
| 2010 | 2011 | 2012 | 2013 | 2014 | 2015 | 2016 | 2017 | 2018 | |||
| Renewable resources | |||||||||||
| Solar energy (J) | 7.85 × 10²⁰ | 7.85 × 10²⁰ | 7.85 × 10²⁰ | 7.85 × 10²⁰ | 7.85 × 10²⁰ | 7.85 × 10²⁰ | 7.85 × 10²⁰ | 7.85 × 10²⁰ | 7.85 × 10²⁰ | 1.00 | [21] |
| Rainwater chemical energy (J) | 9.06 × 10¹⁷ | 7.37 × 10¹⁷ | 8.12 × 10¹⁷ | 7.08 × 10¹⁷ | 8.85 × 10¹⁷ | 9.43 × 10¹⁷ | 1.12 × 10¹⁸ | 8.69 × 10¹⁷ | 9.10 × 10¹⁷ | 1.54 × 10⁴ | [21] |
| Rainwater potential energy (J) | 2.14 × 10¹⁷ | 1.74 × 10¹⁷ | 1.92 × 10¹⁷ | 1.68 × 10¹⁷ | 2.09 × 10¹⁷ | 2.23 × 10¹⁷ | 2.64 × 10¹⁷ | 2.06 × 10¹⁷ | 2.15 × 10¹⁷ | 8.89 × 10³ | [21] |
| Wind energy (J) | 1.08 × 10¹⁸ | 1.08 × 10¹⁸ | 1.08 × 10¹⁸ | 1.08 × 10¹⁸ | 1.08 × 10¹⁸ | 1.08 × 10¹⁸ | 1.08 × 10¹⁸ | 1.08 × 10¹⁸ | 1.08 × 10¹⁸ | 6.63 × 10² | [21] |
| Geothermal energy (J) | 2.03 × 10¹⁷ | 2.03 × 10¹⁷ | 2.03 × 10¹⁷ | 2.03 × 10¹⁷ | 2.03 × 10¹⁷ | 2.03 × 10¹⁷ | 2.03 × 10¹⁷ | 2.03 × 10¹⁷ | 2.03 × 10¹⁷ | 2.90 × 10⁴ | [21] |
| Non-renewable resources | |||||||||||
| Loss of topsoil (J) | 6.59 × 10¹⁶ | 6.59 × 10¹⁶ | 6.59 × 10¹⁶ | 6.59 × 10¹⁶ | 6.59 × 10¹⁶ | 6.59 × 10¹⁶ | 6.59 × 10¹⁶ | 6.59 × 10¹⁶ | 6.59 × 10¹⁶ | 7.40 × 10⁴ | [26] |
| Natural gas (J) | 2.09 × 10¹⁶ | 2.52 × 10¹⁶ | 2.85 × 10¹⁶ | 3.81 × 10¹⁶ | 4.22 × 10¹⁶ | 4.39 × 10¹⁶ | 5.08 × 10¹⁶ | 6.51 × 10¹⁶ | 7.50 × 10¹⁶ | 1.70 × 10⁵ | [26] |
| Coal (J) | 2.83 × 10¹⁸ | 3.14 × 10¹⁸ | 3.27 × 10¹⁸ | 3.58 × 10¹⁸ | 3.66 × 10¹⁸ | 3.58 × 10¹⁸ | 3.48 × 10¹⁸ | 3.61 × 10¹⁸ | 3.57 × 10¹⁸ | 9.71 × 10⁴ | [26] |
| Coke (J) | 2.56 × 10¹⁷ | 2.66 × 10¹⁷ | 2.72 × 10¹⁷ | 2.86 × 10¹⁷ | 2.90 × 10¹⁷ | 2.98 × 10¹⁷ | 2.81 × 10¹⁷ | 2.87 × 10¹⁷ | 3.02 × 10¹⁷ | 6.44 × 10⁴ | [26] |
| Electronic (J) | 2.78 × 10¹⁷ | 3.15 × 10¹⁷ | 3.39 × 10¹⁷ | 3.62 × 10¹⁷ | 3.80 × 10¹⁷ | 3.90 × 10¹⁷ | 4.08 × 10¹⁷ | 4.19 × 10¹⁷ | 4.30 × 10¹⁷ | 2.78 × 10⁵ | [26] |
| Diesel oil (J) | 1.43 × 10¹⁶ | 1.45 × 10¹⁶ | 1.57 × 10¹⁶ | 1.63 × 10¹⁶ | 1.54 × 10¹⁶ | 1.46 × 10¹⁶ | 1.45 × 10¹⁶ | 1.37 × 10¹⁶ | 1.33 × 10¹⁶ | 1.07 × 10⁵ | [26] |
| Gasoline (J) | 3.18 × 10¹⁵ | 2.85 × 10¹⁵ | 3.05 × 10¹⁵ | 3.03 × 10¹⁵ | 2.87 × 10¹⁵ | 2.74 × 10¹⁵ | 2.62 × 10¹⁵ | 2.55 × 10¹⁵ | 2.07 × 10¹⁵ | 1.06 × 10⁵ | [26] |
| Input resources | |||||||||||
| Total energy consumption (J) | 1.97 × 10¹⁵ | 2.14 × 10¹⁵ | 2.30 × 10¹⁵ | 2.45 × 10¹⁵ | 2.51 × 10¹⁵ | 2.58 × 10¹⁵ | 2.65 × 10¹⁵ | 2.73 × 10¹⁵ | 2.77 × 10¹⁵ | 9.71 × 10⁴ | [49] |
| Output resources | |||||||||||
| GDP (CNY) | 1.24 × 10¹² | 1.53 × 10¹² | 1.72 × 10¹² | 1.92 × 10¹² | 2.08 × 10¹² | 2.20 × 10¹² | 2.41 × 10¹² | 2.70 × 10¹² | 3.00 × 10¹² | 8.61 × 10¹¹ | [49] |
| Total sales of goods (CNY) | 1.00 × 10¹² | 1.29 × 10¹² | 1.58 × 10¹² | 8.90 × 10¹¹ | 9.43 × 10¹¹ | 9.45 × 10¹¹ | 1.07 × 10¹² | 1.15 × 10¹² | 1.30 × 10¹² | 8.61 × 10¹¹ | [49] |
| Total energy production (J) | 2.02 × 10¹⁵ | 2.15 × 10¹⁵ | 2.29 × 10¹⁵ | 2.10 × 10¹⁵ | 1.97 × 10¹⁵ | 2.09 × 10¹⁵ | 1.95 × 10¹⁵ | 1.91 × 10¹⁵ | 1.91 × 10¹⁵ | 9.71 × 10⁴ | [49] |
| Wastewater (G) | 7.10 × 10¹⁴ | 7.09 × 10¹⁴ | 6.72 × 10¹⁴ | 7.10 × 10¹⁴ | 6.96 × 10¹⁴ | 7.14 × 10¹⁴ | 4.96 × 10¹⁴ | 4.30 × 10¹⁴ | 4.26 × 10¹⁴ | 1.24 × 10⁹ | [31] |
| Waste gas (G) | 1.78 × 10¹⁴ | 3.04 × 10¹⁴ | 2.96 × 10¹⁴ | 2.83 × 10¹⁴ | 2.92 × 10¹⁴ | 2.92 × 10¹⁴ | 2.54 × 10¹⁴ | 3.14 × 10¹⁴ | 2.91 × 10¹⁴ | 1.84 × 10⁸ | [31] |
| Solid waste (G) | 9.16 × 10¹³ | 1.15 × 10¹⁴ | 1.20 × 10¹⁴ | 1.19 × 10¹⁴ | 1.20 × 10¹⁴ | 1.31 × 10¹⁴ | 1.27 × 10¹⁴ | 1.20 × 10¹⁴ | 1.31 × 10¹⁴ | 2.52 × 10⁸ | [31] |
| Collection Object | Emergy Data | ||||||||
|---|---|---|---|---|---|---|---|---|---|
| 2010 | 2011 | 2012 | 2013 | 2014 | 2015 | 2016 | 2017 | 2018 | |
| Renewable resources | |||||||||
| Solar energy | 7.85 × 10²⁰ | 7.85 × 10²⁰ | 7.85 × 10²⁰ | 7.85 × 10²⁰ | 7.85 × 10²⁰ | 7.85 × 10²⁰ | 7.85 × 10²⁰ | 7.85 × 10²⁰ | 7.85 × 10²⁰ |
| Rainwater chemical energy | 1.40 × 10²² | 1.14 × 10²² | 1.25 × 10²² | 1.09 × 10²² | 1.37 × 10²² | 1.46 × 10²² | 1.72 × 10²² | 1.34 × 10²² | 1.41 × 10²² |
| Rainwater potential energy | 1.91 × 10²¹ | 1.55 × 10²¹ | 1.71 × 10²¹ | 1.49 × 10²¹ | 1.86 × 10²¹ | 1.98 × 10²¹ | 2.35 × 10²¹ | 1.83 × 10²¹ | 1.91 × 10²¹ |
| Wind energy | 7.16 × 10²⁰ | 7.16 × 10²⁰ | 7.16 × 10²⁰ | 7.16 × 10²⁰ | 7.16 × 10²⁰ | 7.16 × 10²⁰ | 7.16 × 10²⁰ | 7.16 × 10²⁰ | 7.16 × 10²⁰ |
| Geothermal energy | 5.89 × 10²¹ | 5.89 × 10²¹ | 5.89 × 10²¹ | 5.89 × 10²¹ | 5.89 × 10²¹ | 5.89 × 10²¹ | 5.89 × 10²¹ | 5.89 × 10²¹ | 5.89 × 10²¹ |
| Non-renewable resources | |||||||||
| Loss of topsoil | 4.88 × 10²¹ | 4.88 × 10²¹ | 4.88 × 10²¹ | 4.88 × 10²¹ | 4.88 × 10²¹ | 4.88 × 10²¹ | 4.88 × 10²¹ | 4.88 × 10²¹ | 4.88 × 10²¹ |
| Natural gas | 3.55 × 10²¹ | 4.29 × 10²¹ | 4.84 × 10²¹ | 6.47 × 10²¹ | 7.18 × 10²¹ | 7.47 × 10²¹ | 8.64 × 10²¹ | 1.11 × 10²² | 1.28 × 10²² |
| Coal | 2.75 × 10²³ | 3.05 × 10²³ | 3.18 × 10²³ | 3.48 × 10²³ | 3.55 × 10²³ | 3.48 × 10²³ | 3.38 × 10²³ | 3.51 × 10²³ | 3.47 × 10²³ |
| Coke | 1.65 × 10²² | 1.71 × 10²² | 1.75 × 10²² | 1.84 × 10²² | 1.87 × 10²² | 1.92 × 10²² | 1.81 × 10²² | 1.85 × 10²² | 1.94 × 10²² |
| Electronic | 7.72 × 10²² | 8.77 × 10²² | 9.43 × 10²² | 1.01 × 10²³ | 1.06 × 10²³ | 1.08 × 10²³ | 1.14 × 10²³ | 1.16 × 10²³ | 1.19 × 10²³ |
| Diesel oil | 1.53 × 10²¹ | 1.55 × 10²¹ | 1.68 × 10²¹ | 1.74 × 10²¹ | 1.65 × 10²¹ | 1.56 × 10²¹ | 1.55 × 10²¹ | 1.47 × 10²¹ | 1.42 × 10²¹ |
| Gasoline | 3.37 × 10²⁰ | 3.02 × 10²⁰ | 3.23 × 10²⁰ | 3.22 × 10²⁰ | 3.04 × 10²⁰ | 2.91 × 10²⁰ | 2.78 × 10²⁰ | 2.70 × 10²⁰ | 2.19 × 10²⁰ |
| Input resources | |||||||||
| Total purchase of goods | 4.01 × 10²³ | 5.33 × 10²³ | 6.19 × 10²³ | 6.85 × 10²³ | 7.29 × 10²³ | 7.22 × 10²³ | 8.08 × 10²³ | 8.76 × 10²³ | 9.65 × 10²³ |
| Total energy consumption | 1.91 × 10²⁰ | 2.08 × 10²⁰ | 2.24 × 10²⁰ | 2.37 × 10²⁰ | 2.44 × 10²⁰ | 2.50 × 10²⁰ | 2.58 × 10²⁰ | 2.65 × 10²⁰ | 2.69 × 10²⁰ |
| Output resources | |||||||||
| GDP | 1.06 × 1024 | 1.32 × 1024 | 1.48 × 1024 | 1.66 × 1024 | 1.80 × 1024 | 1.89 × 1024 | 2.08 × 1024 | 2.33 × 1024 | 2.58 × 1024 |
| Total sales of goods | 8.65 × 10²³ | 1.11 × 1024 | 1.36 × 1024 | 7.66 × 10²³ | 8.12 × 10²³ | 8.14 × 10²³ | 9.20 × 10²³ | 9.89 × 10²³ | 1.12 × 1024 |
| Total energy production | 1.96 × 10²⁰ | 2.09 × 10²⁰ | 2.22 × 10²⁰ | 2.04 × 10²⁰ | 1.91 × 10²⁰ | 2.02 × 10²⁰ | 1.89 × 10²⁰ | 1.86 × 10²⁰ | 1.85 × 10²⁰ |
| Wastewater | 8.80 × 10²³ | 8.79 × 10²³ | 8.33 × 10²³ | 8.80 × 10²³ | 8.63 × 10²³ | 8.86 × 10²³ | 6.15 × 10²³ | 5.33 × 10²³ | 5.28 × 10²³ |
| Waste gas | 3.28 × 10²² | 5.60 × 10²² | 5.45 × 10²² | 5.21 × 10²² | 5.38 × 10²² | 5.37 × 10²² | 4.67 × 10²² | 5.79 × 10²² | 5.36 × 10²² |
| Solid waste | 2.31 × 10²² | 2.89 × 10²² | 3.03 × 10²² | 3.01 × 10²² | 3.02 × 10²² | 3.29 × 10²² | 3.19 × 10²² | 3.02 × 10²² | 3.30 × 10²² |
| Emergy Index | 2010 | 2011 | 2012 | 2013 | 2014 | 2015 | 2016 | 2017 | 2018 |
|---|---|---|---|---|---|---|---|---|---|
| Renewable emergy (EMR) | 2.33 × 10²² | 2.03 × 10²² | 2.16 × 10²² | 1.98 × 10²² | 2.29 × 10²² | 2.39 × 10²² | 2.70 × 10²² | 2.26 × 10²² | 2.34 × 10²² |
| Non-renewable emergy (EMN) | 3.78 × 10²³ | 4.21 × 10²³ | 4.41 × 10²³ | 4.81 × 10²³ | 4.93 × 10²³ | 4.89 × 10²³ | 4.85 × 10²³ | 5.03 × 10²³ | 5.05 × 10²³ |
| Economic feedback emergy (EMI) | 4.01 × 10²³ | 5.33 × 10²³ | 6.19 × 10²³ | 6.86 × 10²³ | 7.29 × 10²³ | 7.23 × 10²³ | 8.08 × 10²³ | 8.76 × 10²³ | 9.65 × 10²³ |
| Output emergy (EMO) | 1.06 × 1024 | 1.32 × 1024 | 1.48 × 1024 | 1.66 × 1024 | 1.80 × 1024 | 1.89 × 1024 | 2.08 × 1024 | 2.33 × 1024 | 2.58 × 1024 |
| Total emergy (EMU) | 8.03 × 10²³ | 9.74 × 10²³ | 1.08 × 1024 | 1.19 × 1024 | 1.25 × 1024 | 1.24 × 1024 | 1.32 × 1024 | 1.40 × 1024 | 1.49 × 1024 |
| Waste emergy | 9.36 × 10²³ | 9.64 × 10²³ | 9.18 × 10²³ | 9.62 × 10²³ | 9.47 × 10²³ | 9.72 × 10²³ | 6.94 × 10²³ | 6.21 × 10²³ | 6.15 × 10²³ |
| Structural index | |||||||||
| Emergy self-sufficiency ratio (ESR) | 5.01 × 10⁻¹ | 4.53 × 10⁻¹ | 4.28 × 10⁻¹ | 4.22 × 10⁻¹ | 4.15 × 10⁻¹ | 4.15 × 10⁻¹ | 3.88 × 10⁻¹ | 3.75 × 10⁻¹ | 3.54 × 10⁻¹ |
| Emergy purchasing ratio (EPR) | 4.99 × 10⁻¹ | 5.47 × 10⁻¹ | 5.72 × 10⁻¹ | 5.78 × 10⁻¹ | 5.85 × 10⁻¹ | 5.85 × 10⁻¹ | 6.12 × 10⁻¹ | 6.25 × 10⁻¹ | 6.46 × 10⁻¹ |
| Emergy per person (EPP) | 1.35 × 10¹⁶ | 1.63 × 10¹⁶ | 1.81 × 10¹⁶ | 1.97 × 10¹⁶ | 2.05 × 10¹⁶ | 2.01 × 10¹⁶ | 2.13 × 10¹⁶ | 2.24 × 10¹⁶ | 2.36 × 10¹⁶ |
| Emergy per area (EPA) | 5.73 × 10¹² | 6.95 × 10¹² | 7.72 × 10¹² | 8.47 × 10¹² | 8.89 × 10¹² | 8.82 × 10¹² | 9.42 × 10¹² | 1.00 × 10¹³ | 1.07 × 10¹³ |
| Functional index | |||||||||
| Emergy money ratio (EMR) | 6.49 × 10¹¹ | 6.37 × 10¹¹ | 6.28 × 10¹¹ | 6.17 × 10¹¹ | 5.97 × 10¹¹ | 5.62 × 10¹¹ | 5.47 × 10¹¹ | 5.19 × 10¹¹ | 4.98 × 10¹¹ |
| Net emergy yield ratio (EYR) | 3.20 × 10⁻¹ | 6.64 × 10⁻¹ | 9.12 × 10⁻¹ | 1.01 | 1.16 | 1.28 | 1.71 | 1.95 | 2.04 |
| Emergy exchange ratio (EER) | 3.77 × 10⁻¹ | 4.04 × 10⁻¹ | 4.18 × 10⁻¹ | 4.14 × 10⁻¹ | 4.06 × 10⁻¹ | 3.81 × 10⁻¹ | 3.89 × 10⁻¹ | 3.77 × 10⁻¹ | 3.74 × 10⁻¹ |
| Emergy investment ratio | 9.98 × 10⁻¹ | 1.21 | 1.34 | 1.37 | 1.41 | 1.41 | 1.58 | 1.67 | 1.83 |
| Ecological efficiency index | |||||||||
| Environmental loading ratio (ELR) | 1.63 × 101 | 2.07 × 101 | 2.04 × 101 | 2.42 × 101 | 2.15 × 101 | 2.04 × 101 | 1.80 × 101 | 2.22 × 101 | 2.16 × 101 |
| Energy waste ratio (EWR) | 8.80 × 10⁻¹ | 7.31 × 10⁻¹ | 6.19 × 10⁻¹ | 5.81 × 10⁻¹ | 5.27 × 10⁻¹ | 5.13 × 10⁻¹ | 3.34 × 10⁻¹ | 2.67 × 10⁻¹ | 2.38 × 10⁻¹ |
| Sustainable development index | |||||||||
| Emergy-based sustainability index (ESI) | 1.97 × 10⁻² | 3.21 × 10⁻² | 4.47 × 10⁻² | 4.17 × 10⁻² | 5.41 × 10⁻² | 6.25 × 10⁻² | 9.52 × 10⁻² | 8.75 × 10⁻² | 9.44 × 10⁻² |
| Revised emergy-based sustainability index (ESI’) | 2.24 × 10⁻² | 4.38 × 10⁻² | 7.22 × 10⁻² | 7.18 × 10⁻² | 1.03 × 10⁻¹ | 1.22 × 10⁻¹ | 2.85 × 10⁻¹ | 3.28 × 10⁻¹ | 3.97 × 10⁻¹ |
Publisher’s Note: MDPI stays neutral with regard to jurisdictional claims in published maps and institutional affiliations. |
© 2021 by the authors. Licensee MDPI, Basel, Switzerland. This article is an open access article distributed under the terms and conditions of the Creative Commons Attribution (CC BY) license (http://creativecommons.org/licenses/by/4.0/).
Share and Cite
Wang, C.; Zhang, Y.; Liu, C.; Hu, F.; Zhou, S.; Zhu, J. Emergy-Based Assessment and Suggestions for Sustainable Development of Regional Ecological Economy: A Case Study of Anhui Province, China. Sustainability 2021, 13, 2988. https://0-doi-org.brum.beds.ac.uk/10.3390/su13052988
Wang C, Zhang Y, Liu C, Hu F, Zhou S, Zhu J. Emergy-Based Assessment and Suggestions for Sustainable Development of Regional Ecological Economy: A Case Study of Anhui Province, China. Sustainability. 2021; 13(5):2988. https://0-doi-org.brum.beds.ac.uk/10.3390/su13052988
Chicago/Turabian StyleWang, Cui, Yingyan Zhang, Conghu Liu, Fagang Hu, Shuling Zhou, and Juan Zhu. 2021. "Emergy-Based Assessment and Suggestions for Sustainable Development of Regional Ecological Economy: A Case Study of Anhui Province, China" Sustainability 13, no. 5: 2988. https://0-doi-org.brum.beds.ac.uk/10.3390/su13052988