
Performance Shortfalls and R&D Investment Change: Aspirations, Actions, and Expectations

1
School of Economics & Management, Fuzhou University, Fuzhou 351006, China
2
School of Business & Management, State University of New York College at Brockport, Brockport, NY 14450, USA
3
School of Economics & Management, MinJiang University, Fuzhou 350108, China
*
Author to whom correspondence should be addressed.
Sustainability 2021, 13(6), 3006; https://0-doi-org.brum.beds.ac.uk/10.3390/su13063006
Submission received: 21 January 2021
/
Revised: 24 February 2021
/
Accepted: 4 March 2021
/
Published: 10 March 2021
(This article belongs to the Section Sustainable Management)
Abstract
:Built on the Behavioral Theory of the Firm, the paper examines how firm response to performance feedback is influenced by firm expectation on the likelihood of an action to close the performance gap. Using firm level change in R&D intensity as a problemistic search behavior, we explore how performance shortfalls relative to social and historical aspirations may prompt underperforming firms to adjust its R&D investment intensity, and how the magnitude of this adjustment is moderated by firm resources, past experience, industry and market conditions. We conduct our analysis using a longitudinal sample of Chinese firms listed on the ChiNext Board between 2009 and 2017. Our results indicate that underperforming firms increase their R&D intensity to a larger degree than their over-performing peers and periods when these firms have substantial cumulated R&D spending, abundant organizational slack, and are competing in more dynamic industries. We also document that these moderating factors influence relationships between social and historical aspirations and R&D investment decisions in a distinct way. We conclude that firm internal resources, capabilities and external industry and market conditions all affect firm expectations, and consequently shape the direction and magnitude of organizational actions in response to performance aspirations.
1. Introduction
Corporate innovation is an important driver of firm competitive advantage and the engine of economic development, which not only generates employment and economic growth, but also improves our way of living and contributes to societal advancement [1,2]. Although investing in innovation has been widely recognized as an effective strategy to achieve performance improvement and growth at both firm level and national level, corporations are often found to underinvest in innovation. This is often attributed to the lengthy, risky, and unpredictable processes of innovation [3], myopia and self-interests of corporate managers [4], and unfavorable institutional conditions such as underdeveloped financial markets and weak intellectual property protection, which hinder firms’ willingness and capability to invest in innovation [5,6].
When firms are experiencing performance shortfalls, their motivation to invest in innovation may be at its highest. According to the Behavioral Theory of the Firm (BTOF), firm decisions are guided by aspirations, which are built on the firm’s past goals and benchmarked against performance of peer organizations [7]. When firm performance falls short of its historical or social aspirations, a problemistic search is triggered to prompt the firm to find solutions to address its underperforming problem. In contrast, when firm performance is above the aspiration level, the firm is more likely to maintain the status quo and follow previous routines [8,9]. Although the conceptual model is compelling, extant research is equivocal on whether performance shortfalls will necessarily invoke change, and no consensus exists on the direction, magnitude, and types of changes either. Pertinent to innovation investment, some scholars suggest that firms will increase resource allocation to R&D in response to unfavorable performance feedback [10], the others argue that underperformance may trigger threat rigidity and resource conservation, thus lead to stagnant R&D investment [11,12], and still others indicate that the relationship between performance shortfall and R&D investment is contingent on situational factors such as abundancy of slack resources [10] and duration of underperformance [13].
Following this stream of literature, our paper investigates factors affecting the propensity of firms to increase R&D investment in response to performance shortfalls. In an attempt to reconcile divergent findings in extant studies, we highlight organizational expectation as an important mechanism shaping organizational responses to performance shortfalls, and consequently moderating the relationship between performance aspirations and actions. In our view, organizational choice is not only a passive reaction to aspirations, but also reflects its expectation of the action-outcome linkage, i.e., the likelihood of a choice to bring desirable outcomes that enable the organization to reach its aspirations. As Gavetti and Levinthal [14] elaborated in their search model, decision makers can anticipate the broad outcomes of their actions, and such expectations will guide the subsequent trajectory of search and organizational capability development. Organizational expectations are not formed from vacuum, but are influenced by the organization’s internal conditions and external contexts, and subsequently shape the path and result of a problemistic search. The focus of this paper therefore is to examine how firm experience, resource endowments, industry norm, and market dynamism may affect firm expectations on the efficacy of R&D investment in closing the performance gap, and subsequently influence their responses to performance shortfalls.
Our paper augments prior literature on BTOF that has focused on the impact of aspirations on firm search and actions by highlighting a largely neglected link in this course of action, expectations. We argue that organizational actions are not only triggered by historical or social aspirations, but are shaped by firm expectations of the action-outcome linkage. Organizations differ in their expectations. Heterogeneous expectations on the effectiveness of R&D investment in improving firm performance thus result in divergent organizational responses to performance feedback and changes in R&D investment. Following the important insight of Cyert et al. [15], we view organizational expectation as an endogenous variable, with its formation heavily influenced by the organization’s resource endowment, past experience, and external environment. To our best knowledge, no prior empirical studies have systematically explored these issues from the angle of expectations. In this way, our paper augments extant studies of BTOF to recognize and explain contingencies affecting directions and types of organizational change in response to negative performance feedback [16,17].
We also contribute to the innovation literature to strengthen our understanding of factors affecting corporate innovation investment. Our firm-level approach grounded in the BTOF is different from prior empirical research that has examined either the effects of micro-level managerial characteristics and incentives on innovation inputs and outcomes of their firms [18,19] or the impact of macro-level industry and institutional environment on innovation at organizational, regional, and national levels [20,21]. In contrast, we view firms not only as our unit of analysis but also as an actor in the socioeconomic system whose expectations and actions are influenced by both internal resources and capabilities and external institutional environment. We then examine how these internal and external contingencies shape firm expectations, and consequently influence their responses to performance shortfalls. Our study therefore extends the firm-level perspective on corporate innovation to develop a cross-level theoretical framework on firm expectations and R&D investment. This meso-level angle thus complements prior innovation literature to provide additional evidence on the influences of firm and industry characteristics on innovation inputs.
We investigate these research questions in a longitudinal sample of firms listed in the ChiNext Board of China’s Shenzhen Stock Exchange. As a Chinese counterpart of NASDAQ, ChiNext board has been established to attract innovative and growth-oriented businesses since its debut in 2009. By using a sample of firms for whom innovation is most critical for survival and growth, we identify internal and external facilitators that encourage firms to increase innovation investment, and obstacles that prevent them from doing so. We find that underperforming firms increase their R&D intensity to a larger degree than their over-performing peers (periods) when these firms have substantial cumulated R&D stocks, abundant organizational slack, and are competing in a dynamic high-growth industry. In addition, we find that although the industry leader’s R&D investment intensity has a positive influence on underperformers’ R&D investment, historical underperforming firms respond less aggressively to the R&D strategy of their industry leaders compared to their over-performing peers. We also document distinctive moderating roles of these aforementioned contingency variables on underperformance relative to social and historical aspirations. We conclude that a firm’s internal resources and capabilities and its external institutional conditions both affect firm expectations on the effectiveness of innovation as a competitive strategy, and consequently shape their responses to different performance aspirations. In this sense, our paper also possesses significant practical importance in guiding firms to craft their innovation strategies in response to performance feedback and market conditions.
The rest of the paper is organized as follows. Section 2 introduces the theoretical foundation and provides a brief review of extant literature. Section 3 builds our hypotheses. Section 4 describes our data, variables and empirical models. We present our results in Section 5 and conclude the paper with a discussion in Section 6.
2. Theoretical Foundation and Literature Review
A Behavioral Theory of the Firm [7] is a Carnegie School cornerstone of the scientific study of firm behavior. The BTOF acknowledges that organizational decision-makers only possess bounded rationality and follow a satisficing instead of maximizing decision-making rule [8]. What deemed as “satisfactory” is dependent on the organization’s aspiration level, set against social peers or its own prior performance [22]. On one hand, decision-makers make social comparisons with similar organizations or market competitors, such as industry peers or firms located in adjacent geographical areas, so called social comparison [11,23]. On the other hand, decision-makers make historical comparison by contrasting current performance with their historical performance [24,25]. When firm performance is below the aspiration level, the organization is prompted to engage in a problemistic search to find solutions to address the performance shortfall problem, which may result in a change of its strategies, routines, practices, and structures. On the contrary, such search and changes are less likely to happen when performance is above the aspiration level. Scholars also incorporate the concepts of risk taking and loss aversion in prospect theory [26] to explain how relative performance may influence managerial risk preferences and consequently shape organizational outcomes [27,28]. It is argued that firms are prone to take more risks when performance falls below the aspiration level, while they are more risk averse when performance is above the reference point [29].
Following this important theoretical insight, voluminous empirical studies have examined how performance feedback may prompt organizational changes, alter firm risk preferences, and ultimately influence firm strategies and outcomes, including asset acquisition [11], unit acquisition [30], divestment [25], factory expansion [23], new product introduction [16], R&D investment [31], community investment [32], and lobbying activities [33]. There is, however, debate on whether performance shortfalls will necessarily invoke change. For example, the thread rigidity theory [34] predicts that performance shortfalls may be perceived as a threat to firm survival, lead to simplified communication and centralized control, and cause firms to display rigidity instead of change.
To explain discrepancy in firm responses, extant literature has investigated variations in organizational aspirations and benchmarks. For example, it is argued that the magnitude of performance discrepancy, i.e., the difference between actual performance and benchmark performance, affects how organizations respond to performance feedback [10,12]. Underperforming firms threatened by bankruptcy tend to maintain existing operations and avoid changes, whereas those facing smaller bankruptcy risks are more likely to re-consider their strategic positions. Durations of underperformance is another factor that may influence organizational responses. Yu et al. [13] identify a curvilinear relationship between underperformance duration and the magnitude and scope of innovative search. Differences in reference points also contribute to diverse firm reactions. For example, Kacperczky et al. [28] suggest that internal social comparison and external social comparison may trigger distinct individual and organizational concerns, and prompt firms to respond differently. Kim et al. [35] argue that historical aspirations and social aspirations on acquisition performance may result in dissimilar firm responses on whether to adopt acquisition strategies. Along the same line, Lucas et al. [31] and Lv et al. [36] explain how inconsistency between social and historical performance signals may give rise to various organizational responses in terms of changing R&D investment.
Diverse firm responses can also be attributed to heterogeneity in organizational characteristics that affect a firm’s aspiration-action link. For example, Audia and Greve [23] and Greve [11] both identify organizational size as an important contingency, and argue that smaller firms are more likely to display threat rigidity than their larger counterparts. Blettner et al. [24] suggest that organizations may choose to allocate their attention on different reference points as they age and navigate through their life cycles. Thus, firms of different ages and at various stages of life cycles respond to performance feedback in a distinct way.
The General Model of Adaptive-motivated Behavior depicted by March and Simon [37], not only highlights the role of aspirations in stimulating a problemistic search, but also underscores the function of expectations in guiding search processes and affecting search outcomes. Importantly, such expectations are not exogenous but are endogenously determined and vary with situational factors. As powerfully stated by Cyert et al. [15], “taking expectations as givens in a theory of business behavior seems similar to taking the outcomes of all individual games as given in a theory of baseball championships”. Search processes only stop when an alternative is expected to be satisfactory, which is dependent on the decision-maker’s expectation of the chosen action to bring the intended outcome [7]. As a result, organizational choice and action are “not merely semi-automatic procedures that react to short-term problems, or failures to achieve historically determined aspiration levels”, but are instead guided by organizational expectations, i.e., organizational beliefs about action-outcome linkage as explained by Gavetti et al. [8]. Therefore, organizational search is not only influenced by aspirations generated from a backward looking feedback-based process, but also involves a forward-looking cognitive process where decisions are made based on expectations of future outcomes that are derived from both organizational observations and interpretations of the environment [14]. Such expectations will guide the subsequent trajectory of organizational search, result in actions to change existing routines and strategies, and prompt organizations to develop necessary capabilities to achieve their aspirational goals. We next develop hypotheses on how internal and external contingencies may shape firm expectation and consequently affect a firm’s response to performance shortfall.
3. Hypotheses Development
According to the BTOF explained above, firms operating below aspirations may seek ways to improve their performance to reach the target level by conducting a problemistic search to change their existing strategies and routines [7]. As corporate innovation is a vital factor for firms to differentiate themselves from competitors and to obtain and sustain competitive advantage, underperforming firms may view R&D investment as an effective means to foster innovation and to revitalize business. Consequently, these firms may increase resource allocation to R&D in response to unfavorable performance feedback. However, R&D is an expenditure item that directly impairs a firm’s bottom-line in the short run, and is also risky with uncertain long-term payoffs [38]. Therefore, underperforming firms facing financial distress may not increase R&D investment to improve performance, but instead choose to cut cost and limit investment in new strategic initiatives [10]. The relationship between performance shortfalls and R&D investment thus is dependent on underperforming firms’ expectations of their action-outcome link.
A firm’s strategic choice is shaped by its past experience. Shimizu [12] argues that a firm with divestiture experience is more likely to view divestiture as a solution to improve poor performance, and is thus more inclined to implement the divestiture strategy when facing performance shortfalls. In contrast, when divestiture experience is lacking, poor-performing firms are less likely to opt for this strategy. By the same token, we expect that an organization’s R&D experience will affect its view on whether investing in innovation is a valid performance-enhancing strategy, and consequently influence its subsequent R&D investment decisions. Firms with a tradition of heavy R&D investment are more likely to view innovation as an effective competitive strategy. These firms are also more likely to develop strong organizational capabilities to benefit from innovation. When firm performance falls below aspirations, these firms are thus more inclined to increase investment in R&D in the hope of achieving better innovation outcomes in a shorter period. In contrast, firms with little R&D spending do not utilize an innovation strategy to compete. As corporate innovation is a path dependent process, these firms are unlikely to benefit significantly from a one-time boost to R&D expenditure. Thus, they may have low expectation on the effectiveness of R&D investment in closing the performance gap, which in turn reduces their motivation to increase R&D expenditure in case of performance shortfalls. Therefore, we predict that the relationship between performance shortfalls and increasing R&D investment is stronger among firms with larger cumulated R&D investment. Taken together, we make the following predictions:
Hypothesis 1a.
Performance shortfalls relative to social peers will result in increased R&D investment when firms’ cumulated R&D investment spending is higher.
Hypothesis 1b.
Performance shortfalls relative to historical levels will result in increased R&D investment when firms’ cumulated R&D investment spending is higher.
Firm perception is also affected by its resource endowments. As R&D investment reduces a firm’s short-term cash flow and impairs its bottom-line, whether a firm could afford to adopt this expensive strategy is dependent on the availability of slack resources [39]. As March and Simon [37] explicitly note, “when an organization has slack money or manpower not committed to going programs, various specializations of function may arise with respect to commitment to new programs and program elaboration”. As innovation and change require and consume resources, organizations with abundant slacks are more likely to support these activities, while those with limited slack resources are severely restricted in their available options [40,41].
Several studies have examined the impact of slack resources on underperforming firms’ action choices. For example, Chen and Miller [10] argue that firms’ R&D search intensity increases with organizational slack. They consequently document a positive relationship between underperforming firms’ available slack and R&D investment intensity in a sample of listed US firms. In addition, Kuusela et al. [25] argue and find evidence that when slack resources are abundant, organizations are more likely to opt for a resource-consuming strategy to improve performance. In contrast, when firms are facing severe resource constraints, they are more inclined to use resource-freeing options. We argue that organizational slacks are likely to have a larger impact on underperforming firms than on their over-performing peers to motivate the former group to increase R&D investment to a greater degree. Innovation projects are uncertain by nature in terms of the timing and degree of technological and market success [42]. As a result, firms with slack resources may weigh between investing in risky innovation projects and spending on less risky alternatives such as engaging in fixed asset investment by acquiring new production machineries or increasing sales and advertising expenditure to explore new markets and attract new customers. According to the BTOF, underperforming may prompt firms to form more optimistic expectations on their gains from risky projects and are thus more likely to engage in more risk taking activities, while over-performing firms tend to be more risk averse and loss averse [43]. Therefore, the relationship between organizational slack and R&D investment intensity is likely to be stronger when firm performance falls below aspiration levels. We consequently make the following predictions:
Hypothesis 2a.
Performance shortfalls relative to social peers will result in increased R&D investment when firms have more slack resources.
Hypothesis 2b.
Performance shortfalls relative to historical levels will result in increased R&D investment when firms have more slack resources.
Expectations are not only affected by a firm’s internal resources and capabilities, but also influenced by the external environment that a firm is facing. Industry is a powerful cognitive category, thus industry boundaries play a salient role in shaping firm behavior [44]. The institutional theory suggests that firms may adopt strategies and practices of other organizations in the same industry, so called mimetic isomorphism [45]. Such social imitation behavior is not indiscriminant, but aims toward selected others. Haunschild and Miner [46] argue that imitation may occur when a benchmark organization is considered more successful. As practices adopted by a higher-status successful peer are often viewed as being legitimate, imitating these practices may help the organization to achieve legitimacy and acquire status. Haveman [44], for example, finds evidence that organizations imitate choices of their industry performance leaders when choosing their market entry strategies. By the same token, we expect that the industry leader’s R&D investment strategy may become an important benchmark and a legitimate practice for underperforming firms to follow.
In addition, a practice adopted by an industry performance leader may also be associated with effectiveness. Industry peers may make a causal inference about the relationship between an industry leader’s heavy R&D investment and its economic success, and conclude that innovation investment is a key contributor to the industry performance leader’s success. Underperforming firms therefore may form a strong positive expectation that they will also benefit from R&D as their successful industry leader. Such a positive expectation will prompt underperforming firms to increase their own R&D investment.
Imitating strategies and practices of successful organizations is particularly attractive in ambiguous and uncertain situations [47]. Such an imitation helps firms reduce search costs and decrease the uncertainty that they are facing. Lieberman and Asaba [48] point out that when managers are unsure about the connections between their actions and outcomes, they are most likely to be receptive to information implicit in others’ actions. As innovation investment is inherently uncertain and risky in terms of payoff probability, time, and amounts, managers may form their expectations on the validity of innovation strategy based on cues obtained from their successful leaders’ R&D strategy, and decide to follow this choice to copy with uncertainty. Taken together, we expect that the industry leader’s R&D investment intensity will affect expectations and choices of their underperforming peers, which gives rise to the following hypotheses:
Hypothesis 3a.
Performance shortfalls relative to social peers will result in increased R&D investment when the industry performance leader has high R&D investment intensity.
Hypothesis 3b.
Performance shortfalls relative to historical levels will result in increased R&D investment when the industry performance leader has high R&D investment intensity.
Although isomorphism may drive firms to adopt similar strategies of their industry peers, conformity is not the only choice. Importantly, firms have to strike a balance between strategic similarity and differentiation, and competitive advantage often originates from differentiation instead of similarity. For example, underperforming firms may pursue a cost leadership strategy that does not need heavy R&D investment. These firms may also choose to invest in marketing and advertising to establish better client relationship and stronger brand recognition, which again does not require increasing R&D expenditure. Therefore, whether firms may increase R&D investment in response to inferior performance is contingent on firm expectation on the return on innovation investment versus return on other alternative strategies [49].
Industry is an important external context constraining firm strategic choices. The impact of industry characteristics on firm innovation could be traced back to the seminal work of Schumpeter [50] in which he suggests that market structure affects incentive of firms to invest in innovation. Economists have long recognized that industry competition affects firm incentive to engage in innovation [20,21]. Organizational researchers also argue that innovation decision is shaped by industry environment [51]. For example, Dess and Beard [52] argue that an industry at the growth stage has extra capacity and resources to support firm expansion, thus firms in these firms are more likely to invest in R&D anticipating higher returns. Importantly, Nadkarini and Chen [53] suggest that rapid rates of growth and changes in technologies and market factors in a dynamic industry render new product development opportunities transient and fleeting, and also make it more difficult for incumbent firms to build relevant capabilities and learn from past experience. In contrast, relatively gradual and stagnant market development in stable environment provides incumbents a longer window to explore market opportunities. Therefore, although desirable, investing in innovation in a dynamic environment is more risky due to less predictability and more uncertainty in future payoffs [54]. The BTOF posits that when firms underperform relative to social or historical aspirations, they are prone to take more risks, while they are more risk averse when performance is above aspiration levels [9]. As a result, we expect that underperforming firms competing in a dynamic high growth industry are more likely to form a positive expectation on their likelihood to benefit from innovation, view R&D investment as a valid performance-enhancing strategy, and subsequently increase their R&D expenditure in response to performance shortfalls. In contrast, firms whose performance are above historical or social aspirations may be less optimistic about their return on innovation investment, thus adopt less risky alternative strategies such as process improvement or market penetration to explore market opportunities, which lead to the following predictions:
Hypothesis 4a.
Performance shortfalls relative to social peers will result in increased R&D investment when the industry growth rate is high.
Hypothesis 4b.
Performance shortfalls relative to historical levels will result in increased R&D investment when the industry growth rate is high.
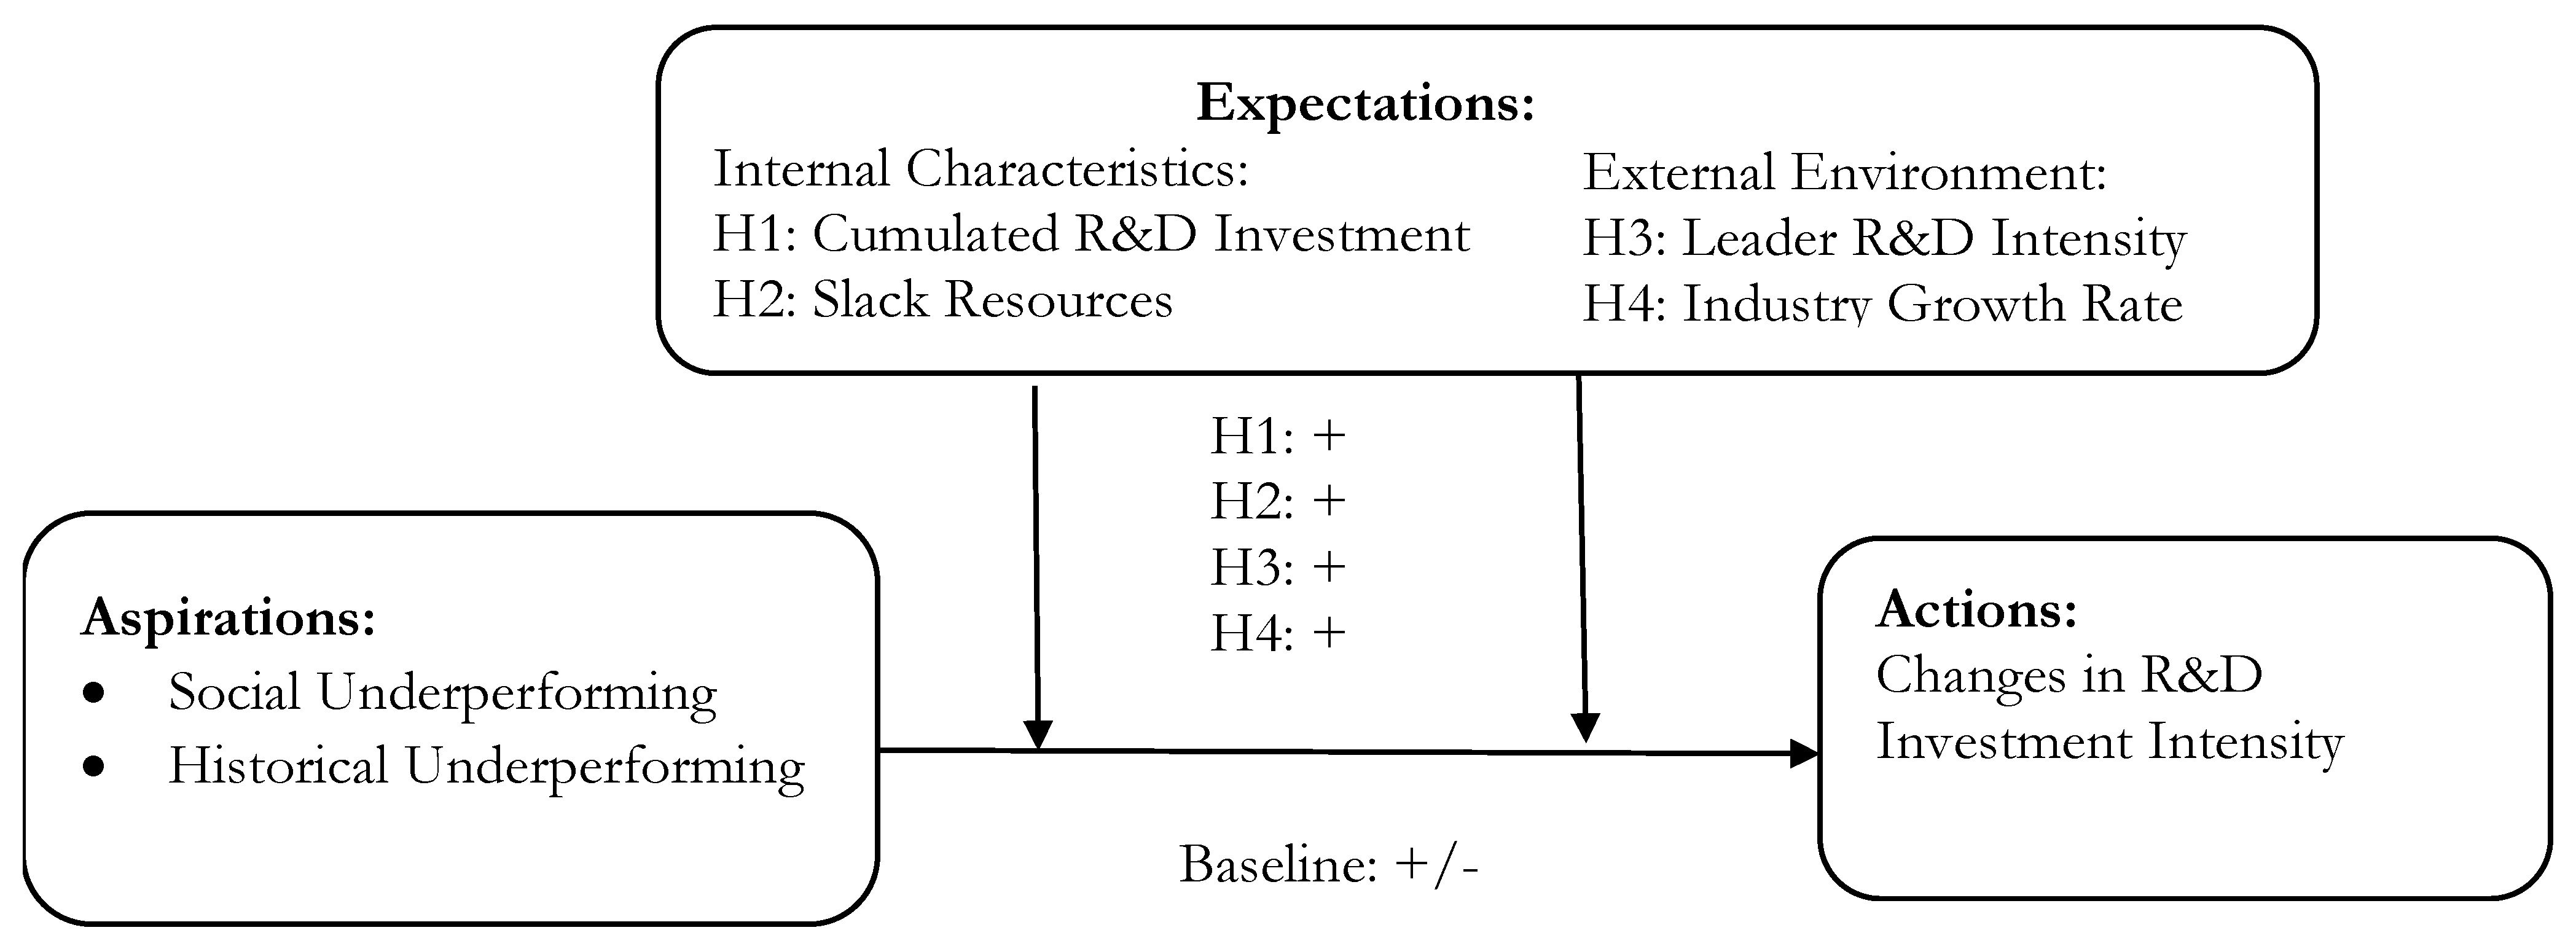
Figure 1 illustrates our hypotheses in a conceptual model.
4. Data, Measure, and Empirical Model
These research questions are examined using firms listed in the ChiNext Board of China’s Shenzhen Stock Exchange. ChiNext Board was debuted in 2009 to benchmark NASDAQ in the US to serve as a financing platform for innovative and growth oriented firms. Firms listed in the ChiNext Board are generally much smaller and younger compared to firms listed in the main board. Our sample includes all firms listed in ChiNext board between 2009 and 2017. Data on these firms are obtained from the CSMAR and Wind databases. After deleting firms without complete information, our final sample includes 596 distinct firms and 3285 firm-year observations for the period of 2009–2017.
Table 1 provides industry distribution of our sample firms. Table 1 reveals that 19.46% of our sample firms are in the software and information technology industry. The second largest industry group is computer and electronic manufacturing, which accounts for 15.44% of the total sample. 13.26% of our sample firms are special machinery manufacturing. The top three categories are all in high-tech sectors. These industry distribution patterns are consistent with the goal of ChiNext board to attract innovative small and medium sized firms. Our sample also includes firms in other manufacturing sectors, as well as utilities, agricultural, retail, construction, and entertainment industries.
Our dependent variable is R&D intensity ratio calculated as the firm’s annual R&D expenditure divided by total sales, and is denoted as R&D. Our main independent variables are performance shortfalls. First, we measure social aspiration using the median returns on asset ratio of all listed firms in the focal firm’s industry, which include both firms listed in the ChiNext board and firms listed in the main board. We label a firm as Social_Under when the firm’s return on assets ratio (ROA) is lower than the median of its industry peers, using a dummy variable taking the value of 1 when firm performance is below the social aspiration level and 0 otherwise. Second, we capture historical aspiration level as the rolling average of the firm’s ROA in the previous three years. We then create a dummy variable Historical_Under, which takes the value of one when the current year ROA is lower than its historical average and zero otherwise.
Our model also includes four sets of moderator variables. We calculate a firm’s cumulated R&D spending as the sum of its total R&D expenditure since the year of its initial public offering. We then take logarithm of this measure and denote it as R&D_Stock. We use the current ratio computed as current assets divided by current liability to capture available slack following Chen and Miller [10]. This variable is labeled as Slack. We measure the industry performance leader’s R&D intensity as its R&D expense to sales ratio and denote the variable as Leader_R&D. A firm is identified as the industry leader when it has the highest return on assets ratio in the industry in a given year, and the industry scope is defined to include all listed firms in both the Chinext Board and the main board. We measure industry growth rate using the three-year rolling average of the industry sales growth rate (denoted as Growth). We then create mean-centered interaction terms by multiply mean-centered values of R&D_Stock, Slack, Leader_R&D, and Growth with our underperformance indicators to measure moderating effects of these contingency variables. These linear transformations enable us to lessen the correlations between these multiplicative terms and their component variables.
Our model also includes a series of control variables at CEO, firm, and industry levels that may also affect a firms’ R&D investment as identified by prior studies. First, we capture the influence of CEO characteristics. It is argued that a CEO’s motivation to invest in R&D is affected by his/her tenure, age, and founder status [18]. We therefore use CEO_Age to capture the age of the CEO, CEO_Tenure to measure the CEO’s experience at the post, and CEO_Founder to indicate the CEO’s founder status. Second, we control for the influence of board and ownership structure, because a firm’s incentive to invest in innovation is heavily influenced by its internal and external corporate governance mechanisms [55]. Board_Size measures the total number of board members, Outsider_Ratio captures the proportion of independent directors on the board, and Duality is a dummy variable with one indicating a combined CEO and chairperson position and zero otherwise. Largest_SH is the percentage of shares held by the largest shareholder, which is used to capture firm ownership concentration. We also use SOE to indicate whether a firm is a state-owned enterprise whose controlling shareholder is the state. Third, our control variables also include other firm characteristics that may affect motivation and capabilities of a firm to invest in R&D [2]. We capture Firm_Size using the logarithm of total assets. We measure capital structure using the debt to asset ratio and label this variable as Debt_Ratio. We calculate Firm_Age using the current sample year minus firm founding year and plus one. Forth, we control for industry characteristics that may also affect firms’ R&D investment decisions [51,52]. We measure industry competitiveness using the Herfindahl-Hirschman Index of firm sales calculated using all listed firms in the focal firm’s industry. We label this variable as Concentration. We follow Keats and Hitt [51] to compute industry instability and denote this variable as Instability. We use five-years’ industry sales data for all listed firms in China to construct the industry growth equation and use antilogs of standard errors of each regression slope coefficient to capture instability. We apply two measures to capture the influence of industry norm on firm innovation investment. R&D_Median measures the median value of R&D intensity in the industry, which captures the level of industry norm. R&D_Entropy is the entropy ratio of R&D intensity dispersion in the industry and is used to capture the strength of industry norm. Finally, we use year dummy variables to control for macro environmental shocks on firms’ R&D investment.
As our dependent variable R&D is a proportion variable between 0 and 1, we apply a fractional response model, more specifically the fractional logit model recommended by Wooldridge [56], to conduct our analysis. Employing this model ensures that the predicted values for Y are in the [0, 1] range, thus avoiding model misspecification and dubious statistical validity. Our model is outlined below in Equation (1):
where i represents firm and t indicates year. The dependent variable is R&D. Under represents either Social_Under indicating social underperforming or Historical_Under for historical underperforming. The interaction terms of Under with mean-centered R&D_Stock, Slack, Leader_R&D, and Growth measure moderating roles of firm expectations shaped by historical R&D investment spending, slack resources, the industry leader’s R&D intensity, and industry growth rate, respectively. We expect β2, β3, β4, β5 > 0 to test H1, H2, H3, and H4. C represents control variables at CEO, firm and industry levels as elaborated above. All independent and control variables are lagged for one period to mitigate the endogeneity problem arising from the simultaneous determination of R&D intensity and other variables.
5. Empirical Results
5.1. Descriptive Analysis and Univariate Analysis
Table 2 provides a descriptive analysis of our key variables. We notice that the average R&D intensity in our sample period is 0.071, ranging from 0 to 0.984. Table 2 indicates that 39% of our sample firms underperform relative to their industry peers, and 61.3% of firms fall short of historical aspirations. Table 2 also reveals that the cumulated R&D investment in our sample is 3.925 on average and the average adaptable slack measured by the current ratio is 5.344. An industry leader on average has a R&D intensity of 0.059, and the average industry growth rate is 0.237.
In addition, an average CEO in our sample is about 50 years old with 5-year experience in the post. 50.7% of CEOs in our sample are also founders of their firms. This pattern is consistent with the goal of the ChiNext board to attract young entrepreneurial firms. An average board in our sample consists of 8 members and 38% of these members are independent directors. 43.8% of firms have a combined CEO and chairperson position. Only 2.8% of firms are state-owned enterprises, which is in sharp contrast with firms listed in the main board where SOEs account for nearly half of listed firms. The largest shareholder on average owns 32.13% of shares outstanding. In addition, an average firm in our sample has a debt to asset ratio of 0.27 and a log asset value of 6.159. An average firm is 15 years old, with the youngest being 2 years and the oldest being 41 years. Table 2 also reveals that the median industry R&D ratio is 4.519 and the average dispersion of industry R&D intensity is 4.232. In addition, the average industry sales concentration ratio is 0.078 and the average instability measure is 0.962.
We next present the correlation matrix of our key dependent and independent variables in Table 3. First of all, Table 3 reveals that both social underperforming and historical underperforming firms are associated with higher R&D intensity. In addition, a firm’s R&D stock is positively correlated with the current term R&D intensity, so is its slack resources. Table 3 also indicates a positive association between the industry leader’s R&D ratio and the focal firm’s R&D intensity. Moreover, older CEOs are associated with lower R&D intensity, while founder-CEOs are associated with higher R&D intensity. In addition, firms with larger boards are linked with lower R&D intensity, and firms with more independent boards and a combined CEO and chairperson position are associated with higher R&D intensity. Moreover, Table 3 indicates that firms with more concentrated ownership, larger size, and higher debt to asset ratios are associated with lower R&D intensity. We also find that a firm’s R&D intensity is positively related to the industry median R&D intensity and the entropy ratio, and negatively correlated with the industry concentration ratio. Overall, these results are consistent with empirical findings of previous innovation literature.
5.2. Effects of Social and Historical Underperformance on R&D
Empirical results obtained from fractional logit regressions are present in Table 4 and Table 5 with Table 4 testing the influence of social underperformance and Table 5 reporting results on historical underperformance. For both tables, Column 1 includes only independent and control variables without interaction terms to serve as the baseline. Column 2 adds the interaction of underperformance with R&D_Stock to test Hypothesis 1a and Hypothesis 1b, Column 3 adds the interaction term with Slack to test Hypothesis 2a and Hypothesis 2b, Column 4 adds the interaction with Leader_R&D to examine Hypothesis 3a and Hypothesis 3b, and Column 5 adds the interaction with Growth to investigate Hypothesis 4a and Hypothesis 4b. Finally, Column 6 includes all four sets of interaction terms simultaneously. We report average marginal effects in all models.
First, we do not observe a statistically significant relationship between social underperformance and R&D intensity in the baseline model present in Column 1 of Table 4. This result indicates that underperforming relative to social aspirations does not necessarily prompt firms to increase R&D investment. In addition, Table 4 reveals that cumulated R&D spending has a significant positive impact on the current term R&D intensity. That is, firms with historically high R&D investment levels are more likely to invest in R&D. More importantly, such a positive relation is significantly stronger among social underperforming firms than their over-performing peers, as indicated by the positive significant sign of the coefficient of Social_Under × R&D_Stock in both Columns 2 and 6. This result supports Hypothesis 1a that performance shortfalls relative to social aspirations will prompt underperforming firms to further increase their R&D intensity when these firms have larger cumulated R&D investment.
Consistent with prior literature, we also observe that a firm’s slack resource is positively related to R&D investment intensity. Importantly, we observe a statistically significant positive sign of the coefficient of Social_Under × Slack in both Columns 3 and 6 of Table 4. These results indicate that social underperformance will motivate slack abundant firms to invest even more in R&D compared to their over-performing counterparts, which confirms the prediction of Hypothesis 2a. Table 4 also reveals a positive relationship between R&D intensity of the industry leader and that of the focal firm. However, such a relationship is not established in case of social underperformance. These results indicate that although firms tend to invest more in R&D when their industry leaders have high R&D intensity, social underperforming does not intensify this relationship. Therefore, Hypothesis 3a is not validated. Finally, Table 4 reveals a significantly positive moderating effect of social underperformance on industry growth rates. In another word, socially underperforming firms increase their R&D investment to a larger degree compared to their over-performing peers when competing in a growing industry, which is consistent with the prediction of Hypothesis 4a.
Table 5 presents results on the impact of historical underperformance on R&D investment. Similar to the case of social underperformance, we do not observe that historical underperformance is associated with increased R&D intensity in the baseline model present in Column 1. In addition, Table 5 reveals that the positive relationship between cumulated R&D investment and current term R&D investment is even stronger among historical underperforming firms compared to their over-performing peers. These results support Hypothesis 1b. Moreover, we observe a statistically significant positive sign of the coefficient of Historical_Under × Slack in both Columns 3 and 6 of Table 5. These results indicate that slack abundant firms whose performance falls below historical aspiration levels are prone to invest more in R&D than their over-performing periods, which confirms the prediction of Hypothesis 2b. Interestingly, we notice that the sign of the coefficient of Historical_Under × Leader_R&D is significantly negative, which suggests that historically underperforming firms are less likely to follow their leaders’ R&D investment strategy. These results are at odd with Hypothesis 3b. Finally, Table 5 also reveals a positive moderating effect of historical underperformance on industry growth rates and validates the prediction of Hypothesis 4b.
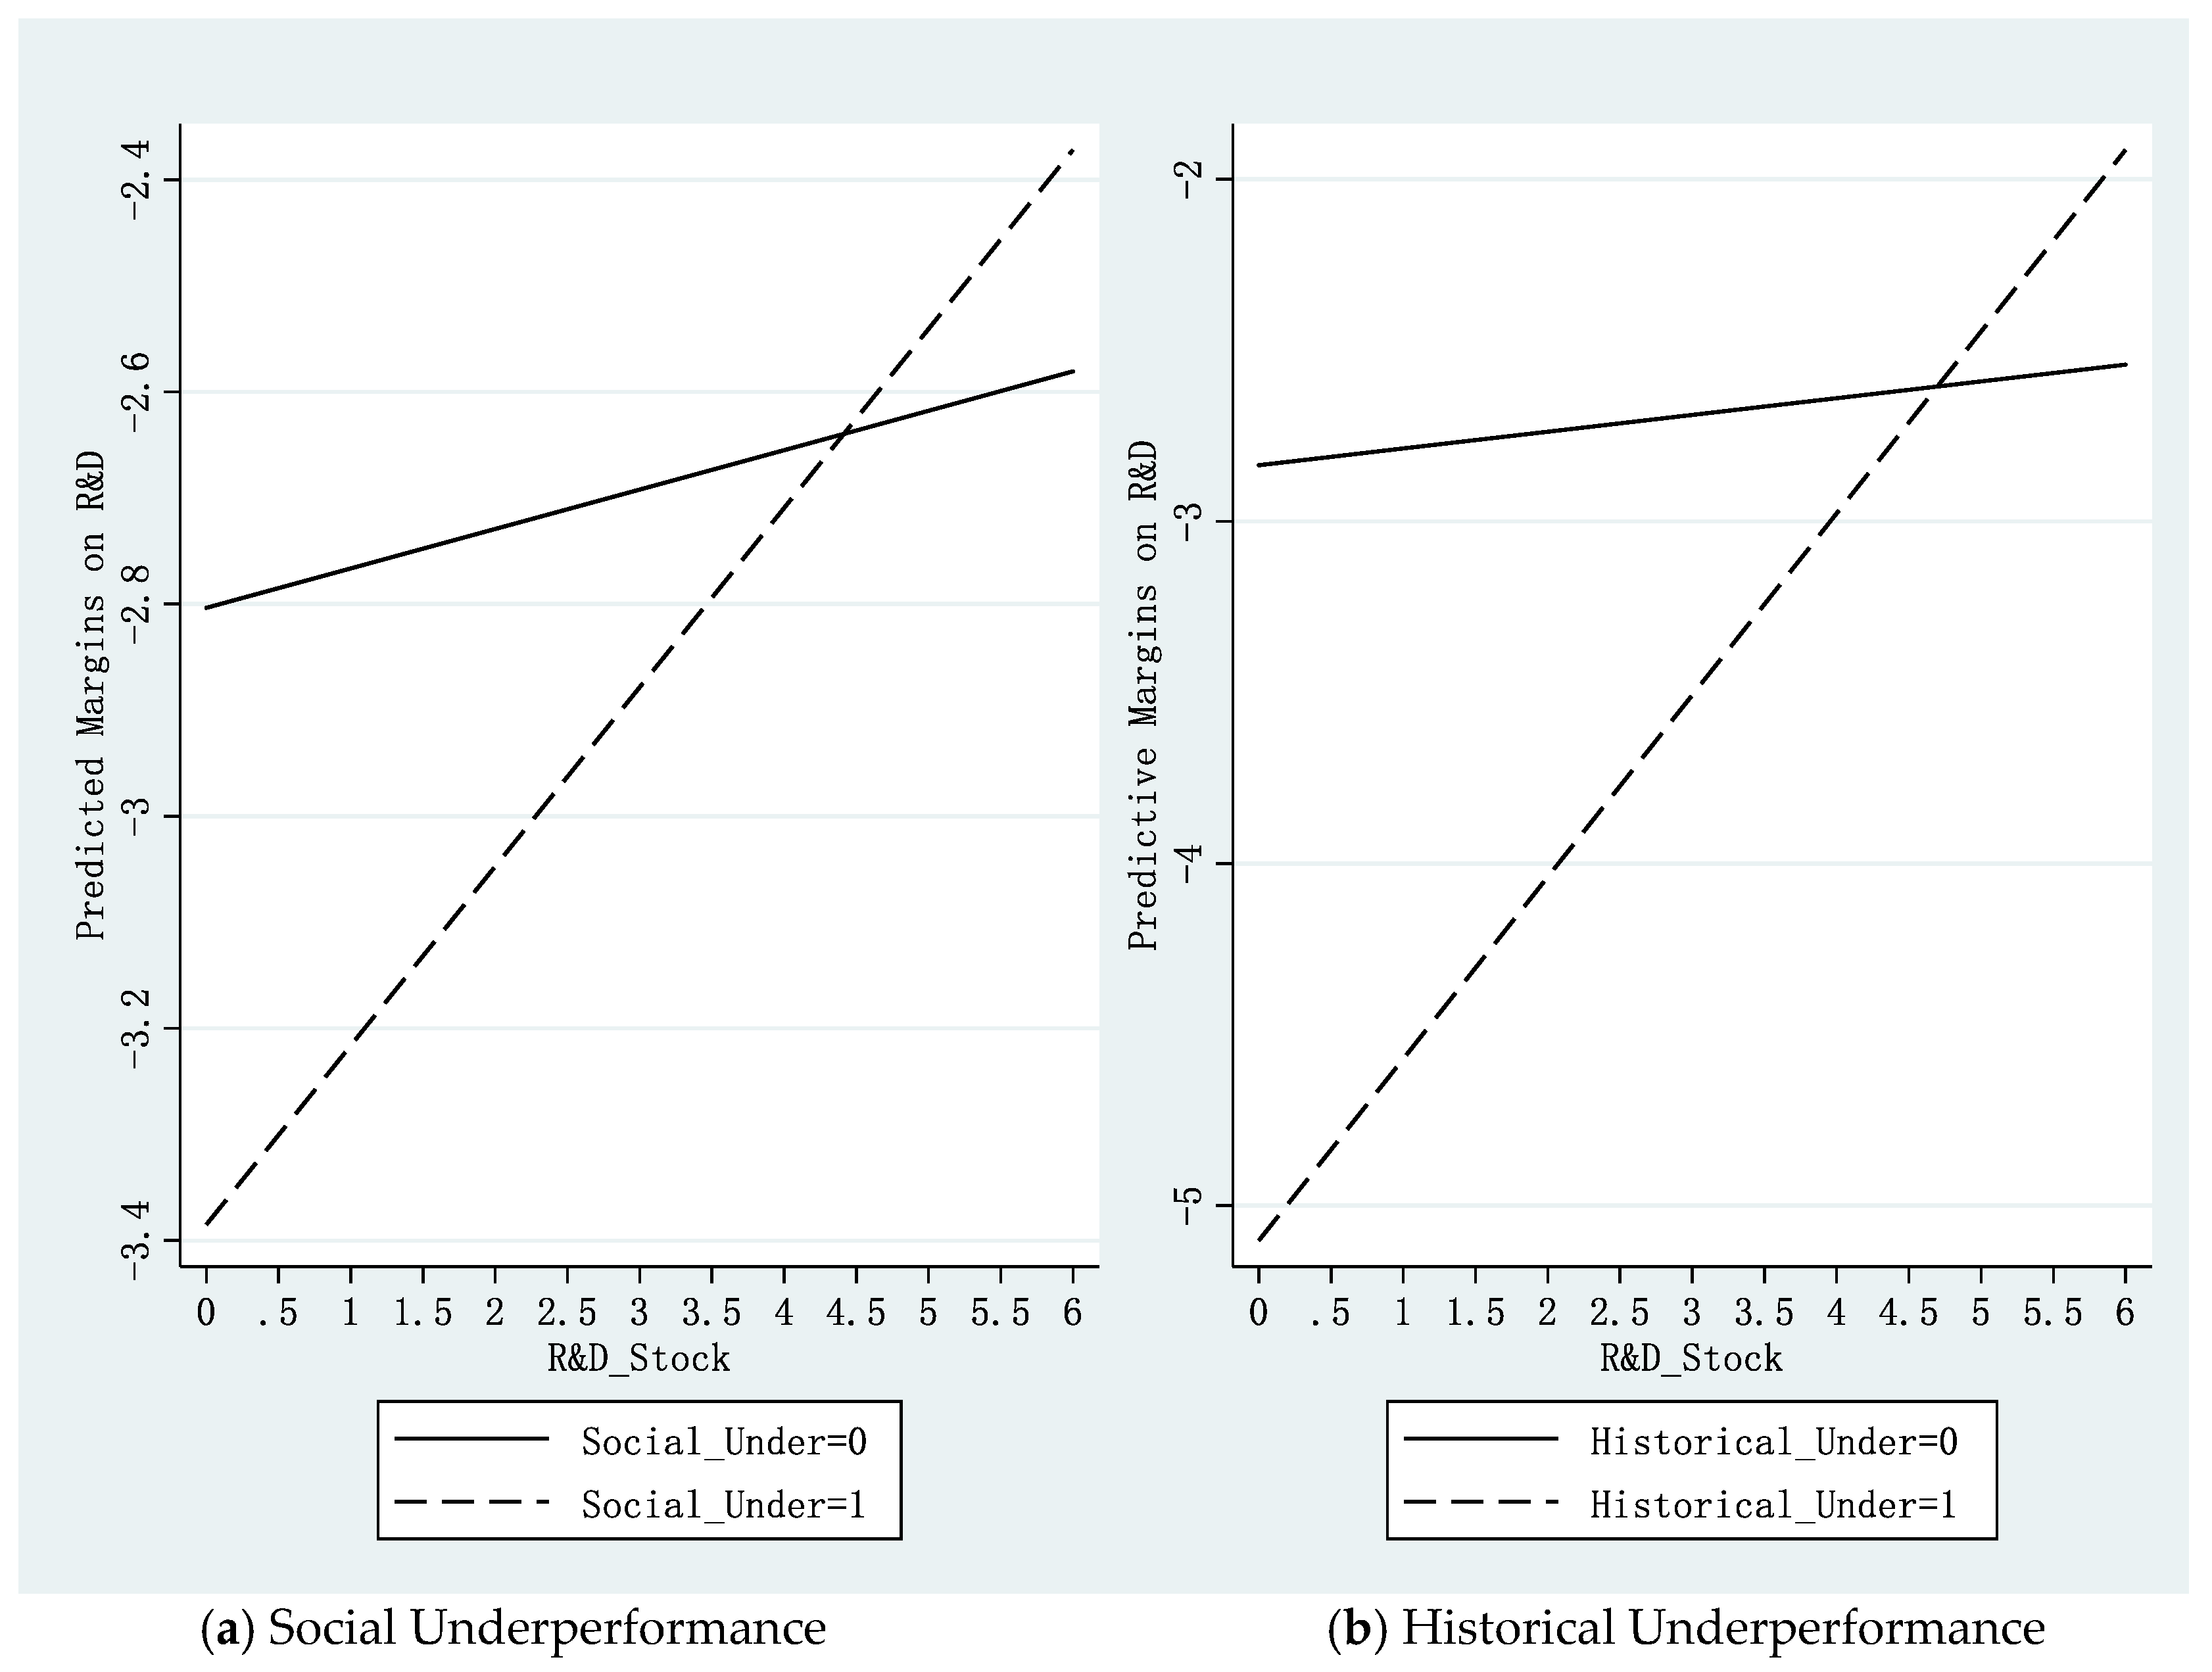
To better illustrate how firm characteristics and external environment moderate the relationship between social and historical underperformance on R&D investment, we plot the interaction effects of R&D_Stock, Slack, Leader_R&D, and Growth in Figure 2, Figure 3, Figure 4 and Figure 5, respectively. For each figure, the left side (a) shows social underperformance and the right side (b) depicts historical underperformance. Within each figure, the dotted line indicates underperforming firms, and the solid line indicates over-performing firms. The X-axis is the moderator variable constructed based on the range of sample characteristics. The Y-axis is the predicted marginal effect on R&D intensity.
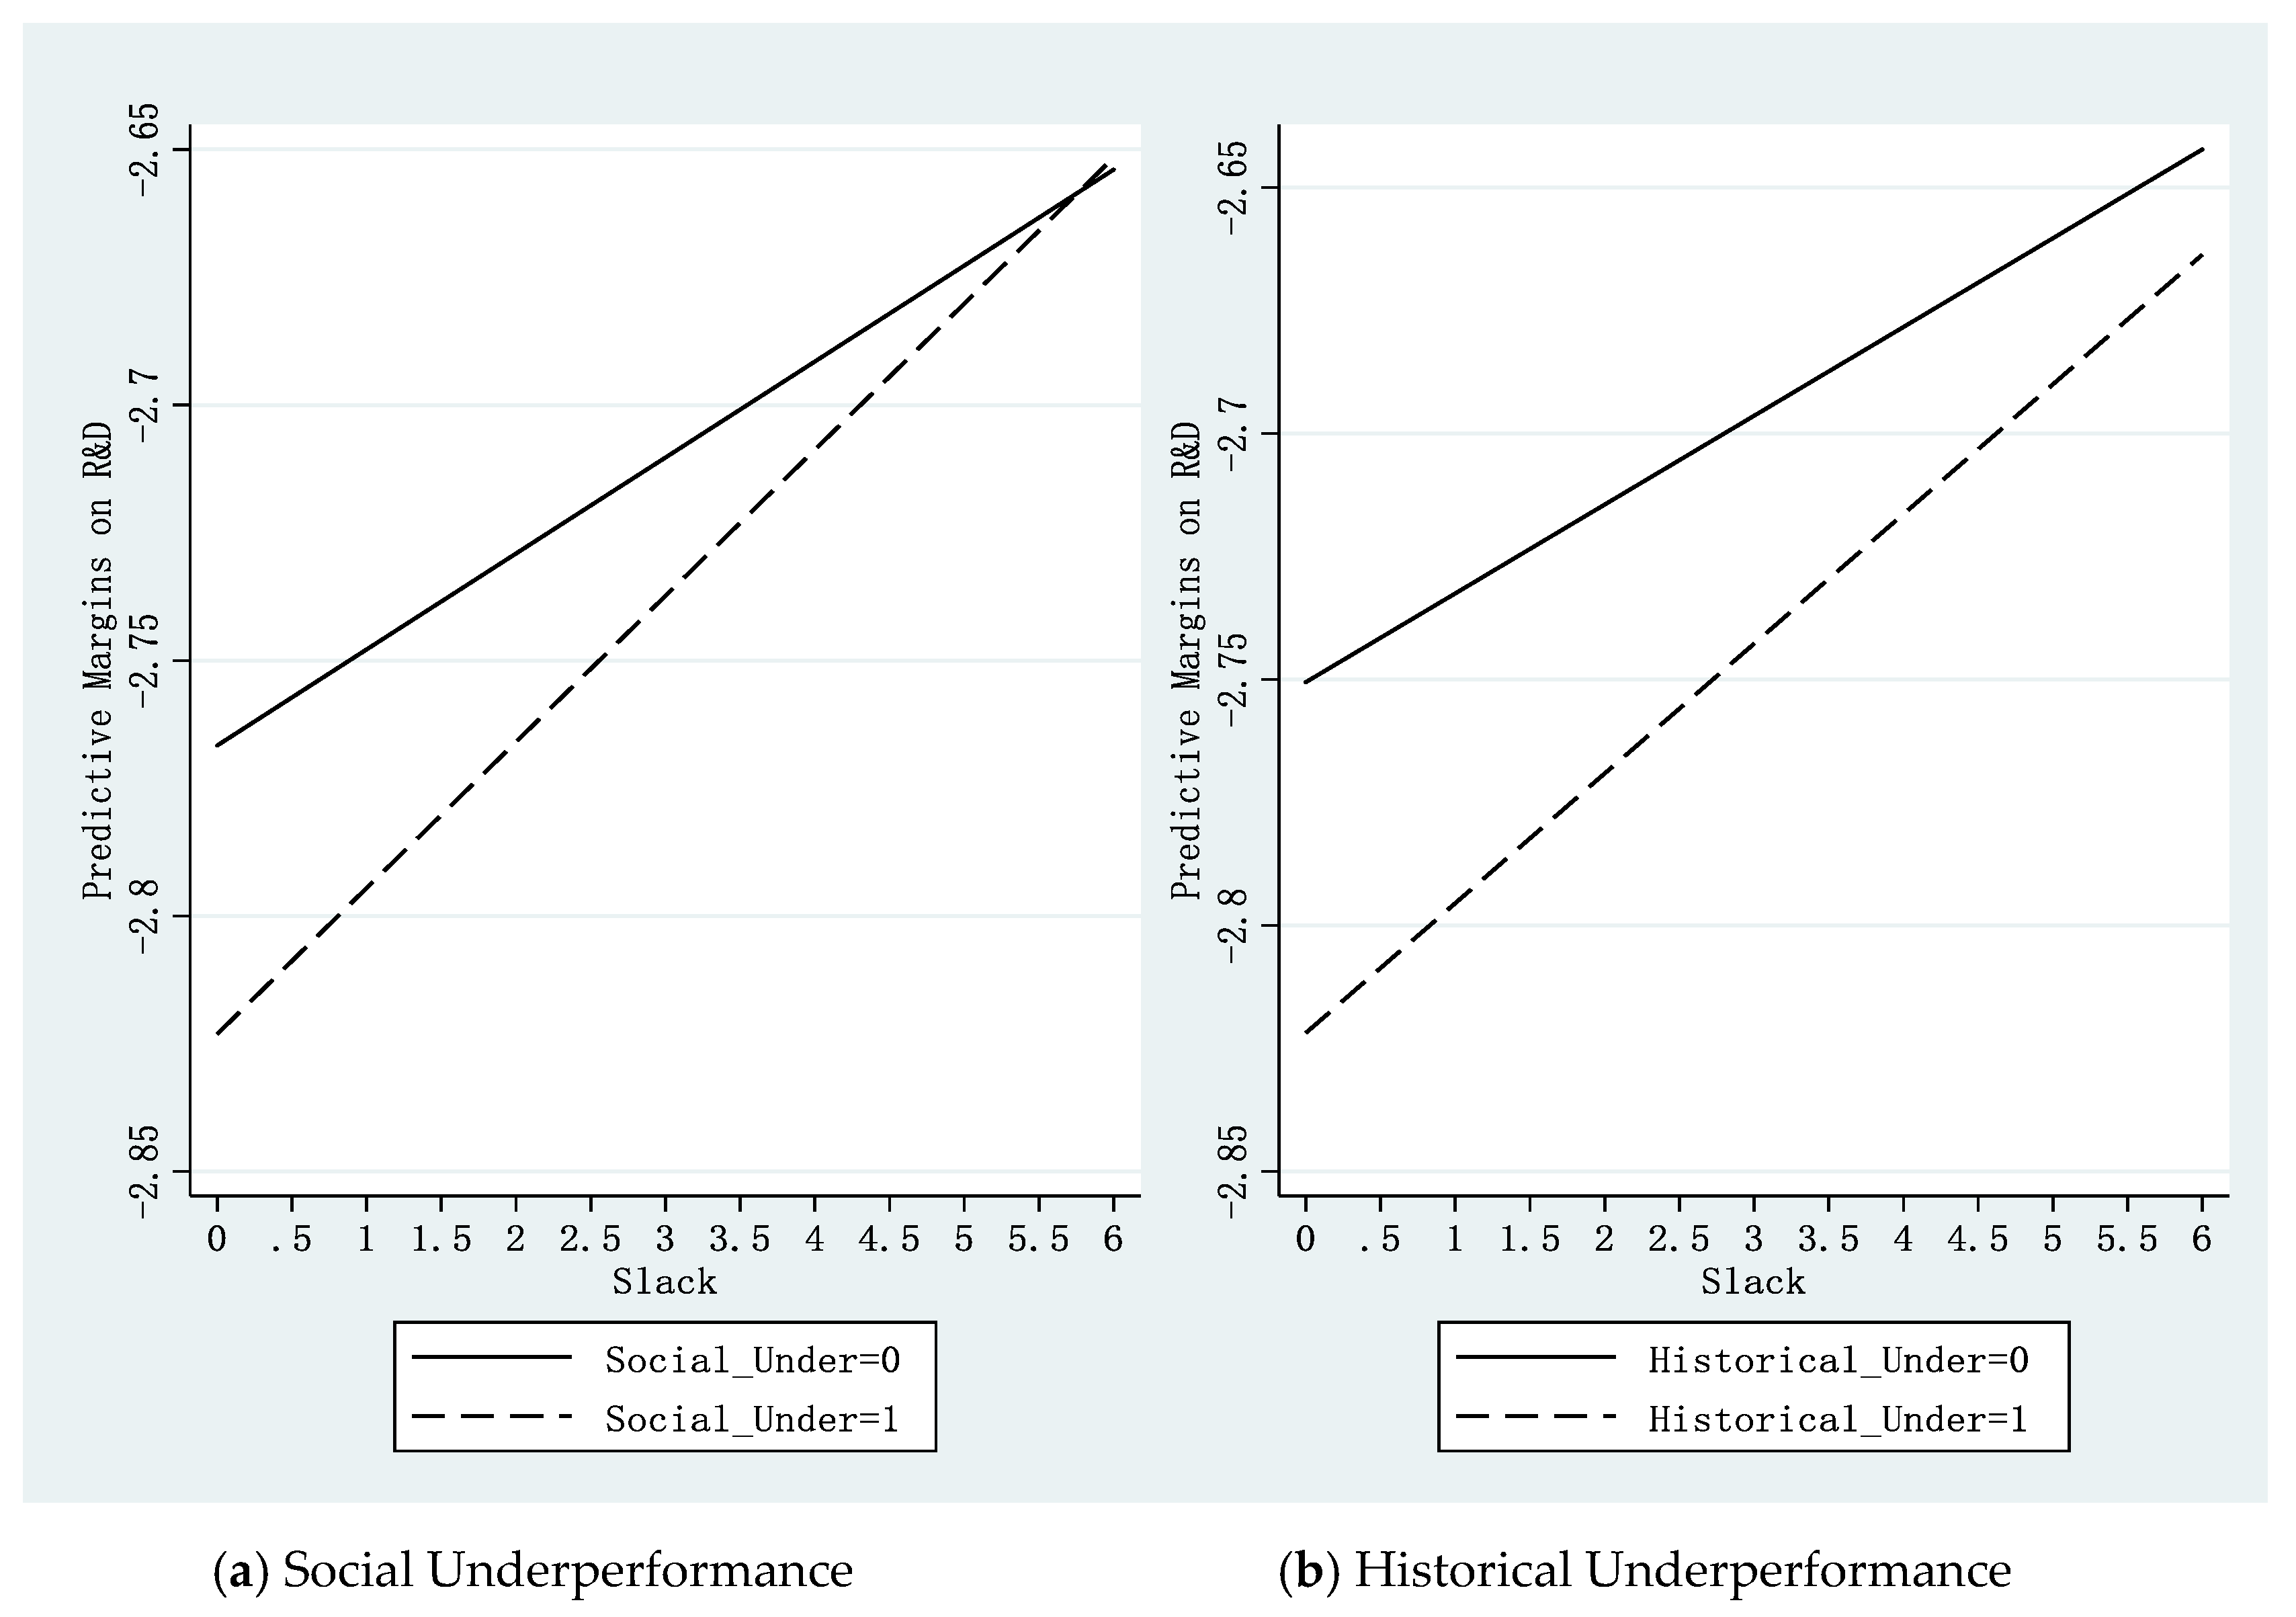
Figure 2a indicates that R&D intensity of both social underperforming and over-performing firms increases with cumulated R&D spending. The slope of underperforming firms is much steeper than that of over-performing firms, which indicates that cumulated R&D expenditure has a larger impact on social underperformers to motivate them to increase R&D investment. We observe a similar pattern in Figure 2b on historical underperformance. This pattern suggests that cumulated R&D expenditure has limited influence on firms’ R&D investment decision during the over-performing period, but has a more salient effect on firms falling short of historical aspirations. Figure 3a shows that R&D investment of both social underperformers and over-performers increases with a firm’s slack resources, but the slope of social underperformers is significantly steeper. This pattern confirms Hypothesis 2a that organizational slack has a larger impact on socially underperformed firms to motivate them to invest more in R&D. Figure 3b demonstrates the same pattern for historically underperforming firms and confirms Hypothesis 2b.
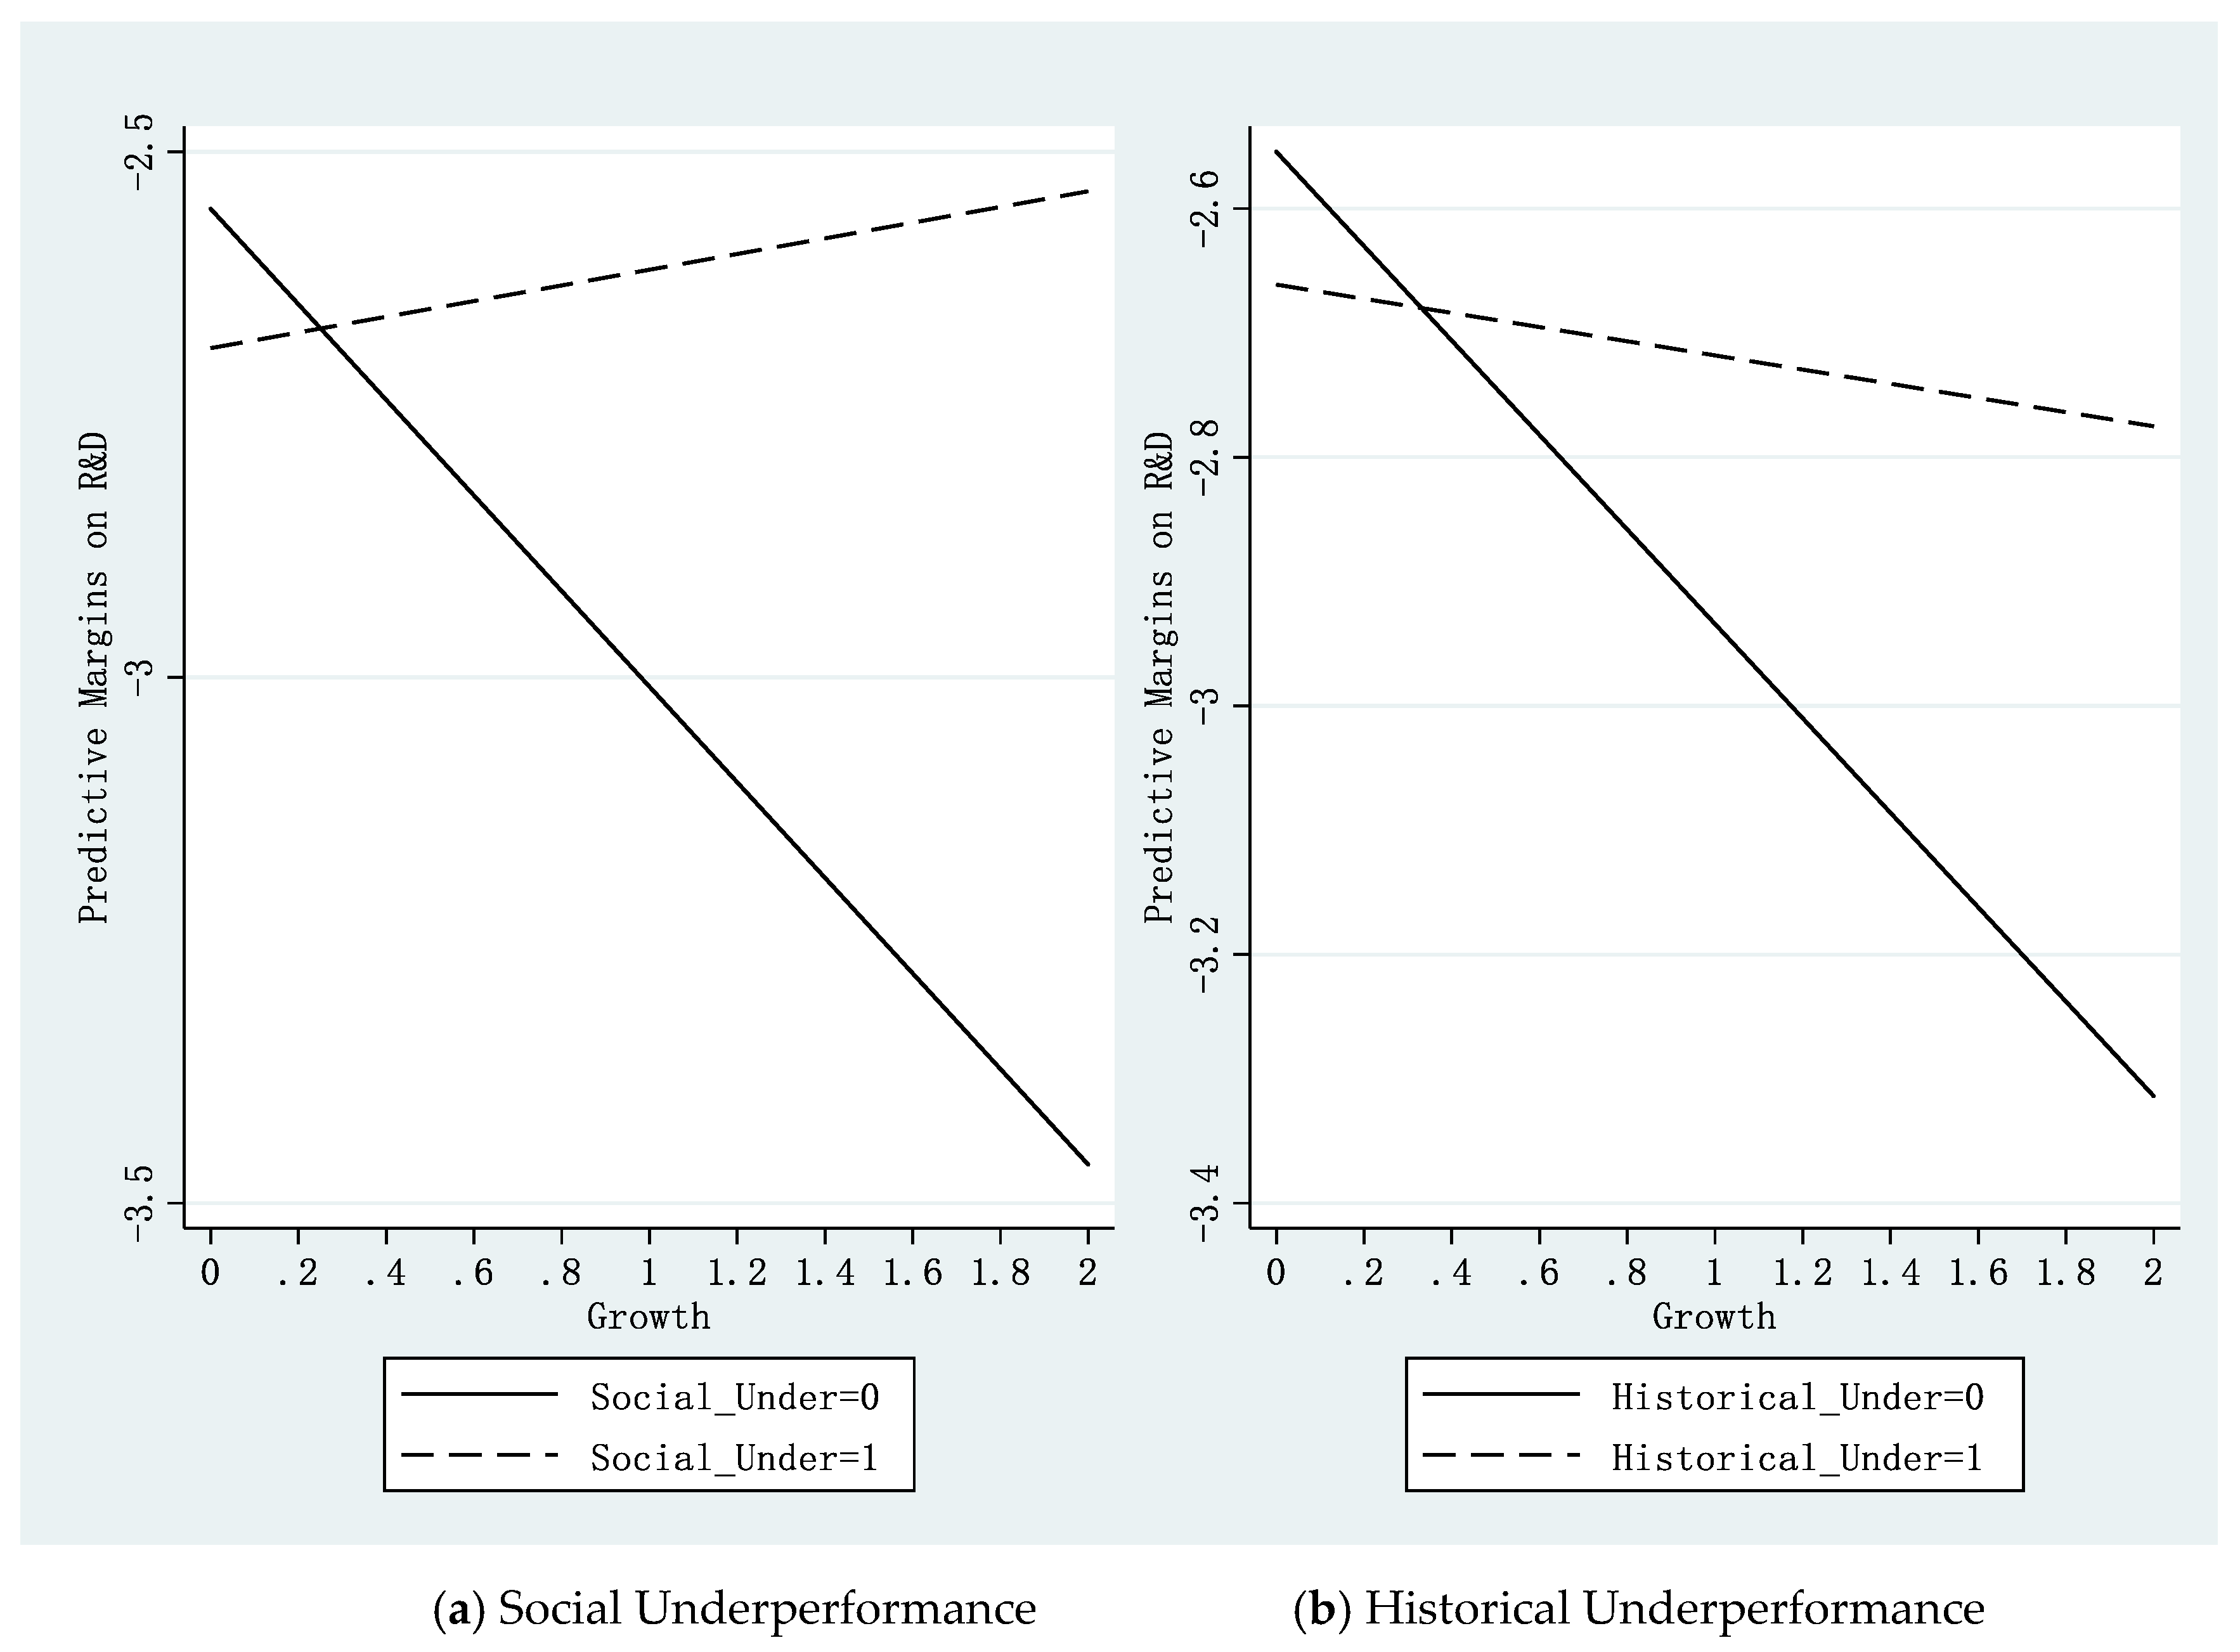
In addition, Figure 4a shows that both social underperformers and over-performers increase their R&D investment as R&D intensity of their industry leaders increases. The slope of over-performers appears to be steeper than that of social underperformers. Figure 4b reveals a similar but stronger pattern, where we find that the slope of historical underperforming firms is almost flat while the upward slope of over-performing firms is much steeper. Hypothesis 3a and Hypothesis 3b are not supported. Finally, Figure 5a demonstrates that social underperformers increase R&D investment intensity as industry growth rate increases, while overperformers decrease R&D investment when the industry is more dynamic. This pattern is consistent with the prediction of Hypothesis 4a. In terms of historical benchmark, Figure 5b indicates that firms performing both below and above historical levels reduce their R&D investment with increasing industry growth rates, such a reduction is milder when firms perform below historical levels than when they are above historical performance levels, which confirms the prediction of Hypothesis 4b. Overall, these graphs illustrate the same patterns as empirical results reported in Table 4 and Table 5, and are consistent with predictions of Hypothesis 1a, Hypothesis 1b, Hypothesis 2a, Hypothesis 2b, Hypothesis 4a and Hypothesis 4b.
6. Discussions and Conclusions
This study examines how performance shortfalls relative to social and historical aspirations may prompt underperforming firms to adjust R&D investment. More specifically, we investigate how firms’ past experience, slack resources, industry and market conditions shape their expectations on return on innovation investment, and consequently influence their responses to performance feedback. We conduct our analysis using a longitudinal sample of Chinese firms listed on the ChiNext Board between 2009 and 2017. Our results indicate that underperforming firms increase their R&D investment intensity to a larger degree than over-performing peers and periods when these firms have substantial cumulated R&D spending and abundant organizational slack. We also find that both social and historical underperformance prompts firms to increase R&D investment when they are competing in a high-growth industry. Our results also indicate that the industry leader’s R&D investment intensity negatively affects underperforming firms’ R&D investment in case of historical underperformance, but the effect is insignificant for social underperformers. In general, we conclude that a firm’s internal resources, capabilities, and external market conditions all shape its expectations on the effectiveness of innovation investment in closing performance gaps, and consequently influence firm responses to performance feedback. Heterogeneous expectations along with diverse aspirations thereby give rise to distinct innovation investment patterns.
Our study reconciles divergent findings in prior literature on the relationship between performance shortfalls and R&D investment by highlighting firm expectation as an important mechanism shaping the direction and magnitude of organizational changes, and moderating the relationship between performance aspirations and firm actions. Following an underemphasized insight of the BTOF, we predict that firm expectations are shaped by their resource endowment, past experience, industry and market environment. Heterogeneity in these internal and external contingencies gives rise to distinct expectations on the feasibility and efficacy of innovation investment in closing performance gaps, and subsequently results in diverse firm responses to performance feedback. In this sense, our paper contributes to extant literature by explicitly incorporating the concept of expectation in the investigation of firm reaction to performance feedback. We emphasize that firm actions are not only guided by their historical or social aspirations but are also influenced by their expectations of the action-outcome linkage. This angle also enriches the organizational learning theory by examining how internal and external contingencies affect firm abilities to learn from past success or failure.
To our best knowledge, our paper is the first empirical study to systematically examine effects of these internal and external contingencies on R&D investment from the angle of expectation. These research topics are examined in a sample of listed Chinese entrepreneurial firms mainly competing in high-tech industries. R&D as a crucial step toward the successful commercialization of corporate innovation is vital for firms to maintain survival, achieve growth, and obtain sustainable competitive advantage. Corporate innovation is also critical for entrepreneurial firms that are forced to compete on differentiated products and service instead of low cost because of liabilities of smallness and newness. As a result, investigating responses of these Chinese entrepreneurial firms to performance feedback also possesses important practical implications.
Our paper has limitations that point to some future research avenues. Tushman and O’Reilly [57] suggest that organizational ambidexterity, the ability to simultaneously pursue both incremental and revolutionary innovation, is essential for firms to achieve competitive advantage. Our paper treats R&D investment as an aggregated sum but do not differentiate between explorative and exploitative innovation projects. Future studies may investigate how performance aspirations and firm expectations may generate differential impacts on firm decisions to invest in exploitative versus explorative projects. In addition, our study investigates the moderating role of industry dynamism and munificence on the relationship between performance feedback and innovation inputs, but does not explore how industry characteristics may shape investment efficiency (i.e., the input to output productivity) and investment outcomes, which will be fruitful research topics as well. We use changes in R&D intensity as an example of problemistic search in this paper. BTOF is a general theory, thus firm expectations on the action-outcome link could apply to other types of strategies in addition to innovation investment. Exploring different strategic choices could also generate insights on the role of expectations in shaping firm decision.
To sum up, our paper highlights the essential role of organizational expectations in the linkage between organizational aspirations and actions. We postulate and find that firms are more likely to respond to performance shortfalls by increasing R&D investment intensity when they expect that investing in R&D will help close performance gaps. Firm expectation is influenced by its past experience, resource and capabilities, the legitimacy of competing on innovation, and the dynamism of industry environment. We hope our study will enrich the application of the Behavioral Theory of the Firm as a powerful conceptual and analytical framework to explain firm strategic choices, and provide important practical implications on how firms could gain and sustain competitive advantage through innovation.
Author Contributions
Conceptualization, L.H. (Lerong He); methodology, L.H. (Liying Huang); software, L.H. (Liying Huang); validation, L.H. (Lerong He); formal analysis, L.H. (Liying Huang); investigation, L.H. (Liying Huang); resources, G.Y.; data curation, L.H. (Liying Huang); writing—original draft preparation, L.H. (Lerong He); writing—review and editing, L.H. (Lerong He); supervision, L.H. (Lerong He); project administration, G.Y.; funding acquisition, G.Y. All authors have read and agreed to the published version of the manuscript.
Funding
This research was funded by National Science Foundation of China grant # 71673048 “Information Disclosure and Market Competition under Information Asymmetry: Theory, Evidence and Policy”.
Institutional Review Board Statement
Not applicable.
Informed Consent Statement
No applicable.
Acknowledgments
We would like to thank conference participants at Management and Organization Review Conference to “Remember Jim March” hosted at Ningbo Nottingham University and discussants at the 2019 Academy of Management Annual Meeting OMT division PDW workshop for valuable comments on early versions of this paper. Financial support from the National Science Foundation of China Grant #71673048 is greatly appreciated.
Conflicts of Interest
The authors declare no conflict of interest.
References
- Ahlstrom, D. Innovation and Growth: How Business Contributes to Society. Acad. Manag. Perspect. 2010, 8, 10–23. [Google Scholar]
- Ahuja, G.; Lampert, C.M.; Tandon, V. Moving Beyond Schumpeter: Management Research on the Determinants of Technological Innovation. Acad. Manag. Ann. 2008, 2, 1–98. [Google Scholar] [CrossRef]
- Holmstrom, B. Agency Costs and Innovation. J. Econ. Behav. Organ. 1989, 12, 305–327. [Google Scholar] [CrossRef] [Green Version]
- Ederer, F.; Manso, G. Is Pay for Performance Detrimental to Innovation? Manag. Sci. 2013, 59, 1496–1513. [Google Scholar] [CrossRef] [Green Version]
- Hsu, P.H.; Tian, X.; Xu, Y. Financial Development and Innovation: Cross-Country Evidence. J. Financ. Econ. 2014, 112, 116–135. [Google Scholar] [CrossRef] [Green Version]
- Moser, P. How Do Patent Laws Influence Innovation? Evidence from Nineteenth-Century World’s Fairs. Am. Econ. Rev. 2005, 95, 1214–1236. [Google Scholar] [CrossRef]
- Cyert, R.; March, J. A Behavioral Theory of the Firm; Prentice Hall: Englewood Cliffs, NJ, USA, 1963. [Google Scholar]
- Gavetti, G.; Greve, H.R.; Levinthal, D.A.; Ocasio, W. The Behavioral Theory of the Firm: Assessment and Prospects. Acad. Manag. Ann. 2012, 6, 1–40. [Google Scholar] [CrossRef]
- Shinkle, G.A. Organizational Aspirations, Reference Points, and Goals: Building on the Past and Aiming for the Future. J. Manag. 2012, 38, 415–455. [Google Scholar] [CrossRef]
- Chen, W.R.; Miller, K.D. Situational and institutional determinants of firms’ R&D search intensity. Strateg. Manag. J. 2010, 28, 369–381. [Google Scholar]
- Greve, H.R. Positional Rigidity: Low Performance and Resource Acquisition in Large and Small Firms. Strateg. Manag. J. 2015, 32, 103–114. [Google Scholar] [CrossRef]
- Shimizu, K. Prospect Theory, Behavioral Theory, and the Threat-Rigidity Thesis: Combinative Effects on Organizational Decisions to Divest Formerly Acquired Units. Acad. Manag. J. 2007, 50, 1495–1514. [Google Scholar] [CrossRef]
- Yu, W.; Minniti, M.; Nason, R. Underperformance Duration and Innovative Search: Evidence from the High-Tech Manufacturing Industry. Strateg. Manag. J. 2019, 40, 836–861. [Google Scholar] [CrossRef]
- Gavetti, G.; Levinthal, D. Looking Forward and Looking Backward: Cognitive and Experiential Search. Adm. Sci. Q. 2000, 45, 113–137. [Google Scholar] [CrossRef] [Green Version]
- Cyert, R.; Dill, W.; March, J. The Role of Expectations in Business Decision Making. Adm. Sci. Q. 1958, 3, 307–340. [Google Scholar] [CrossRef]
- Eggers, J.P.; Suh, J.H. Experience and Behavior: How Negative Feedback in New Versus Experienced Domains Affects Firm Action and Subsequent Performance. Acad. Manag. J. 2019, 62, 309–334. [Google Scholar] [CrossRef]
- Klingebiel, R. Risk-Type Preference Shifts in Response to Performance Feedback. Strateg. Organ. 2018, 16, 141–166. [Google Scholar] [CrossRef]
- Barker, V.L.; Mueller, G.C. CEO Characteristics and Firm R&D Spending. Manag. Sci. 2002, 48, 782–801. [Google Scholar]
- Tarakci, M.; Ates, N.Y.; Floyd, S.W.; Ahn, Y.; Wooldridge, B. Performance Feedback and Middle Managers’ Divergent Strategic Behavior: The Roles of Social Comparisons and Organizational Identification. Strateg. Manag. J. 2018, 1139–1162. [Google Scholar] [CrossRef] [Green Version]
- Greenhalgh, C.; Rogers, M. The Value of Innovation: The Interaction of Competition, R&D and IP. Res. Policy 2006, 35, 562–580. [Google Scholar]
- Peneder, M.; Woerter, M. Competition, R&D and Innovation: Testing the Inverted-U in Simultaneous System. J. Evol. Econ. 2014, 24, 653–687. [Google Scholar]
- Posen, H.; Keil, T.; Kim, S.; Meissner, F. Renewing Research on Problemistic Search-A Review and Research Agenda. Acad. Manag. Ann. 2018, 12, 208–251. [Google Scholar] [CrossRef] [Green Version]
- Audia, P.G.; Greve, H.R. Less Likely to Fail: Low Performance, Firm Size, and Factory Expansion in the Shipbuilding Industry. Oper. Res. 2006, 46, 659–661. [Google Scholar] [CrossRef] [Green Version]
- Blettner, D.P.; He, Z.L.; Hu, S.; Bettis, R.A. Adaptive Aspirations and Performance Heterogeneity: Attention Allocation among Multiple Reference Points. Strateg. Manag. J. 2006, 36, 987–1005. [Google Scholar] [CrossRef]
- Kuusela, P.; Keil, T.; Maula, M. Driven by Aspirations, but in What Direction? Performance Shortfalls, Slack Resources, and Resource-Consuming vs. Resource-Freeing Organizational Change. Strateg. Manag. J. 2017, 38, 1101–1120. [Google Scholar] [CrossRef]
- Kahnaman, D.; Tversky, K.A. Prospect Theory: An Analysis of Decision under Risk. Econometrica 1979, 47, 263–291. [Google Scholar] [CrossRef] [Green Version]
- Hoskisson, R.E.; Chirico, F.; Zyung, J.D.; Gambeta, E. Managerial Risk Taking: A Multitheoretical Review and Future Research Agenda. J. Manag. 2017, 43, 137–169. [Google Scholar] [CrossRef] [Green Version]
- Kacperczyk, A.; Beckman, C.M.; Moliterno, T.P. Disentangling Risk and Change: Internal and External Social Comparison in the Mutual Fund Industry. Adm. Sci. Q. 2015, 60, 228–262. [Google Scholar] [CrossRef] [Green Version]
- Bromiley, P. Testing a Causal Model of Corporate Risk Taking and Performance. Acad. Manag. J. 1991, 34, 37–59. [Google Scholar]
- Iyer, D.; Miller, K. Performance Feedback, Slack, and the Timing of Acquisitions. Acad. Manag. J. 2008, 51, 808–822. [Google Scholar]
- Lucas, G.; Knoben, J.; Meeus, M. Contradictory yet Coherent? Inconsistency in Performance Feedback and R&D Investment Change. J. Manag. 2018, 44, 658–681. [Google Scholar]
- Smulowitz, S.J.; Rousseau, H.E.; Bromiley, P. The Behavioral Theory of the (Community-Oriented) Firm: The Differing Response of Community-Oriented Firms to Performance Relative to Aspirations. Strateg. Manag. J. 2020, 41, 1023–1053. [Google Scholar] [CrossRef] [Green Version]
- Rudy, B.C.; Johnson, A.F. Performance, Aspirations, and Market versus Nonmarket Investment. J. Manag. 2016, 42, 936–959. [Google Scholar] [CrossRef]
- Staw, B.M.; Dutton, S.J.E. Threat Rigidity Effects in Organizational Behavior: A Multilevel Analysis. Adm. Sci. Q. 1981, 26, 501–524. [Google Scholar] [CrossRef]
- Kim, J.Y.J.; Finkelstein, S.; Haleblian, J.J. All Aspirations are not Created Equal: The Differential Effects of Historical and Social Aspirations on Acquisition Behavior. Acad. Manag. J. 2014, 58, 1361–1388. [Google Scholar] [CrossRef]
- Lv, D.D.; Chen, W.; Zhu, H.; Lan, H. How Does Inconsistent Negative Performance Feedback Affect the R&D Investments of Firms? A Study of Publicly Listed Firms. J. Bus. Res. 2019, 102, 151–162. [Google Scholar]
- March, J.; Simon, H. Organizations; Willey: New York, NY, USA, 1958. [Google Scholar]
- Bromiley, P.; Rau, D.; Zhang, Y. Is R&D Risky? Strateg. Manag. J. 2017, 38, 876–891. [Google Scholar]
- Nohria, N.; Gulati, R. Is Slack Good or Bad for Innovation? Acad. Manag. J. 1996, 39, 1245–1264. [Google Scholar] [CrossRef] [Green Version]
- Cheng, J.L.C.; Kesner, I.F. Organizational Slack and Response to Environmental Shifts: The Impact of Resource Allocation Patterns. J. Manag. 1997, 23, 1–18. [Google Scholar] [CrossRef]
- Marlin, D.; Geiger, S.W. A Reexamination of the Organizational Slack and Innovation Relationship. J. Bus. Res. 2015, 68, 2683–2690. [Google Scholar] [CrossRef]
- Duran, P.; Kammerlander, N.; Van Essen, M.; Zellweger, T. Doing More with Less: Innovation Input and Output in Family Firms. Acad. Manag. J. 2016, 59, 1224–1264. [Google Scholar] [CrossRef] [Green Version]
- Greve, H.R. A Behavioral Theory of R&D Expenditures and Innovations: Evidence from Shipbuilding. Acad. Manag. J. 2003, 46, 685–702. [Google Scholar]
- Haveman, H.A. Follow the Leader: Mimetic Isomorphism and Entry into New Markets. Adm. Sci. Q. 1993, 38, 593–627. [Google Scholar] [CrossRef]
- Dimaggio, P.J.; Powell, W.W. The Iron Cage Revisited: Institutional Isomorphism and Collective Rationality in Organizational Fields. Am. Sociol. Rev. 1983, 48, 147–160. [Google Scholar] [CrossRef] [Green Version]
- Haunschild, P.R.; Miner, A.S. Modes of Interorganizational Imitations: The Effects of Outcome Salience and Uncertainty. Adm. Sci. Q. 1997, 42, 472–500. [Google Scholar] [CrossRef]
- Kostova, T.; Roth, K. Adoption of an Organizational Practice by Subsidiaries of Multinational Corporations: Institutional and Relational Effects. Acad. Manag. J. 2002, 45, 215–233. [Google Scholar]
- Lieberman, M.; Asaba, S. Why Do Firms Imitate Each Other? Acad. Manag. Rev. 2006, 31, 366–385. [Google Scholar] [CrossRef] [Green Version]
- Greve, H.R.; Taylor, A. Innovations as Catalysts for Organizational Change: Shifts in Organizational Cognition and Search. Adm. Sci. Q. 2000, 45, 54–80. [Google Scholar] [CrossRef]
- Schumpeter, J.A. The Theory of Economic Development; Harvard University Press: Cambridge, MA, USA, 1991. [Google Scholar]
- Keats, B.W.; Hitt, M.A. A Causal Model of Linkages among Environmental Dimensions, Macro Organizational Characteristics, and Performance. Acad. Manag. J. 1988, 31, 570–598. [Google Scholar]
- Dess, G.; Beard, D.W. Dimensions of Organizational Task Environments. Adm. Sci. Q. 1984, 29, 52–73. [Google Scholar] [CrossRef]
- Nadkarni, S.; Chen, J. Bridging Yesterday, Today, and Tomorrow: CEO Temporal Focus, Environmental Dynamism, and Rate of New Product Introduction. Acad. Manag. J. 2014, 57, 1810–1833. [Google Scholar] [CrossRef]
- Wang, H.; Li, J. Untangling the Effects of Overexploration and Overexploitation on Organizational Performance: The Moderating Role of Environmental Dynamism. J. Manag. 2008, 34, 925–951. [Google Scholar]
- Belloc, F. Corporate Governance and Innovation: A Survey. J. Econ. Surv. 2011, 26, 835–864. [Google Scholar] [CrossRef]
- Wooldridge, J.M. Econometric Analysis of Cross Section and Panel Data; MIT Press: Cambridge/London, UK, 2010. [Google Scholar]
- Tushman, M.; O’Reilly, C. Ambidextrous Organizations: Managing Evolutionary and Revolutionary Change. Calif. Manag. Rev. 1996, 53, 8–30. [Google Scholar] [CrossRef] [Green Version]
Figure 1.
Conceptual Model.

Figure 2.
Moderating Role of Cumulated R&D Investment.

Figure 3.
Moderating Role of Slack Resources.

Figure 4.
Moderating Role of the Industry Leader’s R&D Investment.

Figure 5.
Moderating Role of Industry Growth Rate.


Table 1.
Industry Distribution of Sample Firms.
| Industries | Firm Number | Frequency | Observation Number | Frequency |
|---|---|---|---|---|
| Agriculture, Forestry and Fishery | 8 | 1.34 | 50 | 1.52 |
| Mining | 4 | 0.67 | 31 | 0.94 |
| Food Processing and Manufacturing | 7 | 1.18 | 43 | 1.31 |
| Chemical Manufacturing | 43 | 7.21 | 230 | 7.00 |
| Pharmaceutical | 41 | 6.88 | 243 | 7.4 |
| Rubber and Plastic Manufacturing | 20 | 3.36 | 101 | 3.07 |
| Nonmetal Manufacturing | 14 | 2.35 | 95 | 2.89 |
| Metal Processing and Manufacturing | 9 | 1.51 | 36 | 1.10 |
| Common Machinery Manufacturing | 26 | 4.36 | 166 | 5.05 |
| Special Machinery Manufacturing | 79 | 13.26 | 402 | 12.24 |
| Automobile Manufacturing | 7 | 1.17 | 35 | 1.07 |
| Infrastructure equipment Manufacturing | 5 | 0.84 | 14 | 0.43 |
| Electrical Machinery Manufacturing | 46 | 7.72 | 286 | 8.71 |
| Computer and Telecom. Manufacturing | 92 | 15.44 | 494 | 15.04 |
| Instrumentation Manufacturing | 27 | 4.53 | 139 | 4.23 |
| Other Manufacturing | 5 | 0.84 | 26 | 0.79 |
| Construction | 7 | 1.17 | 40 | 1.22 |
| Retail and Wholesale | 6 | 1.0 | 42 | 1.2 |
| Software and Information Technology | 116 | 19.46 | 612 | 18.63 |
| Leasing and Business Service | 4 | 0.67 | 29 | 0.88 |
| Technology Service | 12 | 2.01 | 59 | 1.8 |
| Public Service | 8 | 1.34 | 54 | 1.62 |
| Entertainment | 10 | 1.68 | 59 | 1.8 |
| Total | 596 | 100 | 3285 | 100 |
Table 2.
Descriptive Analysis of Key Variables.
| Variables | N | Mean | SD | Min | P25 | P50 | P75 | Max |
|---|---|---|---|---|---|---|---|---|
| Dependent Variable | ||||||||
| R&D | 3285 | 0.071 | 0.068 | 0.000 | 0.036 | 0.051 | 0.082 | 0.984 |
| Independent Variables | ||||||||
| Social_Under | 3285 | 0.390 | 0.488 | 0.000 | 0.000 | 0.000 | 1.000 | 1.000 |
| Historical_Under | 3285 | 0.613 | 0.487 | 0.000 | 0.000 | 1.000 | 1.000 | 1.000 |
| Moderators | ||||||||
| R&D_Stock | 3285 | 3.925 | 1.917 | 0.000 | 4.112 | 4.662 | 5.083 | 6.666 |
| Slack | 3285 | 5.344 | 7.510 | 0.373 | 1.802 | 3.020 | 5.961 | 14.000 |
| Leader_R&D | 3285 | 0.059 | 0.056 | 0.000 | 0.014 | 0.040 | 0.090 | 0.213 |
| Growth | 3285 | 0.237 | 0.211 | −0.086 | 0.151 | 0.211 | 0.272 | 2.348 |
| Control Variables-CEO Characteristics | ||||||||
| CEO_Age | 3285 | 48.48 | 6.268 | 28.000 | 44.000 | 49.000 | 53.000 | 71.000 |
| CEO_Tenure | 3285 | 4.869 | 2.651 | 1.000 | 3.000 | 4.000 | 7.000 | 18.000 |
| CEO_Founder | 3285 | 0.507 | 0.500 | 0.000 | 0.000 | 1.000 | 1.000 | 1.000 |
| Control Variables-Corporate Governance Structure | ||||||||
| Board_Size | 3285 | 8.084 | 1.431 | 4.000 | 7.000 | 9.000 | 9.000 | 14.000 |
| Outsider_Ratio | 3285 | 0.380 | 0.055 | 0.250 | 0.333 | 0.364 | 0.429 | 0.600 |
| Duality | 3285 | 0.438 | 0.496 | 0.000 | 0.000 | 0.000 | 1.000 | 1.000 |
| SOE | 3285 | 0.028 | 0.165 | 0.000 | 0.000 | 0.000 | 0.000 | 1.000 |
| Largest_SH | 3285 | 32.130 | 12.980 | 4.150 | 22.410 | 30.200 | 40.169 | 89.850 |
| Control Variables-Firm Characteristics | ||||||||
| Firm_Size | 3285 | 6.159 | 0.353 | 5.112 | 5.918 | 6.110 | 6.375 | 7.691 |
| Debt_Ratio | 3285 | 0.270 | 0.166 | 0.011 | 0.135 | 0.242 | 0.380 | 1.037 |
| Firm_Age | 3285 | 14.65 | 4.426 | 2.000 | 11.000 | 14.000 | 17.000 | 41.000 |
| Control Variables-Industry Characteristics | ||||||||
| R&D_Median | 3285 | 4.519 | 2.467 | 0.000 | 3.160 | 4.137 | 5.356 | 11.68 |
| R&D_Entropy | 3285 | 4.232 | 1.078 | 0.000 | 3.758 | 4.621 | 4.966 | 5.557 |
| Concentration | 3285 | 0.078 | 0.115 | 0.014 | 0.022 | 0.046 | 0.071 | 0.944 |
| Instability | 3285 | 0.962 | 0.050 | 0.851 | 0.924 | 0.947 | 0.982 | 1.241 |
Table 3.
Correlation Matrix of Key Variables.
| [1] | [2] | [3] | [4] | [5] | [6] | [7] | [8] | [9] | [10] | [11] | [12] | [13] | [14] | [15] | [16] | [17] | [18] | |
|---|---|---|---|---|---|---|---|---|---|---|---|---|---|---|---|---|---|---|
| R&D [1] | 1 | |||||||||||||||||
| Social_Under [2] | 0.09 * | 1 | ||||||||||||||||
| Historical_Under [3] | 0.10 * | 0.30 * | 1 | |||||||||||||||
| R&D_Stock [4] | 0.12 * | 0.29 * | 0.50 * | 1 | ||||||||||||||
| Slack [5] | 0.31 * | −0.08 * | −0.02 | −0.19 * | 1 | |||||||||||||
| Leader_R&D [6] | 0.28 * | 0.06 * | 0.01 | 0.09 * | −0.02 | 1 | ||||||||||||
| Growth [7] | −0.01 | 0.06 * | 0.06 * | 0.03 | −0.00 | 0.03 | 1 | |||||||||||
| CEO_Age [8] | −0.06 * | 0.03 | 0.02 | 0.10 * | −0.06 * | −0.02 | −0.00 | 1 | ||||||||||
| CEO_Tenure [9] | 0.02 | 0.17 * | 0.12 * | 0.44 * | −0.12 * | 0.04 * | −0.04 * | 0.18 * | 1 | |||||||||
| CEO_Founder [10] | 0.05 * | −0.07 * | −0.01 | −0.11 * | 0.08 * | 0.01 | −0.01 | 0.11 * | 0.18 * | 1 | ||||||||
| Board_Size [11] | −0.05 * | −0.04 * | −0.04 * | −0.03 | −0.01 | −0.05 * | −0.04 * | −0.01 | −0.01 | −0.02 | 1 | |||||||
| Outsider_Ratio [12] | 0.04 * | 0.00 | 0.04 * | 0.03 | −0.03 | 0.06 * | 0.00 | 0.03 | 0.02 | 0.07 * | −0.66 * | 1 | ||||||
| Duality [13] | 0.04 * | −0.01 | 0.02 | −0.08 * | 0.06 * | −0.01 | −0.02 | 0.16 * | 0.15 * | 0.66 * | −0.05 * | 0.09 * | 1 | |||||
| SOE [14] | −0.01 | 0.02 | −0.01 | −0.07 * | −0.00 | −0.012 | −0.01 | 0.01 | −0.07 * | −0.16 * | 0.12 * | −0.08 * | −0.13 * | 1 | ||||
| Largest_SH [15] | −0.12 * | −0.11 * | −0.03 | −0.18 * | 0.00 | −0.10 * | −0.03 | −0.02 | −0.12 * | 0.05 * | −0.13 * | 0.08 * | 0.15 * | 0.02 | 1 | |||
| Firm_Size [16] | −0.09 * | 0.13 * | 0.09 * | 0.45 * | −0.23 * | 0.00 | 0.10 * | 0.06 * | 0.30 * | −0.11 * | 0.10 * | −0.06 * | −0.10 * | −0.02 | −0.17 * | 1 | ||
| Debt_Ratio [17] | −0.25 * | 0.20 * | −0.01 | 0.17 * | −0.53 * | −0.03 | 0.03 | −0.00 | 0.11 * | −0.07 * | 0.01 | −0.01 | −0.01 | −0.02 | −0.01 | 0.42 * | 1 | |
| Firm_Age [18] | −0.02 | 0.12 * | 0.05 * | 0.26 * | −0.18 * | 0.11 * | −0.06 * | 0.19 * | 0.23 * | −0.05 * | 0.00 | 0.03 | 0.01 | −0.02 | −0.08 * | 0.20 * | 0.16 * | 1 |
| R&D_Median [19] | 0.39 * | 0.07 * | −0.01 | 0.18 * | 0.01 | 0.64 * | 0.02 | 0.07 * | −0.03 | 0.05 * | 0.01 | 0.09 * | 0.02 | −0.03 * | −0.10 | −0.03 | 0.04 | 0.08 * |
| R&D_Entropy [20] | 0.15 * | −0.02 | −0.03 | 0.20 * | −0.07 * | 0.16 * | −0.35 | 0.03 | 0.07 * | 0.07 * | −0.03 | 0.02 | −0.00 | −0.01 | 0.00 | 0.01 | 0.00 | 0.14 * |
| Concentration [21] | −0.09 * | 0.01 | 0.09 * | −0.09 * | 0.11 | −0.01 | 0.22 * | −0.01 | −0.04 * | −0.07 * | −0.01 | 0.00 | 0.00 | −0.03 | 0.01 | −0.02 | −0.00 | −0.10 * |
| Instability [22] | 0.02 | 0.08 * | 0.05 * | −0.10 * | 0.04 * | 0.09 * | 0.36 * | −0.01 | −0.02 | −0.02 | 0.02 | −0.01 | −0.01 | −0.01 | −0.06 * | −0.01 | −0.03 * | −0.06 * |
| [19] | [20] | [21] | [22] | |||||||||||||||
| R&D_Median [19] | 1 | |||||||||||||||||
| R&D_Entropy [20] | 0.36 * | 1 | ||||||||||||||||
| Concentration [21] | −0.23 * | −0.65 * | 1 | |||||||||||||||
| Instability [22] | 0.12 * | −0.72 * | 0.33 * | 1 |
Note: * p < 0.05.
Table 4.
The Effect of Social Underperformance on R&D.
| Fractional Logit Model | ||||||
|---|---|---|---|---|---|---|
| R&D (dy/dx) | ||||||
| Baseline | H1a | H2a | H3a | H4a | All | |
| Variables | (1) | (2) | (3) | (4) | (5) | (6) |
| Social_Under | −0.004 | −0.064 * | −0.004 | −0.005 | −0.007 | −0.074 ** |
| (0.037) | (0.037) | (0.037) | (0.037) | (0.036) | (0.055) | |
| Social_Under × R&D_Stock | 0.132 *** | 0.143 *** | ||||
| (0.024) | (0.024) | |||||
| Social_Under × Slack | 0.010 ** | 0.012 *** | ||||
| (0.004) | (0.004) | |||||
| Social_Under × Leader_R&D | −0.269 | −0.459 | ||||
| (0.642) | (0.629) | |||||
| Social_Under × Growth | 0.529 *** | 0.601 *** | ||||
| (0.169) | (0.166) | |||||
| R&D_Stock | 0.054 *** | 0.037 *** | 0.052 *** | 0.054 *** | 0.055 *** | 0.034 *** |
| (0.011) | (0.012) | (0.011) | (0.011) | (0.011) | (0.011) | |
| Slack | 0.023 *** | 0.023 *** | 0.019 *** | 0.023 *** | 0.023 *** | 0.017 *** |
| (0.002) | (0.002) | (0.003) | (0.002) | (0.002) | (0.003) | |
| Leader_R&D | 1.147 *** | 1.102 ** | 1.197 *** | 1.249 ** | 1.243 *** | 1.447 *** |
| (0.442) | (0.435) | (0.442) | (0.506) | (0.439) | (0.495) | |
| Growth | −0.124 | −0.089 | −0.134 | −0.123 | −0.454 *** | −0.476 *** |
| (0.092) | (0.091) | (0.092) | (0.092) | (0.132) | (0.129) | |
| CEO_Age | −0.007 ** | −0.006 ** | −0.007 ** | −0.007 ** | −0.007 ** | −0.006 ** |
| (0.003) | (0.003) | (0.003) | (0.003) | (0.003) | (0.003) | |
| CEO_Tenure | −0.019 ** | −0.019 ** | −0.019 ** | −0.018 ** | −0.019 ** | −0.019 ** |
| (0.008) | (0.008) | (0.008) | (0.008) | (0.008) | (0.008) | |
| CEO_Founder | 0.023 | 0.022 | 0.017 | 0.022 | 0.019 | 0.011 |
| (0.045) | (0.044) | (0.045) | (0.045) | (0.045) | (0.044) | |
| Board_Size | 0.003 | 0.002 | 0.005 | 0.003 | 0.004 | 0.005 |
| (0.016) | (0.016) | (0.016) | (0.016) | (0.016) | (0.015) | |
| Outsider_Ratio | 0.257 | 0.248 | 0.313 | 0.257 | 0.264 | 0.325 |
| (0.394) | (0.388) | (0.394) | (0.394) | (0.391) | (0.385) | |
| Duality | 0.082 * | 0.075 * | 0.086 * | 0.082 * | 0.084 * | 0.080 * |
| (0.046) | (0.045) | (0.046) | (0.046) | (0.045) | (0.045) | |
| SOE | 0.109 | 0.143 | 0.104 | 0.109 | 0.108 | 0.139 |
| (0.100) | (0.098) | (0.100) | (0.100) | (0.099) | (0.097) | |
| Largest_SH | −0.005 *** | −0.005 *** | −0.006 *** | −0.005 *** | −0.006 *** | −0.005 *** |
| (0.001) | (0.001) | (0.001) | (0.001) | (0.001) | (0.001) | |
| Firm_Size | −0.107 * | −0.108 * | −0.098 | −0.107 * | −0.099 | −0.090 |
| (0.063) | (0.062) | (0.063) | (0.063) | (0.062) | (0.061) | |
| Debt_Ratio | −0.881 *** | −0.921 *** | −0.895 *** | −0.882 *** | −0.872 *** | −0.930 *** |
| (0.133) | (0.131) | (0.133) | (0.133) | (0.132) | (0.130) | |
| Firm_Age | −0.001 | 0.000 | −0.001 | −0.001 | −0.001 | 0.001 |
| (0.004) | (0.004) | (0.004) | (0.004) | (0.004) | (0.004) | |
| R&D_Median | 0.123 *** | 0.120 *** | 0.122 *** | 0.123 *** | 0.123 *** | 0.118 *** |
| (0.011) | (0.011) | (0.011) | (0.011) | (0.011) | (0.011) | |
| R&D_Entropy | 0.096 ** | 0.101 *** | 0.097 ** | 0.096 ** | 0.092 ** | 0.100 *** |
| (0.039) | (0.038) | (0.039) | (0.039) | (0.039) | (0.038) | |
| Concentration | 0.155 | 0.187 | 0.171 | 0.157 | 0.130 | 0.193 |
| (0.190) | (0.188) | (0.190) | (0.191) | (0.189) | (0.186) | |
| Instability | 0.021 | 0.298 | 0.019 | 0.015 | 0.012 | 0.302 |
| (0.651) | (0.642) | (0.651) | (0.652) | (0.647) | (0.637) | |
| Year | Yes | Yes | Yes | Yes | Yes | Yes |
| N | 2687 | 2687 | 2687 | 2687 | 2687 | 2687 |
| Chi-square | 1889.514 | 1833.667 | 1887.267 | 1890.683 | 1859.812 | 1797.093 |
Note: All independent and control variables are lagged for one period. Average marginal effects reported in the table. Robust standard errors in parenthesis. * p < 0.10, ** p < 0.05, *** p < 0.01.
Table 5.
The Effect of Historical Underperformance on R&D.
| Fractional Logit Model | ||||||
|---|---|---|---|---|---|---|
| R&D (dy/dx) | ||||||
| Baseline | H1b | H2b | H3b | H4b | All | |
| Variables | (1) | (2) | (3) | (4) | (5) | (6) |
| Historical_Under | −0.033 | −0.373 *** | −0.027 | −0.041 | −0.031 | −0.402 *** |
| (0.042) | (0.046) | (0.042) | (0.042) | (0.042) | (0.046) | |
| Historical_Under × R&D_Stock | 0.482 *** | 0.536 *** | ||||
| (0.034) | (0.034) | |||||
| Historical_Under × Slack | 0.008 ** | 0.014 *** | ||||
| (0.004) | (0.004) | |||||
| Historical_Under × Leader_R&D | −1.833 *** | −3.144 *** | ||||
| (0.633) | (0.640) | |||||
| Historical_Under × Growth | 0.323 * | 0.699 *** | ||||
| (0.185) | (0.184) | |||||
| R&D_Stock | 0.060 *** | 0.049 *** | 0.055 *** | 0.060 *** | 0.060 *** | 0.041 *** |
| (0.013) | (0.013) | (0.013) | (0.013) | (0.013) | (0.013) | |
| Slack | 0.023 *** | 0.023 *** | 0.018 *** | 0.023 *** | 0.023 *** | 0.014 *** |
| (0.002) | (0.003) | (0.004) | (0.002) | (0.002) | (0.004) | |
| Leader_R&D | 1.136 ** | 0.894 ** | 1.119 ** | 2.141 *** | 1.168 *** | 2.585 *** |
| (0.442) | (0.447) | (0.441) | (0.563) | (0.443) | (0.565) | |
| Growth | −0.121 | 0.056 | −0.126 | −0.116 | −0.380 ** | −0.492 *** |
| (0.092) | (0.093) | (0.092) | (0.092) | (0.162) | (0.161) | |
| CEO_Age | −0.007 ** | −0.006 ** | −0.007 ** | −0.007 ** | −0.007 ** | −0.006 ** |
| (0.003) | (0.003) | (0.003) | (0.003) | (0.003) | (0.003) | |
| CEO_Tenure | −0.019 ** | −0.024 *** | −0.019 ** | −0.018 ** | −0.020 ** | −0.022 *** |
| (0.008) | (0.008) | (0.008) | (0.008) | (0.008) | (0.008) | |
| CEO_Founder | 0.024 | 0.028 | 0.022 | 0.021 | 0.024 | 0.026 |
| (0.045) | (0.046) | (0.045) | (0.045) | (0.045) | (0.045) | |
| Board_Size | 0.004 | −0.008 | 0.003 | 0.005 | 0.004 | −0.006 |
| (0.016) | (0.016) | (0.016) | (0.016) | (0.016) | (0.016) | |
| Outsider_Ratio | 0.264 | 0.174 | 0.271 | 0.313 | 0.279 | 0.291 |
| (0.394) | (0.398) | (0.393) | (0.392) | (0.394) | (0.392) | |
| Duality | 0.083 * | 0.070 | 0.084 * | 0.083 * | 0.084 * | 0.068 |
| (0.046) | (0.046) | (0.046) | (0.045) | (0.046) | (0.045) | |
| SOE | 0.111 | 0.084 | 0.108 | 0.113 | 0.112 | 0.086 |
| (0.100) | (0.101) | (0.100) | (0.099) | (0.100) | (0.099) | |
| Largest_SH | −0.005 *** | −0.003 ** | −0.005 *** | −0.005 *** | −0.005 *** | −0.004 *** |
| (0.001) | (0.001) | (0.001) | (0.001) | (0.001) | (0.001) | |
| Firm_Size | −0.112 * | −0.271 *** | −0.0980 | −0.109 * | −0.109 * | −0.254 *** |
| (0.063) | (0.064) | (0.063) | (0.063) | (0.063) | (0.063) | |
| Debt_Ratio | −0.885 *** | −0.996 *** | −0.896 *** | −0.881 *** | −0.882 *** | −1.013 *** |
| (0.131) | (0.133) | (0.131) | (0.130) | (0.131) | (0.130) | |
| Firm_Age | −0.001 | −0.003 | −0.001 | −0.001 | −0.001 | −0.004 |
| (0.004) | (0.004) | (0.004) | (0.004) | (0.004) | (0.004) | |
| R&D_Median | 0.123 *** | 0.110 *** | 0.123 *** | 0.125 *** | 0.122 *** | 0.110 *** |
| (0.011) | (0.012) | (0.011) | (0.011) | (0.011) | (0.011) | |
| R&D_Entropy | 0.096 ** | 0.043 | 0.099 ** | 0.096 ** | 0.098 ** | 0.052 |
| (0.039) | (0.040) | (0.039) | (0.039) | (0.039) | (0.039) | |
| Concentration | 0.159 | −0.092 | 0.165 | 0.146 | 0.164 | −0.078 |
| (0.191) | (0.195) | (0.190) | (0.190) | (0.191) | (0.191) | |
| Instability | 0.034 | −0.171 | 0.063 | 0.009 | 0.130 | 0.128 |
| (0.651) | (0.658) | (0.649) | (0.647) | (0.654) | (0.650) | |
| Year | Yes | Yes | Yes | Yes | Yes | Yes |
| N | 2687 | 2687 | 2687 | 2687 | 2687 | 2687 |
| Chi-square | 1895.771 | 1936.990 | 1884.559 | 1870.808 | 1897.706 | 1867.865 |
Note: All independent and control variables are lagged for one year. Average marginal effects reported in the table. Robust standard errors in parenthesis. * p < 0.10, ** p < 0.05, *** p < 0.01.
Publisher’s Note: MDPI stays neutral with regard to jurisdictional claims in published maps and institutional affiliations. |
© 2021 by the authors. Licensee MDPI, Basel, Switzerland. This article is an open access article distributed under the terms and conditions of the Creative Commons Attribution (CC BY) license (http://creativecommons.org/licenses/by/4.0/).
Share and Cite
MDPI and ACS Style
Huang, L.; He, L.; Yang, G. Performance Shortfalls and R&D Investment Change: Aspirations, Actions, and Expectations. Sustainability 2021, 13, 3006. https://0-doi-org.brum.beds.ac.uk/10.3390/su13063006
AMA Style
Huang L, He L, Yang G. Performance Shortfalls and R&D Investment Change: Aspirations, Actions, and Expectations. Sustainability. 2021; 13(6):3006. https://0-doi-org.brum.beds.ac.uk/10.3390/su13063006
Chicago/Turabian StyleHuang, Liying, Lerong He, and Guangqing Yang. 2021. "Performance Shortfalls and R&D Investment Change: Aspirations, Actions, and Expectations" Sustainability 13, no. 6: 3006. https://0-doi-org.brum.beds.ac.uk/10.3390/su13063006
Note that from the first issue of 2016, this journal uses article numbers instead of page numbers. See further details here.