
Research on Multi-Objective Optimization Model for Hybrid Energy System Considering Combination of Wind Power and Energy Storage


Abstract
:1. Introduction
- (1)
- The combined wind power and energy storage is applied as a flexible generator of the HES, which ensures more stable generation of the wind power based on the combined ESS.
- (2)
- Both system benefits and renewable energy waste are considered in the combined WPP-ESS based hybrid energy system (WEHES). Based on the cost calculation of CHP, wind power plant (WPP), PV, and ESS, a multi-objective hybrid energy system with the maximum benefits and minimum energy waste as the objectives is constructed. Further, the robust optimization and PSO algorithm are used to solve the proposed model.
- (3)
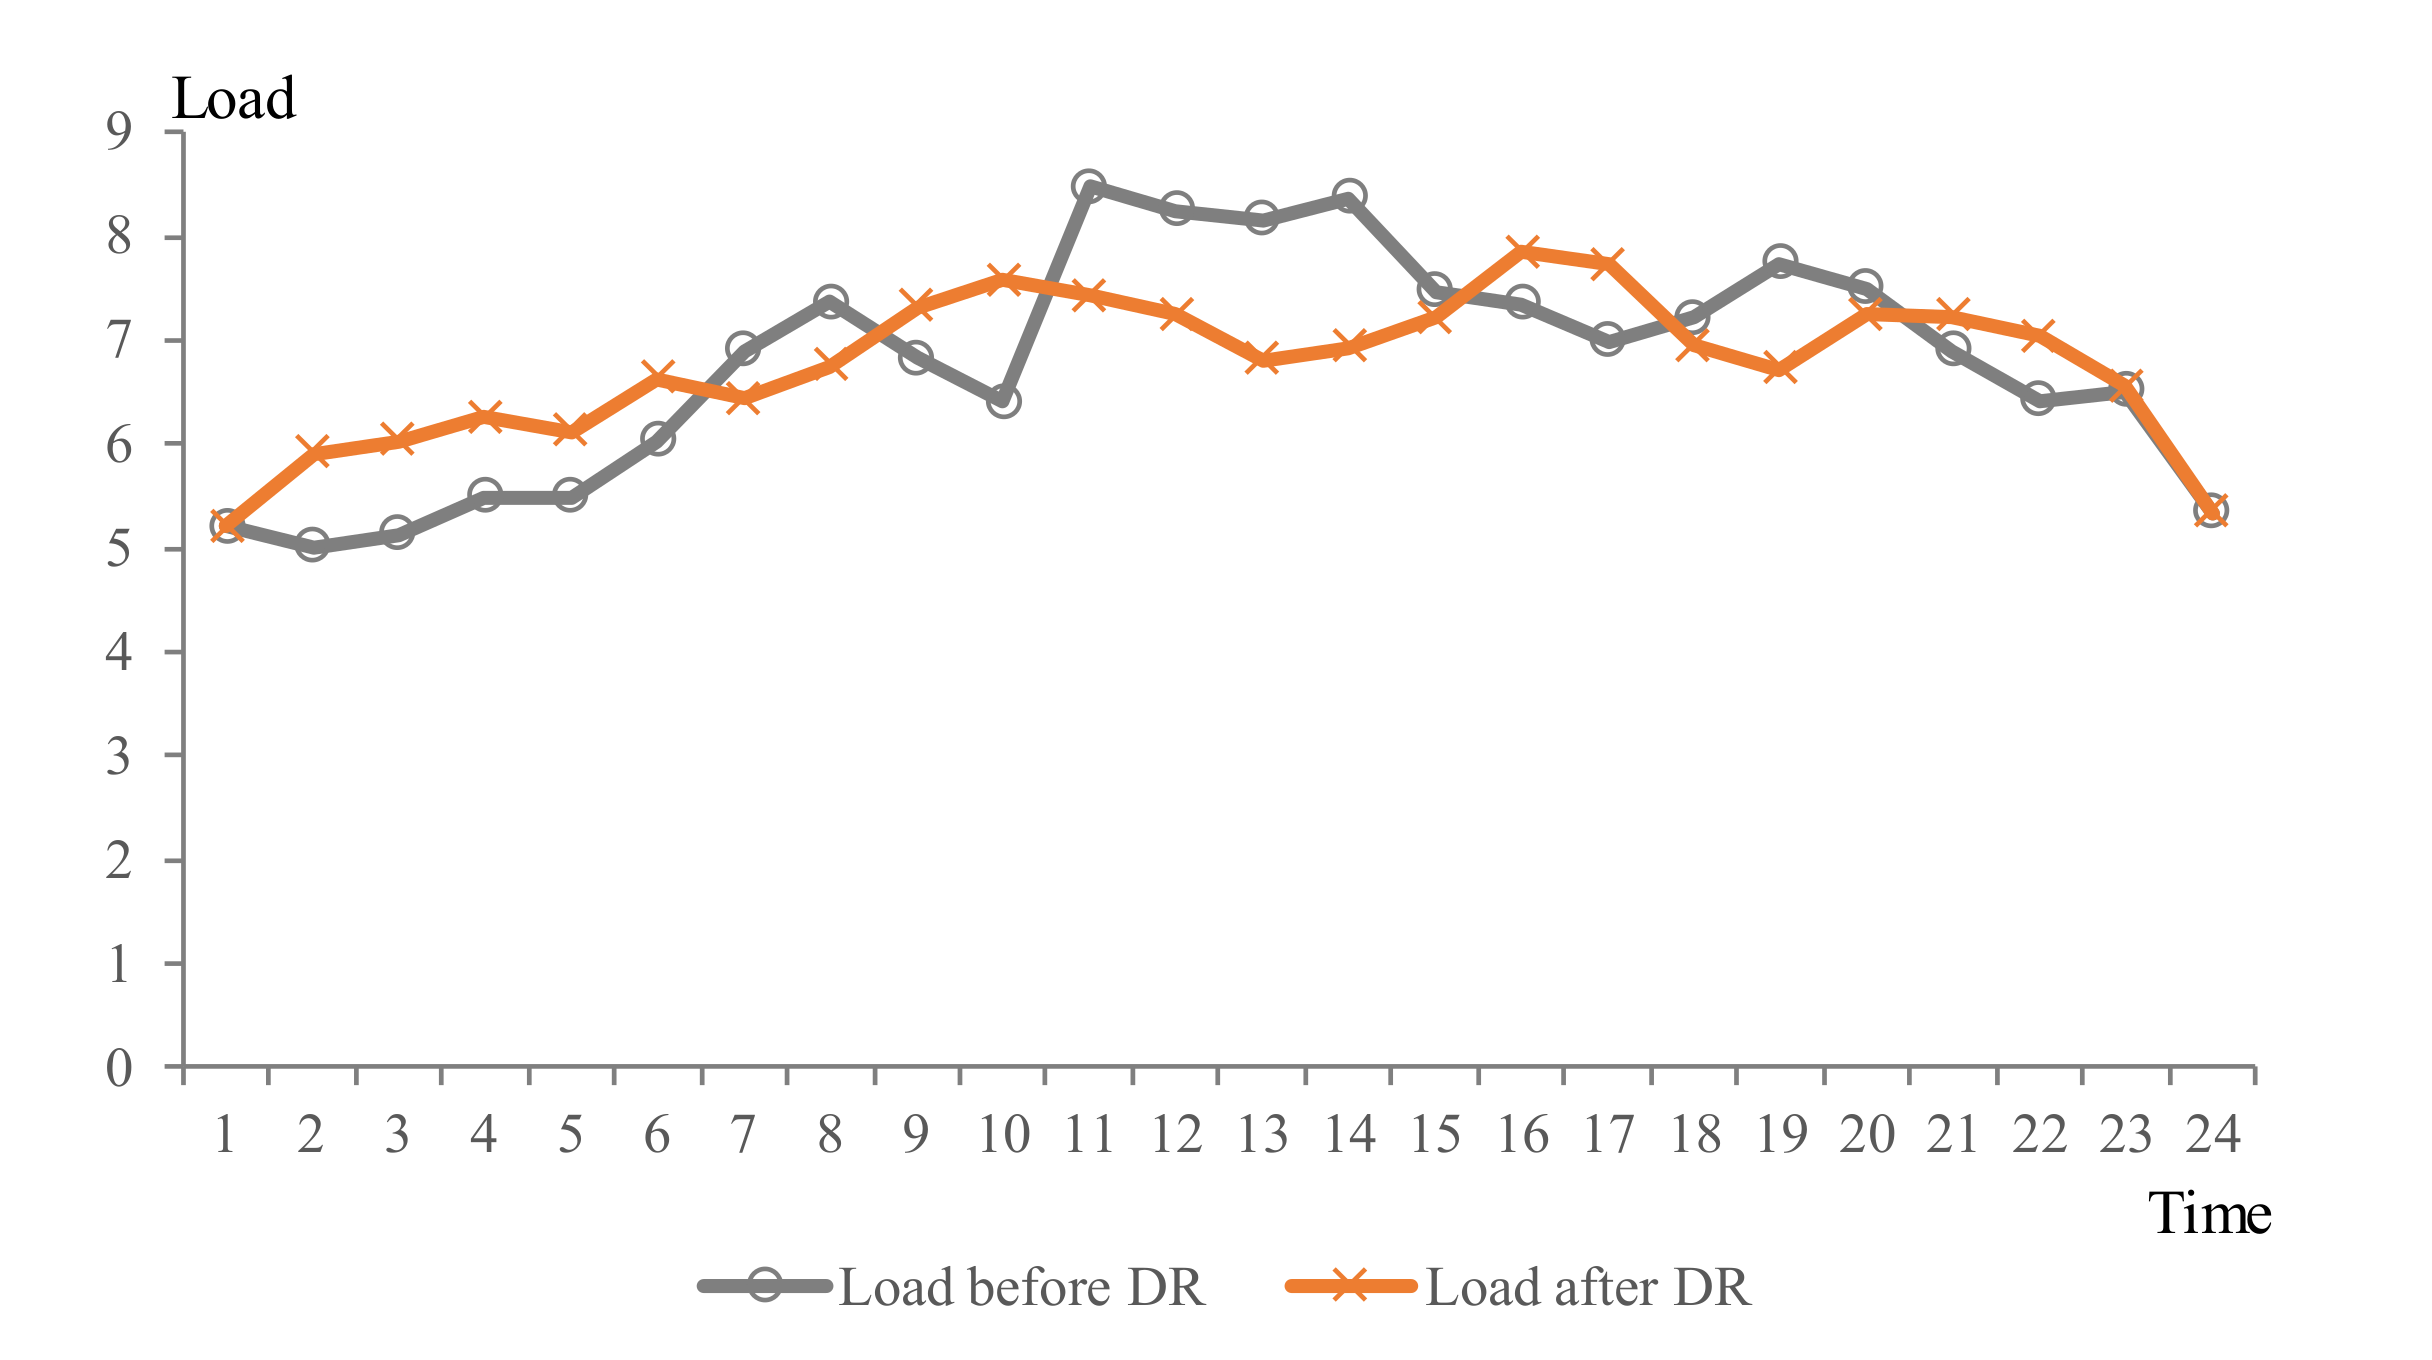
- In this paper, different scenarios are set up to analyze the economy of combined operation of the HES. By introducing demand response (DR) management to reduce the load fluctuation, combining with ESS, taking the connection type of ESS as one of the criteria of scenario division, three scenarios are set. The effects of applying ESS is analyzed, and so is the combined wind power and energy storage.
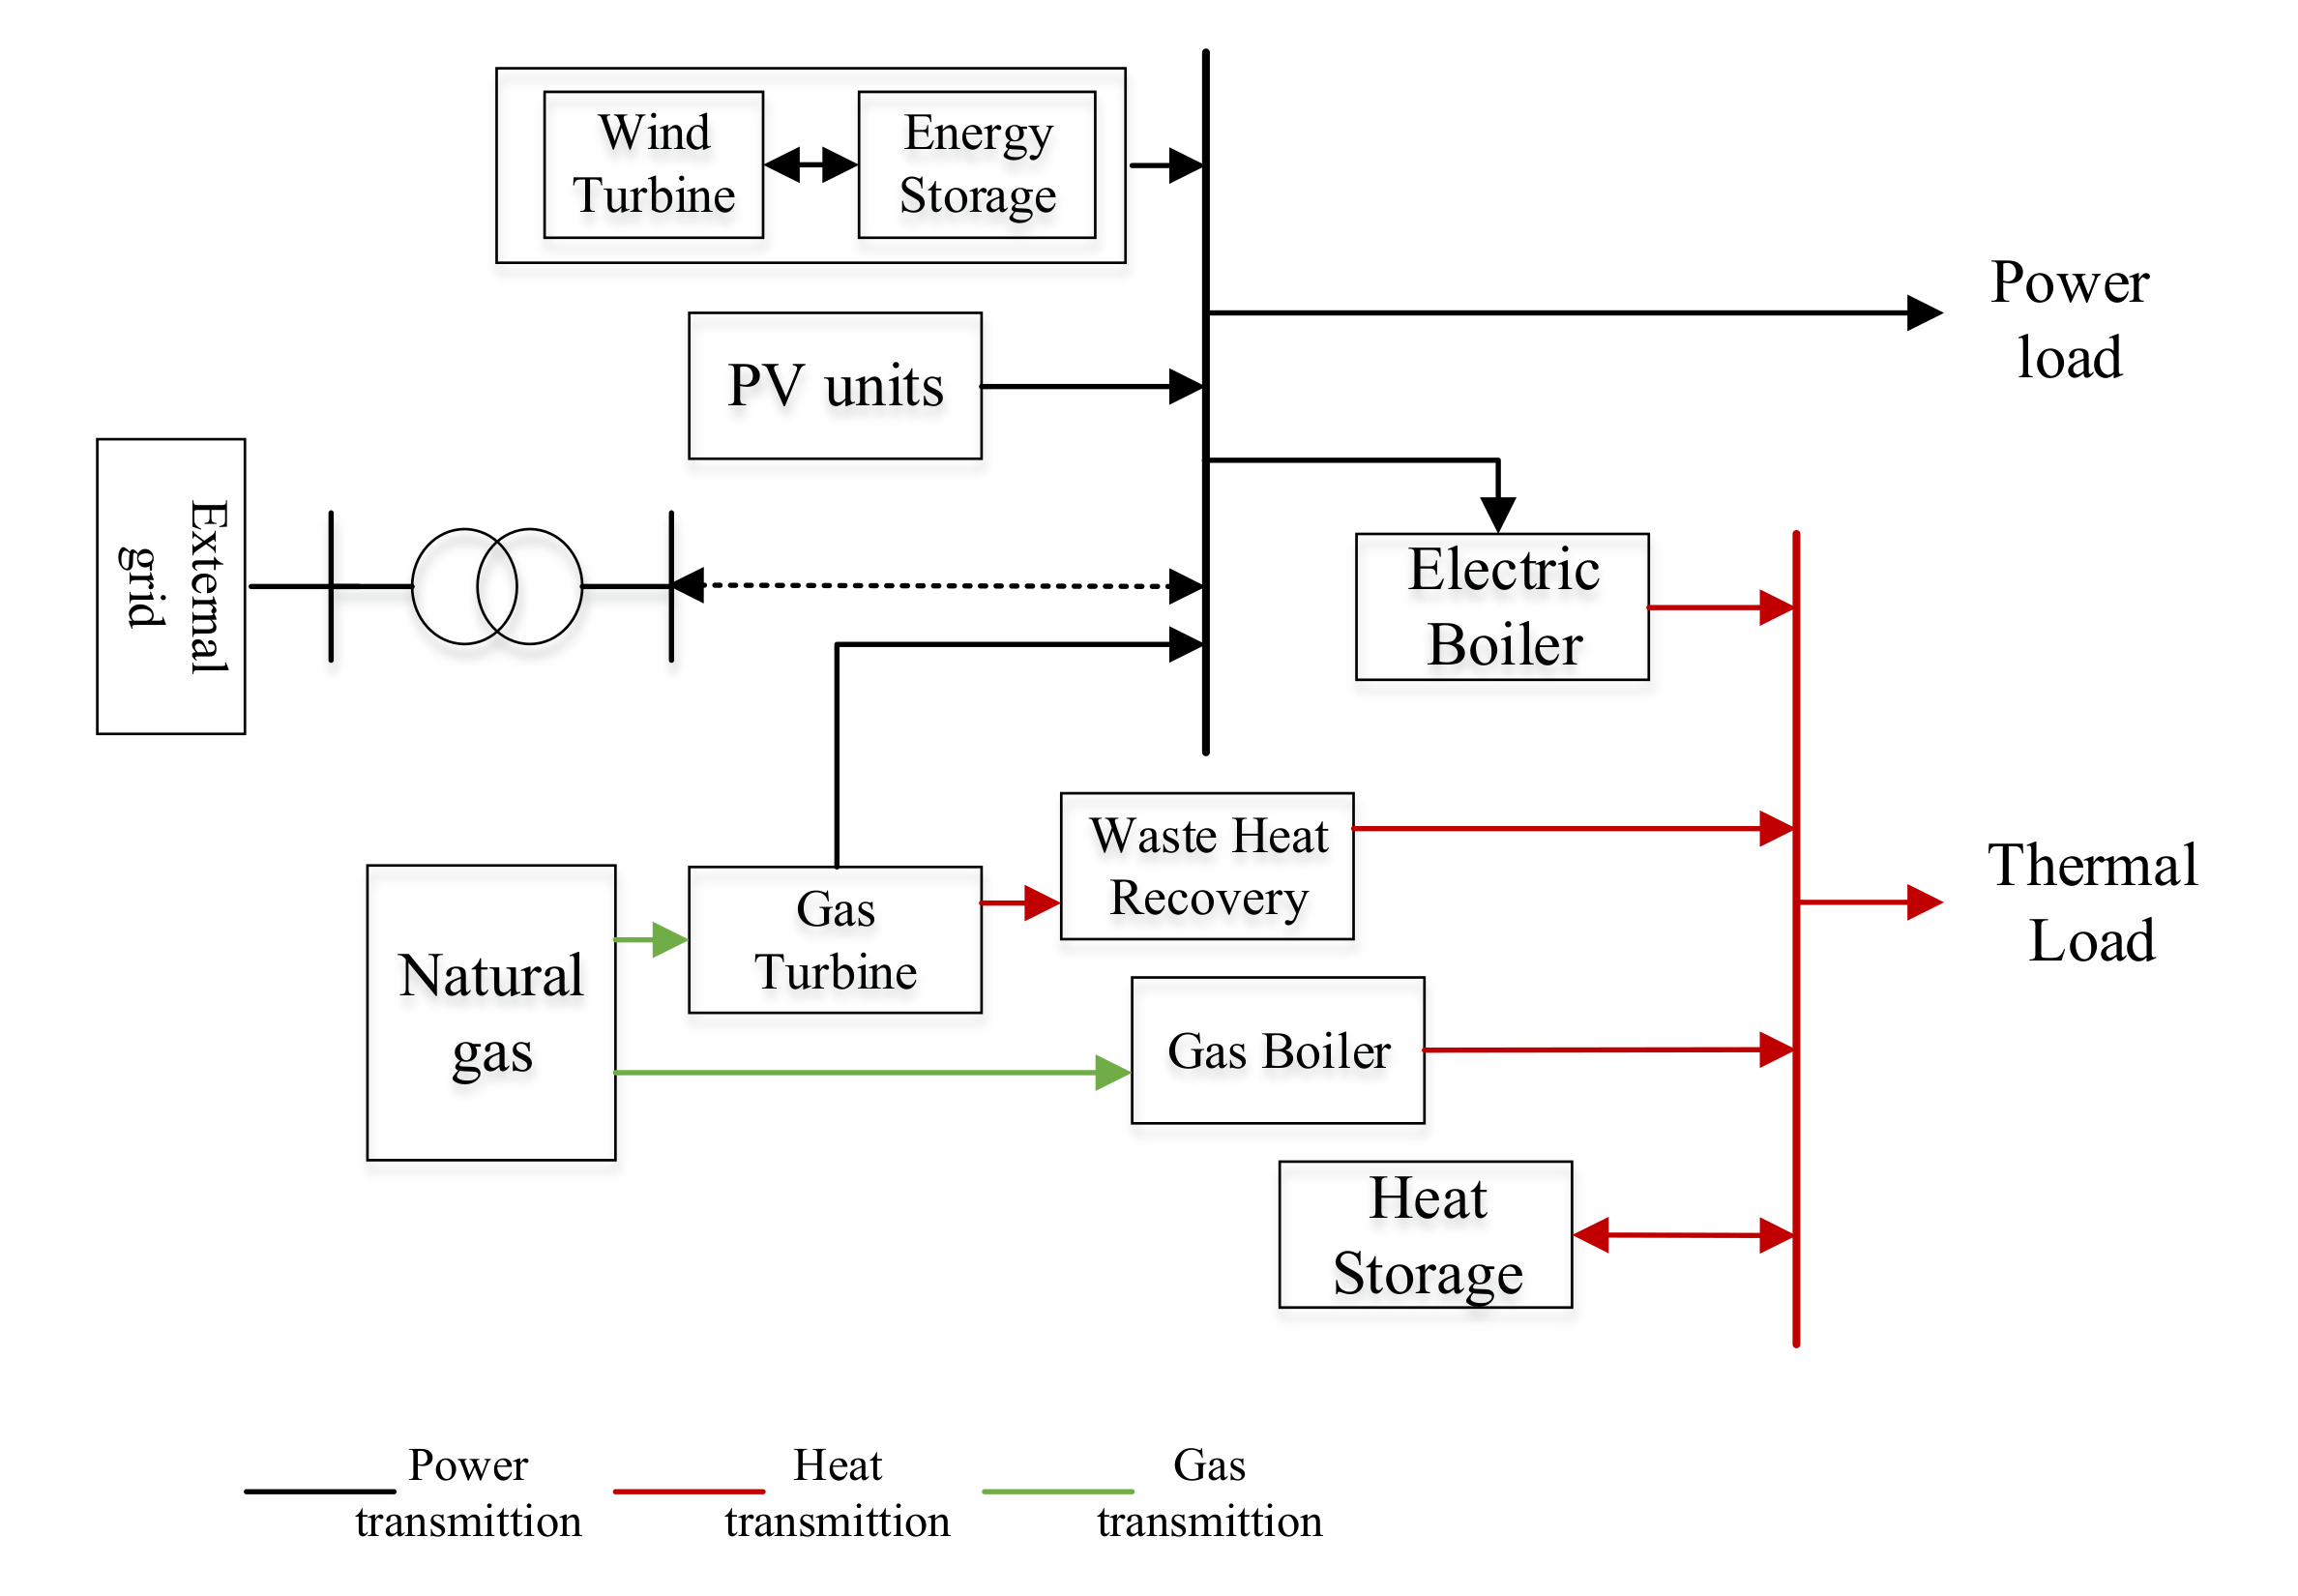
2. Structure of WEHES
3. WEHES Devices Model
3.1. CHP Operation Model
3.2. Wind Power Plant Generation Model
3.3. PV Generation Model
3.4. GB Operation Model
3.5. Operation Loss of ESS
3.6. Operation Cost of Combined WPP and ESS
4. WEHES Optimization Model
4.1. Model Construction
- (1)
- maximum economic benefits
- (2)
- Minimum system energy waste
4.2. Constraint Conditions
- (1)
- Electric power balancing
- (2)
- Thermal power balancing
- (3)
- CHP operation constraints
- (4)
- DR operation constraints
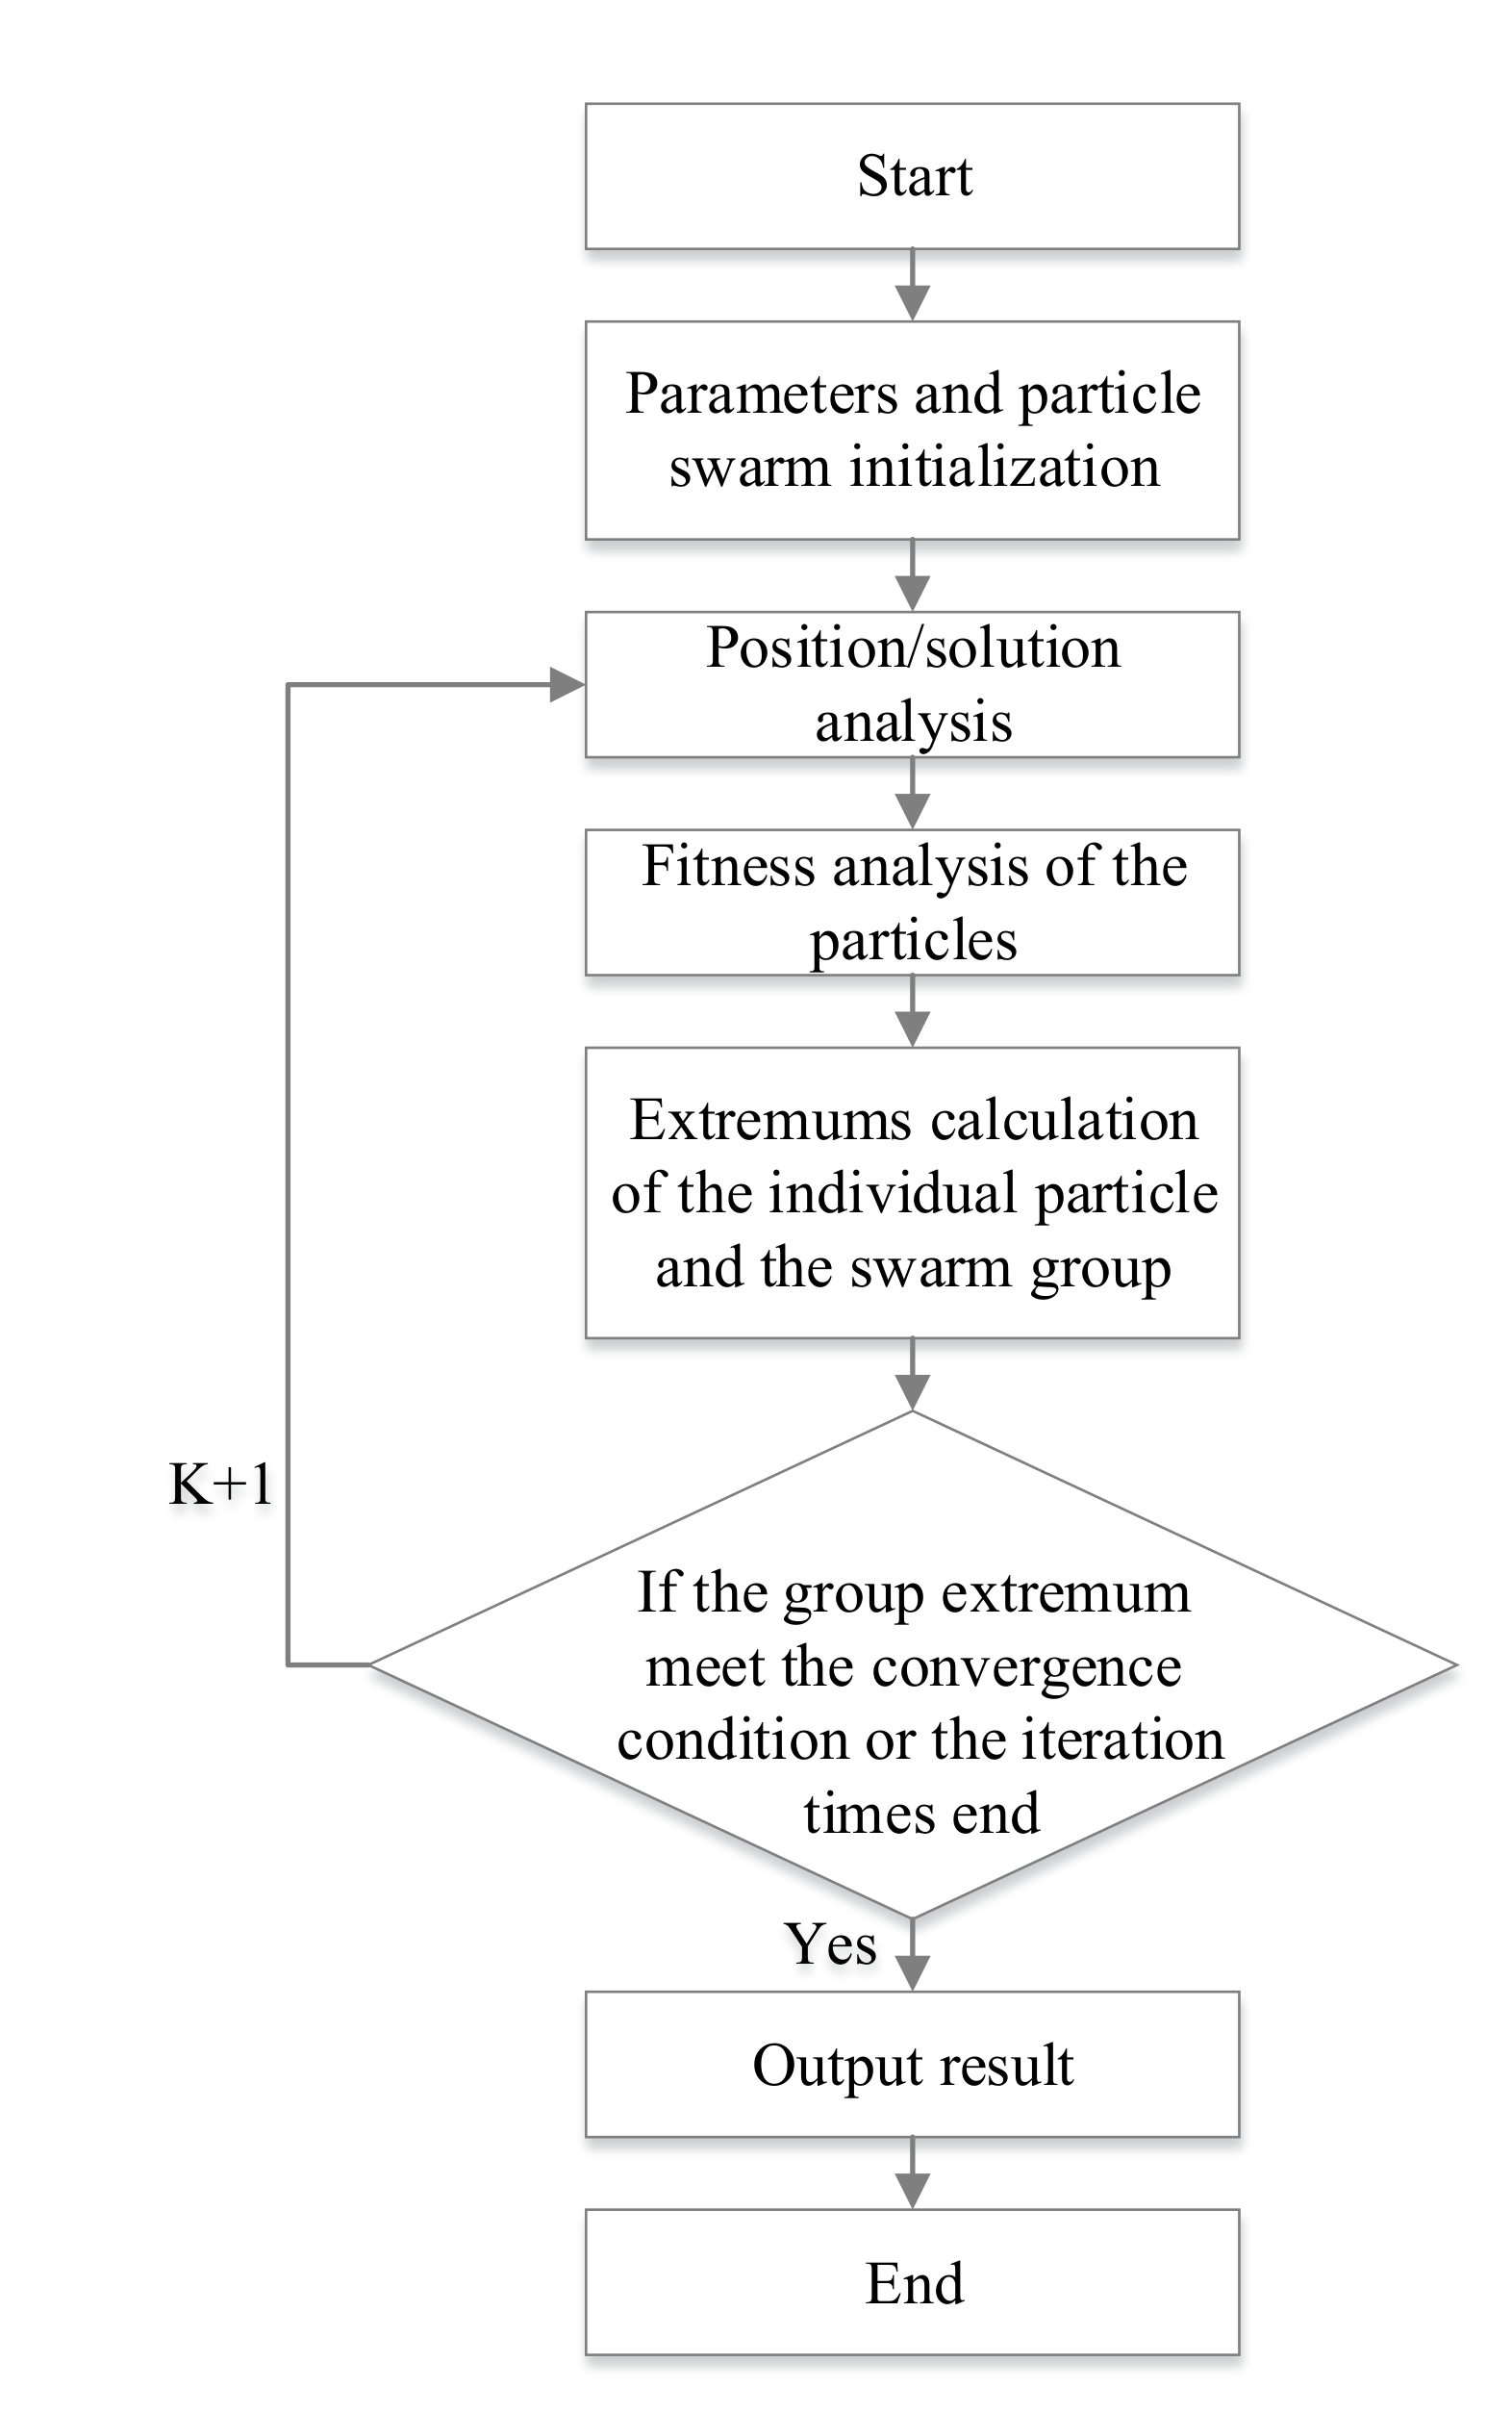
4.3. Solving Method of the WEHES
- (1)
- Set size of the particle swarm and the maximum number of iterations. Input , and , and set accuracy.
- (2)
- The initial position information of each particle is given.
- (3)
- The extreme value of the individual particle and the particle swarm are obtained by fitness calculation.
- (4)
- Update the particle position. The next iteration begins.
- (5)
- When the number of iterations is exhausted or the result reaches the specified accuracy, the iteration ends and the optimal solution is obtained. At this time, the output composition of WEHES system can be obtained.
5. Case Study
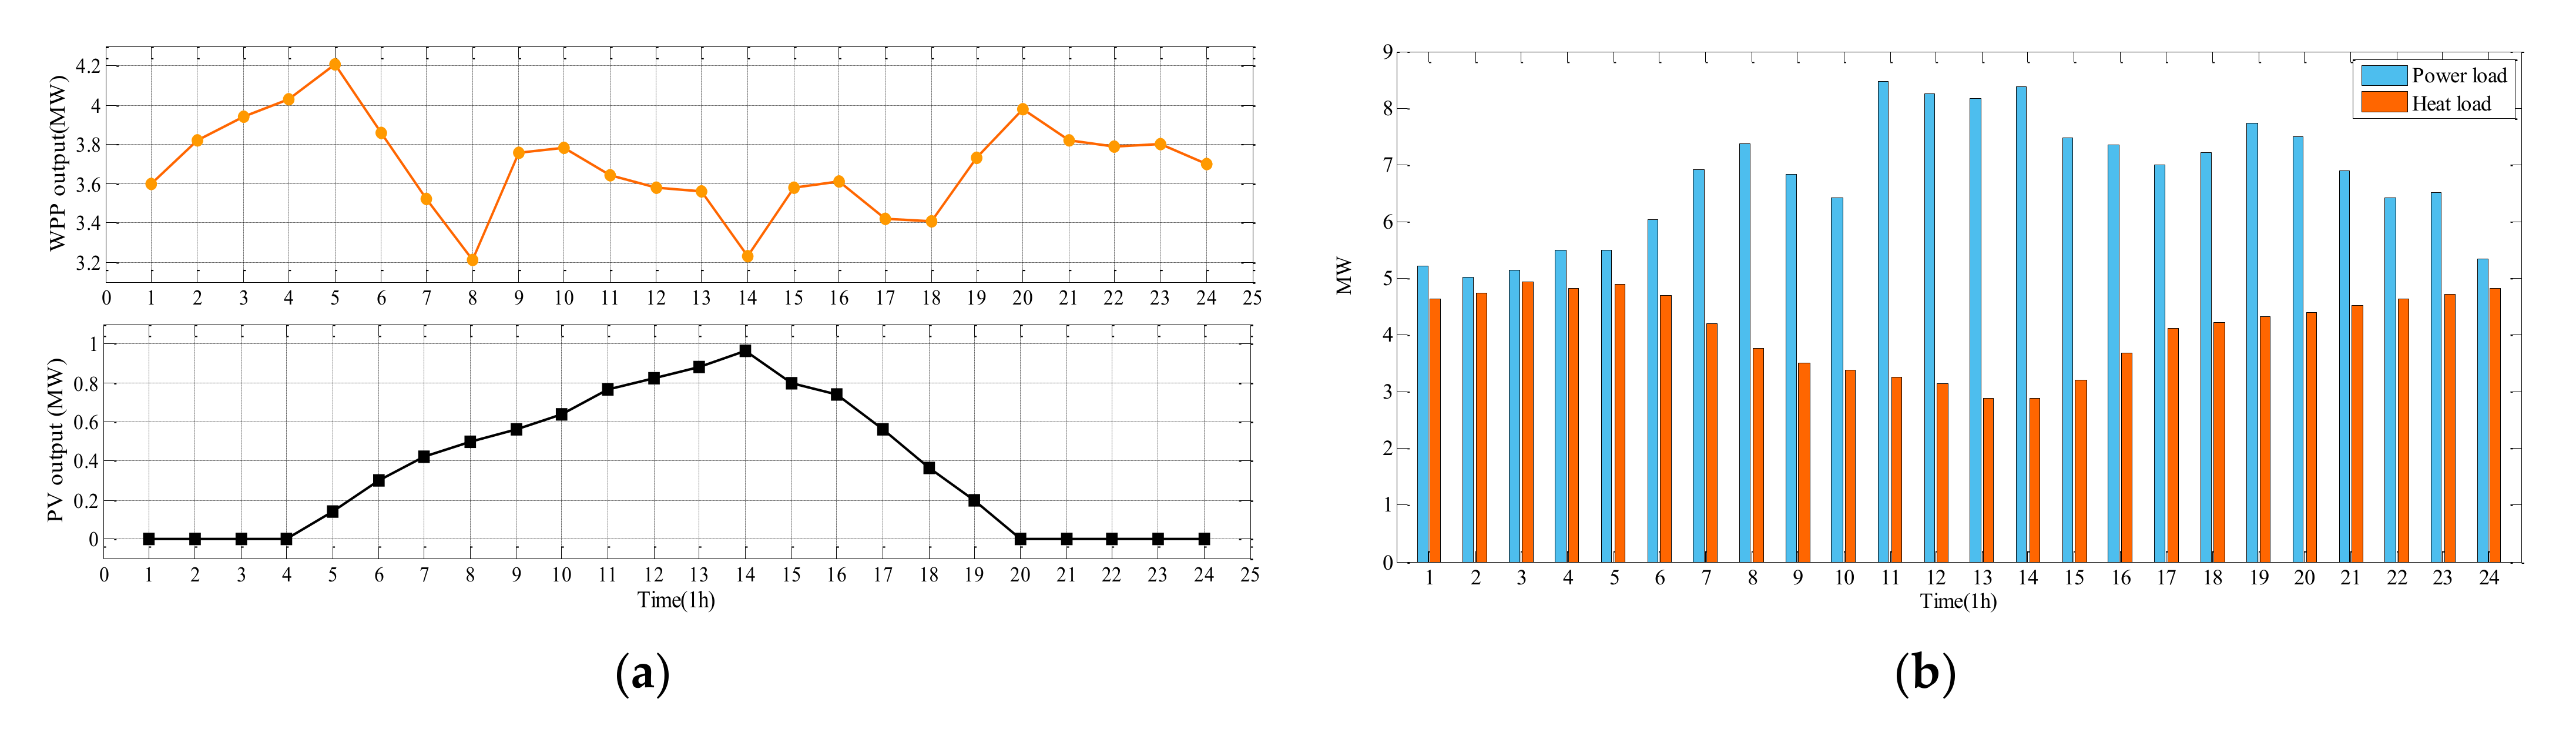
5.1. Basic Data
5.2. Optimization Results Analysis
- Scenario 1: Basic Scenario. DR is applied in this scenario, but no ESS.
- Scenario 2: ESS Scenario. ESS is accessed in the HES.
- Scenario 3: Combined WPP and ESS Scenario. The energy storage is combined with the wind power plant, and there is no other ESS in the system to prevent unnecessary cost.
5.3. Result Analysis
- (1)
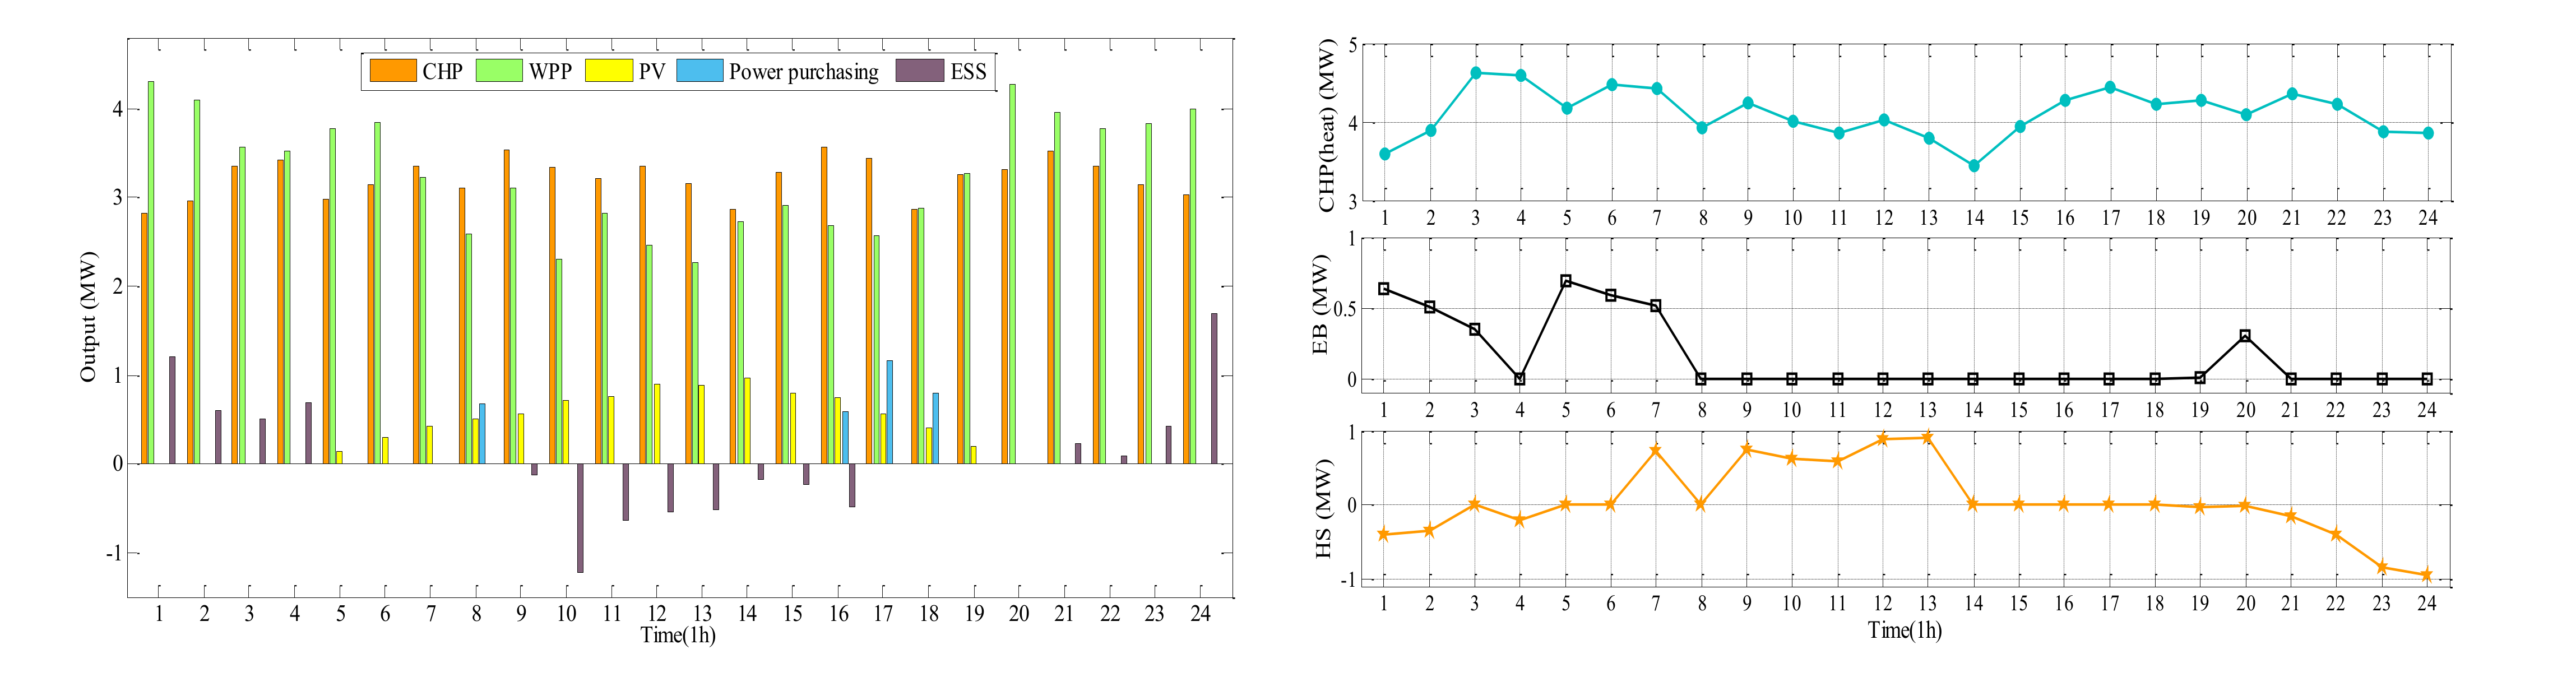
- Optimization results of scenario 1
- (2)
- Optimization results of scenario 2
- (3)
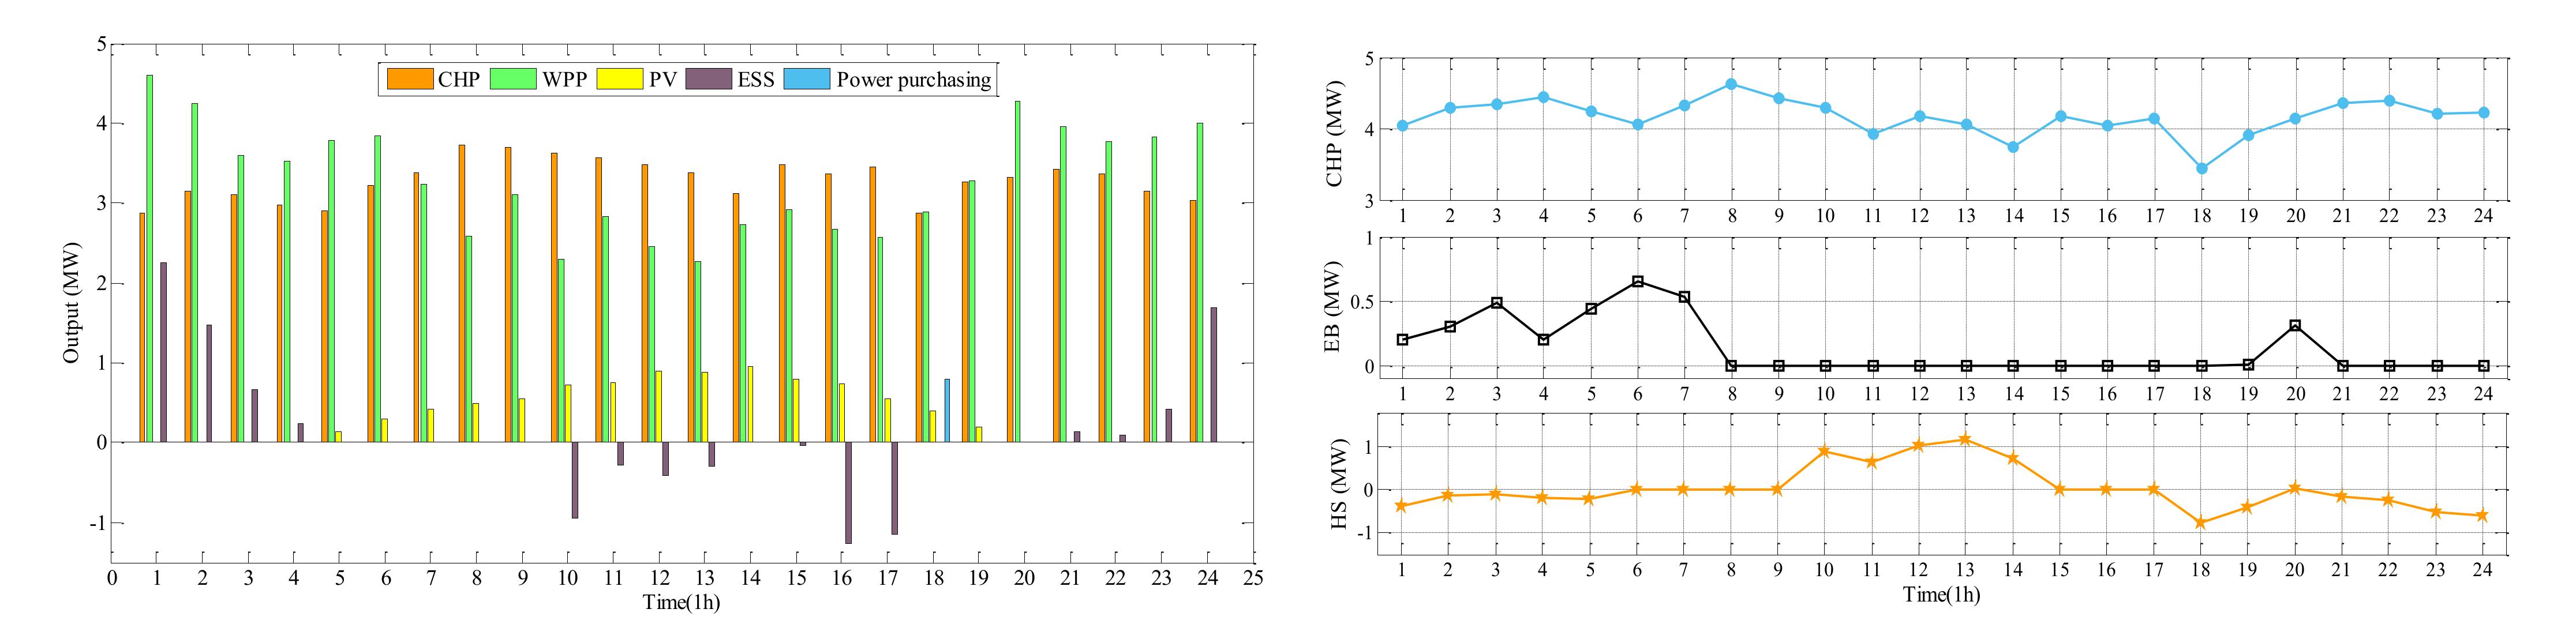
- Optimization results of scenario 3
- (4)
- Renewable energy consumption comparison
6. Conclusions
- (1)
- The ESS has significant contributions to the reduction of the total system cost. Based on the simulation results, by introducing the ESS, both the power curtailment costs, and the power purchasing costs reduce. By storing the excess wind power at the valley time and discharging at the peak time, more benefits can be gained.
- (2)
- The combination of WPP and ESS can improve the utilization of wind power to a greater extent and can directly absorb the excess wind power at the valley time and frequency adjustment while getting grid-connection. This combination is more suitable for the hybrid energy system with small proportion of PV power generation.
- (3)
- The storage and utilization of curtailed wind power is solved by proposed an optimization considering the uncertainty of the incoming wind and the flexible use of ESS, which can be used in the actual situation. However, research on the fluctuation of load side is not profound, which will become a focus of our future research.
Author Contributions
Funding
Institutional Review Board Statement
Data Availability Statement
Conflicts of Interest
References
- Wang, J.; Zhong, H.; Ma, Z. Review and prospect of integrated demand response in the multi-energy system. Appl. Energy 2017, 202, 772–782. [Google Scholar] [CrossRef]
- Pu, L.; Wang, X.; Tan, Z.; Wang, H.; Yang, J.C.; Wu, J. Is China’s electricity price cross-subsidy policy reasonable? Comparative analysis of eastern, central, and western regions. Energy Policy 2020, 138, 111250. [Google Scholar] [CrossRef]
- Yang, J.G.; Zhang, N.; Yi, W.; Kang, C. Multi-energy system towards renewable energy accommodation: Review and prospect. Autom. Electr. Power Syst. 2018, 42, 11–24. [Google Scholar]
- De, G.; Tan, Z.F.; Li, M.L.; Huang, L.L.; Song, X.Y. Two-Stage Stochastic Optimization for the Strategic Bidding of a Generation Company Considering Wind Power Uncertainty. Energies 2018, 11, 3527. [Google Scholar] [CrossRef] [Green Version]
- Ni, L.; Liu, W.; Wen, F. Optimal operation of electricity, natural gas and heat systems considering integrated demand responses and diversified storage devices. J. Mod. Power Syst. Clean Energy 2018, 6, 423–443. [Google Scholar] [CrossRef] [Green Version]
- Fischer, D.; Harbrecht, A.; Surmann, A.; McKenna, R. Electric vehicles’ impacts on residential electric local profiles—A stochastic modelling approach considering socio-economic, behavioral and spatial factors. Appl. Energy 2019, 233, 644–658. [Google Scholar] [CrossRef]
- Home-Ortiz, J.M.; Pourakbari-Kasmaei, M.; Mantovani, J.R.S.; Lehtonen, M. A mixed integer conic model for distribution expansion planning: Matheuristic approach. IEEE Trans. Smart Grid 2020, 11, 3932–3943. [Google Scholar] [CrossRef] [Green Version]
- Zeng, D.; Yao, J.; Yang, S. Optimization scheduling model for price-based demand response considering security constraints to accommodate the wind power. Proc. CSEE 2014, 34, 5571–5578. [Google Scholar]
- Wang, K.; Liu, J.T.; Yao, J.G.; Yang, S.C. A Multi-agent Based Interactive Scheduling Model Considering Demand Response. Power Syst. Autom. 2014, 38, 121–127. [Google Scholar]
- Sahand, B.; David, P.C.; Ned, D.; Crawford, C. Interconnection-wide Hour-ahead Scheduling in the Presence of Intermittent Renewables and Demand Response: A Surplus Maximizing Approach. Appl. Energy 2017, 189, 336–351. [Google Scholar]
- Lu, Q.; Chen, T.; Wang, H.; Li, L.; Lu, L.; Li, W.-D. Combined heat and power dispatch model for power system with heat accumulator. Electr. Power Autom. Equip. 2014, 34, 79–85. [Google Scholar]
- Liu, F.; Bie, Z.; Wang, X. Day-ahead dispatch of integrated electricity and natural gas system considering reserve scheduling and renewable uncertainties. IEEE Trans. Sustain. Energy 2019, 10, 646–658. [Google Scholar] [CrossRef]
- Liu, Y.; Guo, L.; Wang, C. Economic Dispatch of Microgrid Based on Two Stage Robust Optimization. J. Chin. Electr. Eng. Sci. 2018, 38, 4013–4022. [Google Scholar]
- DiSomma, M.; Yan, B.; Bianco, N.; Graditi, G.; Luh, P.B.; Mongibello, L.; Naso, V. Operation Optimization of a Distributed Energy System Considering Energy Costs and Exergy Efficiency. Energy Convers. Manag. 2015, 103, 739–751. [Google Scholar] [CrossRef]
- Zeng, R.; Li, H.Q.; Liu, L.F.; Zhang, Q.; Zhang, G. A Novel Method Based on Multi-population Genetic Algorithm for CCHP–GSHP Coupling System Optimization. Energy Convers. Manag. 2015, 105, 1138–1148. [Google Scholar] [CrossRef]
- Guo, Y.; Hu, B.; Wan, L.; Xie, K.; Yang, H.; Shen, Y. Short-term optimal economic operation of thermoelectric power generation microgrid with heat pump. Autom. Electr. Power Syst. 2015, 39, 16–22. [Google Scholar]
- Ma, L.; Liu, N.; Zhang, J.; Tushar, W.; Yuen, C. Energy management for joint operation of CHP and PV prosumers inside a grid-connected microgrid: A game theoretic approach. IEEE Trans. Ind. Inform. 2016, 12, 1930–1942. [Google Scholar] [CrossRef]
- Zhou, C.; Zheng, J.; Jing, Z.; Wu, Q.; Zhou, X. Multi objective optimization design of integrated energy system for park-level microgrid. Power Syst. Technol. 2018, 42, 1687–1697. [Google Scholar]
- Li, H.; Fang, Y.; Xiao, B. Research on optimized operation of regional integrated energy system considering generalized energy storage. Power Syst. Technol. 2019, 43, 3130–3138. [Google Scholar]
- Gao, H.; Liu, J.; Wei, Z.; Liu, Y.; Wang, W.; Li, X. Multi-scenario two-stage dispatch decision-making model for wind farm with integrated energy storage. Electr. Power Autom. Equip. 2014, 34, 131–140. [Google Scholar]
- Zhao, S.; Wang, Y.; Xu, Y.; Yin, J. Coordinated dispatch of large scale energy storage system and thermal generation in high wind power penetration level system based on chance constrained goal programming. Proc. CSEE 2016, 36, 969–977. [Google Scholar]
- Hu, Z.; Ding, H.; Kong, T. A joint operational model for wind power and pumped-storage plant. Autom. Electr. Power Syst. 2012, 36, 36–41. [Google Scholar]
- Daneshi, H.; Srivastava, A.K. Security-constrained unit commitment with wind generation and compressed air energy storage. IET Gener. Transm. Distrib. 2012, 6, 167–175. [Google Scholar] [CrossRef] [Green Version]
- Jie, W.; Ming, D. Wind power fluctuation smoothing strategy of hybrid energy storage system using self-adaptive wavelet packet decomposition. Autom. Electr. Power Syst. 2017, 41, 7–12. [Google Scholar]
- Basit, A.; Anca, D.; Altin, M.; Poul, S.; Gamst, M. Compensating active power imbalances in power system with large-scale wind power penetration. J. Mod. Power Syst. Clean Energy 2016, 4, 229–237. [Google Scholar] [CrossRef] [Green Version]
- Yang, L.; Tai, N.; Fan, C.; Meng, Y. Energy regulating and fluctuation stabilizing by air source heat pump and battery energy storage system in microgrid. Renew. Energy 2016, 95, 202–212. [Google Scholar] [CrossRef]
- Chen, Y.Z.; He, L.; Li, J. Stochastic dominant-subordinate-interactive scheduling optimization for interconnected microgrids with considering wind-photovoltaic-based distributed generations under uncertainty. Energy 2017, 7, 581–598. [Google Scholar] [CrossRef]
- Cui, Y.; Chen, Z.; Yan, G.; Tang, Y. Coordinated Wind Power Accommodating Dispatch Model Based on Electric Boiler and CHP With Thermal Energy Storage. Proc. Chin. Soc. Electr. Eng. 2016, 36, 4072–4081. [Google Scholar]
- Torres-Madroñero, J.L.; Nieto-Londoño, C.; Sierra-Pérez, J. Hybrid Energy Systems Sizing for the Colombian Context: A Genetic Algorithm and Particle Swarm Optimization Approach. Energies 2020, 13, 5648. [Google Scholar] [CrossRef]
- Jiang, F.; Peng, Z.J. Forecasting of Carbon Price Based on BP Neural Network Optimized by Chaotic PSO Algorithm. J. Stat. Inf. 2018, 33, 93–98. [Google Scholar]
- Chen, Q.Y.; Chen, W.H.; Dai, C.H.; Zhang, X.X. Reactive Power Optimization Based on Modified Particle Swarm Optimization Algorithm for Power System. Proc. CSU-EPSA 2014, 26, 8–43. [Google Scholar]
- Sun, B.; Yao, H.T. The short-term wind speed forecast analysis based on the PSO-LSSVM predict model. Power Syst. Prot. Control 2012, 40, 85–89. [Google Scholar]


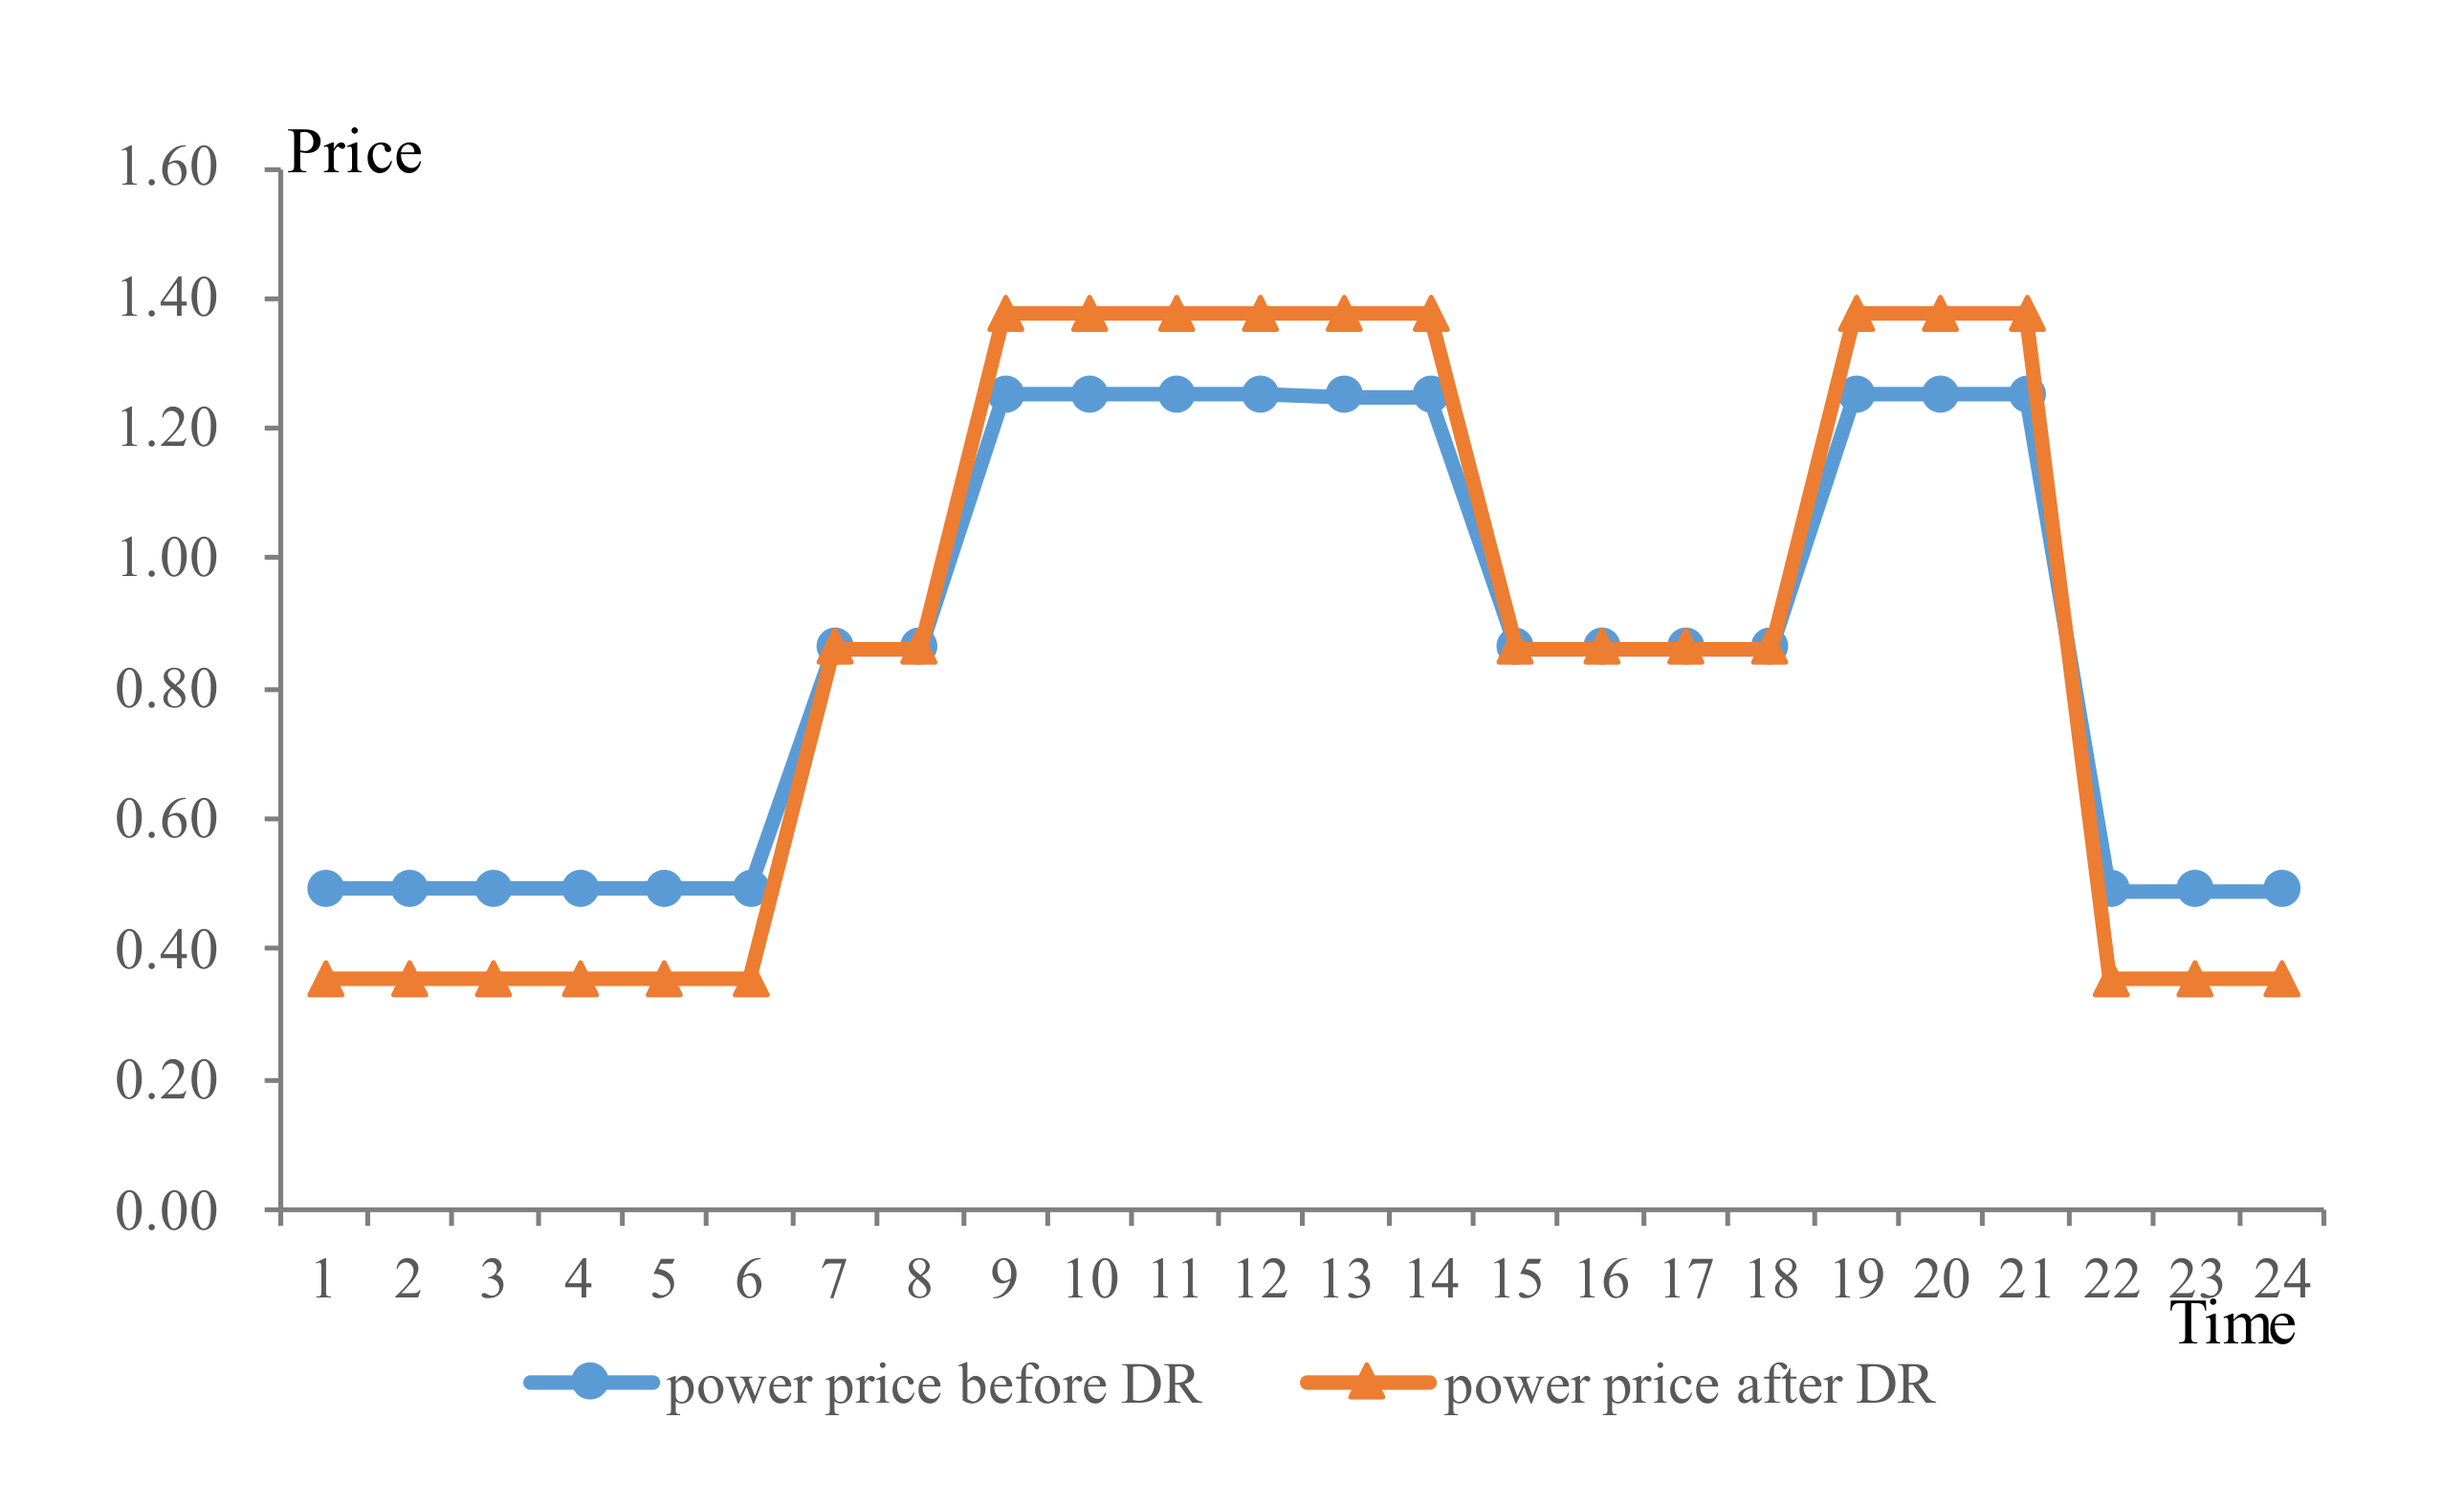
| Types | Time Periods | Power Price (Yuan/kWh) |
|---|---|---|
| Peak periods | 10:00–15:00 and 18:00–21:00 | 1.25 |
| Valley periods | 00:00–07:00 and 23:00–24:00 | 0.49 |
| Flat periods | the rest time periods | 0.86 |
| Scenarios | WPP | PV | CHP | Power Purchasing |
|---|---|---|---|---|
| Scenario 1 | 71.658 | 8.6 | 86.25 | 6.78 |
| Scenario 2 | 78.726 | 8.846 | 77.4 | 3.227 |
| Scenario 3 | 79.206 | 8.846 | 78.894 | 0.799 |
| Index Comparing | Scenario 1 | Scenario 2 | Scenario 3 |
|---|---|---|---|
| Calculated system benefits (yuan) | 83,128.68 | 104,375.2 | 107,546.7 |
| Mean value of system benefits (yuan) | 83,167.73 | 104,299.4 | 107,621.0 |
| Calculated power curtailment (MWh) | 12.27 | 2.554 | 2.507 |
| Mean power curtailment (MWh) | 12.29 | 2.549 | 2.511 |
Publisher’s Note: MDPI stays neutral with regard to jurisdictional claims in published maps and institutional affiliations. |
© 2021 by the authors. Licensee MDPI, Basel, Switzerland. This article is an open access article distributed under the terms and conditions of the Creative Commons Attribution (CC BY) license (http://creativecommons.org/licenses/by/4.0/).
Share and Cite
Wu, J.; Tan, Z.; Wang, K.; Liang, Y.; Zhou, J. Research on Multi-Objective Optimization Model for Hybrid Energy System Considering Combination of Wind Power and Energy Storage. Sustainability 2021, 13, 3098. https://0-doi-org.brum.beds.ac.uk/10.3390/su13063098
Wu J, Tan Z, Wang K, Liang Y, Zhou J. Research on Multi-Objective Optimization Model for Hybrid Energy System Considering Combination of Wind Power and Energy Storage. Sustainability. 2021; 13(6):3098. https://0-doi-org.brum.beds.ac.uk/10.3390/su13063098
Chicago/Turabian StyleWu, Jing, Zhongfu Tan, Keke Wang, Yi Liang, and Jinghan Zhou. 2021. "Research on Multi-Objective Optimization Model for Hybrid Energy System Considering Combination of Wind Power and Energy Storage" Sustainability 13, no. 6: 3098. https://0-doi-org.brum.beds.ac.uk/10.3390/su13063098