Article

Assessment of Acidic Biochar on the Growth, Physiology and Nutrients Uptake of Maize (Zea mays L.) Seedlings under Salinity Stress

by
Mukesh Kumar Soothar
1,2,†,
Abdoul Kader Mounkaila Hamani
1,†,
Mahendar Kumar Sootahar
2,3,
Jingsheng Sun
1,*,
Gao Yang
1,*,
Saleem Maseeh Bhatti
2 and
Adama Traore
1
1
Key Laboratory for Crop Water Requirement and Regulation of Ministry of Agriculture, Farmland Irrigation Research Institute, Chinese Academy of Agricultural Sciences, Xinxiang 453002, China
2
Department of Soil Science, Sindh Agriculture University, Tandojam 70060, Pakistan
3
Institute of Environment and Sustainable Development in Agriculture, Chinese Academy of Agricultural Sciences, Beijing 100081, China
*
Authors to whom correspondence should be addressed.
Mukesh Kumar Soothar and Abdoul Kader Mounkaila Hamani contributed equally to this work.
Sustainability 2021, 13(6), 3150; https://0-doi-org.brum.beds.ac.uk/10.3390/su13063150
Submission received: 30 January 2021 / Revised: 19 February 2021 / Accepted: 4 March 2021 / Published: 12 March 2021

Abstract

:
The application of an acidic biochar can improve plant growth and soil properties in saline conditions. In this study, we investigated the effect of acidic biochar on plant growth and nutrients contents in saline soil. Seven treatments were arranged in a complete randomized design, including control (CK), 0, 30, and 45 g biochar added to a soil having 1% and 1.5% salts; these treatments were termed as B0S1, B30S1, B45S1 and B0S1.5, B30S1.5, B45S1.5 respectively. Experimental results showed that the plant height, leaves plant−1, leaf area, and shoot fresh and dry biomass, and root fresh and dry biomass were increased for the B45S1.5, respectively. Similarly, the highest total nitrogen (TN), total phosphorus (TP), total potassium (TK), and total sodium (Na) concentration in maize shoot were observed for B30S1, B0S1.5, CK, and B0S1.5, respectively. The highest concentrations of TN, TP, TK, and Na in root were obtained with the treatments B0S1, B0S1, B45S1, and B0S1, respectively. Soil pH, and EC decreased and nutrients concentration improved by the addition of acidic biochar. We conclude that the use of acidic biochar can be a potential source for the improvement of maize plant growth as well as mitigate the adverse effect of salt stress.

1. Introduction

Salt stress has become an environmental constraint to crop productivity in the arid and semi-arid regions of the world. It is one of the abiotic stresses for plant growth and development, which ultimately causes a reduction in the yield [1]. Salt stress triggers inhibition in plant development and yield by imposing osmotic stress, causing ion toxicity and nutrients imbalance in plants [2,3]. Salt stress induces multiple effects on plants, including morphological, physiological, biochemical, and molecular changes [4,5]. Some of the effects in various crops include inhibition in leaf expansion, photosynthesis, chlorophyll contents, plant height, leaf area index, seed production, plant biomass and yield, uptake of water, and essential nutrients [3,6,7,8]. Salinity also affects the soil quality and its usage by deteriorating soil physical, chemical, and biological properties [9,10,11]. Salinity and alkalinity problems are most likely to occur under irrigated soils in arid and semi-arid regions. Saline-alkali soils contain not only an excessive amount of soluble salts but also a harmful amount of adsorbed sodium. The alkalinity of soil confined the plant growth and reduced the yield of maize [12].
Many research studies have reported different strategies to minimize the effect of salt stress on plants [13,14]. Some of the strategies include leaching of salts, replacement of Na+ application of gypsum (CaSO4), growing of salt-tolerant varieties, phytoremediation, and application of various organic materials (plant residue, compost, biochar, organic matter, poultry manure, rice straw manure) [13,15].
In the last two decades, the biochar has received a great attention among researchers by its positive effects of mitigating salinity stress in plant growth and soil properties [16,17]. Biochar is pyrolyzed product of different organic materials (crop residual, animal and poultry waste) by heating at various temperatures. Biochar is highly recalcitrant due to its high aromaticity and is able to sequester carbon for a long time [18]. Its pH is variable depending upon the material used for its production [19,20]. Biochar is extensively used in agriculture because of its numerous benefits, for example, it improves soil physical, chemical, and biological properties [21,22,23,24], increases soil water holding capacity, permeability, and aeration [25,26], enhances soil organic matter content and mineral [26,27,28], reclaims the saline soils [13] and increases crops yield [29,30].
The properties of biochar are dependent upon the material used for its production and pyrolysis temperature [31,32]. The pH of biochar is variable from acidic to alkaline [33]. When the pyrolysis temperature increases, it affects the biochar pH, ash content, total carbon and nutrients contents [34,35]. Generally, alkaline biochars are applied to the soils [36,37]. Alkaline biochars have high pH, alkalinity (CaCO3), and EC [36,38]. The high pH and EC of biochars can increase soil pH and EC. Some studies have reported negative effect of alkaline biochars on plant biomass and concentration of nutrients (NP) [39], soil properties [40], and soil biota [41]. A study conducted by Qi et al. [42] revealed that biochar having a neutral pH (7.0) increased more soil pH and EC when compared to acidic biochar.
However, following the literature review, very limited information is available about the effect of acidic biochar incorporation in the soil to mitigate salinity stress. Thus, we hypothesized that acidic biochar may decrease high soil pH, mitigate the salinity stress and establish plant growth. The study was conducted with aims 1, to evaluate the effect of acidic biochar on the growth parameters of maize at the seedling stage; 2, to investigate the effect of acidic biochar on nutrients concentration in plant parts and 3, to determine the effect of acidic biochar on soil chemical properties.

2. Materials and Methods

2.1. Soil and Salt Analysis

The surface soil layer (0–20 cm) used in the current experiment was taken from Apple Orchard of Alar city, Xinjiang Province of China. The soil was ground and passed through a sieve in order to remove gravels. Physico-chemical properties of soil were analyzed before initiation of the experiment and are given in Table 1. Soil pH and electrical conductivity (EC) were measured in 1:5 w/v extract by using pH and EC meter (Fisher Scientific, USA). For soil texture, the hydrometer method was used [43]; cation exchange capacity of soil was determined by the ammonium acetate method [44], and total N and P were analyzed by an elemental analyzer. Salt was also collected from the Alar city of Xinjiang Province, the salt EC value was ~17 dS m−1 and was analyzed for selected chemical properties, i.e., chloride, potassium, sodium, calcium, and magnesium, before using for the experiment (Table 1).

2.2. Collection of Biochar and Its Characterization

The acidic wood biochar was collected from Shangqiu SanLi Company, Henan Province, China, which was pyrolyzed at approximately 250–300 °C in an oxygen-free kiln. The method proposed by Dai et al. [45] was used for the determination of biochar pH in water extract with a pH meter (1:10 w/v). Cation exchange capacity was determined by the ammonium acetate method [46] and total nitrogen (N), phosphorus (P), potassium (K), and sodium (Na) were measured by acid digestion method [47], and extract of the samples was run on Continuous Flow-Analyzer AA3. The biochar characteristics are presented in Table 1.

2.3. Experimental Site and Treatments

The experiment was conducted during the year 2020 in a controlled greenhouse at Farmland Irrigation Research Institute, Chinese Academy of Agricultural Sciences (CAAS), Qiliying, Xinxiang. The temperature inside the greenhouse was maintained at 30/25 °C for day/night with a photoperiod of 14 h. The PVC pots (15 cm width and 25 cm height) were filled with soil-biochar mixtures. The experimental treatments consisting of two biochar levels and two salt levels were arranged in a complete randomized design with a 2 × 2 factorial scheme. In this study, seven treatments were arranged, including control (CK: no biochar and salt), and 0, 30, and 45 g biochar added to a soil having 1% and 1.5% salts; these treatments were termed as B0S1, B30S1, B45S1 and B0S1.5, B30S1.5, B45S1.5 respectively. A total number of 35 plants were used during the experiment, with five plants per treatment. Three seeds of the maize plant (cv. Denghai605) were sown in each pot, and after one week of successful germination, one plant per pot was maintained. Fertilization was made with Hoagland solution [48] twice (first and second week after sowing) throughout the experiment duration.

2.4. Chlorophyll Fluorescence and SPAD Chlorophyll Content

Chlorophyll fluorescence was measured with a portable chlorophyll fluorescence meter (MINITAB-II) after 30 minutes’ dark adaptation [49]. The maximal photochemical efficiency of photosystem II (Fv/Fm) was calculated to tests whether or not plant stress affects photosystem II in a dark adapted state. Chlorophyll fluorescence is expressed as Fv/Fm ratio. It was calculated as; (Equation (1))
Fv/Fm = Fm − Fo/Fm
where Fm and F0 are maximal and minimal fluorescence of dark adopted leaves, respectively, and Fv is variable fluorescence (the difference between Fm and Fo) [50]. Chlorophyll contents of fully expanded young leaves of three replicates of maize seedlings were measured using the SPAD-502Minolta Chlorophyll meter (Spectrum Technologies Inc., Ill.) [6].

2.5. Seedling Growth Characteristics

Thirty days after sowing, growth parameters such as plant height, leaf area, number of leaves, shoot fresh weight and dry weight, and root fresh weight and dry weight were determined. Plant height and leaf area were measured by using a ruler and the number of leaves were counted manually. Plant height was measured from the ground to the flag leaf, and leaf area was calculated using the equation (Leaf area cm2 = height × width × A) by taking the average height (cm) and width (cm) of each treatment and a constant (A = 0.75) [51]. Fresh biomass of shoot was obtained from each pot and was placed in oven at 70 °C for 72 h to a constant dry weight. Roots were extracted from each replicate, rinsed with tap water following de-ionized water. The fresh weight of roots was recorded and was placed in an oven at 70 °C for 72 h and to a constant weight and weighed to determine dry weight.

2.6. Nutrients Analysis

Both dried plant tissues (above and below ground) were ground and stored in a sealed container for nutrients analysis. The samples were digested for N, P, K, and Na by acid digestion method [46] and the extract of samples was run on Continuous Flow-Analyzer (Bran and Luebbe AA3, Norderstedt, Germany).

2.7. Post-Harvest Analysis of Soil

After the harvest of maize seedlings, soil samples were collected for post-harvest chemical properties and nutrient contents. Samples were collected at the depth of 0–20 cm with the help of an auger. Collected soil samples were processed and analyzed for pH, EC, total nitrogen, phosphorus, potassium, and sodium.

2.8. Statistical Analysis

The collected data was subjected to one-way ANOVA and correlations between the different treatments were determined by Pearson correlation using SPSS software 23.0 (IBM Corporation, New York, NY, USA). The multiple comparisons between all treatments were analyzed using Tukey’s test. The data are expressed as the mean (n = 3) ± SE (standard errors), and Duncan’s multiple range tests were performed at a significance level of <0.05.

3. Results

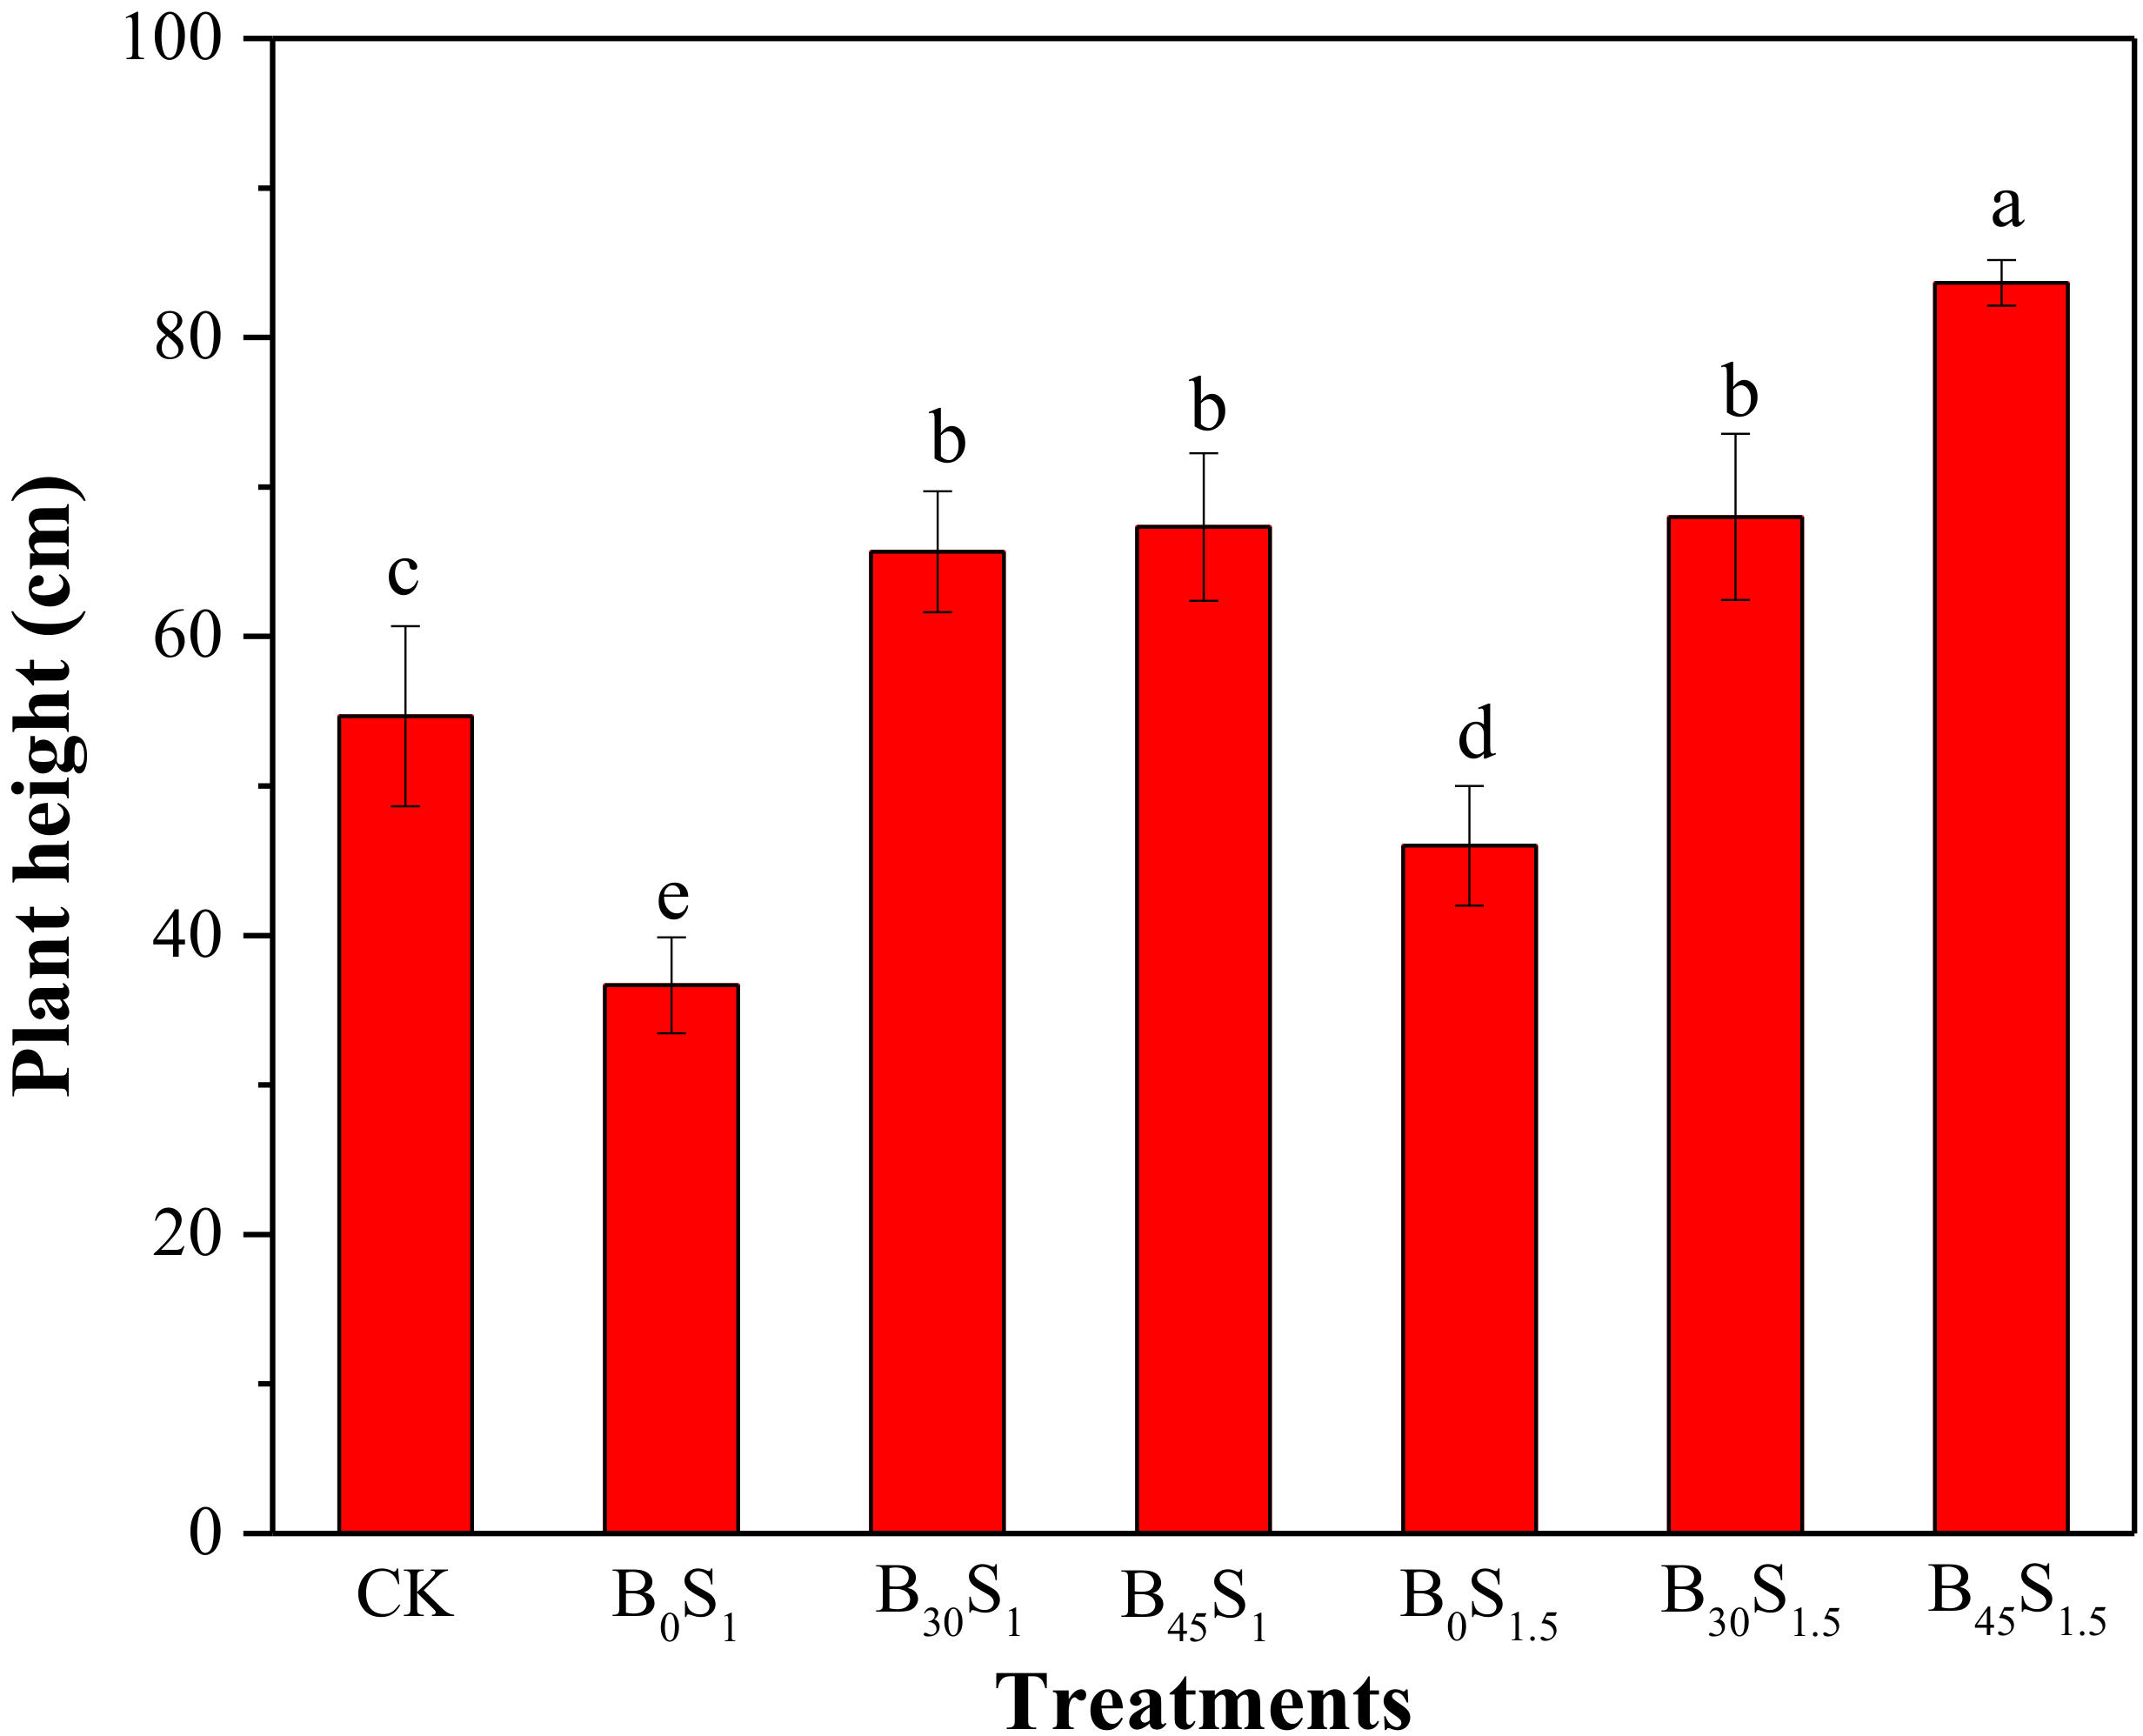
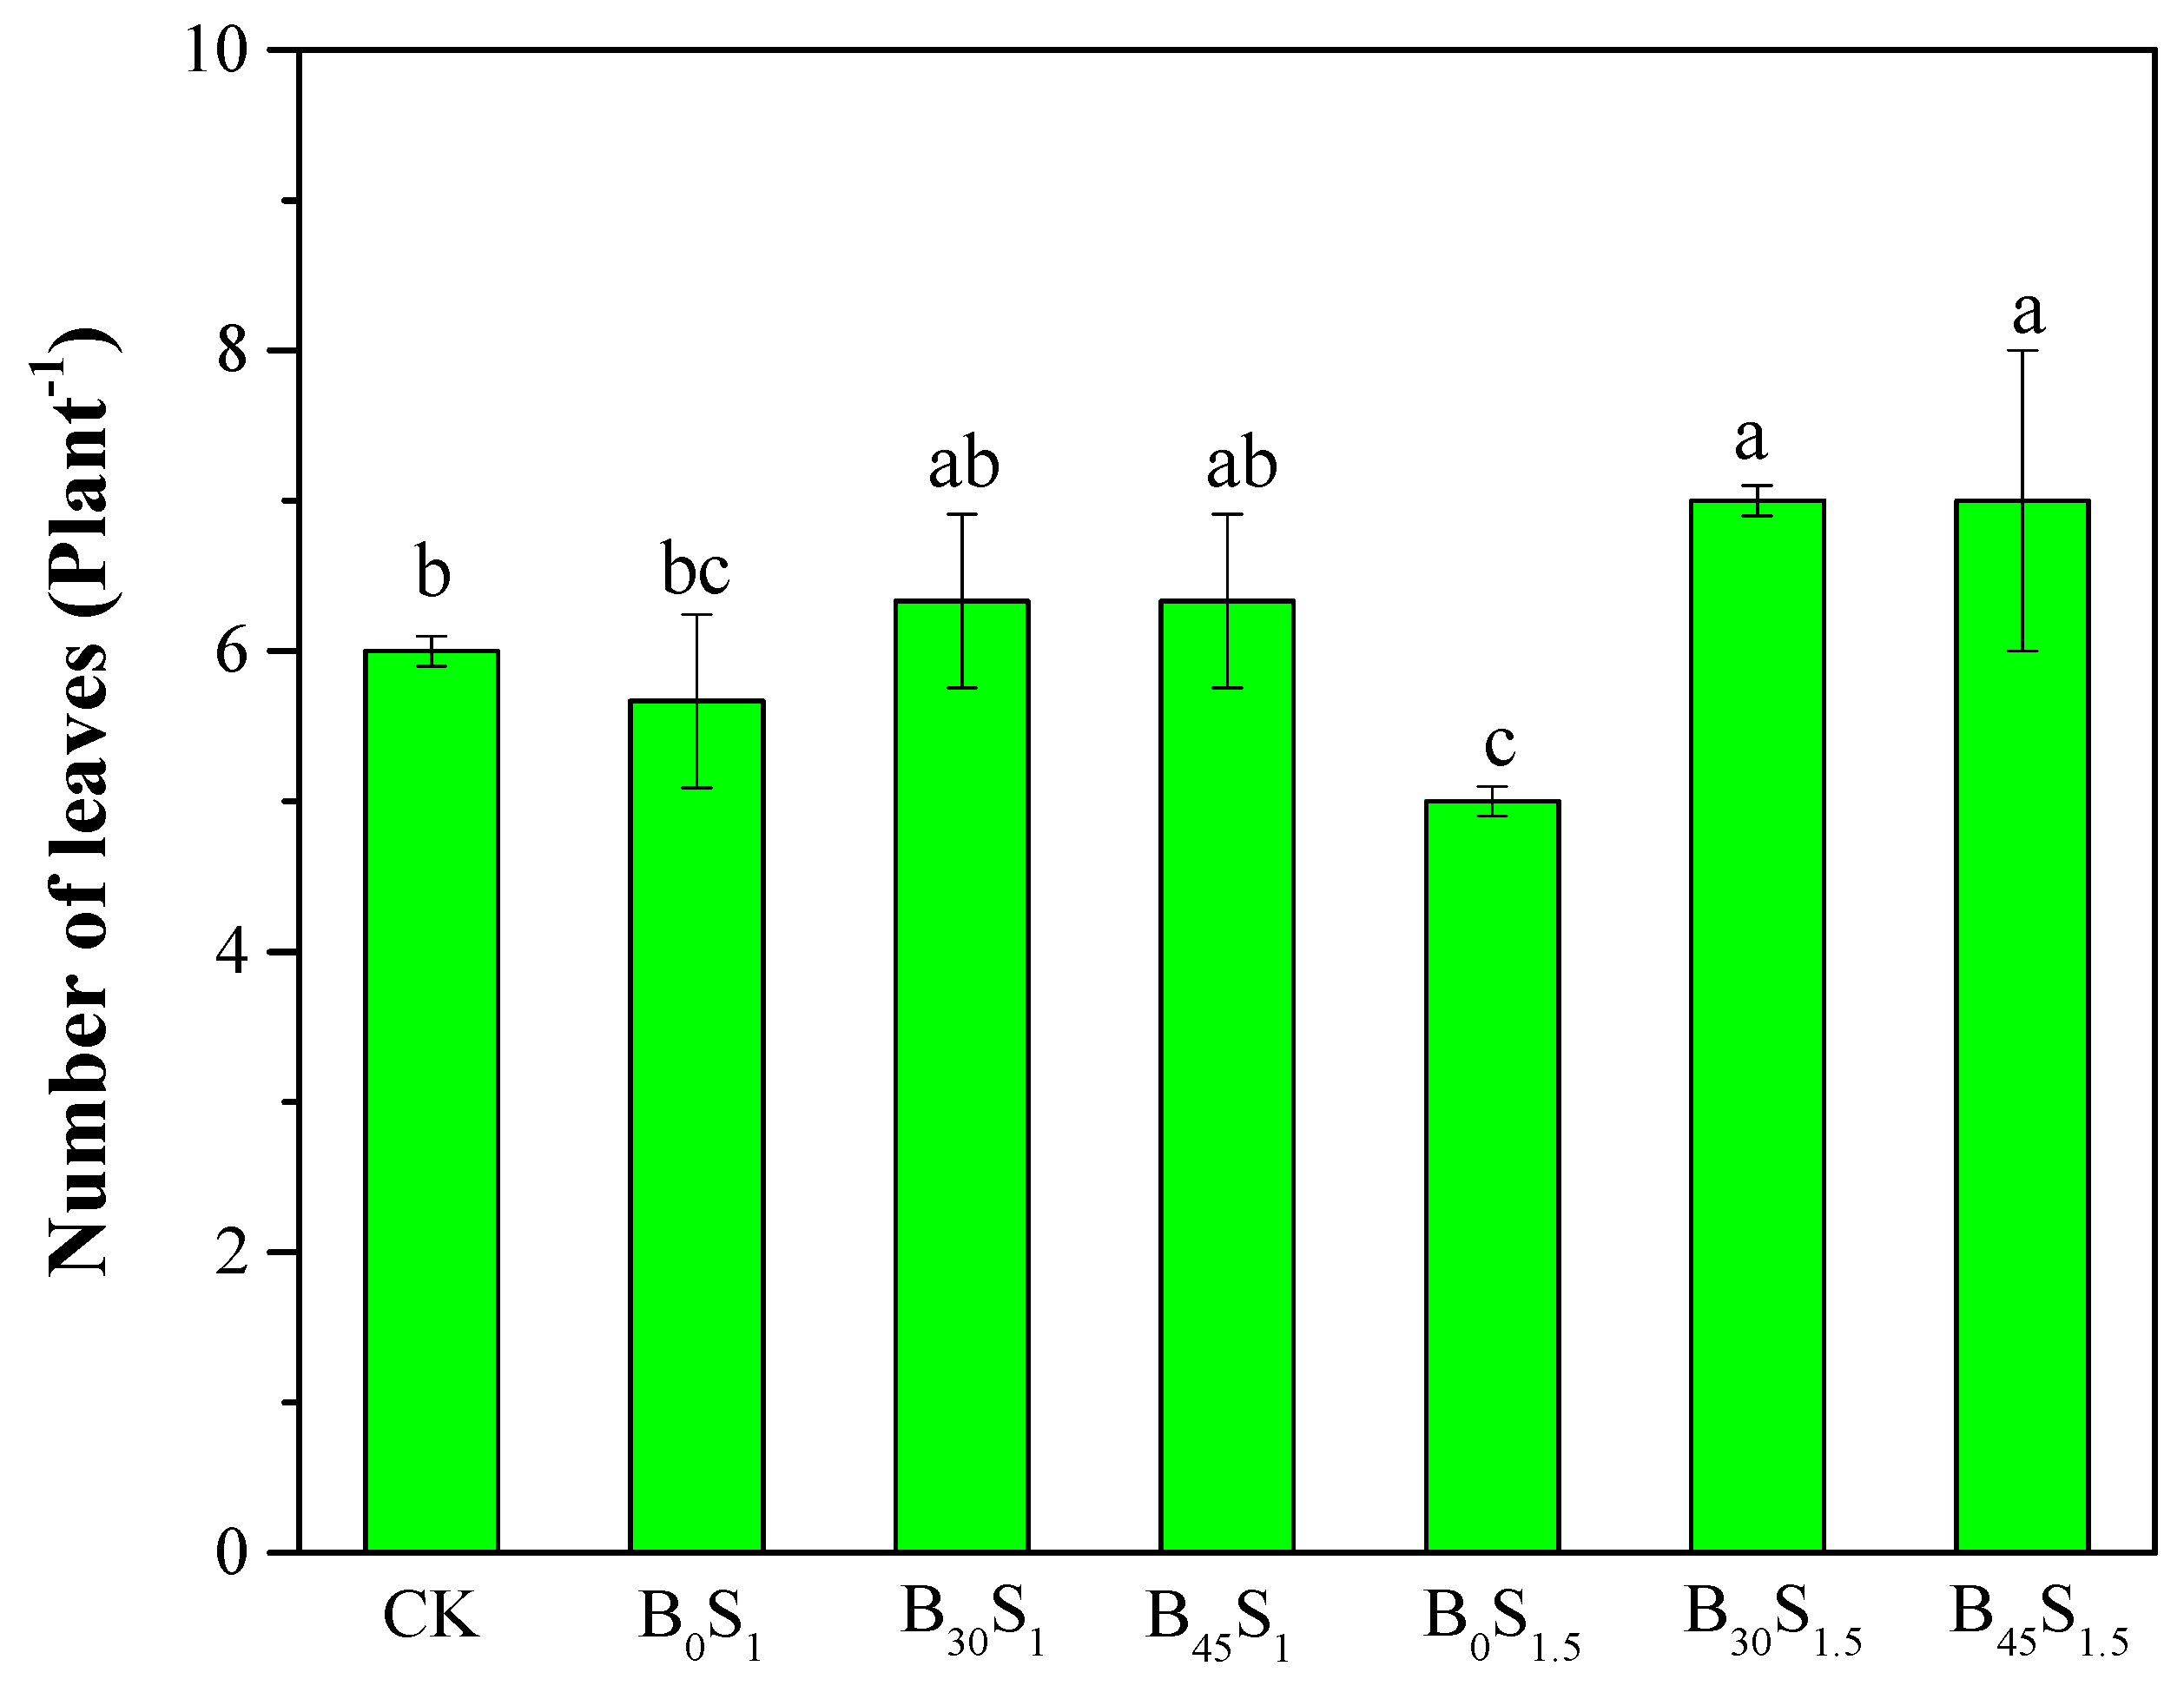
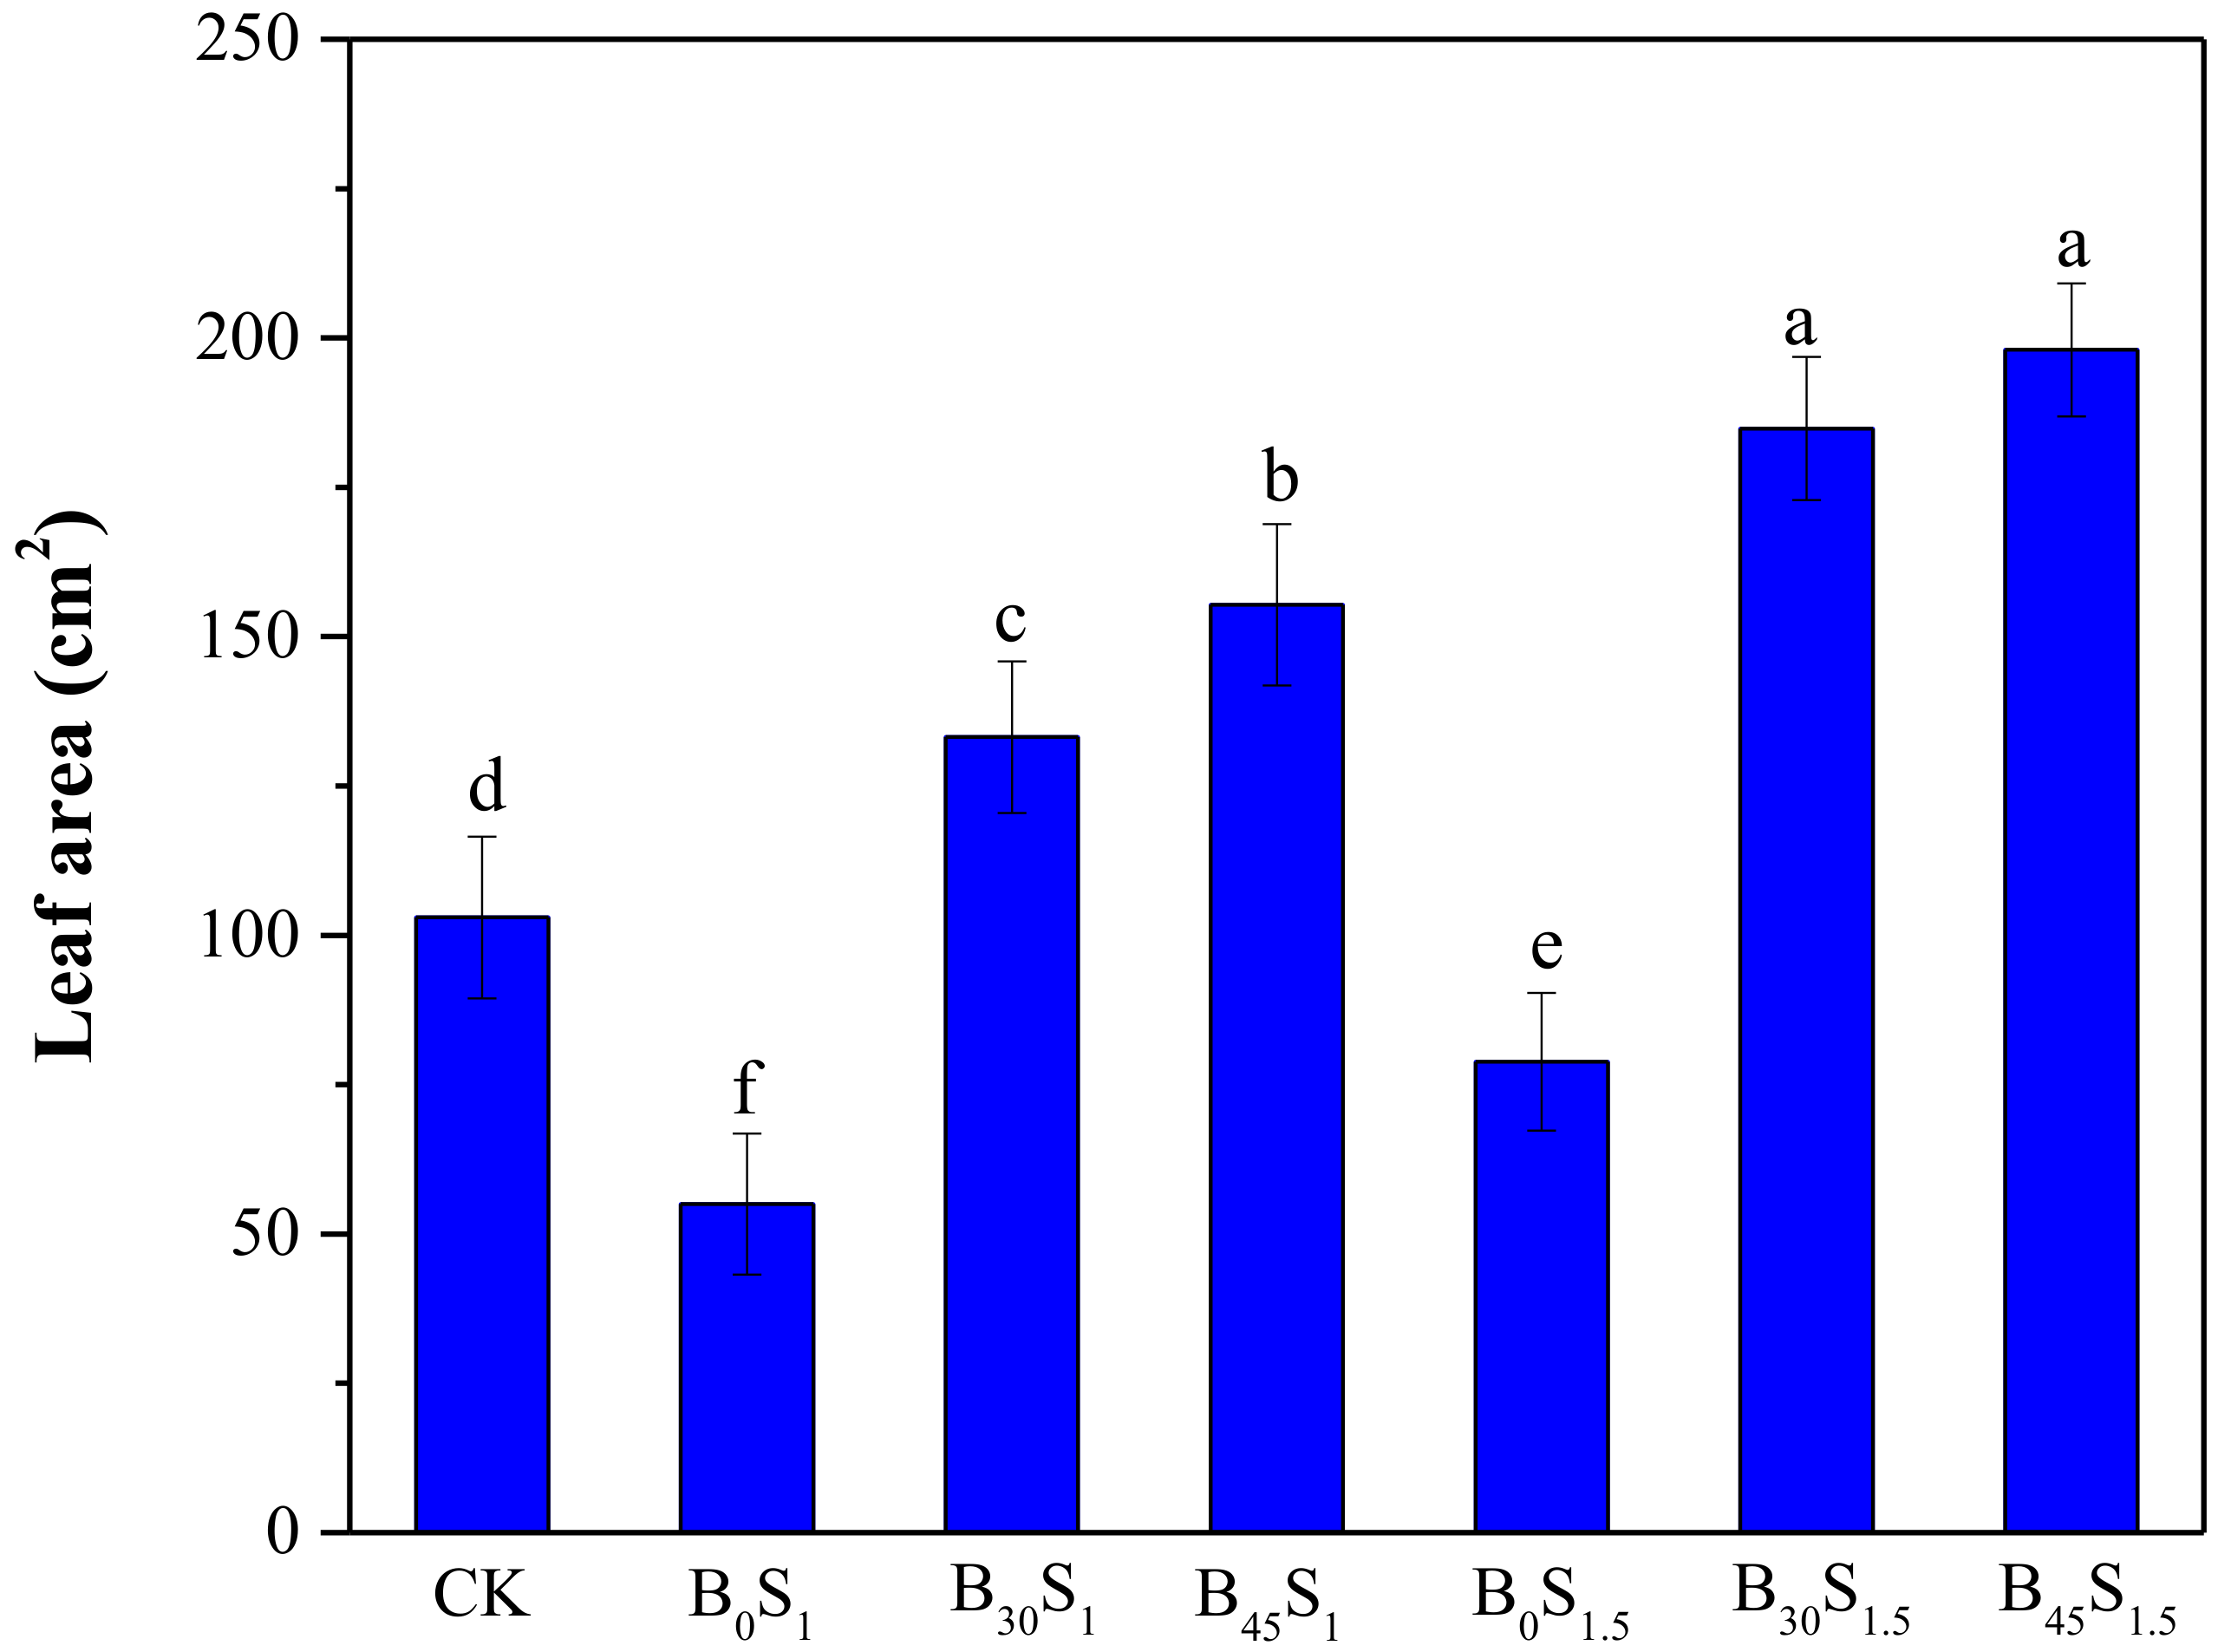
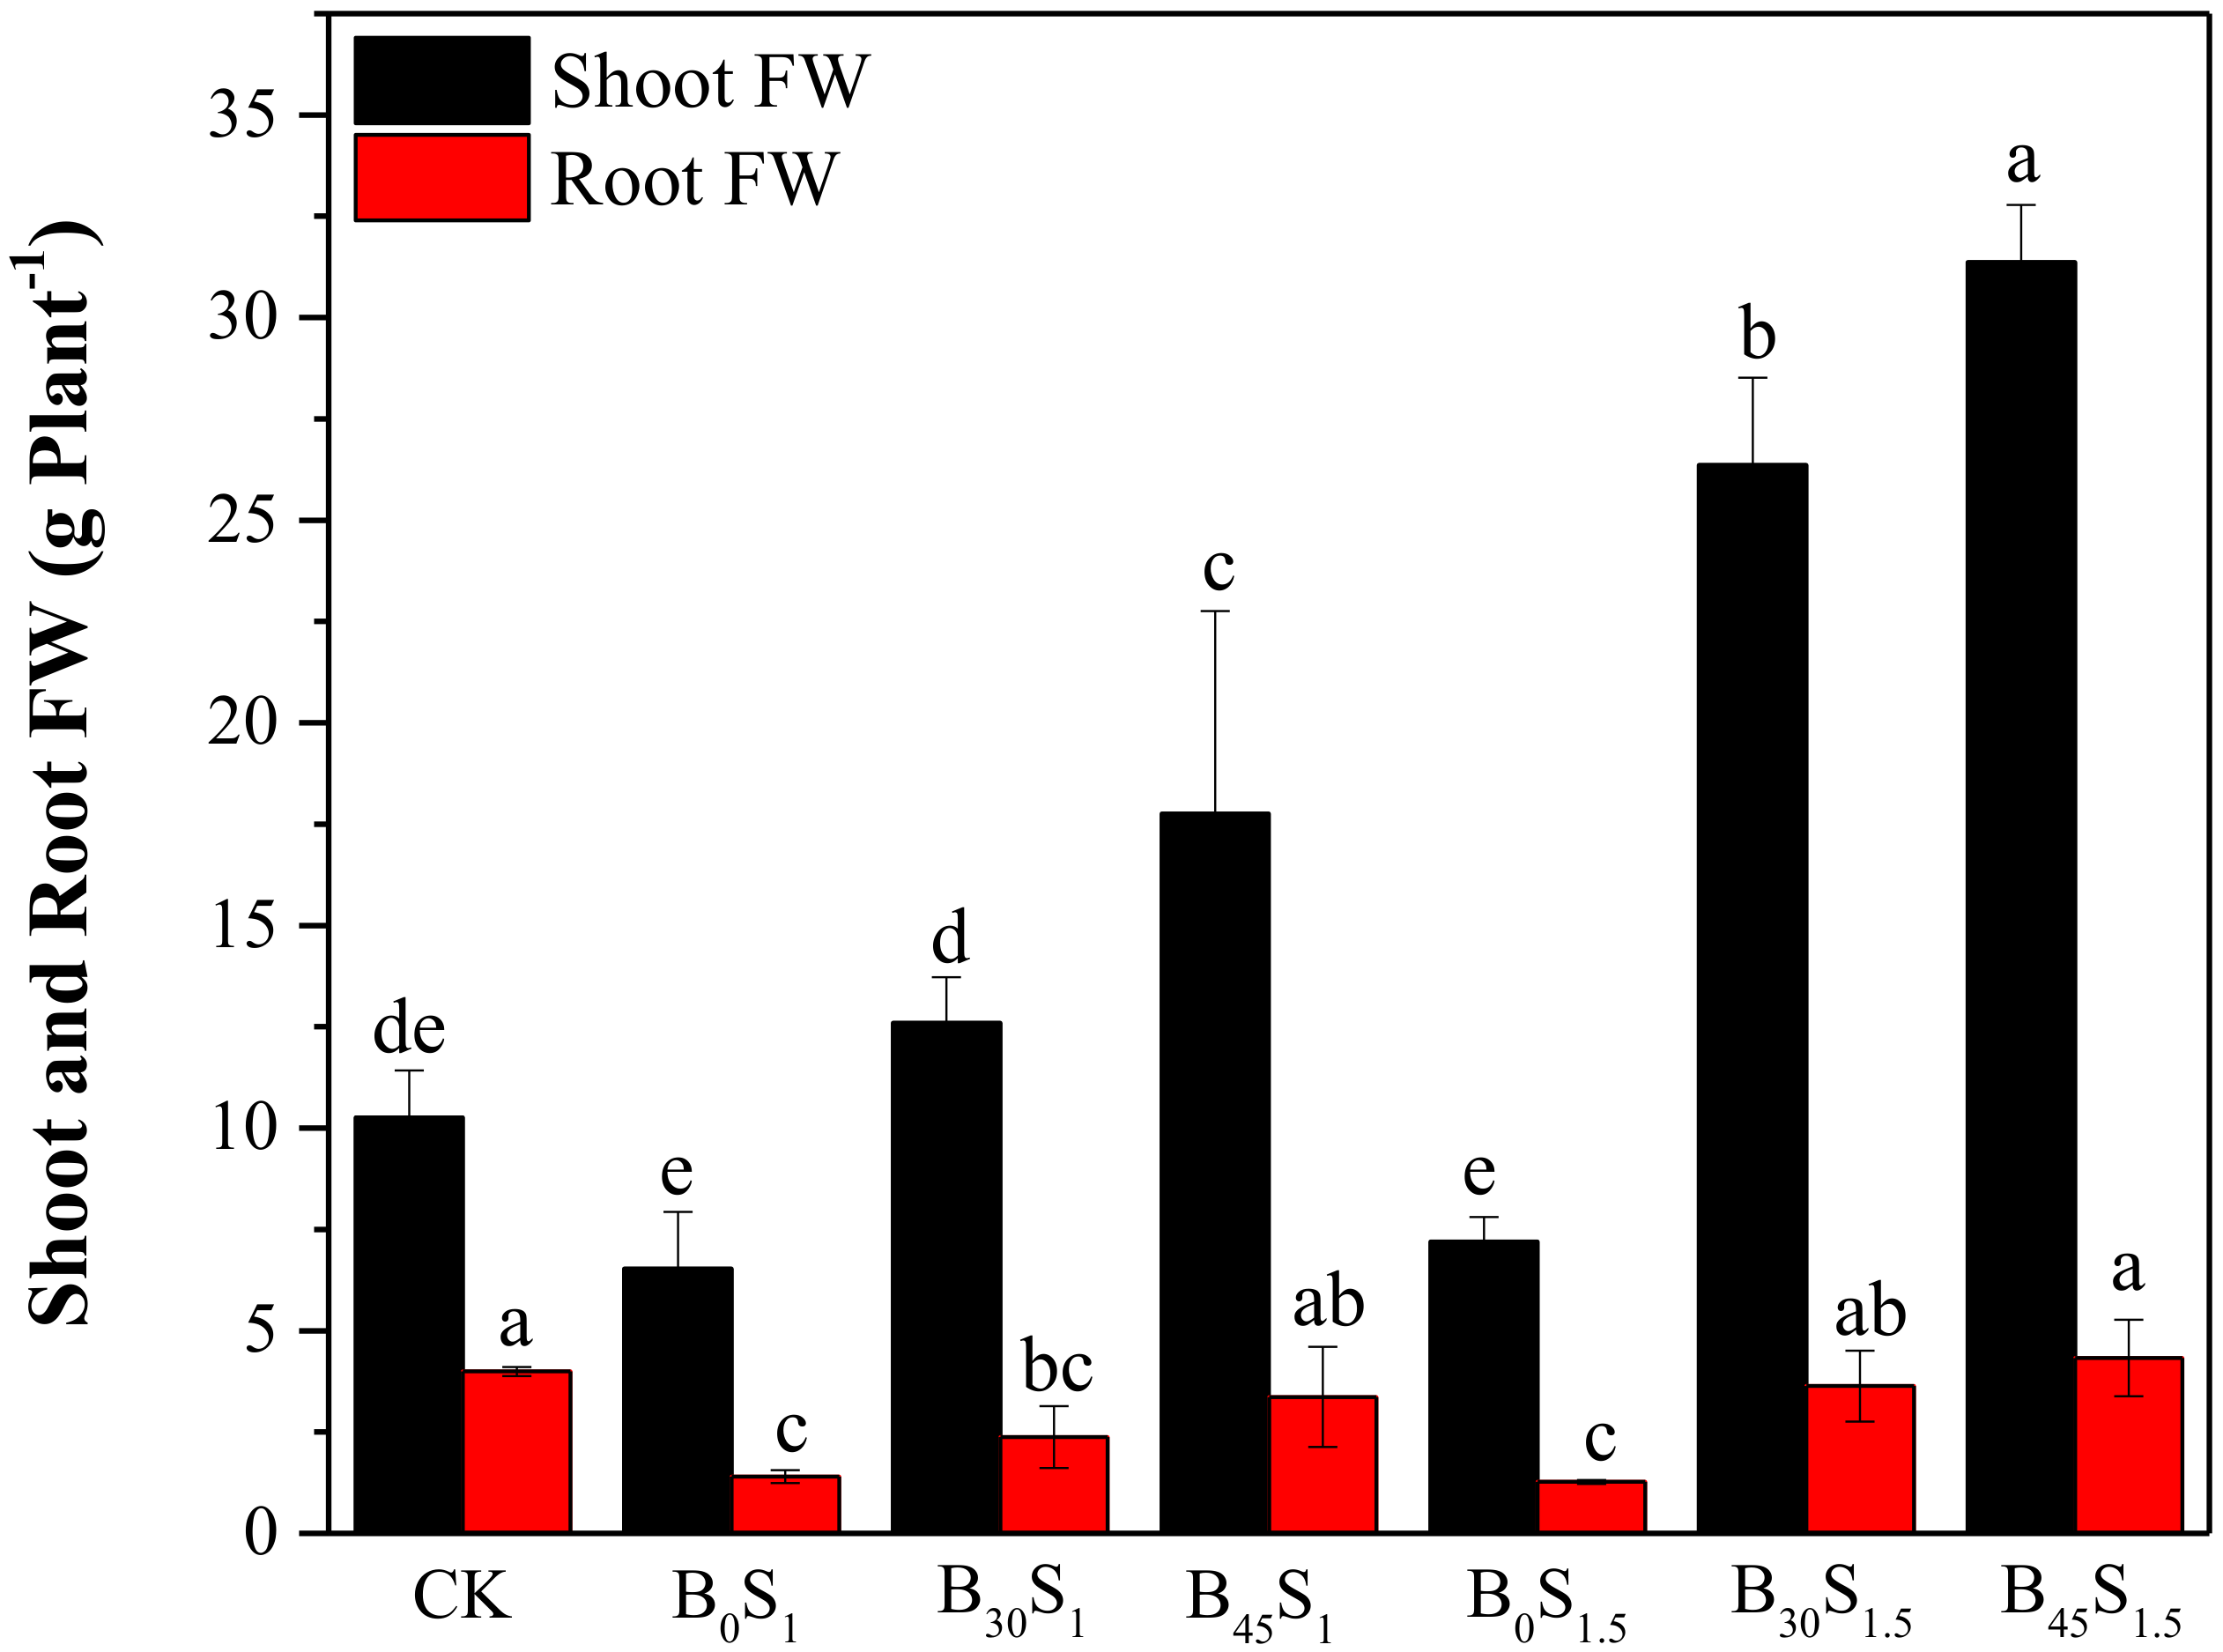
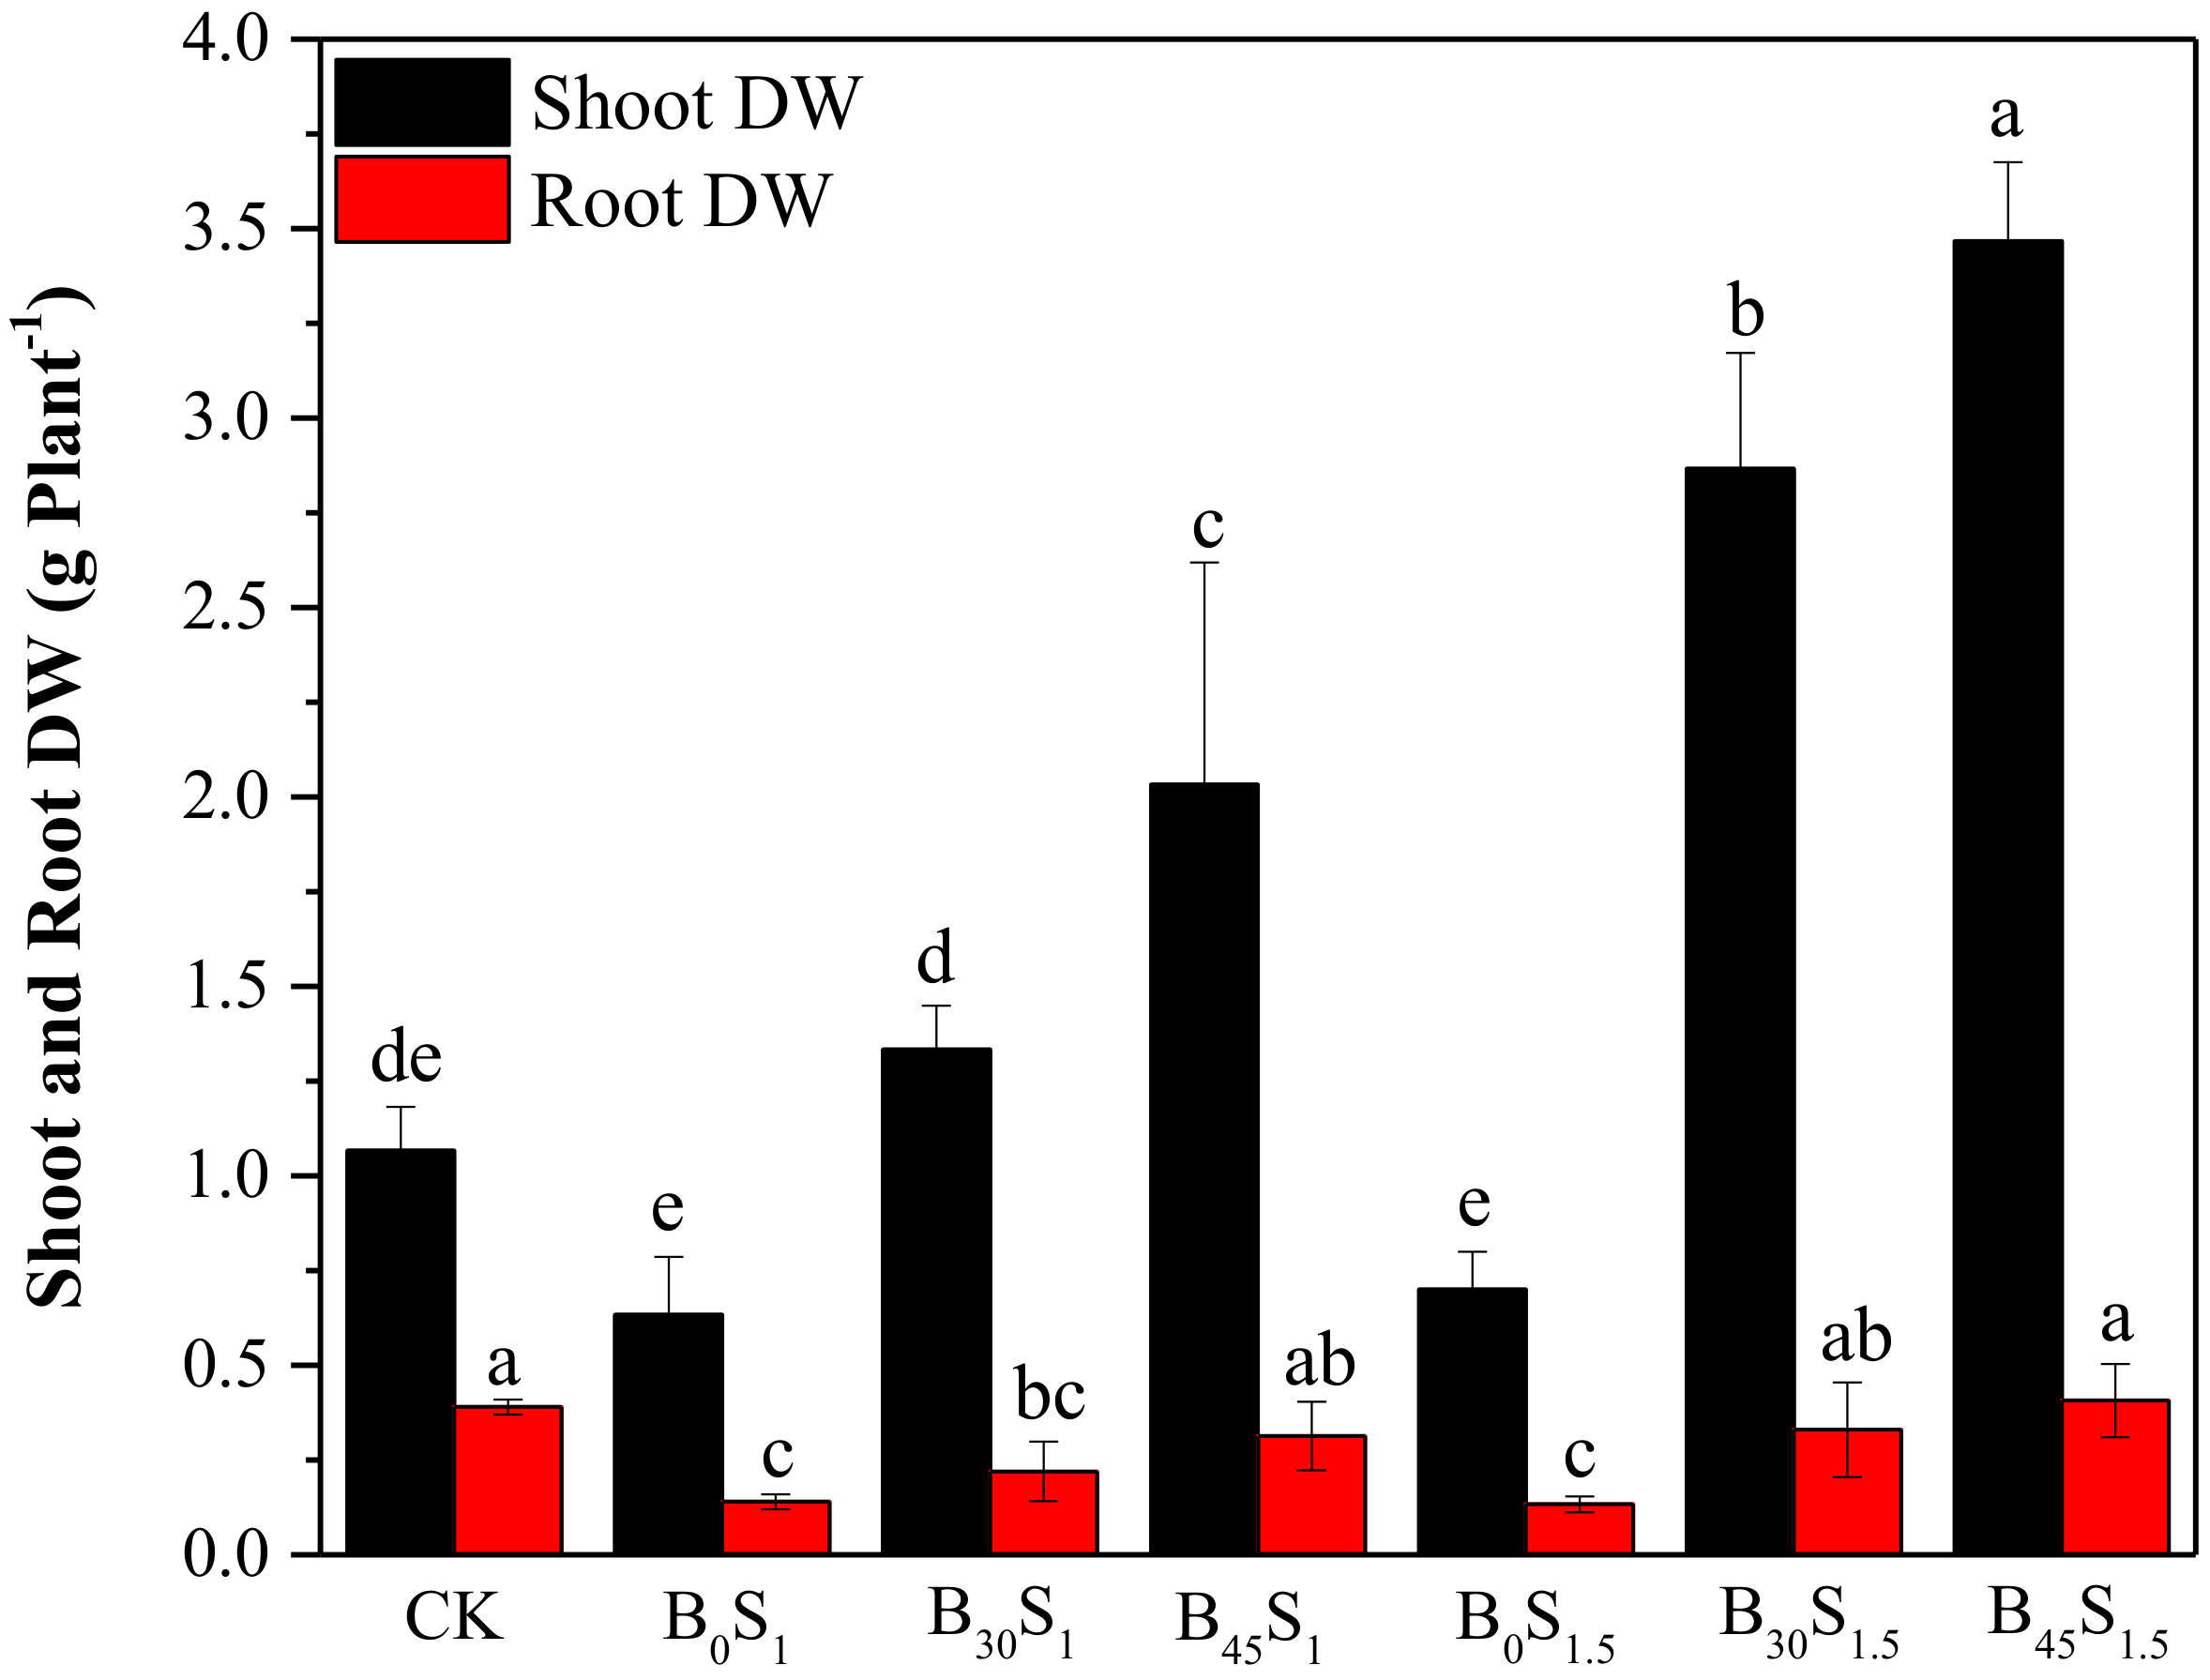
3.1. Effects of Acidic Biochar on Plant Growth Attributes

The growth parameters of maize seedlings, including plant height, number of leaves, leaf area, shoot fresh and dry weight of maize seedlings were significantly affected by the addition of biochar, especially the treatments B30S1 and B45S1 compared to control (CK) (Figure 1, Figure 2, Figure 3, Figure 4 and Figure 5). The results showed that both biochar levels (30 and 45 g kg−1) enhanced plant height, the number of leaves, leaf area, shoot and root fresh and dry weight as compared CK. Under 45 g kg−1 biochar with 1 and 1.5% salt application, the plant height and leaf area were increased by 23.2 and 53.0 and 50.8 and 92.2% in B45S1 and B45S1.5, respectively, as compared to CK (Figure 1 and Figure 3). However, with the same biochar and salt levels, the above-mentioned growth components increased by 83.6 and 81.9, 11.8, and 40.0 and 182.4 and 151.2% in B45S1 and B45S1.5, respectively, when compared with only salt applied treatments (B0S1 and B0S1.5). Comparatively, the combined application of biochar and salt increased the corresponding parameters.
The B45S1 and B45S1.5 showed significantly higher shoot fresh weight as compared to CK and the salt-treated plants without biochar, respectively. B45S1 and B45S1.5 increased the shoot fresh-weight by 73.1 and, 171.9% and 205.5 and 335.6%, respectively, when compared with CK and salt-treated plants. The root fresh-weight was increased by 8.3 and 2.4% respectively in B45S1.5 as compared to CK and B0S1.5. Root fresh weight under B30S1 increased by 139.9% compared to B0S1. (Figure 4).
Figure 5 indicated that the higher level of biochar (45 g kg−1) and salt levels (1 and 1.5%) increased shoot dry weight by 90.6 and 221.1% and 225.0 and 395.2% respectively, for the same said above treatments when compared with CK and B0S1 and B0S1.5. Acidic biochar amendment enhanced root dry weight by 4.3 and 205.1%, respectively, for B45S1.5, while 45 g kg−1 biochar increased root dry weight by 123.8% in B45S1 compared to B0S1 (Figure 5). At the same time, it can be noticed that plants treated with salt only, responded negatively to all the above-mentioned growth attributes.

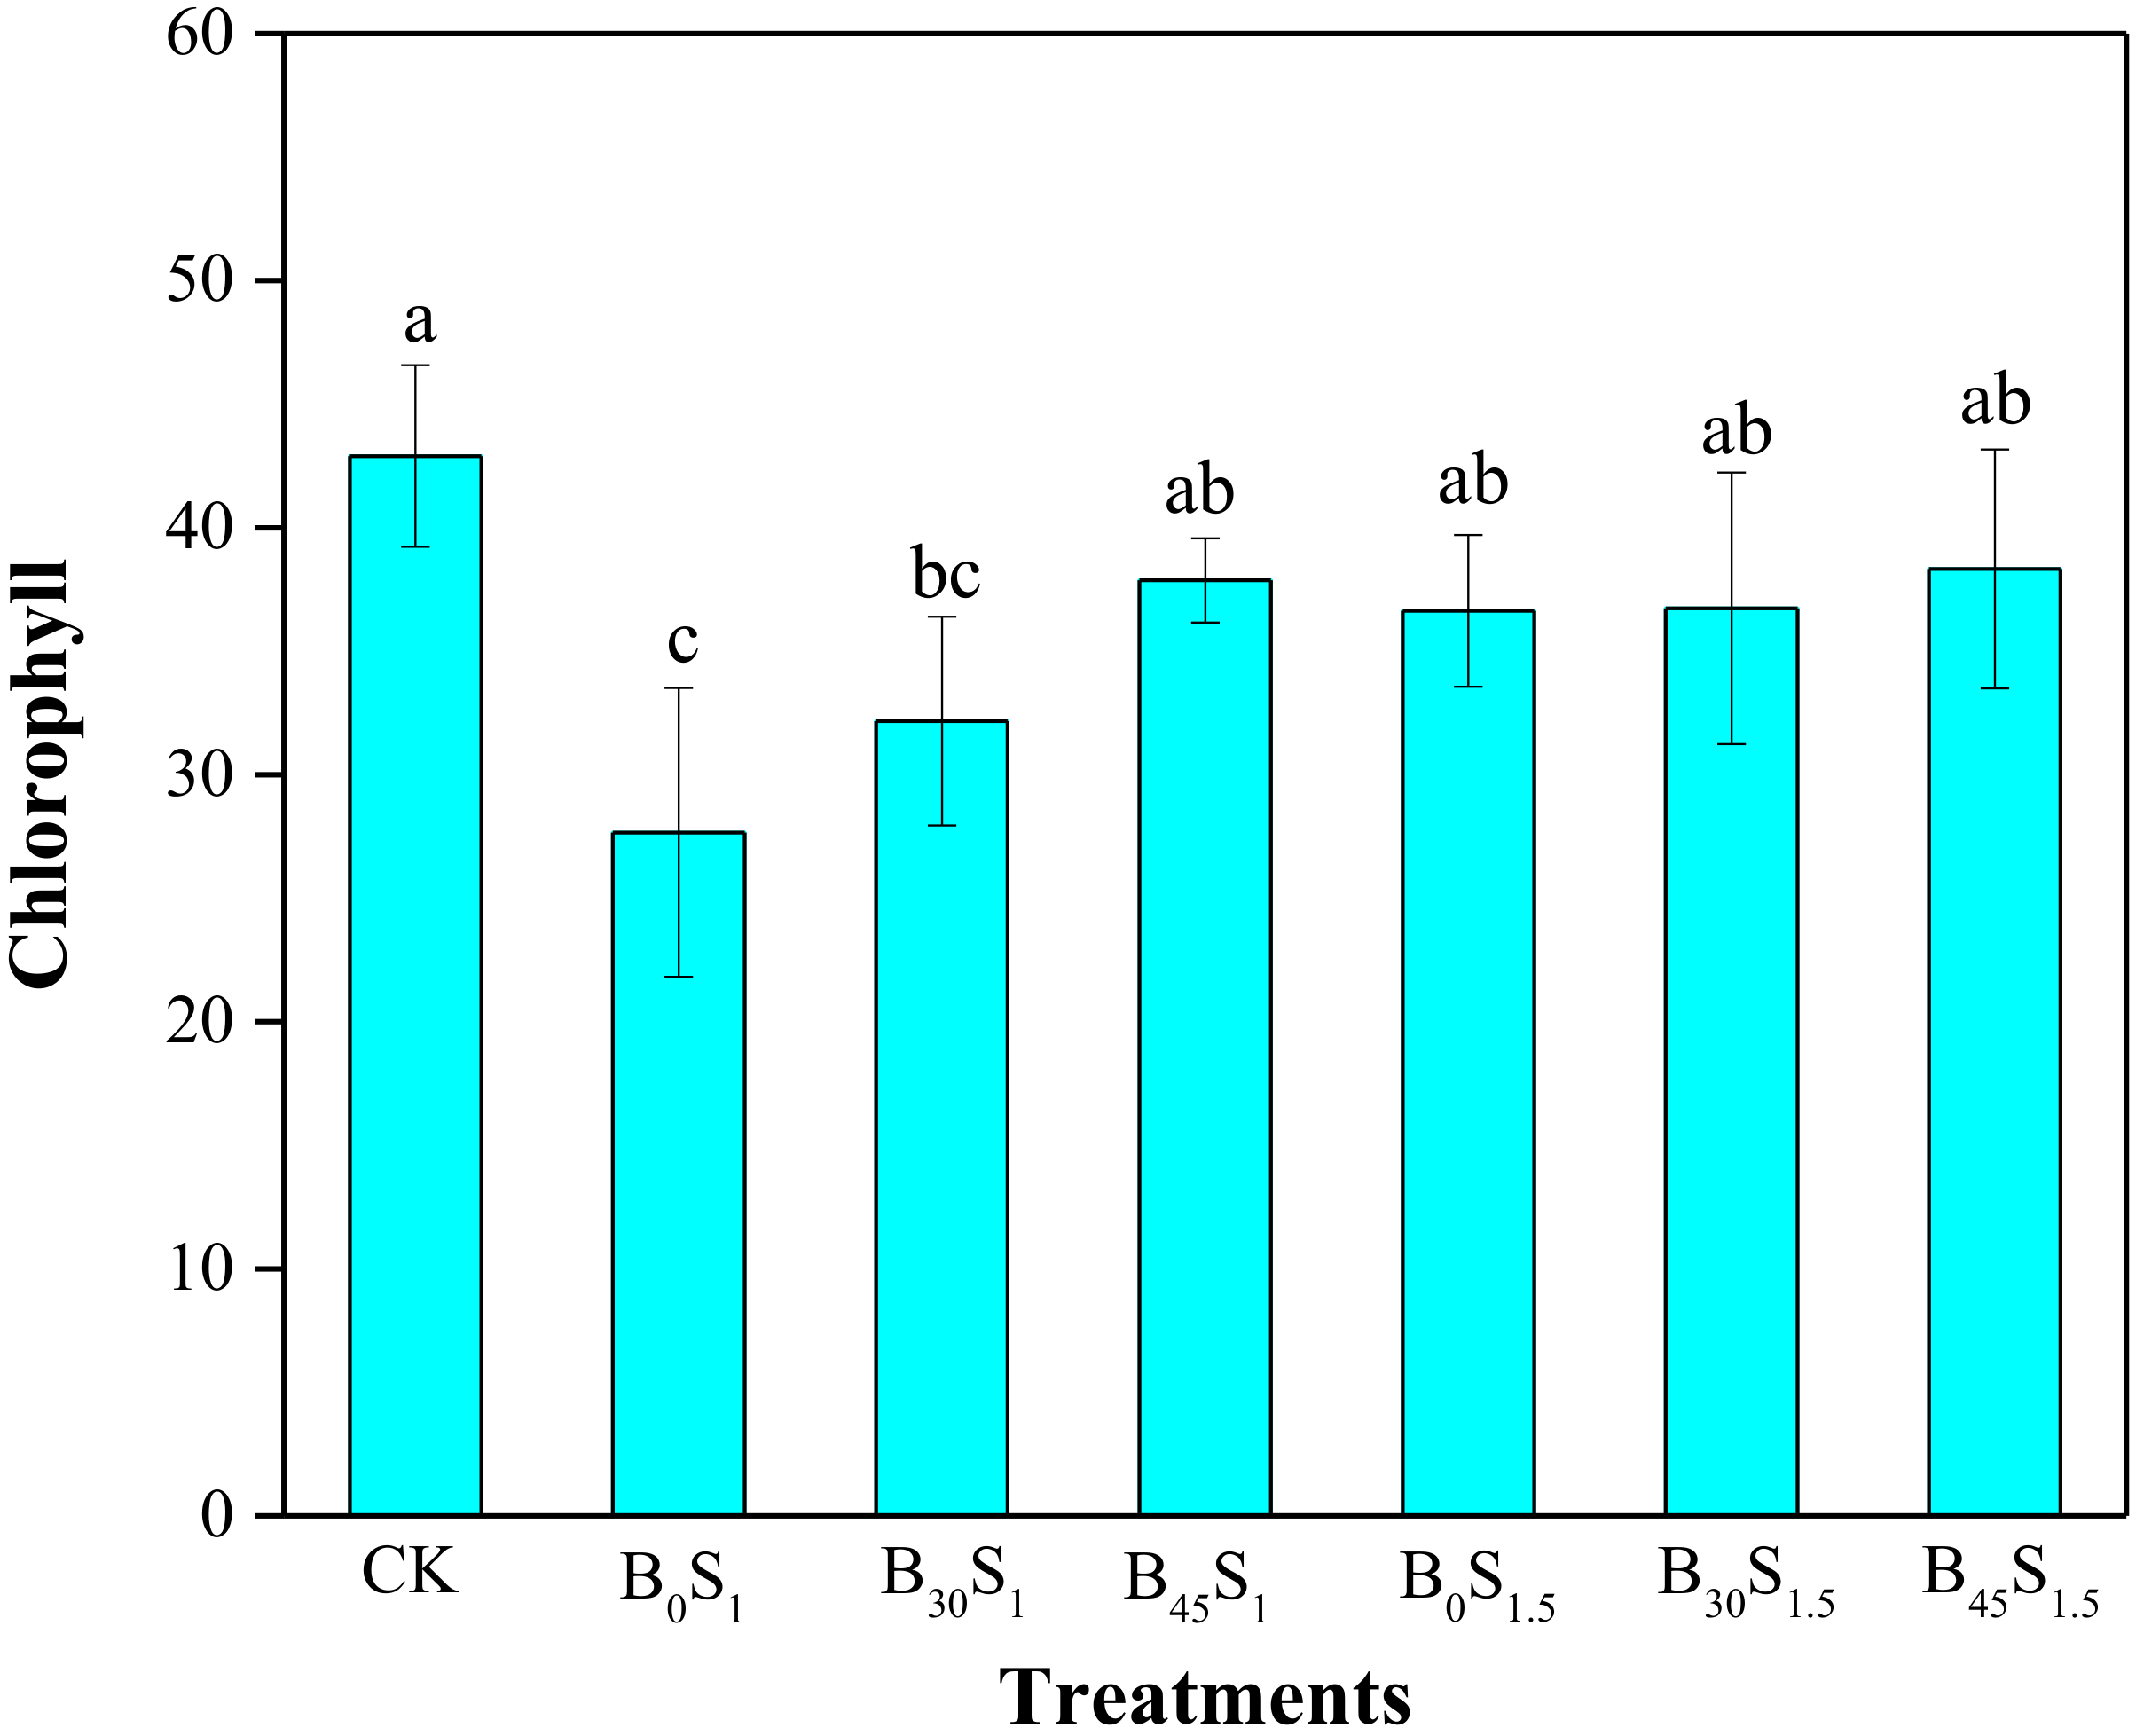
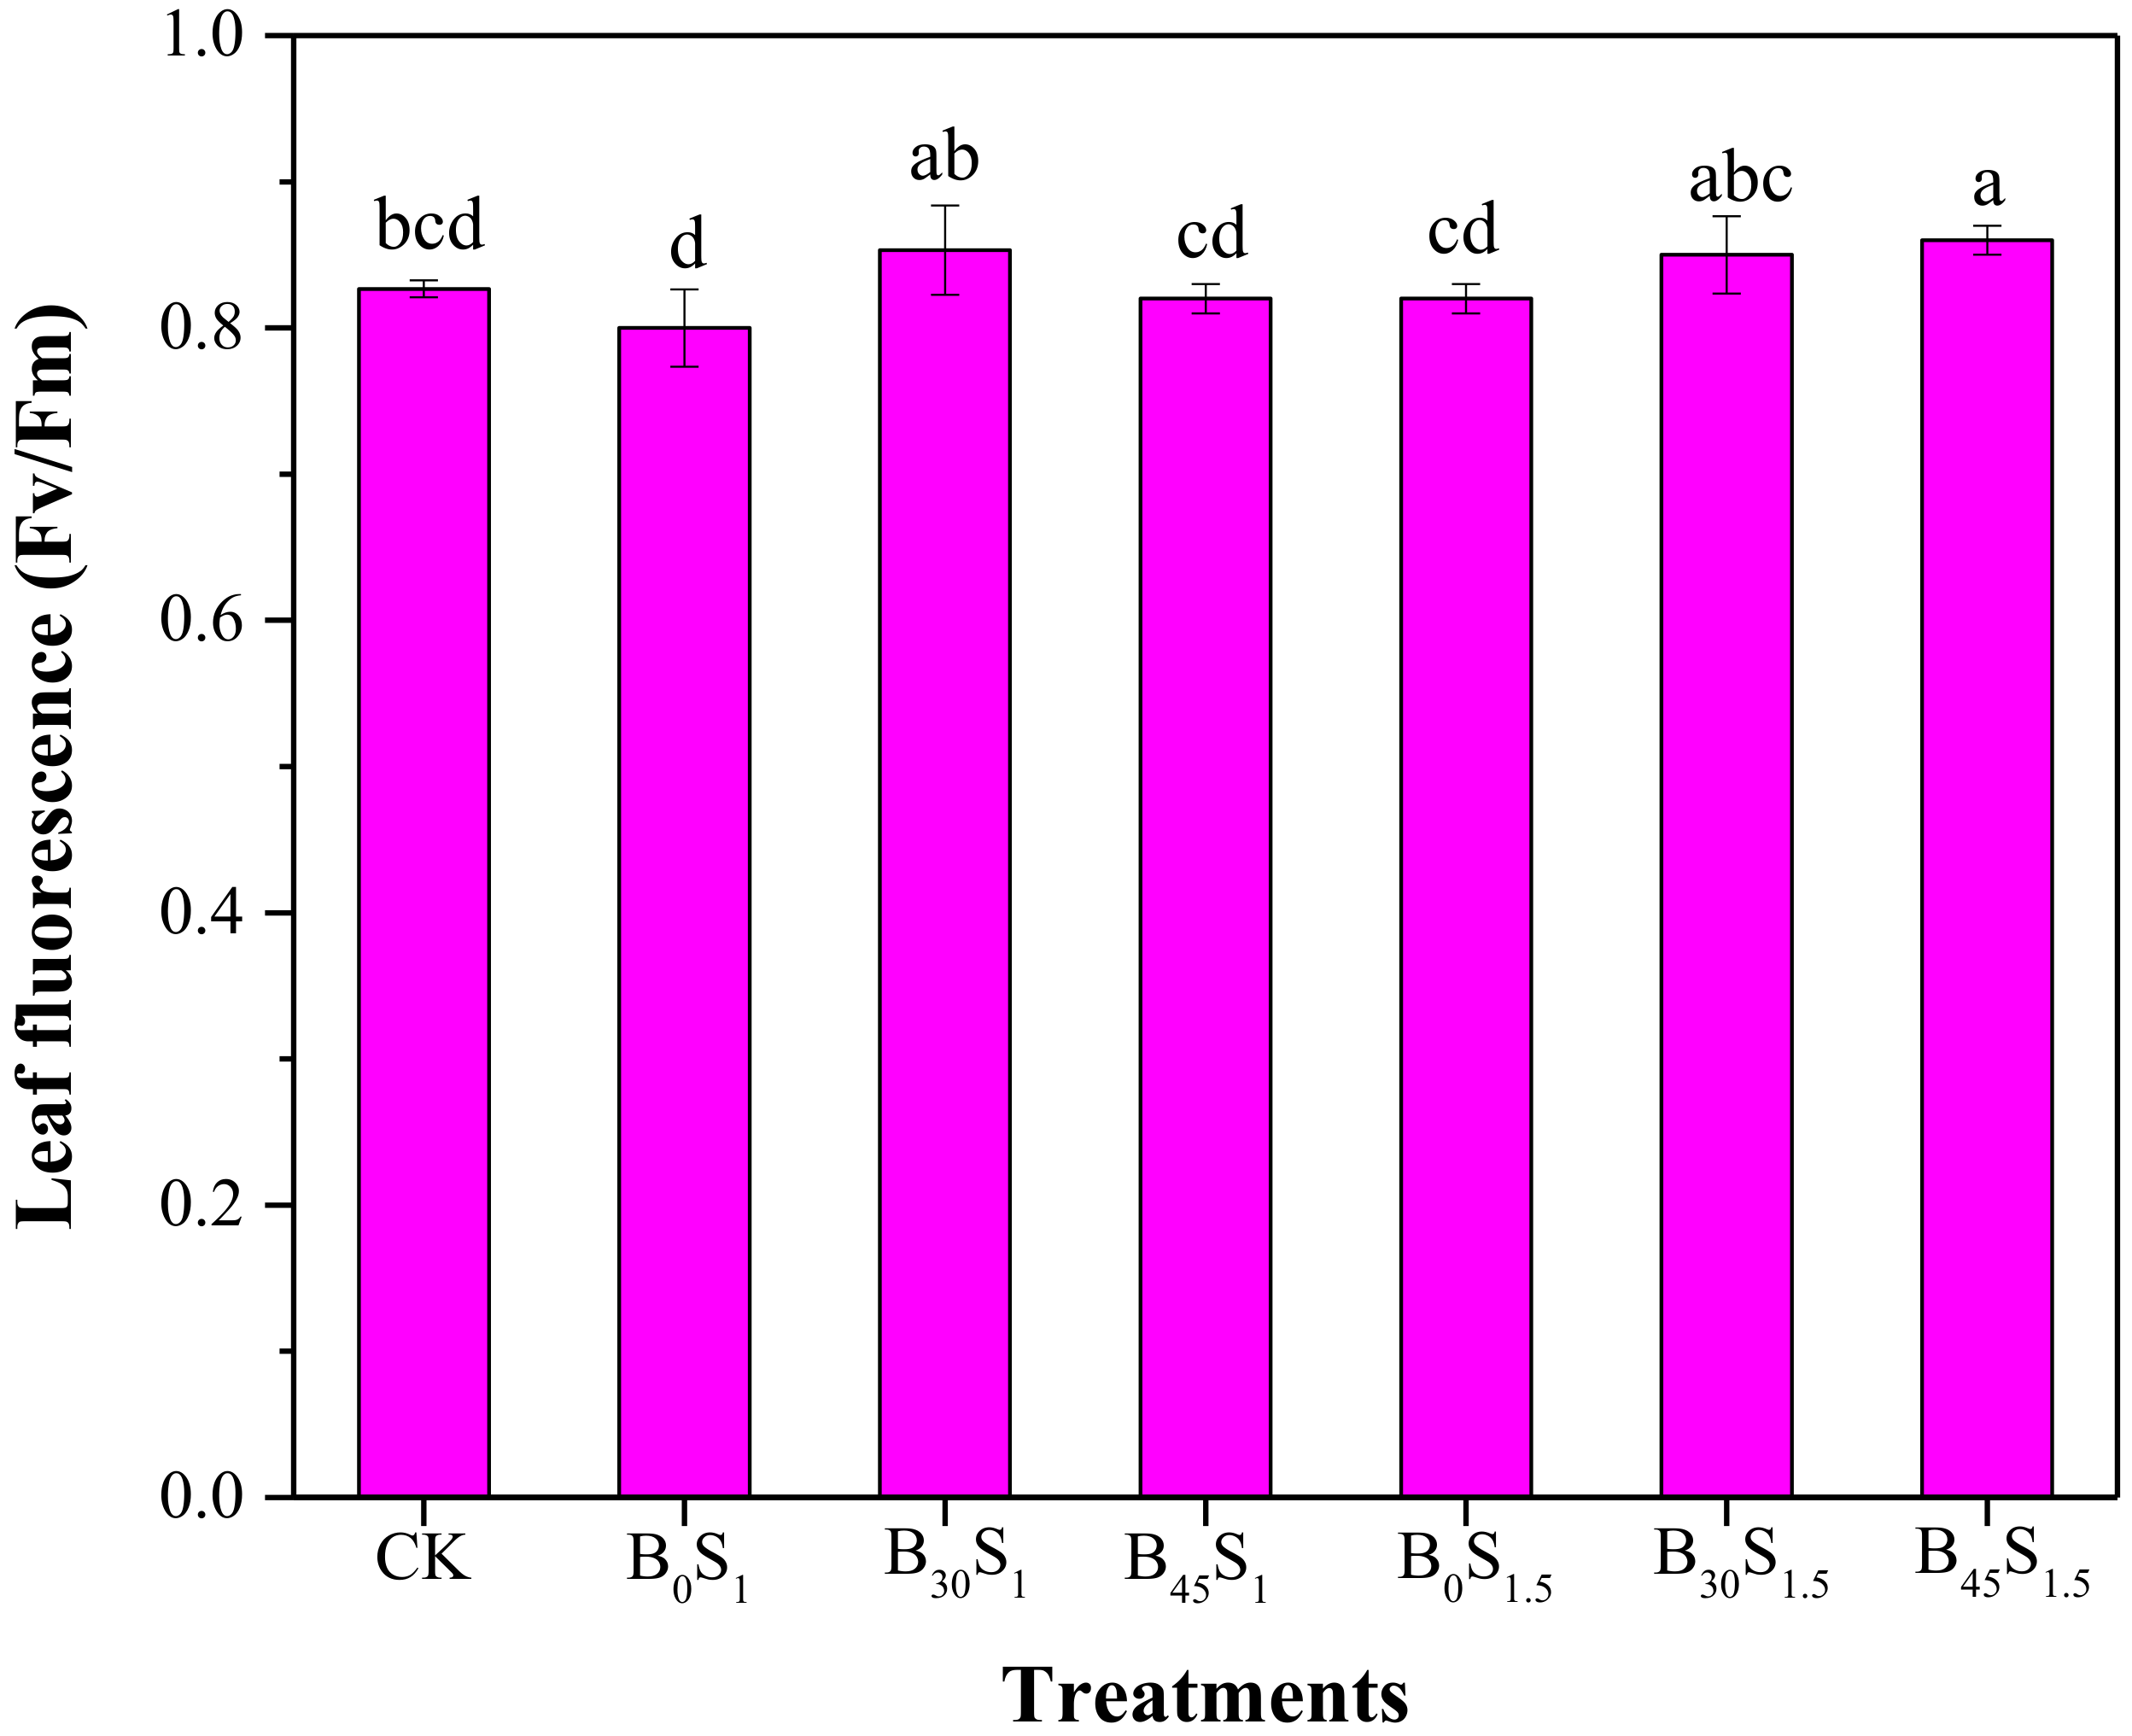
3.2. SPAD Chlorophyll Content and Chlorophyll Fluorescence (Fv/Fm)

Acidic biochar application positively affected SPAD chlorophyll content under salt stress (Figure 6). The maximum SPAD chlorophyll content (42.9) was recorded in CK, while the minimum (27.7) was observed in B0S1. Among biochar and salt-stressed treatments, biochar addition increased chlorophyll content by 36.9 and 4.6% in B45S1 and B45S1.5 compared to B0S1 and B0S1.5.
All the treatments under salt stress showed a significant decrease in chlorophyll fluorescence over CK and biochar treated treatments, as shown in Figure 7. Under B30S1, chlorophyll fluorescence improved by 3.2 and 6.7% over CK and B0S1, respectively. However, B45S1.5 augmented its stimulatory effect by 4.0 and 4.9% as compared to CK and B0S1.5, respectively. However, high levels of biochar under higher salt-stressed plants showed greater chlorophyll fluorescence.

3.3. Effect of Acidic Biochar on Shoot Nutrients Concentration in Maize Seedlings

Application of acidic biochar under salinity levels insignificantly affected nutrients concentration in the shoot of maize seedlings in comparison with CK (Table 2). The highest TN (10.71 mg g−1) concentration was observed in B30S1 among all the treatments. The lowest TN concentration (7.39 mg g−1) was recorded in B0S1.5, where only salt was applied to the plant. Addition of both salt levels had showed insignificant effect on TN concentration of shoot.
Biochar application insignificantly effected the TP concentration in shoot compared to CK (Table 2). Under B45S1 and B45S1.5, TP concentration insignificantly increased by 31.1 and 39.9% compared to CK. Interestingly, the highest TP concentration (2.46 mg g−1) was noted in salt applied treatment (B0S1.5) among all the biochar and non-biochar treated plants. The B0S1 and B0S1.5 showed a significant increase in TP concentration by 102.0 and 149.0% when compared with CK (Table 2).
Data presented in Table 2 showed that the concentration of TK was higher in biochar applied treatments as compared to only salt-treated plants. But control (CK) had shown the highest TK concentration (3.97 mg g−1) in shoots compared to biochar and salt treatments.
The application of acidic biochar decreased the concentration of Na in the shoot of maize seedlings under both salinity levels B0S1 and B0S1.5 compared to CK (Table 2). The 1% salt-treated plants (B0S1) showed the highest concentration of Na in shoots (14.07 mg g−1) among all the treatments. The B45S1 and B45S1.5 biochar treated plants showed that Na concentration significantly decreased compared to B0S1.

3.4. Effect of Acidic Biochar on Root Nutrients Concentration in Maize Seedlings

Data of nutrients concentration (NPK and Na) in the root of maize seedlings with biochar and salt amendment is presented in Table 3. The maize seedlings accumulated more nutrients concentration in its roots than shoots. The highest concentration of TN (33.62 mg g−1) was observed in B0S1, where only salt (1%) was applied.
Both the biochar treatments significantly increased total phosphorus (TP) concentration in root under salinity conditions. The concentration of TP in roots was increased by 35.6 and 42.0% in B45S1 B45S1.5, respectively, as compared to CK. Under the highest level of biochar (B45S1) treatment, the TP concentration in root was significantly decreased when compared to the salt-applied plant. Impressively, TP concentration increased by 31.3% in B45S1.5, respectively, as compared to B0S1.5 (Table 3).
The concentration of TK in the roots of maize seedlings insignificantly increased by 10.6 and 7.0%, and 6.5 and 25.2% in B45S1 and B45S1.5 respectively, when compared with CK, and salt treated plants respectively (Table 3).
Results revealed that Na concentration in root was significantly decreased by the addition of biochar under salt stress (Table 3). The concentration of Na in root decreased by 42.3 and 65.6% and 60.1 and 58.1% under B45S1 and B45S1.5, respectively, as compared to CK and B0S1 and B0S1.5.

3.5. Effect of Biochar on Soil Properties after Harvest (0–20 cm)

Biochar addition had an insignificant effect on soil EC, TK, and Na under salt stress at 0–20 cm depth. Acidic biochar addition decreased soil pH and EC, while it significantly increased TN and TP (Table 4). In treatment B45S1 (45 g kg−1 biochar + 1% salt), the soil pH and EC decreased by 7.7 and 10.2% and by 25.2 and 32.8% as compared to CK and B0S1, respectively. In B45S1.5 (45 g kg−1 biochar + 1.5% salt), a similar trend was noticed that the soil pH and EC decreased by 7.6 and 7.8%; 25.3 and 13.7%, compared with CK and B0S1.5, respectively. Biochar addition to soil significantly increased soil TN as compared to CK and salt-treated soils (Table 4). The soil treated with 45 g kg−1 biochar + 1% salt showed that TN in soil increased by 27.0 and 16.8% over CK and B0S1, respectively. Similar results were found for B45S1.5, it significantly enhanced soil TN 28.6% and 47.3% when compared to CK and B0S1.5, respectively. The data in Table 4 showed that soil, which received maximum biochar in the pots increased TP concentration in soil when compared to non-biochar treated pots. The pots treated with 45 g kg−1 biochar + 1% salt (B45S1) accumulated 2.3 and 1.0 times greater soil TP as compared to CK and B0S1, respectively. The same trend was recorded in B45S1.5. It increased soil TP 2.5 and 2.5 times as compared to CK and B0S1.5, respectively.

3.6. Relationship between Plant Growth Parameters, and Shoot and Root Na Content

Acidic biochar treatment under salt stress has improved plant growth parameters and decreased shoot and root Na content. Pearson correlations between seedling growth parameters and shoot and root Na concentration are shown in Table 5. High significant positive relationships were observed between plant growth parameters. On the other hand, except for the number of leaves (NL), plant growth parameters significantly negatively correlated with the shoot and root Na content.

4. Discussion

4.1. Effect of Biochar on Growth Attributes of Maize Seedlings

Plants are affected by a number of abiotic stresses but salinity is a more critical hindrance for sustainable agriculture, especially at the seed emergence and seedling stage. The seedling stage is amongst the most important stage of any crop, which is an indicator of a crop to tolerate abiotic stress. The results of the present study revealed that salinity stress not only negatively affected the growth parameters (plant height, number of leaves, leaf area, shoot fresh- and dry-weight and root fresh- and dry-weight) at the seedling stage of maize but also deteriorated soil properties (Figure 1, Figure 2, Figure 3, Figure 4 and Figure 5). The addition of acidic biochar mitigated the salinity stress and improved plant height, the number of leaves, leaf area, shoot fresh- and dry-weight, and root fresh- and dry-weight. When plants were subjected to 1 and 1.5% salt stress, the biochar applied at 30 and 45 g kg−1 caused a positive influence on growth attributes, SPAD chlorophyll, leaf fluorescence, and nutrients concentration in above and below ground (shoot and root) parts of maize seedlings. Several studies have reported similar findings in maize, sorghum, and wheat crops [29,52,53,54]. The reduction in growth attributes may be caused by the toxic influence of Na+ as well as lowering the water potential for the growth media, thereby causing a reduction in water uptake and nutrients concentration. Salt stress may reduce the vigor index of maize seedlings [53]. These results correlate with Lashari et al. and Akhtar et al. [16,29]. Amendment of acidic biochar had shown its effectiveness in alleviating salt stress. Due to large surface area, cation exchange capacity, high porosity, enriched with nutrients, and useful absorptive features of biochar [16,29,30,54]. The adsorptive features of biochar could reduce the uptake of Na or transport to the upper parts of the plants. The positive impact of biochar on growth is in agreement with Ibrahim et al. [54], who investigated in their pot experiment that 4% biochar application improved sorghum germination, shoot length, shoot dry weight, root length, and root dry weight under high salinity stress (3 g NaCl kg−1 dry soil). Similar results were observed by Kanwal et al. [55] in a pot experiment for wheat. They reported that biochar mitigated the negative effect of NaCl on all growth attributed under saline conditions. Akhtar et al. [30] also reported in their experiment on residual effect of biochar for promoting growth of plant and mitigating salinity stress.

4.2. Effect of Biochar on Nutrients Concentration in Shoot

Nitrogen and phosphorus are the elements which are required by the plant in a great quantity for several functions. Synthetic fertilizers are not only costly but also unfriendly to the environment reported in various studies [56,57,58]. For this reason, biochar is in a great concentration of the researchers, by utilizing it, higher production can be achieved with a friendly environment. In our pot experiment, biochar addition to the soil increased TN and TP in the above-ground part of seedlings (shoot) as compared to control, and highly salt-stressed plants. The increase in TN and TP uptake might be due to high CEC of biochar and a higher concentration of TN and TP in biochar than soil. Biochar has great potential to retain more N in the soil, which can easily be taken up by plants’ root hair [59]. The increased N in plant parts is might be due to the enhanced level of leaf chlorophyll [30]. Kanwal et al. [55] and Sarfaraz et al. [60] also reported an improved N uptake by plants, grown in biochar amended soils under saline conditions. A considerable increase in N concentration was noticed across all the biochar-treated plants under salt stress. Phosphorus is the second key element that plays various significant roles in plant nutrition and development. It is very interesting to note that the P supply from biochar was greatly lower in biochar treated than in only salt-treated plants. It was observed that P uptake by plants was significantly influenced by biochar under saline conditions. The results indicated that plants treated with biochar showed lower TP concentration in the shoots of maize seedlings. The possible reason for the low concentration of TP might be the slow release and insolubility of P in such a short period of time. The high salt concentration and high pH of soils in pots can also be the reasons for P uptake. Phosphorus availability to plants is very slow and most of the part of P remains fixed in the soil [61]. The plant-available P was very observed low in Suaeda salsa plant in saline-sodic soils because of a negative interaction that occurred upon addition of biochar and P fertilization [62]. The P availability is highly pH-dependent. The release of P from biochar, P fertilization, and their combination would determine P availability for plant growth [62]. In our study is was noticed that the P supply from biochar was greatly lower in biochar treated than in only salt-treated plants. Potassium is among the macronutrients which is taken up by plants in large quantity. Potassium plays a significant and multifunction role in the early growth of plant. The effect of salinity on the concentration of TK in the shoot is clearly mentioned. Moreover, TK uptake was significantly increased under the treatments of biochar (45 g kg−1) (Table 2). The highest amount of K in biochar can bring down SAR by decreasing relative salt concentrations and producing more favorable salt compositions on concentrations of soluble salts to alleviate salinity. In such a way, the significantly increased TK indicated the alleviation of salt stress to maize plants under biochar treatments. As high sodium and minimum phosphorus could create specific ion toxicity in plant cells [63]. The high TK uptake by shoot could play a vital role in mitigating salt stress which may damage plant physiology [64].
Dietrich et al. and Bochard et al. [65,66] reported in their pot experiments that biochar addition to soil increased the availability of potassium due to the excessive competition for sorption sites [66]. Lashari et al. [67] observed great improvement of major nutrients (NPK) in wheat and maize grain by the addition of biochar over the control under salt-stressed treatments. Sodium is not an essential element for plant growth but is required to aid in a very small quantity in the metabolism and synthesis of chlorophyll. Excess quantity of Na ion causes soil compaction, which directly deteriorates pore size distribution and results in poor salt leaching, root penetration as well as seed germination [63,68]. The concentration of Na in shoot of maize was significantly decreased (43.8%) (Table 2) by the application of acidic biochar. Biochar particles have the potential to adsorb Na+ ion and do not release to the plants for its uptake [17]. The high CEC results positively in the reduction of Na uptake and application of biochar reduces the negative effects of salt stress by adsorbing Na from soil solution [30,63]. Similar results were obtained by Huang et al. [26] in their greenhouse experiment, who have also reported that biochar reduced the concentration of Na and enhanced K concentration in the sweet corn plant. The findings of the present study are in line with the results of other studies [16,63,69]. These researchers demonstrated that biochar addition could immobilize Na ions from the soil solution by its high sorption capability, thus decreasing Na uptake and aided ionic balance by releasing mineral nutrients, which directly improved the growth of maize seedling under saline conditions.

4.3. Effect of Biochar on Nutrients Concentration in Root

Roots, the first organ to adapt and respond resistively to abiotic stresses in soil (drought and soil), play an important role in regulating plant growth [70,71]. Root architecture, particularly those that can entrench deeper with longer root length in the soil, plays an important role in maximizing the ability of plants to gain soil water and nutrients for plant growth [72]. The results of the present study showed that biochar retained NPK and Na in the root of maize seedlings. It was observed that TK concentration was decreased and Na concentration increased in the root (Table 3). However, Akhtar et al. [30] reported that salt-induced disorder in growth and physiology of the plants could be alleviated by biochar application due to its high adsorption capacity, which might have either led to reduced Na uptake or enhanced Na exclusion or both from the roots. Roots play its key role in the nutrition of a plant. These results are further supported by the study of Qiao-Hong et al. [73], who observed a higher concentration of N, P, and K in roots as compared to shoots of maize plant with biochar addition. Roots are the main entrance of nutrients transfer to upward parts of the plants. Salinity decreased the transport of nutrients towards the above parts of maize seedling and accumulated a greater quantity of nutrients in the root. A similar trend was observed in biochar treated plants. However, the addition of biochar basically contributes to the cation exchange capacity of soil [74]. The increased K concentration with biochar application might be directly related to its higher K content, thereby reducing Na uptake, and this could be another advantage of using biochar in reducing Na uptake in addition to its high Na adsorption potential [75]. Another reason for the high TK concentration in roots is due to the local salt, which contained a high quantity of exchangeable K. Interestingly, the higher concentration of all nutrients was observed in the roots of maize seedlings as compared to shoots.

4.4. Effect of Biochar on Soil Properties

Soil degradation through salinization and sodication is the scourge of intensive agriculture and a major environmental threat, caused by an increasing degree of temperature, low precipitation in arid and semi-arid ecological regions of the world. Soil salinity degrades soil properties by accumulation and adsorption of sodium (Na) salts on clay particles, it degrades and disturbs the pore structure of surface soil along with it creates a problem of soil permeability due to the predominance of sodium salts [67]. Overall, it can be observed that soil properties (pH, EC, N, P and K) improved by the addition of acidic biochar (Table 4). Soil pH was significantly low in the pots where maximum biochar was added. The reason for the improvement in the soil pH is due to the acidic nature of biochar. In contrast, the adsorptive properties of biochar resulted in low EC of the soil. The Na was adsorbed by the soil particles in high quantity with the application of acidic biochar. The high concentration of elements in biochar resulted in enhanced nutrient concentration in the soil. The findings are further supported by the research studies of [20,29,30,76], who observed the improved soil properties with the addition of different types of biochars.

5. Conclusions

Our study showed that the use of acidic biochar may offer an efficient technique for alleviating the adverse effect of salt in the root zone. The improvement of the agronomic growth of maize seedling and nutrients contents in above and below-ground parts (shoot and root) was observed in B45S1 and B45S1.5. The SPAD chlorophyll and leaf fluorescence were increased by the addition of acidic biochar. The nutrients content of the soil was also improved by the addition of acidic biochar under salt stress. Based on our results, acidic biochar could be the best organic amendment to act as a soil nutrient source to improve maize seedling growth, plant nutrients, and soil properties under saline conditions. Therefore, future studies should investigate the effects of acidic biochar on maize seedling molecular characteristics in order to understand the deeper benefits of acidic biochar on maize seedling under saline conditions. However, our result shed new light on the important role of acidic biochar in improving maize seedlings’ physiological characteristics under saline conditions.

Author Contributions

Conceptualization, J.S. and G.Y.; data curation, M.K.S. (Mukesh Kumar Soothar) and A.K.M.H.; formal analysis, M.K.S. (Mukesh Kumar Soothar) and A.K.M.H. funding acquisition, J.S. and G.Y.; investigation, G.Y.; methodology, A.K.M.H., J.S., and G.Y.; project administration, J.S. and G.Y.; software, M.K.S. (Mahendar Kumar Sootehar), S.M.B., and A.T.; supervision, G.Y.; writing—original draft, M.K.S. (Mukesh Kumar Soothar), A.K.M.H., and S.M.B.; writing—review and editing, G.Y. All authors have read and agreed to the published version of the manuscript.

Funding

This research was supported by the National Natural Science Foundation of China (No. 51790534), and the China Agricultural Research System (CARS-15-13).

Data Availability Statement

Some or all data that support the finding of this study are available from the corresponding author upon reasonable request.

Acknowledgments

I would like to thank my laboratory colleagues, especially Fu Yuanyuan and Yang Jing. I would also like to thank Yingying Zhang, the manager of the Key Laboratory of Crop Water Use and Regulation, the Ministry of Agriculture and Rural Affairs, Xinxiang, Henan, and the China Scholarship Council (CSC).

Conflicts of Interest

The authors declare that they have no conflict of interest.

References

  1. Ahmed, R.; Howlader, M.H.K.; Shila, A.; Haque, M.A. Effect of salinity on germination and early seedling growth of maize. Progress. Agric. 2017, 28, 18–25. [Google Scholar] [CrossRef] [Green Version]
  2. Grattan, S.R.; Grieve, C.M. Salinity-mineral nutrient relations in horticultural crops. Sci. Hortic. 1999, 58, 127–157. [Google Scholar] [CrossRef]
  3. Munns, R. Comparative physiology of salt and water stress. Plant Cell Environ. 2002, 25, 239–250. [Google Scholar] [CrossRef] [PubMed]
  4. Ambede, J.G.; Netondo, G.W.; Mwai, G.N.; Musyimi, D.M. NaCl salinity affects germination, growth, physiology, and biochemistry of Bambara groundnut. Braz. J. Plant Physiol. 2012, 24, 151–160. [Google Scholar] [CrossRef] [Green Version]
  5. Abreu, I.A.; Farinha, A.P.; Negrão, S.; Gonçalves, N.; oFnseca, C.; Rodrigues, M. Coping with abiotic stress: Proteome changes for crop improvement. J. Proteom. 2013, 93, 145–168. [Google Scholar] [CrossRef]
  6. Saleh, B. Effect of salt stress on growth and chlorophyll content of some cultivated cotton varieties grown in Syria. Commun. Soil Sci. Plant Anal. 2012, 43, 1976–1983. [Google Scholar] [CrossRef]
  7. Bose, S.; Fakir, O.A.; Alam, M.K.; Hossain, A.Z.; Hossain, A.; Mymensingh, B.; Rashid, M.H. Effects of salinity on seedling growth of four maize (Zea mays L.) cultivars under hydroponics. J. Agric. Stud. 2018, 6, 56–69. [Google Scholar]
  8. Adnan, M.; Fahad, S.; Zamin, M.; Shah, S.; Mian, I.A.; Danish, S.; Zafar-ul-Hye, M.; Battaglia, M.L.; Naz, R.M.M.; Saeed, B.; et al. Coupling phosphate-solubilizing bacteria with phosphorus supplements improve maize phosphorus acquisition and growth under lime induced salinity stress. Plants 2020, 9, 900. [Google Scholar] [CrossRef]
  9. Yuan, C.; Feng, S.; Wang, J.; Huo, Z.; Ji, Q. Effects of irrigation water salinity on soil salt content distribution, soil physical properties and water use efficiency of maize for seed production in arid Northwest China. Int. J. Agric. Biol. Eng. 2018, 11, 137–145. [Google Scholar] [CrossRef] [Green Version]
  10. Wei, C.; Li, F.; Yang, P.; Ren, S.; Wang, S.; Wang, Y.; Zhang, Y. Effects of irrigation water salinity on soil properties, N2O emission and yield of spring maize under mulched drip irrigation. Water 2019, 11, 1548. [Google Scholar] [CrossRef] [Green Version]
  11. Zhang, W.W.; Chong, W.A.N.G.; Rui, X.U.E.; Wang, L.J. Effects of salinity on the soil microbial community and soil fertility. J. Integr. Agric. 2019, 18, 1360–1368. [Google Scholar] [CrossRef]
  12. Fu, J.; Liu, Z.; Li, Z.; Wang, Y.; Yang, K. Alleviation of the effects of saline-alkaline stress on maize seedlings by regulation of active oxygen metabolism by Trichoderma asperellum. PLoS ONE 2017, 12, e0179617. [Google Scholar] [CrossRef] [PubMed] [Green Version]
  13. Amini, S.; Ghadiri, H.; Chen, C.; Marschner, P. Salt-affected soils, reclamation, carbon dynamics, and biochar: A review. J Soils Sed. 2016, 16, 939–953. [Google Scholar] [CrossRef]
  14. Wichern, F.; Islam, M.; Hemkemeyer, M.; Watson, C.; Joergensen, R.G. Organic amendments alleviate salinity effects on soil microorganisms and mineralisation processes in aerobic and anaerobic paddy rice soils. Front. Sustain. Food Syst. 2020, 4, 30. [Google Scholar] [CrossRef] [Green Version]
  15. Leogrande, R.; Vitti, C. Use of organic amendments to reclaim saline and sodic soils: A review. Arid Land Res. Manag. 2019, 33, 1–21. [Google Scholar] [CrossRef]
  16. Akhtar, S.S.; Andersen, M.N.; Naveed, M.; Zahir, Z.A.; Liu, F. Interactive effect of biochar and plant growth-promoting bacterial endophytes on ameliorating salinity stress in maize. Funct. Plant Biol. 2015, 42, 770–781. [Google Scholar] [CrossRef] [PubMed]
  17. Jin, F.; Cheng, R.; Qulaqa, A.; Yangqiu, G.; Liying, G.; Jianbo, L.; Dong, H.; Xianqin, Z.; Xu, L.; Xiwen, S. Effects of biochar on sodium ion accumulation, yield and quality of rice in saline-sodic soil of the west of Songnenplain, northeast China. Plant Soil Environ. 2018, 64, 612–618. [Google Scholar] [CrossRef] [Green Version]
  18. Joseph, S.; Lehmann, J. Biochar for Environmental Management Science and Technology; Earth Scan: London, UK, 2009; pp. 1–12. [Google Scholar]
  19. Mishra, A.; Shinogi, Y. Effects of biochar on soil physico-chemical properties. In Proceedings of the International Exchange and Innovation Conference on Engineering and Sciences, Fukuoka, Japan, 18–19 October 2018; Volume 4, pp. 102–105. [Google Scholar]
  20. Sial, T.A.; Khan, M.N.; Lan, Z.; Kumbhar, F.; Ying, Z.; Zhang, J.; Li, X. Contrasting effects of banana peels waste and its biochar on greenhouse gas emissions and soil biochemical properties. Process Saf. Environ. Prot. 2019, 122, 366–377. [Google Scholar] [CrossRef]
  21. Gul, S.; Whalen, J.K.; Thomas, B.W.; Sachdeva, V.; Deng, H. Physico-chemical properties and microbial responses in biochar-amended soils: Mechanisms and future directions. Agric. Ecosys Environ. 2015, 206, 46–59. [Google Scholar] [CrossRef]
  22. Głąb, T.; Palmowska, J.; Zaleski, T.; Gondek, K. Effect of biochar application on soil hydrological properties and physical quality of sandy soil. Geoderma 2016, 281, 11–20. [Google Scholar] [CrossRef]
  23. Adekiya, A.O.; Agbede, T.M.; Aboyeji, C.M.; Dunsin, O.; Simeon, V.T. Effects of biochar and poultry manure on soil characteristics and the yield of radish. Sci. Hortic. 2019, 243, 457–463. [Google Scholar] [CrossRef] [Green Version]
  24. Piash, M.I.; Hossain, M.F.; Parveen, Z. Effect of biochar and fertilizer application on the growth and nutrient accumulation of rice and vegetables in two contrast soils. Acta Sci. Agric. 2019, 3, 74–83. [Google Scholar]
  25. Duarte, S.J.; Glaser, B.; Cerri, C.E.P. Effect of biochar particle size on physical, hydrological and chemical properties of loamy and sandy tropical soils. Agronomy 2019, 9, 165. [Google Scholar] [CrossRef] [Green Version]
  26. Huang, M.; Zhang, Z.; Zhu, C.; Zhai, Y.; Lu, P. Effect of biochar on sweet corn and soil salinity under conjunctive irrigation with brackish water in coastal saline soil. Sci. Hortic. 2019, 250, 405–413. [Google Scholar] [CrossRef]
  27. Younis, U.; Athar, M.; Malik, S.A.; Shah, M.H.R.; Mahmood, S. Biochar impact on physiological and biochemical attributes of spinach (Spinacia oleracea L.) in nickel contaminated soil. Glob. J Environ. Sci. Manag. 2015, 1, 245–254. [Google Scholar]
  28. Agbna, G.H.D.; Dongli, S.; Zhipeng, L.; Elshaikh, N.A.; Guangcheng, S.; Timm, L.C. Effects of deficit irrigation and biochar addition on the growth, yield, and quality of tomato. Sci. Hortic. 2017, 222, 90–101. [Google Scholar] [CrossRef]
  29. Lashari, M.S.; Liu, Y.; Li, L.; Pan, W.; Fu, J.; Pan, G.; Zheng, J.; Zheng, J.; Zhang, X.; Yu, X. Effects of amendment of biochar-manure compost in conjunction with pyroligneous solution on soil quality and wheat yield of a salt-stressed cropland from Central China Great Plain. Field Crop. Res. 2013, 144, 113–118. [Google Scholar] [CrossRef]
  30. Akhtar, S.S.; Andersen, M.N.; Liu, F. Residual effects of biochar on improving growth, physiology and yield of wheat under salt stress. Agric. Water Manag. 2015, 158, 61–68. [Google Scholar] [CrossRef]
  31. Rafiq, M.K.; Bachmann, R.T.; Rafiq, M.T.; Shang, Z.; Joseph, S.; Long, R. Influence of pyrolysis temperature on physico-chemical properties of corn stover (Zea mays L.) biochar and feasibility for carbon capture and energy balance. PLoS ONE 2016, 11, e0156894. [Google Scholar] [CrossRef] [Green Version]
  32. Zhao, S.X.; Ta, N.; Wang, X.D. Effect of temperature on the structural and physicochemical properties of biochar with apple tree branches as feedstock material. Energies 2017, 10, 1293. [Google Scholar] [CrossRef] [Green Version]
  33. Chan, K.Y.; Xu, Z. Biochar: Nutrient properties and their enhancement. Biochar Environ. Manag. Sci. Technol. 2009, 1, 67–84. [Google Scholar]
  34. Zhang, J.; Liu, J.; Liu, R. Effects of pyrolysis temperature and heating time on biochar obtained from the pyrolysis of straw and lignosulfonate. Bioresour. Technol. 2015, 176, 288–291. [Google Scholar] [CrossRef] [PubMed]
  35. Elnour, A.Y.; Alghyamah, A.A.; Shaikh, H.M.; Poulose, A.M.; Al-Zahrani, S.M.; Anis, A.; Al-Wabel, M.I. Effect of pyrolysis temperature on biochar microstructural evolution, physicochemical characteristics, and its influence on biochar/polypropylene composites. Appl. Sci. 2019, 9, 1149. [Google Scholar] [CrossRef] [Green Version]
  36. Trupiano, D.; Cocozza, C.; Baronti, S.; Amendola, C.; Vaccari, F.P.; Lustrato, G.; Scippa, G.S. The effects of biochar and its combination with compost on lettuce (Lactuca sativa L.) growth, soil properties, and soil microbial activity and abundance. Int. J. Agron. 2017, 2017, 3158207. [Google Scholar] [CrossRef] [Green Version]
  37. Xiao, L.; Fande, M. Evaluating the effect of biochar on salt leaching and nutrient retention of Yellow River Delta soil. Soil Use Manag. 2020, 36, 740–750. [Google Scholar] [CrossRef]
  38. Fernandes, J.D.; Chaves, L.H.; Mendes, J.S.; Chaves, I.B.; Tito, G.A. Alterations in soil salinity with the use of different biochar doses. Rev. de Cienc. Agrar. 2018, 42, 89–98. [Google Scholar]
  39. Gonzaga, M.I.S.; Mackowiak, C.; Almeida, A.Q.; Junior, J.I.T.C.; Andrade, K.R. Positive and negative effects of biochar from coconut husks, orange bagasse and pine wood chips on maize (Zea mays L.) growth and nutrition. Catena 2018, 162, 414–420. [Google Scholar] [CrossRef]
  40. Deenik, J.L.; Uehara, T.M.G.; Antal, M.J., Jr.; Campbell, S. Charcoal volatile matter content influences plant growth and soil nitrogen transformations. Soil Sci. Soc. Am. J. 2010, 74, 1259–1270. [Google Scholar] [CrossRef]
  41. Hol, W.H.G.; Vestergard, M.; Hooven, F.; Duyts, H.; Voorde, T.F.J.; Bezemer, T.M. Transient negative biochar effects on plant growth are strongest after microbial species loss. Soil Biol. Biochem. 2017, 115, 442–451. [Google Scholar] [CrossRef]
  42. Qi, F.; Dong, Z.; Lamb, D.; Naidu, R.; Bolan, N.S.; Ok, Y.S.; Liu, C.; Khan, N.; Johir, M.A.H.; Semple, K.T. Effect of acidic and neutral biochars on properties and cadmium retention of soils. Chemosphere 2017, 180, 564–573. [Google Scholar] [CrossRef] [Green Version]
  43. Bouyoucos, G.J. Hydrometer method improved for making particle size analyses of soils. Agron. J. 1962, 54, 464–465. [Google Scholar] [CrossRef]
  44. Rayment, G.E.; Higginson, F.R. Australian Laboratory Handbook of Soil and Water Chemical Methods; Inkata Press Pty Ltd.: Melbourne, Australia, 1992. [Google Scholar]
  45. Dai, Z.; Meng, J.; Muhammad, N.; Liu, X.; Wang, H.; He, Y.; Xu, J. The potential feasibility for soil improvement, based on the properties of biochars pyrolyzed from different feedstocks. J. Soils Sediments 2013, 13, 989–1000. [Google Scholar] [CrossRef]
  46. Thomas, G.W. Exchangeable cations. Methods Soil Anal. Chem. Microbiol. Prop. 1983, 9, 159–165. [Google Scholar]
  47. Gao, H.; Mao, H.; Zhang, X. Determination of lettuce nitrogen content using spectroscopy with efficient wavelength selection and extreme learning machine. Zemdirb. Agric. 2015, 102, 51–58. [Google Scholar] [CrossRef] [Green Version]
  48. Hoagland, D.R.; Arnon, D.I. The water-culture method for growing plants without soil. Circ. Calif. Agric. Exp. Stn. 1950, 347. [Google Scholar]
  49. Kader, M.H.A.; Wang, G.; Soothar, M.K.; Shen, X.; Gao, Y.; Qiu, R.; Mehmood, F. Responses of leaf gas exchange attributes, photosynthetic pigments and antioxidant enzymes in NaCl-stressed cotton (Gossypium hirsutum L.) seedlings to exogenous glycine betaine and salicylic acid. BMC Plant Biol. 2020, 1–14. [Google Scholar]
  50. Abideen, Z.; Koyro, H.W.; Huchzermeyer, B.; Ansari, R.; Zulfiqar, F.; Gul, B. Ameliorating effects of biochar on photosynthetic efficiency and antioxidant defense of Phragmites karka under drought stress. Plant Biol. 2019, 22, 259–266. [Google Scholar] [CrossRef]
  51. Tanure, M.M.C.; da Costa, L.M.; Huiz, H.A.; Fernandes, R.B.A.; Cecon, P.R.; Junior, J.D.P.; da Luz, J.M.R. Soil water retention, physiological characteristics, and growth of maize plants in response to biochar application to soil. Soil Tillage Res. 2019, 192, 164–173. [Google Scholar] [CrossRef]
  52. Agami, R.A. Alleviating the adverse effects of NaCl stress in maize seedlings by pretreating seeds with salicylic acid and 24-epibrassinolide. S. Afr. J Bot. 2013, 88, 171–177. [Google Scholar] [CrossRef] [Green Version]
  53. Riffat, A.; Ahmed, M.S.A. Amelioration of adverse effects of salt stress on maize (Zea mays l.) cultivars by exogenous application of sulfur at seedling stage. Pak. J Bot. 2016, 48, 1323–1334. [Google Scholar]
  54. Ibrahim, M.H.; Adam, Y.A.A.; Aboagla, M.I.E.; Guisheng, Z.; Nimir, E.A.N.; Irshad, A.; Eltyeb, S.M.S.; Safiya, B.M.E.; Ebtehal, G.I.S. Biochar improved sorghum germination and seedling growth under salinity stress. Agron. J. 2020, 112, 911–920. [Google Scholar] [CrossRef]
  55. Kanwal, S.; Ilyas, N.; Shabir, S.; Saeed, M.; Gul, R.; Zahoor, M.; Mazhar, R. Application of biochar in mitigation of negative effects of salinity stress in wheat (Triticum aestivum L.). J. Plant Nut 2017, 41, 526–538. [Google Scholar] [CrossRef]
  56. Omidire, N.S.; Shange, R.; Khan, V.; Bean, R.; Bean, J. Assessing the impacts of inorganic and organic fertilizer on crop performance under a microirrigation-plastic mulch regime. Prof. Agric. Workers J. 2015, 3. [Google Scholar] [CrossRef]
  57. Sharma, A.; Chetani, R. A review on the effect of organic and chemical fertilizers on plants. Int. J. Res. Appl. Sci. Eng. Technol. 2017, 5, 677–680. [Google Scholar] [CrossRef]
  58. Chandini, K.R.; Kumar, R.; Prakash, O. The Impact of chemical fertilizers on our environment and ecosystem. Res. Trends Environ. Sci. 2019, 69–86. [Google Scholar]
  59. Sohi, S.P.; Krull, E.; Lopez-Capel, E.; Bol, R. A review of biochar and its use and function in soil. Adv. Agron. 2010, 105, 47–82. [Google Scholar]
  60. Sarfraz, R.; Awais, S.; Muhammad, A.; Ammara, A.; Azhar, H.; Shihe, X. Impact of integrated application of biochar and nitrogen fertilizers on maize growth and nitrogen recovery in alkaline calcareous soil. Soil Sci. Plant Nut. 2017, 63, 488–498. [Google Scholar] [CrossRef]
  61. Brady, N.C.; Weil, R. Nature and Properties of Soils, the: Pearson New International Edition; Pearson Higher Ed.: London, UK, 2013. [Google Scholar]
  62. Xu, G.; Zhang, Y.; Sun, J.; Shao, H. Negative interactive effects between biochar and phosphorus fertilization on phosphorus availability and plant yield in saline sodic soil. Sci. Total Environ. 2016, 568, 910–915. [Google Scholar] [CrossRef]
  63. Lashari, M.S.; Ye, Y.; Ji, H.; Li, L.; Kibue, G.W.; Lu, H.; Pan, G. Biochar–manure compost in conjunction with pyroligneous solution alleviated salt stress and improved leaf bioactivity of maize in a saline soil from central China: A 2-year field experiment. J. Sci. Food Agric. 2014, 95, 1321–1327. [Google Scholar] [CrossRef] [PubMed]
  64. Naheed, G.; Shahbaz, M.; Latif, A.; Rha, E.S. Alleviation of the adverse effects of salt stress on rice (Oryza sativa L.) by phosphorus applied through rooting medium: Growth and gas exchange characteristics. Pak. J Bot. 2007, 39, 729–737. [Google Scholar]
  65. Dietrich, C.C.; Rahaman, M.A.; Robles-Aguilar, A.A.; Latif, S.; Intani, K.; Müller, J.; Jablonowski, N.D. Nutrient loaded biochar doubled biomass production in Juvenile maize plants (Zea mays L.). Agronomy 2020, 10, 567. [Google Scholar] [CrossRef] [Green Version]
  66. Borchard, N.; Siemens, J.; Ladd, B.; Möller, A.; Amelung, W. Application of biochars to sandy and silty soil failed to increase maize yield under common agricultural practice. Soil Tillage Res. 2014, 144, 184–194. [Google Scholar] [CrossRef]
  67. Lashari, M.S.; Bakht-un-Nisa Mangan, I.R.; Ji, H.; Pan, G.; Lashari, A.A.; Nan, J. Improvement of Soil Fertility and Crop Yield through Biochar Amendment from Salt Affected Soil of Central China. J. Agric. Sci. Technol. 2018, 8, 209. [Google Scholar]
  68. Troeh, F.R.; Thompson, L.M. Soils and Soil Fertility; Blackwell: New York, NY, USA, 2005; Volume 489. [Google Scholar]
  69. Haider, G.; Diedrich, S.; Gerald, M.; Christoph, M.; Claudia, I.K. Biochar reduced nitrate leaching and improved soil moisture content without yield improvements in a four-year field study. Agric. Ecosyst. Environ. 2017, 237, 80–94. [Google Scholar] [CrossRef]
  70. Fenta, B.A.; Beebe, S.E.; Kunert, K.J.; Burridge, J.D.; Barlow, K.M.; Lynch, J.P.; Foyer, C.H. Field phenotyping of soybean roots for drought stress tolerance. Agronomy 2014, 4, 418–435. [Google Scholar] [CrossRef] [Green Version]
  71. West, G.; Inzé, D.; Beemster, G.T. Cell cycle modulation in the response of the primary root of Arabidopsis to salt stress. Plant Physiol. 2004, 135, 1050–1058. [Google Scholar] [CrossRef]
  72. Robbins, N.E.; Dinneny, J.R. Growth is required for perception of water availability to pattern root branches in plants. Proc. Natl. Acad. Sci. USA 2018, 115, 822–831. [Google Scholar] [CrossRef] [PubMed] [Green Version]
  73. Qiao-Hong, Z.H.U.; Xin-Hua, P.E.N.G.; Huang, T.Q.; Zu-Bin, X.I.E.; Holden, N.M. Effect of biochar addition on maize growth and nitrogen use efficiency in acidic red soils. Pedosphere 2014, 24, 699–708. [Google Scholar]
  74. Liang, B.; Lehmann, J.; Solomon, D.; Kinyangi, J.; Grossman, J.; O’neill, B.; Neves, E.G. Black carbon increases cation exchange capacity in soils. Soil Sci. Soc. Am. J. 2006, 70, 1719–1730. [Google Scholar] [CrossRef] [Green Version]
  75. Akhtar, S.S.; Andersen, M.N.; Liu, F. Biochar mitigates salinity stress in potato. J. Agron. Crop Sci. 2015, 201, 368–378. [Google Scholar] [CrossRef]
  76. Kizito, S.; Hongzhen, L.; Jiaxin, L.; Hamidou, B.; Renjie, D.; Shobiao, W. Role of nutrient-enriched biochar as a soil amendment during maize growth: Exploring practical alternatives to recycle agricultural residual and to reduce chemical fertilizer demand. Sustainability 2019, 11, 3211. [Google Scholar] [CrossRef] [Green Version]
Figure 1. Effect of acidic biochar and salt stress on plant height of maize seedling. Data are mean ± standard error; different alphabets on top of error bars of mean represent significant differences (p < 0.05); CK = control, B0S1, B30S1, B30S1.5, B0S1.5, B30S1.5, B45S1.5 = 0, 30 and 45 g biochar + 1% and 1.5% salt respectively.
Sustainability 13 03150 g001
Figure 2. Effect of acidic biochar and salt stress on the number of leaves of maize seedling. Data are mean ± standard error; different alphabets on top of error bars of mean represent significant differences (p < 0.05); CK = control, B0S1, B30S1, B30S1.5, B0S1.5, B30S1.5, B45S1.5 = 0, 30 and 45 g biochar + 1 and 1.5% salt respectively.
Sustainability 13 03150 g002
Figure 3. Effect of acidic biochar and salt stress on the number of leaves of maize seedling. Data are mean ± standard error; different alphabets on top of error bars of mean represent significant differences (p < 0.05); CK = control, B0S1, B30S1, B30S1.5, B0S1.5, B30S1.5, B45S1.5 = 0, 30 and 45 g biochar + 1 and 1.5% salt respectively.
Sustainability 13 03150 g003
Figure 4. Effect of acidic biochar and salt stress on the fresh weight (FW) of shoot and root of maize seedling. Data are mean ± standard error; different alphabets on top of error bars of mean represent significant differences (p < 0.05); CK = control, B0S1, B30S1, B30S1.5, B0S1.5, B30S1.5, B45S1.5 = 0, 30 and 45 g biochar + 1 and 1.5% salt respectively.
Sustainability 13 03150 g004
Figure 5. Effect of acidic biochar and salt stress on dry weight (DW) of shoot and root of maize seedling. Data are mean ± standard error; different alphabets on top of error bars of mean represent significant differences (p < 0.05); CK = control, B0S1, B30S1, B30S1.5, B0S1.5, B30S1.5, B45S1.5 = 0, 30 and 45 g biochar + 1 and 1.5% salt respectively.
Sustainability 13 03150 g005
Figure 6. Effect of acidic biochar and salt stress on SPAD chlorophyll of maize seedling. Data are mean ± standard error; different alphabets on top of error bars of mean represent significant differences (p < 0.05); CK = control, B0S1, B30S1, B30S1.5, B0S1.5, B30S1.5, B45S1.5 = 0, 30 and 45 g biochar + 1 and 1.5% salt respectively.
Sustainability 13 03150 g006
Figure 7. Effect of acidic biochar and salt stress on leaf fluorescence of maize seedling. Data are mean ± standard error; different alphabets on top of error bars of mean represent significant differences (p < 0.05); CK = control, B0S1, B30S1, B30S1.5, B0S1.5, B30S1.5, B45S1.5 = 0, 30 and 45 g biochar + 1 and 1.5% salt respectively.
Sustainability 13 03150 g007
Table 1. Physico-chemical properties of soil, wood biochar and salt used in the experiment.
Parameters SoilBiocharSalt
TextureSilty clay loam--
pH8.512.52-
EC dS m−13.31-17
CEC cmol(+) kg−13.8623.7-
Total nitrogen (mg g−1)0.502.8-
Total phosphorus (mg g−1)0.6664.9-
Total potassium (mg g−1)-5.6-
Chloride (g kg−1)0.00710.0370.0
Exchangeable K (g kg−1)--0.02
Exchangeable Na (g kg−1)0.0180.504.46
Exchangeable Ca (g kg−1)50.43-0.04
Exchangeable Mg (g kg−1)18.33-1.94
Table 2. Effect of acidic biochar and salt stress on nutrients concentration in the above-ground part (shoot) of maize seedlings.
Selected Nutrients Concentration in Shoot of Maize Seedlings
TreatmentsTN (mg g−1)TP (mg g−1)TK (mg g−1)Na (mg g−1)
CK9.10 ± 0.67 ab0.99 ± 0.08 b3.97 ± 0.58 a6.85 ± 0.89 c
B0S18.41 ± 0.71 ab1.99 ± 0.16 a 0.93 ± 0.38 b14.07 ± 1.15 a
B30S110.71 ± 1.14 a1.38 ± 0.28 b1.65 ± 0.47 b9.09 ± 1.02 bc
B45S19.45 ± 0.89 ab 1.29 ± 0.21 b1.69 ± 0.17 b7.69 ± 1.39 bc
B0S1.57.39 ± 0.04 b2.46 ± 0.32 a0.71 ± 0.25 b10.13 ± 0.44 b
B30S1.59.22 ± 0.65 ab0.97 ± 0.14 b1.19 ± 0.59 b8.78 ± 0.79 bc
B45S1.58.68 ± 0.94 ab1.38 ± 0.09 b1.74 ± 0.40 b7.10 ± 1.21 bc
Data are presented as mean ± SE (n = 3); different alphabets shows significant difference among the treatments. Abbreviations: TN, total nitrogen; TP, total phosphorus; TK, total potassium; Na, sodium; CK = control. B0S1, B30S1, B30S1.5, B0S1.5, B30S1.5, B45S1.5, 0, 30 and 45 g biochar + 1 and 1.5% salt.
Table 3. Effect of acidic biochar and salt stress on nutrients concentration in the under ground part (root) of maize seedlings.
Selected Nutrients Concentration in Root of Maize Seedlings
TreatmentsTN (mg g−1)TP (mg g−1)TK (mg g−1)Na (mg g−1)
CK26.34 ± 0.39 c1.88 ± 0.01 d19.46 ± 1.22 ab26.41 ± 0.70 b
B0S133.62 ± 0.20 a3.02 ± 0.03 a20.20 ± 1.29 ab38.18 ± 1.10 a
B30S124.84 ± 0.16 d2.41 ± 0.04 c20.19 ± 1.56 ab21.67 ± 1.29 c
B45S125.19 ± 0.09 d2.55 ± 0.07 bc21.52 ± 1.56 a15.25 ± 1.41 d
B0S1.526.40 ± 0.22 c2.03 ± 0.03 d16.63 ± 1.30 b21.69 ± 1.75 c
B30S1.530.50 ± 0.19 b2.87 ± 0.05 a19.47 ± 0.87 ab17.75 ± 0.55 d
B45S1.526.45 ± 0.18 c2.67 ± 0.14 b20.81 ± 0.71 a9.09 ± 0.98 e
Data are presented as mean ± SE (n = 3); different alphabets shows significant difference among the treatments. Abbreviations: TN, total nitrogen; TP, total phosphorus;, TK, total potassium; Na, sodium; CK = control, B0S1, B30S1, B30S1.5, B0S1.5, B30S1.5, B45S1.5, 0, 30 and 45 g biochar + 1 and 1.5% salt.
Table 4. Effect of acidic biochar and salt stress on soil properties after harvest (0–20 cm depth).
TreatmentspHEC
(dS m−1)
TN
(mg g−1)
TP
(mg g−1)
TK
(mg g−1)
Na
(mg g−1)
CK8.23 ± 0.04 b1.69 ± 0.18 ab0.42 ± 0.01 c0.64 ± 0.00 c0.20 ± 0.02 ab1.13 ± 0.10 a
B0S18.47 ± 0.08 a1.87 ± 0.32 a0.38 ± 0.01 cd1.05 ± 0.43 c0.22 ± 0.02 ab1.33 ± 0.20 a
B30S17.84 ± 0.02 c1.29 ± 0.11 b0.49 ± 0.02 b1.66 ± 0.02 b0.21 ± 0.01 ab1.07 ± 0.15 a
B45S17.61 ± 0.02 d1.26 ± 0.09 b0.53 ± 0.02 a2.15 ± 0.02 a0.23 ± 0.02 a1.04 ± 0.18 a
B0S1.58.24 ± 0.03 b1.46 ± 0.15 ab0.37 ± 0.01 d0.65 ± 0.01 c0.18 ± 0.01 b0.95 ± 0.13 a
B30S1.57.80 ± 0.05 c1.30 ± 0.04 b0.48 ± 0.02 b1.67 ± 0.04 b0.19 ± 0.00 ab1.08 ± 0.14 a
B45S1.57.60 ± 0.02 d1.26 ± 0.04 b0.54 ± 0.02 a2.25 ± 0.06 a0.20 ± 0.01 ab0.97 ± 0.11 a
Data are presented as mean ± SE (n = 3); different alphabets shows significant difference among the treatments. Abbreviations: EC, electrical conductivity; TN, total nitrogen; TP, total phosphorus; TK, total potassium; Na, sodium; CK = control, B0S1, B30S1, B30S1.5, B0S1.5, B30S1.5, B45S1.5, 0, 30 and 45 g biochar + 1% and 1.5% salt.
Table 5. Correlation matrix of plant growth parameters and shoot and root Na content.
NLLASFWRFWSDWRDWSNaRNa
PH0.68 **0.94 ***0.87 **0.71 **0.87 **0.66 **−0.62 **−0.87 **
NL 0.73 **0.78 **0.64 **0.79 **0.57 **Ns−0.47 *
LA 0.92 **0.69 **0.92 **0.63 **−0.56 **−0.86 **
SFW 0.73 **0.99 **0.68 **−0.45 *−0.79 **
RFW 0.75 **0.99 ***−0.52 *−0.58 **
SDW 0.69 **−0.45 *−0.79 **
RDW −0.47 *−0.54 *
SNa 0.65 **
Abbreviation. PH, plant height; NL, number of leaves; LA, leaf area; SFW, shoot fresh weight; RFW, root fresh weight; SDW, shoot dry weight; RDW, root dry weight; SNa, shoot sodium content; RNa, root sodium content. *, **, and *** indicate significance levels of p < 0.05, p < 0.01, and p < 0.001 respectively.
Publisher’s Note: MDPI stays neutral with regard to jurisdictional claims in published maps and institutional affiliations.

