1. Introduction
Transport for tourism or tourism for transport? This question, which apparently appears as a dilemma, has only an answer, i.e., the two systems are strictly related to each other. In his book, Kaul [
1] stated that the development of tourism was mainly influenced by that of means of transport. On the other hand, tourism was a mass phenomenon which was needed for transport infrastructures and services.
The role of transport is therefore crucial for the increase of tourist flow. The integration of domestic and international transport systems and parallel co-ordination with other countries contributes to the ease of tourism flow and growth of domestic and international tourism. An important aspect is related to the technological developments which would exercise a deep impact on the means and patterns of transportation in both developing and developed societies, with the result that a more efficient, faster and safer transport system would be beneficial to the growth and expansion of tourism improvement.
Significant innovation in transportation technology and continuous construction of High-Speed Rail (HSR) jointly trigger the “second railway age” [
2,
3]. The tourism sector can benefit from the expansion of the HSR network, which, in turn, improves the transport accessibility of the cities served. An interesting body of literature reports the effects of HSR on tourism using different methodologies. For example, in Europe, the inauguration of the HSR line linking Barcelona and Perpignan increased the daily trip in the market of Barcelona [
4]. Cuenca and Toledo experienced an increase in the tourism industry due to HSR [
5]. Ureña et al. [
6] showed that large intermediate cities served by HSR, such as Lille, Zaragoza and Cordoba, benefited from a growth in urban and business tourism. Studies in France demonstrated that HSR increased the attraction of Disneyland Paris [
7] and visitors’ re-visiting Paris and Madrid [
8].
The objective of this paper is to study the impact of HSR on tourism using both parametric and non-parametric methodologies. Among the first ones, the Generalized Estimating Equations (GEEs) was chosen and among the second ones, the Classification and Regression Tree (CART) model was proposed.
Generalized Estimating Equations (GEEs) are usually chosen, assuming that the relations are constant across all provinces, i.e., the associations are spatially stationary [
1]. The limited ability of this technique to take spatial effects into account can be overcome through the specification of spatial regression models. In general, the commonly used spatial models are the Geographically Weighted Poisson Regression (GWPR); the Spatial Autoregressive Regression (SAR) model and the Conditional Autoregressive Regression (CAR) model. The latter has been considered here. The rest of this paper is organized as follows. The case study together with data set and the methodology are reported in
Section 2. In
Section 3 the CART model is specified. Conclusions and further perspectives are reported in
Section 4.
2. The Methodology
2.1. The Case Study
In the past decade, China has experienced a remarkable growth of the HSR network, changing the spatial structure of cities within the transportation system.
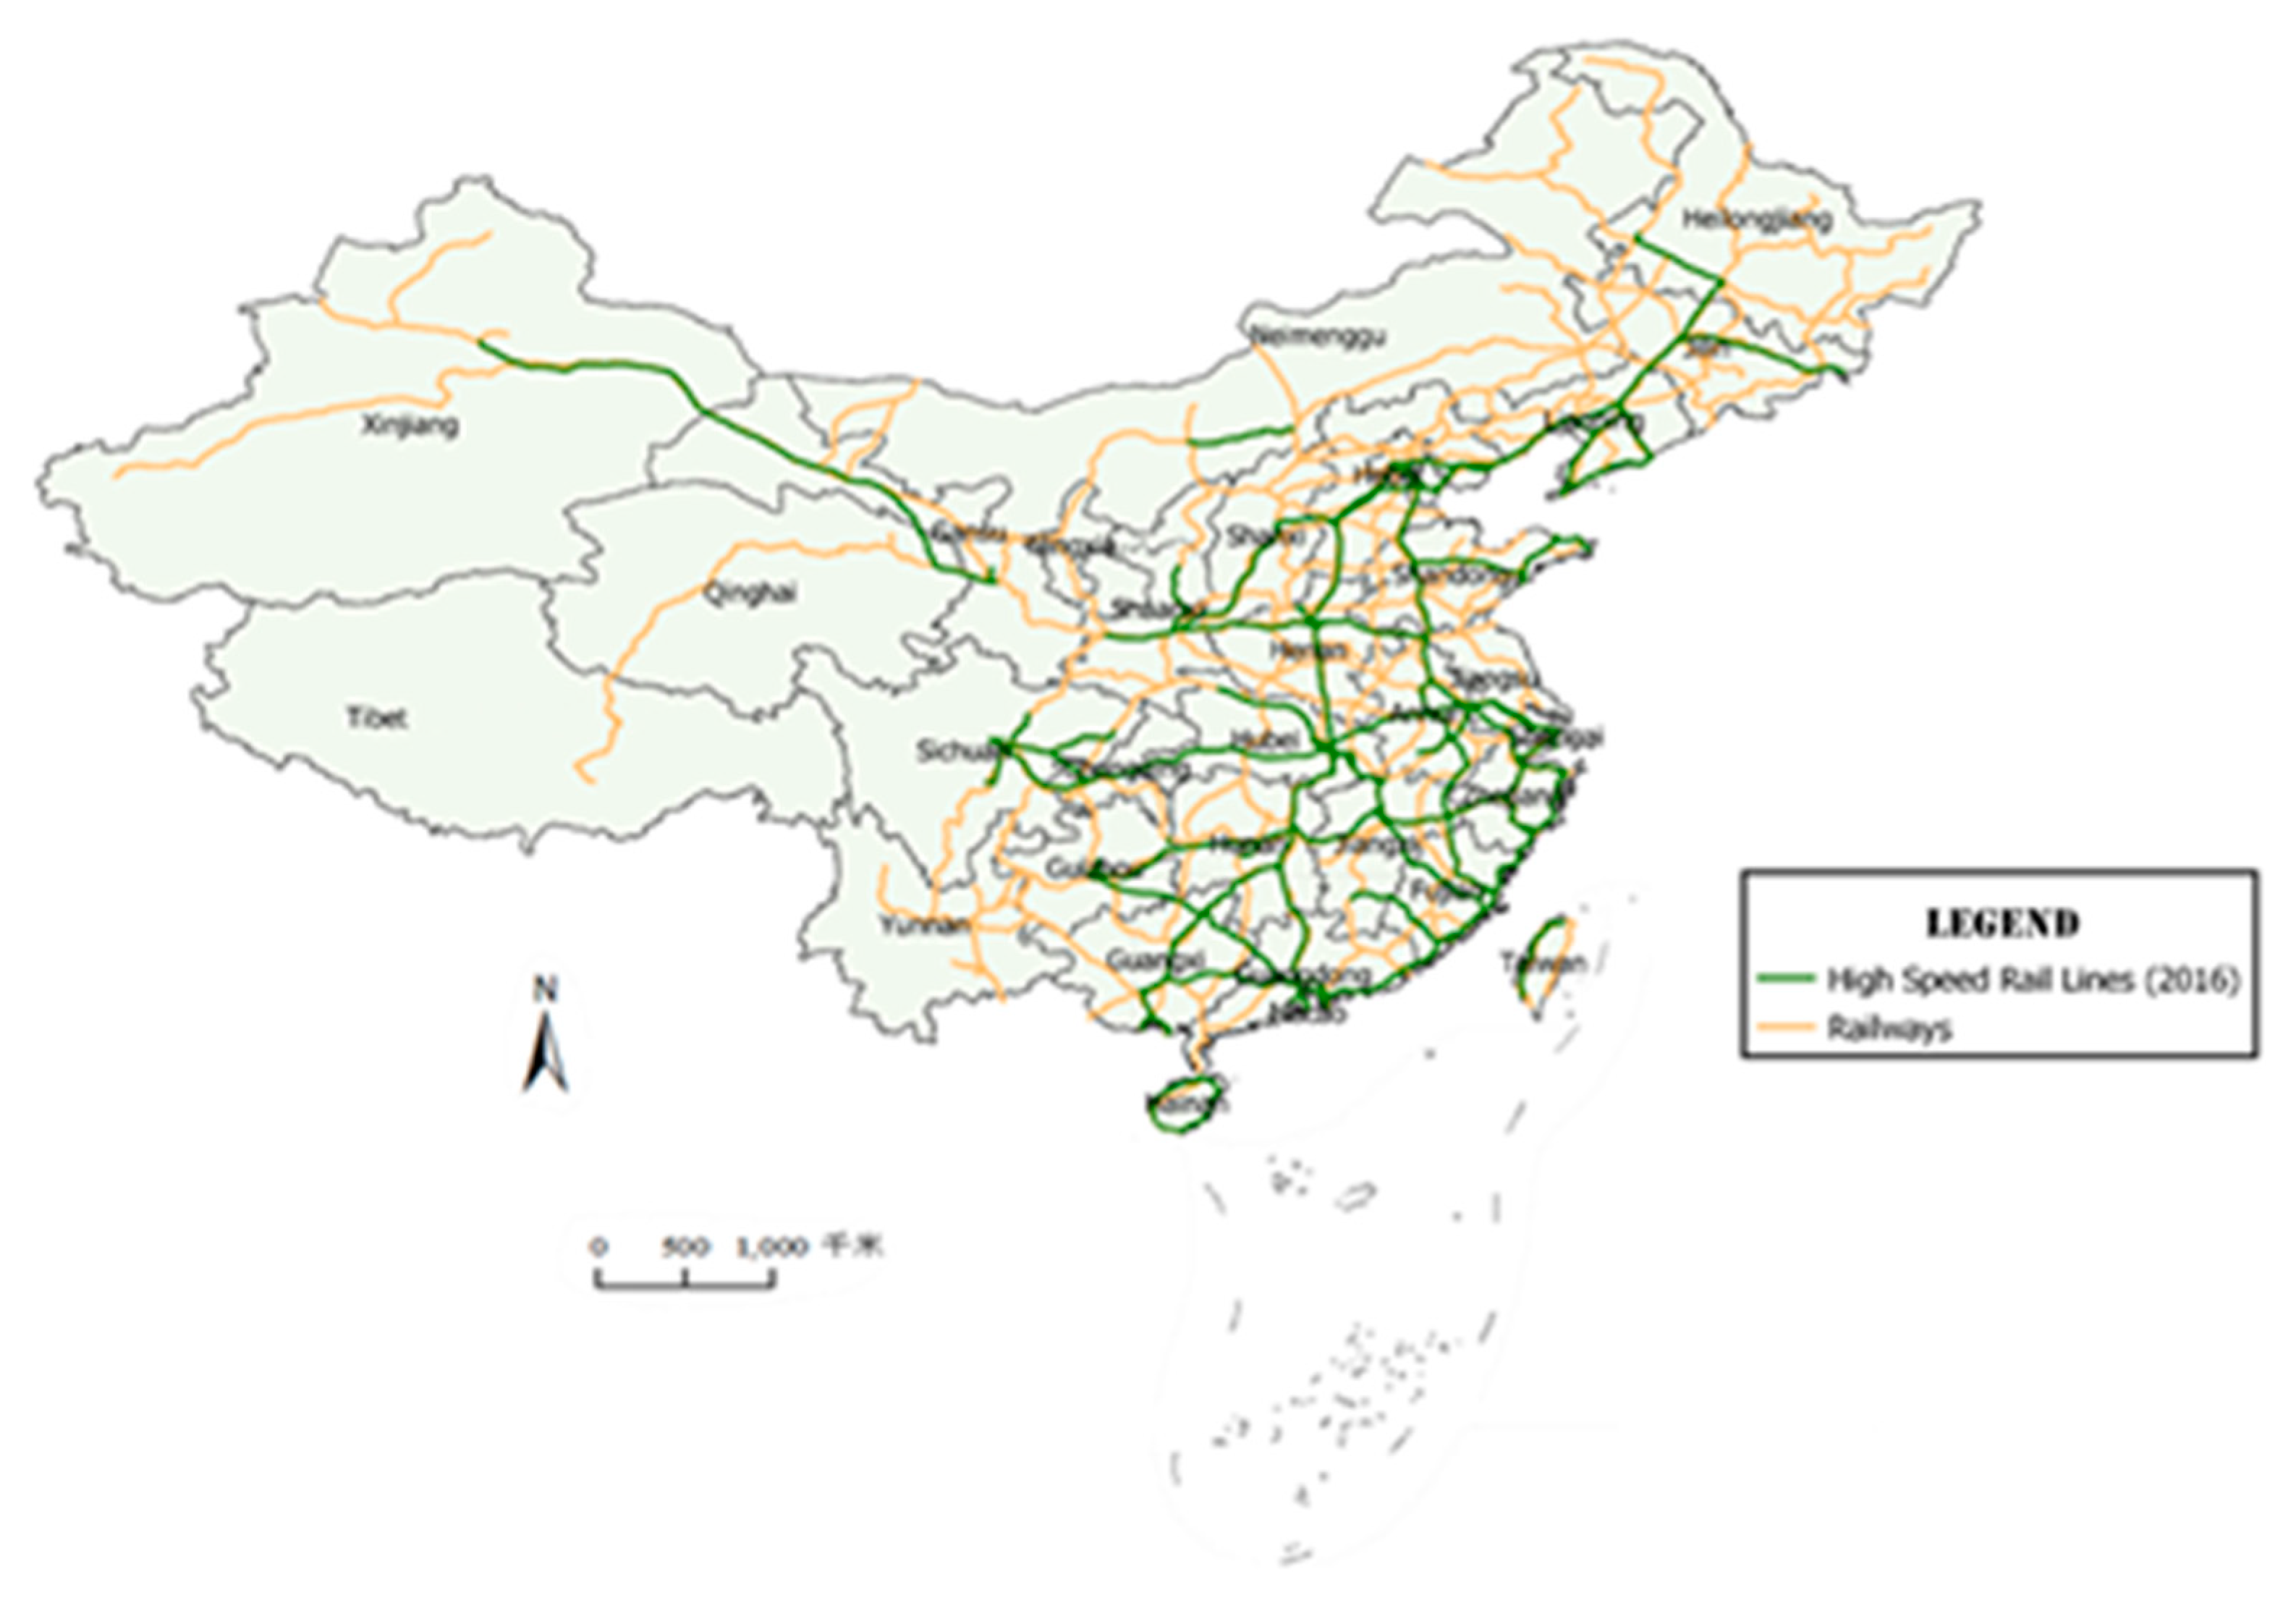
Indeed, China has the longest HSR in the world (see
Figure 1). In 2019, the national railway operating mileage was more than 139,000 km, including 35,000 km of HSR; with 5474 km new mileage constructed and went into operation in 2019 (See
Figure 1). The coverage of the HSR network to cities with a population of more than 500,000 expands from 28% in 2012 to 86% in 2019. All provincial capital cities, except Lhasa in the mainland, have been connected with HSR, and Hong Kong has entered the national HSR network. The Capital Area (Beijing–Tianjin–Hebei), Yangtze River Delta, and other urban agglomerations can be traversed by HSR in under two hours; Beijing, Shanghai, and other big cities with distance of 1000 km can be reached in four hours and distance of 2000 km in eight hours [
9].
In August 2020, China National Railway Group Co., Ltd. issued and released The Outline of Railway Development Plan for A Powerful Transportation Country, defining the development blueprint of China Railway in the next 15 years and 30 years. According to the plan, in 15 years, i.e., in 2035, China will have built about 200,000 km of national railway network, including about 70,000 km of HSR. The HSRs mileage will be doubled with respect to the year 2019, and all provincial cities and cities with a population of more than 500,000 will be accessible by HSR. The three-hour HSR circle is mostly realized between the provincial capitals in adjacent regions.
The analysis of the factors affecting tourists’ choices for the case study of thirty Chinese provinces has been taken into account, where the impact of HSR has been analyzed. In the literature, studies can be found mainly concentrating on accessibility and mobility impacts of HSR in China [
10,
11,
12], as well as on the effect of HSR on regional tourism development [
13] and on international tourists [
14]. However, the causal effect of HSR and tourism growth has been less highlighted. Among the few contributions, Chinese scholars did not reach an agreement on the same results, considering that in some cases they found a positive impact [
15,
16], while in other cases the effect was not significant [
17]. For example, Chen and Haynes [
14] demonstrated that the Chinese provinces served by HSR experienced an increase in the number of foreign tourists of 20% and an increase of tourism revenue of almost 25%.
Taotao et al. [
18] studied the impact of HSR on tourism in the Yangtze River Delta. The increase of regional tourism in the Yangtze River Delta showed an “HSR effect”, and the demand and supply of tourist products improved considerably. Yuhua and Jun [
19] showed that the opening of the HSR had an effect on the tourism development of the cities served by HSR.
Lei et al. [
20] analyzed the tourism spatial structure of Huangshan city before the opening of HSR, just after its opening and two years after its inauguration, and found that the impact of the opening of the HSR on the tourism in Huangshan city was not significant.
Another study demonstrated that the extension of the HSR network in the Capital Region of China significantly increased the total tourism spatial interaction and reduced the spatial difference. Smaller cities connected through HSR to core cities benefited the most from the HSR network inauguration [
9]. HSR also affected tourist flows and spatial relationships of the two cities, Beijing and Tianjin, served by it [
21,
22]. Ziyang et al. [
23] considered Xiamen City as an example and verified that HSR had a correlation with tourism. Yongze et al. [
24] demonstrated that the opening of HSR played a significant role in promoting regional tourism, but this role gradually decreased from the East to the West parts of the country.
2.2. The Data Set
The dataset collected for this study contains information concerning thirty out of the thirty-four Chines provinces (excluding Hong Kong, Macao, Taiwan and Tibet), and deals with the time period 2001–2017. For each province, for each year, eight variables have been identified. Two dependent and six independent ones (See
Table 1).
Regression models assume that the relationship between a dependent variable and any independent variable is stationary in space. To avoid that the autocorrelation between variables seriously affects the estimated coefficients, leading to inadequate statistical inferences, the data considered involve measurements over time for the same provinces (panel data). To take into account these possible unknown correlations, a further extension of the GLM (Generalized Linear Model) was considered, namely, the Generalized Estimating Equation (GEE).
Count data have been modeled through a Poisson distribution, where the probability of a given province
i having
yit tourists every year is equal to the following expression [
25]:
where
P(yi) is the probability of province
i with a number of
yi tourists every year and
λi represents the parameter for province
i of the Poisson distribution. The relationship between count data and the dependent variables, above listed, has been identified through the specification of Generalized Linear Models (GLMs). The information collected involves measurements over time for the same cities and the problem connected with the serial correlation was avoided thanks to the introduction of panel data regression models, which provide a variety of correlation patterns. To deal with possible unknown correlations problems, Generalized Estimating Equations (GEEs) have been specified, being an extension of the GLMs.
The student’s t-test statistic was chosen in order to test the significance of each variable. Therefore, a coefficient is significant when t is greater than 1.96.
Specifically, the first GEE model estimated through the software STATA (version 16), whose results are reported in
Table 2, considers as dependent variable the number of Chinese tourists (using the ChineseTourists variable).
Analyzing the results, it is clear that almost all the independent variables are significant, with the exception of the Hotels variable, which is not shown in the table for this reason.
Variables Resorts, GDP and Passengers have a positive impact, even though a bit smaller, on the number of domestic tourists. The variables that have the greatest impact on the value of the dependent variable are IntAirport, which has an estimated coefficient of 0.3736, and HSRstations, whose coefficient is 0.2053. It is, therefore, clear that Chinese tourists are strongly influenced, in the choice of destinations, both by the presence of international airports and by the presence of HSR connections. The second GEE model estimated takes into account as dependent variable the number of foreign tourists (ForeignTourists), and the results obtained are shown in the following
Table 3.
For this model, all the variables have a t-value greater than 1.96, thus resulting significant. All the variables have a positive coefficient, in particular, the IntAirport and HSRstations variables, which assume a higher coefficient value compared to other independent variables. Comparing the two models, it is possible to note that the Hotels variable is significant only in the case of the ChineseTourists model. This result shows that foreign tourists prefer as a tourist destination one in which there are a large number of Hotels, which are not so fundamental for domestic tourists. The coefficients relating to the Resorts, GDP and Passengers variables are almost constant. The variable HSRstations has a higher coefficient in the second model, which implies that the presence of a HSR network has a higher impact on the choices of foreign tourists compared to those of the domestic ones.
The coefficient relating the IntAirport variable has a higher value in the first model than in the second. Therefore, the presence of international airports seems to have a higher impact on Chinese tourists than on the foreign ones.
The regression models have their basic assumptions and pre-defined underlying relationships between dependent and independent variables. If these assumptions are violated, the model could lead to erroneous estimation. The use of tree-structured methods, like regression trees, can be seen as an application of a regression model in which some explanatory variables are used as covariates to predict the dependent variable values on the basis of some decision rules. This approach establishes a casual effect between dependent and independent variables. These tree-structured methods do not require a priori probabilistic knowledge about the phenomena under study, and no assumption is required [
26,
27]. This can be considered as one of the main advantages of these methods with regard to standard econometric analysis [
28]. A tree is a hierarchical and graphical representation of interactions between variables formed by a finite number of nodes departing from the root node or father node.
3. The CART Model
The application of the non-parametric Classification and Regression Tree (CART) model does not require an a priori probabilistic knowledge of the phenomenon under study and the fulfilment of strict hypotheses, neither on the type of relationship, nor on the form of distribution of the dependent variable. These aspects represent the main advantages over parametric techniques. It was decided to apply this methodology, in addition to those previously described, to collect information not highlighted and left out in the parametric models.
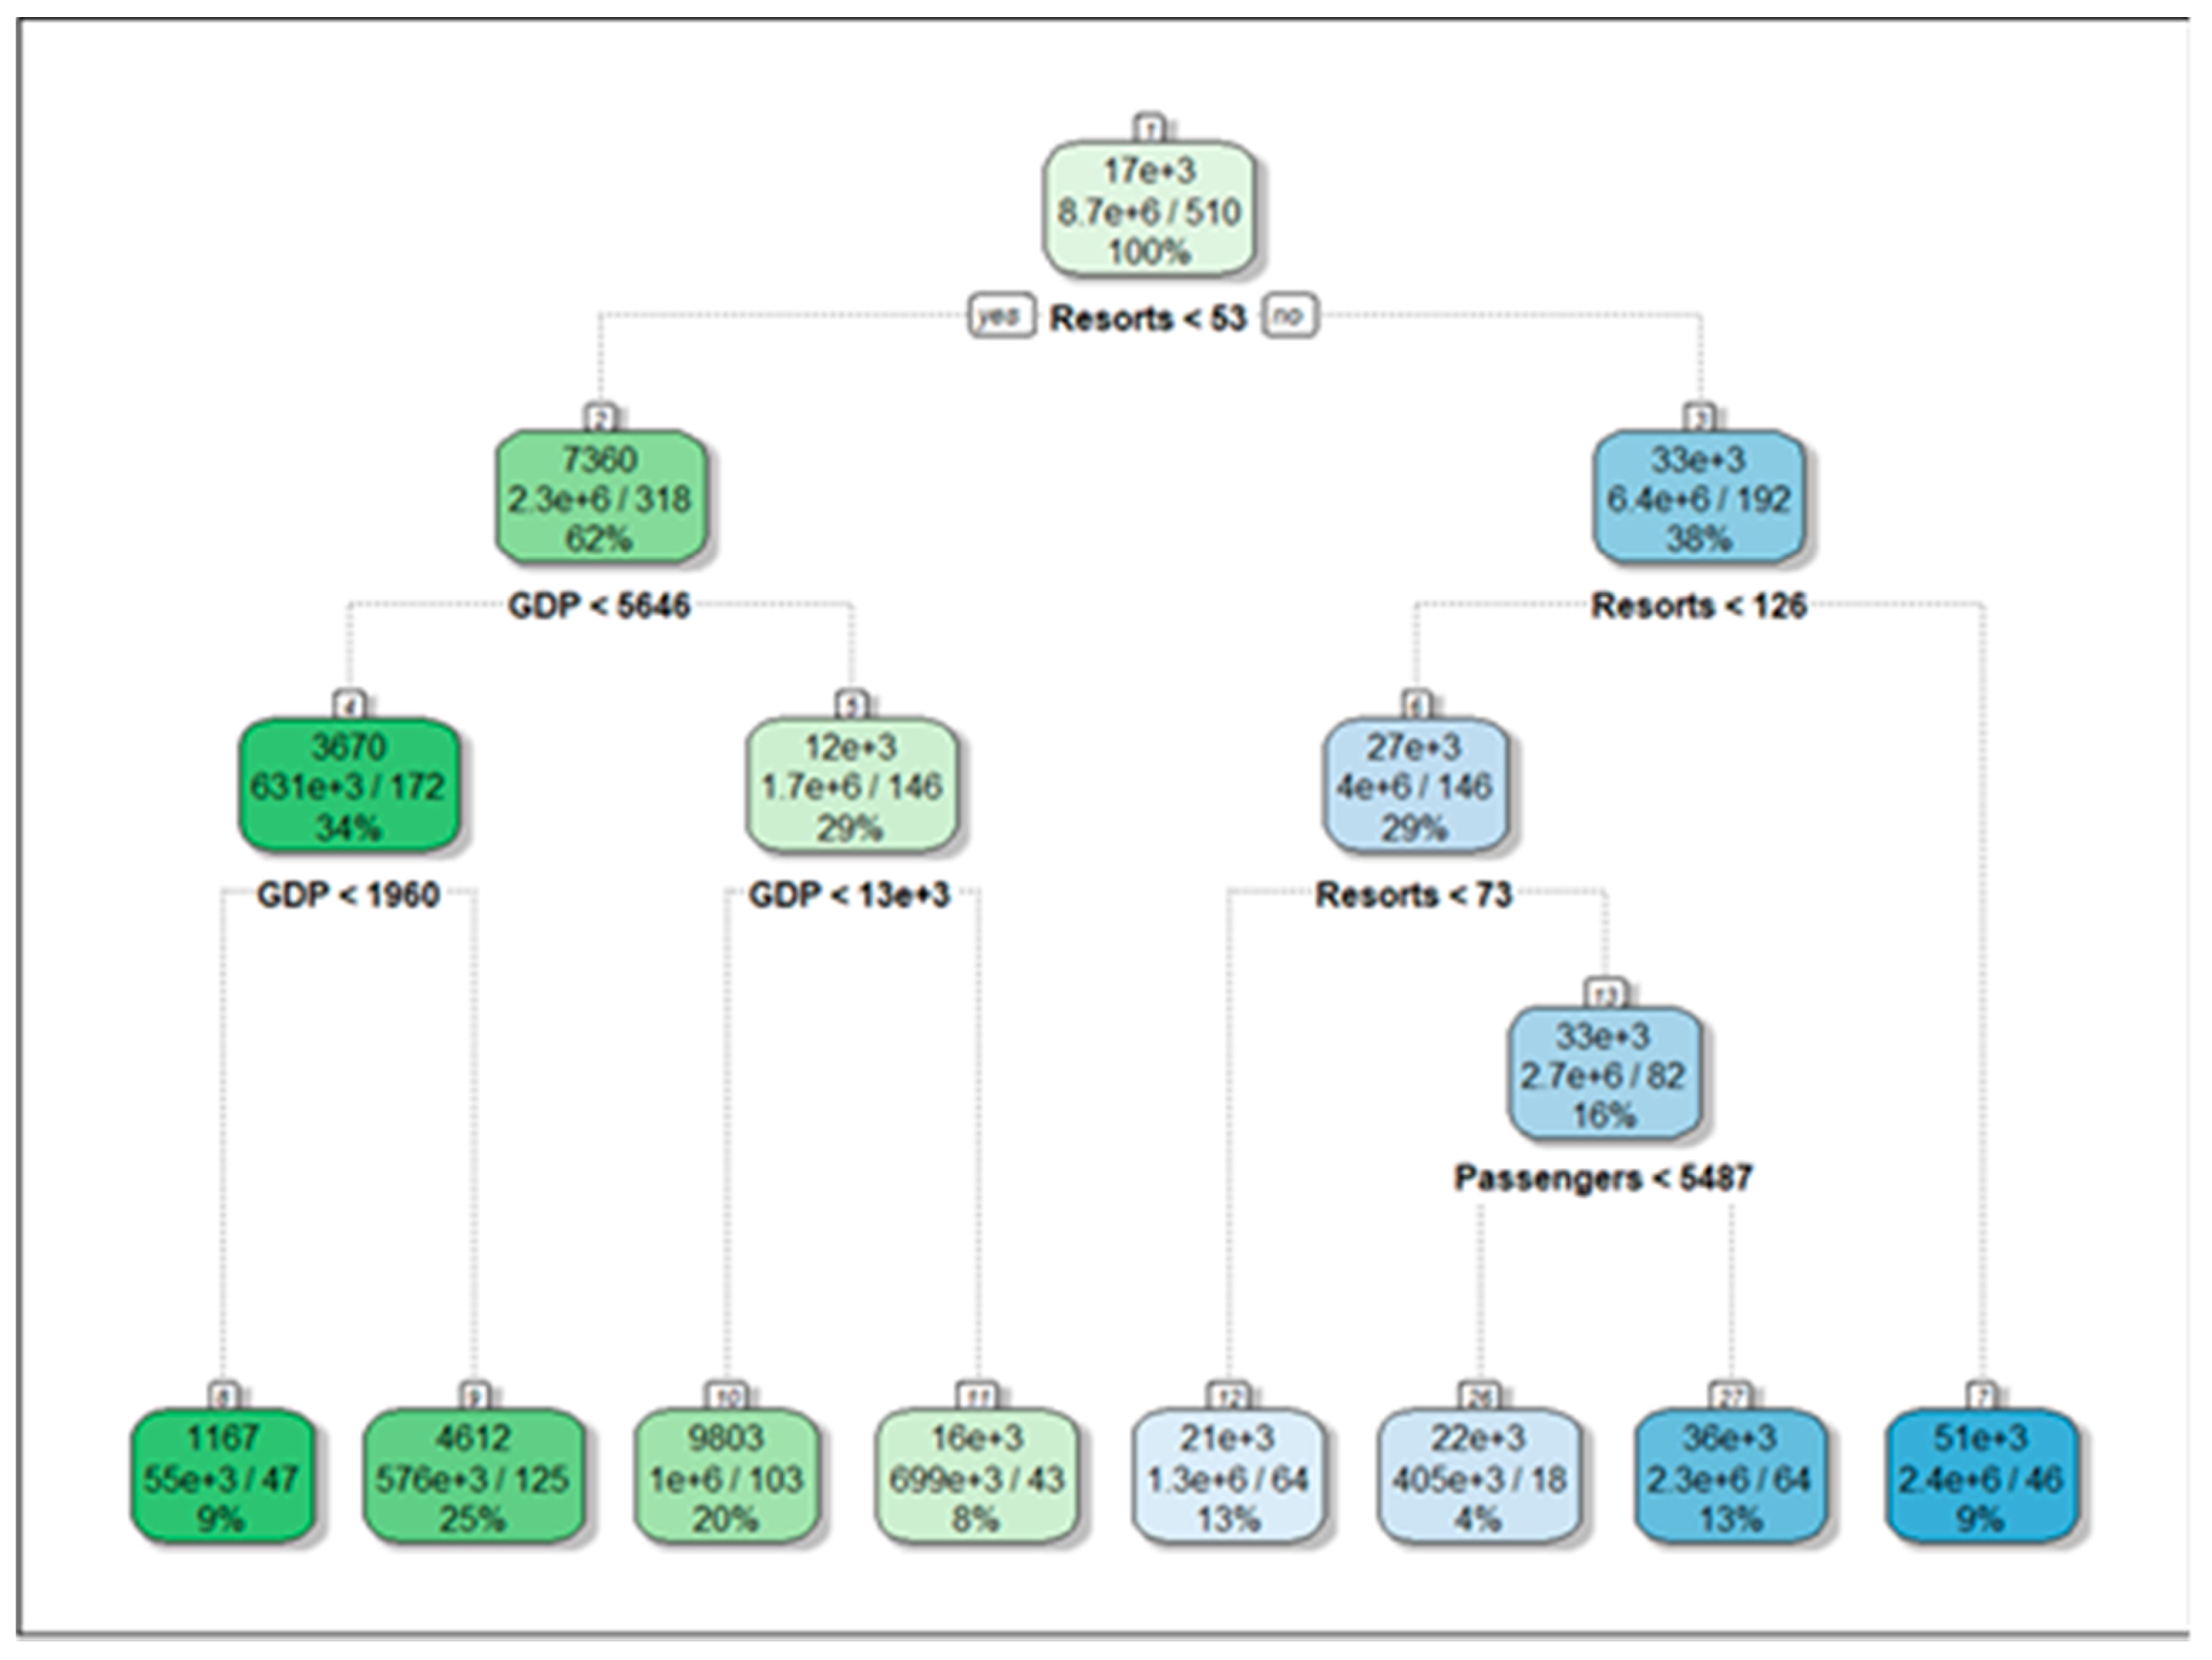
Each node of the tree indicates the predicted value, the number of experimental units contained in the node and its descriptive percentage. The regression tree relating to the ChineseTourists dependent variable has 14 nodes and the first split variable is the one relating to Resorts (see
Figure 2). Results were obtained through the R-Part software.
By analysing the tree, it is clear that, as the number of resorts increases, the number of foreign tourists increases. Another variable that strongly influences the tourist flow is the GDP variable. In the case of richer cities, the number of foreign tourists increases. In this tree, the HSRstations variable never appears as a split variable, like the IntAirport variable.
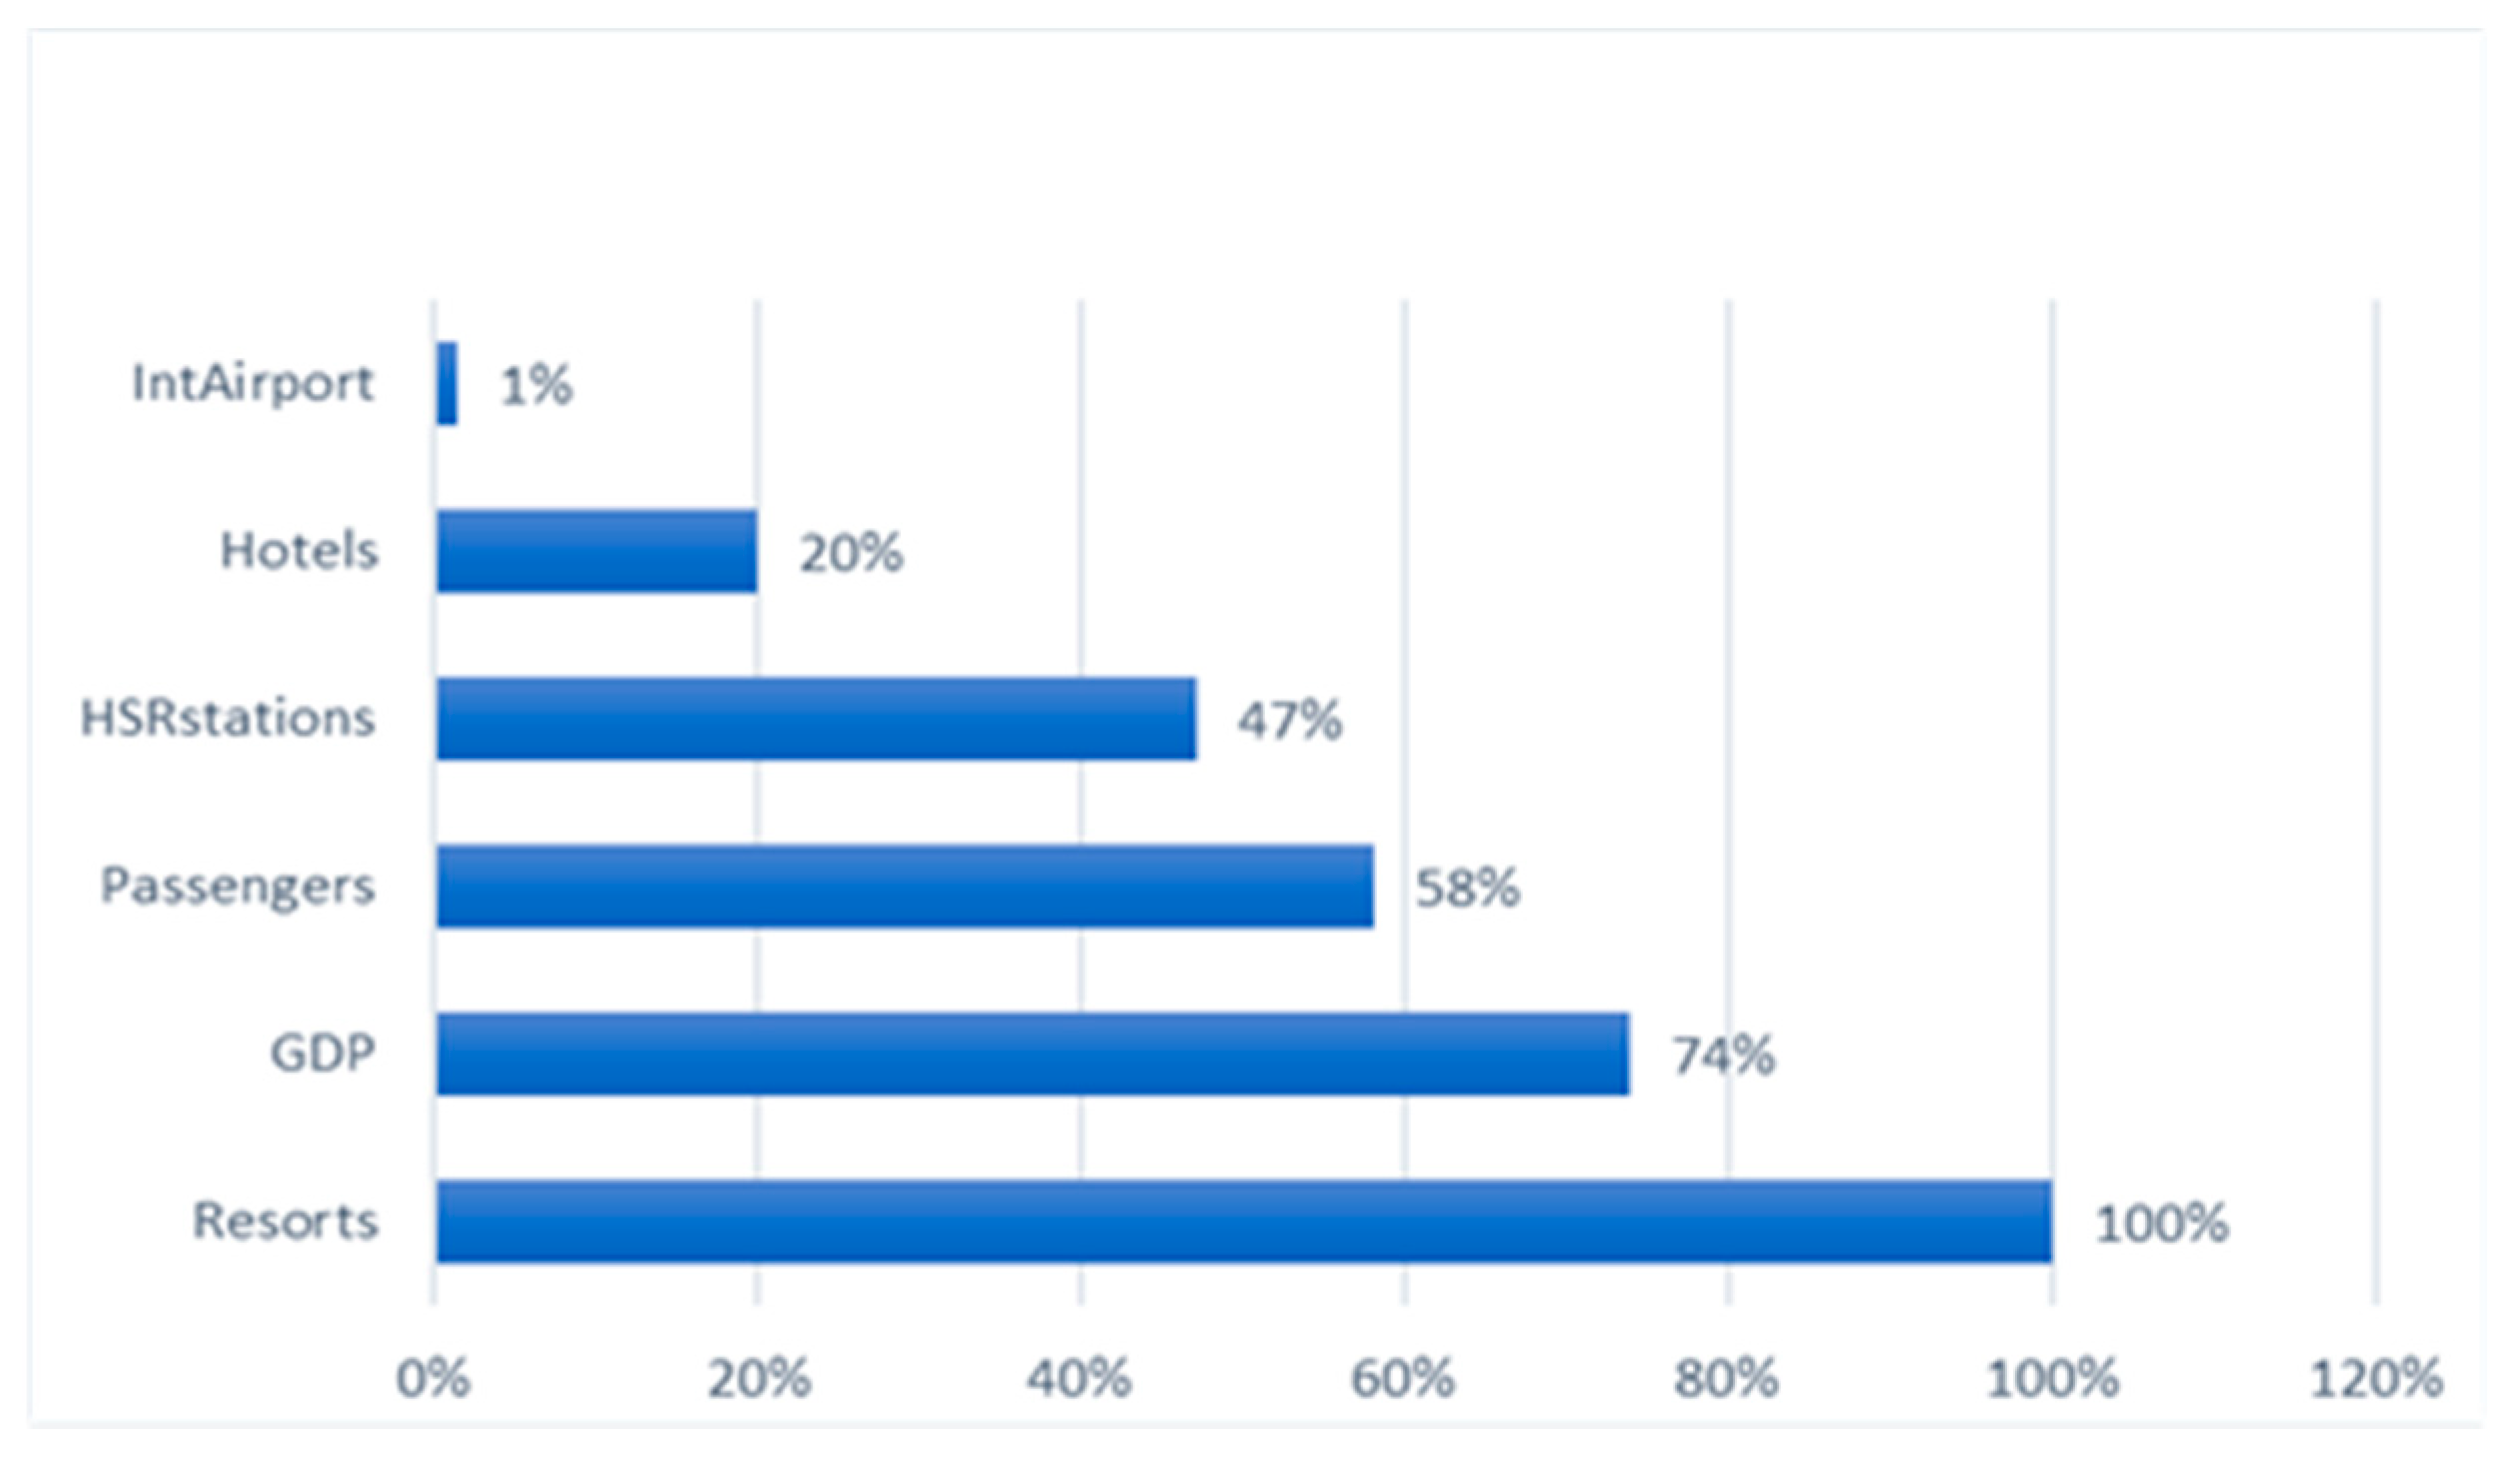
By analysing the values of importance of the variables (see
Figure 3), it is clear that the most important variable is Resorts, followed by GDP, Passengers and HSRstations.
As previously stated, the HSRstations variable never appears as a split variable; this can be explained by the “masking” effect of the Resorts variable with respect to it. Indeed, analysing the correlation matrix, the two variables are strongly correlated (see
Table 4).
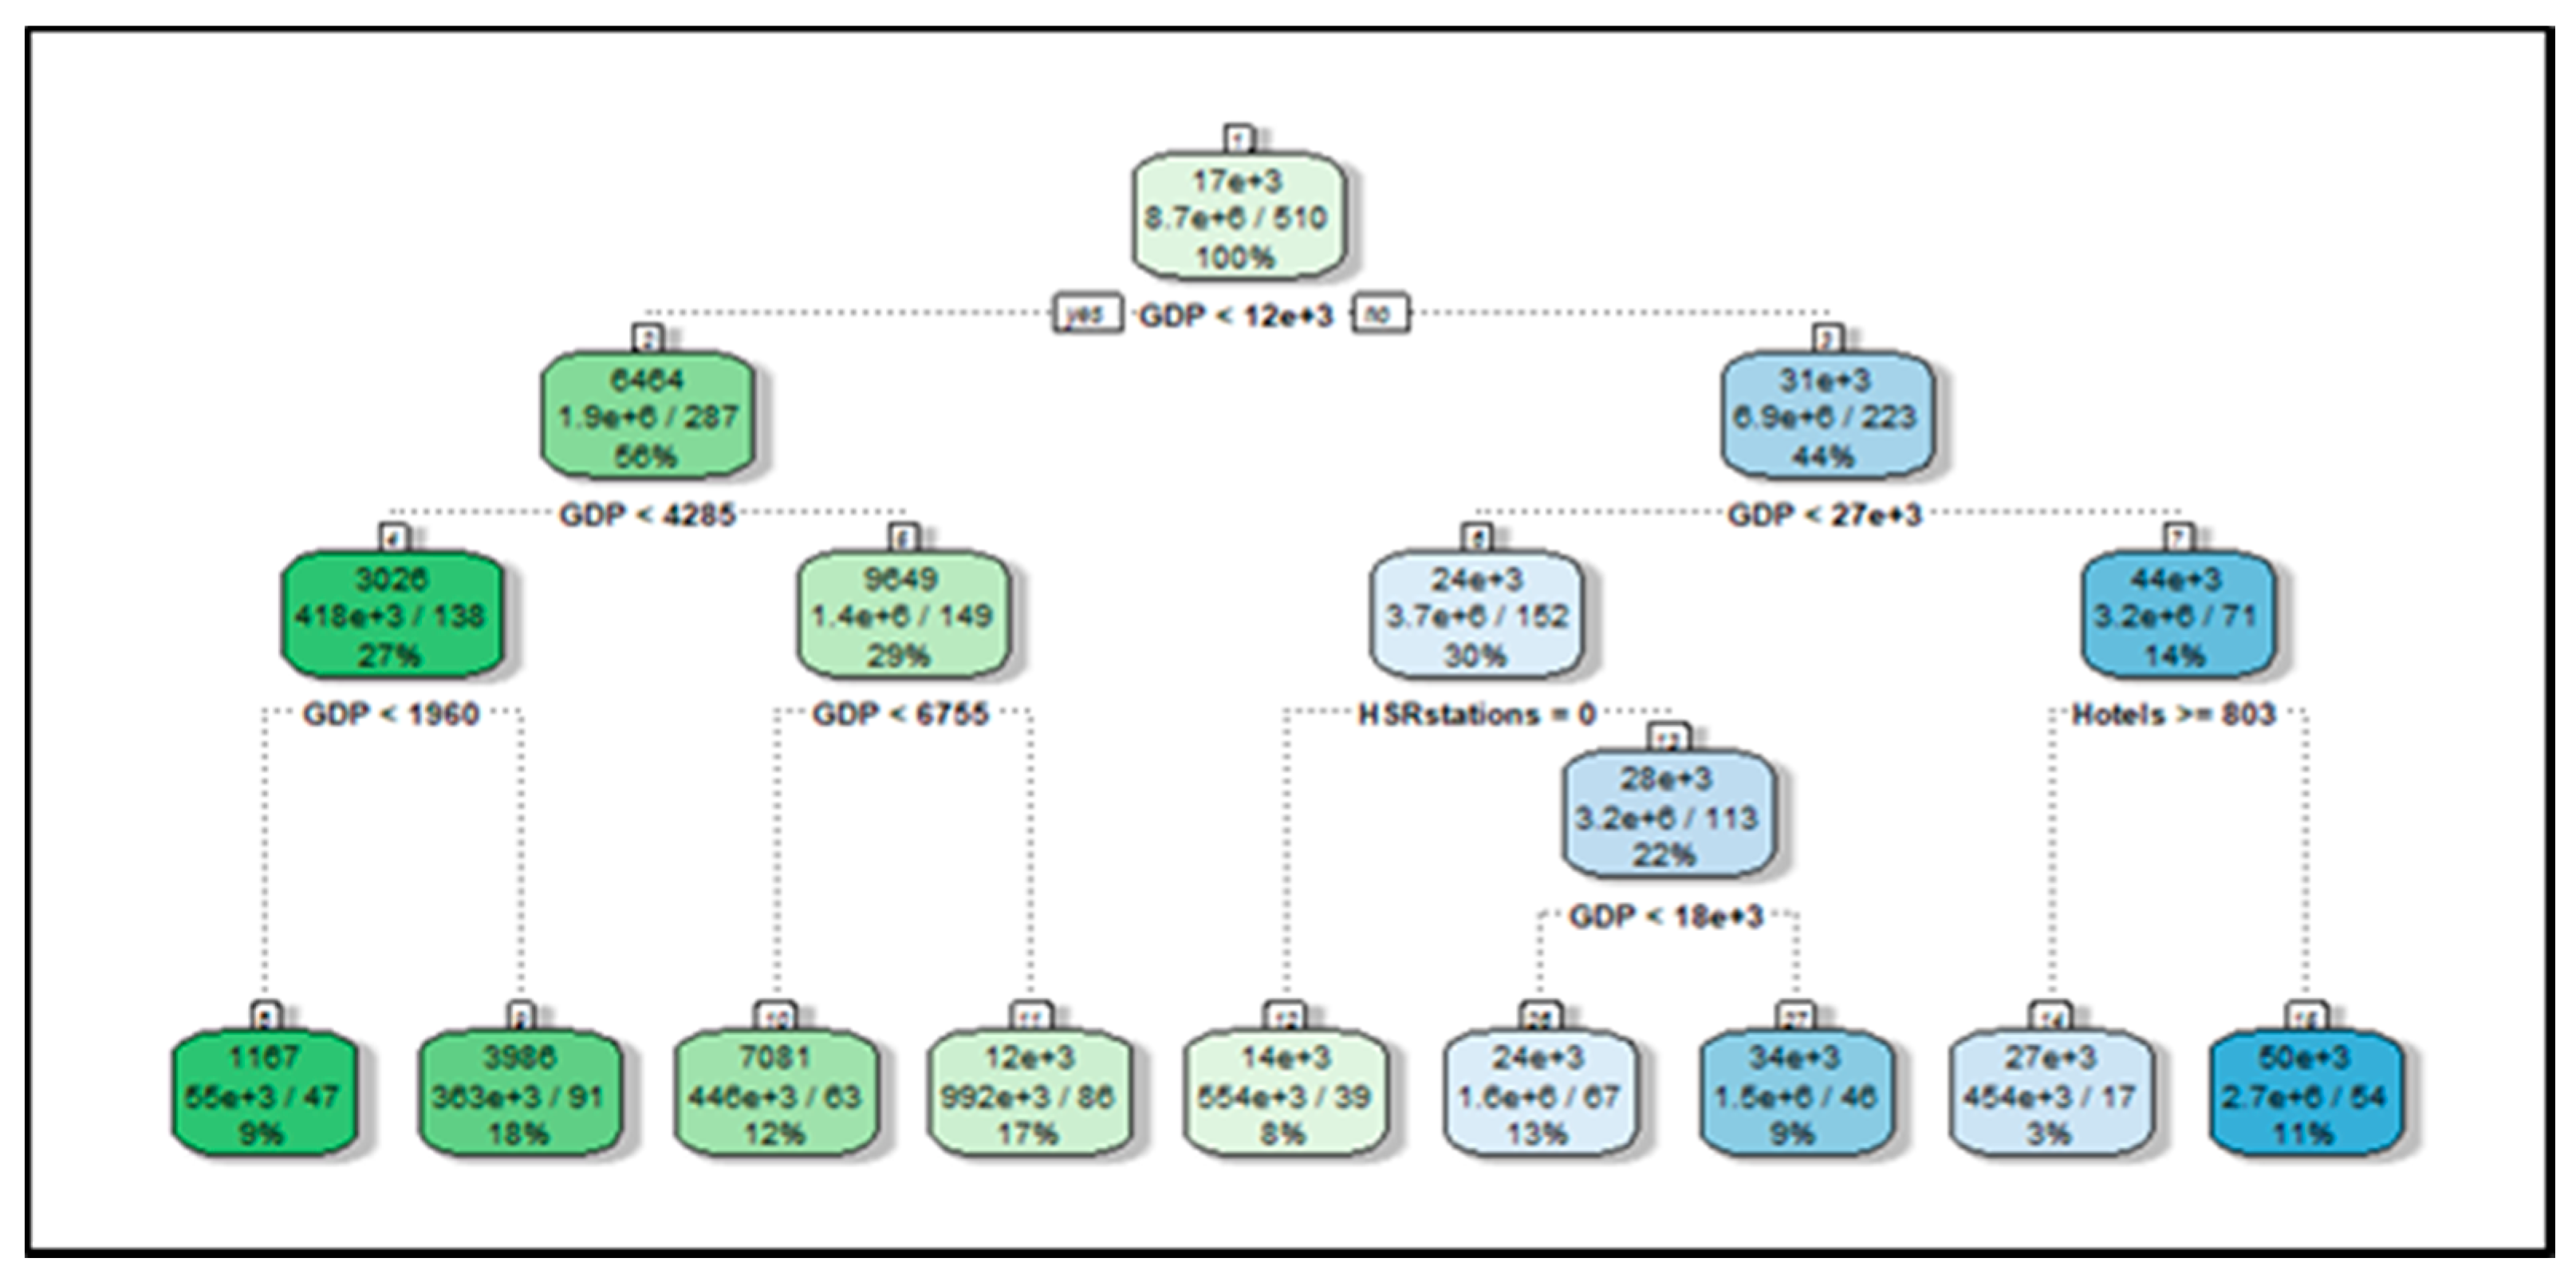
Without considering the Resorts variable, the resulting regression tree presents the HSRstations variable as a split variable (see
Figure 4).
Through the analysis of this tree, it is clear that the presence or absence of HSRstations affects the value of the ChineseTourists variable. The child nodes (12 and 13) have highly differentiated values, a predicted value of 554,000 and a much higher one, i.e., 3,200,000. Therefore, the presence of HSR stations has an impact on the number of domestic tourists.
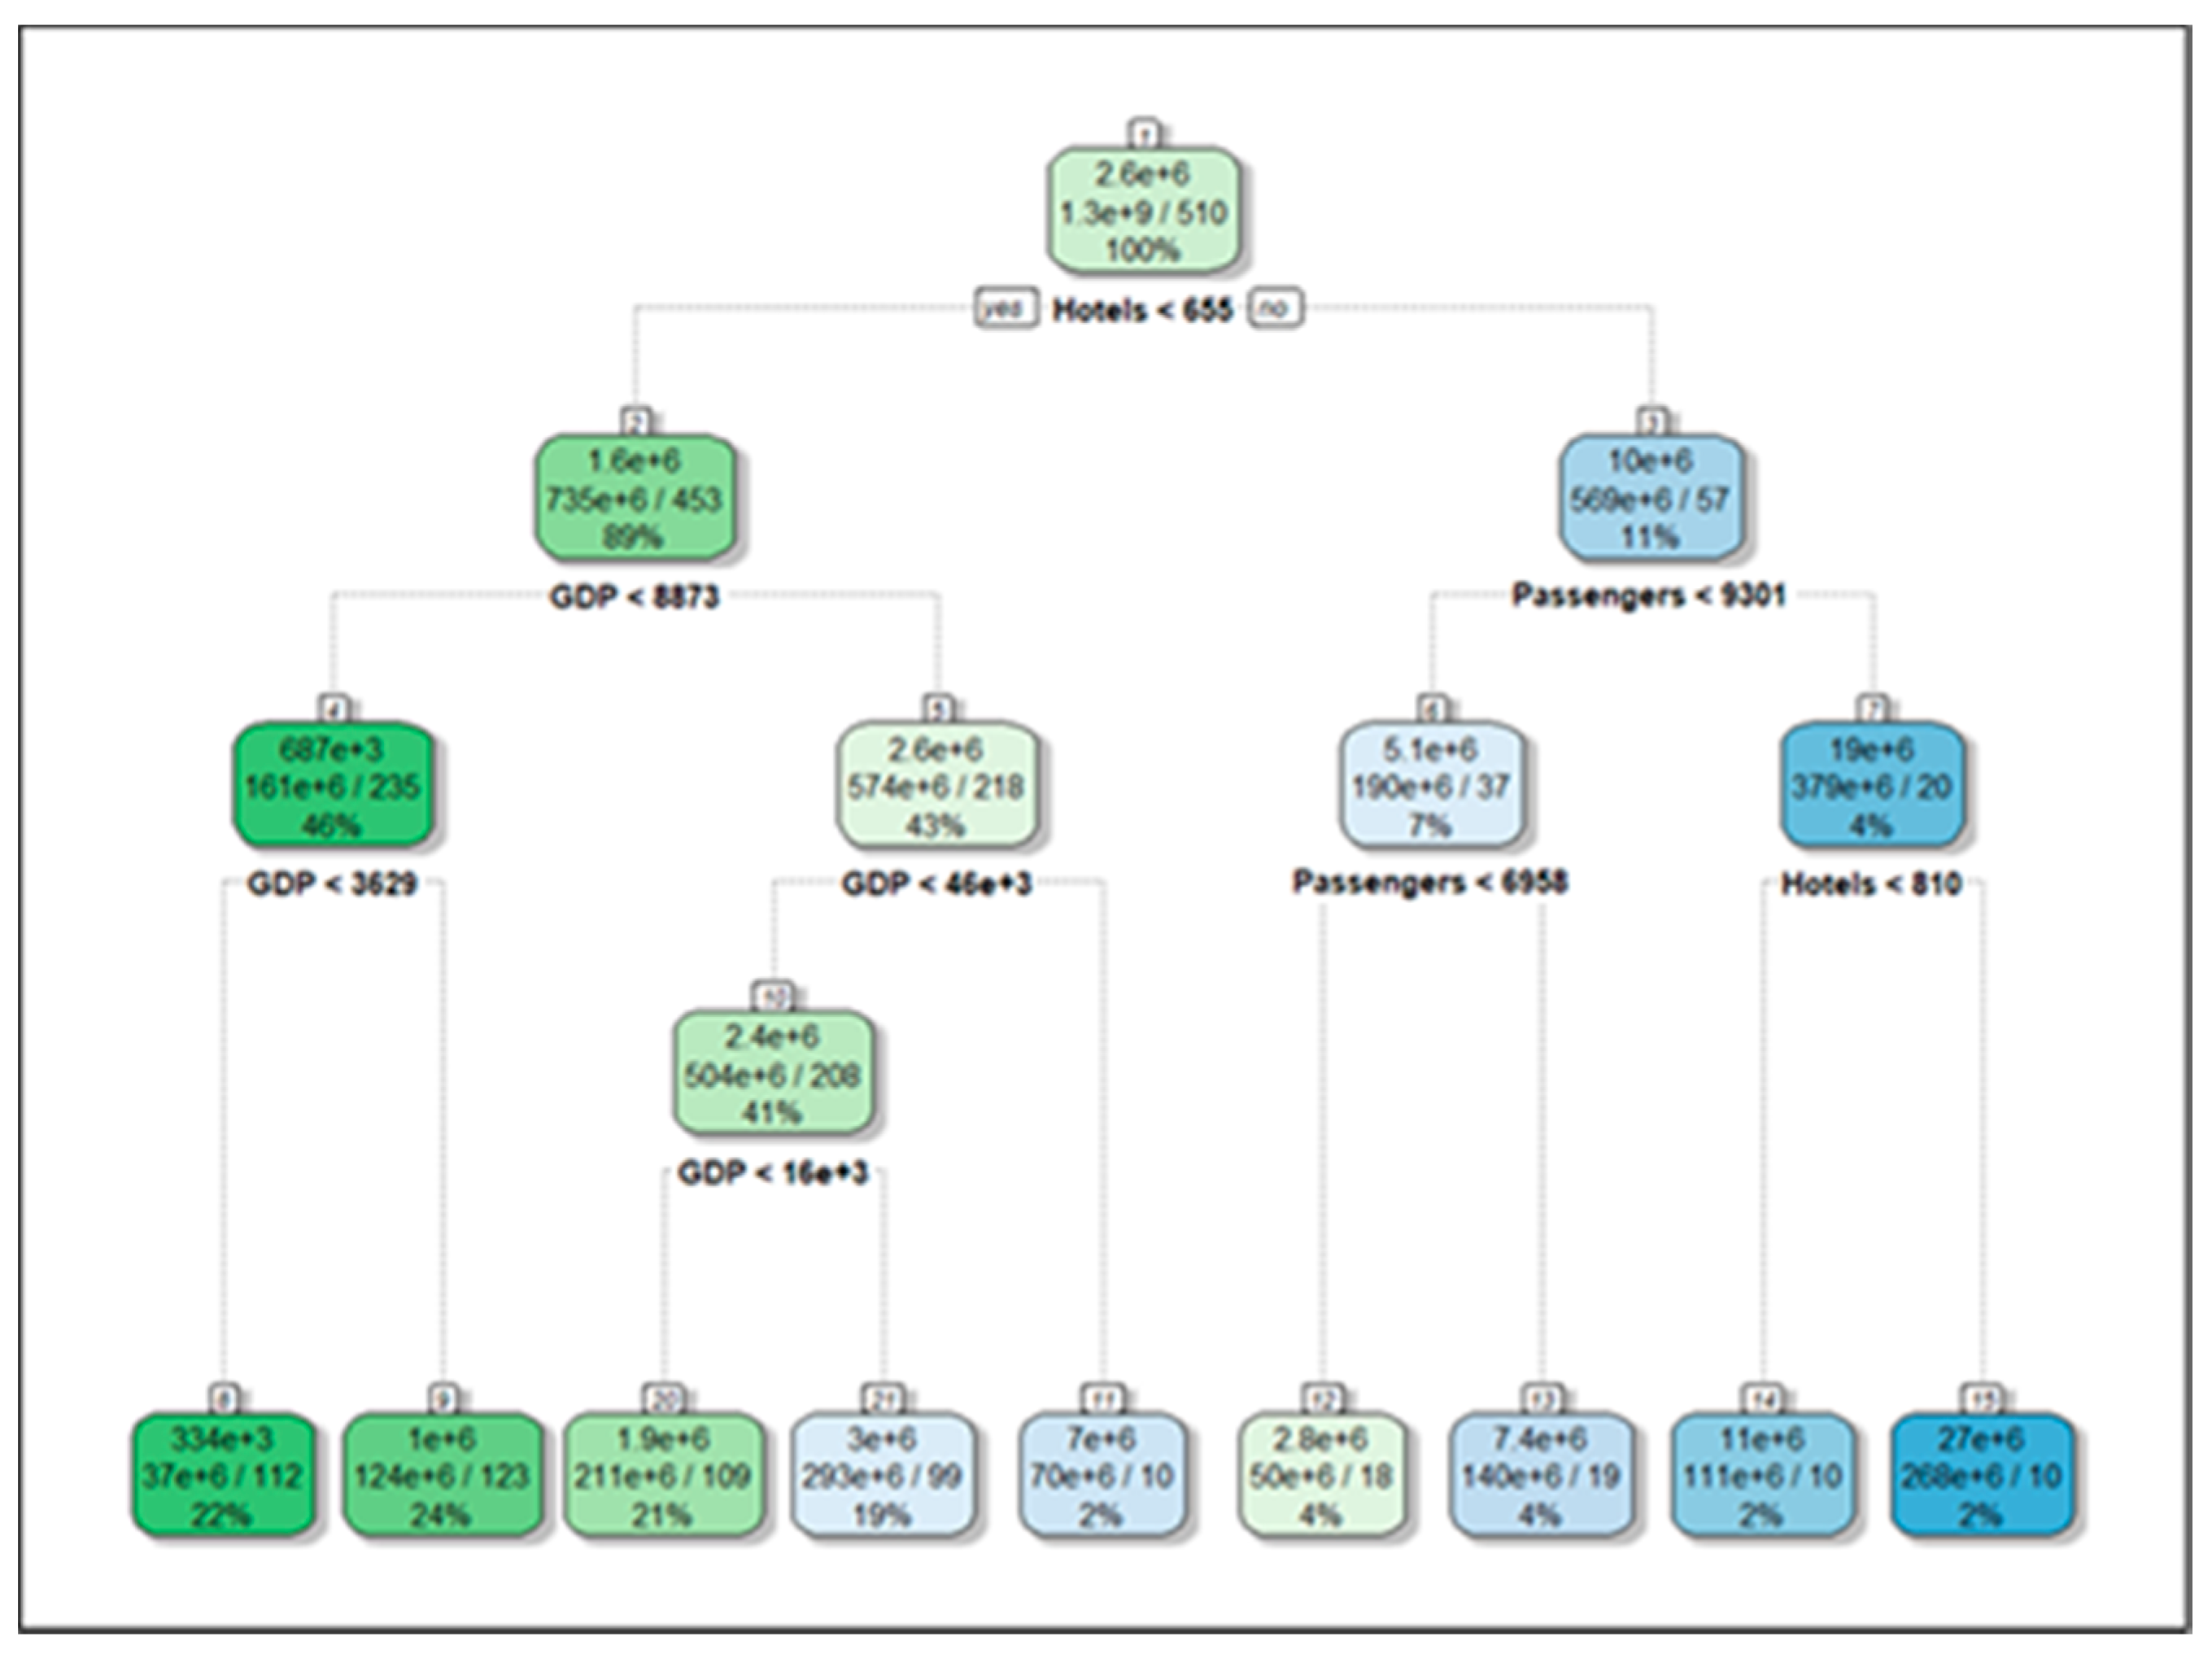
The tree relating to the dependent variable ForeignTourists has 16 nodes and also in this case, there are no HSRstations and IntAirport variables. The first variable of the split is Hotels, in addition to it, the independent variable that most influences the number of Foreign tourists is the GDP variable (see
Figure 5).
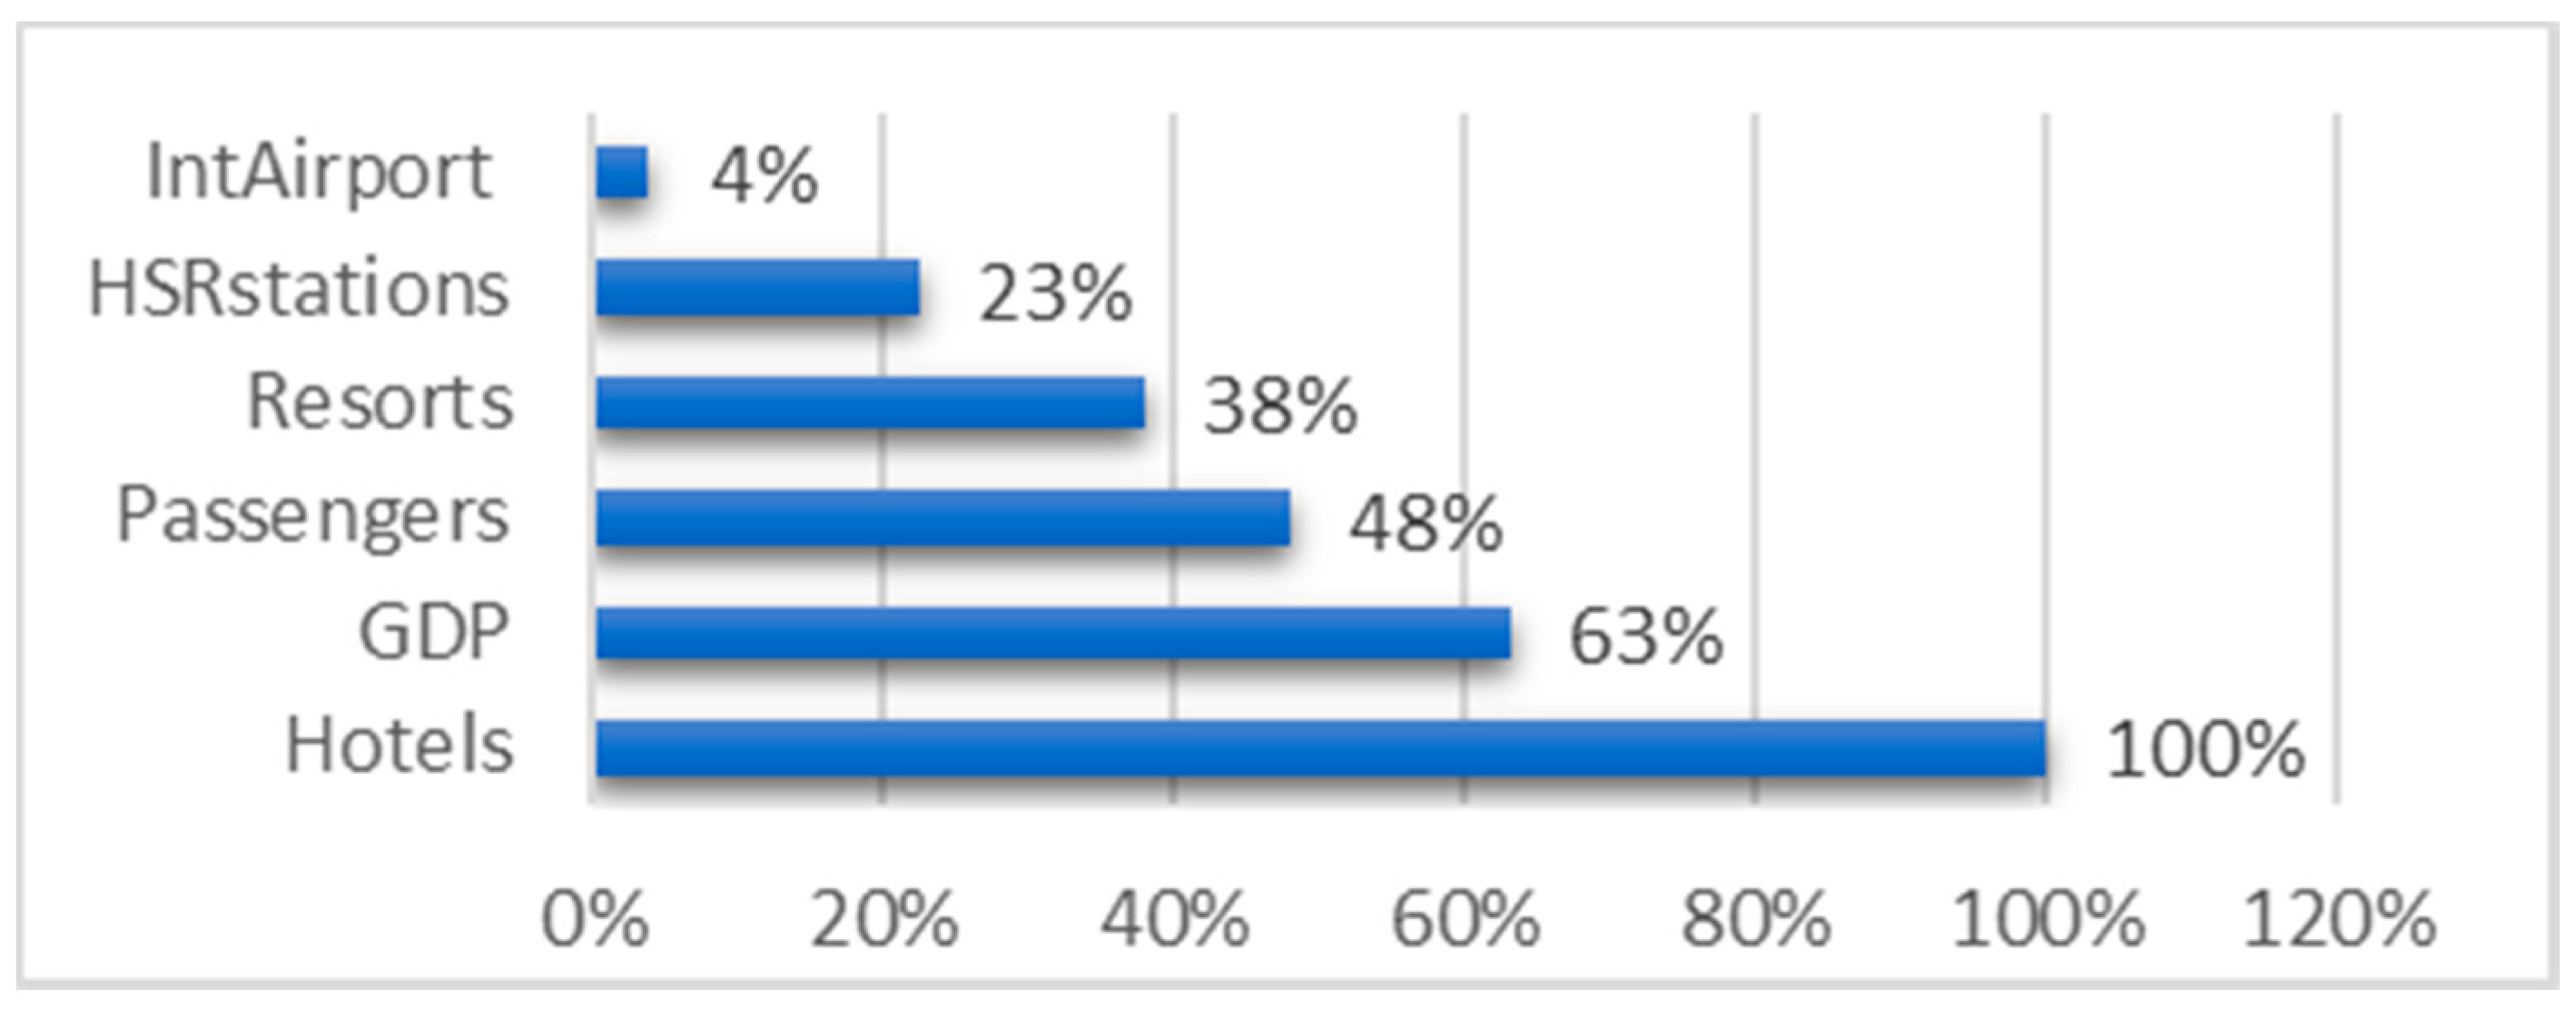
Considering the importance values of the variables, there is an increase in the importance of the IntAirport variable and a decrease in the relative importance of the HSRstations variable (see
Figure 6).
The analysis of the regression trees shows that the HSRstations and IntAirport variables are not considered as split variables. This can be justified by the fact that the two variables, being dichotomous variables (i.e., dummies), can only assume values 0 and 1, and therefore they provide poor information and do not fully express the variability of information itself. It is likely that the HSRstations variable would have a higher explanatory power if the number of stations in the territory was quantified, given the different sizes of the provinces and the regions considered.
A comparison between the two methodologies adopted in this paper follows. The R2 marginal was adopted (see
Table 5).
4. Conclusions and Further Research
In this paper the objective is that of analysing the impact that HSR systems can have on the tourist areas they serve, thanks to the increased accessibility they bring. Indeed, this study found consistent evidence in favour of a positive relationship between HSR and tourist outcomes for the case study of China. Estimation of parametric and non-parametric models have been proposed to analyse tourist behaviours, both Chinese and foreign ones. Results show that HSR has affected the tourism industry and that therefore investments in these systems have significant effects on regional development.
Very few are the contributions in the literature applying the CART methodology in this context. CART provides both theoretical and applied advantages relative to the parametric models. Indeed, from the theoretical perspective, the advantage of the CART method is that it does not require the specification of the functional form of the model in advance and the assumption of the additive relationship between dependent and independent variables. Another advantage is that the CART analysis can effectively handle collinearity problems. When a serious correlation between independent variables exists, the variability of the estimated coefficients will be inflated. It follows that an interpretation of the relationship between independent and dependent variable is difficult to define. On the other hand, regression tree methods are also not sensitive to outliers since the splitting is based on the samples proportion within the split ranges and not on the absolute values.
From the applied perspective, the regression tree methods are very intuitive and easy to explain. Moreover, they have the advantage of giving each variable the chance of appearing in different contexts with different covariates, and thus better reflecting its potential impact on the dependent variable. However, unlike a linear regression model, a variable in the CART algorithm can be considered highly important even if it never appears as a node split.
Further research is required on the use of HSR variables, which should describe the connectivity and territorial distribution of the HSR network, and the service conditions offered by the operating companies (e.g., fares, timetables, frequency, and so on). Specifically, considering that one of the limitations of the current literature is represented by aggregate data on tourism, the authors suggest proposing direct surveys to tourists and ask them the travel mode chosen to reach a given destination for their holidays. More disaggregate analysis should be represented in international literature to fill this gap.
Moreover, the application of the same methodology to other case studies will be considered in order to make a comparison.


