1. Introduction
1.1. Context and Background
More than half of the world population lives in urban areas, and this is an increasing trend. Consequently, more people, assets, facilities, and goods are concentrated in cities and exposed to floods. Weather related disasters are becoming increasingly frequent worldwide, and floods represent 40% of the total natural disasters in the 21st century, when floods affected about 1.64 billion people, accounting for approximately 105 thousand casualties and reaching a total damage that exceeded half a billion dollars [
1].
The world population reached 7.7 billion in 2019, and nearly 64 million people were affected by floods and major storms [
1]. By 2050, projections indicate an increase of approximately 26% in the total population [
2]. The approximate number of people exposed to floods around the world in 2018 was estimated as 1.2 billion, and up to 2 billion people will be at risk by 2050 [
3]. Urban areas are expected to absorb practically all of this increased risk, and most of the global urban growth will take place in areas that are prone to high-frequency floods [
4].
The rapid population growth imposes challenges for cities in their path towards sustainable development. The urbanization process is commonly followed by major land-use changes, which include vegetation removal, increase of imperviousness rates, reduction of infiltration and natural retention, and other changes in the urban hydrology, leading to imbalances in the occupied watershed [
5,
6,
7]. This process results in greater runoff volumes flowing faster, increasing peak discharges and aggravating floods. The built environment degrades, and quality of life is affected, frequently impoverishing the local population in a spiral of increasing and unrecoverable losses.
Considering social, economic, and environmental damages caused by floods, this phenomenon has been widely studied, and the evolution of urban rainwater management has been characterized by a breakdown of paradigms [
8].
The rainwater management paradigms were defined, in the first instance, by controlling floods in a timely manner. Subsequently, urban flood management was carried out by flood control in a distributed and integrated manner over the watershed and, more recently, floods are addressed from the perspective of flood risk management [
9]. In this context, this new paradigm considers building flood resilient cities rather than simply mitigating flood damages. Flood resilient cities must be able to resist over time, minimizing flood impacts, recovering quickly from damage, and maintaining city functions. These goals are easier to achieve when urban hydrology can be nearly restored to the natural patterns. This means, however, that spaces must be available to recover the modified hydrological functions [
5,
10].
Successful development depends on sustainable urbanization practices, as cities should guarantee inclusion, security, and resilience for all citizens on a daily basis and even when facing extreme situations [
11]. When considering resilience as a component of sustainability, urban resilience should address both natural and anthropic risks, aiming to reduce vulnerability of people in the urban environment but also increase robustness to the decision-making process of local urban plans [
12].
Both resilience [
13,
14,
15,
16,
17] and sustainability imply a long-term vision, where the city must positively respond to future challenges, maintaining its active functions and expected quality of life. Therefore, it should be recognized that a risk-free situation does not exist, leading to the need to develop strategies that allow an acceptable level of risk. It is in this context that resilience demonstrates its value. Since it is impossible to avoid all risks, it is important to offer functional solutions and prepare urban systems to “fail safely” [
18], as far as possible, and to recover quickly from damages. Within this framework, urban strategies on flood mitigation should focus on combining “safe-to-fail” and “fail-safe” approaches, seeking to ensure that the city’s services and structures do not fail frequently or in a critical punctual or cascading manner [
17,
19].
Understanding flood dynamics allows identifying, mapping, and communicating flood risks to the community, which is the first step in managing these risks. If practical and justifiable, flood risks can be mitigated using best practices, possibly by applying structural measures, but it is also important to add non-structural measures to support and complement the structural measures.
From this point of view, best practices aim to improve community flood resilience through the reduction of social and financial costs generated by flood events. However, there will always be a residual risk [
9,
20,
21] associated with the probability of the proposed structural measures failing, which may be overloaded by an unusual event or become obsolete due to an uncontrolled urbanization process. Therefore, these best practices should not only be based on structural interventions but also on a set of measures that seek to increase naturalness and sustainability by both acting at the urban spaces within the watershed scale and offering alternatives to interact with the population, for example, through early warning systems, indicating what routes and places are safe when residual risks materialize their effects.
Some of the most common best practices (structural and non-structural) can be summarized as: flood zoning [
22,
23], LID (low impact development) controls [
24,
25], relocation of structures and infrastructures at risk [
26], re-balancing of the sedimentary cycle, and reorganization of city mobility through early warning systems [
27,
28].
1.2. Best Practices and the Adaptation of Conventional Urban Rainwater Infrastructure
The rapid urbanization process led to a series of negative environmental impacts in urban areas. This process changes both the quality and the quantity of runoff, which may increase flood magnitudes, pollute surface water bodies, and lead to a shortage of groundwater resources [
29].
To minimize these negatives impacts, low impact development measures have recently garnered interest in urban planning. More recently, there has been a widespread uptake of the “Sponge City” approach [
30,
31,
32], intending to manage rainwaters generated within the watershed itself, dealing with their excess and quality changes, aiming to mitigate flood risks, and fostering rainwater reuse. This approach is inspired by LID and green infrastructure approaches, as it promotes natural and semi-natural measures in managing urban stormwaters and wastewaters as well as considering the water cycle as a whole [
33].
LID is a management approach that focuses on the conservation and/or the recovery of pre-development water cycle conditions through various strategies and formal elements [
25] that mimic the original water cycle functions, mainly in terms of infiltration and retention. These technologies not only include structural techniques but also non-structural ones that support the functions of the water cycle [
34,
35]. In general, LID techniques manage stormwater at its source through the natural processes of infiltration, detention, storage, and purification [
36]. Its principles include preserving and recreating natural landscape features, minimizing effective imperviousness to create functional and appealing site drainage that treats storm water as a resource rather than a waste product [
37].
There are different types of LID techniques, and it is believed that their combination with other urban systems could enhance the resilience of cities to cope with environmental risks from storm events of various return periods [
31,
32,
33,
34,
35,
36,
37,
38]. They are also indicated for highly urbanized areas as they are usually micro-scale and decentralized facilities [
31,
39]. Some studies report that LID measures have other positive effects such as improving public health, ecosystem diversity, increasing land value, and reducing rainfall runoff [
25]. Combining LID measures with urban design can also bring about the possibility of retrofitting degraded urban areas as well as using green open spaces to improve environmental connections.
Stepping away from the traditional “end-of-pipe” approach, the Sponge City paradigm calls for the use of natural processes as part of the urban runoff control strategy [
37], moving towards the LID concept. This new approach aims to enhance infiltration and evapotranspiration as well as capture and reuse the stormwater in the urban environment [
40]. In other words, a Sponge City refers to sustainable urban development including flood control, water conservation, water quality improvement, and natural eco-system protection. It envisions a city with a water system which operates like a sponge to absorb, store, infiltrate, and purify rainwater and release it for reuse when needed [
33]. In this sense, a Sponge City can be defined as a city that has the capacity to mainstream urban flood risk management in its urban planning policies and designs, helping to deal with issues such as “too much water” as well as mitigating impacts of “too little” and “too dirty” water [
30,
40]. However, acting in advance and introducing these concepts in the planning phase is much more effective than trying to reverse unplanned urban growth. Dense cities can suffer from limited space for action and high costs of adaptation when acting later.
Generally speaking, the design of a Sponge City has the main goal of reducing runoff volumes and peak discharges but its benefits also include: an increase in infiltration as well as pollutant abatement [
29]; a reduction of the economic losses due to flooding; an enhancement of livability and resilience of cities [
40]; and finally, accelerated economic and social sustainable development [
31,
41]. In order to meet the requirement of reducing runoff volumes, various LID solutions can be selected according to their various characteristics [
29]. The choice of an optimal LID scheme must consider environmental benefits, implementation cost of LID facilities, operation performance, and social benefits. All these topics are equally important in decision making for Sponge City construction [
31,
42].
However, assessing the functionality of an LID scheme with distributed actions over the watershed combining effects in space and time is not simple. This is a situation that usually requires the support of mathematical modeling tools. Besides, optimizing LID use inside dense urban environments is crucial for minimizing implementation impacts, including investment costs. A critical point here can be the lack of available data to adequately calibrate mathematical models and increase their confidence.
1.3. Mathematical Modeling
One of the biggest challenges for mathematical flood modeling is the capability to represent the urban environment. The urban environment has a series of specific characteristics where urban structures may interact with the drainage system when it fails leading to flooding. The network of streets, for example, can function as a network of channels, when storm drains or channels overflow; walls can work as weirs; unexpected reservoirs may arise from public squares, basements, and even buildings, in general; flows in the drainage system may be reversed by backwater effects [
43,
44]. It is particularly important to model urban watersheds, coping channels, and storm drains networks with surface flow representation.
Urban hydrological modeling also brings difficulties. Although hydrological modeling can simulate both surface and subsurface processes adequately at a watershed level, most of them are unable to simulate urban flooding accurately [
45]. The superficial processes tend to be intense and fast.
Within this context, the improvement of flood models for simulations of LID methodologies is a current challenge. Kaykhosravi et al. [
46] analyzed the application of 11 flood models in the simulation of LID techniques and showed that none of the selected models constitute a fully integrated environment in which to simulate all LID applications. Different models have different advantages and limitations.
One of the most used open-source tools is the Storm Water Management Mode (SWMM) [
47,
48]. This model presents versatility, relatively low demand of data, no time step limit, and no scale limit [
49]. For these reasons, the SWMM model has been widely used for the simulation of storm drain networks and LID techniques [
24,
50,
51,
52]. However, the SWMM is inaccurate in representing all the peculiarities of flows in urban landscapes; it mainly lacks the representation of superficial flows and the interaction of these flows with urban landscape. This feature places this model as a useful design tool, but it is limited in diagnosing flood patterns (although efficient in showing system local flaws).
In this paper, in addition to the usual modeling choice for representing LID technologies with the SWMM, the mathematical hydrologic-hydrodynamic model called Urban Flow-Cell Model (MODCEL), developed in the Federal University of Rio de Janeiro [
53], was used. It is basically a quasi-2D model [
54,
55] that represents the urban space through homogeneous compartments called cells. Inside each cell, a rainfall–runoff transformation is performed, and each cell has a storage capacity. The first version of a cell model developed in Brazil was built to represent Pantanal Matogrossense, a large marshland in the central-west region of Brazil [
56]. Later, this model was adapted to the urban environment, gaining a series of new facilities. MODCEL proved to be a useful tool when compared to different models [
57] and can be found in detail in Miguez et al. [
44]. Some previous applications of this model can be found in the literature [
21,
58,
59,
60,
61].
It is important to highlight here that these two models will be used complementarily and not for the purposes of comparison. The recognition of their different vocations will provide an envelope of results, aiming to raise confidence in the modeling process of an urban environment where lack of proper data sets is frequent. Many cities do not have fluvial gauges or storm drains monitoring, thus limiting model calibration. Observing the results provided by the drainage network representation of SWMM and the superficial flow representation of MODCEL will allow a wider range of representation capabilities to be covered, offering a more consistent range of results to support decisions regarding flood control design.
This paper intends to offer a framework to address urban flooding in a densely occupied urban watershed, where structural and non-structural measures are combined in a set of best practices to mitigate flood risks, including the remaining residual risks. An essential part of this framework relies on mathematical modeling, since cities represent complex environments that are difficult to interpret without modeling tools and usually demand integrated actions in space and time in order to address and reduce flood risks.
However, the general setup of the framework proposed here starts with the recognition that several cities have incomplete topographical and/or hydrological data for modeling urban flooding. This is a critical situation, since the lack of a proper data set for calibration purposes can provide little confidence in the results. It makes it difficult to be sure about design choices aimed to optimize urban flood solutions. Furthermore, these choices may imply costly adaptation measures in a context limited by the urbanization itself. The higher the uncertainty is, the worse the decision process and the possible consequences will be.
In this context, we propose the combination of two models of different conceptions in a redundant procedure to build an envelope of results, creating a space of confidence. Then, we explore LID measures within the limits imposed by urbanization and, lastly, we introduce a warning system strategy to reduce risks and improve resilience of a system that becomes safer to fail.
The methodological proposal is built using an exploratory case study in Reggio Calabria in southern Italy and is supported by mathematical modeling tools.
It is important to highlight that the watershed used in the case study is prone to flash floods due to morphological and climatic features, and there are no measured data to precisely characterize flooding. The only available information refers to the identification of critical flooding points with approximate flood depths and flooding extensions.
In this way, flood modeling is performed by SWMM and MODCEL, aiming to produce more consistent results (despite limited information for model calibration) by joining the capability to map system failures of SWMM and the surface flow representation and its interaction with urban features of MODCEL. After validating the two models against each other, a systemic diagnosis is produced, and flood risk control alternatives are drawn using the models to offer a range of probable results for the proposed actions.
LID controls are taken as the basis for supporting the structural measures, seeking to increase the watershed naturalness (as much as possible, considering the dense urban occupation) and acting both at the urban area level and at the watershed scale. Non-structural measures complement the structural ones and refer to flood mapping and the development of early warning systems, mainly focusing on the reorganization of city mobility and the definition of safe areas. Complementary non-structural actions help cities to coexist with floods in a more resilient way.
2. Case Study
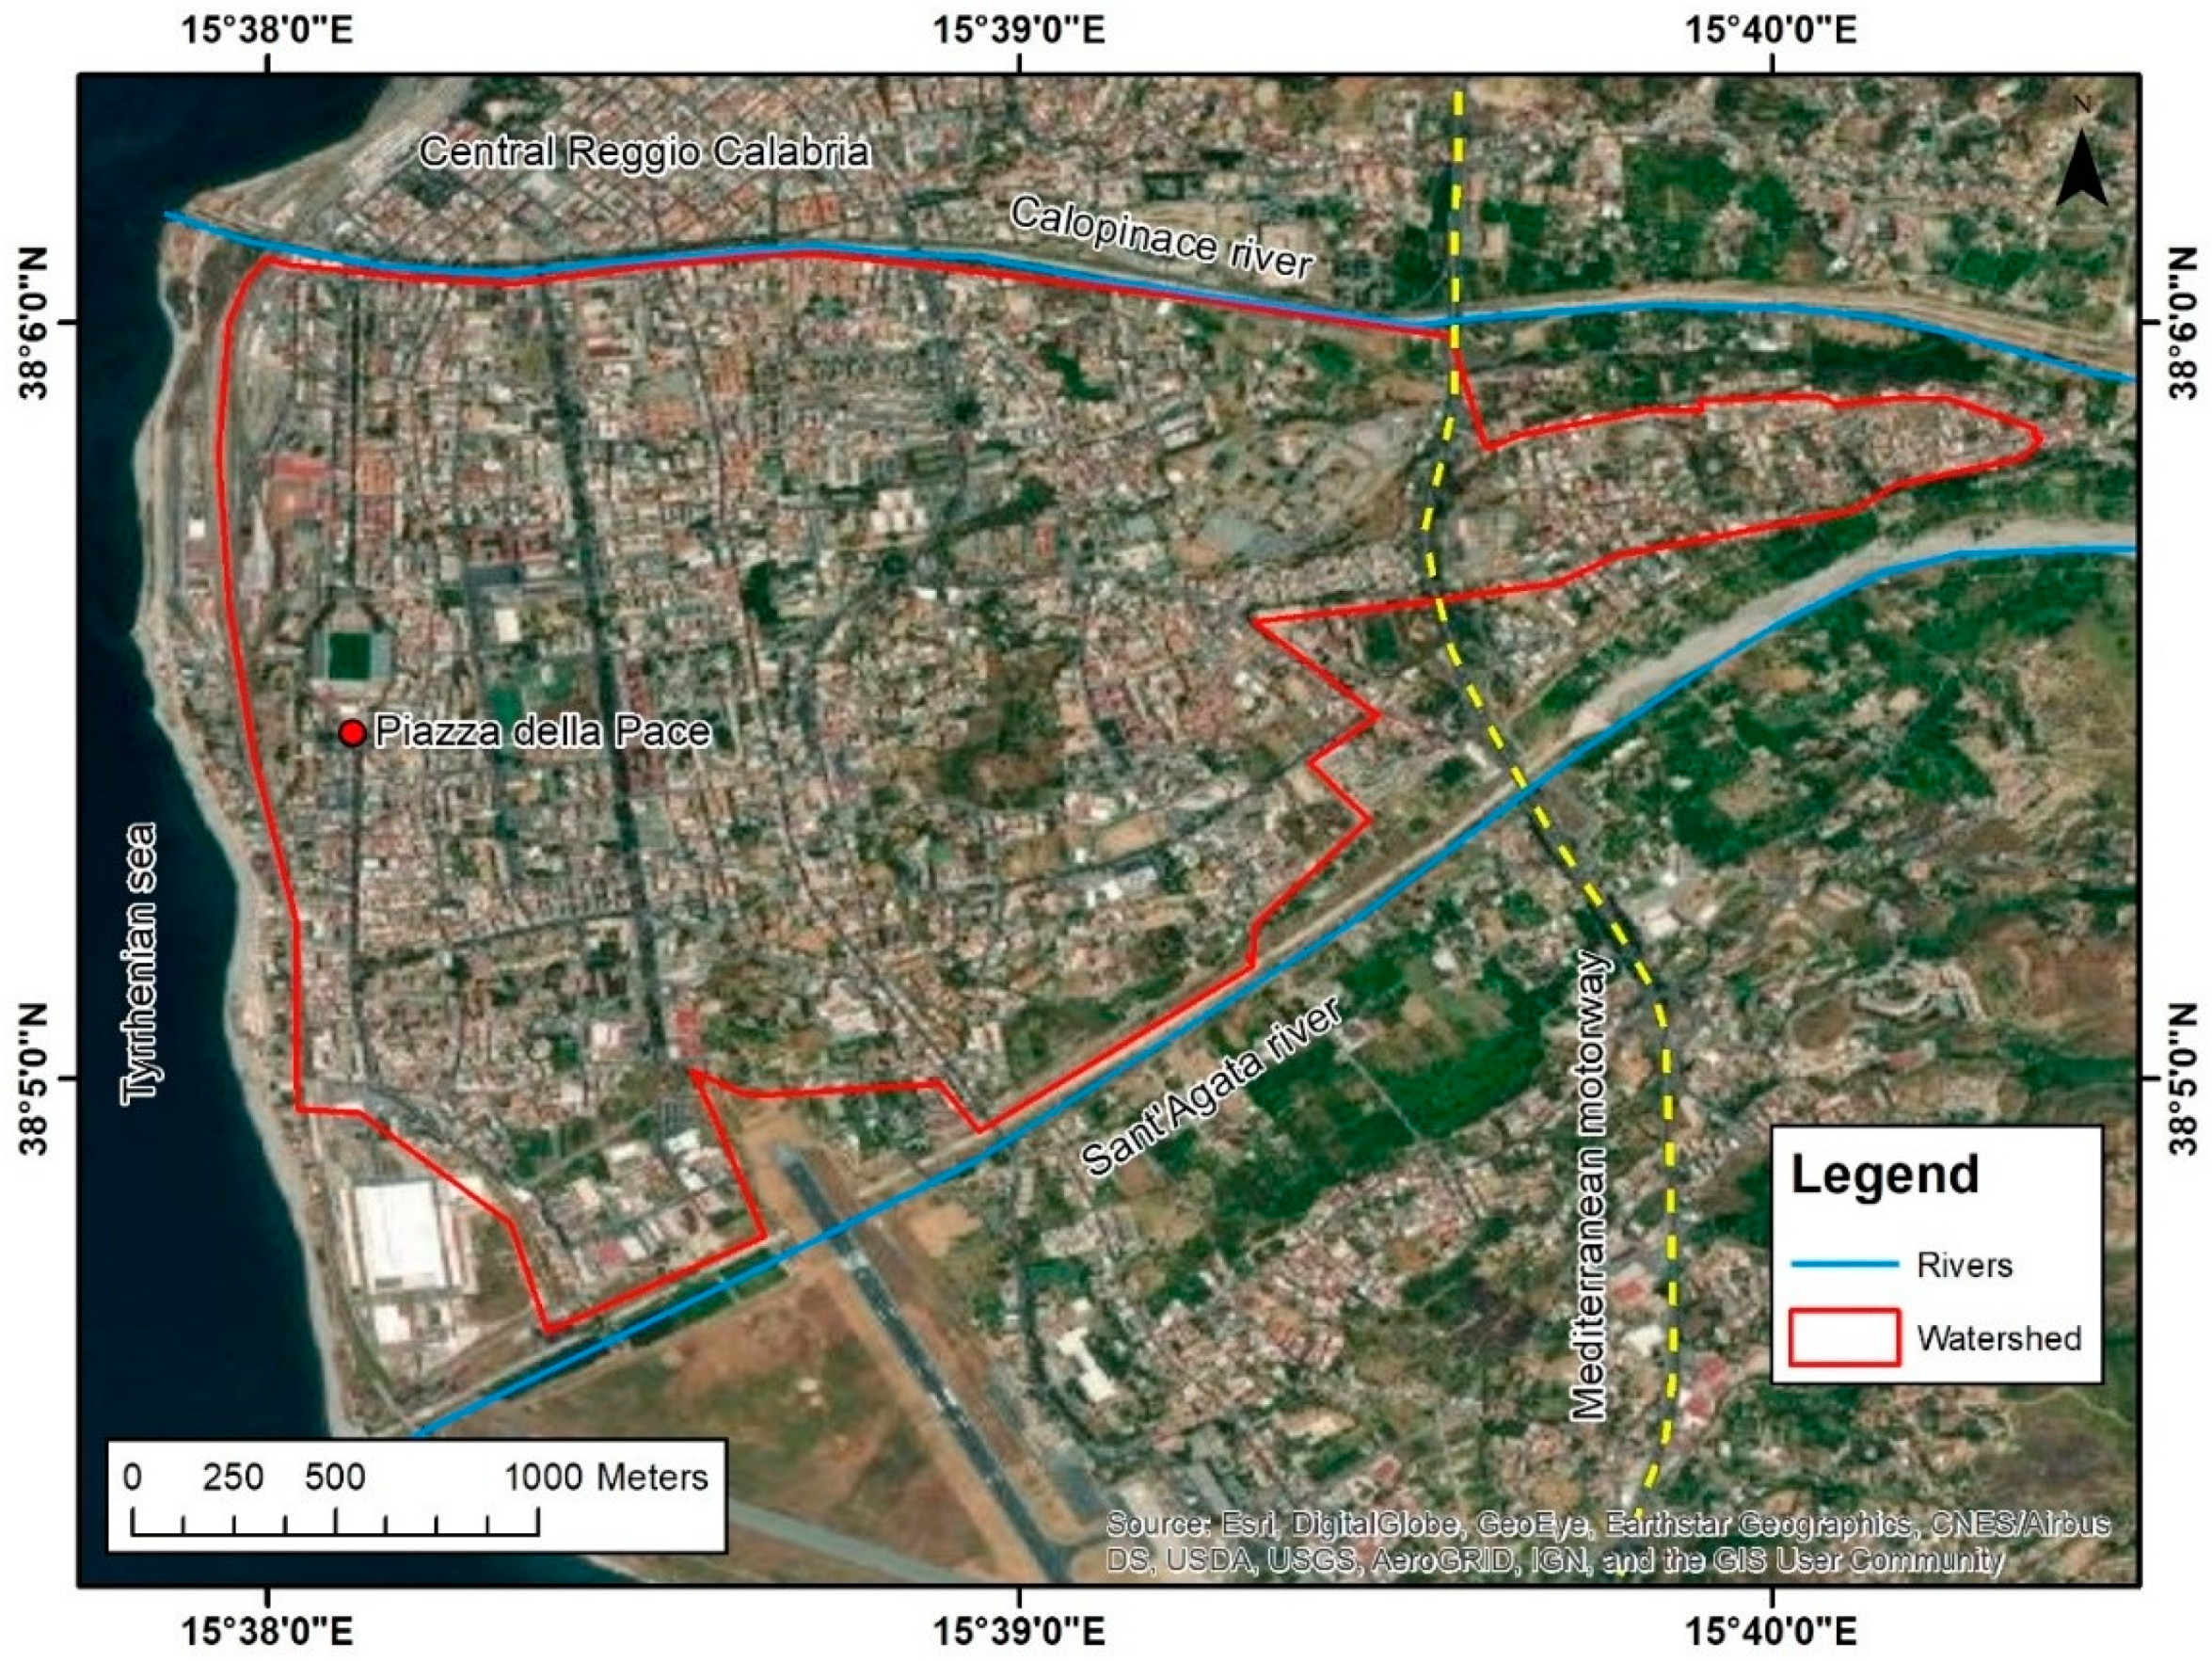
The study area refers to the watershed that converges on Piazza della Pace, a public square that is located 5 km from the city center of Reggio Calabria (southern Italy, 181,447 inhabitants). The entire city is in the Mediterranean climate zone, with about 300 days of sunshine per year, annual average temperature of 17.32 °C, and annual average precipitation of approximately 550 mm [
62].
This square (Piazza della Pace) is located at the absolute elevation of 4 m above mean sea level and between the Calopinace and the Sant’Agata rivers. It marks the outfall of a watershed of approximately 4.70 km
2 that extends to the San Sperato district, 131 m above mean sea level (
Figure 1).
It is interesting to note that the area that limits this watershed has an unusual configuration, since it is located between the riverbanks of two rivers. This conformation results from the local topography modified by characteristics of the built environment, which drain most of the rainwaters to the lower region of the watershed near the sea, where the square is located.
According to [
62], this is an urbanized watershed, with approximately 65% of impervious areas. During severe rainfall events, the watershed suffers from significant surface flows, causing serious flooding problems, especially in Piazza della Pace, near its outfall. According to local people, floods in this square have been occurring frequently for more than two decades.
The region’s minor drainage is obsolete, with superficial flows conveying most of the rain water through the streets [
62]. The rainfall events of 3 September 2010, 6 November 2017, and 22 August 2018 caused the most striking flooding in the region, resulting in three important events in fewer than 10 years.
3. Materials and Methods
In cities that have few formal records of flood events, modeling can be challenging, and it is necessary to establish alternative approaches to gain greater confidence in the process. It is not difficult to know what the critical flooding areas are and to have a local reference for the highest flooding depths. However, without monitoring, it is almost impossible to know how the flooding process develops on the watershed, the flood duration, and the flooding depths outside the critical areas.
Taking into consideration the context of insufficient information, and with the intention of addressing this gap, the use of two models with different vocations can be considered suitable, since the probability of errors in the flooding representation is reduced by the cross-references provided in this process. In this paper, the chosen models are SWMM, which addresses the representation of detailed storm drains, and MODCEL, a quasi-2D model that focuses on surface flow generation and its interactions with urban landscape and drainage systems. The combination of these aspects should provide a range of possible results, increasing confidence in the process and providing better knowledge of watershed functioning.
To increase the reliability of modeling results, the comparison of the flood depths obtained in both models with recorded images of the event provides confidence for forecasts of future scenarios and for proposing structural and/or non-structural interventions. Each model must be representative of the reference information about local flooding, but it is not expected that they offer the same results due to their differing focuses. In this way, the range of modeled results is taken as a possible (and more probable) representation of reality.
In this situation, and using both models again, LID measures are proposed to reduce flooding on the watershed as far as possible (due to urban constraints that can limit a full solution). If the problem is not completely solved, an additional classifying system is proposed to map safe routes, to guarantee people mobility, as well as to support civil defense addressing non-structural aspects for reducing flood risk.
3.1. Framework Assessment and General Procedures to Mitigate Flood Effects
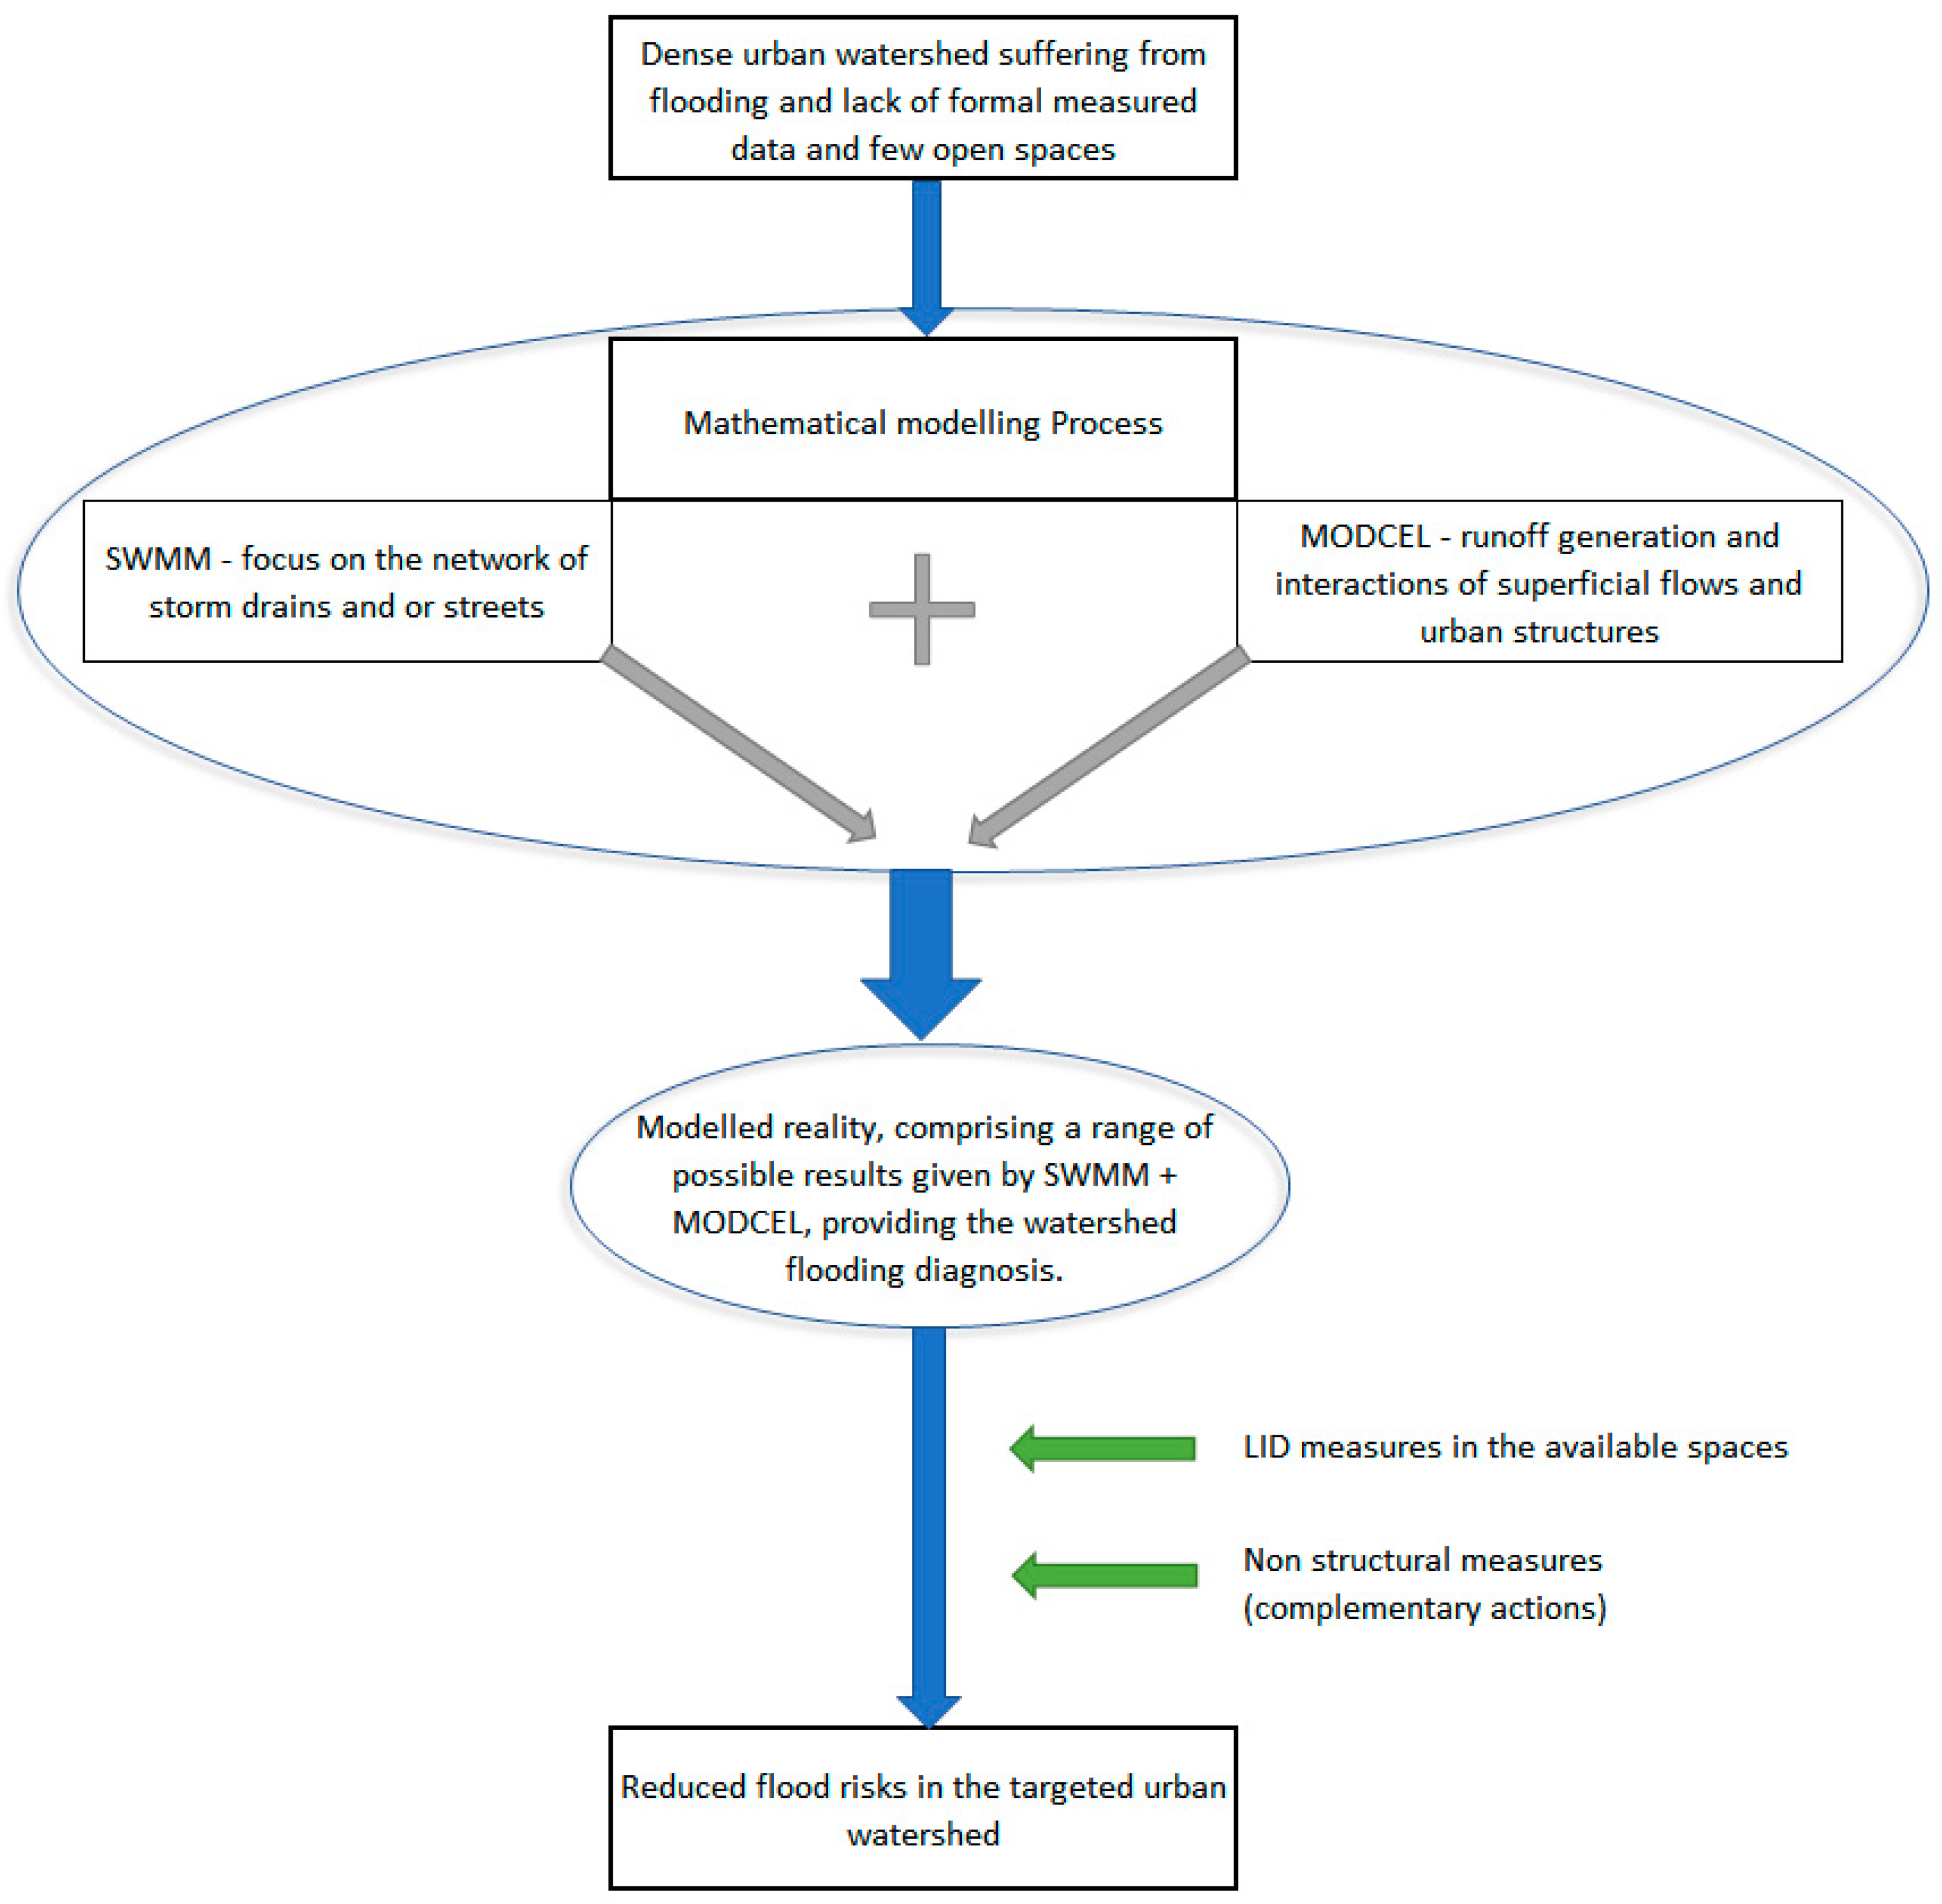
The proposed framework to mitigate flood effects starts by diagnosing the current flood situation over the whole watershed using two mathematical models with distinct vocations. The use of the two models of distinct conceptions to map the same watershed aims to circumvent the lack of formal measured data. By reproducing general patterns observed in the watershed, such as critical areas and the extent of flooding, by means of two different (and complementary) tools, the chance of major errors in the representation of the flooding situation is reduced.
Subsequently, strategies are proposed to deal with flooding problems in a broad way, combining structural LID interventions and non-structural measures. Consolidated cities with dense urban areas have little space for implementing major flood control actions. In this context, distributed LID measures can be useful, although lack of space can still be an important limiting factor, eventually requiring significant and complex adaptation actions on buildings. Therefore, a contingency plan should be considered as a complementary action to avoid greater losses when LID measures are not sufficient (especially for higher return periods events), mainly in terms of early warnings for expected flooding and the definition of alternative escape routes and temporary shelters. In this study, complementarily to the possible LID measures proposed and based on the results of urban flood modeling, a classification of streets is presented in which the transport routes affected by the floods are prioritized on a scale. All this application is developed using the case study of Piazza della Pace in Reggio Calabria as an exploratory case.
Figure 2 schematically shows the proposed framework.
3.2. Hydrological Modeling
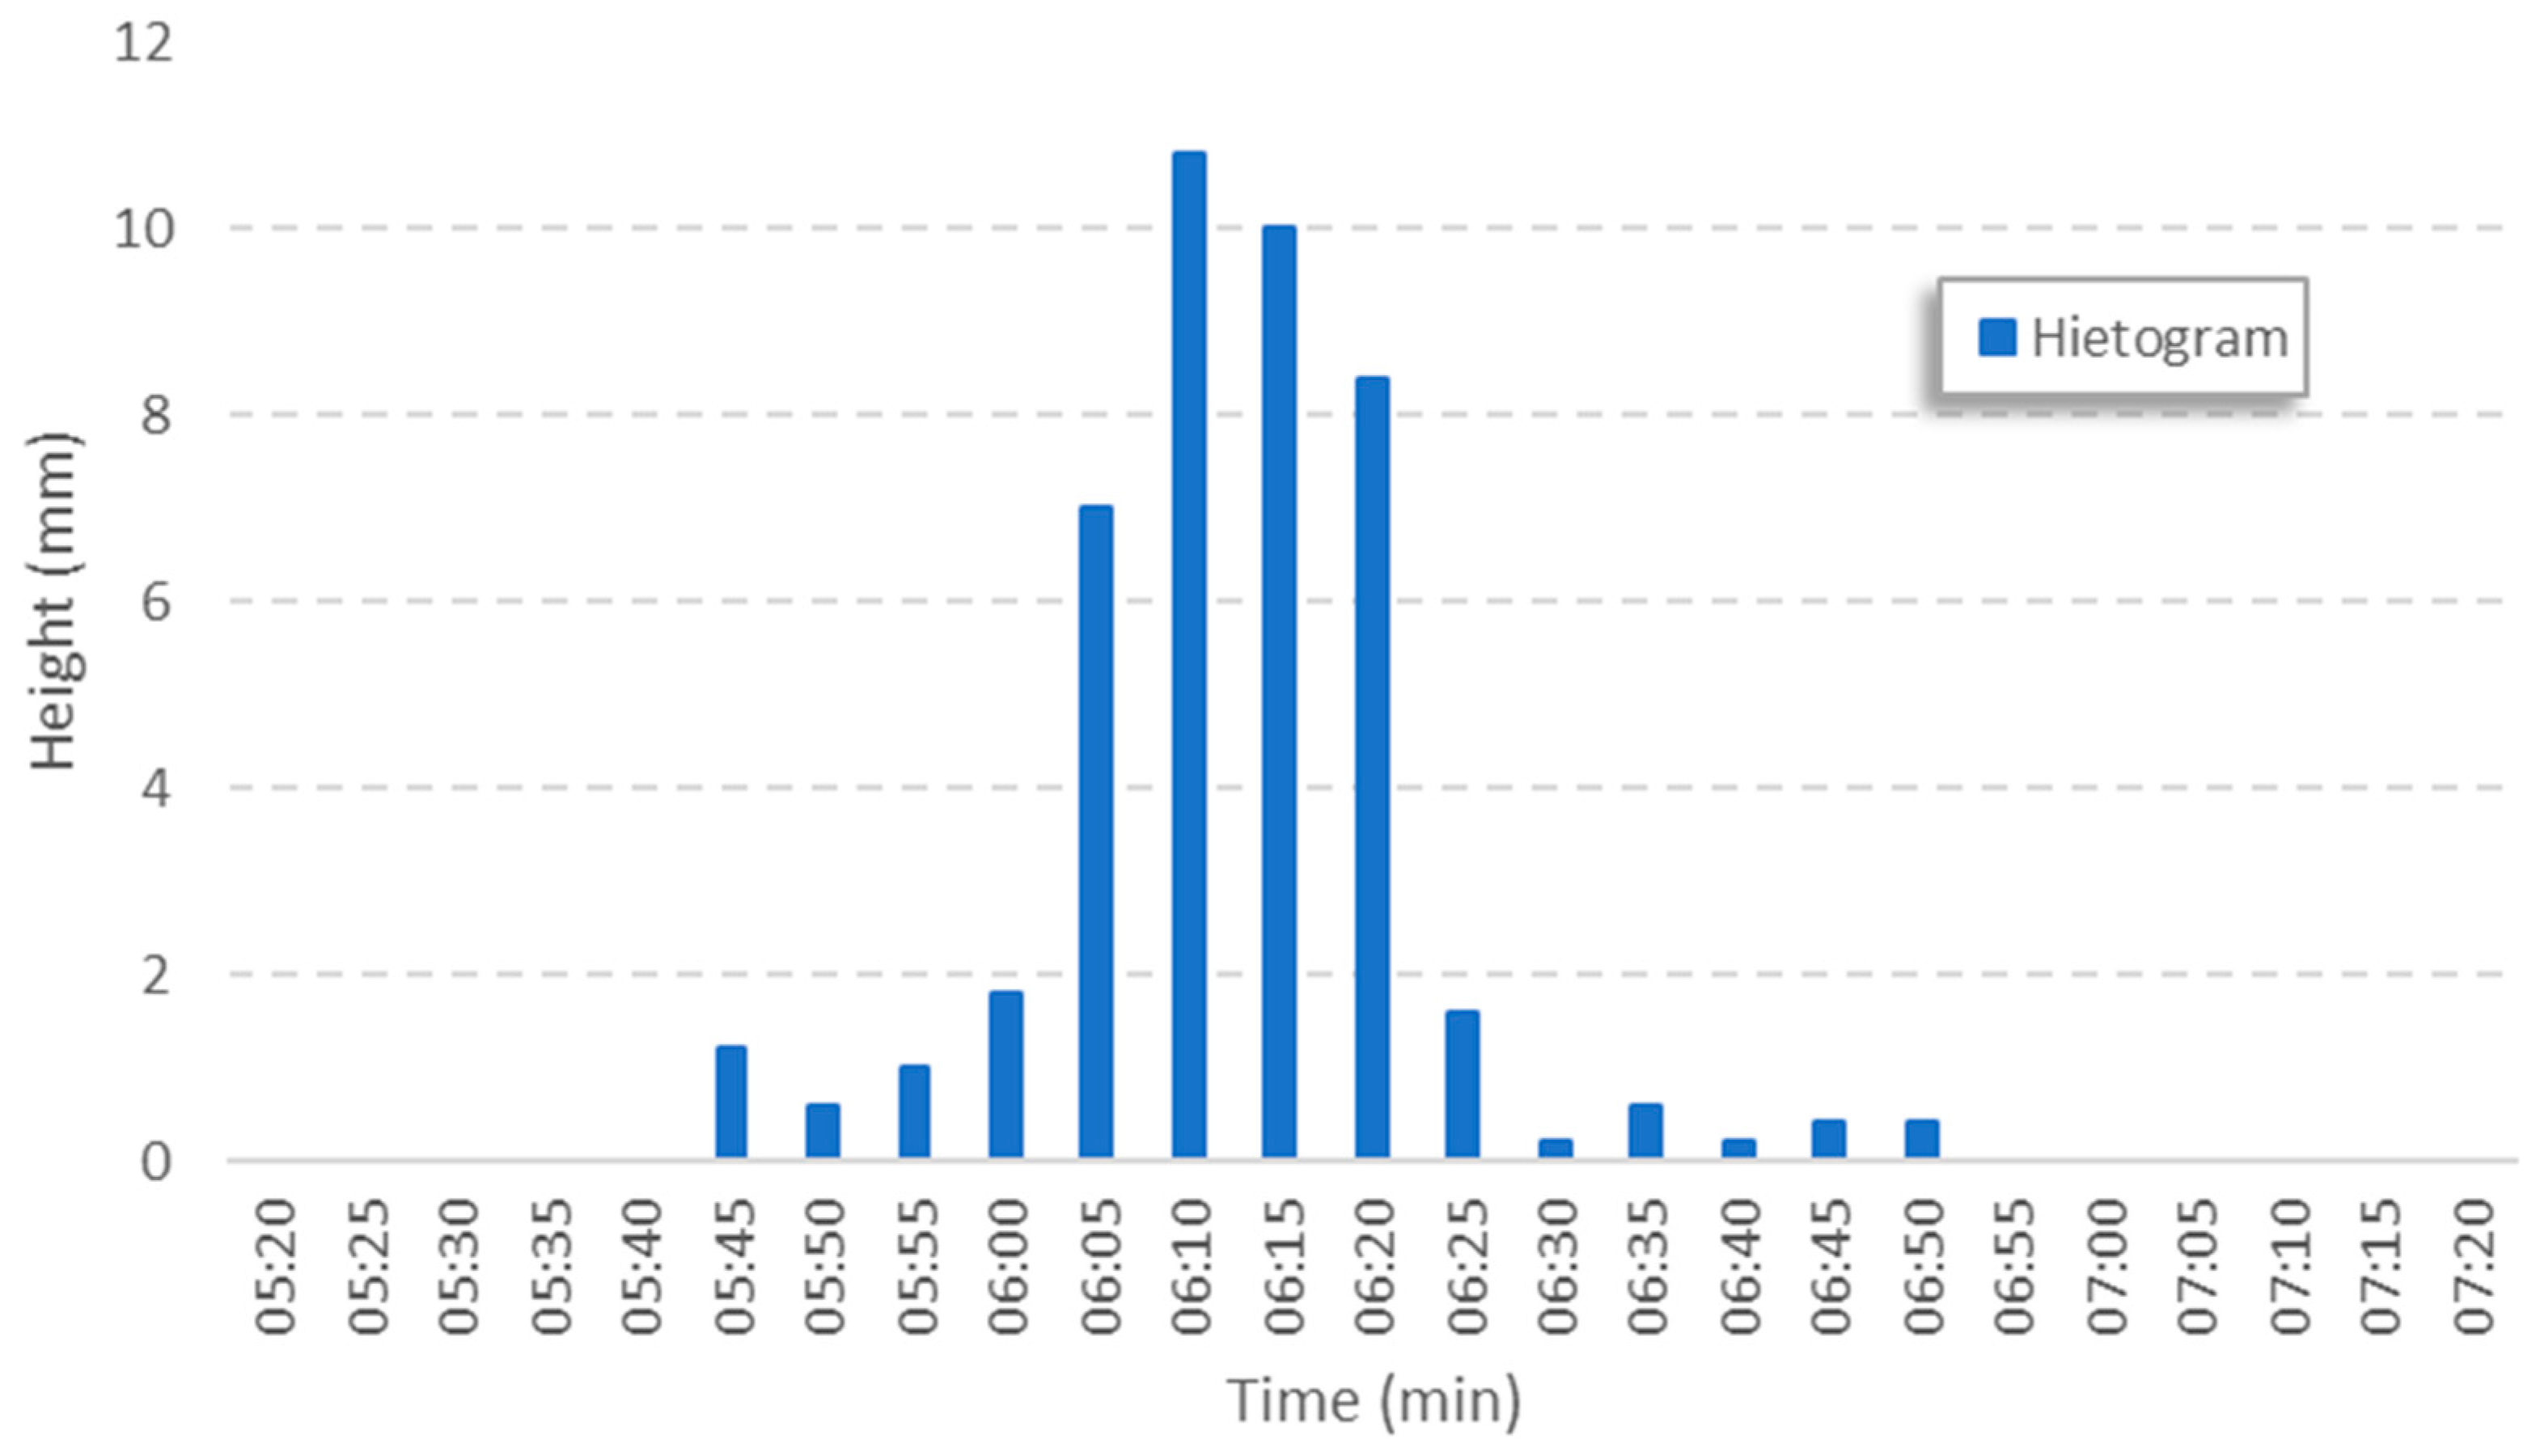
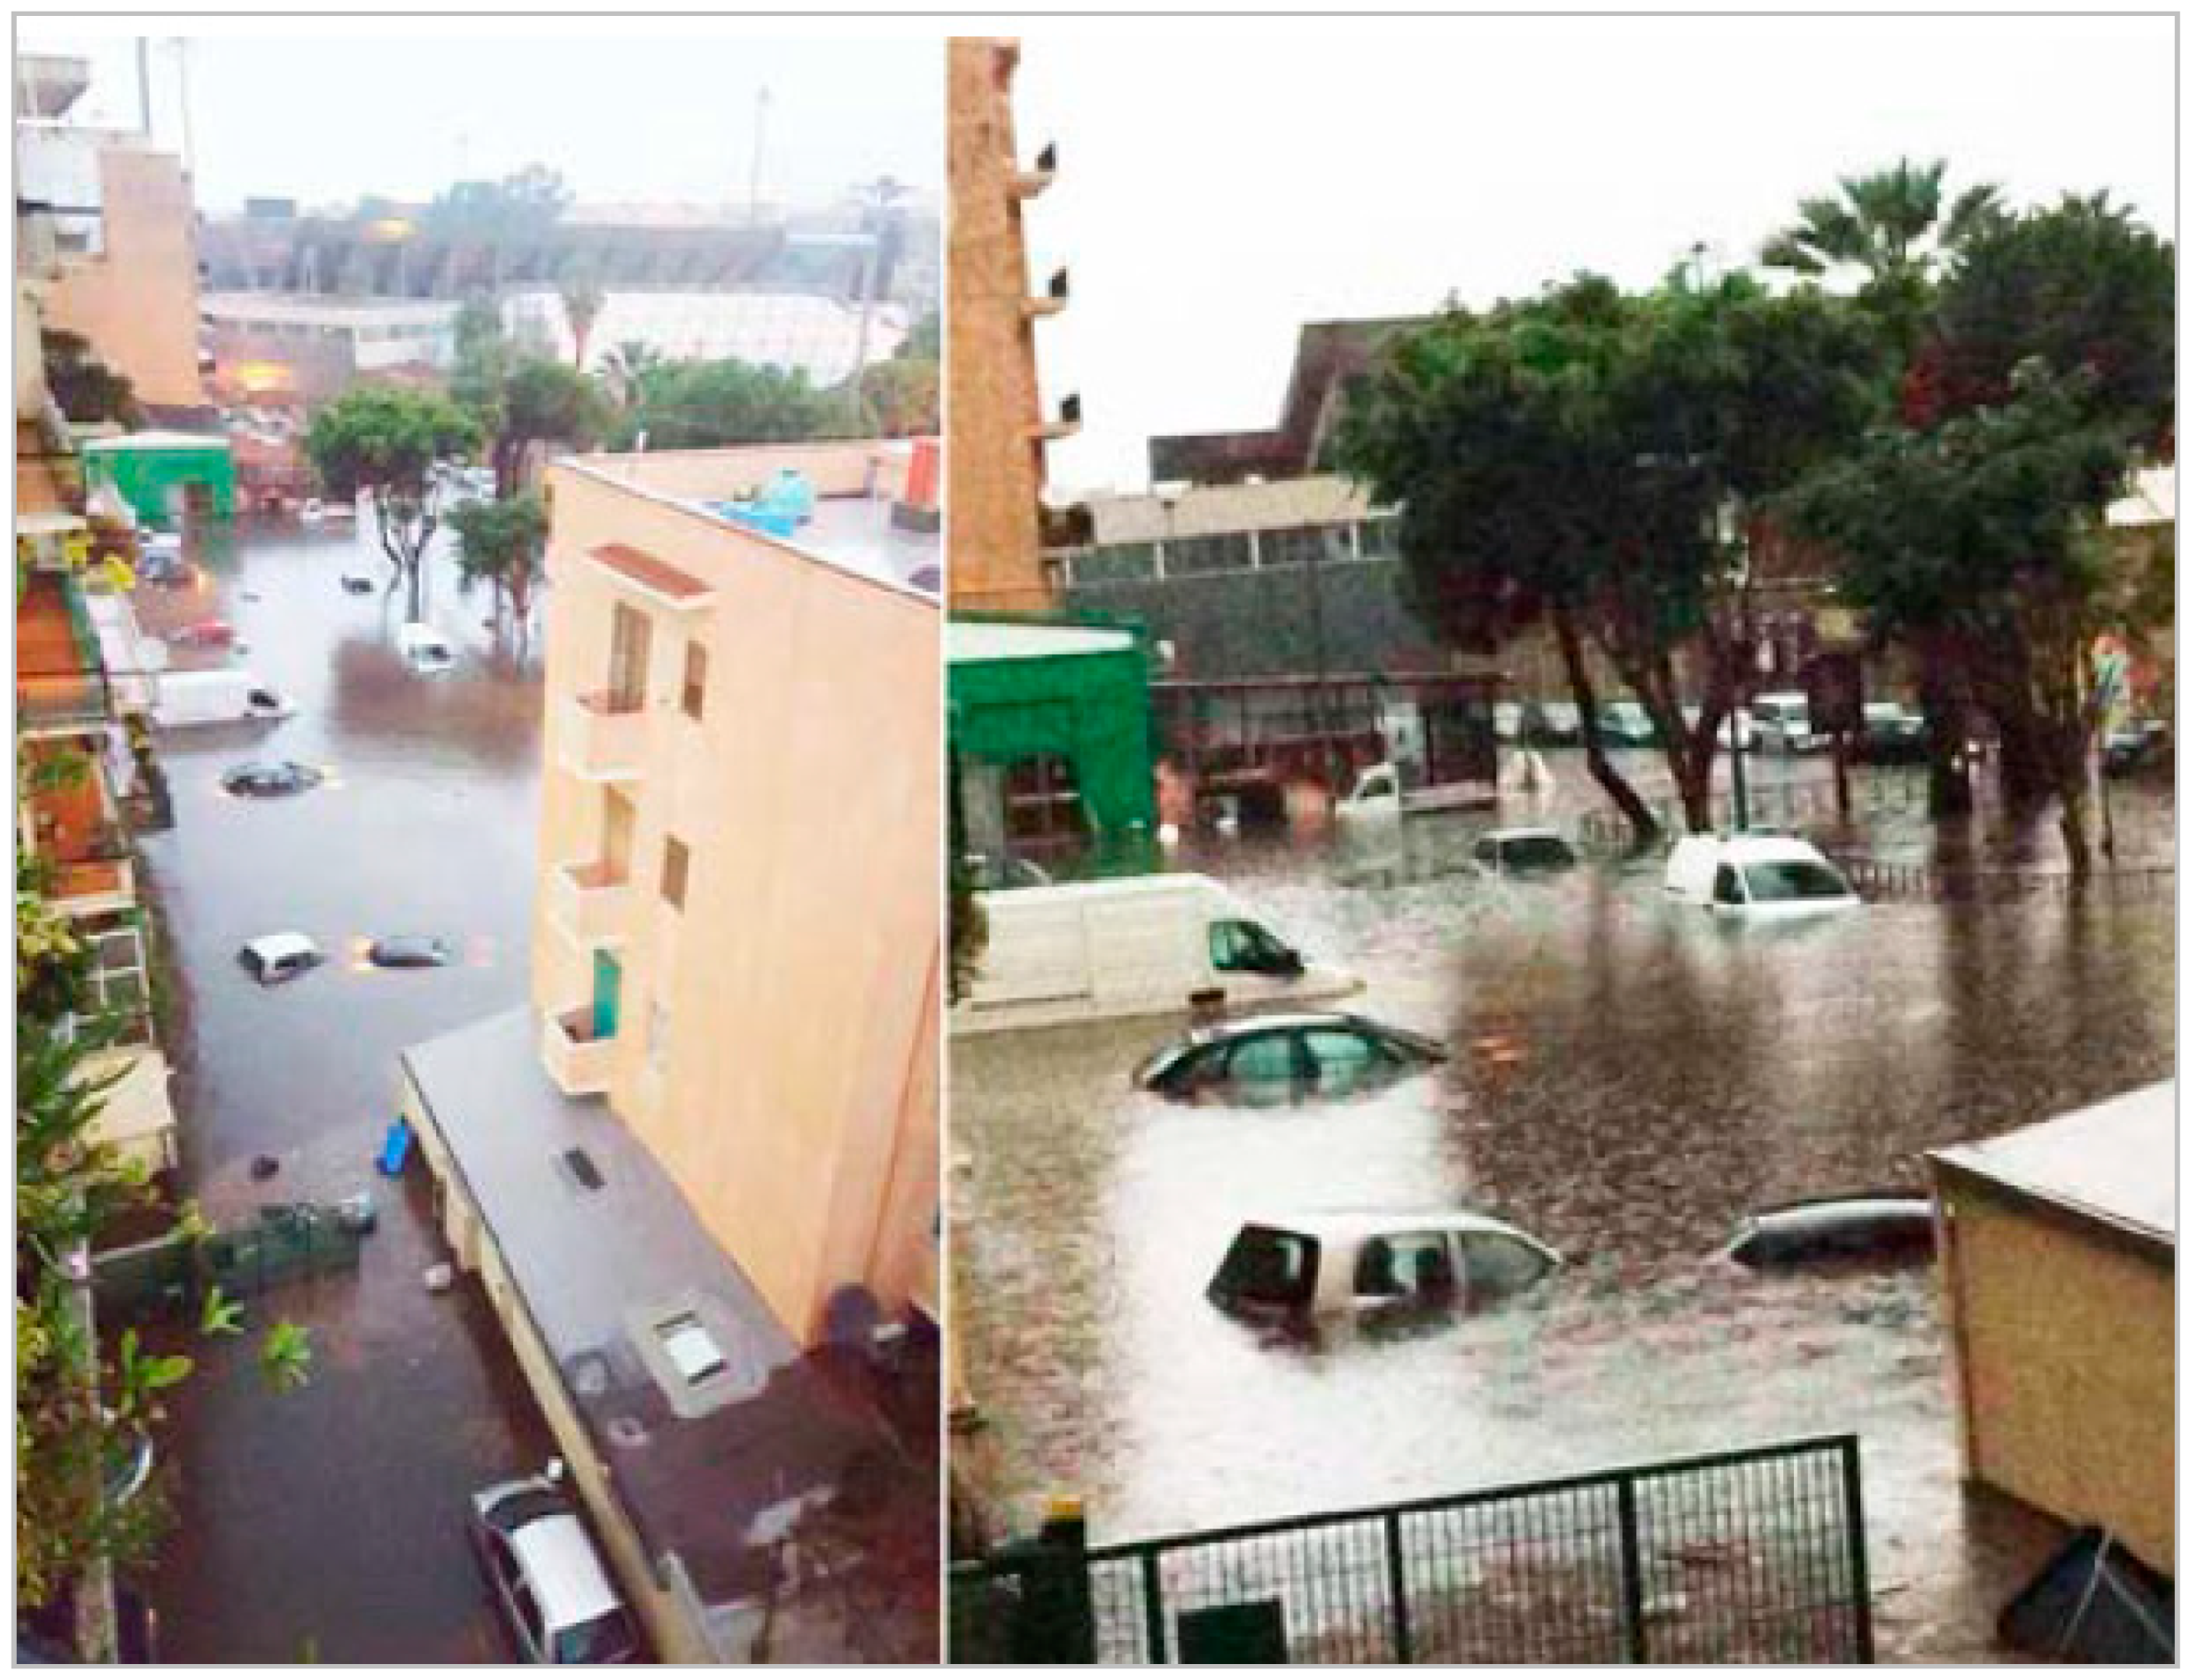
For the present study, the rainfall event chosen to feed both models took place in November 2017, with an average intensity of 50 mm/h and a peak intensity of 132 mm/h (11 mm in 5 min). Its hyetograph is shown in
Figure 3. The heaviest rainfall occurred between 05:00 and 07:00 and caused several flooding points in different parts of the city, its most critical result occurring in Piazza della Pace where water depth was sufficient to cover the parked cars and stop traffic on nearby roads (
Figure 4). The rain data presented are from the Reggio Calabria station (cod. 2450) and were retrieved from Multirisk Functional Centre of the Calabria region (
http://www.cfd.calabria.it/ (accessed on 30 November 2020)) [
62].
3.3. Hydrodynamic Modeling
In this section, both SWMM and MODCEL are presented.
3.3.1. SWMM
The first modeling phase was carried out with SWMM, a dynamic rainfall–runoff open-source software. First, it was necessary to divide the entire catchment area into sub-catchments with homogeneous features.
The spatial analysis tools of Google Earth were used to estimate geometric and altimetric characteristics of the various elements. The images nearer to date of the reference event refer to 15 September 2017, just two months before the flood event. The choice of this cartographic data, among the various choices available (for example, those present in the Open Data sections of the Calabrian and the Italian Geoportals), is linked to the need to identify and represent roads, houses, green areas, etc., which were effectively present during the modeled event. All the other available data were related to years other than 2017.
Historical satellite imagery of Google Earth was analyzed to identify all the elements present in the catchment area, such as roads, houses, green areas etc., and to assign the Manning coefficients values of pervious and impervious areas (0.02 and 0.012 respectively), according to Yen’s classification [
63].
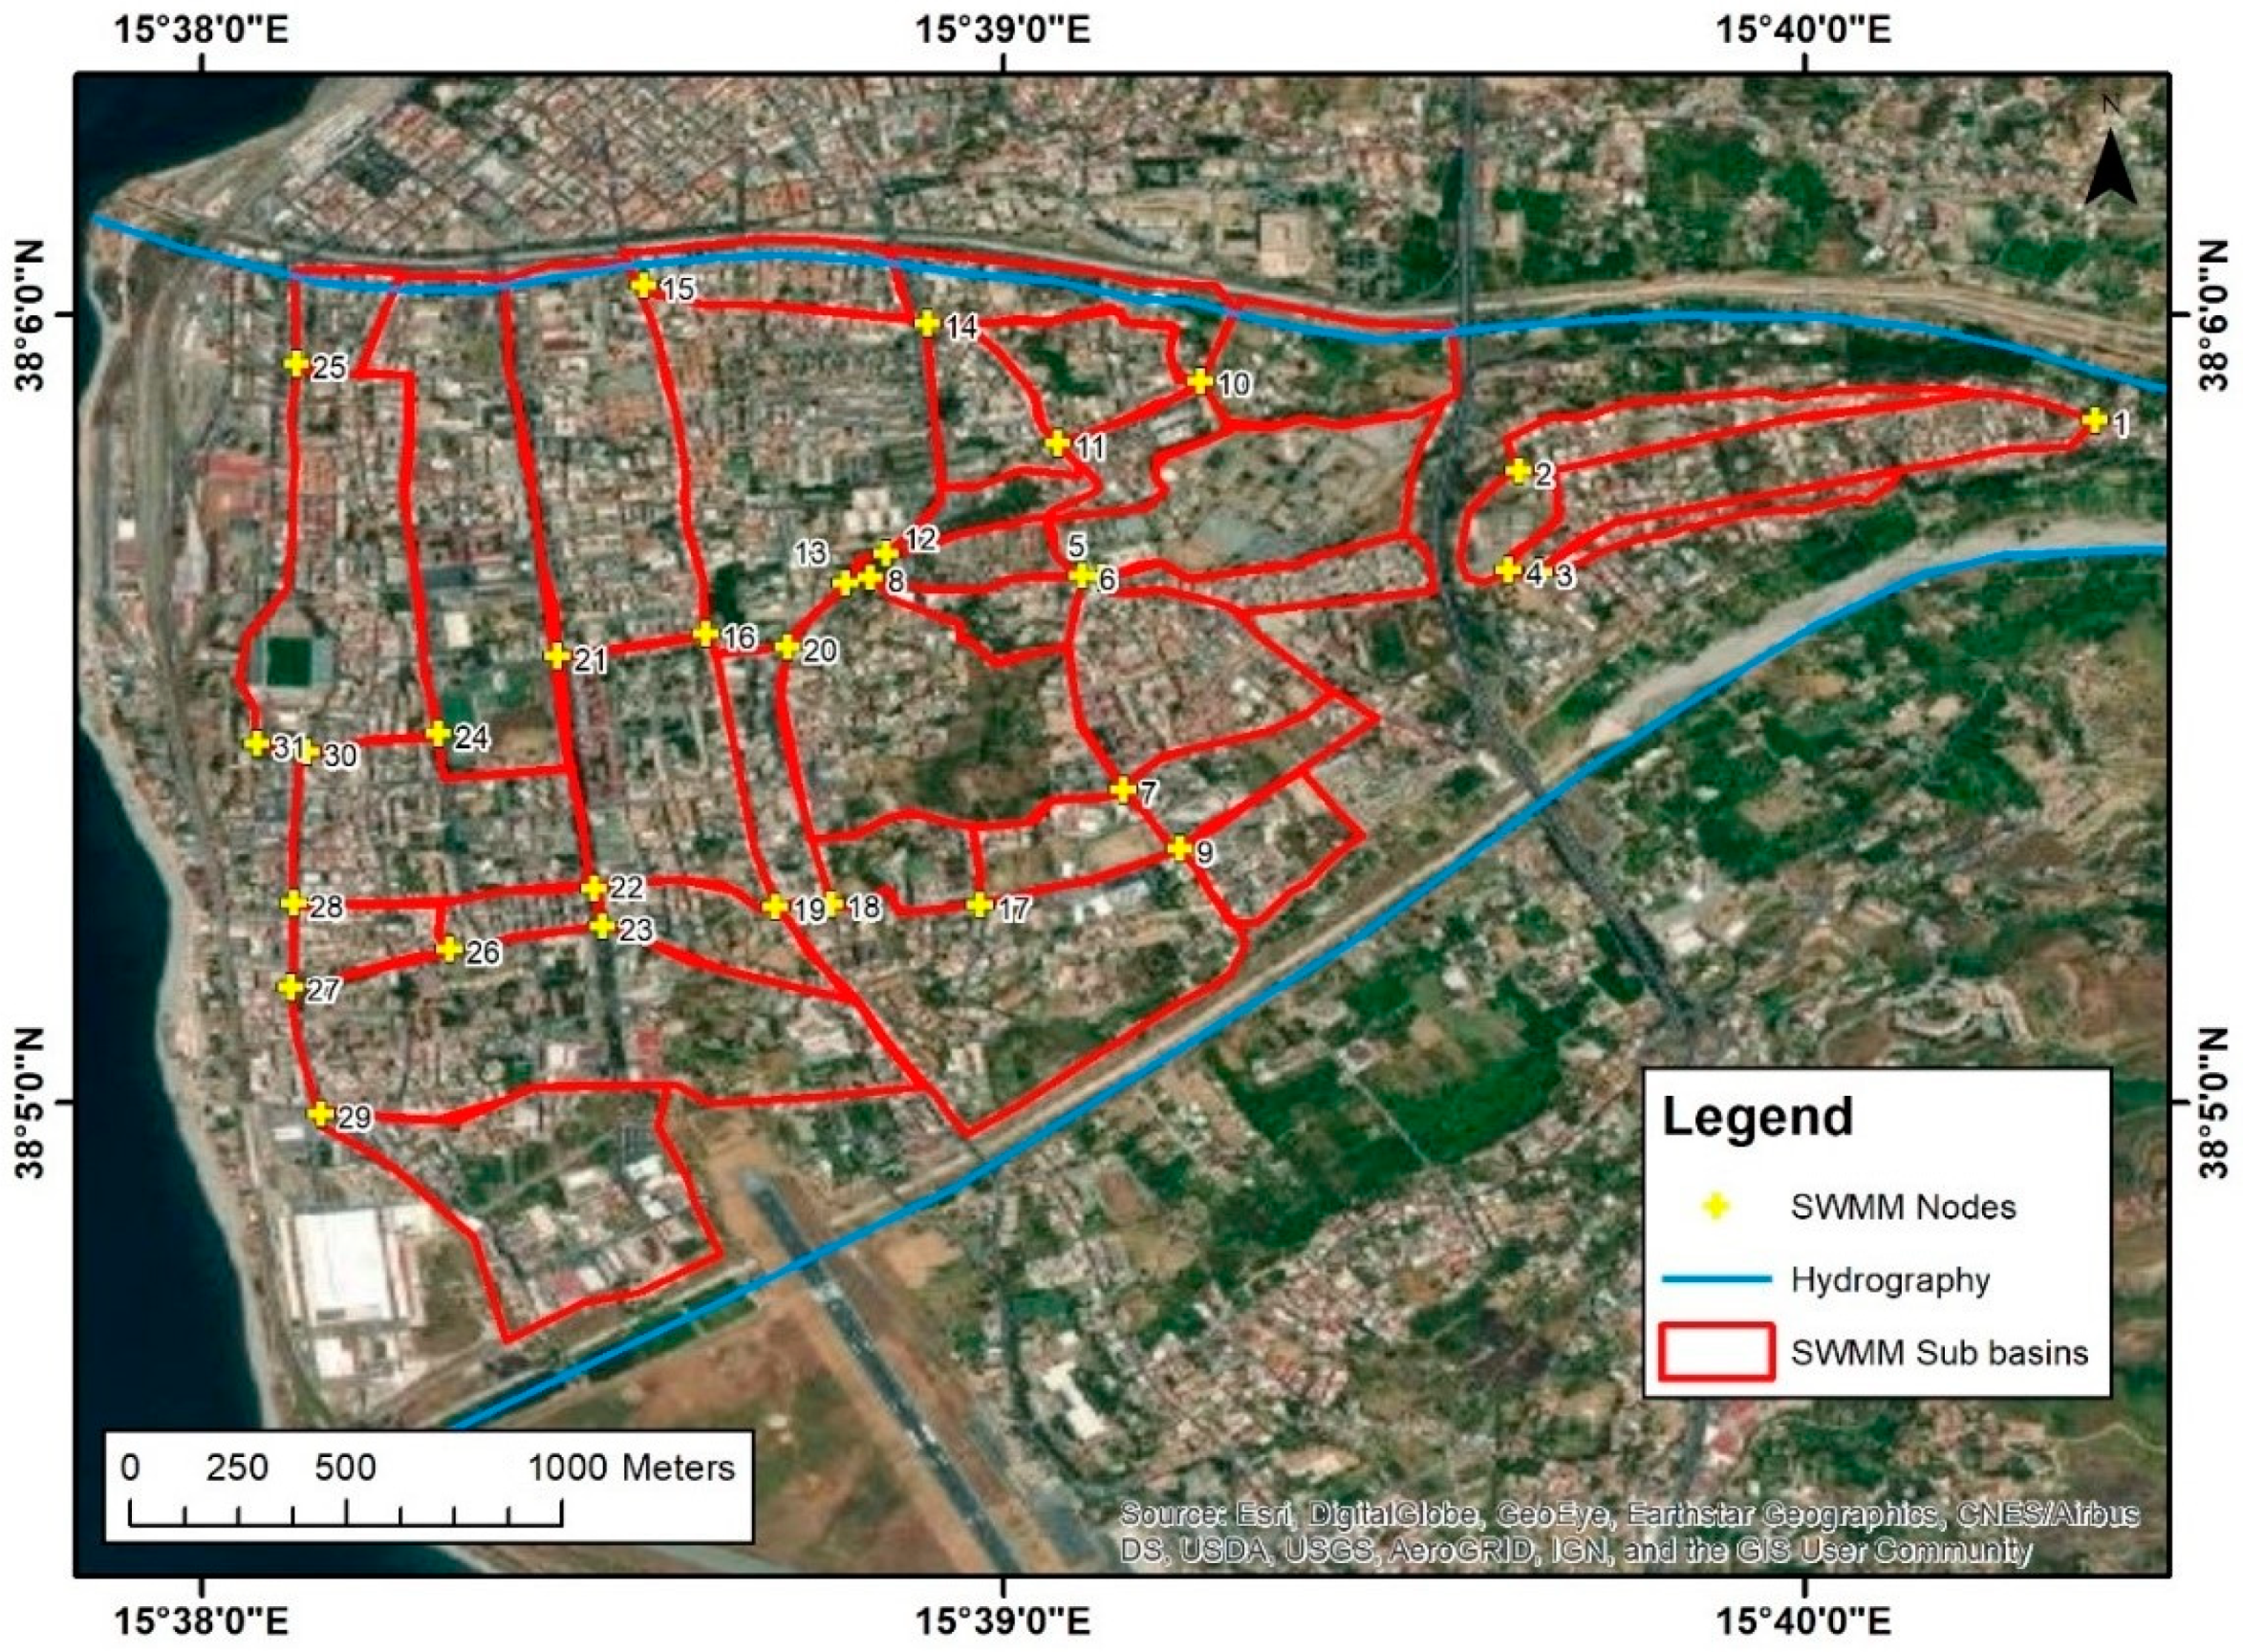
The entire catchment area was divided into 35 subbasins. Furthermore, 29 streets were modeled as open conduits of rectangular shape, connected by 31 nodes which collect the runoff generated by the runoff of the sub-catchments (
Figure 5).
Using a form recommended by Chow [
64] for impermeable areas that consider the flow in the asphalt width of the streets, a Manning coefficient of 0.012 was assigned. The same value was attributed to the ducts, whereas, for permeable areas, Manning coefficient ranging from 0.02 corresponding to dense residential land use and 0.12 corresponding to shrubs and bushes were assigned.
Among the simulation options, the dynamic wave was used as the routing model, while the Horton equation was used as the infiltration model. The model calibration phase was mainly concerned with the estimation of the storage depression depth of the pervious and the impervious areas of each sub-catchment. Indeed, the sensitivity analysis showed that the parameter that most influenced the model was the storage depression depth.
3.3.2. MODCEL
MODCEL is a hydrodynamic model based on the Saint Venant equations. The entire watershed and its elements are represented by different types of cells, and these cells are connected to each other by different types of hydraulic links, forming a mesh of cells. This mesh composes a network that interconnects surface flows, channel flows, and drainage systems [
44]. Rainfall contribution is also computed in each cell.
While the links represent the way that the flow occurs between two cells, the cells act as storage elements where the characteristics of the real surface are represented. It is worth mentioning that, during the division of cells, attention should be paid to some important characteristics, such as: (1) total plain area, where precipitation occurs; (2) storage area, where the mass balance is applied; and (3) land use, which directly influences the generation of runoff. In addition, in the specific case of urban cells, different levels can be established to represent streets, sidewalks, and buildings affecting the available storage capacity and, consequently, the levels of flooding [
44].
In this case study, the study area was divided into 82 cells of the “urbanized floodplain” type. This type of cell represents flows of free surface in a flooded urban plain, linked together by streets that function as channels. Using the land use information, a runoff value was set at 0.75, and a Manning’s coefficient value was set at 0.025 for all urban cells, representing street and sidewalk conditions [
64].
Regarding the connection between cells, the following links were used:
Type P (floodplain flow) was used to connect cells without obstructions in the flow path, flowing in smooth terrains; this was the most frequent link.
Type V (broad crested weir) was used when the water needed to reach a certain level to communicate with the neighboring cell. It was used on two occasions; the first was in the bridge passage, which connects the region upstream of the Autostrada del Mediterraneo (San Sperato) with the region downstream, where the poured water laterally overflowing the bridge sidewalk left the model. The second was as an outlet to model the water that left the study area towards the sea.
3.4. Hydrodynamic Modeling—Prognoses
Considering that the study area is densely urbanized, and heavy structural measures are of difficult implementation, LID measures of small application scale were chosen to reduce part of the recurrent flooding in Piazza della Pace. These measures aim to facilitate the recovery of part of the pre-development water cycle conditions through various strategies and elements that mimic the original water cycle functions, mainly in terms of infiltration and retention [
25].
In this sense, this research proposes three assessment scenarios with different combinations of LID:
- SC1:
green roofs and rainwater reservoirs;
- SC2:
green roofs, rainwater reservoirs, and permeable pavements;
- SC3:
green roofs, rainwater reservoirs, permeable pavements, and new discharge outfall.
Each one of these scenarios was simulated in SWMM and MODCEL, and the response of each LID combination was assessed with respect to the current situation in Piazza della Pace.
3.4.1. LID Simulation in SWMM
Among the features of SWMM, there is a tool for modeling the presence of LIDs. Thus, two different scenarios were analyzed to reduce the flooding in Piazza della Pace through low environmental impact interventions. The first scenario concerned the insertion of green roofs and rainwater reservoirs (called “Rain Barrel” on SWMM), while the second scenario also included permeable pavements along the main artificial stream. The choice of the location of the LID interventions and the definition of the related geometric characteristics was always carried out by analyzing the satellite images of Google Earth. In addition, for the green roofs, it was necessary to define the soil and the grassy surface thickness and the properties of the drainage material. For the rainwater reservoirs, it was necessary to define the height and the geometry of the drains, whereas, for the permeable pavements, it was necessary to define the thickness and the roughness of the pavement and the soil layers and the geometry of the drains.
Finally, it was considered that the whole area of green roof per cell was equivalent to 80% of the impermeable area of that cell, while, for the permeable pavement, that percentage corresponded to 20%.
3.4.2. LID Simulation in MODCEL
Unlike SWMM, MODCEL does not have specific tools for directly incorporating LID in the modeling process. However, MODCEL has all necessary types of cells and links to simulate LID structures by combining these elements.
Thus, for modeling green roofs and permeable pavements measures, the cell type was changed from “urbanized floodplain” to “reservoir”. This new type of cell has a reservoir attached to the surface of urban plain areas. Thus, for a given rain event, these reservoirs intercept part of the rain falling on the cell and accumulate water up to its maximum operational capacity. When this capacity is exceeded, water pours into the plain area.
To apply this methodology, it is necessary to determine the height of each reservoir and the number of reservoirs per cell. These reservoirs are associated with the urban parcels of a region.
It was considered that the whole area of green roof per cell was equivalent to 80% of the impermeable area of that cell, while, for the permeable pavement, that percentage corresponded to 20%. Aiming to determine the number of reservoirs per cell, the total area of each one of these two LID measures was divided by 200 m², this being equivalent to the average area of a building roof. The free height of the reservoir adopted for both LID measures was the same value of 8 cm, corresponding to the void spaces in the soil supporting green roofs or gravel reservoir beneath permeable pavements.
Specifically, for the green roof measure, it was also considered that part of the rain falling on it would be intercepted by a canopy that can absorb up to 14 mm of rainfall.
Finally, the rainwater reservoirs were determined to receive 20% of total impermeable area of each cell. For the simulation of this measure, it was decided to reduce the runoff coefficient according to Equation (1). This reduction had the effect of removing all the water that fell over the area of the reservoirs.
where:
runoffred is the reduced runoff;
A0 is the total area of each cell;
Aimp is the impermeable area of each cell.
To increase the reduction of the flooding depth in Piazza della Pace, a new discharge system was also simulated. This measure was represented as a system that captured the water from the Piazza and took it into two manholes. After this, the water flowed towards the sea in a storm pipe with 2.5 m in diameter and 300 m in length.
3.5. Flood Impacts on Road Transport
After assessing the efficiency of the LID measures and determining the modified flooding map, non-structural measures should be implemented to serve as the basis for contingency plans. In a contingency plan, there should be a definition of immediate actions to respond to the disaster. Its main objective is to help the affected population by defining actions that aim to restore the conditions of security and essential services through identification, mapping, and monitoring of local threats and vulnerabilities.
Flooding has the potential to cause severe impact on the daily operations of cities and endanger the safety of people. This kind of event is the predominant cause of weather-related disruption to the transport sector and is particularly acute on the road network in urban areas [
65].
A flood hazard assessment that aims to determine alternative mobility routes must consider a comparison between the different routes and the interaction of their urbanization patterns and their hydrological characteristics. The most common approaches to assess the impact of flooding on transport disruption do not capture the complexity of interactions between flood hazard and transport system. Normally, they assume that a road is either “open” or “closed”. However, flooding on a road does not necessarily preclude people from driving along it. To change from a binary view of a flooded road being considered “open” or “closed”, a relationship between the flood depths and the disruption of the road transport system can be established [
66].
In this context, a flood hazard scale indicator for urban mobility was developed based on the flood depths, as shown in
Table 1.
This classification was adapted from [
66], who proposed a depth break function for road transport. According to the authors, flood depths greater than 15 cm may be sufficient to stall a small car, whereas four-wheel drive (4WD) or off-road vehicles can safely drive through water depths up to 45 cm.
In this sense, the flood hazard scale indicator for urban mobility presented considered that streets with flooding depth smaller than 20 cm represented “very low hazard” to the urban mobility. Flooding depth between 20 and 30 cm represented a “low hazard” able to stall people and small cars. Flooding depth between 40 and 60 cm represented a “high hazard” able to stall 4WD and off-road vehicles. In the worst case, with flooding depth greater than 60 cm (“very high hazard”), it can be considered that the traffic on the road is closed. With the assessment of flood results obtained by both models, the mapping of the effect of flooding on the road network could be accomplished. Through the classification of streets in the current scenario and in the best project scenario, it was possible to identify where the disruption of road transport occurred and establish a scale for prioritizing transport routes. In this sense, this map could be used to support the definition of safe escape routes and increase resilience when structural measures failed, and residual risks took place.
4. Results
In this section, the results regarding the diagnosis and the prognosis of the watershed of Piazza della Pace are presented for each of the models in
Section 4.1 and
Section 4.2. The result obtained for the possible impact of floods on the transport system is presented in
Section 4.3.
4.1. SWMM
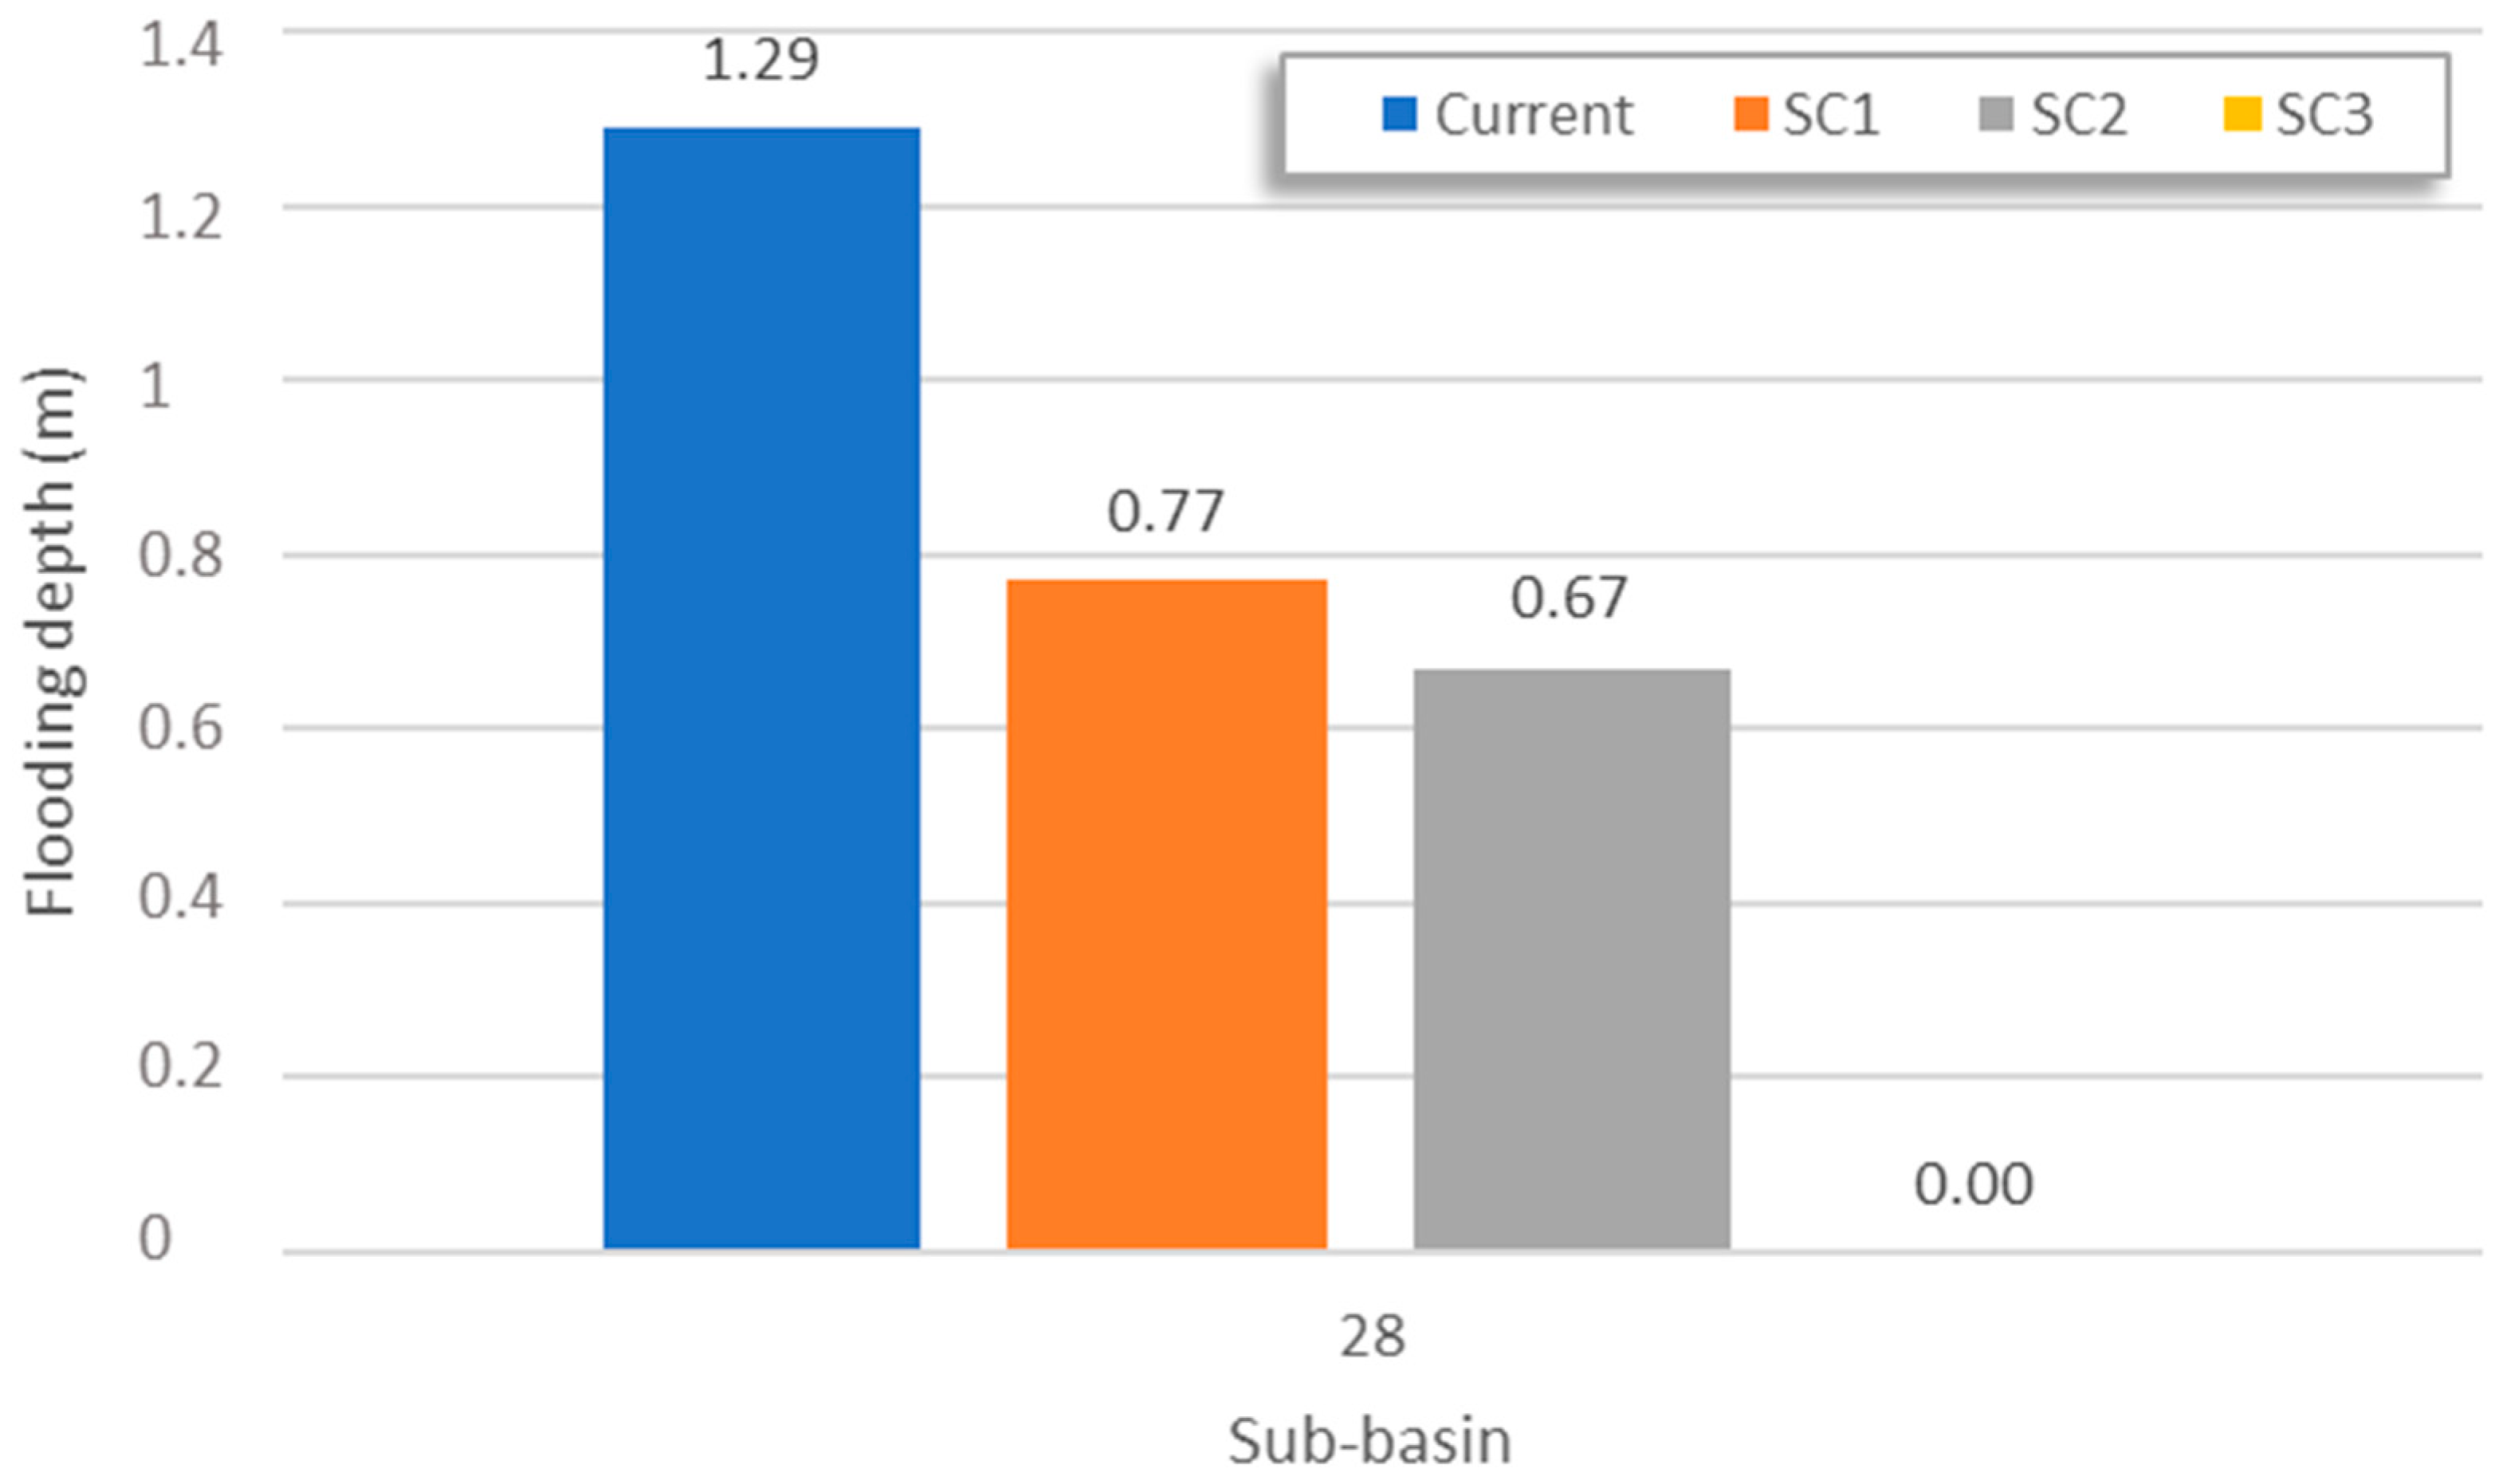
The application of SWMM showed flooding results between 0.1 m and 0.4 m in various subbasins, while water depth in the nodes near Piazza della Pace reached values close to or greater than one meter. Piazza della Pace itself (corresponding to subbasin number 28) was flooded in the model by about 1.3 m of rainwaters. When simulating the proposed scenarios (SC1, SC2, and SC3), the flooding heights in Piazza della Pace reduced significantly in the first two LID scenarios and were completely mitigated with the complementary discharge capacity added to the system outfall. These results can be seen in
Figure 6.
It can be observed that, in scenario SC1, corresponding to the green roofs and the rainwater reservoirs, there was a reduction of 40% in the flooding levels in the Piazza della Pace subbasin. It should be noted that the addition of permeable pavements (in Scenario SC2) resulted in an additional 8% improvement in water levels reduction. In the Scenario SC3, with the addition of a new discharge system to increase the hydraulic capacity of the outfall to the sea, flooding related to the simulated event was eliminated. Thus, there was an absolute reduction in flooding in the region.
4.2. MODCEL
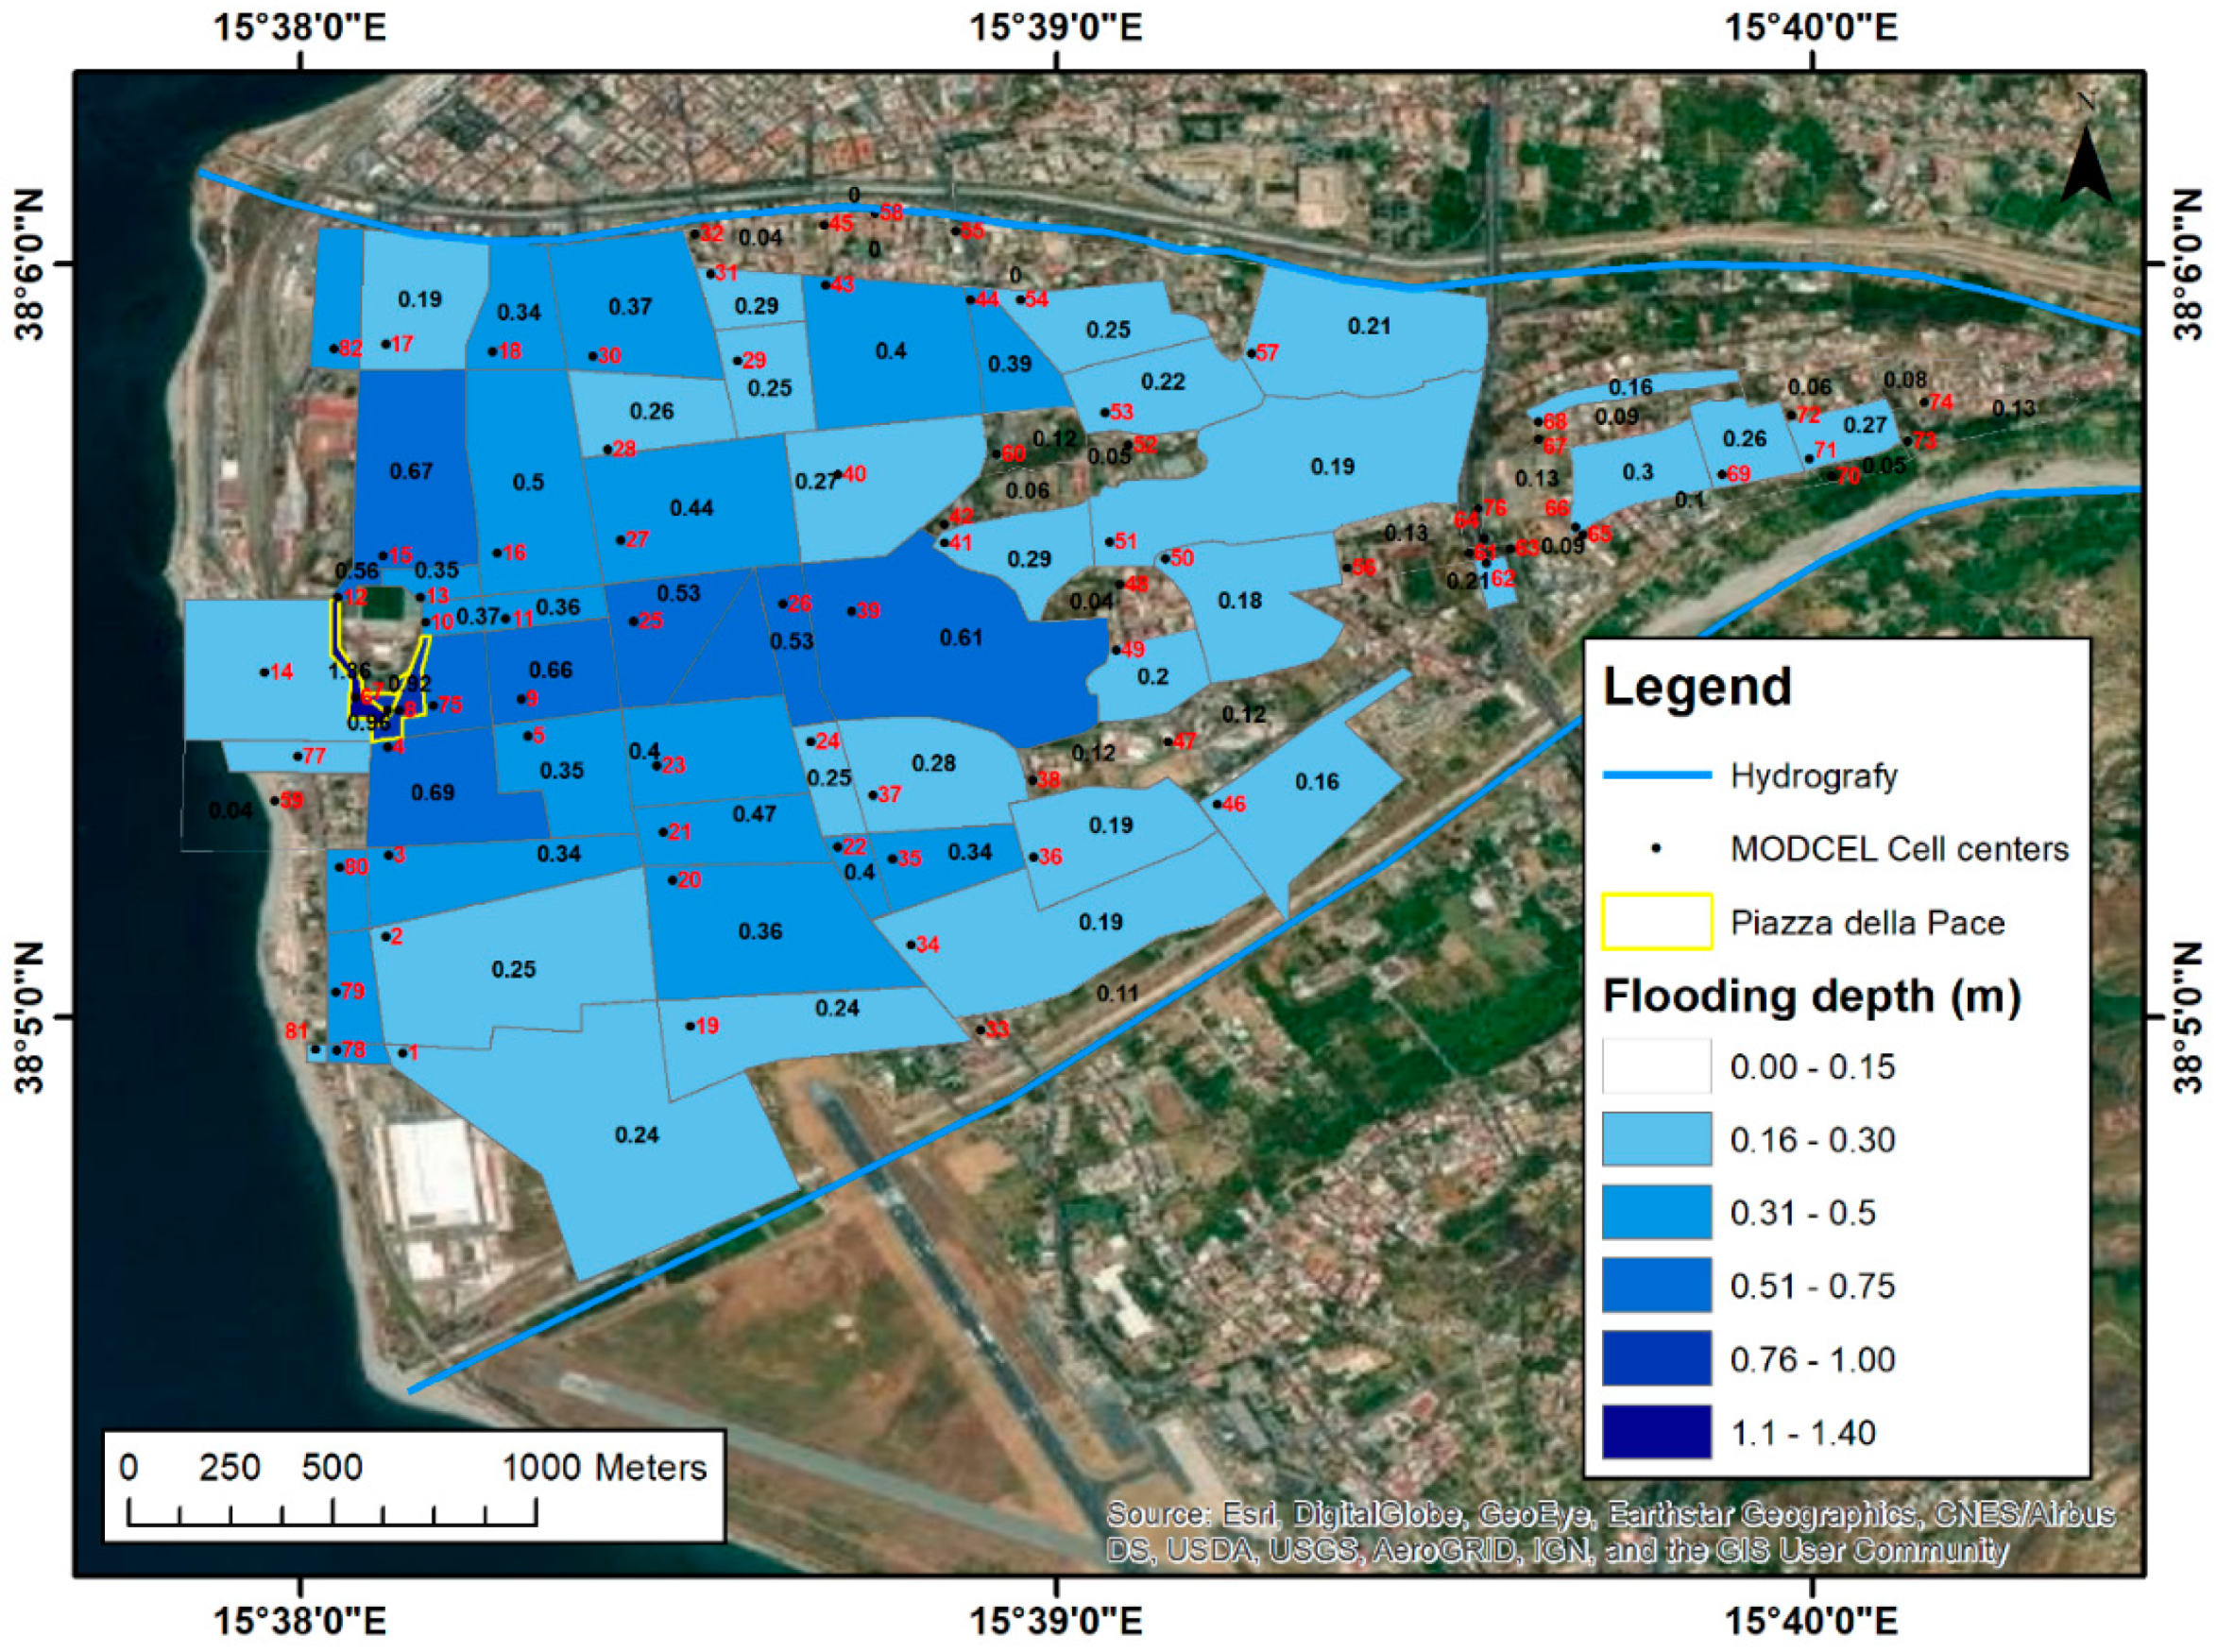
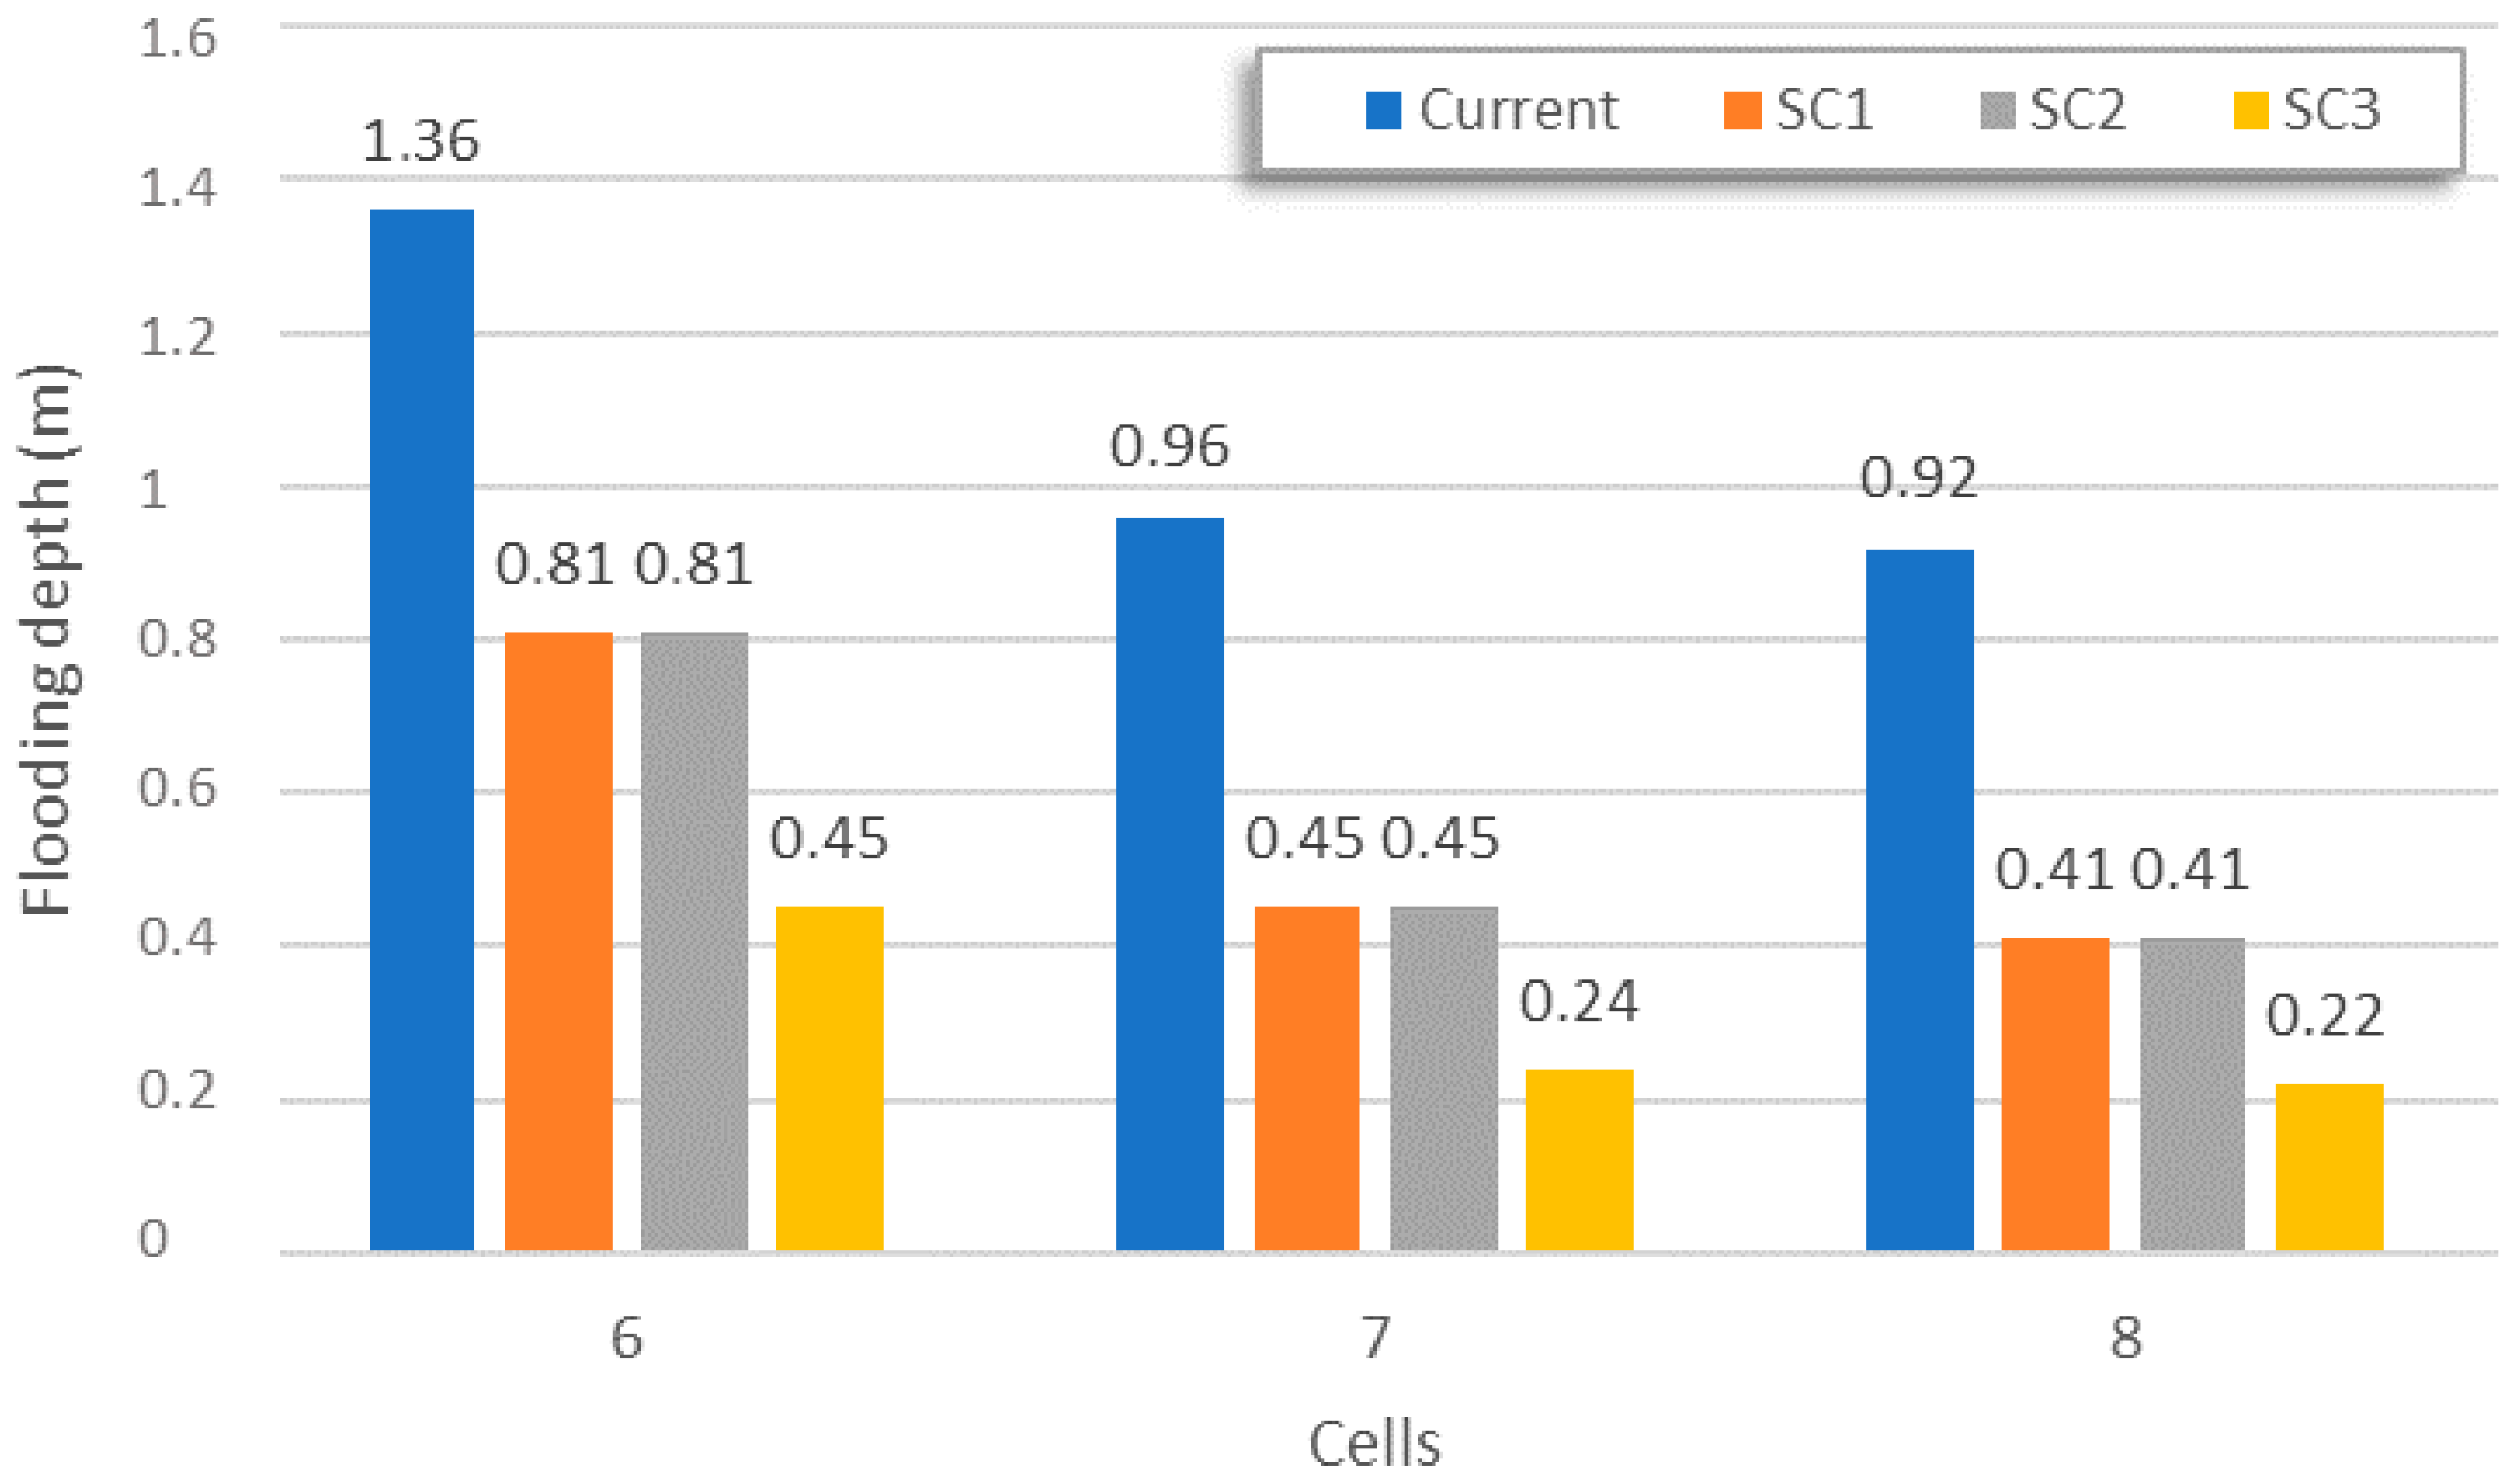
The flooding depths obtained in vicinity of Piazza della Pace showed an approximate value of 1 m, with the greatest water depth reaching 1.36 m (cells 6, 7, and 8 shown in
Figure 5), and they were closely related to the water depths observed by the available images of the real event. These results were also similar to those obtained by the SWMM simulation and by Occhiuto [
57]. The number of each modeled cell in the watershed and the respective water depth ranges can be observed in
Figure 7.
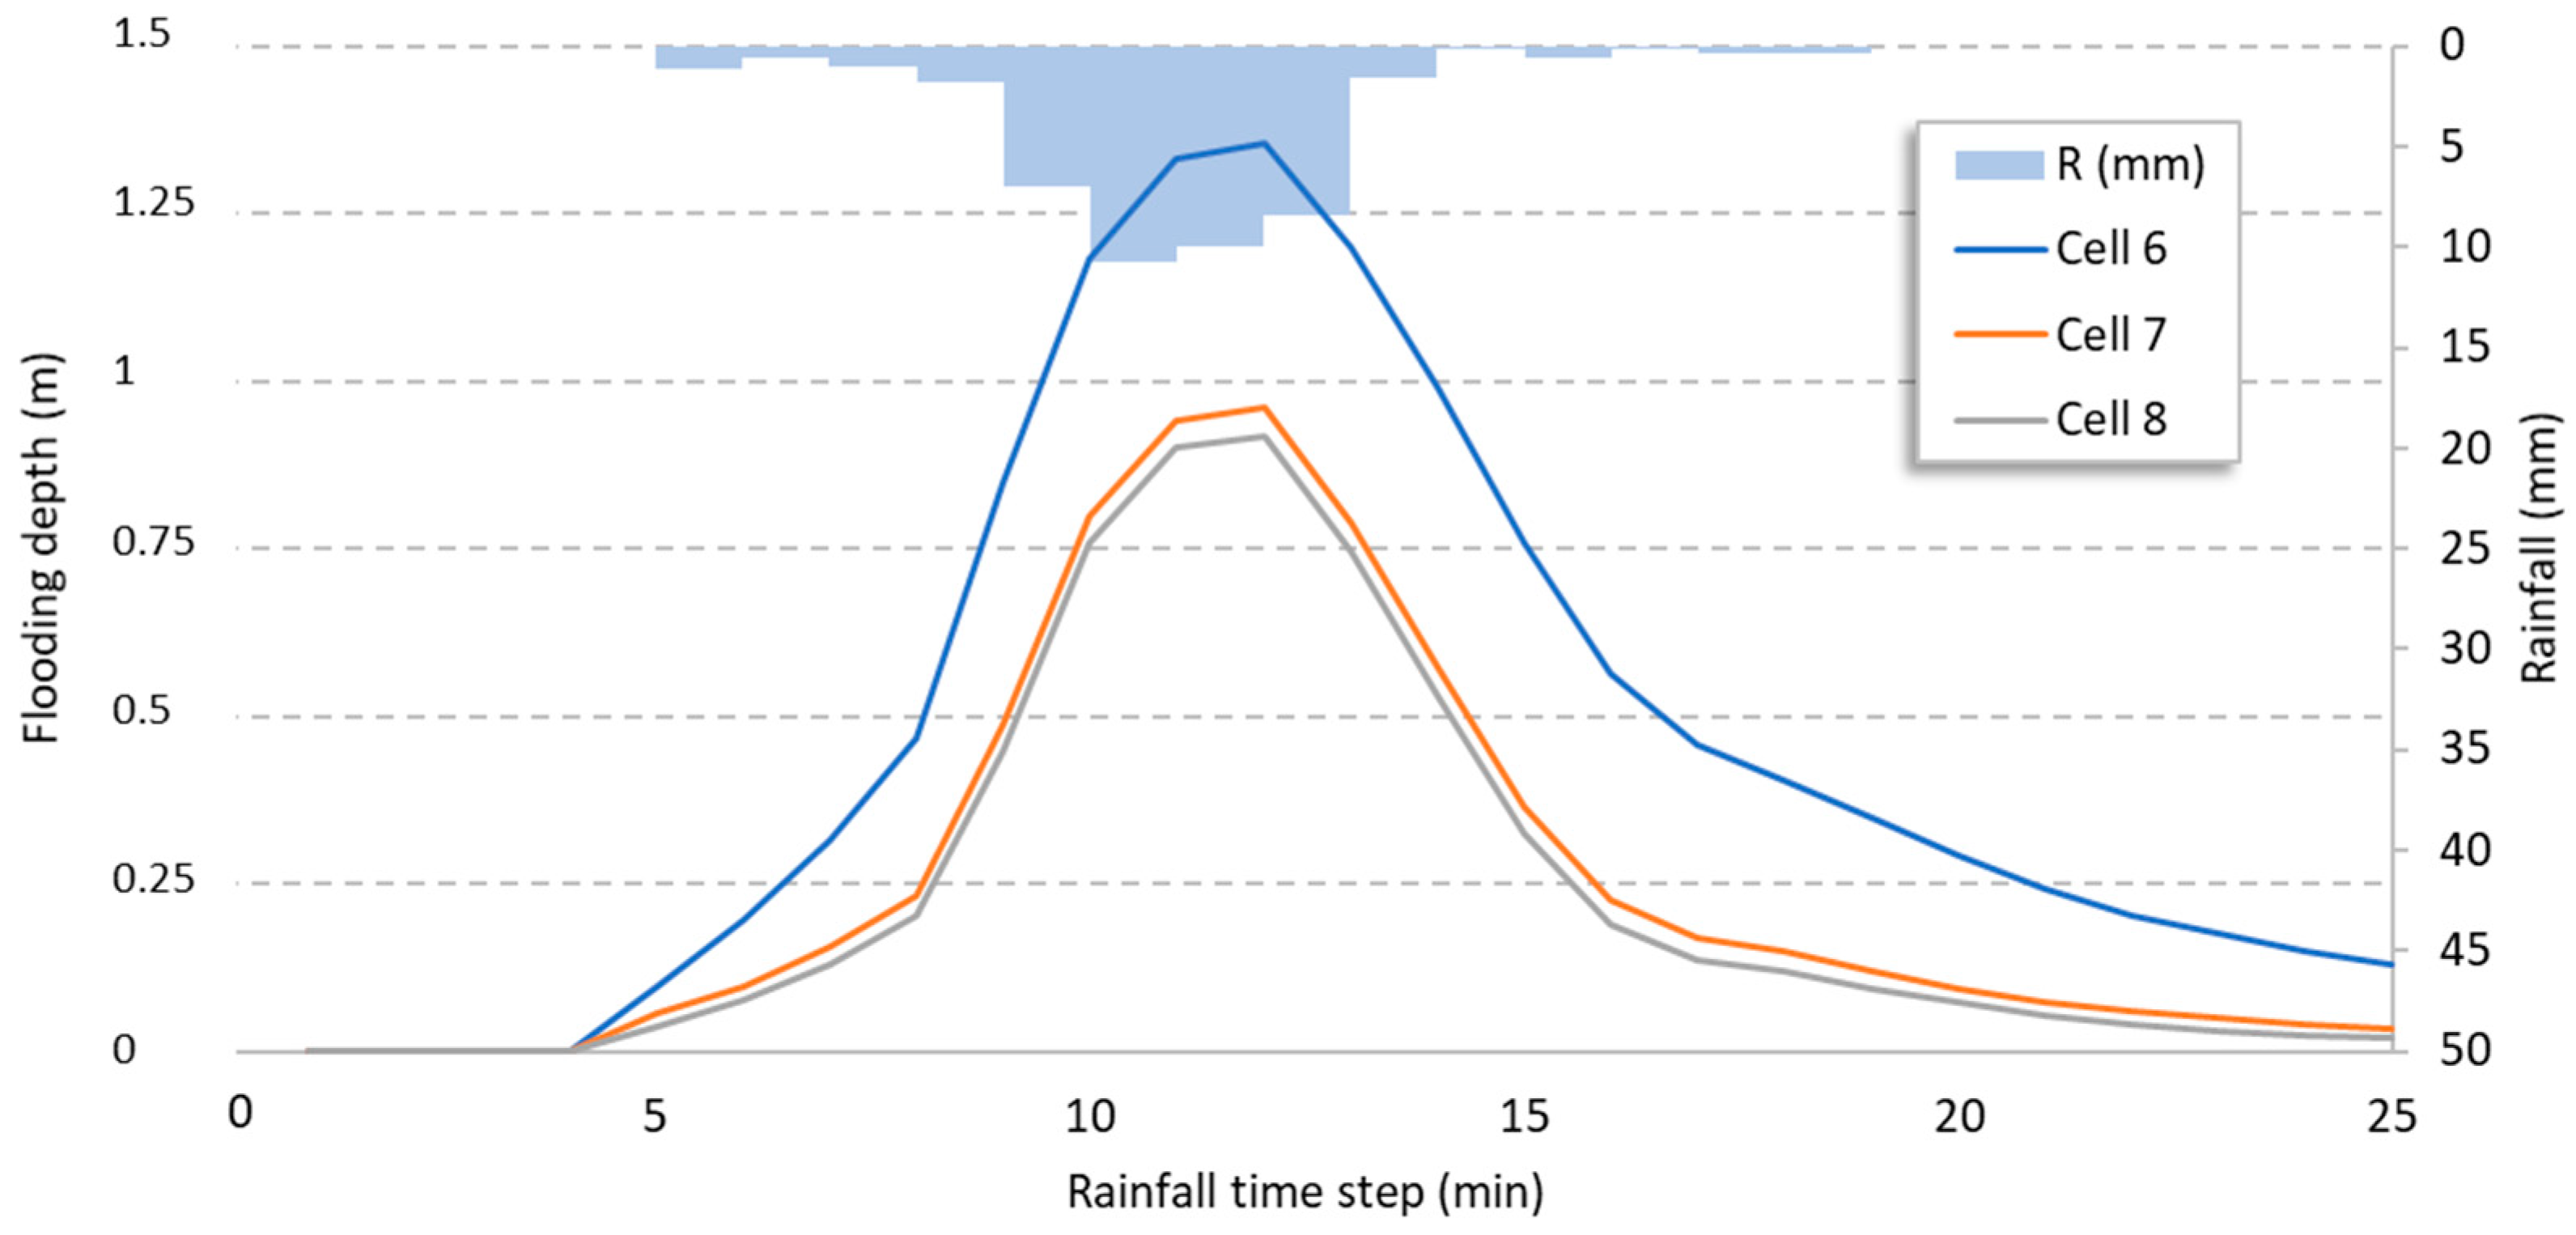
Figure 8 shows the evolution of the flooding depth in Piazza della Pace during the rainfall event.
Unlike SWMM, in which Piazza della Pace was modeled inside one subbasin (subbasin number 28), this region was divided into three cells (cells 6, 7, and 8) in MODCEL, with a more detailed sub-division to better represent the superficial flows in the area.
Considering the results obtained by MODCEL (
Figure 9), it can be observed that, in scenario SC1 (green roofs and rainwater reservoirs), there was a reduction of 40% in cell 6 and 55% in cells 7 and 8 in the flooding levels of Piazza della Pace. Note that the addition of permeable pavements (scenario SC3) did not result in any effective improvement in water levels, since the expected improvements here were superimposed on the previous measures. The subsequent addition of a new discharge system (scenario SC3) increased the flooding reduction gains to approximately 70%.
Using the cell 6 as reference (assuming the highest flooding value as the most worrying) and comparing its results with SWMM results, we can say that the expected water depths in Piazza della Pace at present can vary from 1.00 m to 1.40 m, approximately. The use of LID measures can reduce about 40% of the flooding, showing that there is a limit (established by the urbanization features) to this approach. The addition of a new outfall, considering that the watershed flows to the sea (implying that water can be discharged without transferring problems downstream), complements the LID measures proposed and can reduce the flooding problem to a more manageable level, probably resulting in water depths of between 0.00 m and 0.40 m.
However, since MODCEL represents the superficial flow processes more accurately, it is probable that there will be residual flooding in Piazza della Pace, justifying complementary action intending to reduce eventual residual flooding damages. In this case, non-structural measures can be incorporated in the proposed solution, as discussed in the next item.
4.3. Flood Impact on Road Transport Mapping
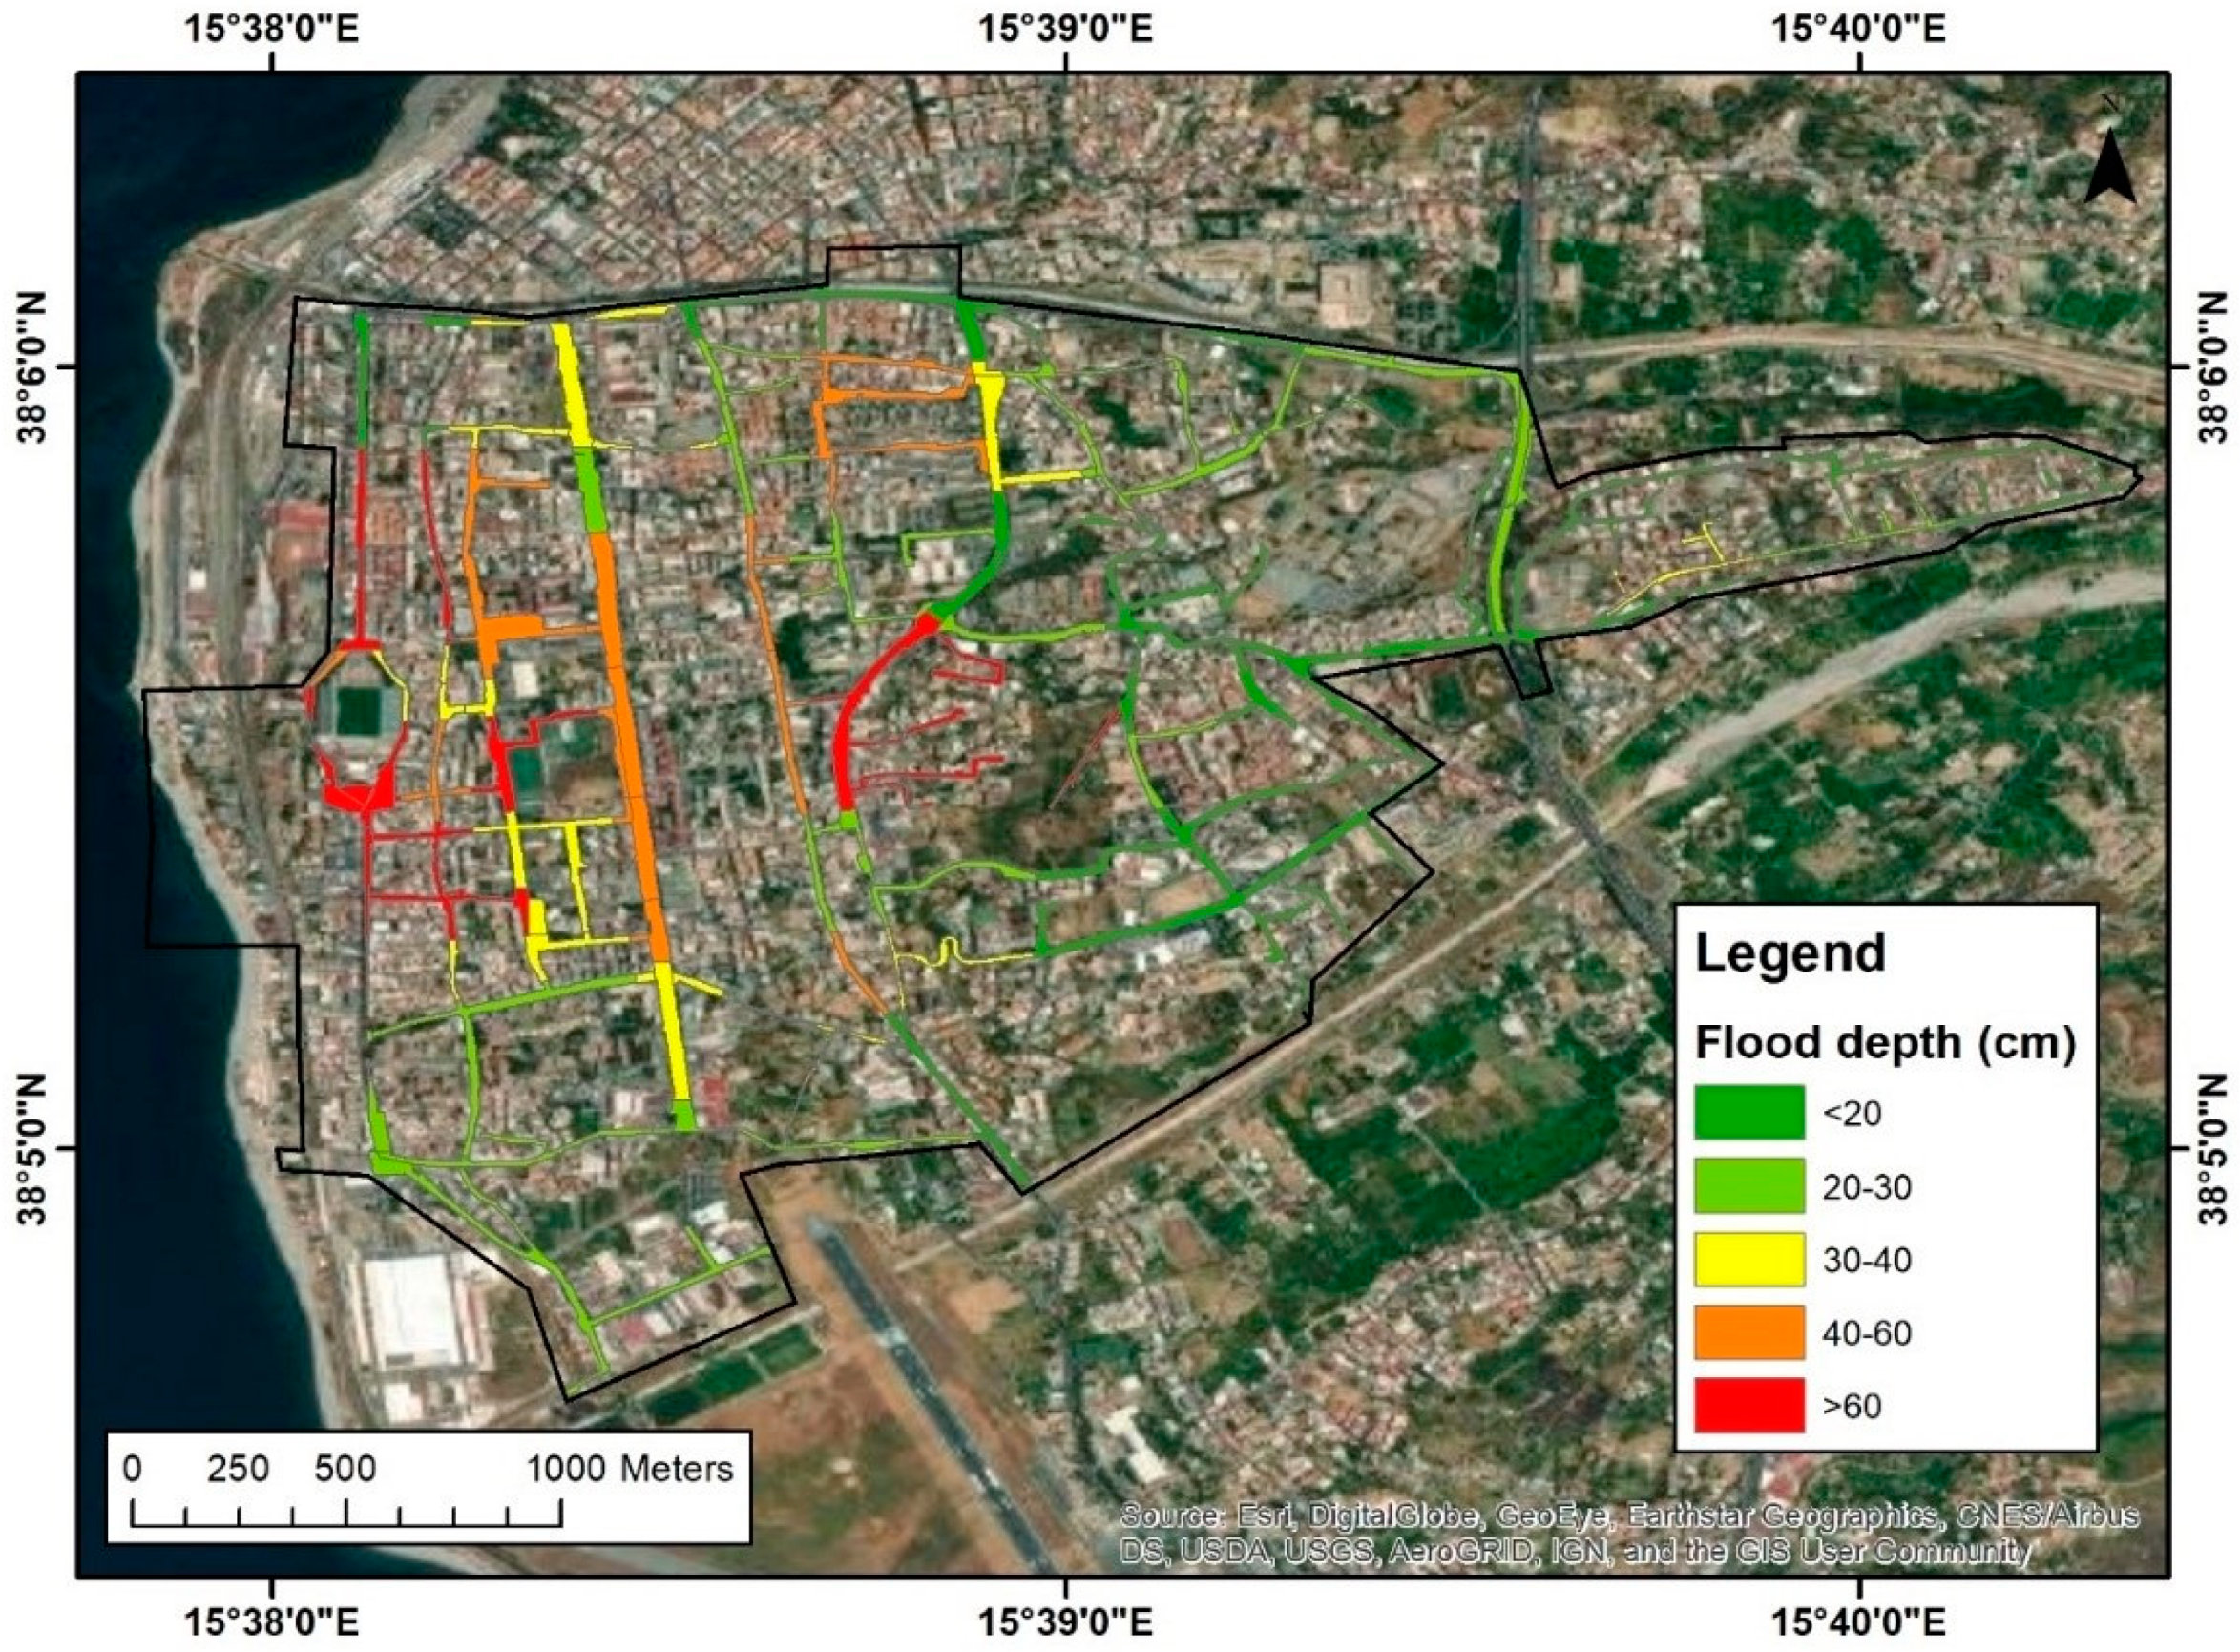
The flooding depths in the main streets of the watershed, as modeled by MODCEL, can be observed in
Figure 10. These flooding depths correspond to the current situation in the watershed without any implemented measures.
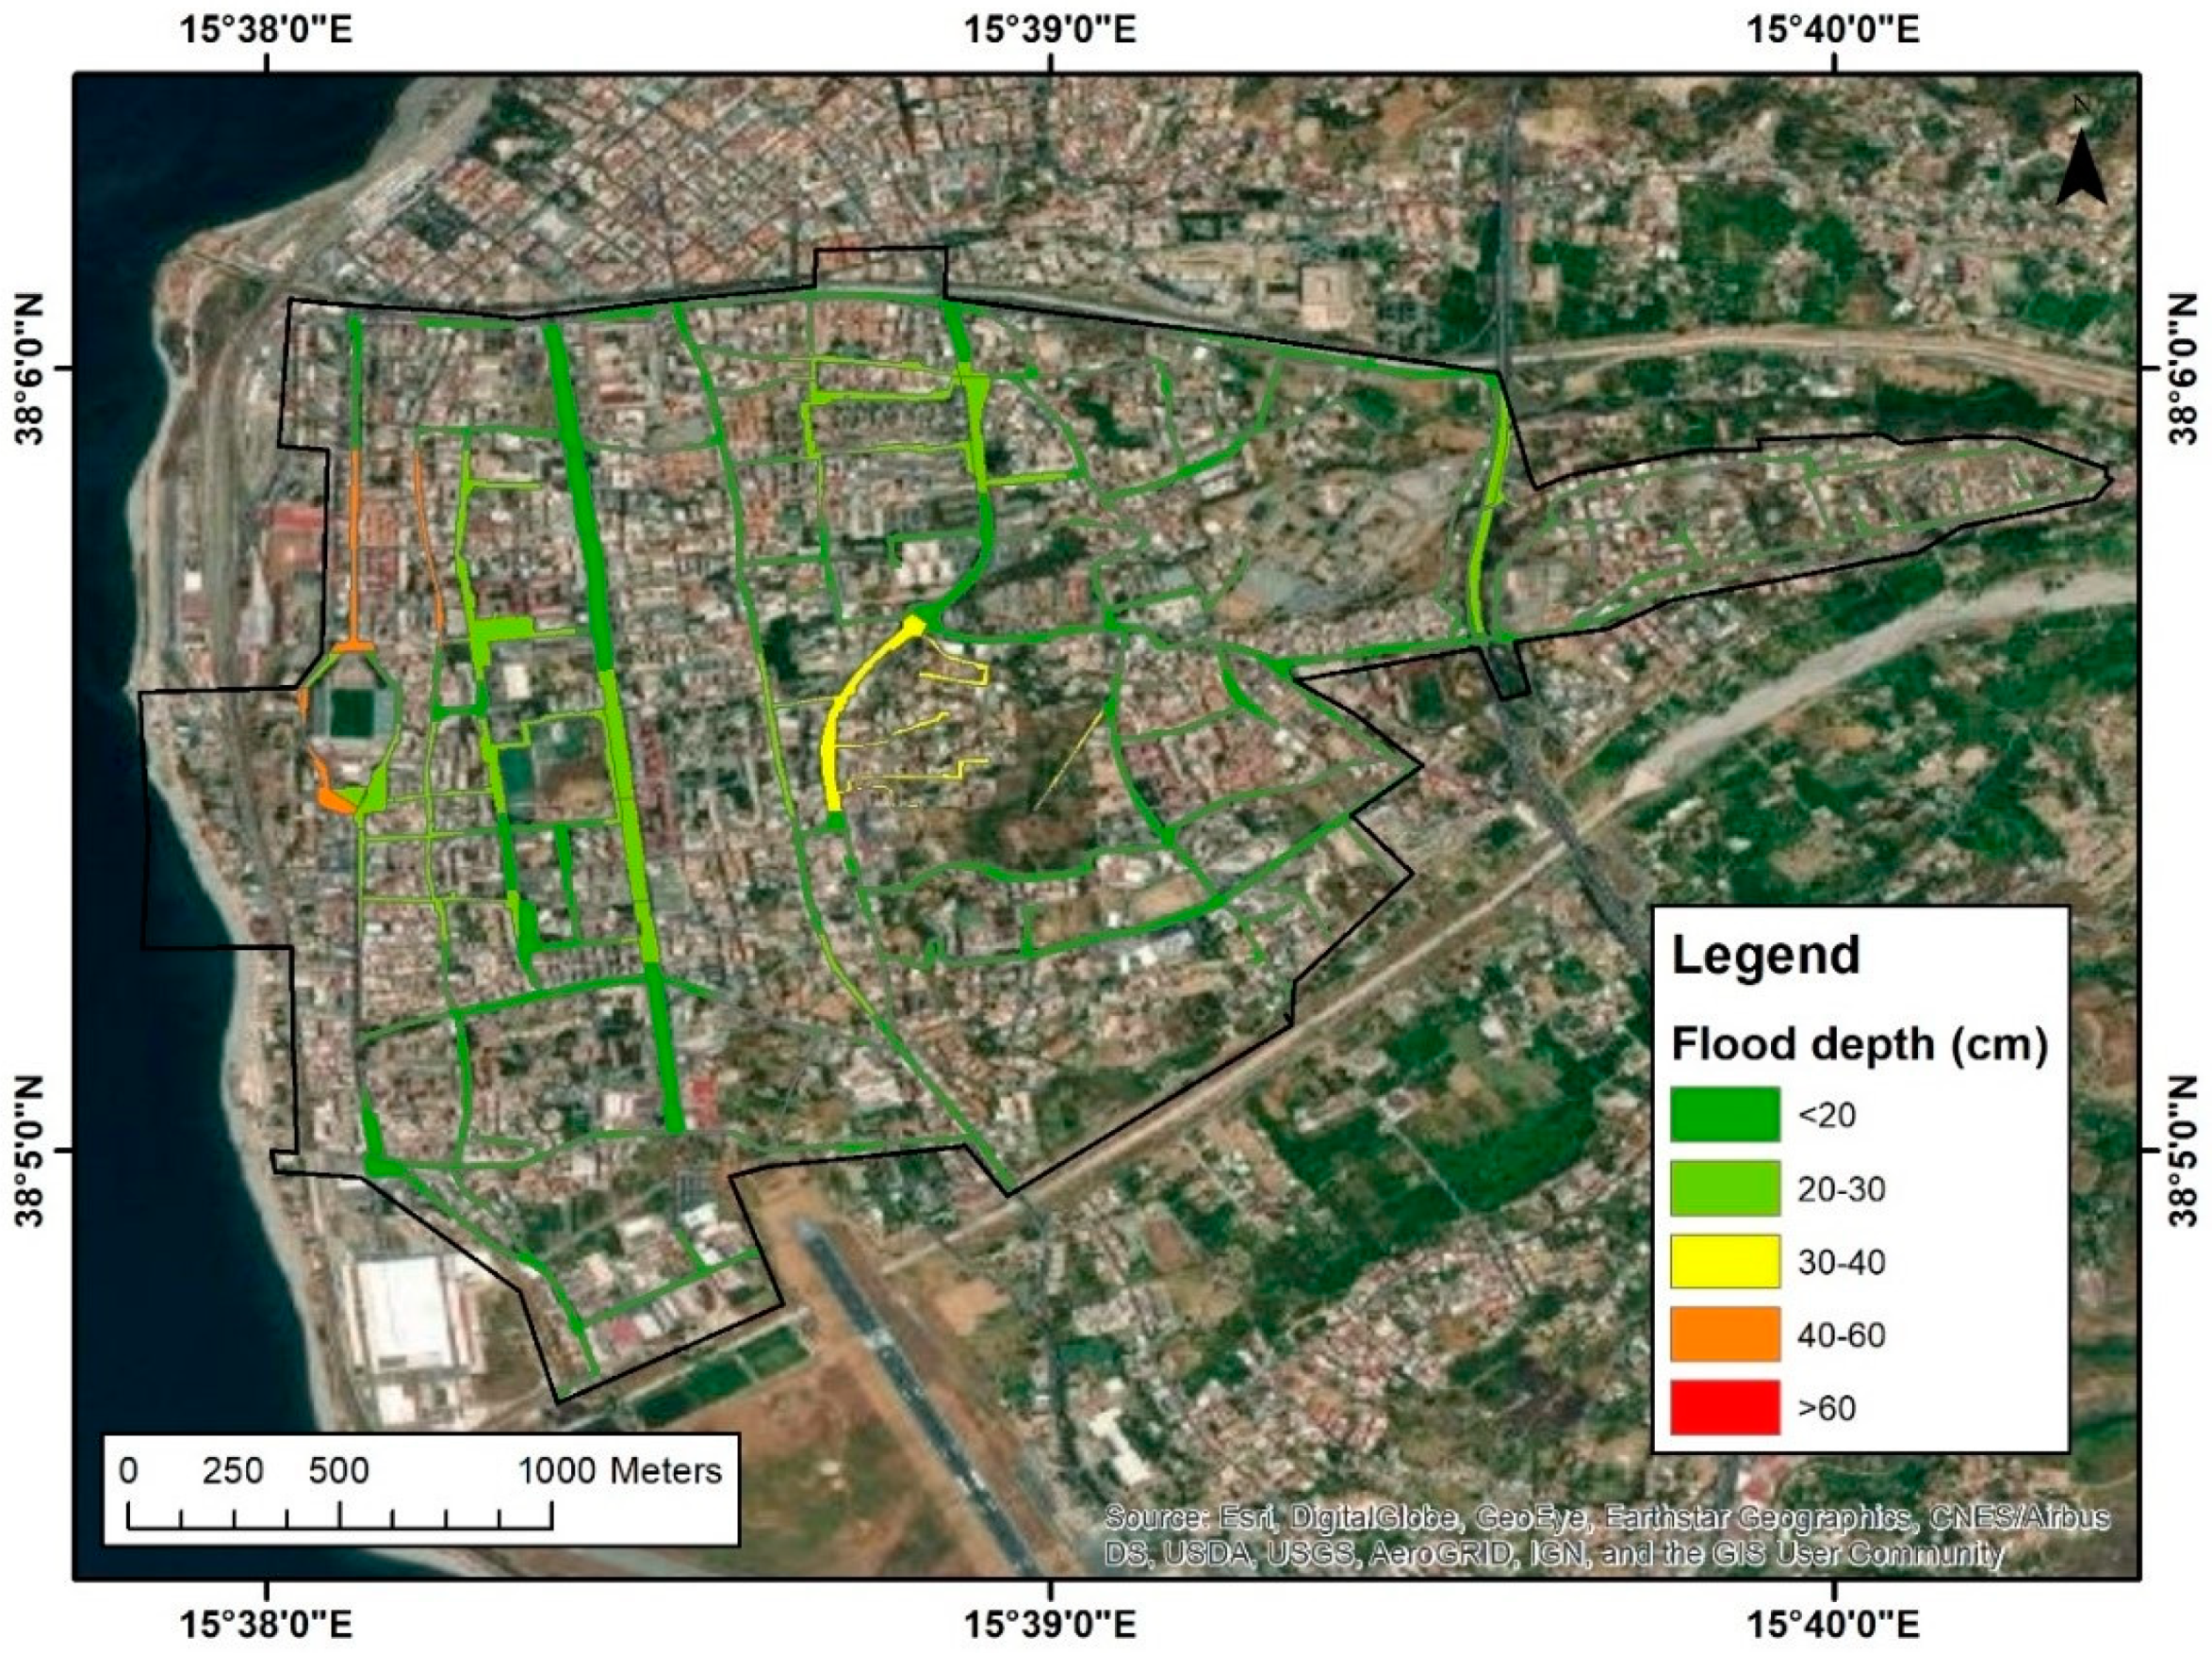
On the other hand, the map shown in
Figure 11 corresponds to the SC3 scenario (best project scenario of MODCEL), providing a logistical notion of remnant risks to mobility during a flooding event in the watershed. Using this information, the city mobility can be reorganized according to escape routes, determined from the identification of the least affected streets. This procedure can assist stakeholders in the co-related decision-making process.
5. Discussion
SWMM is widely used for assessing the performance of LID and sustainable urban drainage systems and for supporting local authorities or designers in the evaluation of the hydrological efficiency of these systems [
67,
68].
However, especially in recent years, SWMM is frequently coupled with other software and models to overcome the lack of data or the lack of capacity of the individual software and models.
In detail, Babei et al. [
69] coupled the SWMM with the Preference Ranking Organization Method for Enrichment of Evaluations (PROMETHEE II) method because it has good accuracy in prioritizing the urban sub-catchments contribution to flooding. This methodology was applied to Urmia city, located in a mountainous area in the North-East of Iran.
Macro et al. [
70] developed a new open-source multi-objective SWMM optimization tool by connecting SWMM with the existing Optimization Software Toolkit for Research Involving Computational Heuristics (OSTRICH) with optimization algorithms that the user can apply to optimize green infrastructures types, sizing, and placement. This methodology was applied in the city of Buffalo, New York (USA).
Yazdi et al. [
71] coupled the SWMM with the Hydrologic Simulation Program-Fortran (HSPF) to compare the ability of these two models at simulating streamflow, peak flow, and baseflow from an urban watershed. This methodology was applied in Stroubles Creek, located within Montgomery County, Virginia (USA). The obtained results showed that both models simulated streamflow adequately; however, HSPF simulated baseflow better than SWMM, while SWMM simulated peak flow better than HSPF.
Baek et al. [
72] developed a new modeling tool (SWMM-H) by coupling the SWMM and HYDRUS-1D models to improve simulations of hydrological processes. The new tool was tested in a small-scale green roof constructed on the rooftop of the Science Walden of the Ulsan National Institute of Science and Technology in Ulsan, South Korea. The new LID module of SWMM-H improved green roof simulations when compared with the single use of SWMM and can be applied to other LID infrastructures, such as rain gardens and bioretention measures. Therefore, the SWMM-H model can be useful in developing the best LID practices and designing of LID infrastructures.
Zhang and Chui [
73] developed a coupled surface-subsurface hydrological model (SWMM-MODFLOW) that can simulate fine–temporal scale two-way interactions between green infrastructure and groundwater at catchment scale. This methodology was applied in the urban catchment of Silverdale, Kitsap County, Washington State (USA).
Shojaeizadeh et al. [
74] developed a new green Infrastructure Placement Tool coupled with Storm Water Management Model (GIP-SWMM) for selection and strategic placement of green infrastructure practices. The performance of the tool was evaluated in the Meade-Hawthorne drainage basin in Rapid City, South Dakota (USA).
Taghizadeh et al. [
75] proposed a coupled SWMM-Multi-Objective Particle Swarm Optimization (MOPSO) model for Low Impact Development—Best Management Practices (LID-BMP) optimization. The proposed model was applied to an urban area in Northwestern Tehran, Iran.
Zeng et al. [
76] designed and implemented a web service framework based on SWMM (WEB-SWMM), which can provide real-time computing services for urban water management. This service was applied to an urban area in China.
Following this trend, in this work, SWMM was combined with MODCEL to improve superficial flows representation and to generate a possible range of acceptable results.
In this context, the set of results obtained with the application of these two models, SWMM and MODCEL, was similar, consistently mapping the general characteristics of the observed flooding event taken as reference in this study.
This is an important aspect of the proposed methodological framework. The support of two different models, built with different conceptions, was important to address the lack of proper data for formal calibration purposes. The models gave results that were similar but not exactly the same, as expected. Using the range of values provided by both models allowed the discussion to incorporate these uncertainties in the assessment process.
Similarly, to the representation of the current situation, the results obtained with the introduction of LID measures were also comparable for the two models’ application, pointing to a reduction of 40% in the flooding levels. However, due to limitations in open spaces, major LID measures (such as detention or retention ponds in green areas) are not feasible, and city constraints lead to significant flooded areas.
In this case, a complementary increase in the outfall discharge is possible, taking advantage of outflowing the watershed directly to the sea. Considering this measure complementarily to the LID interventions, SWMM showed no flooding in the simulated event, while MODCEL showed a residual level of flooding. Considering the range of results provided by both simulations, it is probable that a certain risk remains.
Since the most feasible LID measures were used, and the traditional grey intervention of retrofitting the storm drain outfall was considered, it is important to address the residual risks and provide non-structural measures that can help the city to “live with floods” in a less risky way, minimizing losses.
In this work, considering that the residual flooding ranges from 0.00 m to 0.40 m, the city mobility can probably still be affected in a significant way. In fact, we consider that this aspect will be important in almost all cases, since the residual flooding (after designing flood control actions) will be related to some decimeters of water, possibly interrupting traffic but not causing serious damages to buildings. Therefore, a street classification scale was defined according to flooding depth ranges, allowing the identification of safer escape routes and complementing the proposed framework to provide cities that are more resilient to flooding.
6. Conclusions
This research proposed a combined strategy to deal with urban flood problems where there is no available information, using combined structural and non-structural measures to mitigate flood damages. In brief, two models with different vocations were combined to generate an envelope of results to foster confidence in the modeling process in the absence of proper data for model calibration. The first model was SWMM, which was tailored to represent storm drains and LID measures; the other was MODCEL, which focused on the representation of runoff generation and its interactions both with urban landscape structures and the drainage network. The joint use of models provided a range of results that support the design of different LID measures, thereby reducing floods in the interest area as much as possible. At last, the effect of residual flooding over the watershed was mapped to offer the possibility of determining safe routes to maintain city functioning.
In this sense, this research envisaged three scenarios with different LID combinations. The first scenario (SC1) considered a combination between green roofs and rainwater reservoirs. The second scenario (SC2) considered the same LID measures of scenario SC1 plus the addition of permeable pavements. Finally, the last scenario (SC4) introduced an additional new discharge system.
The flooding responses obtained by the two models were first analyzed separately, intending to approximate the results to the available information in the critical flooding area. It was observed that the 2017 event was satisfactorily represented by both models. Then, the results were jointly considered to produce a wider range of possible results, which should reflect the whole problem to be addressed over the entire watershed. In the design process, the LID measures implemented in SWMM and MODCEL simulations reached the objective of reducing most of the flooding experienced in Piazza della Pace.
In general, both models showed that, in terms of flood depth reduction: (1) the implementation of green roofs and rainwater reservoirs had the most significant results when considering LID measures; (2) the addition of permeable pavement into the green roof and rainwater reservoir combination had little effect (probably due to superimposing effects and because of a smaller available area of influence); (3) the addition of a discharge system that increases the hydraulic capacity of the outlet channel to the sea had a significant impact in reducing the remaining flood depths, which is something expected in plain areas near the shore when discharging directly to the sea is possible.
However, even when considering the wide range of obtained results, by the combination of the responses of the two models, not all the flooding problems were solved in the watershed as a whole. The MODCEL results, which represent the superficial flows in more detail, indicate that, even in Piazza della Pace, there is residual flooding that may reach 0.40 m. Therefore, given the difficulty of completely reversing flooding and due to the lack of available urban spaces for implementing larger structural measures, there is the need for complementary non-structural strategies.
In this research, city mobility was used as the most representative factor affected by remaining flood risks. City mobility was assessed using a street classification scale according to flooding depth ranges, allowing the identification of safe escape routes to compose contingency plans.
Departing from this classification, it would be possible to couple an early warning system based on the presence of a water level depth sensor located in the lowest point of Piazza della Pace and other identified interest points. The sensor should be connected to some light panels placed at the square entrances and to an acoustic alarm that is activated when the water depth exceeds, for example, 30 cm. The choice of this threshold, corresponding to the transition from low to moderate flood hazard risk class (
Table 1), is due to the short times involved during urban floods. Indeed, the most impactful flood events on the urban territory are those of short duration and high intensity and, generally, in urban watersheds, the times of concentration are short.
In general, the main aims of the study were fulfilled. The following steps should define safe areas for supporting emergencies, extend the discussion to assess critical infrastructure, and compose a framework to support the development of flood resilient cities.
Future studies should consider a sensibility analysis to assess the uncertainties associated with the range of results produced by the combined use of the two models. Furthermore, the non-structural measures can be expanded to cover more aspects of residual flood protection.
Author Contributions
Conceptualization, G.B., M.G.M.; methodology, G.B., G.F., M.G.M., M.M.d.S.; software, G.F., I.O., M.G.M., M.M.d.S., P.M.C.d.M., A.B.R.d.C.F.; validation, G.B., G.F., M.G.M., M.M.d.S., P.M.C.d.M., A.B.R.d.C.F., M.R.V.; formal analysis, G.B., M.G.M.; investigation, I.O.; data curation, G.B., M.M.d.S., P.M.C.d.M., A.B.R.d.C.F., M.R.V.; writing—original draft preparation, G.F., M.G.M.; writing—review and editing, G.F., I.O., M.G.M., M.M.d.S., P.M.C.d.M., A.B.R.d.C.F.; visualization, G.F., I.O., M.M.d.S., P.M.C.d.M., A.B.R.d.C.F., M.R.V.; supervision, G.B., M.G.M.; project administration, G.B. All authors have read and agreed to the published version of the manuscript.
Funding
This work was funded by the Coordenação de Aperfeiçoamento de Pessoal de Nível Superior- Brasil (CAPES) and the Conselho Nacional de Desenvolvimento Científico e Tecnológico (CNPq) [303240/2017-2; 131457/2019-5].
Acknowledgments
The authors would like to acknowledge the UNESCO Chair for Urban Drainage in Regions of Coastal Lowlands at the University of Rio de Janeiro, Brazil (UFRJ).
Conflicts of Interest
The authors declare no conflict of interest. The funders had no role in the design of the study; in the collection, analyses, or interpretation of data; in the writing of the manuscript, or in the decision to publish the results.
References
- CRED/UCLouvain EM-DAT: International Disaster Database. 1988. Available online: https://www.emdat.be/ (accessed on 30 November 2020).
- UN-DESA. World Population Prospects 2019-Department of Economic and Social Affairs; Population Division, United Nations: New York, NY, USA, 2019; ISBN 9789211483161. [Google Scholar]
- UN-WATER. United Nations World Water Development Report-Natured Based Solutions; ons Educational, Scientific and Cultural Organization: Paris, France, 2018. [Google Scholar]
- Güneralp, B.; Güneralp, I.; Liu, Y. Changing global patterns of urban exposure to flood and drought hazards. Glob. Environ. Chang. 2015, 31, 217–225. [Google Scholar] [CrossRef]
- Miguez, M.G.; Rezende, O.M.; Veról, A.P. City growth and urban drainage alternatives: Sustainability challenge. J. Urban Plan. Dev. 2015, 141, 1–10. [Google Scholar] [CrossRef]
- García-Soriano, D.; Quesada-Román, A.; Zamorano-Orozco, J.J. Geomorphological hazards susceptibility in high-density urban areas: A case study of Mexico City. J. S. Am. Earth Sci. 2020, 102. [Google Scholar] [CrossRef]
- Mitchell, D.; Enemark, S.; van der Molen, P. Climate resilient urban development: Why responsible land governance is important. Land Use Policy 2015, 48, 190–198. [Google Scholar] [CrossRef]
- Hale, R.L. Spatial and temporal variation in local stormwater infrastructure use and stormwater management paradigms over the 20th century. Water (Switzerland) 2016, 8, 310. [Google Scholar] [CrossRef]
- Rezende, O.M. Análise Quantitativa da Resiliência a Inundações Para o Planejamento Urbano: Caso da Bacia do Canal do Mangue no rio de Janeiro, Tese de Doutorado. Programa de Pós-Graduação em Engenharia Civil COPPE/UFRJ; Universidade Federal do Rio de Janeiro: Rio de Janeiro, Brazil, 2018. [Google Scholar]
- Veról, A.P.; Lourenço, I.B.; Fraga, J.P.R.; Battemarco, B.P.; Merlo, M.L.; de Magalhães, P.C.; Miguez, M.G. River Restoration Integrated with Sustainable Urban Water Management for Resilient Cities. Sustainability 2020, 12, 4677. [Google Scholar] [CrossRef]
- UN-WATER. United Nations World Water Development Report—Leaving No One Behind 2019; UNESCO: Paris, France, 2019. [Google Scholar]
- Pirlone, F.; Spadaro, I.; Candia, S. More Resilient Cities to Face Higher Risks. The Case of Genoa. Sustainability 2020, 12, 4825. [Google Scholar] [CrossRef]
- Johannessen, Å.; Wamsler, C. What does resilience mean for urban water services? Ecol. Soc. 2017, 22. [Google Scholar] [CrossRef] [Green Version]
- Bertilsson, L.; Wiklund, K.; de Moura Tebaldi, I.; Rezende, O.M.; Veról, A.P.; Miguez, M.G. Urban flood resilience—A multi-criteria index to integrate flood resilience into urban planning. J. Hydrol. 2019, 573, 970–982. [Google Scholar] [CrossRef]
- European Commission. EU approach to resilience: Learning from food crisis. In Humanit. Aid Civ. Prot. Dev. Coop. EuropeAid; European Commission: Brussel, Belgium, 2014. [Google Scholar]
- IPCC; Lal, P.N.; Mitchell, T.; Aldunce, P.; Auld, H.; Mechler, R.; Miyan, A.; Romano, L.E.; Zakaria, S.; Dlugolecki, A.; et al. Managing the Risks of Extreme Events and Disasters to Advance Climate Change Adaptation: Special Report of the Intergovernmental Panel on Climate Change; The Edinburgh Building: Cambridge, UK, 2012; Volume 9781107025, ISBN 9781139177245. [Google Scholar]
- Batica, J. Methodology for Flood Resilience Assessment in Urban Environments and Mitigation Strategy Development. Ph.D. Thesis, Université Nice Sophia Antipolis, Nice, France, 2015. [Google Scholar]
- Kim, Y.; Eisenberg, D.A.; Bondank, E.N.; Chester, M.V.; Mascaro, G.; Underwood, B.S. Fail-safe and safe-to-fail adaptation: Decision-making for urban flooding under climate change. Clim. Chang. 2017, 145, 397–412. [Google Scholar] [CrossRef]
- Arrighi, C.; Pregnolato, M.; Castelli, F. Indirect flood impacts and cascade risk across interdependent linear infrastructures. Nat. Hazards Earth Syst. Sci. 2020, 1–18. [Google Scholar] [CrossRef]
- Moura Rezende, O.; Ribeiro da Cruz de Franco, A.B.; Beleño de Oliveira, A.K.; Pitzer Jacob, A.C.; Gomes Miguez, M. A framework to introduce urban flood resilience into the design of flood control alternatives. J. Hydrol. 2019, 576, 478–493. [Google Scholar] [CrossRef]
- Rezende, O.M.; Miranda, F.M.; Haddad, A.N.; Miguez, M.G. A framework to evaluate urban flood resilience of design alternatives for flood defence considering future adverse scenarios. Water 2019, 11, 1485. [Google Scholar] [CrossRef] [Green Version]
- Tariq, M.A.U.R. Risk-based flood zoning employing expected annual damages: The Chenab River case study. Stoch. Environ. Res. Risk Assess. 2013, 27, 1957–1966. [Google Scholar] [CrossRef]
- Rossi, G.; Harmancioglu, N.; Yevjevich, V. Coping with Floods; Kluwer Academic Publisher: Dordrecht, The Netherlands, 1994; Volume 01, ISBN 9788578110796. [Google Scholar]
- Luan, Q.; Fu, X.; Song, C.; Wang, H.; Liu, J.; Wang, Y. Runoff effect evaluation of LID through SWMM in typical mountainous, low-lying urban areas: A case study in China. Water 2017, 9, 439. [Google Scholar] [CrossRef] [Green Version]
- Son, C.H.; Hyun, K.H.; Kim, D.; Baek, J.I.; Ban, Y.U. Development and application of a low impact development (LID)-based district unit planning model. Sustainability 2017, 9, 145. [Google Scholar] [CrossRef] [Green Version]
- Nalau, J.; Handmer, J. Improving development outcomes and reducing disaster risk through planned community relocation. Sustainability 2018, 10, 3545. [Google Scholar] [CrossRef] [Green Version]
- Collins, M.L.; Kapucu, N. Early warning systems and disaster preparedness and response in local government. Disaster Prev. Manag. Int. J. 2008, 17, 587–600. [Google Scholar] [CrossRef]
- N. Brazzola, S.H.; Helander, S.E.M. Five Approaches to Build Functional Early Warning Systems; United Nations Dev. Program.: New York, NY, USA, 2018. [Google Scholar]
- Li, N.; Qin, C.; Du, P. Optimization of China sponge city design: The case of Lincang Technology Innovation Park. Water 2018, 10, 1189. [Google Scholar] [CrossRef] [Green Version]
- Zevenbergen, C.; Dafang, F.; Pathirana, A. Preface of Sponge Cities: Emerging Approaches, Challenges and Opportunities. In Sponge Cities: Emerging Approaches, Challenges and Opportunities; MDPI: Basel, Switzerland, 2018; ISBN 9783038972723. [Google Scholar]
- Li, Q.; Wang, F.; Yu, Y.; Huang, Z.; Li, M.; Guan, Y. Comprehensive performance evaluation of LID practices for the sponge city construction: A case study in Guangxi, China. J. Environ. Manag. 2019, 231, 10–20. [Google Scholar] [CrossRef]
- Zhang, S.; Zevenbergen, C.; Rabé, P.; Jiang, Y. The influences of sponge city on property values in Wuhan, China. Water 2018, 10, 766. [Google Scholar] [CrossRef] [Green Version]
- Li, H.; Ding, L.; Ren, M.; Li, C.; Wang, H. Sponge city construction in China: A survey of the challenges and opportunities. Water 2017, 9, 594. [Google Scholar] [CrossRef] [Green Version]
- Clar, M.L.; Barfield, B.J.; O’Connor, T.P. Stormwater Best Management Practices Design Guide; U.S. Environmental Protection Agency: Washington, DC, USA, 2004.
- SEMCOG. Low Impact Development Manual for Michigan a Design Guide for Implementers and Reviewers; South East Michigan Coucil of Governments Information Center: Detroit, MI, USA, 2008; p. 512. [Google Scholar]
- Dong, X.; Guo, H.; Zeng, S. Enhancing future resilience in urban drainage system: Green versus grey infrastructure. Water Res. 2017, 124, 280–289. [Google Scholar] [CrossRef]
- Jia, H.; Wang, Z.; Zhen, X.; Clar, M.; Yu, S.L. China’s sponge city construction: A discussion on technical approaches. Front. Environ. Sci. Eng. 2017, 11, 1–11. [Google Scholar] [CrossRef]
- Casal-Campos, A.; Fu, G.; Butler, D.; Moore, A. An Integrated Environmental Assessment of Green and Gray Infrastructure Strategies for Robust Decision Making. Environ. Sci. Technol. 2015, 49, 8307–8314. [Google Scholar] [CrossRef] [PubMed] [Green Version]
- Gregoire, B.G.; Clausen, J.C. Effect of a modular extensive green roof on stormwater runoff and water quality. Ecol. Eng. 2011, 37, 963–969. [Google Scholar] [CrossRef]
- Zevenbergen, C.; Fu, D.; Pathirana, A. Transitioning to sponge cities: Challenges and opportunities to address urban water problems in China. Water 2018, 10, 1230. [Google Scholar] [CrossRef] [Green Version]
- Demuzere, M.; Orru, K.; Heidrich, O.; Olazabal, E.; Geneletti, D.; Orru, H.; Bhave, A.G.; Mittal, N.; Feliu, E.; Faehnle, M. Mitigating and adapting to climate change: Multi-functional and multi-scale assessment of green urban infrastructure. J. Environ. Manag. 2014, 146, 107–115. [Google Scholar] [CrossRef] [PubMed]
- Visitacion, B.J.; Booth, D.B.; Steinemann, A.C. Costs and benefits of storm-water management: Case study of the puget sound region. J. Urban Plan. Dev. 2009, 135, 150–158. [Google Scholar] [CrossRef] [Green Version]
- GebreEgziabher, M.; Demissie, Y. Modeling urban flood inundation and recession impacted by manholes. Water 2020, 12, 1160. [Google Scholar] [CrossRef] [Green Version]
- Miguez, M.G.; Battemarco, B.P.; De Sousa, M.M.; Rezende, O.M.; Veról, A.P.; Gusmaroli, G. Urban Flood Simulation Using MODCEL—An Alternative Quasi-2D Conceptual Model. Water 2017, 9, 445. [Google Scholar]
- Wang, X.; Kingsland, G.; Poudel, D.; Fenech, A. Urban flood prediction under heavy precipitation. J. Hydrol. 2019, 577, 123984. [Google Scholar] [CrossRef]
- Kaykhosravi, S.; Khan, U.T.; Jadidi, A. A comprehensive review of low impact development models for research, conceptual, preliminary and detailed design applications. Water 2018, 10, 1541. [Google Scholar] [CrossRef] [Green Version]
- Rossman, L.A. Storm Water Management Model Reference Manual-Hydraulics. Environ. Prot. 2017, II, 37–46. [Google Scholar]
- Rossman, L.A.; Huber, W.C. Storm Water Management Model Reference Manual Volume I–Hydrology (revised)(EPA/600/R-15/162A). U.S. Environ. Prot. Agency 2016, I, 231. [Google Scholar]
- Peng, J.; Ouyang, J.; Yu, L. The model of low impact development of a sponge airport: A case study of Beijing Daxing International Airport. J. Water Clim. Chang. 2020, 1–11. [Google Scholar] [CrossRef]
- Xie, J.; Wu, C.; Li, H.; Chen, G. Study on storm-water management of grassed swales and permeable pavement based on SWMM. Water 2017, 9, 840. [Google Scholar] [CrossRef] [Green Version]
- Kim, J.; Lee, J.; Song, Y.; Han, H.; Joo, J. Modeling the runoffreduction effect of low impact development installations in an industrial area, South Korea. Water 2018, 10, 967. [Google Scholar] [CrossRef] [Green Version]
- Chen, P.Y.; Tung, C.P.; Li, Y.H. Low impact development planning and adaptation decision-making under climate change for a xommunity against pluvial flooding. Water 2017, 9, 756. [Google Scholar] [CrossRef] [Green Version]
- Mascarenhas, F.C.B.; Miguez, M.G. Urban flood control through a mathematical cell model. Water Int. 2002, 27, 208–218. [Google Scholar] [CrossRef]
- Cunge, J.A.; Holly, F.M.; Verwey, A. Practical Aspects of Computational River Hydraulics; Pitman Advanced Publishing Program: London, UK, 1980; ISBN 0273084429. [Google Scholar]
- Zanobetti, D.; Lorgeré, H. Le modèle mathématique du du mékong. La Houille Blanche 1968, 5, 363–378. [Google Scholar] [CrossRef] [Green Version]
- Mascarenhas, F.C.B.; Miguez, M.G. Large flood plains modeling by a cell scheme—Application to the pantanal of Mato-Grosso. In Engineering Hydrology—Proceedings of the Symposium; ASCE: Reston, VA, USA, 1993; pp. 1212–1217. [Google Scholar]
- De Sousa, M.M.; de Oliveira, A.K.B.; da Silva, B.M.G.; Miguez, M.G. How Important Is the Physical Interpretation and the Role of the Model User in Urban Flooding Simulation? Green Energy Technol. 2019, 522–527. [Google Scholar] [CrossRef]
- De Oliveira, A.K.B.; Rezende, O.M.; de Sousa, M.M.; Nardini, A.; Miguez, M.G. An alternative flood model calibration strategy for urban watersheds: Case study of Riohacha, Colombia. Water Sci. Technol. 2019. [Google Scholar] [CrossRef]
- Miguez, M.G.; Veról, A.P.; De Sousa, M.M.; Rezende, O.M. Urban floods in lowlands-levee systems, unplanned urban growth and river restoration alternative: A case study in Brazil. Sustainability 2015, 7, 11068–11097. [Google Scholar] [CrossRef] [Green Version]
- Jacob, A.C.P.; Rezende, O.M.; de Sousa, M.M.; de França Ribeiro, L.B.; de Oliveira, A.K.B.; Arrais, C.M.; Miguez, M.G. Use of detention basin for flood mitigation and urban requalification in Mesquita, Brazil. Water Sci. Technol. 2019. [Google Scholar] [CrossRef] [PubMed]
- Scionti, F.; Miguez, M.G.; Barbaro, G.; De Sousa, M.M.; Foti, G.; Canale, C. Integrated Methodology for Urban Flood Risk Mitigation in Cittanova, Italy. J. Water Resour. Plan. Manag. 2018, 144, 05018013. [Google Scholar] [CrossRef]
- Occhiuto, I. Analisi dell’allagamento di Piazza della Pace a Reggio Calabria e relative proposte di interventi di mitigazione. Master’s Thesis, Mediterranea University of Reggio Calabria, Reggio Calabria, Italy, 2019. [Google Scholar]
- Yen, B.C. Chapter 6: Hydraulics of Sewer Systems. In Stormwater Collection Systems Design Handbook; Mays, L.M., Ed.; McGraw-Hill: New York, NY, USA, 2001. [Google Scholar]
- Chow, V.T. Open-Channel Hydraulics; McGraw-Hill Civil Engineering Series: New York, NY, USA, 1959. [Google Scholar]
- Cai, T.; Li, X.; Ding, X.; Wang, J.; Zhan, J. Flood risk assessment based on hydrodynamic model and fuzzy comprehensive evaluation with GIS technique. Int. J. Disaster Risk Reduct. 2019, 35, 101077. [Google Scholar] [CrossRef]
- Pregnolato, M.; Ford, A.; Wilkinson, S.M.; Dawson, R.J. The impact of flooding on road transport: A depth-disruption function. Transp. Res. Part D Transp. Environ. 2017, 55, 67–81. [Google Scholar] [CrossRef]
- Cipolla, S.S.; Maglionico, M.; Stojkov, I. A long-term hydrological modelling of an extensive green roof by means of SWMM. Ecol. Eng. 2016, 95, 876–887. [Google Scholar] [CrossRef]
- Pappalardo, V.; La Rosa, D.; Campisano, A.; La Greca, P. The potential of green infrastructure application in urban runoff control for land use planning: A preliminary evaluation from a southern Italy case study. Ecosyst. Serv. 2017, 26B, 345–354. [Google Scholar] [CrossRef]
- Babei, S.; Ghazavi, R.; Erfanian, M. Urban flood simulation and prioritization of critical urban sub-catchments using SWMM model and PROMETHEE II approach. Phys. Chem. Earth 2018, 105, 3–11. [Google Scholar] [CrossRef]
- Macro, K.; Matott, L.S.; Rabideau, A.; Ghodsi, S.H.; Zhu, Z. OSTRICH-SWMM: A new multi-objective optimization tool for green infrastructure planning with SWMM. Environ. Model. Softw. 2019, 113, 42–47. [Google Scholar] [CrossRef]
- Yazdi, M.N.; Ketabchy, M.; Sample, D.J.; Scott, D.; Liao, H. An evaluation of HSPF and SWMM for simulating streamflow regimes in an urban watershed. Environ. Model. Softw. 2019, 118, 211–225. [Google Scholar] [CrossRef]
- Baek, S.S.; Ligaray, M.; Pachepsky, Y.; Chun, J.A.; Yoon, K.S.; Park, Y.; Cho, K.H. Assessment of a green roof practice using the coupled SWMM and HYDRUS models. J. Environ. Manag. 2020, 261, 109920. [Google Scholar] [CrossRef]
- Zhang, K.; Chui, T.F.M. Assessing the impact of spatial allocation of bioretention cells on shallow groundwater–An integrated surface-subsurface catchment-scale analysis with SWMM-MODFLOW. J. Hydrol. 2020, 586, 124910. [Google Scholar] [CrossRef]
- Shojaeizadeh, A.; Geza, M.; Hogue, T.S. GIP-SWMM: A new Green Infrastructure Placement Tool coupled with SWMM. J. Environ. Manag. 2021, 277, 111409. [Google Scholar] [CrossRef] [PubMed]
- Taghizadeh, S.; Khani, S.; Rajaee, T. Hybrid SWMM and Particle Swarm Optimization Model for Urban RunoffWater Quality Control by Using Green Infrastructures (LID-BMPs). Urban For. Urban Green. 2021. [Google Scholar] [CrossRef]
- Zeng, Z.; Yuan, X.; Liang, J.; Li, Y. Designing and implementing an SWMM-based web service framework to provide decision support for real-time urban stormwater management. Environ. Model. Softw. 2021, 135, 104887. [Google Scholar] [CrossRef]
| Publisher’s Note: MDPI stays neutral with regard to jurisdictional claims in published maps and institutional affiliations. |
© 2021 by the authors. Licensee MDPI, Basel, Switzerland. This article is an open access article distributed under the terms and conditions of the Creative Commons Attribution (CC BY) license (http://creativecommons.org/licenses/by/4.0/).


 ,
, 


