Article

Twitter’s Messages about Hydrometeorological Events. A Study on the Social Impact of Climate Change

by
Esther Oliver
1,*,
María Carmen Llasat
2,
Montserrat Llasat-Botija
2 and
Javier Díez-Palomar
3
1
Department of Sociology, University of Barcelona, 08034 Barcelona, Spain
2
Department of Applied Physics, University of Barcelona, 08028 Barcelona, Spain
3
Department of Linguistic and Literary Education, and Teaching and Learning of Experimental Sciences and Mathematics, University of Barcelona, 08035 Barcelona, Spain
*
Author to whom correspondence should be addressed.
Sustainability 2021, 13(6), 3579; https://0-doi-org.brum.beds.ac.uk/10.3390/su13063579
Submission received: 28 January 2021 / Revised: 15 March 2021 / Accepted: 16 March 2021 / Published: 23 March 2021

Abstract

:
This study is based on an interdisciplinary collaboration between scientists from natural and social sciences to create scientific knowledge about how Twitter is valuable to understand the social impact of hydrometeorological events. The capacity of citizens’ reaction through Twitter to environmental issues is widely analyzed in the current scientific literature. Previous scientific works, for example, investigated the role of social media in preventing natural disasters. This study gives scientific evidence on the existence of diversity in the intentionality of Twitters’ messages related to hydrometeorological events. The methodological design is formed by four experiments implemented in different moments of a temporal axis. The social impact on social media methodology (SISM) is implemented as social media analytics. From the findings obtained, it can be observed that there are different forms of intentionality in Twitter’s messages related to hydrometeorological events depending on the contextual circumstances and on the characteristics of Twitter’s users’ profiles (including the geolocation when this information is available). This content is relevant for future works addressed to define social media communication strategies that can promote specific reactions in vulnerable groups in front the climate change.

1. Introduction

Climate change is a challenge that humanity is facing today. It affects economies, societies and people worldwide and requires further knowledge to define proper actions to stop it and make sustainable development possible. In the process of scientific knowledge’s construction about climate change and its social impact, it is crucial to establish interdisciplinary bounds to deepen this phenomenon’s comprehension. This study is based on an interdisciplinary collaboration between scientists from natural and social sciences concerned by the need to know more about how citizens react through social media in front of hazardous hydrometeorological events that are or can be related to climate change. Indeed, citizens are key actors in understanding and creating knowledge around issues affecting their lives. The way citizens (individually or as part of an organization or an institution) react and act in front of hydrometeorological hazards [1] events through social media gives relevant information about how climate change is being understood by citizenship and how it can be faced or prevented. This is a crucial issue to address global social development successfully.
The capacity and possibility of citizens’ reaction through Twitter in front of different issues affecting them is widely analyzed in the previous scientific literature. A wide range of research has focused the attention on the analysis of social media to capture the views of citizens regarding different topics [2,3]. Wandhöfer and colleagues [4] developed an FP7 research project that analyzed how social networking sites enable dialogues and engagements between governments and citizens. Chew and Eysenbach [5] studied how social media contributed, already in 2009, to collect relevant information for the management of a public emergency in public health worldwide during the H1N1 pandemic. These authors stress the role of knowledge translation, which is assumed by the public, using and generating content through social media. This content became relevant for public health professionals in managing that sanitarian crisis. In the COVID-19 pandemic crisis, again social media became very suitable for collecting information, distinguishing between fake news and scientific evidence [6] and anticipating actions to respond better to current challenges for the public health and the whole society as a whole [6,7].
This article presents the results of a study formed by four experiments developed with the social impact on the social media methodology (SISM) already tested and published in previous scientific works [2,3]. Pulido and colleagues [2], use the term social impact as a broad concept that considers the social transformations towards social goals defined by citizens through institutions such the United Nations, as the U.N. Sustainable Developments Goals (SDGs). The UN SDG n° 13 is Climate action [8]. Climate change is one of the most important challenges: This is a reality all over the world and it affects air temperatures, sea level, snow and ice melting, rainfall patterns, and other meteorological phenomena which alter ecosystems and people, transforming living conditions worldwide [9]. In this article, it is analyzed how citizens and organizations or institutions use social media to react in different ways in front of weather-related hazardous events, also in situations of vulnerability, providing knowledge that can be useful better to understand the social impact of climate change in citizenship and respond in front of it. Indeed, Twitter is a relevant tool to achieve this understanding and can contribute to generating actions to act in front of this climate change for the better.
Indeed, social networks as Twitter facilitate the speed of exchange of information and knowledge transfer. It favors that citizens can obtain information in the tweets at the same moment that an event happens [10]. For example, Twitter enables the creation of virtual communities that discuss and improve communication about different topics involving diverse social agents (individual citizens, policymakers, members of NGOs (Non-Governmental Organizations, professionals of the media, etc.) [10]. The analysis of weather-related events’ social impact through social media permits the researchers to reach bigger audiences in a broader spatial context and a faster temporal frame [11].
Four experiments were done in four different moments in this study. The first experiment worked for testing the methodology. The data from the last three provided insights about the different types of responses citizens and organizations give through Twitter regarding the events in each moment. The overall aim is to provide a wider understanding of how citizens and organizations react through Twitter in front of hazardous hydrometeorological events which can be connected to climate change. The main objective is to analyze the responses in terms of intentionality provided by citizens (individuals or organizations) through Twitter in front of meteorological events, starting from research questions interested in knowing if the SISM methodology is adequate for studying the social impact of hydrometeorological events and if Twitter is a social media which potentially can enable different forms of communication with different intentionalities (prevention, information, denounce, complain, adaptation or question) regarding climate change issues.
Additionally, a comparative analysis of the data obtained from these three experiments is done to deepen the study of the different reactions depending on each experiment’s context. Finally, relevant information is given about Twitter’s users’ profile and about the geolocation of the tweets analyzed in each experiment when this information is available.
Five more sections beyond this introduction form this article. In the following section, a literature review is summarizing the state of the art in two main aspects: (1) previous scientific contributions on the role of social media in reacting in front natural phenomena and specifically climate change; (2) previous insights of the SISM Methodology implemented in this study. Next, the methodological design of the whole study is specified, as well as the design of the sample and the technical procedures followed to collect and analyze all the data material. A detailed description of the context (temporal axis, hydrometeorological extreme events and social events related to climate change associated with each experiment) is provided. The social impact on the social media methodology (SISM) is also described in the Materials and Methods section, specifying how it is implemented in this concrete study.
The fourth section presents the main results of the analysis. First, data is given in each experiment about the most and less frequent types of responses (with different intentionality) and the frequency of messages captured from individual or collective (organization or institution) accounts, in two languages (Catalan and Spanish). Second, data of the three experiments are compared in terms of the intentionality of the Tweet’s messages and Twitter’s users’ profiles. The information available about the geolocation of the Tweets is also analyzed, distinguishing between countries (in the case of tweets in Spanish) or between regions (in the case of tweets in Catalan). Third, the data about the intentionality of the Tweets and the Twitter’s users’ profiles are crossed to know more in deep about the intentionality of the citizenship’s responses depending on the characteristics of the individual or collective actor which is posting the Tweet.
Next, a section with a discussion of the main findings, including questions that remain opened and a description of the study’s limitations is offered. Finally, the main conclusions highlight the added value of this scientific contribution, providing scientific evidence on, first, the use of the SISM methodology for the study of the social impact of climate change in citizenship and second, the use of Twitter as a potential tool to obtain information for improving the capacity of understanding and reaction of citizens in front climate change.

2. Literature Review

2.1. Theoretical Background

Previous works already analyzed the role that social media can develop in preventing natural disasters such as earthquakes, floods and tornados, facilitating the definition of emergency responses and acting as real-time emerging systems [12,13,14,15,16]. Some studies highlighted how people use social media such as Twitter as a tool that allows the fast dissemination of information about extreme hydrometeorological events from local points, even in cases where other sources of information do not work efficiently. The information shared through Twitter can be very relevant to prevent natural catastrophes once the problems for the geolocation of the tweets are solved [12,17]. Twitter includes the possibility of adding the location to the tweets enabling precise location through the GPS (Global Positioning System) of the device to facilitate the localization of the users when the tweet is done. However, Twitter accounts have not activated this GPS location as default [17]. If the GPS location is activated, the Twitters’ account’s geolocation is referred to as the users’ location and not necessarily to the site of the event that is mentioned in Twitter’s text [13].
Different strategies have been defined to overcome these limitations. Some of them imply the analysis of twitter’s contents, such as geoparsing algorithms, geotagging or geocoding as ways to extract the geographical locations of a tweet from toponyms or ambiguous or unstructured location’s information in Twitter’s text [13,17]. According to Middleton and colleagues [14], for example, geoparsing systems can analyze texts to extract likely geographical locations, which can contribute to defining social media crisis maps to alert in front of natural disasters [14]. In this article, the geolocations of the tweets analyzed are obtained through an analysis done manually (without any supportive qualitative data analysis software) as is further explained in the Materials and Methods section.
Taking into account these previous studies, this article analyses the way social media, specifically Twitter, can become a very valuable tool to know more in-depth about the social impact of climate change on the perceptions, concerns and proposals of action of citizens through Twitter’s messages, studying the intentionality of these messages and the characteristics of the Twitter’s user profiles. The study started with the knowledge of previous studies focused on analyzing citizens’ perception in front of climate events [18,19]. Llasat and colleagues [18,19], for example, developed an extensive analysis of the evolution of the perception of citizens in front of natural hazards in the last decades in the Mediterranean area, using article newspapers as an indicator. These authors highlighted that natural disasters’ societal impact is higher now than in the past mainly due to a higher vulnerability, a lower acceptable risk threshold, and a higher social perception [18,19]. From these previous scientific works, this article proposes a list of different potential intentionality in Twitter’s messages as part of the analytical frame of this study.
The three concepts above mentioned, vulnerability, risk and perception, are strongly interconnected. The vulnerability in front of a natural hazard depends on the exposure, the existing knowledge, and the risk management in front of that natural hazard [18,19]. The concept of vulnerability, analyzed by Cardona [20], is linked to a physical, economic, political or social possibility to suffer any damage in front of a phenomenon. Some social groups have more chance to be vulnerable depending on socio-economic factors, especially if it is considered that vulnerability to climate change is not only the possibility to be affected (exposure and susceptibility to being damaged) but also the capacity to give an adequate and adapted response in front the emerging needs when a natural hazard is happening [21]. This article analyses citizens’ and institutional or organization’s responses in different moments, including extreme events in which their high severity increases the impact and damages on specific populations, such as those living in some areas of the Mediterranean coast during the Gloria storm in January 2020.
Vulnerability is also related to a socially constructed process as people do not necessarily have the same risks’ perception in a similar situation. On the contrary, the risks’ perception depends on the dominant patterns and beliefs, and it is positively related to a social context [18,19,20]. Wilkinson [22], for example, stresses how the knowledge that people have about technological risks and their relationships with natural and environmental hazards is associated with processes of discourse that are opened to be debated and to be changed. Understanding the way people react in front of potential risks is a complex process. Beck [23], in his conceptualization of the risk society of the late XX’s, already specified the need to consider both the risk itself and its perception as the same thing and argued the risk awareness of citizens is oriented and given by science. Specifically, Beck focused the attention on the increasing risk of citizenship in the latest modernized societies, where there was a broader scientific understanding of risks and an increased need to generate services and actions to answer these risks.
This need to analyze the influence of the context in capturing public perceptions of risk of climate events related to climate change is also highlighted by experts of climate change, as it is considered that the risk’s perception includes, on the one hand, the socio-cultural factors influencing this perception, and on the other hand, the natural event itself, which consists of the hazard and the vulnerability associated to it [18,19].

2.2. SISM Methodology

SISM is a methodology developed in the frame of the IMPACT-EV FP7 research project [24], funded by the D.G. Research and Innovation of the European Commission. SISM is used in both social media analytics and as a methodology to evaluate the social impact of research [1]. Many studies use data from social media to obtain significant results in diverse fields of study in different ways. Pulido and colleagues [25] highlight the way these uses can vary from research that makes use of social media to generate and disseminate certain phenomena while others implement it as eye-tracking methodology [26] to explore changes in behavioral patterns related to different ways to be exposed to social media. Additionally, other studies have contributed with scientific knowledge on the way the social impact of research or the social impact of a phenomenon can be captured [2].
Consequently, social media research is a fruitful field. While some studies focused attention on the selection of specific keywords in Twitter to obtain results that can be relevant for policy-makers to respond to the needs of society [5], others use social media to monitor phenomena and to obtain complementary data to understand citizen’s concerns [2]. In this frame, the implementation of the assessment of the social impact of social media (SISM, social impact in social media), can combine quantitative and qualitative content analysis of the samples selected.
One of the main contribution of the SISM methodology regarding other methodologies is the distinction between dissemination and social impact, focusing the attention, in this last case, on the content’s analysis of Facebook posts or tweets to obtain evidence of social impact, including both potential and real social impact. Social impact is understood as a broad concept that considers the social transformations towards social goals defined by citizens through institutions such as the United Nations, as the U.N. Sustainable Developments Goals (SDGs) [8].
These analyses are done in a way in which what is relevant, in considering the number of tweets and Fb/posts with evidence of social impact, are the types of messages published and shared, specifically if they contain evidence of social impact or not. The evidence of social impact found can be both quantitative and qualitative [2].
Different studies implement the SISM methodology in different fields confirming that this is a methodology applied in social media analytics that can be used in very different fields.

3. Materials and Methods

3.1. Study’s Methodological Design

This study consists of four experiments. The first one is focused on testing the SISM methodology on the study of the social impact of hydrometeorological hazards events. The last three experiments are focused on studying citizenship’s social responses in front of meteorological phenomena which is or can be related to climate change. This study is framed in the research project M-CostAdapt. Rutas de adaptación al cambio climático en la zona costera Mediterránea. Superando los límites de la adaptabilidad, RTD Spanish National Plan (n° CTM2017-83655-C2-2-R) [27].
Although the study is not contextualized in a concrete geographical context, the four experiments have Catalonia and the Valencian Community (Spain) as main geographical references, as the research project MCostAdapt [27], from which this study emerges, specifically studied the impact of climate change in this part of the Mediterranean coasts in Spain. This fact also explains the selection of both languages, Catalan and Spanish, for the data collection and analysis of the collected tweets. Catalan, as well as Spanish, is spoken, among other regions, in Catalonia and the Valencian community. The analysis of the data includes the study of the geolocation of the tweets when this information is available.
The methodology implemented to conduct the study was the social impact on social media methodology (SISM). It consists of developing algorithms to search for and select tweets/posts throughout the social networks, combining the use of developers’ tools (such as Anaconda software) with social methods of investigation (coding, discourse analysis). In this investigation, the SISM methodology is implemented as social media analytics [25].
This article analyses the intentionality of citizens’ and the organization’s responses on Twitter in three different moments, from October 2018 to January 2020. In what follows, there is a description of the four experiments to facilitate the study’s replicability. 
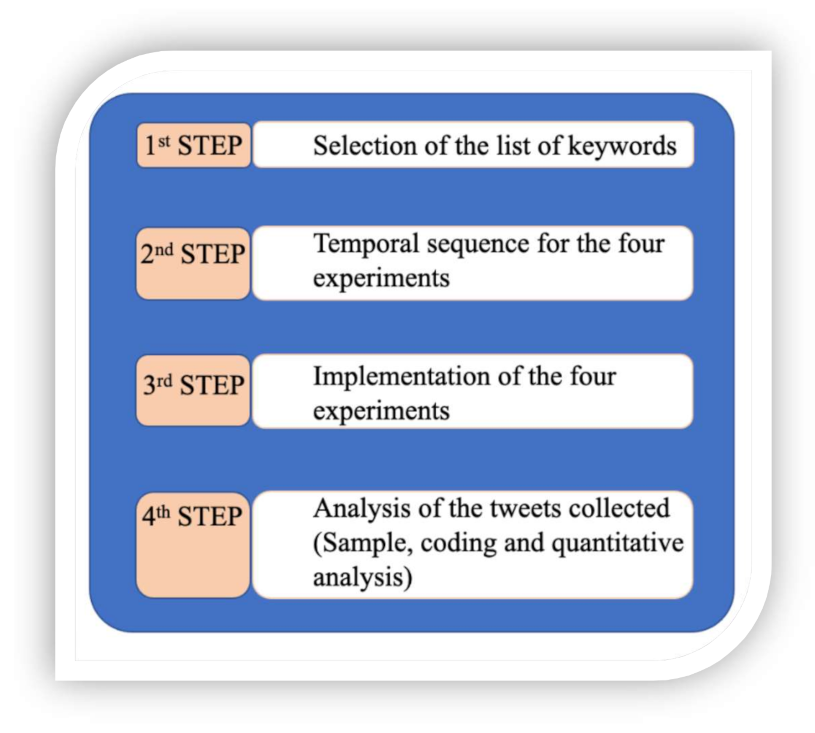
Figure 1 summarizes the design and implementation of the study.
First step: Selection of keywords related to the hydrological, meteorological and sea hazardous events and climate change in Catalan and Spanish. The use of these two languages used by potential Twitter’s users allows a comparison of the data in terms of regions, in the case of the tweets in Catalan, and by countries, in the case of tweets in Spanish. The selection of keywords consisted of (1) analysis of the news headlines about floods and sea storms published by La Vanguardia between 1981 and 2010 included in the PRESSGAMA database [18,19]. A total of 2950 news headlines related to floods and heavy rainfalls and 280 news headlines related to sea and surge storms were analyzed. Besides, some 90 news items from the Anuari Territorial de Catalunya published between 2011 and 2017 were analyzed. The most mentioned words were considered for selecting keywords used in the collection of data of this study; (b) brainstorming with the research members of the MCost-Adapt project based on the previous selection.
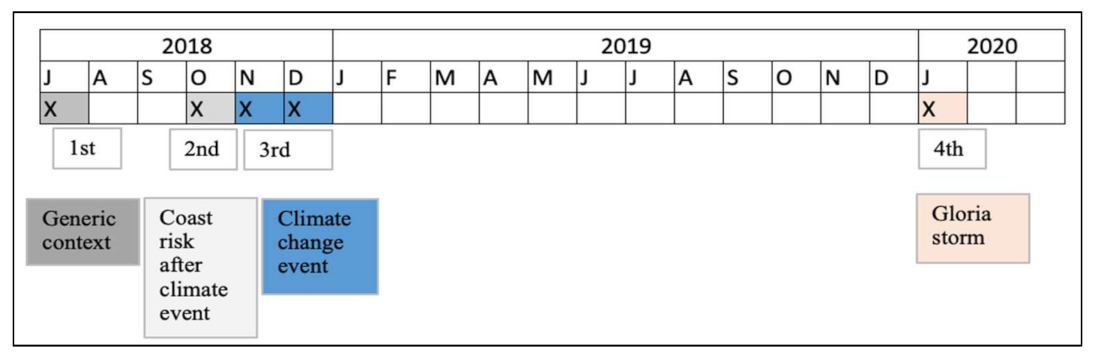
Second step: Design of the temporal sequence for the four experiments, which took place in four different moments (Figure 2):
The first experiment: May 2018. At that moment, there was not any relevant event happening. As mentioned, this experiment was used to test the implementation of the SISM in a study about the social impact of climate and hydrometeorological events phenomena in normal conditions.
The second experiment: October 2018. The Twitter search was done after the catastrophic flash floods that affected Mallorca, and the windstorm and flash floods produced by the cue of the hurricane Leslie, that affected the north of Spain and the south of France. However, those events did not affect catastrophically Catalunya either the Valencia region. It could be said that the SISM was implemented in a moment of moderate impacts due to hydrometeorological risks in the region of study, but with major sensibilization of the population due to the catastrophic events in Mallorca and France.
The third experiment: November–December 2018. The Twitter search was done during and after the COP14 event, the Climate Change Conference in Katowice (Poland).
The fourth experiment: January 2020. That was a moment of high perception of the risk and social awareness of climate change due to the Gloria storm. The SISM was used in a moment of high damage impact due to hydrometeorological risks in the analyzed region. On the other hand, while the October 2018 events were mainly characterized by heavy rainfall and floods, the Gloria storm was a compound event [28] constituted by heavy rains, floods, windstorm, and strong sea surge.
(1)
Generic context. May 2018
(2)
Hydrometeorological hazard that has catastrophic consequences in a neighbor region but moderate damage in the region of study: October 2018.
(3)
Climate change event (COP24): November–December 2018.
(4)
Hydrometeorological hazard that has catastrophic consequences in the region of study, probably related to climate change: Gloria storm, January 2020
Third step: Implementation of different searching strategies in the four experiments:
The first experiment (May 22–May 31, 2018): To extract messages from Twitter from a list of 11 keywords related to selected hydrometeorological phenomena and climate change both in Catalan and Spanish languages, and a list of four more keywords also in both languages, which were combined with the first 11 to limit the search and to obtain more concrete data. This first experiment’s data is not included in the analysis, as this experiment was only done to test the SISM. The main problems of the geolocation of the tweets were identified in this phase of the study, as explained in Section 3.2.
The second experiment (October 8–October 18, 2018): To extract messages from Twitter from a new combination of 29 keywords related to selected hydrometeorological phenomena and climate change both in Catalan and Spanish languages. Words selection was improved after the first experiment to avoid ambiguities and unnecessary noise.
The third experiment (November 29–December 9, 2018): To extract messages from Twitter using the combination of 29 keywords selected in the second experiment.
The fourth experiment (January 17–January 23, 2020): To extract messages from Twitter using the combination of 29 keywords selected in the second experiment.
In the implementation of these searching strategies, it is relevant to mention that the tweets captured in each temporal moment included all the tweets containing a combination of the keywords, from the final date of the period in which the experiment finalized to seven days before, taking into account that there was a limitation in the potential number of tweets which can be captured (45,000 tweets every 15 min).
Fourth step: Finally, 15,859 tweets were collected from Experiments 2, 3 and 4. From them, 1616 tweets were selected as a sample (see Section 3.2.1). This data was imported into NVivo to analyze. From the databases obtained, quantitative (frequencies) and qualitative evidence (analysis of conceptual terms) of the social impact of climate change in citizen’s (individually or in organizations) perceptions and reactions were obtained.
By quantitative evidence, the research team mean concrete data on:
-
The number of tweets obtained in each experiment.
-
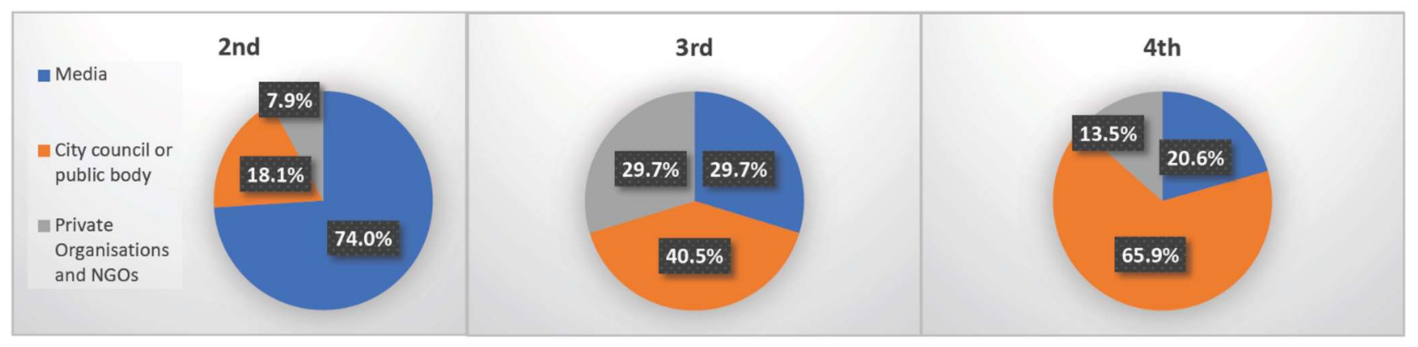
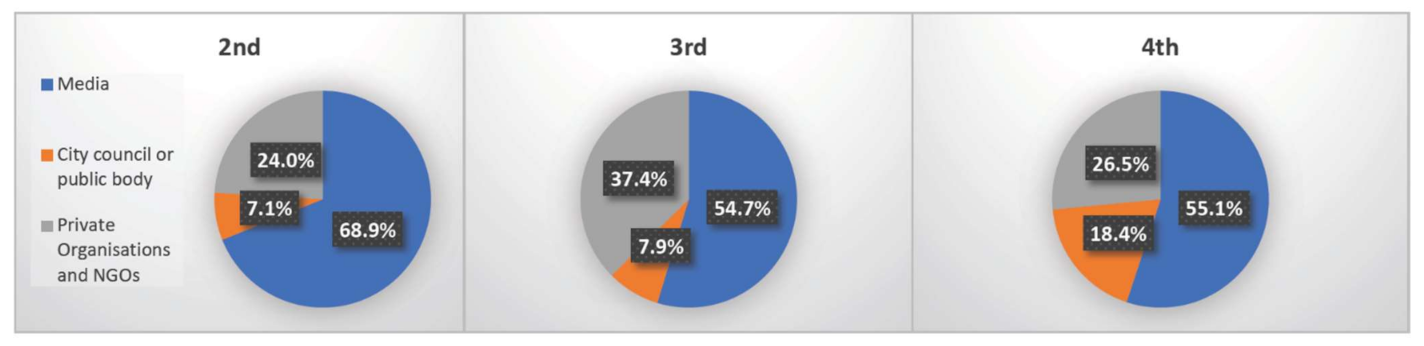
The number of tweets associated with a specific Twitter user’s profile (taking into account gender or a specific type of organization: media, city council or public body and private organizations or NGOs).
By qualitative evidence, the research team mean information obtained from a manual analysis (without the support of any software of qualitative analysis) about:
-
Identification of one concrete type of intentionality of each Twitter message (one by one) from the sample, to finally obtain the number of tweets by type of message’s intentionality in each experiment (in Catalan and Spanish).
-
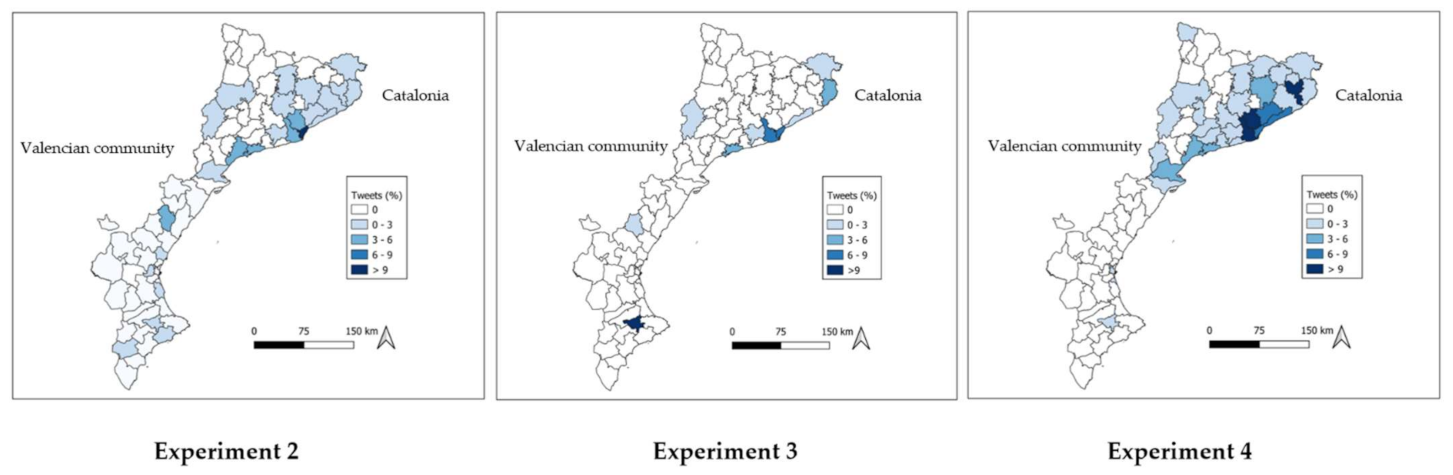
Identification of a term related to the geolocation of the tweet (when this information was available), identifying: 1) if the tweet contains or does not contain information regarding its geolocation and 2) highlighting the term used to identify this location (city, region, country). This information is obtained from the Twitter users’ profile when it is available.
From this manual analysis, the number of tweets by country (in the case of tweets in Spanish) or by region (in the case of the tweets in Catalan) was obtained by each experiment.

3.2. Detailed Description of the Experiments for the Data Collection

The first experiment: It took place in a moment in which there were not any significant climate phenomena taking place.
In this methodology’s testing of the SISM, the main difficulties identified were:
First difficulty: The list of keywords defined for the first experiment (first list, Table 1) contained very general terms which lead to an enormous sample of tweets, not specifically related to the aims of our study. It was necessary to cross this search with the second list of keywords (second list, Experiment 1, Table 1) to limit and achieve greater specificity in the search processes.
Second difficulty: many of the tweets captured in the first experiment did not contain information about the geolocation of the tweet, and in the cases this information was available, it was presented in very different forms: (1) the Twitter account is located; (2) the location appears as part of the message of the tweet; (3) the user is located; (4) location is named using different geographical frames of references (country, region, municipality or city).
Therefore, this first experiment allowed the research team to identify methodological problems of geolocation of the tweets from the searches done. These geolocation’s problems of the tweet’s searches were already identified in previous scientific contributions as was mentioned in the state of the art of this article. As a conclusion of this first experiment, and to identify clearly and to analyze with rigour the location of the tweets with this information available, the research team decided to explore all tweets of the sample from Experiments 2, 3 and 4, one by one manually, and to include in the analysis two necessary information: (a) if each tweet is located or not; (b) in the cases where the tweet is located, the identification of a geographical reference linked to the tweet (city, region or country).
At the end of the four experiments, 1363 (over 1616) Tweets captured contained geolocation information.
The second experiment: On this occasion, the Twitter search was done after a concrete meteorological phenomenon, specifically heavy rainfalls in the Mediterranean area, affecting the coast. After the first experiment, the list of keywords to be combined was modified to better adjust the searches to the study’s aim: to analyze which was the reaction of the citizen in the social media after a relevant natural phenomenon (both in Catalan and Spanish) (see Table 1).
The software used to capture the Tweets for the second, third and fourth experiments was Anaconda. An algorithm was designed to capture the Tweets from Twitter, in a concrete timeline, looking for the keywords displayed in Table 1.
This second experiment’s main contribution was testing the methodology in a situation of hydrometeorological hazard. It was used to establish the methodological pattern that would be repeated in Experiments 3 and 4.
The third experiment: Using the same keywords and methodology as in experiment 2 and 4, this experiment had as a focus the analysis of the social impact of climate issues in the social media and the social awareness and reactions of citizenship regarding climate change when an important event related to this phenomenon was taking place: The COP24 event.
The fourth experiment: Using the same keywords and methodology as Experiments 2 and 3, this experiment was focused on capturing the reactions of citizenship in a moment of high perception of the risk and potential heightened social awareness of the climate change: The Gloria storm.

3.2.1. Design of the Sample

A total amount of 1616 tweets were selected in the four experiments. The research team proceeded using the same algorithm for all the experiments. First, they calculated the sample size using the Formula (1).
n = Z 2 · N · d 2 d 2 · Z 2 + N 1 · E 2
  • Z = value obtained throughout the levels of confidence. The research team assumed 95% of confidence, as an accepted standard criterion (equivalent to Z = 1.96).
  • d = standard deviation, assuming that this is 0.5 since the real value is unknown, using the accepted standard criterion.
  • N = size of the population (in our case, 15,859 tweets).
  • n = sample size (in our case, 1616 tweets)
  • E = sample error, it was assumed a 5% (E = 0.05).
Table 2 summarizes the calculation of the sample size for the four experiments.
Then, the EXCEL software was used to produce a list of random numbers to select the Tweets from the Tweets collection from Twitter. Six collections of Tweets were obtained using Anaconda software (two for each experiment, one in Catalan and one in Spanish), as presented in Table 2 (see column “N”). Each Tweet was identified with an I.D., from 1 to N. Using EXCEL, a list of n random numbers (see column “Sample size” in Table 2) was generated. Then, the research team selected the n cases for each experiment, according to the sample size.

3.3. Description of the Method of Data Analysis

To analyze the Tweets selected for each experiment, the research team defined four independent variables: intentionality, type of organization, gender, and geolocation.
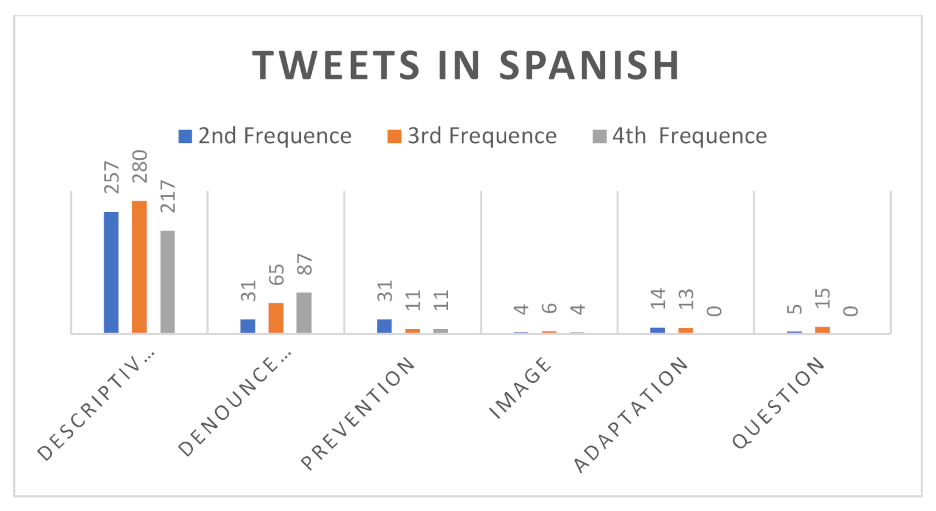
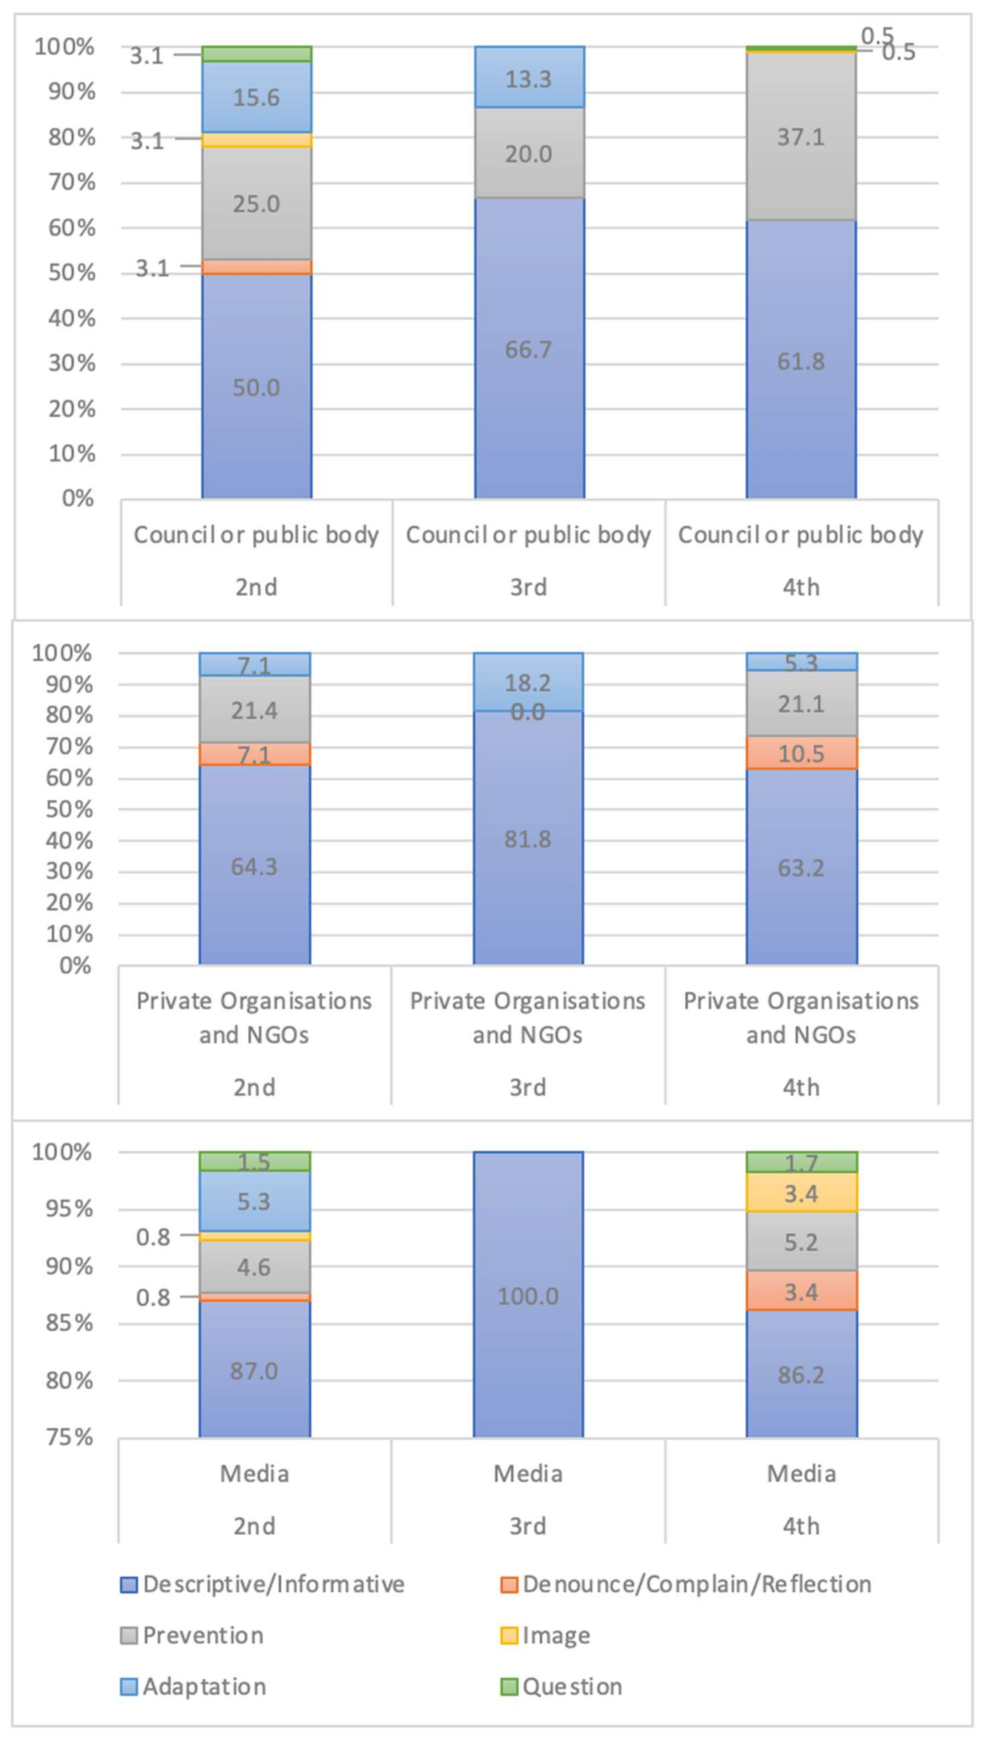
Intentionality was defined as the purpose of the action expressed through each specific tweet. The research team met several times to examine the contents of the tweets selected in the first experiment, used for testing the procedure and the methodology to follow. Then, after considering the main contributions of previous scientific literature on articles focused on studying the interactions between citizenship and social media around different topics and, as a result of an earlier analysis of the press news about hydrometeorological hazards and climate change, the research team defined five categories which contribute to answering to the aim of the study: (a) descriptive or informative, (b) denounce, complain, or reflection, (c) prevention, (d) image, (e) adaptation or action, and (f) make a question.
In this study, to match each tweet from the sample with one of these categories, the research team read one by one the content of each tweet and selected the category which predominantly fitted better with the message expressed by each tweet. It is considered a Tweet as “Descriptive or Informative” when it provides information about an event regarding hydrometeorological aspects (e.g., the rainfall in Catalonia (or Spain) affecting the coast, in October 2018). A Tweet is defined as “denounce, complain or reflection” when the Tweet’s intentionality is understood as denouncing, complaining or as making a reflection regarding a particular hydrometeorological event. Reflections or messages, including a link between specific hydrometeorological events and the climate change phenomena, are included in this category. “Prevention” was used to code the Tweets providing information to alert the population of potential risks or potential effects of those events. “Image” refers to a graphical content included in the Tweet which is predominant in the message. “Adaptation or action” is a category associated with Twitter’s messages when a concrete measure to adapt the context of citizens’ behavior to the situation is defined. Finally, “Question” covers the case in which the Tweet raises a question regarding those events.
Regarding Twitter’s profile, the research team distinguished when a Tweet is made by a collective actor (or an organization), or an individual one. For the former, different types of organization were identified. A Tweet can be written by the media (newsletter, T.V., radio, etc.), a City Council or a public body, and private organizations or NGOs. For the latter category, individual actor, the research team identified the gender (male, female or unclear—when it is not clear if the Tweet was writing either by a male or a female). Finally, geolocation collects the information regarding the Tweet localization (when available) as it is explained previously.

4. Results

4.1. SISM in Experiments about the Social Impact of Climate Change

The first experiment (May 22–May 31, 2018): This experiment allowed the researchers to consider the methodological difficulties to use keywords related to hydrometeorological events in terms of obtaining very generic data and to find a high number of tweets without or with very disperse information about their geolocation associated. No other findings can be related to this experiment as the data obtained was not further analyzed.
The second experiment (October 8–October 18, 2018): From the searching strategies described in Section 3.1, 644 tweets in Catalan and 4.240 tweets in Spanish were captured in this experiment. Two samples of 241 and 352 tweets, respectively, were analyzed. As mentioned before, this experiment took place at a moment when a hydrometeorological hazard, that has catastrophic consequences in a neighbor region but moderate damage in the region of study, took place. Regarding Twitter’s users’ profile, 26.6% were done by individual actors and 73.4% by collective actors or organizations in the case of the tweets in Catalan and 36.1% by individual actors and 63.9% by collective actors or organizations in the case of the tweets in Spanish (See Table 3).In Catalan, most of the Tweets analyzed (76.5%) contain descriptive or informative purposes, 8% of the tweets had prevention purposes, and 6.7% of the tweets were denouncing, complains or reflections (See Table 4 and Figure 3). In Spanish, the major trend was also descriptive and informative (75.1%). In comparison, 9.1% of the tweets had the intentionality of denouncing, complain or reflection, and 9.1% of the tweets had prevention purposes (See Table 5 and Figure 4).
The third experiment (November 29–December 9, 2018): On this occasion, the Tweets captured were 63 in Catalan and 748 in Spanish. The samples analyzed contains 54 and 254 tweets, respectively. Regarding the analysis of Twitter’s profiles, 41.3% were done by individual actors and 58.7% by collective actors or organizations in the case of Catalan tweets and 47.5% by individual accounts and 52.5% by collective or organizational accounts in the Tweets in Spanish. The COP24 event did not increase the total number of tweets related to climate change. However, the frequency of tweets with the “denounce, complaint and reflection” purposes increased to 11.9% in Catalan. Besides, in Catalan, 67.8% of tweets analyzed were descriptive or informative, and 8.5% were centered on the “adaptation” intentionality, which means that they were messages oriented to propose adaptation measures to the effects of hydrometeorological events happening (See Table 4). In Spanish, 71.8% of tweets were descriptive or informative, 16.7% of tweets were related to contents of denouncing, complain or reflection around the topic of climate change and 3.8% of the tweets formulated questions (See Table 5).
The fourth experiment (January 17–January 23, 2020): The moment in which this experiment took place (the Gloria storm) had an intense impact on citizenship reactions through social media such as Twitter. On this occasion, 4792 tweets were captured in Catalan and 5363 tweets were captured in Spanish. A total of 356 tweets from the samples in Catalan and 359 tweets in Spanish. Regarding Twitter’s users’ profiles, 20.8% were done by individual actors and 79.2% by collective actors or organizations in the Catalan tweets and 62.1% by individual and 37.9% in collective accounts in the Spanish tweets. Again, the highest intentionality’s category is “descriptive or informative” with 64.3% of the tweets in Catalan and 68% of the tweets in Spanish. However, it is relevant to mention that 25.4% of the Tweets in Catalan were focused on the prevention intentionality. In comparison, this category in the analysis of the Spanish tweets had only 3.4% of the tweets (See Table 4 and Table 5).

4.2. Comparing the Social Impact of Hydrometeorological Events in Different Meteorological Situations (Experiments 2, 3 and 4)

In this section, a comparative analysis of Experiments 2, 3 and 4 is offered, considering that each experiment was implemented in different hydrometeorological and social circumstances as it is explained above.

4.2.1. Intentionality

In comparing Experiments 2, 3 and 4, it is relevant to mention that in all the cases, the predominant intentionality’s category is “descriptive or informative”. However, it is interesting to note that both in the third experiment and in the fourth experiment, the percentage of “denounce, complaints or reflections” (in the third experiment) and of “prevention” tweets (in the fourth experiment) increased significantly. This coincides with the conference that was held on climate change in December 2018 (which affected having an increase of complaints or reflections about climate change and its effects on Twitter). Similarly, the Gloria storm coincided with a significant increase in prevention messages on Twitter. This indicates that behaviors in the Twitter experiment changes when some social event and natural phenomena linked to climate occur.
Additionally, in January 2020, Twitter echoed Gloria storm’s meteorological phenomenon and became a tool for disseminating information about it and posting preventive messages to avoid or to confront the risk, mainly from public authorities. However, the most relevant difference regarding Tweets’ intentionality captured in Catalan and Spanish is precisely on the preventive messages. In the case of Tweets in Spanish, there was a lower incidence of prevention Tweets than in the case of Tweets in Catalan. This can be explained because the geographical scope of the tweets in Spanish goes beyond the Iberian Peninsula (it also includes Latin American countries), which did not suffer the effects of the Gloria storm (which hit the Iberian Peninsula) and specifically affected the Mediterranean coast which is the object of this study, specifically Catalunya and the Valencian community. Thus, in this case of the Catalan tweets, the number of preventive messages is much higher than in the Spanish tweets.

4.2.2. Twitter’s Users’ Accounts

The tweets’ distribution regarding the characteristics of Twitter’s users’ profile in the three experiments (Exp. 2, Exp. 3 and Exp. 4) is composed of 708 tweets coming from individual actors and 1071 tweets coming from collective actors, organizations or institutions.
Concerning the distribution by gender of the tweets coming from individual accounts, 96 tweets were done by men and 28 by women in Catalan tweets, while in 11 cases the gender was unclear. In the case of the total of Spanish tweets, from the total number of tweets analyzed in the three experiments, 277 were done by men, 110 by women and 66 were unclear in gender terms.
Regarding the tweets coming from collective actors or organization’s accounts, in the second experiment, most of the tweets were posted by media organizations (press, T.V., radio). This trend completely changed in the case of tweets in Catalan, both in the third experiment and the fourth experiment in which the predominant profile in both cases was city council or public bodies. However, this change did not appear in the Spanish tweets’ analysis, as the Spanish Tweets coming from media organizations were in the three experiments predominant, with more than half of the analyzed tweets (Figure 5 and Figure 6). In the case of Tweets in Catalan, the research team must highlight the role of the City councils or the public bodies (especially police agencies or firefighters or emergency services), which accounted for almost half (40.5%) or more than a half (66%) of the Tweets analyzed for Experiments 3 and 4, respectively.
As mentioned, in the case of tweets in Spanish, the highest percentage was always the tweets issued by the media. The public authorities in none of the three experiments accounted for a relevant percentage of the tweets; by contrast, those posted by private organizations or NGOs were around a quarter (or even more than one third) of the Tweets posted.

4.2.3. Geolocation of Tweets

The information available about geolocation analyzed in the Tweets from the samples for Experiments 2, 3 and 4 is presented in Table 6 and Figure 7, which show the distribution of tweets in Catalan by regions, and in Table 7 which shows the distribution of tweets in Spanish by countries.
In the case of tweets in Catalan, in Experiment 2, the most mentioned regions in the Twitters’ user’s profiles are Balear Islands, Barcelonès, Tarragonès and Baix Camp, in Experiment 3, they are Balear Islands, Valencia and Baix Llobregat and Barcelonès and in Experiment 4, they are Vallès Occidental, Baix Llobregat, Vallès Oriental and Barcelonès.
Figure 7 show the distribution of tweets in Catalonia and the Valencian community. Balear Islands are not represented in the maps. Besides, some locations in Table 6 were not named as a concrete region in the tweets analyzed and they are not included in the maps. These cases are highlighted with (*) in Table 6.
In the case of the Spanish Tweets, the most mentioned countries in Experiment 2 are Spain, Mexico, Nicaragua and the United States, in Experiment 3 they are Mexico, Colombia, Spain and Ecuador and in Experiment 4 they are Spain, Argentina, Venezuela and Mexico.

4.3. Cross-Analysis

4.3.1. Intentionality and Collective Accounts

Table 8 and Table 9 show the result of crossing the intentionality with the type of organization, for the three experiments, both in Catalan and Spanish. In all cases, the chi-square is significant (less than 0.05). That means that the trends which are detected regarding the type of intentionality of the tweets and the organization type are significant (the relationship is not due to chance). If the Tweets in Catalan made by the media (press, T.V., radio, etc.) are looked at, they tend to be mostly informative or descriptive (87% in the second experiment; 100% in the third, and 86.2% in the fourth). On the other hand, if the prevention messages are examined, then it is found that they are mostly done by the city councils or by public bodies (police, emergency services, etc.): 25% in the second experiment, 20% in the third and 37.1% in the fourth. In the case of private organizations or NGOs, they also posted preventive messages. Both city councils and public bodies and organizations posted tweets with the intentionality of promoting adaptive measures or actions (providing answers or making proposals to face the effects of hydrometeorological events or climate challenges).
In the case of Tweets in Spanish, it can be affirmed the same about the trends that the research team identified in the analysis of the results: The chi-square is always less than 0.05, so the correlations between intentionality and type or organization are not due to chance. There is a relationship between who makes the tweet and the intentionality of that tweet. Thus, again the research team observes that the media mainly inform or describe the meteorological phenomena observed. On the other hand, and even though both city councils, public bodies and private organizations or NGOs also post mainly informative or descriptive tweets, it is also true that it can be detected a significant tendency to make tweets to prevent (especially in the case of city councils or public bodies), or denounce (in the case of private organizations or NGOs).
In Figure A1 (see Appendix A), it can be visually appreciated these trends, in the case of tweets in Catalan. Most of the tweets content informative or descriptive messages. However, when comparing the types of organizations posting tweets of the samples, the city councils or public bodies mostly tend to make a significant number of tweets to prevent the effects of the hydrometeorological events (much more than in the case of other organizations and the media). On the contrary, private organizations or NGOs tend to make more tweets of a complaint and offer more responses (adaptations) than the media or the public authorities.
In turn, Figure A2 (see Appendix A) summarizes the results in the case of the Tweets in Spanish. Regarding the Spanish Tweets, as in the Catalan Tweets, the most predominant category are the tweets devoted to providing information or making descriptions. This is the case for the media: more than eight Tweets over ten are informative/descriptive ones (in the fourth experiment, this trend increased to nine out of ten tweets). Prevention also is remarkable in the case of media and city councils or other public bodies. This is especially the case for the hydrometeorological events (the floods and heavy storms in October 2018 and the Gloria storm in January 2020). Instead, denouncing appears more often among private organizations or NGOs.

4.3.2. Intentionality and Individual Accounts (by Gender)

When analyzing the results according to gender, the research team did not observe that different trends are depending on whether the person making the tweet is a man or a woman. The chi-square test is not significant in any of the cases. Neither do other statistical measures of linear association yield significant results (likelihood ratio, lambda, Goodman and Kruskal tau, nor the uncertainty coefficient). Nor are the symmetry tests (Phi, Cramer’s V and coefficient of contention) are significant. This means that gender is not a variable that explains the differences between men and women according to the tweet’s intention.
On the contrary, the tweet’s intention does not depend on who does it (either male or female). If we look at Table 10 and Table 11, it can be observed that mostly both men and women, in the three experiments, and both in the case of Catalan Tweets and Spanish tweets, tend to have the intention of describing and/or informing. More men posted Tweets of denouncing, complaining, or reflection in the second experiment (Catalan) and found more women making more complaints, denouncing or making reflections related to climate change in the fourth experiment (Catalan).
In the case of Tweets in Spanish, the same things happened. There is no relationship between gender and the type of message made on Twitter, except the second experiment, where it is detected a significant chi-square equal to 0.000, which is a statistically significant difference between the expected frequencies and the observed frequencies. That suggests that in the second experiment the researchers can assume that there is a relationship between gender and the type of message statistically significant.
Table 11 shows that women inform more than men (77.8% versus 68.9% respectively) in the second experiment. They also denounce more. However, men are the ones who make a higher number of prevention Tweets (9.5% versus 3.7% respectively) in this second experiment. In the other two experiments, no clear gender trends can be identified. More women denounce, but that is not significant.

5. Discussion

One of this paper’s main contributions is to provide scientific evidence of the different intentionality of Twitter’s messages related to hydrometeorological events that are or can be associated with climate change. Citizens, individually or as members of organizations or institutions, are key social actors in understanding and creating knowledge about natural phenomena. This knowledge is relevant to prevent and know how to react in front of hydrometeorological events and define ways to translate the information shared through social media into concrete measures or actions.
Predominantly, Twitter is used to inform and describe the circumstances and risks associated with hydrometeorological events. However, in concrete situations, the preventive purpose or the denounce, the reflection and/or the complaint intentionality can also become relevant, mainly when an international event focused on climate change occurs or when a catastrophic hydrometeorological event is happening. In that sense, Twitter is a tool for increasing social awareness and reflection about the connections between specific hydrometeorological events and climate change phenomena. By contrast, messages with content related to the adaptation are more present when a significant event took place near the location of Twitter’s users, producing damages that directly affect people’s lives and environments. In these cases, Twitter becomes a useful tool to spread information faster about potential risks to citizens and disseminate information about the most efficient way to react to these risks. This element can be particularly relevant to vulnerable communities affected by natural disasters when other ways of disseminating relevant information for people’s safety in moments of natural disasters are not available.
The individual or collective actors’ profile is also relevant to understand the intentionality of Twitter’s messages. There is no relevant difference between the kind of messages posted by men or women regarding individual actors. Concerning collective actors, when there is no significant hydrometeorological event happening, the media organizations are very active in posting information through social media on climate’s issues. The main Twitter’s messages launched by the media are descriptive or informative. However, when a relevant international event on climate change is organized or when a natural disaster as the Gloria storm is happening affecting the territory, the role of governmental or public bodies is more active. It allows concluding that the local or regional institutions have Twitter as one relevant tool in their communication strategies with citizenship regarding climate issues. Prevention is another of the most frequent intentionality in messages on Twitter of governmental or public bodies in front of hydrometeorological events while denouncing, complaining, or making a reflection is more common intentionality in the case of private or non-governmental organization’s messages.
Another relevant contribution from this article is the relevance of providing evidence of the implementation of the SISM methodology in studying the social impact of climate change. However, this study has limitations that could be further explored in future analyses. The study of the potential reach of the communication and transmission of messages associated with hydrometeorological events through Twitter could be further analyzed, not only focusing on the attention on the samples of Tweets captured but also specifying and analyzing the ones that are more retweeted. Additionally, the automatization of the content’s analysis about the intentionality of the messages and the information of the geolocation of the Tweets captured would facilitate the replicability of this study.
Relevant questions emerge from this analysis, such as to what extent some messages through Twitter, with specific intentionality, have an impact in defining more efficient responses to hydrometeorological events. It would be interesting to know if these responses can help define better strategies to be adapted, prevent and stop climate change, and contribute to a more global sustainable development.
Twitter and other social media are already a tool to promote the active participation of citizenship in the debate, discussion and definition of strategies and measures to respond to climate change. This study contributes with insights about the relevance of the intentionality of the message and Twitter’s users’ profile in a deeper understanding of the social impact of climate change.

6. Conclusions

Science can contribute to making global and sustainable development possible. In this article, natural and social scientists have joined their efforts and previous scientific knowledge to provide an overall understanding of how citizens and governmental and non-governmental organizations in current societies react through Twitter in front of hazardous hydrometeorological events, which can be connected to climate change. Social media is an active tool for the co-creation of knowledge about the citizen’s understanding of a concrete topic and can activate dynamic processes of scientific knowledge’s construction [29].
The results obtained highlight the relevance of (1) using the SISM methodology for studying the social impact of hydrometeorological events; (2) considering the potentiality of this form of social media communication in preventing, informing, denouncing, complaining, adapting and questioning aspects related to climate change, differentiating about the more or less frequent type of response depending on the profile of the Twitter’s user. The added value of this article respecting previous scientific contributions is the analysis of the diversity of internationality of the Twitters messages and the characteristics of Twitter’s profile accounts.
Social media are a dialogic space where changing perceptions, opinions and understanding are taking place continuously. This application can be used to design communication strategies that contribute to improving the knowledge that citizens and social and political organizations have about climate change and to inform from scientific evidence about the best ways to avoid and react in front of disasters as a consequence of the climate change. This content becomes relevant for professionals, civil servant and citizens as a whole, because it can be used for the definition of more efficient strategies of education, socialization and prevention in front the climate change and thus, to contribute to advance towards achieving a global and sustainable development for all.

Supplementary Materials

The following are available online at https://0-www-mdpi-com.brum.beds.ac.uk/2071-1050/13/6/3579/s1, Six files containing the data set corresponding to the six experiments conducted in SPSS format (*.sav) will be uploaded as a Supplementary Materials in the submission process.

Author Contributions

All authors have made relevant contributions: conceptualization: M.C.L., E.O.; methodology: J.D.-P., M.L.-B.; software: J.D.-P.; validation: E.O., M.C.L., J.D.-P., M.L.-B.; formal analysis: E.O., J.D.-P., M.L.-B.; investigation: E.O., M.C.L., M.L.-B., J.D.-P.; resources: M.C.L., E.O., M.L.-B.; J.D.-P.; data curation: J.D.-P.; writing—original draft preparation: E.O., J.D.-P., M.L.-B.; writing—review and editing: E.O., J.D.-P.; M.L.-B., M.C.L.; visualization: M.L.-B., J.D.-P.; supervision: M.C.L., E.O.; project administration: J.D.-P.; funding acquisition: E.O. All authors have read and agreed to the published version of the manuscript.

Funding

The APC was funded by the Consolidated Research Group on Sociological Theory and Social Impact of Research (SGR 2017 01589).

Institutional Review Board Statement

Not applicable. Regarding ethical considerations, the present research adheres to international ethical criteria related to social media data collection and corresponding analyses; in particular, we have followed the ethical guidelines for social media research supported by the Economic and Social Research Council (UK) [30] and Ethics in Social and Humanities Sciences of the European Commission [31]. Furthermore, we have perceived the risk of harm to and conserved the anonymity of users. Additionally, we have read the terms, conditions and legalities of each of the social media channels, and we have used only public information without identifying any user. Likewise, the data were appropriately coded and anonymized to avoid the possibility of traceability. Sets of data have been secured, saved, and stored. The dataset analyzed and the calculations performed are available in the Supplementary Materials (dataset). We cannot share all raw data due to the current terms of the social media channels and the General Data Protection Regulation (GDPR).

Informed Consent Statement

Not applicable.

Data Availability Statement

Data is contained within the article or supplementary material. The data presented in this study are available in supplementary material here.

Acknowledgments

This research has been carried out under the framework of the “Spanish project M-CostAdapt” (FEDER/MICINN-AEI/CTM2017-83655-C2-2-R) of the Ministry of Science and Innovation.

Conflicts of Interest

The authors declare no conflict of interest.

Appendix A

Figure A1. Changes in the intentionality versus type of organisation during Experiments 2, 3 and 4 (Catalan): percent.
Sustainability 13 03579 g0a1
Figure A2. Changes in the intention versus type of organization during the four experiments (Spanish): percent.
Sustainability 13 03579 g0a2

References

  1. UNISDR. Terminology on Disaster Risk Reduction, 2009. United Nations. Available online: http://www.unisdr.org/eng/terminology/UNISDRterminology-2009-eng.pdf (accessed on 26 January 2021).
  2. Pulido, C.M.; Redondo-Sama, G.; Sordé-Martí, T.; Flecha, R. Social impact in social media: A new method to evaluate the social impact of research. PLoS ONE 2018, 13, e0203117. [Google Scholar] [CrossRef] [PubMed]
  3. Cabré-Olivé, J.; Flecha-García, R.; Ionescu, V.; Pulido, C.; Sordé-Martí, T. Identifying the relevance of research goals through collecting citizens’ voices on social media. Int. Multidisc. J. Soc. Sci. 2017, 6, 70–102. [Google Scholar] [CrossRef] [Green Version]
  4. Wandhöfer, T.; Taylor, S.; Walland, P.; Geana, R.; Weichselbaum, R.; Fernandez, M.; Sizov, S. Determining Citizens’ Opinions About Stories in the News Media. JeDEM-eJ. eDemocr. Open Gov. 2012, 4, 198–221. [Google Scholar]
  5. Chew, C.; Eysenbach, G. Pandemics in the Age of Twitter: Content Analysis of Tweets during the 2009 H1N1 Outbreak. PLoS ONE 2010, 5, e14118. [Google Scholar] [CrossRef] [PubMed]
  6. Pulido Rodríguez, C.; Villarejo-Carballido, B.; Redondo-Sama, G.; Guo, M.; Ramis, M.; Flecha, R. False News Around COVID-19 Circulated Less On Sina Weibo Than On Twitter. How To Overcome False Information? Int. Multidiscip. J. Soc. Sci. 2020, 9, 107–128. [Google Scholar] [CrossRef]
  7. Pulido, C.M.; Villarejo-Carballido, B.; Redondo-Sama, G.; Gómez, A. COVID-19 infodemic: More retweets for science-based information on coronavirus than for false information. Int. Sociol. 2020, 35, 377–392. [Google Scholar] [CrossRef] [Green Version]
  8. United Nations. Transforming Our World: The 2030 Agenda for Sustainable Development: Goal 13: Take Urgent Action to Combat Climate Change and Its Impacts. Sustainable Development Goals. 2015. Available online:htpps://www.un.org/sustainabledevelopment/climate-change (accessed on 26 January 2021).
  9. Government of Catalonia. Ministry of Foreign Action, Institutional Relations and Transparency Advisory Council for Sustainable Development (CADS). The 2030 Agenda: Transform Catalonia, Improve the World. Report 3/2016. 2016. Barcelona: Government of Catalonia. Available online: http://cads.gencat.cat (accessed on 26 January 2021).
  10. Pejić Bach, M.; Pulido, C.M.; Sušac Vugec, D.; Ionescu, V.; Redondo-Sama, G.; Ruiz-Eugenio, L. Fostering Social Project Impact with Twitter: Current Usage and Perspectives. Sustainability 2020, 12, 6290. [Google Scholar] [CrossRef]
  11. Llasat, M.C.; Turco, M.; Quintana-Seguí, P.; Llasat-Botija, M. The snowstorm of 8 March 2010 in Catalonia (Spain): A paradigmatic wet-snow event with a high societal impact. Nat. Hazards Earth Syst. Sci. 2014, 14, 427–441. [Google Scholar] [CrossRef]
  12. De Brujin, J.A.; Moel, H.; Jongman, B.; De Ruiter, M.; Wagemaker, J.; Aerts, J. A Global database of historic and real-time flood events based on social media. Sci. Data 2019, 6, 1–12. [Google Scholar] [CrossRef]
  13. Ghahremanlou, L.; Sherchan, W.; Thom, J.A. Geotagging Twitter Messages in Crisis Management. Comput. J. 2015, 58, 1937–1954. [Google Scholar] [CrossRef]
  14. Middleton, S.E.; Middleton, L.; Modaferi, S. Real-time crisis mapping of natural disasters using social media. IEEE Intell. Syst. 2014, 29, 9–17. [Google Scholar] [CrossRef] [Green Version]
  15. Fohringer, J.; Dransch, D.; Kreibich, H.; Schröter, K. Social media as an information source for rapid flood inundation mapping. Nat. Hazards Earth Syst. Sci. 2015, 15, 2725–2738. [Google Scholar] [CrossRef] [Green Version]
  16. Smith, L.; Liang, Q.; James, P.; Lin, W. Assessing the utility of social media as a data source for flood risk management using a real-time modelling framework. J. Flood Risk Manag. 2017, 10, 370–380. [Google Scholar] [CrossRef]
  17. De Brujin, J.A.; De Moel, H.; Jongman, B.; Wagemaker, J.; Aerts, J. TAGGS: Grouping Tweets to Improve Global Geoparsing for Disaster Response. J. Geovis. Spat. Anal. 2018, 2, 2–14. [Google Scholar] [CrossRef] [Green Version]
  18. Llasat, M.C.; Llasat, M.; Barnolas, M.; López, L.; Altava-Ortiz, V. An analysis of the evolution of hydrometeorological extremes in newspapers: The case of Catalonia, 1982–2006. Nat. Hazards Earth Syst. Sci. 2009, 9, 1201–1212. [Google Scholar] [CrossRef] [Green Version]
  19. Llasat, M.C.; Llasat-Botija, M.; López, L. A press database on natural risks and its application in the study of floods in Northeastern Spain. Nat. Hazards Earth Syst. Sci. 2009, 9, 2049–2061. [Google Scholar] [CrossRef] [Green Version]
  20. Cardona, O. The Need for Rethinking the Concepts of Vulnerability and Risk from a Holistic Perspective: A Necessary Review and Criticism for Effective Risk Management. In Mapping Vulnerability: Disaster, Development and People; Bankoff, G., Frerks, D., Hilhorst, D., Eds.; Earthscan Publishers: London, UK, 2004; Chapter 3; pp. 2–18. [Google Scholar]
  21. Albizua, A.; Zografos, C. A Values-Based Approach to Vulnerability and Adaptation to Climate Change. Applying Q methodology in the Ebro Delta, Spain. Environ. Policy Gov. 2014, 24, 405–422. [Google Scholar] [CrossRef]
  22. Wilkinson, I. Social theories of risk perception: At once indispensable and insufficient. Curr. Sociol. 2001, 49, 1–22. [Google Scholar] [CrossRef]
  23. Beck, U. Risk Society. Towards a New Modernity; Sage: London, UK; New York, NY, USA, 1992; pp. 1–272. [Google Scholar]
  24. European Commission. 7th Framework Program of Research. D.G. Research and Innovation 2014–2017. In IMPACT-EV. Evaluating the Impact and Outcomes of European SSH Research; Grant agreement ID: 613202; European Commission: Bruxelles, Belgium, 2014. [Google Scholar]
  25. Pulido, C.M.; Mara, L.C.; Ionescu, V.; Sordé-Martí, T. Social impact of psychological research on well-being shared in social media. Front. Psychol. 2020, 11, 1–12. [Google Scholar] [CrossRef] [PubMed]
  26. Hussain, Z.; Simonovic, B.; Stupple, E.J.N.; Austin, M. Using Eye Tracking to Explore Facebook Use and Associations with Facebook Addiction, Mental Well-being and Personality. Behav. Sci. 2019, 2, 19. [Google Scholar] [CrossRef] [Green Version]
  27. Ministerio de Economía, Industria y Competitividad del Gobierno de España. Programa Estatal de Fomento de la Investigación Científica y Técnica de Excelencia. Subprograma Estatal de Investigación, Desarrollo e Innovación. Plan Estatal de Investigación Científica y Técnica y de Innovación. 2018–2020. In MCost-Adapt. Rutas de adaptación al Cambio Climático en la Zona Costera Mediterránea. Superando los límites de la adaptabilidad; CTM2017-83655-C2-2-R; Ministerio de Economía, Industria y Competitividad del Gobierno de España: Paseo de la Castellana, Spain, 2018. [Google Scholar]
  28. Sanuy, M.; Rigo, T.; Jiménez, J.A.; Llasat, M.C. Classifying compound coastal storm and heavy rainfall events in the north-western Spanish Mediterranean. Hydrol. Earth Syst. Sci. 2020. [Google Scholar] [CrossRef]
  29. Flecha, R. Contributions from Social Theory to Sustainability for all. Sustainability 2020, 12, 9949. [Google Scholar] [CrossRef]
  30. Economic and Social Research Council. Using Social Media. Available online: https://esrc.ukri.org/research/impact-toolkit/social-media/using-social-media/ (accessed on 18 March 2021).
  31. Ethics in Social Science and Humanities, 2018. European Commission. Available online: https://ec.europa.eu/research/participants/data/ref/h2020/other/hi/h2020_ethics-soc-science-humanities_en.pdf (accessed on 18 March 2021).
Figure 1. Study’s methodological design.
Sustainability 13 03579 g001
Figure 2. Temporal axis for the four experiments.
Sustainability 13 03579 g002
Figure 3. The intentionality of the tweets selected by experiment (Catalan).
Sustainability 13 03579 g003
Figure 4. The intentionality of the tweets selected by experiment (Spanish).
Sustainability 13 03579 g004
Figure 5. Distribution of tweets by type of organizations (Catalan).
Sustainability 13 03579 g005
Figure 6. Distribution of tweets by type of organizations (Spanish).
Sustainability 13 03579 g006
Figure 7. Distribution of tweets in Catalonia and the Valencian community in Experiment 2, Experiment 3 and Experiment 4.
Sustainability 13 03579 g007
Table 1. Keywords related to hydrometeorological events and climate change combined in the searching strategies.
1st Experiment2n, 3rd and 4th Experiments
1st list (keywords both in Catalan and Spanish):Catalan:Spanish:
(1) litoral (1) baixos(1) bajos
(2) temporal(2) bandera(2) bandera
(3) tormenta/tempesta(3) cabdal(3) caudal
(4) playa/platja(4) calamarsa(4) granizo
(5) riada/riuada(5) costa(5) costa
(6) oleaje/onatge(6) danys(6) daños
(7) costa(7) desbordament(7) desbordamiento
(8) inundaciones/inundacions(8) desperfe15ctes(8) desperfectos
(9) pluges(9) fort(9) fuerte
(10) riera(10) infraestructures(10) infraestructuras
(11) costa(11) INUNCAT(11) INUNCAT
2nd list: (12) inundacions(12) inundaciones
(1) canvi climàtic/cambio climático(13) litoral(13) litoral
(2) gestió/gestión(14) NEUCAT(14) NEUCAT
(3) alerta(15) onatge(15) oleaje
(4) daños/danys(16) pedra(16) piedra
(17) pèrdua(17) pérdida
(18) platges(18) playas
(19) platja(19) playa
(20) pluges(20) lluvias
(21) riera(21) riera
(22) rissaga(22) rissaga
(23) riu(23) río
(24) riuades(24) riadas
(25) sorra(25) arena
(26) tempestes(26) tormentas
(27) temporal(27) temporal
(28) VENTCAT(28) VENTCAT
(29) vermella(29) roja
Table 2. Sample size calculation.
NSample Size n (Z = 1.96, E = 0.05)
2nd experiment (Catalan)644241
2nd experiment (Spanish)4249352
3rd experiment (Catalan)6354
3rd experiment (Spanish)748254
4th experiment (Catalan)4792356
4th experiment (Spanish)5363359
Total15,8591616
Table 3. Distribution of tweets according to the profile of Twitter’s users (individual or collective) by experiment and by language.
2nd Catalan2nd Spanish3rd Catalan3rd Spanish4th Catalan4th Spanish
Individual64 (26.6%)127 (36.1%)26 (41.3%)194 (47.5%)74 (20.8%)223 (62.1%)
Collective177 (73.4%)225 (63.9%)37 (58.7%)214 (52.5%)282 (79.2%)136 (37.9%)
Total241 (100%)352 (100%)63 (100%)408 (100%)356 (100%)359 (100%)
Table 4. Description of the intentionality of the tweets selected by experiment (Catalan).
2nd 3rd 4th
Freq.PercentageFreq.PercentageFreq.Percentage
Descriptive/Informative18276.54067.822564.3
Denounce/Complain/
Reflection
166,7711.9205.7
Prevention19835.18925.4
Image31.35051.4
Adaptation135.548.520.6
Question52.1596.892.6
Total2381004100350100
Table 5. Description of the intentionality of the tweets selected by experiment (Spanish).
2nd 3rd 4th
Freq.PercentageFreq.PercentageFreq.Percentage
Descriptive/Informative25775.128071.821768.0
Denounce/Complain/Reflection319.16516.78727.3
Prevention319.1112.8113.4
Image41.261.541.3
Adaptation144.1133.300
Question51.5153.800
Total342100390100319100
Table 6. Distribution of Tweets in Catalan by regions of Catalunya and Valencian Community. (*: regions not included in the maps)
2 Exp%3 Exp%4 Exp%
Alicante0.7Alt Empordà2.8Alt Camp1.6
Alt Empordà1.3Alt Penedès2.8Alt Empordà2
Alt Penedès0.7Andorra2.8Alt Penedès0.8
Bagès0.7Baix Empordà5.6Anoia1.2
Baix Camp4.6Baix Llobregat8.3Bages1.2
Baix Ebre0.7Barcelonès8.3Baix Camp3.7
Baix Empordà2* Castellón2.8Baix Ebre3.7
Baix Llobregat3.3* Illes Balears38.9Baix Empordà1.6
Baix Maestrat0.7Maresme2.8Baix Llobregat9.8
Barcelonès17.8Safor2.8Baix Penedès0.4
Berguedà0.7Segrià2.8Barcelonès8.5
Costera0.7Tarragonès5.6Berguedà0.4
Gironés2València13.9Conca de Barberà0.8
* Illes Balears38.8Total100* Empordà0.4
La Noguera0.7 Garraf2.4
La Selva0.7 Garrotxa0.4
Maresme1.3 Gironès13
Marina Alta0.7 La Garrotxa0.4
Osona1.3 La Noguera0.4
Plana Baixa1.3 La Selva2.8
Rosselló2 Maresme8.1
Safor0.7 Montsià2
Segrià2.6 Osona5.7
Serrans0.7 Pla de l’Estany0.8
Tarragonès4.6 Ribera Baixa0.4
* Terres de l’Ebre0.7 Ripollès1.2
València3.3 Segrià0.4
Vallès Occidental3.9 Tarragonès4.5
Vallès Oriental1.3 Terra Alta0.4
Total100 * Terres de l’Ebre1.2
Urgell0.4
València0.4
Vall d’Aran0.4
Vallès Occidental9.3
Vallès Oriental8.9
Total100
Table 7. Distribution of Tweets in Spanish by country.
2 Exp%3 Exp%4 Exp%
Argentina1.6Argentina7.2Alemania0.4
Bolivia0.4Bolivia0.8Argentina6.7
Chile1.2Chile1.1Australia0.4
Colombia4.7Colombia15.1Bolivia1.2
Costa Rica1.2Ecuador11.3Brasil0.4
Cuba0.4El Salvador0.8Chile2.4
Ecuador0.4España12.8Colombia3.2
El Salvador2.7Francia0.4Costa Rica1.2
España38.4Guatemala0.4Ecuador3.6
Guatemala2.7México20.8El Salvador0.8
Honduras1.6Panamá2.6España51.6
Inglaterra0.4Paraguay1.1Guatemala1.6
Italia0.4Perú1.1Japón0.4
México19Puerto Rico1.1México9.5
Nicaragua5.8República Dominican6Nicaragua0.4
Panamá2.3Uruguay0.8Panamá0.8
Perú1.6USA10.2Paraguay1.2
Puerto Rico0.4Venezuela6.4Perú1.6
República Dominican4.3Total100Puerto Rico2.4
Rusia0.4 República Dominican2.4
USA6.6 Rumania0.4
Venezuela3.9 Uruguay1.2
Total100 USA2.4
Venezuela4.0
Total100
Table 8. Intentionality versus the type of organization (Catalan). Percentage.
MediaA Governmental and Public BodyPrivate Organisations or NGOs
2nd3rd4th2nd3rd4th2nd3rd4th
Descriptive/Informative87.0100.086.250.066.761.864.381.863.2
Denounce/Complain/Reflection0.80.03.43.10.00.07.10.010.5
Prevention4.60.05.225.020.037.121.40.021.1
Image0.80.03.43.10.00.50.00.00.0
Adaptation5.30.00.015.613.30.07.118.25.3
Question1.50.01.73.10.00.50.00.00.0
Table 9. Intentionality versus the type of organization (Spanish): percentage.
MediaCouncil and Public BodyPrivate Organisations or NGOs
2nd3rd4th2nd3rd4th2nd3rd4th
Descriptive/Informative83.993.298.756.358.876.068.571.380.6
Denounce/Complain/Reflection2.61.70.00.05.94.09.315.013.9
Prevention7.72.61.325.017.620.013.02.52.8
Image1.30.00.00.00.00.00.03.80.0
Adaptation2.62.60.018.811.80.07.46.30.0
Question1.90.00.00.05.90.01.91.32.8
Table 10. Intentionality versus gender (Catalan): percent.
MaleFemaleUnclear
2nd3rd4th2nd3rd4th2nd3rd4th
Descriptive/Informative72.7100.056.475.066.756.060.081.80.0
Denounce/Complain/Reflection22.70.017.912.50.024.020.00.00.0
Prevention2.30.017.912.520.08.00.00.00.0
Image2.30.00.00.00.04.00.00.00.0
Adaptation0.00.00.00.013.30.00.018.20.0
Question0.00.07.70.00.08.020.00.0100.0
Table 11. Intentionality versus gender (Spanish): percentage.
MaleFemaleUnclear
2nd3rd4th2nd3rd4th2nd3rd4th
Descriptive/Informative68.960.256.077.860.544.469.248.363.6
Denounce/Complain/Reflection14.923.339.018.534.253.318.841.427.3
Prevention9.52.93.03.70.02.26.80.00,0
Image2.70.00.00.02.60.01.76.90.0
Adaptation2.72.90.00.00.00.02.60.00.0
Question1.410.72.00.02.60.00.93.49.1
Publisher’s Note: MDPI stays neutral with regard to jurisdictional claims in published maps and institutional affiliations.

