Article

Advances on the Implementation of Circular Economy Techniques in Rural Areas in Colombia under a Sustainable Development Framework

by
Javier Rodrigo-Ilarri
1,*,
Camilo-A. Vargas-Terranova
2,
María-Elena Rodrigo-Clavero
1 and
Paula-A. Bustos-Castro
3
1
Instituto de Ingeniería del Agua y Medio Ambiente (IIAMA), Universitat Politècnica de València (UPV), 46022 València, Spain
2
Programa de Ingeniería Ambiental y Sanitaria, Universidad de La Salle, Bogotá 111711, Colombia
3
Quipus Consultores SAS, Cota 250010, Colombia
*
Author to whom correspondence should be addressed.
Sustainability 2021, 13(7), 3816; https://0-doi-org.brum.beds.ac.uk/10.3390/su13073816
Submission received: 21 February 2021 / Revised: 26 March 2021 / Accepted: 26 March 2021 / Published: 30 March 2021

Abstract

:
For the first time in the scientific literature, this research shows an analysis of the implementation of circular economy techniques under sustainable development framework in six municipalities with a depressed economy in Colombia. The analysis is based on solid waste data production at a local scale, the valuation of the waste for subsequent recycling, and the identification and quantification of the variables associated with the treatment and final disposal of waste, in accordance with the Colombian regulatory framework. Waste generation data are obtained considering three different scenarios, in which a comparison between the simulated values and those established in the management plans are compared. Important differences have been identified between the waste management programs of each municipality, specifically regarding the components of waste collection, transportation and disposal, participation of environmental reclaimers, and potential use of materials. These differences are fundamentally associated with the different administrative processes considered for each individual municipality. This research is a good starting point for the development of waste management models based on circular economy techniques, through the subsequent implementation of an office tool in depressed regions such as those studied.

1. Introduction

Colombia has a regulatory framework (Resolution 3754/2014) that promotes the articulation of the public cleaning service. However, scientific literature includes very few researches explaining and analyzing the singularities when applying circular economy techniques in rural areas, including the specific analysis of the promotion and contribution of key elements in terms of waste management under a sustainable development framework. Only very recently, some works have been focused on showing the progress of waste management on municipal economies with higher growth in the largest cities of the country, such as Bogotá and Medellín [1,2].
Based on the analysis carried out in large cities, forecasts are obtained regarding the solid waste production to be managed. These forecasts can be used as a first approximation by the entities in charge of environmental management in small municipalities. The particularities of the local economy of these municipalities are very different from those of the big cities and expose adverse economic situations. Therefore, solid waste management strategies must be established for the implementation, improvement and optimization of the provision of the public cleaning and waste management service under circular economy criteria. These strategies should include the design of waste collection routes, separation, recycling, treatment, and disposal methodologies.
Furthermore, management strategies must necessarily consider the establishment of actions aimed at strengthening local recyclers’ associations who carry out fundamental work in waste management at this municipal level. In this context, the implementation of circular economy techniques means a benefit for the community, reducing the environmental impacts associated with municipal solid waste management and minimizing the rejections deposited in landfills. Besides, other eco-efficiency promotion processes can be implemented with the use of raw materials other than waste, taking advantage of the production potential of agricultural activities in rural areas, as most of the municipalities under study [3].
Scientific literature shows that economic development and population growth imply the appearance of more populated and prosperous cities that demand a greater supply of goods and services which participate in the local and global market resulting in an increase in solid waste generation [4,5,6]. The generation of municipal solid waste (MSW) is a problem that requires comprehensive management due to the social, economic, and environmental impacts that they cause [7,8]. A safe management of municipal solid waste is, therefore, a persistent challenge in modern society [9].
Currently, the main trend in waste management is the circular economy [10], which focuses in promoting reuse and waste reduction, so that resources are used to the maximum and their useful life is extended [11,12]. In the same way, regarding the waste generated by the agro-industry, the composting technology has been sophisticated, evaluating the physicochemical characteristics of different raw materials, such as food waste or vegetable matter (fruits, wheat, cellulose). Through this technological development, the circular economy strategy for organic waste is promoted, not only in the use of waste, but also in the use that is given to composting by farmers [13]. However, the situation in emerging and developing economies is very different.
While developed countries try to implement comprehensive and sustainable waste management systems [14], emerging nations struggle to change waste disposal in uncontrolled landfills (open dumpsites) to its disposal in controlled or sanitary landfills [15,16].
Most of the world’s uncontrolled landfills are located in Africa, Latin America, and Asia, and impact directly on the public and environmental health of approximately 64 million people [17].
An example of the health problems that may arise due to the inadequate disposal of waste is the situation that occurs in Conakry, Guinea, in which waste is burned openly or disposed of in bodies of water, generating an increase in the morbidity of urban populations leading to increased mortality. This situation is produced by the gases emitted by the burning of waste that generate respiratory problems. Likewise, there is a significant presence of micro-plastics and pathogens in the water bodies used by the population, causing people to become poisoned or exposed to fatal diseases [18].
Thus, for example, in most African countries (54) less than 20% (11) of urban solid waste generated is disposed of in controlled landfills [19]. In China, depending on the region, this percentage increases to 30–60% [20]. In Latin America, there are countries, such as Brazil, where 60% of its municipalities use uncontrolled landfills to manage their MSW [21]. This is fundamentally due to the inexistence of waste management planning policies [22].
Therefore, although there are alternatives with lower environmental impact, landfilling is still the most widely used waste disposal method in developing countries. It is a cheap and well-known technology and with fewer problems than those generated by uncontrolled landfills [23,24].
With regard to recycling operations, while the European average is around 25%, China reaches 10% and Latin American countries barely reach 5% [25].
Low-and middle-income countries share several similarities regarding their socioeconomic conditions, in particular in having waste management systems that operate to low standards [26]. This situation creates the need for alternative ways of treating waste, leading to the appearance of informal waste activities (called the “informal waste sector”). The existence of this informal sector contributes to increasing recycling rates of many cities in low-and middle-income countries, reducing the volume of waste deposited in landfills and creating added value in the economic sector [27]. However, despite these benefits, the informal sector is also associated with negative social and economic conditions [28,29].
Approximately, 1% of world’s urban population is involved in the recovery value solid waste; in Latin America, Asia, and Africa, the work of these people accounts for nearly 30% of this recovery process [30].
Optimum MSW management system is an essential aspect to be considered in any development. It covers the optimization aspects in terms of technology and cost to achieve sustainability [31]. However, on many occasions it is intended to implement in rural areas waste management systems that are already implemented in urban areas with hardly any field studies. This means that MSW management systems in developing countries are generally inefficient, as they lack appropriate administrative and financial structures, good legislation, and adequate human resources [32].
Characteristics and composition of solid waste generated in rural areas are different from those urban areas. In order to implement an optimal waste management system, it is necessary to know the characteristics and composition of waste in rural areas, since it contains a large fraction of organic waste (more than 50% of the total), some amount of inorganic waste (glass, plastic, paper, metals) and a negligible amount of toxic waste [33].
There are studies than demonstrate the importance and value of measuring and assessing waste management systems quantitatively. For waste management, policy makers cannot manage what they cannot measure. Sound data is critically important to guide transitions to sustainable, circular waste management systems [34].
In order to implement and achieve optimal efficiency in solid waste management, each stage of the management system must be analyzed from an economic, environmental and social perspective [35]. The development of a municipal solid waste management plan is a complex process. Developing an efficient plan, quantifying and forecasting solid waste generation are essential components [36].

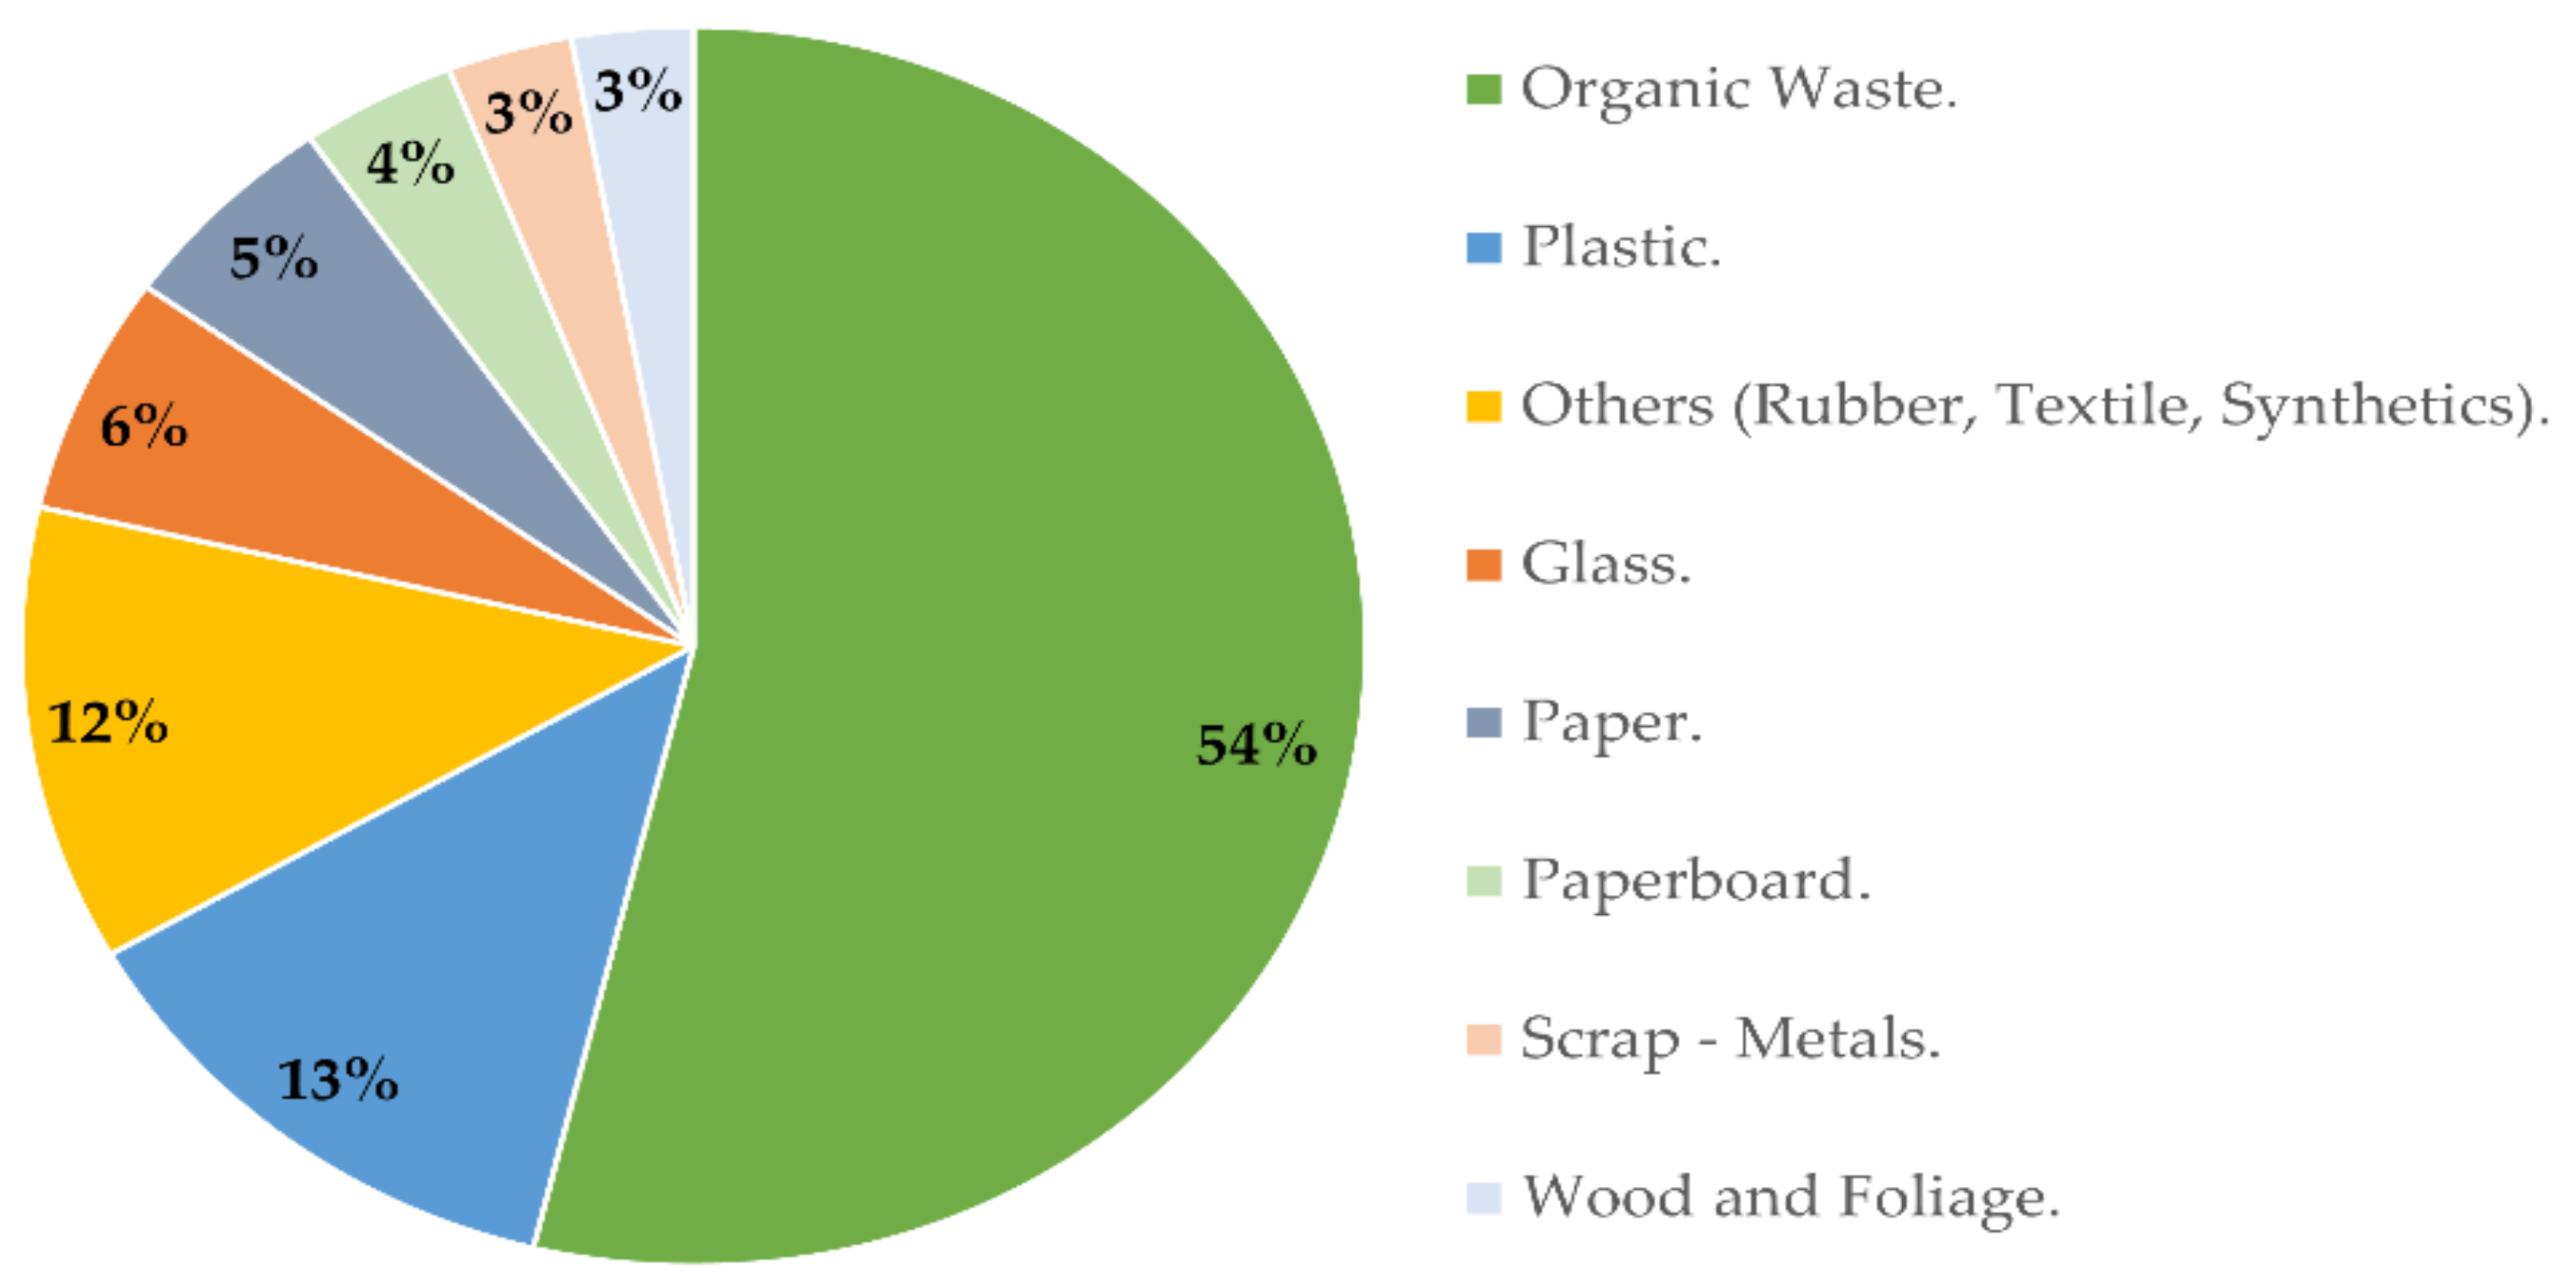
2. General Overview of Urban Solid Waste Management in Colombia

The transition from a waste management system based on a linear economy to one based on circular economy and how this translates into public policy is a global challenge. In the case of South American countries, MSW management is a great challenge, since its generation is continuously increasing [37]. In addition, there are other problems, such as inadequate waste disposal, financial insufficiency in urban systems and the presence of an informal recycling sector [38,39,40].
The most used system in Colombia for the elimination of waste is its disposal in landfills (97% of the total), including both controlled and uncontrolled landfilling. The waste accumulated in these facilities affects land recovery and generates environmental problems derived from the production of leachate and biogas. However, landfills are still chosen as the best option for waste disposal [41].
In 2018, in Colombia, an average of 30,973 t/day of solid waste was disposed of in all its municipalities, which corresponds to 97% of the waste that was generated at the national level. This waste disposal was done both in authorized and unauthorized sites. 89.5% of this disposal was done in sanitary landfills, contingency cells and treatment plants authorized by environmental authorities while 10.5% corresponds to unauthorized disposal sites in which temporary cells and open dumps are used. However, at the national level, landfills are still the predominant treatment system (56%) [42].
Additionally, 974,039 t of reusable material were reported in the country, with paper and cardboard constituting the highest percentage (55%), followed by metals (29%), plastics (10%), and glass, wood, and textiles [43].
Integral management of solid waste in Colombia is carried out in conjunction with the public cleaning service with the joint purpose of moving towards a circular economy. This group of policies seek to maintain the value of products and materials as long as possible, therefore considering a linear production and consumption model. Current policies promote education and innovation in terms of separation, use and treatment of solid waste [44].
The Colombian 2018–2022 development plan promotes the implementation of the circular economy strategy to encourage the economic, environmental, and social development of the country, trying to increase recycling and the use of solid waste with the purpose of reducing by 20% greenhouse gases by 2030, implementing comprehensive waste management throughout the country in order to improve the reusing of waste and strengthen educational programs [45].
In Colombia, municipalities are categorized according to their population and by the annual current income as established in article 6 of Law 617 of 2000. Being categorized allows to have certain kinds of administrative functions such as investment access, improvement of public management and the allocation and distribution of national transfers [46]. To be classified inside the fifth category a municipality must have a population between ten thousand one (10,001) and twenty thousand (20,000) inhabitants or show a current income between fifteen thousand (15,000) and twenty-five thousand (25,000) monthly legal minimum wages [47].
According to these administrative functions, as stated in Article 5 of Law 142 of 1994, it is the responsibility of the municipalities to ensure the efficient provision of solid waste public cleaning service to their inhabitants, either by official, private, mixed companies, or directly by the municipal administration [48].
This service is given according to the guidelines of the Comprehensive Solid Waste Management Plan (CSWMP) structured as a mandatory resolution. A municipality must approve a plan that contains the following programs: (i) Institutional management for the provision of the public cleaning service, (ii) generation of solid waste, (iii) collection, transportation and transfer, (iv) sweeping and cleaning of roads and public areas, (v) cleaning of coastal and riverside beaches, (vi) lawn mowing and pruning of trees in roads and public areas, (vii) washing of public areas, (viii) exploitation, (ix) inclusion of recyclers, (x) final disposal, (xi) management of special solid waste, (xii) management of construction and demolition waste, (xiii) solid waste management in rural areas, and (xiv) risk management [49].
In Colombia, the research fields have focused so far on the control of atmospheric pollution, on the design of technologies for the treatment of drinking water and domestic wastewater, and on public health strategies. However, the issue of solid waste management has not made significant progress. Currently, the only technology to treat waste is landfilling, showing most of the landfills operational and technical failures.
In Colombia, in 2018, only 974,039 tons of the total annual 11,305,145 tons of waste that were generated were reused. That means that only 8.61% of the total waste was reused. According to the Colombian national reports [42,43], the usual practice of MSW management begins with the voluntary separation at the source by the waste generators, the temporary storage and conditioning in waste collection centers, which are mainly used by productive sectors, and the reincorporation of these as secondary raw material in production lines such as cardboard, paper, glass and plastic products and foundries. Companies such as Peldar, Cartón de Colombia, Fibras Nacional, and Acerías Paz del Río stand out, leaders in the incorporation of recovered materials for the development of their processes [50,51,52,53,54,55].
So far, the integral management of solid waste in Colombia has been limited to formulating or updating management plans, but no analysis has been carried out on generation rates, nor has the quality of the provision of the public cleaning service been evaluated [56]. This is because at the administrative level efforts have been focused on complying with the collection and final disposal of waste.
In an international context, in solid waste management, it has been identified that in low- and middle-income countries, various problems recur [57]. Lack of capacity and technical skills was the most reported problem with a 30% incidence. In countries like Kenya and Brazil, the technical barrier arises in relation to the poor infrastructure of the public cleaning service. Similarly, in the case of the Philippines, the main and limiting barrier to be able to propose improvement actions in the collection and final disposal of waste is the lack of information on the composition of the waste, its quality, the prices of materials, and the employment situation of the workers.
When comparing cities in low-income countries, such as Colombia, the most common problems refer to technical difficulties and the ability to collect information on the conditions of service and its components.
The scientific literature includes few studies carried out in countries of the Latin American environment. An analysis of solid waste generation in Colombia [58] was based on gross domestic product (GDP). This analysis compared GDP in Colombia with that of countries such as Brazil and Bolivia, highlighting the inverse relationship between GDP and solid waste generation. In the case of Brazil, the production of waste per unit of GDP is lower compared to that of other countries, despite the fact that Brazil GDP is the highest in Latin America. On the contrary, in Bolivia, the generation of solid waste is higher compared to that of other countries, and Bolivian GDP is the lowest in the region. While Bolivia generates 92 tons of MSW for every million dollars of GDP, Brazil generates 29 tons of MSW for every million dollars of GDP. In Colombia, which has the third largest GDP in Latin America, there is a marked difference in the amounts reported by large cities, which have controlled landfills, and those reported in rural areas, where the amounts of waste produced are higher.
Other studies are focused on the analysis of the generation and composition of solid waste in different countries of Latin America and the Caribbean [59]. They indicate that, for countries such as Colombia, Mexico, Paraguay, Peru, and Ecuador, there is a trend towards a decrease in the content of food waste, gardening, leather and rubber, paper, and cardboard, but this fraction continues to be predominant. Furthermore, seasonal, economic, and regional differences have been identified. For the particular case of plastic, there was an increase in its production, while for glass a decrease in the amount present in the different cities under study was observed.
Based on the aforementioned, this research analyzes the comprehensive solid waste management plans in Colombian fifth-category municipalities, specifically in the solid waste generation, collection and transportation, sweeping and cleaning of roads and public areas, inclusion of recyclers and final disposal programs determined by the CSWMP as key administrative instruments for the provision of the public cleaning service. The research carried out evaluates the integral management of solid waste in fifth-category municipalities, evidencing that each municipality integrates its programs according to their administrative and technical capacity. That is the reason why municipalities implement collection routes with a specific frequency to manage waste and propose and develop alternatives for reusing waste while ensuring the maintenance of roads and public areas with sweeping and cleaning programs.

3. Materials and Methods

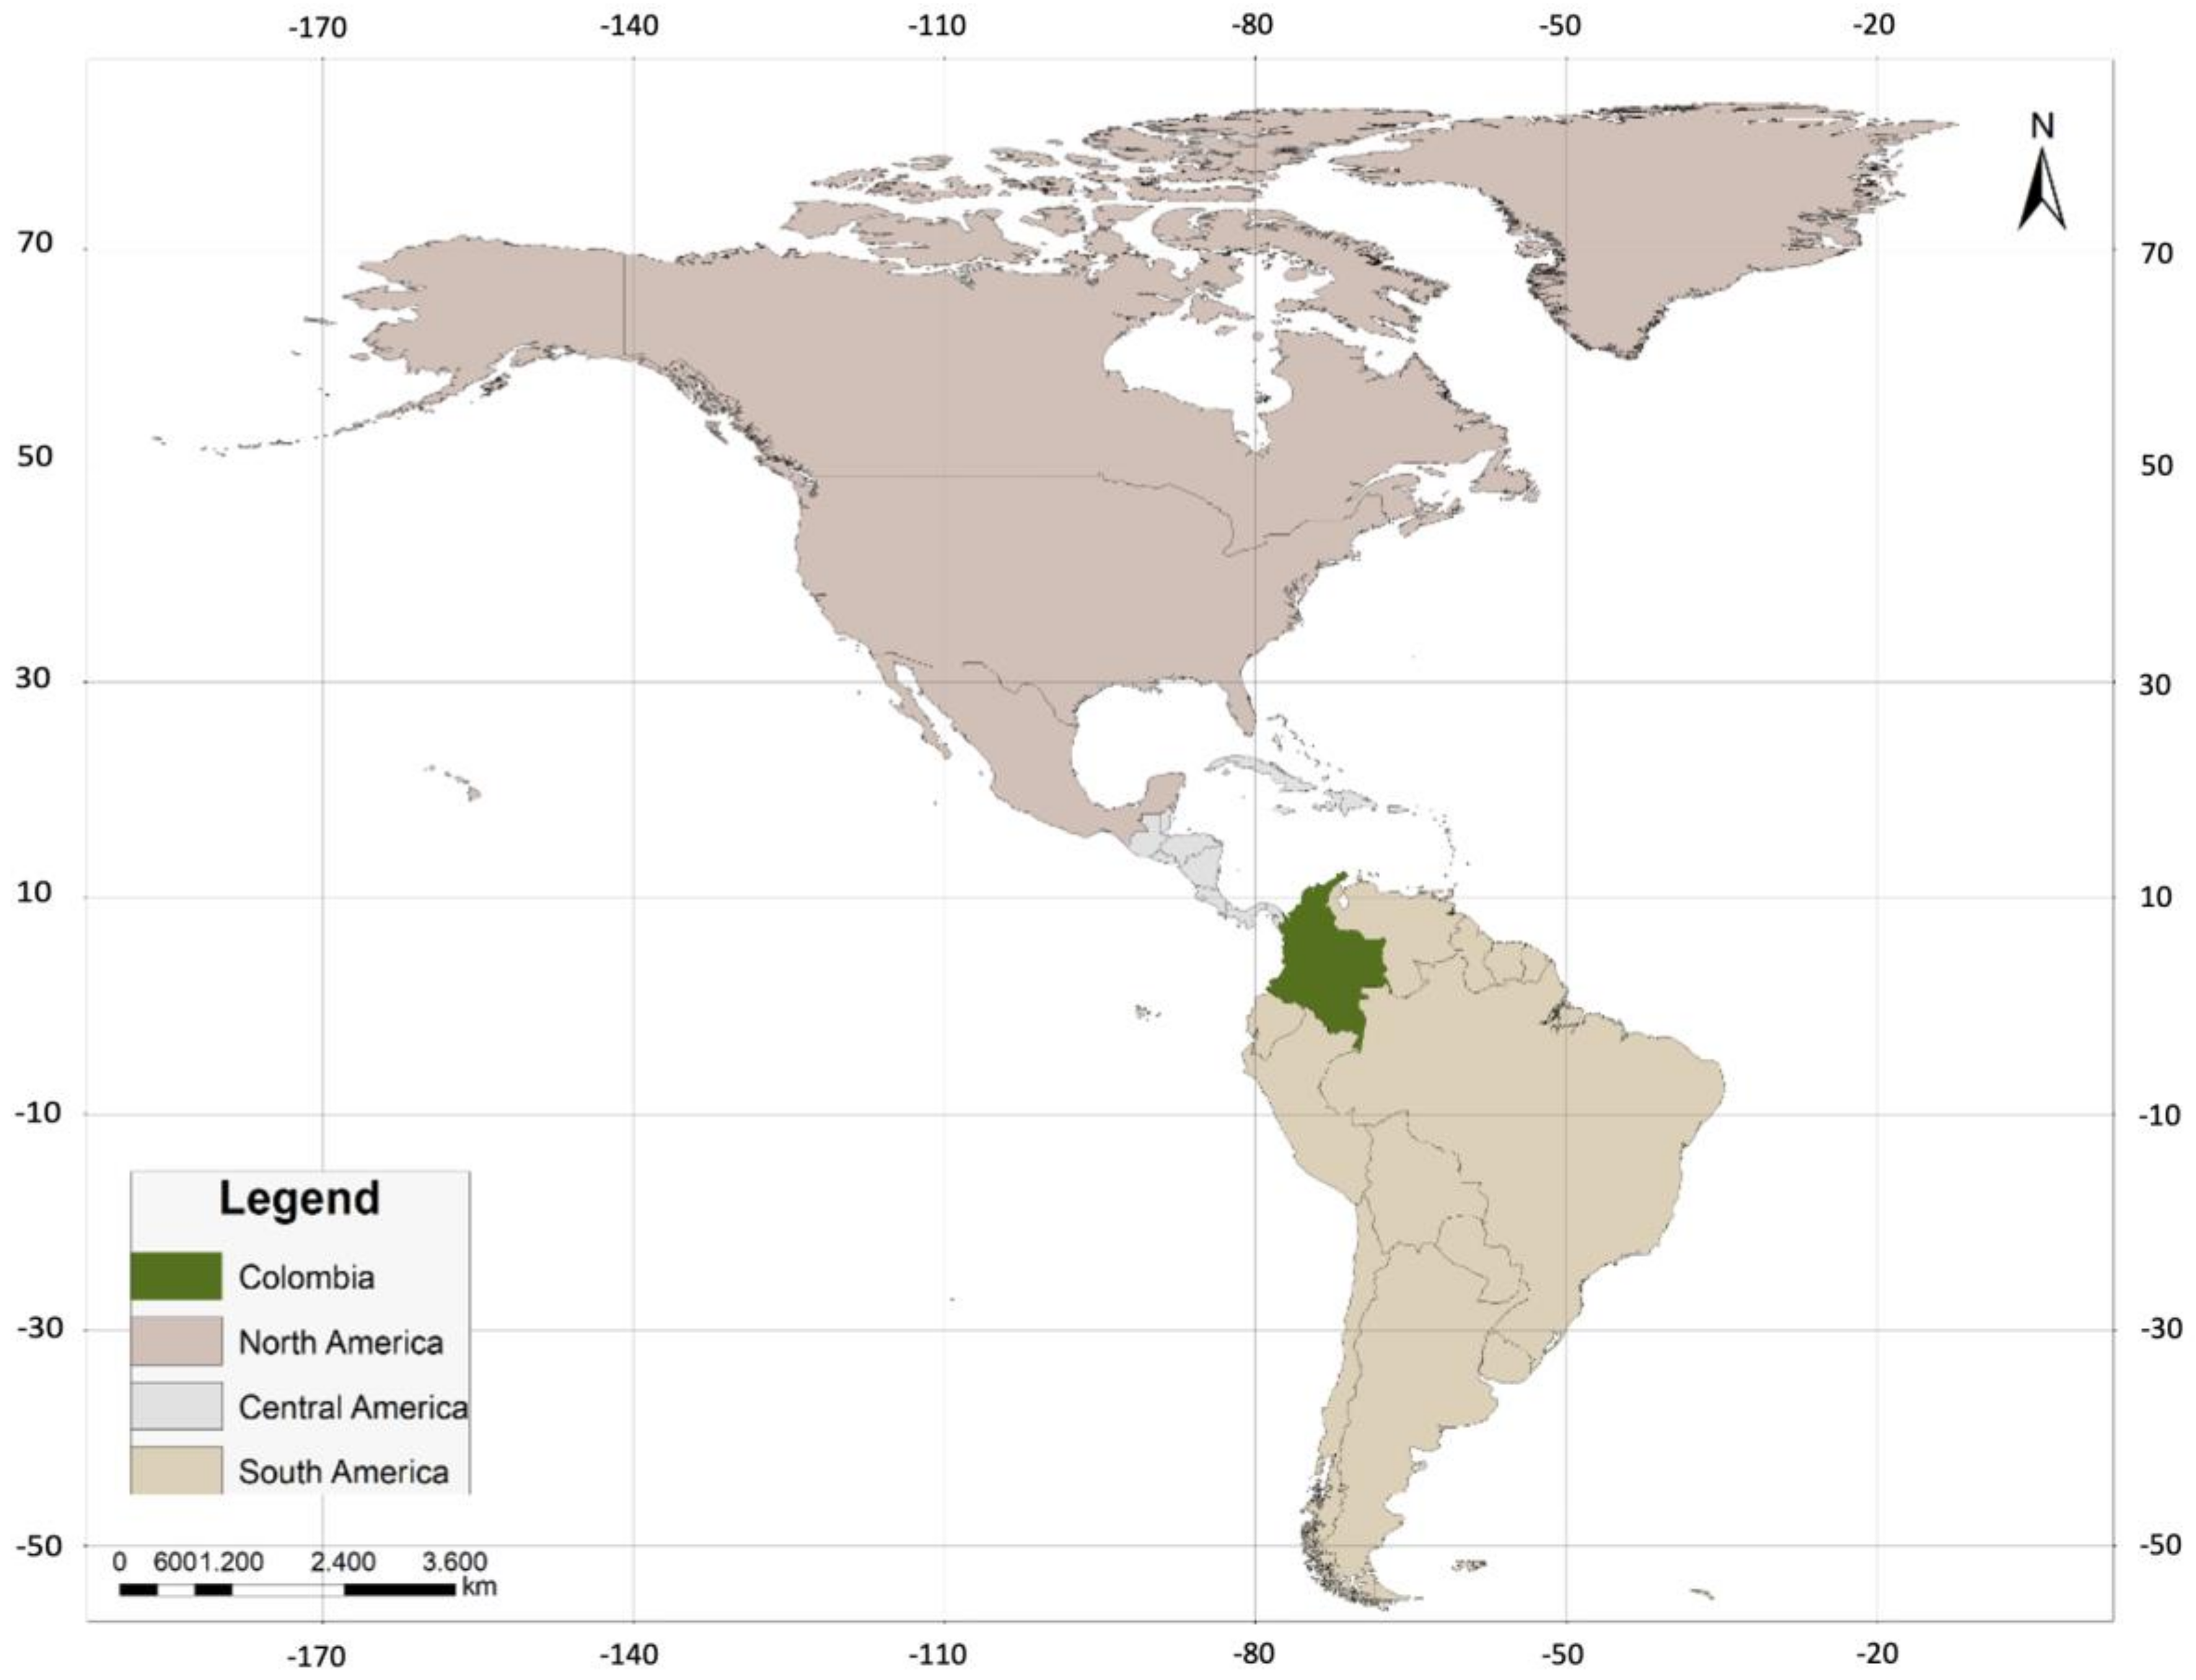
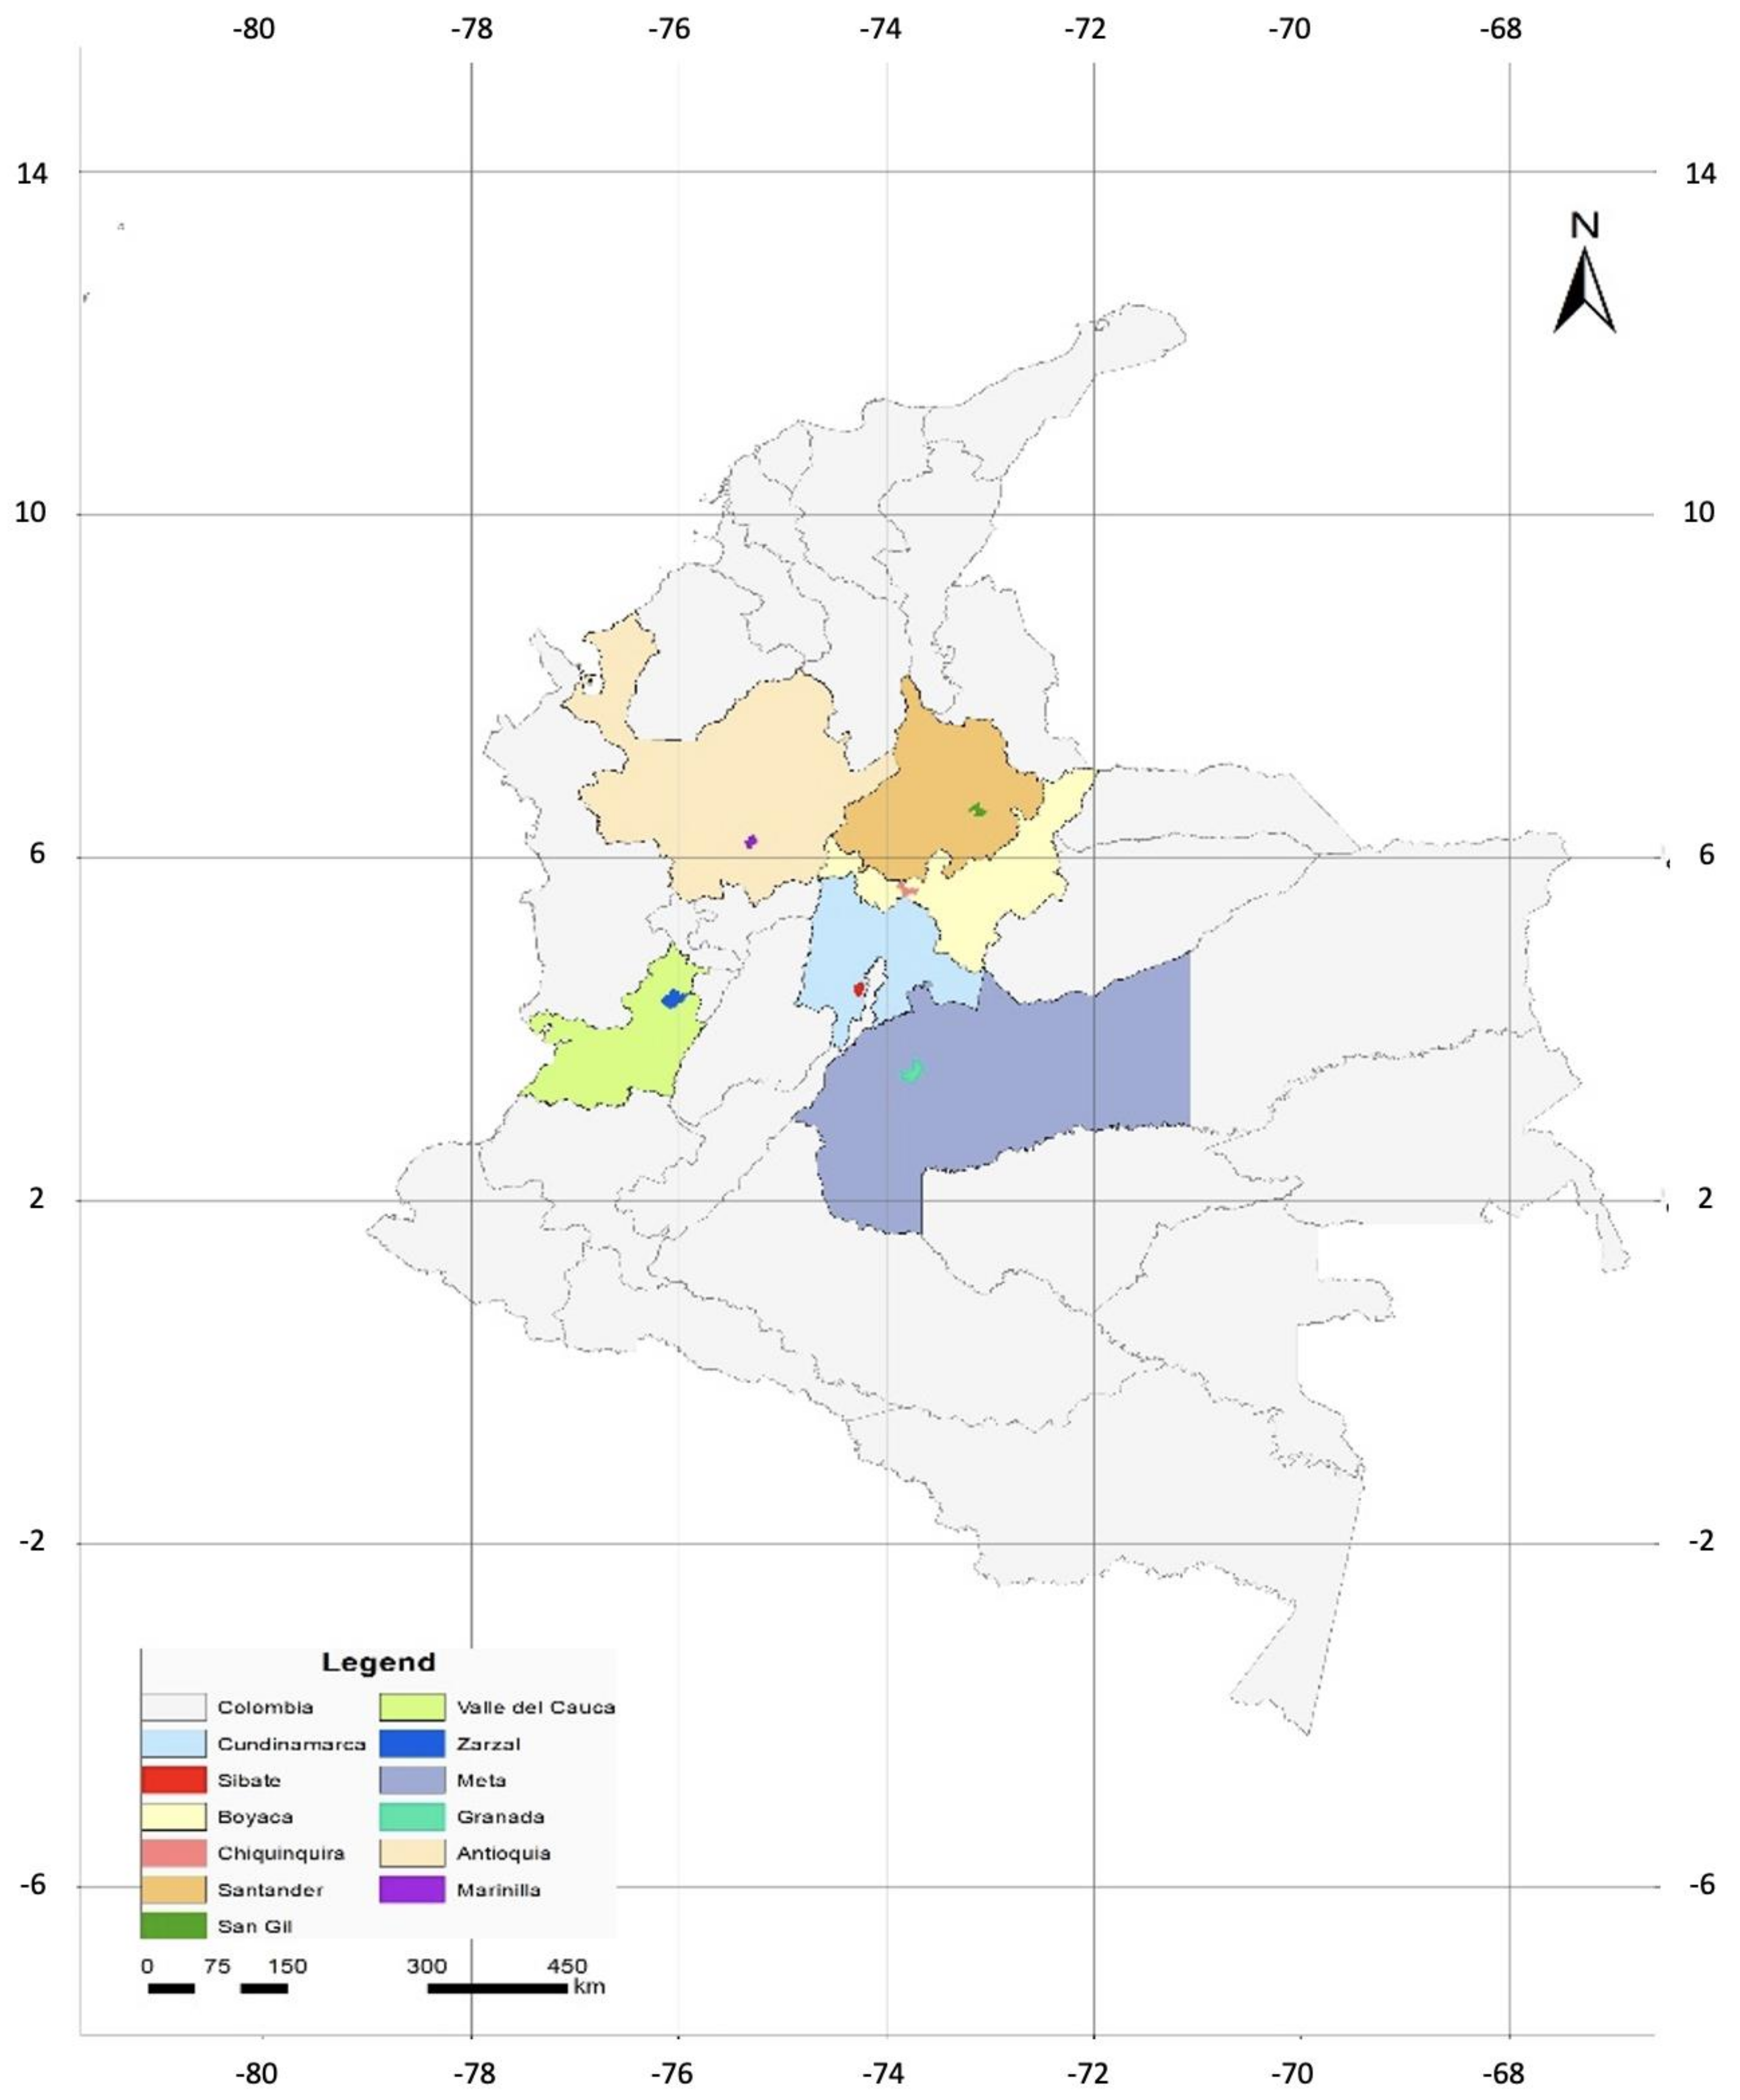
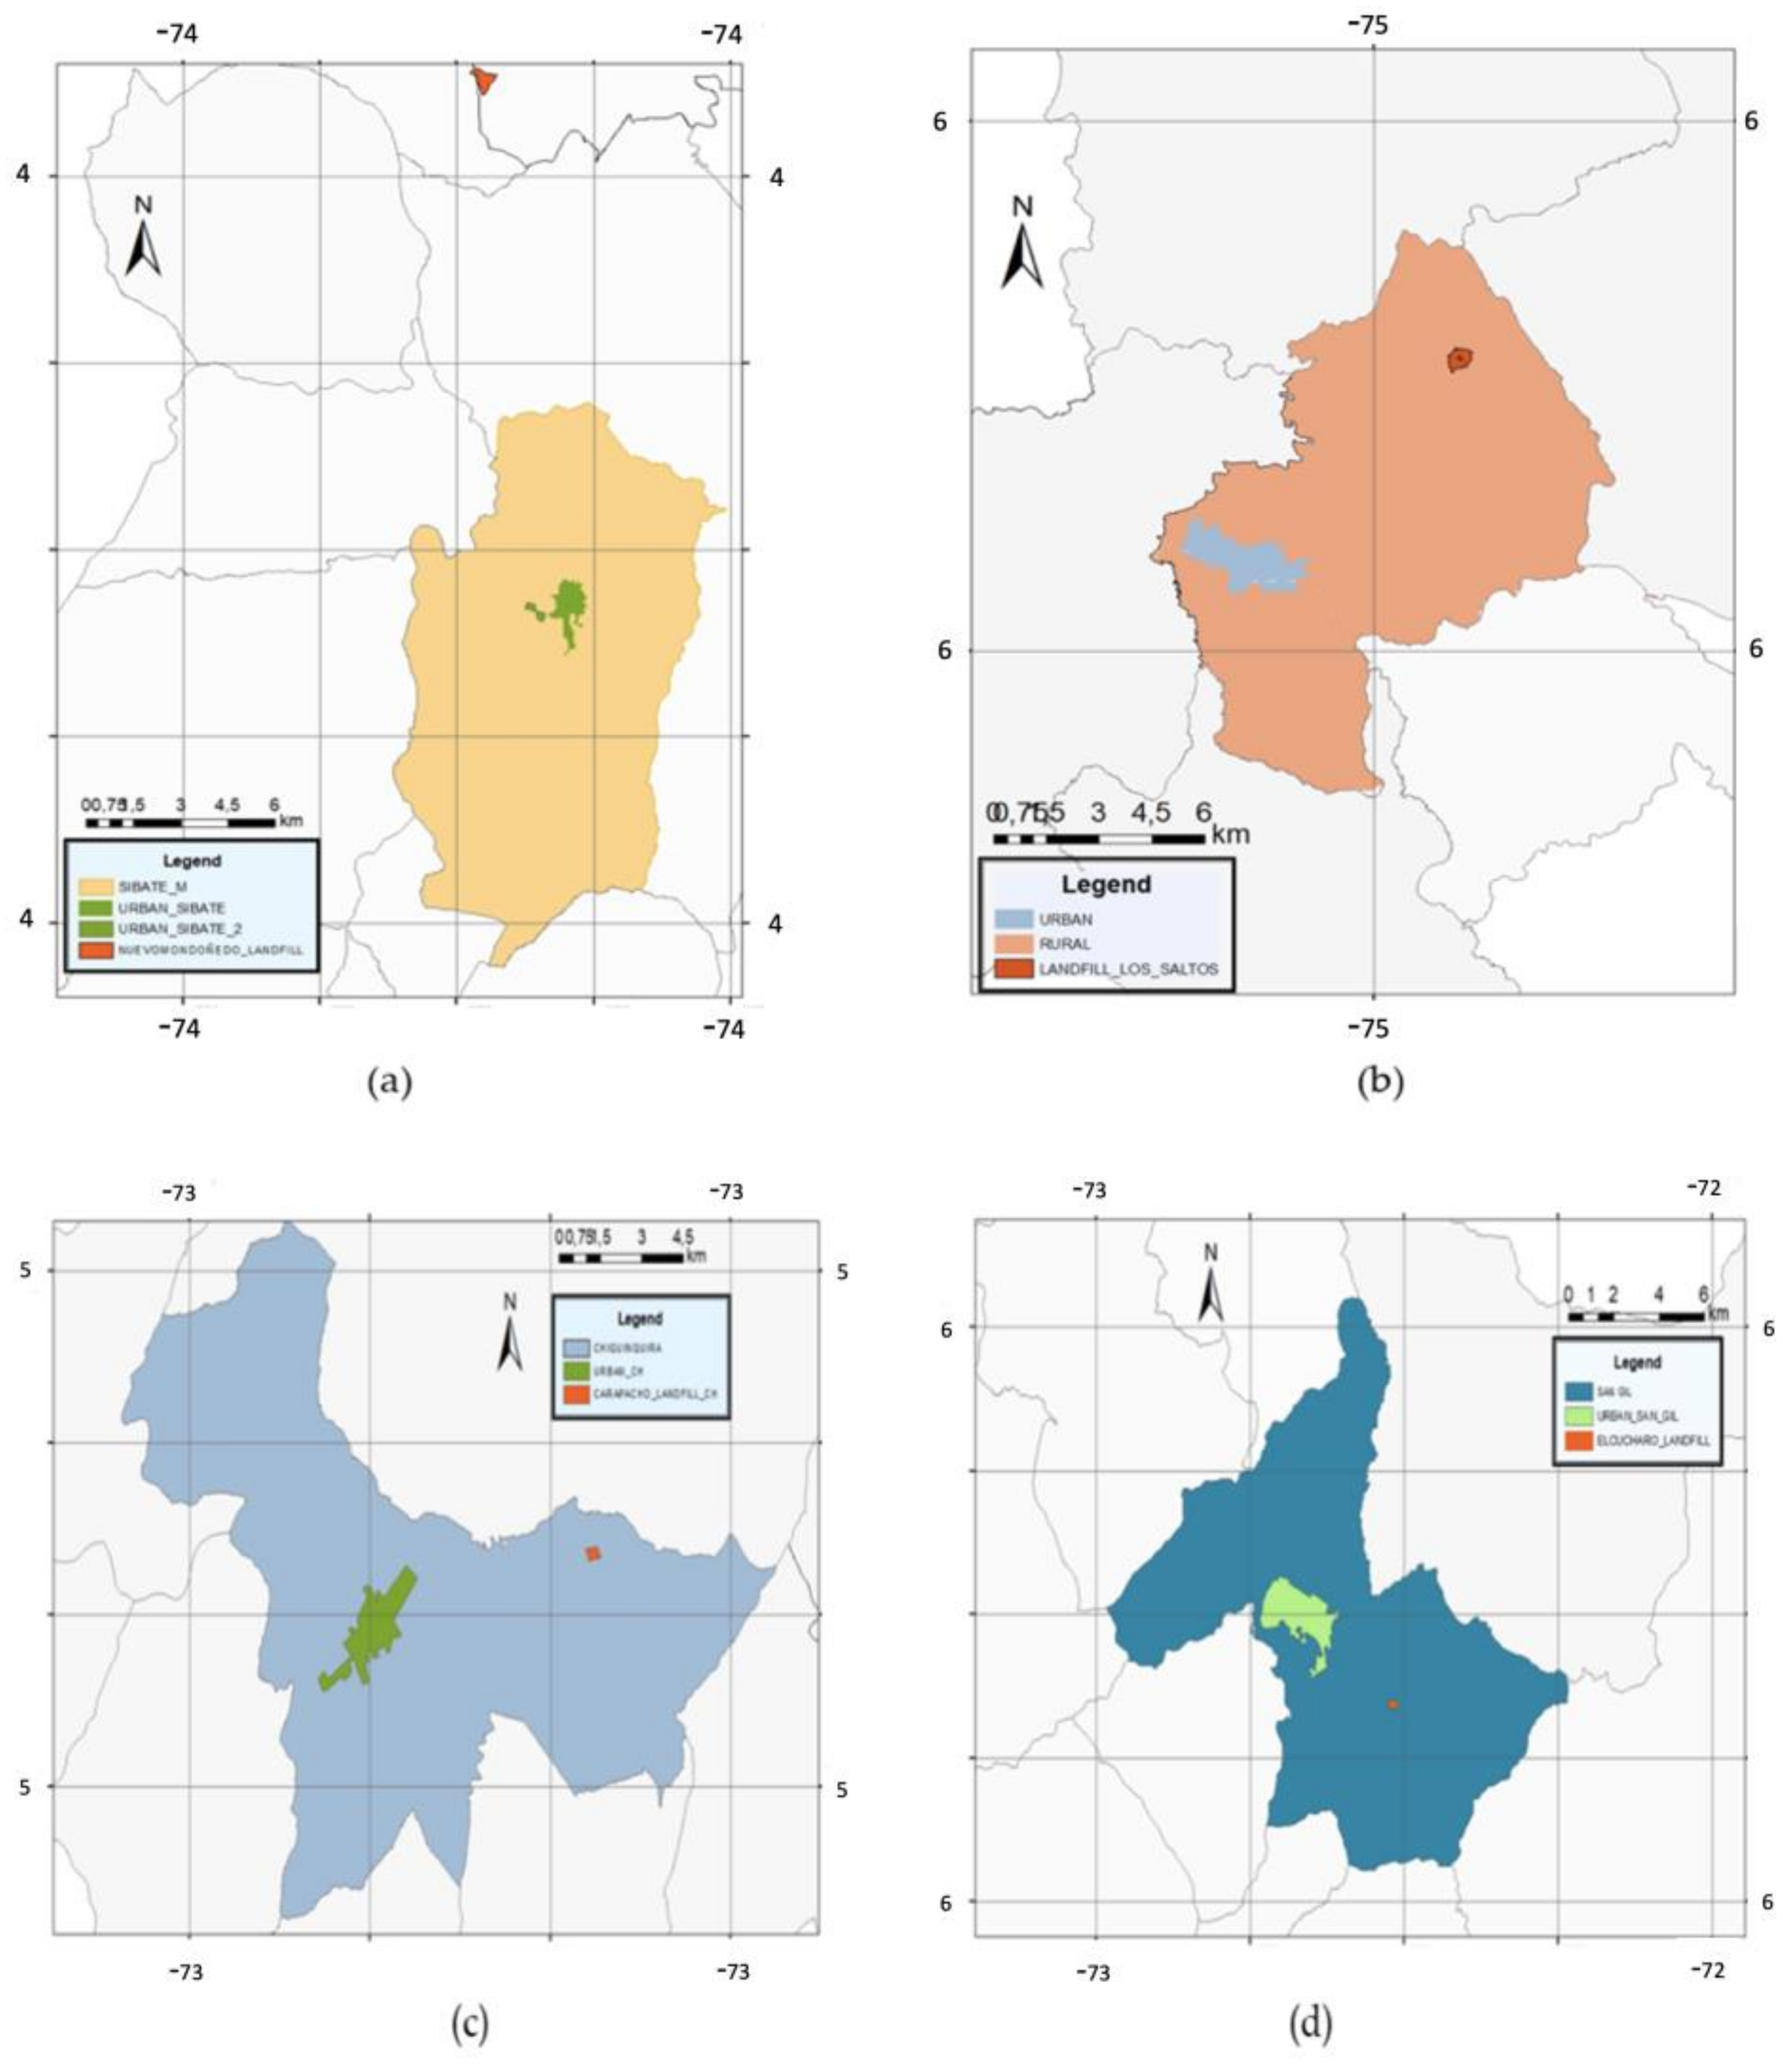
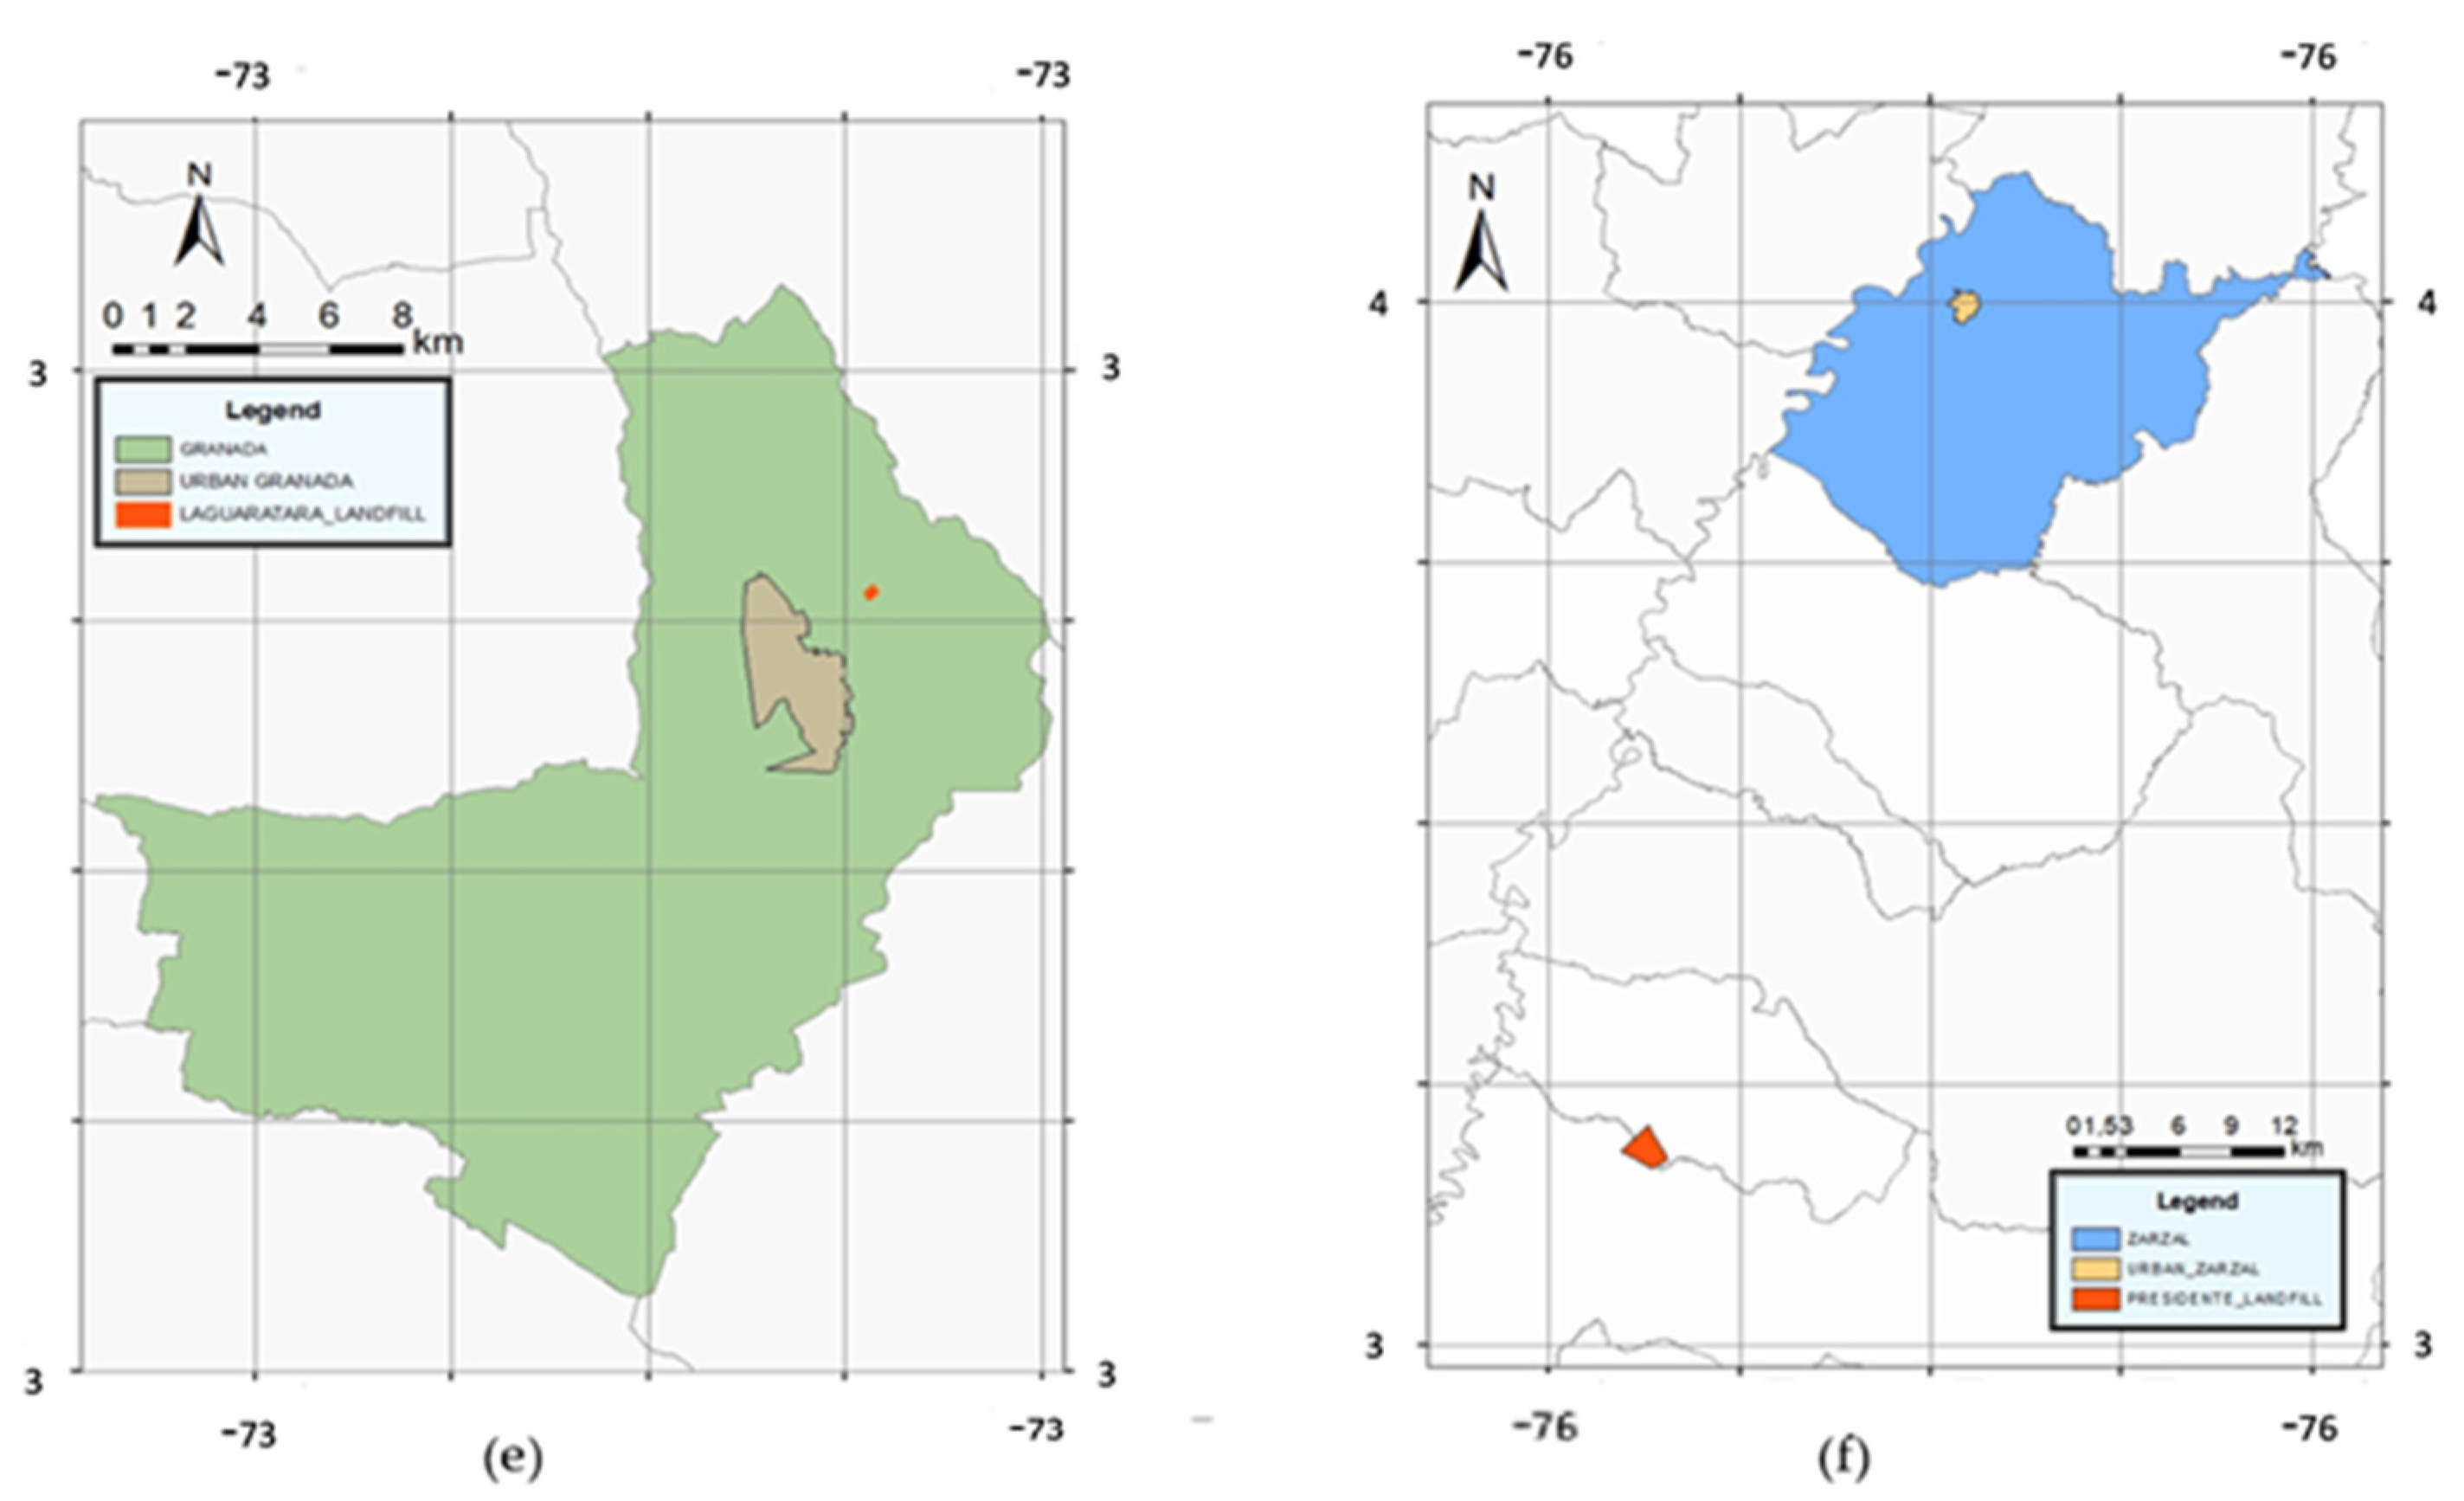
3.1. Selection of Municipalities

Following the classification of the National Planning Department and current legislation in Colombia, (Art. 2 of Law 617/2000 and Art. 6 of Law 136/1994 define a categorization of districts and municipalities inside the country) (Figure 1), districts and municipalities are classified according to their population and income in six categories.
For the development of this research, six municipalities of the fifth-category were selected (Figure 2). These municipalities are Sibaté (located in the department of Cundinamarca), Chiquinquirá (located in the department of Boyacá), San Gil (located in the department of Santander), Zarzal (located in the department of Valle del Cauca), Granada (located in the department of Meta) and Marinilla (located in the department of Antioquia) [47,48,49,57].
Table 1 shows the total area of the municipalities under study. Sibaté, Cundinamarca with an extension of 120 km2; Chiquinquirá, Boyacá with an area of 171 km2; San Gil, Santander with an area of 150 km2, Zarzal, Valle del Cauca with an area of 371 km2; Granada, Meta with an area of 381 km2; and Marinilla, Antioquia with an area of 116 km2, respectively.

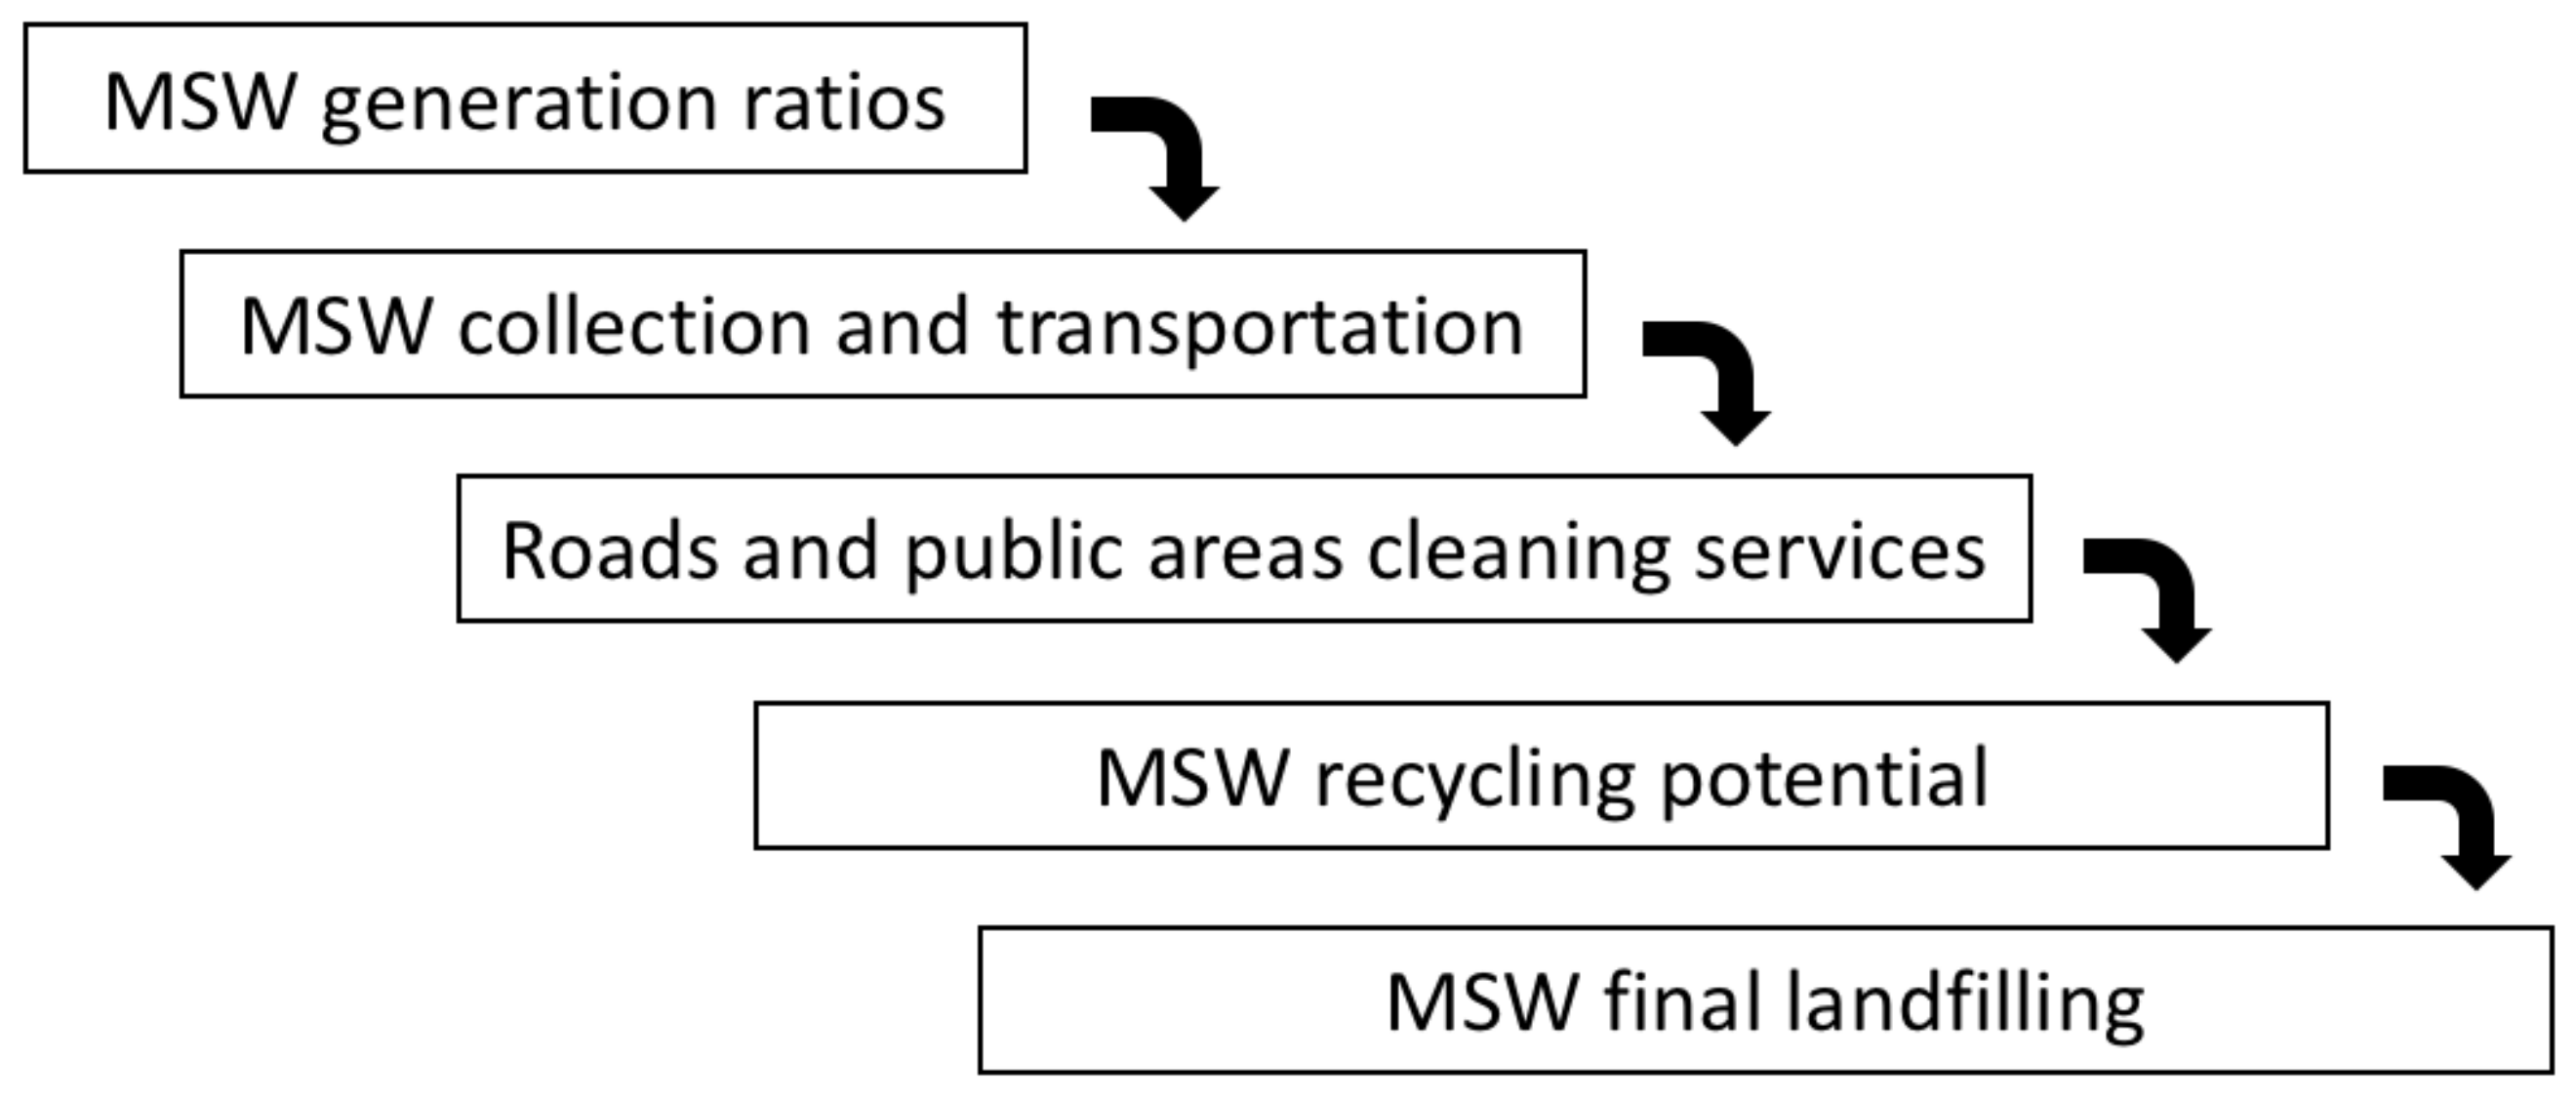
3.2. Evaluation of the Solid Waste Management Plans

For each one of the six selected municipalities, the corresponding Comprehensive Solid Waste Management Plans (CSWMP), the 2018 Solid Waste Final Disposal National Report and the 2018 National Waste Reuse Report were compiled. Every CSWMP was analyzed identifying inside each of them the generation, use, collection, transportation, transfer and final disposal of solid waste programs, as well as the coverage of the cleaning public areas programs [50,51,52,53,54,55].
The methodology proposed to analyze MSW management in low-income areas include the individual analysis of the following key aspects that must be addressed sequentially (Figure 3):
This methodology has been designed taking into account the common lack of information associated with economically depressed areas or areas with low annual income, where in which is very common that reliable data are not available.

3.2.1. MSW Generation Ratios

A comparison for three different scenarios was made. This comparison was based on the estimation of the amount of waste generated in one day per inhabitant at a five-year projection (for the period between 2018 and 2022). The first scenario (Reference) corresponds to the projection indicated in the CSWMP. The second scenario (Estimation 1) was obtained considering the projection of the population obtained by the geometric method using Equations (1) and (2) and the Solid Waste Production per capita established in the CSWMP. The third scenario (Estimation 2), was obtained from the amount of solid waste reported in the National Final Disposal Report for the year 2018 and the projection of the population using the geometric method shown in Equations (1) and (2) [60]:
P f = P u c 1 + r T f T u c
r = P u c P c i 1 T u c T c i
where Pf is the population corresponding to the year for which the projection is to be carried out; Puc is the population expected by the Colombian National Statistics Department (DANE) [61]; Pci is the population corresponding to the initial census with information; r is the annual growth rate in decimal form; Tuc is the last year projected by DANE and Tf is the year to which the estimation is to be done. The daily solid waste production per inhabitant was obtained according to Equation (3) [62]:
MSW   Production   per   capita   ( PPC )   =   MSW   mass   kg day Population
Once the solid waste production values for the three scenarios were obtained, the differences were determined as shown in Equations (4) and (5), calculating the absolute errors and the relative errors between the reference values and the estimated values [63]:
Absolute   Error 1 ; 2 = a b s Ref   Value   Estimation 1 ; 2
Relative   Error 1 ; 2 % = a b s Ref   Value   Estimation 1 ; 2 Ref   Value
Table 2 describes the main characteristics of the three scenarios analyzed to determine the solid waste generation values and their percentage differences. The comparison between each estimate and the reference scenario should not exceed 50%.

3.2.2. MSW Collection and Transportation

Regarding the MSW collection and transportation program, the micro routes and the collection frequency were determined and evaluated, as well as the type of transportation and the capacity of the collection system for each of the six municipalities, following the information included in the CSWMP.

3.2.3. Sweeping and Cleaning of Roads and Public Areas

In the sweeping and cleaning of roads and public areas program, the micro routes and the frequency were determined and evaluated. Similarly, the swept mileage and the number of public baskets installed in the municipality were determined, following the information included in the CSWMP.

3.2.4. MSW Recycling Potential

For each solid waste program, the types of waste that are likely to be reused and their respective amount (%) were determined. Likewise, based on the information contained in each CSWMP, the recyclers associations, the number of recyclers by municipality and the classification and use facilities were identified.

3.2.5. MSW Final Landfilling

Finally, in the final solid waste disposal program, the sanitary landfill, the type of landfill and its ownership (regional or municipal administration) were identified. The distance to the landfill from the centroid of the municipality was determined and it was geographically represented in ArcGIS 10.5 software.

4. Results

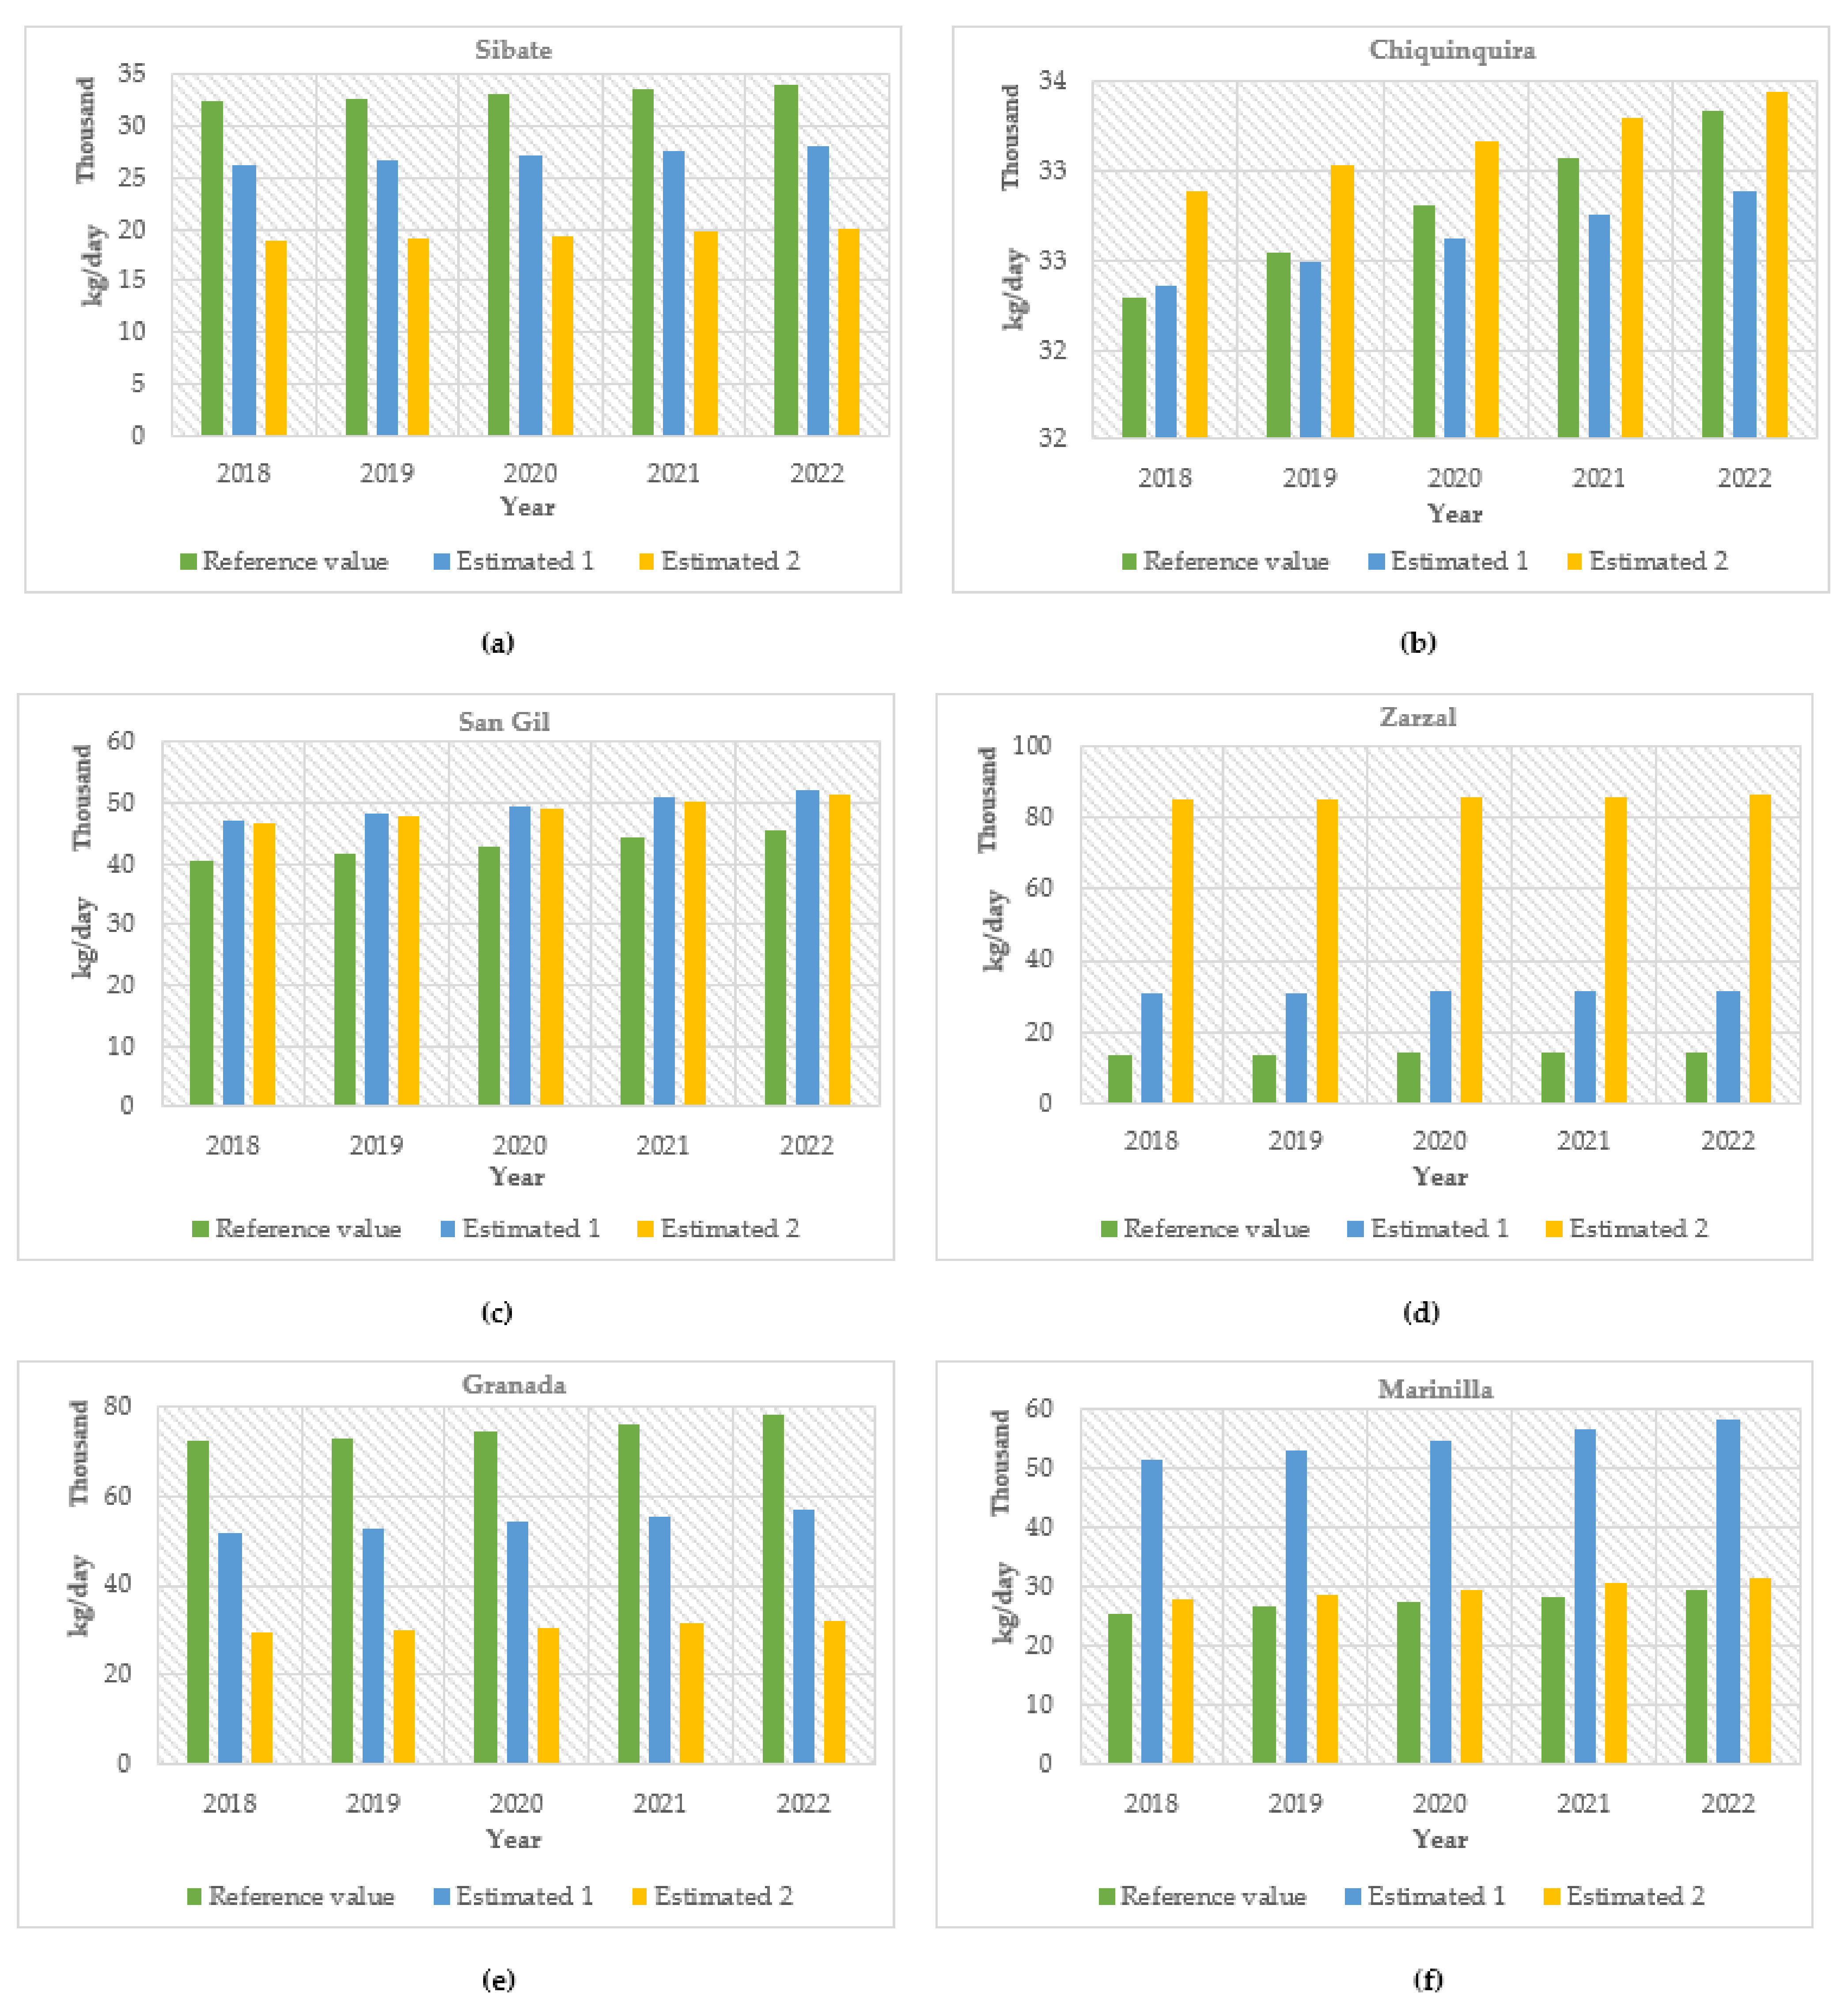
4.1. MSW Generation Ratios

The per capita production for urban and rural areas in each municipality as reported in the Comprehensive Solid Waste Management Plan, is shown in Table 3.
The daily waste generation rates for the period 2018 to 2022 were estimated applying Equation 3 and considering the projections made in the three previously defined scenarios (Reference, Estimation 1 and Estimation 2. The values of the absolute and relative errors for each of the municipalities were obtained. Results showing the percentage errors for each year are shown in Table 4.
The solid waste generation projections for each of the six municipalities in the study period and for each scenario are shown in Figure 4.
From the available data, the percentage values of the composition of solid waste generated in the municipalities of Sibaté, Chiquinquirá, San Gil, Zarzal, Granada, and Marinilla were obtained. Maximum percentage corresponds to organic waste (54%), followed by plastic (13%), other waste which includes textiles, rubber and synthetics (12%), glass (6%), paper (5%), cardboard (4%), and in the same proportion scrap metal—wood and foliage waste (3%) (Figure 5).
Organic solid waste is the one with the highest municipal production. However, it is not subjected to a process of recovery by composting in a systematic and organized manner under prior planning. This process is only done for lawn mowing and pruning waste. In the specific case of the municipalities of Chiquinquirá and San Gil, only the waste generated in the marketplace is used without distinction of technique. In the municipalities of Granada, Zarzal and Marinilla, the home waste is finally deposited in a sanitary landfill. In the municipality of Sibaté, there is selective collection for domestic organic waste that is delivered to an external manager who is in charge of its final processing. However, there are no records of the use of waste coming from the local market [50,51,52,53,54,55]. At domestic level, the practice of composting depends on the conditions of each home and knowledge about this technique. However, there are no records of the number of people who carry out this activity, volumes of compost produced, sectors in which composting is used and/or if there is any marketing mechanism.

4.2. MSW Collection and Transport

Regarding the collection and transportation program, compactor-type vehicles are selected, taking into account that, on average, municipalities use two or three vehicles with a capacity between 8 to 25 yd3. Likewise, they show an average between 7 to 10 micro collection routes, each one with a frequency of 2 to 3 times a week. The main components of the collection and transport activities are summarized in Table 5. The efficiency in the provision of the public cleaning service for each municipality is shown in Table 6. For the urban areas inside each municipality the service efficiency is 100%. For the rural areas in the municipalities of Sibaté, Zarzal Granada, and Marinilla the efficiency is higher than 80%. The municipalities of Chiquinquirá and San Gil do not provide this service.

4.3. Sweeping and Cleaning of Roads and Public Areas

Regarding the sweeping and cleaning of roads and public areas program, the swept mileage distributed in the micro routes with their respective frequency was established in each municipality. Besides, the number of waste baskets installed in different parts of the municipality was obtained, as shown in Table 7.

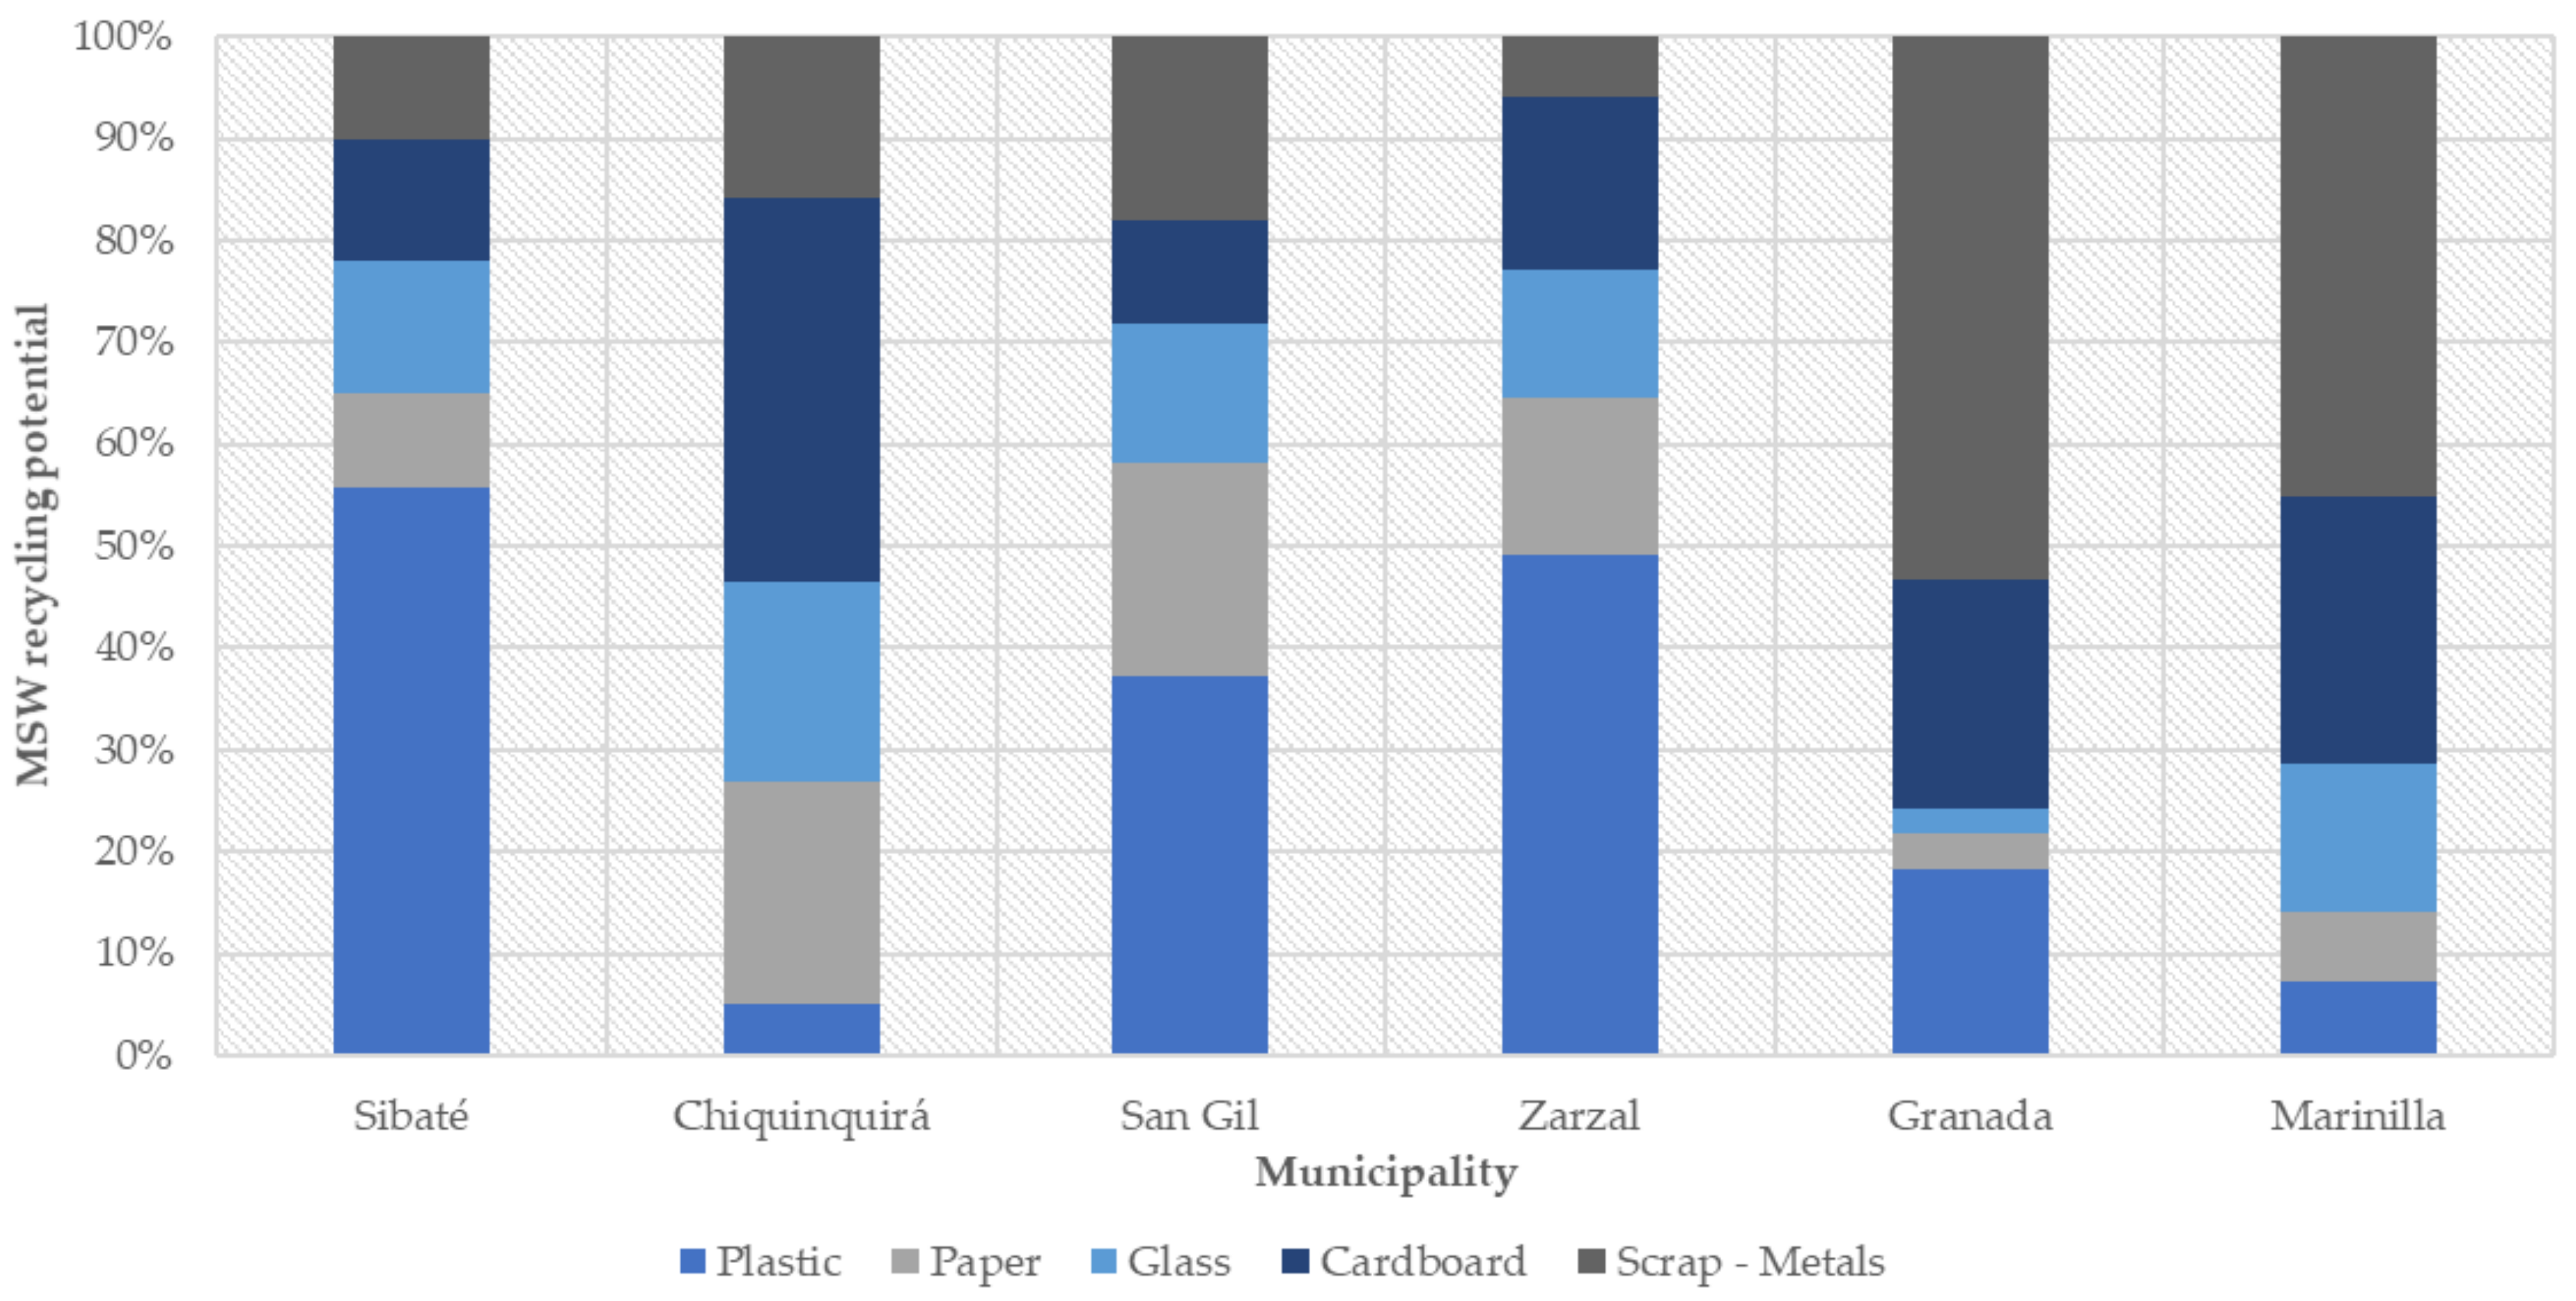
4.4. MSW Recycling Potential

The potentially recyclable waste that are generated in the study area municipalities include plastic, paper, glass, cardboard, and scrap-metals in the proportions shown in Figure 6.
The recycling activity is carried out by recyclers, who can work independently or belong to different associations which work in a coordinated way. According to the evaluation carried out, in three of the six municipalities there are associations and in the remaining three there are independent recyclers. Each of the municipalities has more than one collection center where the MSW is classified. The main characteristics of the recycling system is summarized in Table 8.
In Figure 6, the potentially usable material is shown. It has been possible to identify the existence in each municipality of a collection center supported by recuperators who carry out the activity. However, only the municipalities of San Gil and Marinilla report the real percentage of use, which is 10.52% and 25.25%, respectively. The rest of the municipalities do not report any reuse value, either because the recycling results are not quantified or because the waste is not delivered to external managers, who could provide the information in an accurate way [50,51,52,53,54,55].
In these municipalities, recyclers make a profit from the sale of the selected materials and their subsequent use. Unfortunately, classification and recycling techniques are still not fully implemented, especially the smaller municipalities. Waste separation is not sufficiently entrenched in rural society. In this sense, promoting alternatives based on circular economy techniques such as those proposed allow optimizing municipal waste management and maximizing the recovery of usable waste. These techniques also strengthen the role of local recyclers’ associations and materialize benefits at a social and environmental level [64].

4.5. Final Landfilling Sites

Final disposal of the MSW in each of the selected municipalities is carried out in sanitary landfills. Four of them are managed by regional authorities while in two municipalities their landfill is managed directly by local authorities.
Table 9 shows the distance from the centroid of the municipality to the correspondent sanitary landfill.
Figure 7 shows the location of the landfill inside the correspondent municipality area, showing their respective urban and rural areas.

5. Discussion

In this research, the programs of (i) municipal solid waste generation, (ii) collection and transportation, (iii) sweeping and cleaning of roads and public areas, (iv) use and inclusion of recyclers, and (v) final disposal in six fifth category municipalities in Colombia using a comparative methodology has been performed. Results have been obtained by analyzing data obtained from official sources and using geographic information tools. The analyzed factors included in the analysis are the estimation of the waste production, the quantity of potentially usable waste, the typology of recyclers, the micro-routes and frequency of collection and sweeping, the type of vehicles to carry out the collection activities, the number of baskets installed in the municipality and the final disposal place and its distance to the centroid of each municipality.
Following Table 4, the municipalities that presented a higher error in Estimation 1 compared to the Reference Value were Zarzal and Marinilla. In the case of Zarzal, the number of inhabitants is greater according to the CSWMP than the population projected by the geometric method based on the census of the year 2018. Regarding the difference in Marinilla, the population increased more than they had projected. That may be the reason why the difference in the generation of solid waste in the particular case of these municipalities is close to 100%.
For Estimation 2, the municipalities with the greatest differences were Zarzal and Granada. In the case of Zarzal, it is evident that the generation of waste reported by the Superintendency of Public Services in its annual final disposal report is greater than that considered in the CSWMP, while, in the case of Granada, the generation of waste is lower according to the Superintendency report than what is considered by the CSWMP.
In the case of the collection and transportation program, the municipalities have micro collection routes with a frequency of 2 to 3 times a week. They are able to collect all the waste that is generated while having better control of the economic resources that are demanded to collect the waste. On average, each municipality has 2 or 3 compactor vehicles with sufficient capacity to carry out the collection. This type of vehicles allows a greater load capacity and a better control of leachate and offensive odors generated by solid waste [65].
Regarding the sweeping and cleaning of roads and public areas program, each municipality has its respective micro routes and their frequency. Despite every municipality has installed garbage baskets it can be observed that there are some municipalities that have only 12 to of 15 of them, while others have more than 100. This difference is generated by the administrative decisions taken in each municipality. Therefore, this program focuses on actions aimed at leaving areas and public roads free of solid waste that are scattered or accumulated that can generate blockages in the sewer system or that generate vectors [66].
In the program for the use and inclusion of recyclers, as shown in Table 4, the municipalities have collection centers where the potential non-organic solid waste are classified. Three of the municipalities do not perform this classification task while the other three municipalities classify the waste before delivering it to external managers. All the municipalities have recyclers, either belonging to a union or working independently. As shown in the percentages given in Figure 3, the most generated waste is plastic, followed by scrap-metal and finally cardboard. The municipality of Marinilla is the one that reuses waste at a higher rate (25.25%) due to its higher number of recyclers. The municipalities of San Gil (10.52%) and Chiquinquirá (10.20%) also reuse waste. The three remaining municipalities do not provide information on the amount of waste reused.
Finally, regarding the final disposal program of the six municipalities, it has been seen that they use sanitary landfills which provide a final destination to the solid waste. According to Table 9 and Figure 6, the municipality that is further away from its sanitary landfill is Zarzal and the municipality that has the landfill closer to its centroid is Granada. The location of a sanitary landfill depends on the potential areas that the municipal entity determines in its management plan and must be licensed through the legal environmental process. That is the reason why municipal landfills depend on administrative and technical criteria and their distance from the centroid will depend directly on these factors [67].
In rural areas furthest from populated centers or cities with greater economic activity, it is common that solid waste is burned in the open or buried without any other additional technical measure. Sometimes these practices are the answer to the inefficiency of the waste collection services [68]. In fact, this makes no difference with sanitary landfills in other regions of Colombia which show important defects in their operation that caused emergency situations and catastrophes in the period between 1977 and 2005 [39].

6. Conclusions

For the first time in scientific literature, this paper presents an analysis of the implementation of circular economy techniques under environmental sustainability criteria in six municipalities with depressed economy in Colombia. The analysis is based on the waste production data of waste at local scales, the recovery of waste for subsequent recycling and the identification and quantification of the variables associated with waste treatment and final disposal, in accordance with the Colombian regulatory framework.
Likewise, this work provides a complete analysis of the integral management of solid waste in Colombian rural areas, being one of the first studies to compare different municipalities in the country in relation to the provision of public waste management services. Each of the components of the waste collection service have been evaluated, detailing the differences between municipalities that should have similarities due to their equal economic categorization. The administrative differences that are identified in the programs are mainly associated with the size and income of the municipalities, and with the political-administrative will to execute these plans as they have been detailed to provide the public cleaning service.
The population and solid waste projections allow long-term decisions to be made through data analysis, so that municipalities can fully and efficiently cover the public sanitation service, as well as establishing reduction and use of strategies aimed under a circular economy paradigm. However, local waste management plans are prepared for periods of 8-to-10 years, so the information considered inside them does not always adjust to the current dynamics of the population.
As established in Colombian legislation (Resolution 0754_2014), once the local waste management plan is implemented, it is the responsibility of the municipality’s local administration to control, update, optimize, and improve the specific actions included in the plan to make the provision of the waste management service more efficient. The analysis carried out in this work provides an estimation of the amounts of potential recycling by-products, which are necessary for the design of strategies by the administrations and the companies that provide the service.
Problems have been identified in the management of the waste in the municipalities analyzed. Only the municipalities of San Gil and Marinilla report some percentage of reuse (which is 10.52% and 25.25%, respectively). However, the other municipalities do not report any value, either because they do not keep track of the material that is reused or because it is only stored in the collection centers. It has been shown that each municipality integrates its programs according to its administrative and technical capacity. The management of solid waste is done through its collection, transport, and final disposal, as well as generating alternatives for the classification and use of waste (such as plastic, cardboard, glass, paper and scrap), with the support of trade recyclers or associations.
Similarly, the implementation of sweeping and cleaning strategies for the maintenance of roads and public areas is evidenced. These strategies allow municipalities maintaining a low amount of scattered waste that can be a source of vectors and generate the devaluation of the property by its accumulation.
Finally, the problems analyzed in rural municipalities with low purchasing power in Colombia highlight the importance of having access to information methodologies that allow the subsequent systematization of the data. This is a key aspect for the implementation of optimal waste management techniques based on circular economy criteria, despite the economic contexts of the regions. Unfortunately, the problems in the management, promotion and control of data in the Colombian municipalities with depressed economy are very evident. These municipalities still need the implementation of effective mechanisms to promoting important changes in waste management systems due to sociocultural and administrative deficiencies despite sharing the regulatory framework with larger cities in the country that are in line with the management system needs [62]. Implementing circular economy models in small Colombian municipalities for the use of waste such as plastic, cardboard, paper, scrap, and glass provides greater opportunities at social, economic, and environmental levels. Results obtained after the analysis carried out show the existence of a good scenario for the development of these models based on circular economy techniques. These include the participation of local recyclers’ associations so that waste management is significantly improved.
The implementation of an office tool in municipalities such as those presented in this work is currently in process, which will allow the simulation of variables considered in a circular economy model. The tool under development is a macro-type matrix developed on the Microsoft Excel® platform accompanied by a dashboard programmed in Visual Basic®. These tools have been selected taking into account the economic and technical capacity of the municipalities under study. The preliminary feasibility results for the implementation of a closed loop for usable waste will be obtained during the second semester of 2021. As a result of this research, it is expected to present to a local government, in a period not longer than 8 months from now, a pilot proposal for the gradual implementation of the model, supported by academic communities and other organizations related to the process, also considering that there is already a preselected municipality located in the center of the country.

Author Contributions

Conceptualization, J.R.-I. and C.-A.V.-T.; methodology, C.-A.V.-T., P.-A.B.-C., M.-E.R.-C., and J.R.-I.; software, P.-A.B.-C.; validation, P.-A.B.-C. and M.-E.R.-C.; formal analysis, C.-A.V.-T., M.-E.R.-C., P.-A.B.-C., and J.R.-I.; investigation, C.-A.V.-T. and J.R.-I.; resources, C.-A.V.-T. and J.R.-I.; data curation, M.-E.R.-C. and J.R.-I.; writing—original draft preparation, C.-A.V.-T., M.-E.R.-C., P.-A.B.-C., and J.R.-I.; writing—review and editing, J.R.-I.; visualization, C.-A.V.-T. and J.R.-I.; supervision, J.R.-I.; project administration, C.-A.V.-T. and J.R.-I.; funding acquisition, C.-A.V.-T. and J.R.-I. All authors have read and agreed to the published version of the manuscript.

Funding

This research received no external funding.

Institutional Review Board Statement

Not applicable.

Informed Consent Statement

Not applicable.

Data Availability Statement

Data used in this research were obtained from different sources; i. The Comprehensive Solid Waste Management Plans (CSWMP) of every municipality; ii. The 2018 Solid Waste Final Disposal National Report of Colombia; iii. The 2018 National Waste Reuse Report of Colombia. Restrictions apply to the availability of these data. Data are available from the authors with the permission of the corresponding local or national Colombian Authority.

Conflicts of Interest

The authors declare no conflict of interest.

References

  1. Padilla, A.J.; Trujillo, J.C. Waste disposal and households’ heterogeneity. Identifying factors shaping attitudes towards source-separated recycling in Bogotá, Colombia. Waste Manag. 2018, 74, 16–33. [Google Scholar] [CrossRef]
  2. Valenzuela-Levi, N. Waste Political Settlements in Colombia and Chile: Power, Inequality and Informality in Recycling. Dev. Chang. 2020, 51, 1098–1122. [Google Scholar] [CrossRef]
  3. Borowski, P.F. Innovation strategy on the example of companies using bamboo. J. Innov. Entrep. 2021, 10, 1–17. [Google Scholar] [CrossRef]
  4. Kaza, S.; Yao, L.; Bhada, P.; Van Woerden, F. At a Glance: A Global Picture of Solid Waste Management. In What a Waste 2.0 A global Snapshot of Solid Waste Management to 2050; Urban Development Series; The World Bank: Washington, DC, USA, 2018; pp. 17–37. [Google Scholar]
  5. Khandelwal, H.; Dhar, H.; Thalla, A.K.; Kumar, S. Application of life cycle assessment in municipal solid waste management: A worldwide critical review. J. Clean. Prod. 2019, 209, 630–654. [Google Scholar] [CrossRef]
  6. Cervantes, D.E.T.; López Martínez, A.; Cuartas Hernández, M.; de Cortázar, A.L.G. Using indicators as a tool to evaluate municipal solid waste management: A critical review. Waste Manag. 2018, 80, 51–63. [Google Scholar] [CrossRef] [PubMed]
  7. Zhang, D.Q.; Tan, S.K.; Gersberg, R.M. Municipal solid waste management in China: Status, problems and challenges. J. Environ. Manag. 2010, 91, 1623–1633. [Google Scholar] [CrossRef] [PubMed]
  8. Kuehr, R. Towards a sustainable society: United Nations University’s Zero Emissions Approach. J. Clean. Prod. 2007, 15, 1198–1204. [Google Scholar] [CrossRef]
  9. Wagner, T.; Arnold, P. A new model for solid waste management: An analysis of the Nova Scotia MSW strategy. J. Clean. Prod. 2008, 16, 410–421. [Google Scholar] [CrossRef]
  10. Margallo, M.; Ziegler-Rodriguez, K.; Vázquez-Rowe, I.; Aldaco, R.; Irabien, Á.; Kahhat, R. Enhancing waste management strategies in Latin America under a holistic environmental assessment perspective: A review for policy support. Sci. Total Environ. 2019, 689, 1255–1275. [Google Scholar] [CrossRef] [PubMed]
  11. Cobo, S.; Dominguez-Ramos, A.; Irabien, A. From linear to circular integrated waste management systems: A review of methodological approaches. Resour. Conserv. Recycl. 2018, 135, 279–295. [Google Scholar] [CrossRef]
  12. Arena, U.; Di Gregorio, F. A waste management planning based on substance flow analysis. Resour. Conserv. Recycl. 2014, 85, 54–66. [Google Scholar] [CrossRef]
  13. Żelaziński, T. Properties of Biocomposites from Rapeseed Meal, Fruit Pomace and Microcrystalline Cellulose Made by Press Pressing: Mechanical and Physicochemical Characteristics. Materials 2021, 14, 890. [Google Scholar] [CrossRef]
  14. Laurent, A.; Bakas, I.; Clavreul, J.; Bernstad, A.; Niero, M.; Gentil, E.; Hauschild, M.Z.; Christensen, T.H. Review of LCA studies of solid waste management systems—Part I: Lessons learned and perspectives. Waste Manag. 2014, 34, 573–588. [Google Scholar] [CrossRef] [PubMed]
  15. Ferronato, N.; Rada, E.C.; Gorritty Portillo, M.A.; Cioca, L.I.; Ragazzi, M.; Torretta, V. Introduction of the circular economy within developing regions: A comparative analysis of advantages and opportunities for waste valorization. J. Environ. Manag. 2019, 230, 366–378. [Google Scholar] [CrossRef] [PubMed]
  16. Vaccari, M.; Torretta, V.; Collivignarelli, C. Effect of Improving Environmental Sustainability in Developing Countries by Upgrading Solid Waste Management Techniques: A Case Study. Sustainability 2012, 4, 2852–2861. [Google Scholar] [CrossRef] [Green Version]
  17. Zurbrügg, C.; Caniato, M.; Vaccari, M. How Assessment Methods Can Support Solid Waste Management in Developing Countries—A Critical Review. Sustainability 2014, 6, 545–570. [Google Scholar] [CrossRef] [Green Version]
  18. Borowski, P. Environmental pollution as a threats to the ecology and development in Guinea Conakry. J. Innov. Entrep. 2021, 10, 1–17. [Google Scholar] [CrossRef] [Green Version]
  19. Vaccari, M.; Tudor, T.; Vinti, G. Characteristics of leachate from landfills and dumpsites in Asia, Africa and Latin America: An overview. Waste Manag. 2019, 95, 416–431. [Google Scholar] [CrossRef]
  20. Idowu, I.A.; Atherton, W.; Hashim, K.; Kot, P.; Alkhaddar, R.; Alo, B.I.; Shaw, A. An analyses of the status of landfill classification systems in developing countries: Sub Saharan Africa landfill experiences. Waste Manag. 2019, 87, 761–771. [Google Scholar] [CrossRef]
  21. Wang, F.; Cheng, Z.; Reisner, A.; Liu, Y. Compliance with household solid waste management in rural villages in developing countries. J. Clean. Prod. 2018, 202, 293–298. [Google Scholar] [CrossRef]
  22. De Sousa Pereira, T.; Fernandino, G. Evaluation of solid waste management sustainability of a coastal municipality from northeastern Brazil. Ocean Coast. Manag. 2019, 179, 104839. [Google Scholar] [CrossRef]
  23. Costa, I.; Dias, M.F. Evolution on the solid urban waste management in Brazil: A portrait of the Northeast Region. Energy Rep. 2020, 6, 878–884. [Google Scholar] [CrossRef]
  24. Manfredi, S.; Christensen, T.H. Environmental assessment of solid waste landfilling technologies by means of LCA-modeling. Waste Manag. 2009, 29, 32–43. [Google Scholar] [CrossRef] [PubMed]
  25. Guerrero, L.A.; Maas, G.; Hogland, W. Solid waste management challenges for cities in developing countries. Waste Manag. 2013, 33, 220–232. [Google Scholar] [CrossRef]
  26. Botello-Álvarez, J.E.; Rivas-García, P.; Fausto-Castro, L.; Estrada-Baltazar, A.; Gomez-Gonzalez, R. Informal collection, recycling and export of valuable waste as transcendent factor in the municipal solid waste management: A Latin-American reality. J. Clean. Prod. 2018, 182, 485–495. [Google Scholar] [CrossRef]
  27. Aparcana, S. Approaches to formalization of the informal waste sector into municipal solid waste management systems in low- and middle-income countries: Review of barriers and success factors. Waste Manag. 2017, 61, 593–607. [Google Scholar] [CrossRef] [PubMed] [Green Version]
  28. Wilson, D.C.; Rodic, L.; Scheinberg, A.; Velis, C.A.; Alabaster, G. Comparative analysis of solid waste management in 20 cities. Waste Manag. Res. 2012, 30, 237–254. [Google Scholar] [CrossRef] [PubMed] [Green Version]
  29. Medina, M. Scavenger cooperatives in Asia and Latin America. Resour. Conserv. Recycl. 2000, 31, 51–69. [Google Scholar] [CrossRef]
  30. Wilson, D.C.; Velis, C.; Cheeseman, C. Role of informal sector recycling in waste management in developing countries. Habitat Int. 2006, 30, 797–808. [Google Scholar] [CrossRef]
  31. Gutberlet, J. Cooperative urban mining in Brazil: Collective practices in selective household waste collection and recycling. Waste Manag. 2015, 45, 22–31. [Google Scholar] [CrossRef] [PubMed]
  32. Anwar, S.; Elagroudy, S.; Razik, M.A.; Gaber, A.; Bong, C.P.C.; Ho, W.S. Optimization of solid waste management in rural villages of developing countries. Clean Technol. Environ. Policy 2018, 20, 489–502. [Google Scholar] [CrossRef]
  33. Patwa, A.; Parde, D.; Dohare, D.; Vijay, R.; Kumar, R. Solid waste characterization and treatment technologies in rural areas: An Indian and international review. Environ. Technol. Innov. 2020, 20, 101066. [Google Scholar] [CrossRef]
  34. Elgie, A.R.; Singh, S.J.; Telesford, J.N. You can’t manage what you can’t measure: The potential for circularity in Grenada’s waste management system. Resour. Conserv. Recycl. 2021, 164, 105170. [Google Scholar] [CrossRef]
  35. Yıldız-Geyhan, E.; Yılan, G.; Altun-Çiftçioğlu, G.A.; Neşet-Kadırgan, M.A. Environmental and social life cycle sustainability assessment of different packaging waste collection systems. Resour. Conserv. Recycl. 2019, 143, 119–132. [Google Scholar] [CrossRef]
  36. Solano Meza, J.K.; Orjuela Yepes, D.; Rodrigo-Ilarri, J.; Cassiraga, E. Predictive analysis of urban waste generation for the city of Bogotá, Colombia, through the implementation of decision trees-based machine learning, support vector machines and artificial neural networks. Heliyon 2019, 5, e02810. [Google Scholar] [CrossRef]
  37. Calderón Márquez, A.J.; Rutkowski, E.W. Waste management drivers towards a circular economy in the global south—The Colombian case. Waste Manag. 2020, 110, 53–65. [Google Scholar] [CrossRef] [PubMed]
  38. Ezeah, C.; Fazakerley, J.A.; Roberts, C.L. Emerging trends in informal sector recycling in developing and transition countries. Waste Manag. 2013, 33, 2509–2519. [Google Scholar] [CrossRef] [PubMed]
  39. Hettiarachchi, H.; Ryu, S.; Caucci, S.; Silva, R. Municipal Solid Waste Management in Latin America and the Caribbean: Issues and Potential Solutions from the Governance Perspective. Recycling 2018, 3, 19. [Google Scholar] [CrossRef] [Green Version]
  40. Velis, C. Waste pickers in Global South: Informal recycling sector in a circular economy era. Waste Manag. Res. 2017, 35, 329–331. [Google Scholar] [CrossRef] [PubMed]
  41. Molano Camargo, F. El relleno sanitario Doña Juana en Bogotá: La producción política de un paisaje tóxico, 1988–2019. Hist. Crítica 2019, 74, 127–149. [Google Scholar] [CrossRef]
  42. Superintendencia de Servicios Públicos Domiciliarios. Disposición Final de Residual Sólidos Informe Nacional—2018, 11th ed.; Superservicios: Bogotá, Colombia, 2019.
  43. Superintendencia de Servicios Públicos Domiciliarios. Informe Sectorial de la Actividad de Aprovechamiento 2018, 11th ed.; Superservicios: Bogotá, Colombia, 2019. Available online: https://www.superservicios.gov.co/sites/default/archivos/Publicaciones/Publicaciones/2020/Ene/informe_nacional_disposicion_final_2019_1.pdf (accessed on 3 August 2020).
  44. Departamento Nacional de Planeación, Consejo Nacional de Política Económica y Social. CONPES 3874: Política Nacional Para La Gestión Integral De Residuos Sólidos; Consejo Nacional de Política Económica y Social: Bogotá, Colombia, 2016. Available online: https://colaboracion.dnp.gov.co/CDT/Conpes/Econ%C3%B3micos/3874.pdf (accessed on 19 June 2020).
  45. Ministerio de Ambiente y Desarrollo Sostenible; Ministerio de Comercio, Industria y Turismo. Estrategia Nacional Economía Circular: Cierre de Ciclos de Materiales, Innovación, Tecnológica, Colaboración y Nuevos Modelos de Negocio, Transformación Productiva y Cierre de Ciclos de Materiales; Government of Colombia: Bogotá, Colombia, 2019. Available online: https://www.dnp.gov.co/Crecimiento-Verde/Documents/Comite%20Sostenibilidad/Presentaciones/Sesi%C3%B3n%201/2_Presentacion_Estrategia_nacional_economia_circular.pdf (accessed on 19 June 2020).
  46. Duque, N. Importancia de la Categorización Territorial Para la Descentralización y las Relaciones Intergubernamentales en Colombia. Derecho del Estado No 38. 2017, pp. 67–95. Available online: https://revistas.uexternado.edu.co/index.php/derest/article/view/4927 (accessed on 19 June 2020).
  47. Congreso de Colombia. Ley 617 de 2000. Available online: http://www.secretariasenado.gov.co/senado/basedoc/ley_0617_2000.html (accessed on 19 June 2020).
  48. Congreso de Colombia. Ley 142 de 1994. Available online: http://www.secretariasenado.gov.co/senado/basedoc/ley_0142_1994.html (accessed on 3 August 2020).
  49. Ministerio de Vivienda, Ciudad y Territorio; Ministerio de Ambiente y Desarrollo Sostenible. Resolución 754 de 2014. Available online: https://www.corantioquia.gov.co/SiteAssets/PDF/Gesti%C3%B3n%20ambiental/Residuos/Anexo%20residuos%20ordinarios/Resoluci%C3%B3n%200754%20del%202014.pdf (accessed on 3 August 2020).
  50. Plan de Gestión Integral de Residuos Sólidos. Available online: http://www.minvivienda.gov.co/viceministerios/viceministerio-de-agua/gestioninstitucional/gesti%C3%B3n-de-residuos-solidos/planes-de-gestion-integral-de-residuos-solidos/pgirs-segunda-generacion (accessed on 30 June 2020).
  51. Alcaldía Municipal de Zarzal. Plan de Gestión Integral de Residuos Sólidos; Unidad de Asistencia Técnica Agropecuaria—UMATA: Zarzal, Colombia, 2015.
  52. Alcaldía Municipal de San Gil. Plan de Gestión Integral de Residuos Sólidos; A. AMSG—ACUASAN: San Gil, Colombia, 2015.
  53. Alcaldía Municipal de Marinilla. Plan de Gestión Integral de Residuos Sólidos; Empresa de Servicios Públicos de San José de La Marinilla ESPA ESP: Marinilla, Colombia, 2016.
  54. Alcaldía Municipal de Granada. Plan de Gestión Integral de Residuos Sólidos; Empresas de Servicios Públicos de Granda EDESA SA ESP: Granada, Colombia, 2016.
  55. Alcaldía Municipal de Sibaté. Plan de Gestión Integral de Residuos Sólidos; Empresas Públicas Municipales de Sibaté S.C.A. ESP: Sibaté, Colombia, 2019.
  56. Gélvez, M. Propuesta Para el Manejo Integral de Residuos Sólidos Urbanos en el Municipio de Puerto Escondido, Córdoba, Colombia; Universidad Militar Nueva Granada: Bogotá, Colombia, 2017. [Google Scholar]
  57. Departamento Nacional de Planeación. Sistema de Estadística Territoriales TerriData. Available online: https://terridata.dnp.gov.co/index-app.html#/perfiles (accessed on 19 June 2020).
  58. Colorado-Lopera, H.A.; Echeverri-Lopera, G.I. The solid waste in Colombia analyzed via gross domestic product: Towards a sustainable economy. Rev. Fac. Ing. Univ. Antioq. 2020, 96, 51–63. [Google Scholar] [CrossRef]
  59. Hernández-Berriel, M.; Aguilar-Virgen, Q.; Taboada-González, P.; Lima-Morra, R.; Eljaiek-Urzola, M.; Márquez-Benavides, L.; Buenrostro-Delgado, O. Generación y Composición de los Residuos Sólidos Urbanos en América Latina y el Caribe. Rev. Int. Contam. Ambie. 2016, 32, 11–22. [Google Scholar] [CrossRef] [Green Version]
  60. Ministerio de Vivienda, Ciudad y Territorio. Reglamento Técnico del Sector Agua Potable y Saneamiento Básico: Titulo B. Sistemas de acueducto. Viceministerio de Agua y Saneamiento Básico, 2nd ed.; Centro de Investigaciones en Acueductos y Alcantarillados—CIACUA, Departamento de Ingeniería Civil y Ambiental, Universidad de los Andes: Bogotá, Colombia, 2010. Available online: https://www.minvivienda.gov.co/sites/default/files/documentos/titulob-030714.pdf (accessed on 3 August 2020).
  61. Departamento Administrativo Nacional de Estadística. Censo General. 2005. Available online: https://www.dane.gov.co/index.php/estadisticas-por-tema/demografia-y-poblacion/censo-general-2005-1 (accessed on 20 June 2020).
  62. Ministerio de Vivienda, Ciudad y Territorio. Reglamento Técnico del Sector Agua Potable y Saneamiento Básico: Titulo F. Sistemas de Aseo Urbano, 2nd ed.; Viceministerio de Agua y Saneamiento Básico: Bogotá, Colombia, 2012. Available online: https://www.minvivienda.gov.co/sites/default/files/documentos/titulo-f.pdf (accessed on 3 August 2020).
  63. Domínguez, F.; Nieves, A. Errores. In Métodos Numéricos Aplicados a la Ingeniería; Grupo Editorial Patria: Mexico City, Mexico, 2011; pp. 13–22. [Google Scholar]
  64. Martinez, J. Outlook of Municipal Solid Waste in Bogota (Colombia). Am. J. Eng. Appl. Sci. 2016, 9. [Google Scholar] [CrossRef]
  65. Martínez, C.I.P.; Piña, W.A. Solid waste management in Bogotá: The role of recycling associations as investigated through SWOT analysis. Environ. Dev. Sustain. 2016, 19, 1067–1086. [Google Scholar] [CrossRef]
  66. Ochoa, M. Barrido, recolección, Conceptualización y análisis de la gestión integral de residuos en Colombia. In Gestión Integral de Residuos. Análisis Normativo y Herramientas Para Su Implementación; Universidad del Rosario: Bogotá, Colombia, 2018. [Google Scholar]
  67. Campani, D.; La Torre, F.; Sarafian, D.; Tello, P. Barrido, recolección, Transporte y Transferencia de Residuos Sólidos Urbanos. In Gestión Integral de Residuos Sólidos Urbanos; Asociación Interamericana de Ingeniería Sanitaria y Ambiental AIDIS: São Paulo, Brasil, 2018; pp. 60–65. [Google Scholar]
  68. Ramírez, O. Identificación de problemáticas ambientales en Colombia a partir de la percepción social de estudiantes universitarios localizados en diferentes zonas del país. Rev. Int. Contam. Ambie. 2015, 31, 293–310. [Google Scholar]
Figure 1. Location map of Colombia inside South America.
Sustainability 13 03816 g001
Figure 2. Geographic location of the six municipalities: Cundinamarca region and Sibaté; Boyacá region and Chiquinquirá; Santander region and San Gil; Valle del Cauca region and Zarzal; Meta region and Granada; Antioquia region and Marinilla.
Sustainability 13 03816 g002
Figure 3. Flowchart of the proposed methodology for municipal solid waste (MSW) management analysis in low-income areas.
Sustainability 13 03816 g003
Figure 4. Estimation of the MSW future production rate in the six municipalities (a) Sibaté; (b) Chiquinquirá; (c) San Gil; (d) Zarzal; (e) Granada; (f) Marinilla.
Sustainability 13 03816 g004
Figure 5. Percentual composition of MSW.
Sustainability 13 03816 g005
Figure 6. Distribution in fractions of MSW recycling potential in every municipality.
Sustainability 13 03816 g006
Figure 7. Geographic location of the final disposal sites (sanitary landfills) inside the municipality area. (a) Municipality of Sibaté and sanitary landfill of Nuevo Mondoñedo; (b) Municipality of Marinilla and sanitary landfill of Los Saltos; (c) Municipality of Chiquinquirá and sanitary landfill of Carapacho; (d) Municipality of San Gil and sanitary landfill of El Cucharo (Acuasan); (e) Municipality of Granada and sanitary landfill of La Guaratara; (f) Municipality of Zarzal and sanitary landfill of Presidente.
Sustainability 13 03816 g007aSustainability 13 03816 g007b
Table 1. Territorial extension of the municipalities under study.
MunicipalityArea (km2)
Sibaté120
Chiquinquirá171
San Gil150
Zarzal371
Granada381
Marinilla116
Table 2. Main characteristics of the scenarios under analysis.
ReferenceEstimation 1Estimation 2
Corresponds to the amount of waste generated in the municipality detailed in the Comprehensive Solid Waste Management Plan (CSWMP) according to the projections made in the PlanCorresponds to the amount of waste generated in each municipality detailed in the CSWMP in relation to the number of inhabitants reported by government entities for 2018Corresponds to the value reported in the 2018 National Final Disposal Report
Table 3. MSW per capita production (PPC) in urban and rural areas.
MunicipalityUrban PPC (kg/Day)Rural PPC (kg/Day)
Sibaté0.6500.460
Chiquinquirá0.5500.420
San Gil0.7900.270
Zarzal0.7300.860
Granada0.7100.450
Marinilla0.4700.290
Table 4. MSW generation ratios for every scenario.
YearMunicipalityReference Value
kg/Day
Estimation 1
(E1)
kg/Day
Absolute Error
E1
Relative Error
E1 (%)
Estimation 2
(E2)
kg/Day
Absolute Error
E2
Relative Error
E2 (%)
2018Sibaté32,36626,348601818.59018,83013,53641.820
Chiquinquirá32,58532,652670.21033,1906051.860
San Gil40,26947,139687017.06046,530626115.550
Zarzal13,60930,95717,348127.48084,81071,201523.200
Granada72,18651,52120,66528.63029,25142,93559.480
Marinilla25,64051,59925,959101.24027,91022708.850
2019Sibaté32,77126,758601318.35019,12313,64841.650
Chiquinquirá32,84632,785600.18033,3254801.460
San Gil41,52748,343681616.41047,719619214.910
Zarzal13,81831,09417,276125.03085,18571,367516.490
Granada73,04152,83820,20327.66029,99943,04258.930
Marinilla26,57053,19826,628100.22028,77522058.300
2020Sibaté33,18027,174600618.10019,42013,76041.470
Chiquinquirá33,10827,174593517.92019,42013,68841.340
San Gil42,82449,578675415.77048,938611414.280
Zarzal14,03031,23217,202122.61085,56271,532509.850
Granada74,33754,18820,14927.10030,76543,57258.610
Marinilla27,51054,84627,33699.37029,66721577.840
2021Sibaté33,59427,596599817.85019,72213,87241.290
Chiquinquirá33,59427,596599817.85019,72213,87241.290
San Gil44,16250,845668315.13050,188602613.640
Zarzal14,24531,37017,125120.22085,94171,696503.320
Granada76,09555,57320,52226.97031,55244,54358.540
Marinilla28,47056,54628,07698.62030,58621167.430
2022Sibaté34,01528,026598917.61020,02913,98641.120
Chiquinquirá33,64033,1884521.34033,735940.280
San Gil45,54152,144660314.50051,470592913.020
Zarzal14,46331,50917,046117.86086,32171,859496.850
Granada78,34956,99421,35527.26032,35845,99158.700
Marinilla29,46058,29828,83897.89031,53420747.040
Table 5. Main components of the collection and transport activities.
MunicipalityVehicle TypeNumber of
Vehicles
Volume (yd3)Number of
Microroutes
Frequency
(Times/Week)
SibatéCompactor125102
116
117
ChiquinquiráCompactor21683
18
San GilCompactor21673
18
ZarzalCompactor22573
GranadaCompactor12672
116
MarinillaCompactor317102 or 3
Table 6. Efficiency of MSW collection coverage.
MunicipalityUrban Efficiency (%)Rural Efficiency (%)
Sibaté10098
Chiquinquirá1000
San Gil1000
Zarzal10085
Granada100100
Marinilla10091.170
Table 7. Sweeping and cleaning of roads and public areas components.
MunicipalitySweeping Distance (km)MicroroutesFrequency (Times/Week)Number of
Baskets
Sibaté64.530216144
Chiquinquirá49.3204612
San Gil66.74016330
Zarzal6220615
Granada301.3022374
Marinilla149106100
Table 8. Recycling system characteristics.
MunicipalityRecycler
Type
Number of
Recyclers
Association NameCollection Centers
SibatéAssociation55ASOCRO, ARSI y ACRUB4
ChiquinquiráAssociation47Asociación de Recicladores de Chiquinquirá9
San GilIndependent71 4
ZarzalIndependent6 5
GranadaIndependent40 13
MarinillaAssociation & Independent83CORPOGESTAR ORIENTE5
Table 9. Final landfilling sites.
MunicipalitySanitary LandfillManaging AuthorityDistance (km)
SibatéNuevo MondoñedoRegional27
ChiquinquiráCarapachoMunicipal20
San GilEl Cucharo (Aucuasan)Regional9
ZarzalPresidenteRegional60
GranadaLa GuarataraRegional2
MarinillaLos SaltosMunicipal18
Publisher’s Note: MDPI stays neutral with regard to jurisdictional claims in published maps and institutional affiliations.

