1. Introduction
In various industries, e.g., energy, transport, chemistry, many technologies are based on heat and mass transfer processes in liquid dispersion phase. When a liquid is dispersed to droplets, the area of the contact surface between a liquid discrete phase and a uniform gaseous phase expands greatly. Hence, processes of heat and mass transfer between droplets of gas and liquid become very effective. The practice of sprayed liquid is widespread [
1,
2,
3,
4,
5,
6], and therefore boundary conditions for the heat and mass transfer in droplets are rather different. One of the aspects that all liquid spray technologies have in common is the semi-transparent liquid, and therefore it is important to define the regularities to heat transfer and phase change processes that take place in droplets. In this aspect, complex theoretical and experimental studies of transfer processes in various liquid droplets and comparative evaluations of their results in terms of both qualitative commonality and quantitative specificity are important. Processes of droplet heat and mass transfer have been investigated for more than a hundred years now [
7], and yet this matter gains more and more attention [
8] because of the need of better knowledge about the transfer processes in sprayed liquid flows in order to optimize the existing and to develop new more efficient and more environmentally friendly industry and energy technologies as well as modern transportation means.
Considering the regulatory pattern of the US and the EU, it can be reasonably expected that emission limits for vehicles will become even stricter. Despite the rapid development of the electric car industry, cars with internal combustion engines will not cease to exist. Diesel cars constitute approximately 50 percent of annual car registrations in the European Union (but less than 1 percent in the United States). Compared to gasoline, the emission control (NO
x, PM) for diesel vehicles is more complex, requires relatively new technologies, not to mention the greater costs. The most plausible solution to the situation is a gradual decrease of the market share occupied by diesel. Over that last decade, the transport sector has made significant reductions to its gas emissions, and despite of that it still remains to be the largest contributor to NO
x emissions: 46 percent of total EU—28 emissions. In the government’s policy for emission reduction, vehicles powered by diesel fuel are among the most urgent targets since they account for 80 percent of the total NO
x emissions in the world [
9].
The quality of diesel-powered engine combustion depends on the formed mixture of fuel and air. A faulty combustion process results in a loud engine, particulate matter (PM), and NO
x. In fact, many factors determine the performance of diesel engines and the characteristics of emission. One of the key factors is the control of fuel injection since, if performed right, it can minimize the exhaust emission and thus increase the performance of the engine. When the fuel is injected into the combustion chamber, it breaks into small droplets. The droplets start vaporizing as heat transfer processes begin due to air compression, high temperature, and formation of the air-fuel mixture. Atomization of fuel yields tiny fuel droplets, which means wider surface area and better mixing during the combustion process. Atomization happens when a high pressure forces fuel through a narrow orifice. In the case of a low pressure of injection, the fuel droplet diameters increase during combustion and the ignition delay period is prolonged, resulting in an increase in pressure and a decrease in engine efficiency [
10]. In the case of an increased fuel injection pressure, the fuel droplet diameter decreases, and therefore air and fuel mix better in the ignition process [
11].
In terms of the use of renewable fuels, the best alternative to conventional fuels is biofuels. Solid biofuels are often combusted in energy installations. Biogas and liquid biofuels have recently been frequently used in transport sector i.e., in engines as well. Investigations of droplet heat and mass transfer processes are important for optimizing the combustion of water and liquid fuel emulsions. The fuel is made through transesterification—a chemical process when the glycerin is separated from the fat and/or vegetable oil. Yet, there are certain limitations to biodiesel, e.g., possible harm to rubber hoses, clogging of fuel filters, high viscosity, calorific value, and volatility. More than several researches have been conducted on the performance of rail-compressed diesel-powered engines and the characteristics of the emissions in the case of the mixture of diesel fuel and biodiesel [
12]. Emulsification has been proposed as one of the options to solve the issue. In the emulsification process, several immiscible liquids are dispersed together to form a uniform mixture, which, in the discussed topic, should power a diesel engine properly. Most popular investigations with emulsified fuel in diesel engine are the water and diesel emulsions. Also, several investigations have been reported when emulsions have been prepared with animal fat, methanol, and ethanol [
13].
Issues of pollution control and reduction are significant not only in transport sector but in energy sectors as well. For now, the world’s resources of fossil fuels are still sufficient to satisfy the energy needs of industries and households [
14]. However, the combustion of natural gas and oil is irrational, first of all, because the resources are finite and, second, their application is very wide. The fossil fuel as a component in global energy must be reduced [
15], and renewable energy technologies have been rapidly developed for this reason [
16]. The resources of these sources are sustainable and viable to use [
17,
18,
19]. The sources of biomass and biofuels are practically inexhaustible [
18], and therefore the technologies based on them are being increasingly applied in practice [
19,
20,
21,
22,
23]. The end product of the fuel combustion process is carbon dioxide. However, toxic oxides of nitrogen and sulfur form as well and solid fuel combustion products also contain unwanted solid particles—ash. Since the energy production using fuel combustion processes leads to obviously negative consequences for the environment [
24], exceptional consideration must be devoted to environmental issues in the course of the change from fossil fuel combustion technologies to biofuel technologies. First of all, the quality of biofuel combustion at the furnace must be ensured. Second, the heat of cooling flue gases in heat exchangers must be utilized efficiently, and the flue gases discharged into the atmosphere must be clean and the least polluting. During hydrogen combustion when the moisture of the fuel vaporizes, the water vapor accumulates in the flue gas. A biofuel furnace emits flue gas of a temperature close to 1000 °C, in which the volume fraction of water vapor
Xv can be as large as 0.4 [
25]. In a biofuel boiler, flue gas is cooled to a temperature of 150–200 °C. In traditional heat exchangers, however, water vapor condensation is undesirable due to the possible corrosion of metals, and thus the humidity of the flue gas does not change. Before being discharged into the environment, the flue gas is further cooled and dried in a condensing heat exchanger [
25,
26,
27,
28]. Flue gas cleaning technologies are also important in reducing atmospheric pollution [
29,
30].
When the flue gas in a condensing heat exchanger is cooled to a temperature of ≈40 °C and dried to
Xv ≈ 0.07, a significant amount of thermal energy is recovered and the efficiency of the biofuel boiler can increase up to 30 percent. It is significant that the temperature of the flue gas entering the heat exchanger is close to the dew point temperature and that the vapor condensation process starts as soon as possible. It is then possible to use smaller condensing heat exchangers and significantly reduce the investment costs associated with the high cost of non-ferrous metal constructions used in them. Therefore, an effective solution is to cool down the flue gas to even lower temperatures before the condensing heat exchanger by spraying water into the flue gas flow [
6]. The water is usually an accumulated water vapor condensate with a temperature close to 40 °C. The flue gas is not only cooled to a temperature of 90 ± 10 °C, but also additionally humidified. In this way, the dew point temperature can be increased up to 80 °C. The important thing is that the complete evaporation of the injected condensate droplets is not necessary, as water is additionally sprayed in the condensing heat exchanger itself. In contact-type condensing shell and tube heat exchangers, water vapor is condensed from the flue gas directly onto the sprayed water droplets. In this case, the process of water vapor condensation is very important, and the evaporation of droplets is undesirable. In recuperative condensing heat exchangers, water is sprayed into the flue gas flow before it enters the tube bundles. In this case, only processes of transitional phase change in droplets take place, and the flow of non-completely evaporated water droplets improves the hydrodynamics of the condensate film flow in the pipes.
Thus, by highlighting the problems in the transport and energy sectors, it can be concluded that the knowledge of heat and mass transfer processes in droplet phase change regimes greatly influences the definition of optimal water spray into the biofuel flue gas flow. Here, two typical cases of droplet phase change regimes can be distinguished. In the first case, water is sprayed into a high-temperature gas flow and the droplets evaporate under combined radiation-convection heating conditions. In the second case, water is sprayed into a gas flow with a relatively low temperature and transitional phase change regime from condensation to evaporation take place in the droplets under prevailing convective conditions.
The interaction between the processes involved in combined transfer in flows of liquid droplets and gas is intense [
8,
31,
32,
33]. Factors defining the intensity of the interaction include the effect of the Stefan flow on droplet convective heat transfer and phase changes [
31] and the effect of thermal radiation absorbed in a semi-transparent liquid on droplet thermal state and internal heat exchange [
8,
32]. Due to non-isotherm conditions in droplets, Archimede’s forces are insufficient to cause spontaneous water circulation in them [
33]. However, the forces exerted on the surface of the droplets slipping in a gas flow cause the forced circulation of water [
34]. Therefore, in the case of combined heating, the heat in droplets is transferred by radiation and convection. The theory of effective thermal conductivity is applied to define convective heat transfer [
34]. The combined heat transfer in semi-transparent droplets is defined by modern models of spectral radiation [
35,
36,
37,
38,
39,
40]. The volumetric absorption of spectral radiation in semi-transparent liquids is usually defined by models based on the Mi theory [
35,
38,
39,
40]. When modeling the interaction between combined heat transfer processes, it is important to define the temperature field in the droplet and the local flux of radiation. Then, spectral radiation models based on the geometrical optics theory are applied [
36,
37]. Due to multiple reflections of a light beam in the droplet ensemble of the sprayed liquid, the intensity of the light beam reflected from gas and the gas-limiting channel walls (in energy installations, the walls are often covered in a layer of soot) and striking a single droplet is close to the spectral radiation of the black body [
35,
37]. The internal heat transfer of a semi-transparent droplet can be efficiently described according to the integral-type model of combined heat transfer by conductivity and radiation [
36], and the influence of water circulation can be evaluated by the effective thermal conductivity parameter according to the methodology [
34].
The process of radiation absorption in droplets of a semi-transparent liquid, including water, strongly depends on the size of the droplets [
35]. Therefore, for droplets of different dispersity, the intensity of the interaction between the processes of combined heat and mass transfer will be different [
41]. Investigation in [
6] confirms the essential roles of water droplet slipping in a gas flow and the absorption of the local flux of radiation in those droplets during an interaction between combined transfer processes. However, the work does not describe the influence mechanism of these factors on the interaction. The intensity of the interaction will also be affected by the specific change in the diameter of individual droplets in their phase change regimes. The aim of this work is to highlight the influence of droplet dispersity on the interaction between the processes of combined heat and mass transfer and to evaluate the influence of the key defining factors in consistently varying phase change regimes of the water sprayed into a high-temperature gas flow.
2. Materials and Methods
When modeling droplet phase changes, some authors use commercial codes [
42], while others employ their own developed codes. The latter case is the present work. Here water droplet phase changes in a wet gas flow were modeled using QBASIC with the original numerical investigation software LASAS developed by Kaunas University of Technology’s Department of Energy. The numerical iterative scheme defining the average instantaneous temperature of the droplet’s surface and working according to the fastest descent method is based on the energy balance of combined heat transfer thermal flows and of phase change thermal flows moving toward and away from the droplet’s surface. Processes of internal heat transfer in a semi-transparent droplet are described based on an integral model of heat transfer by conduction and radiation, and a possible influence of water circulation is evaluated by the effective parameter of thermal conductivity. The local radiation flux in the droplet is defined by a spectral model based on geometrical optics. External heat and mass transfer by convection in the droplet is described based on empirical equations for the case of a solid particle by foreseeing an analogy for the Reynolds and by evaluating the influence of the Stefan flow on the classical functions of the Spalding’s numbers. The applied software LASAS and its numerical method of solution are described below.
Processes of heat and mass transfer in water droplets in biofuel flue gas flow are modeled in a cycle of consistently changing regimes of condensation, transitional evaporation, and equilibrium evaporation. The cycle is defined in the time (τ, [s]) scale:
A cycle (1) of phase change regimes begins (τ = 0) at the moment water is sprayed into a biofuel flue gas flow. The cycle ends at the moment the droplet’s evaporation ends (τ = τf). Therefore, droplets of different sizes have individual cycles of phase changes (1).
The following assumptions are made: The droplet’s size is defined by the diameter of its sphere equivalent to the droplet’s volume; the phase change regime of the droplet is defined by the average instantaneous temperature of its surface; the analogy of the Reynolds criterion applies to the convective heating and evaporation of the droplet; because of the multiple reflections of the light beam in droplet ensemble, the intensity of a light beam that falls on a separate droplet is close to the spectral radiation of the black body; the condition of quasi-stationarity applies to the transfer processes.
The intensity of the external heating of the droplet is defined by the total heat flux (
qΣ), which is defined by the radiation (
qr,g) and convection (
qc,g) components:
, [W/m
2]. The internal heat exchange in the droplet is also defined by the total heat flux, which is defined by the radiation and convection components:
, [W/m
2]. The heat flux of ongoing phase changes (
qf [W/m
2]) is defined as a product of condensing water vapor or evaporating water vapor (g
v, [kg/s]) condensing on the surface of a droplet and of phase change heat (L, [J/kg]):
, [W/m
2]. The ongoing complex processes of heat transfer and phase changes are closely related to the thermal state of the droplet. The dynamics of the surface temperature (T
R) of a heating droplet, which is defined by the time function
TR (τ), which describes the average temperature on the droplet surface
TR, [K] in a cycle of phase changes (1) is necessary in order to define the variation of phase change regimes in the cycle (1). A change in the thermal state of the droplet is determined by the interaction between processes of heat transfer and phase changes in phase change regimes of the droplet. As a result of such an interaction, the average temperature of the droplet’s surface changes so as to ensure the balance between the average heat flows moving toward and away from the droplet surface during a cycle of phase change regimes (1):
The condensation regime takes place until the temperature
TR is lower than the dew point temperature
Tdp defined by flue gas humidity. Under the condensation regime, the droplet is intensively heated by the heat released by the phase changes of water vapor together with the heat of external heat exchange. Therefore, the droplet’s surface heats up rapidly to the dew point temperature and at the time moment
τ = τco the condensation regime changes to the transitional evaporation regime. The heat from external heat exchange affecting the droplet under the transition evaporation regime heats and vaporizes the water. The equilibrium evaporation regime begins at the time moment
τ = τe, when the droplet heats up to the thermal state which ensures that the heat supplied to the droplet is fully incorporated in the surface evaporation of water. In the transitional evaporation regime, at a certain time moment
τr, a temperature field with the negative gradient is formed in the droplet of a semi-transparent liquid (which water is as confirmed by the peculiarity of water optical spectra properties [
43,
44]) under the influence of radiation [
32]. Since that moment, the formed conditions are in favor that a part of the radiation stream absorbed by the droplet is conducted by internal heat convection to the surface of the droplet and participate in the evaporation of water. At the time moment
τ = τe, the droplet temperature is the highest, and the temperature field gradient ensures the incorporation of the absorbed radiation stream into the process of water evaporation. The thermal state of a non-isothermal droplet is determined by the average temperature (
Tl,m) of the mass of water. The dynamics of the change in the average temperature in a cycle of phase change regimes in the droplet (1) is described by the temporal function
Tl,m(τ), which is defined by the function of the transient temperature field of the droplet in the case of combined heat transfer by radiation and convection (“c + r”):
After defining the vapor flow on the droplet’s surface according to the model [
34], the change in the equivalent radius of the droplet is described by the following differential equation of phase changes:
When there is no circulation of water in the droplet, combined heat transfer by radiation and conduction (the case of
heat exchange) takes place, and the transient temperature field of the droplet is described according to the following integral model [
36]:
The forced water circulation conditioned by frictional forces of the surface of the droplet sliding in a flue gas flow ensures more intensive heating in the inner layers of the droplet. This is a favorable condition to reduce non-isothermality in the droplet. It is assumed that the gradient of the transient temperature field of the droplet diminished in proportion to the parameter
kc of effective thermal conductivity in the case of combined heat transfer “c + r” as compared to the case of combined heat transfer “k + r” [
36]:
The parameter of effective thermal conductivity and velocity of a droplet are described based on the empirical model [
34,
45,
46]:
In Equations (3)–(7), al, [m2/s] and cp,l [J/(kg K)] are water thermal diffusivity and specific heat, respectively; BM and BTSpalding numbers for heat and mass transfer, respectively; Cf and Cl coefficients of friction and total resistance, respectively; Dvg, [m2/s], cp,vg, [J/(kg K)] and ρvg, [kg/m3] are the water vapor diffusion coefficient in a gas mixture at the droplet and the heat and density of this gas mixture, respectively; gv, [kg/s] is a vapor flux at the surface of the droplet; r, [m] the radial coordinate; R, [m] the droplet equivalent radius; Rel, Pel, and Prlare Reynolds, Péclet, and Prandtl numbers for water; Re and Re∞ are modified Reynolds number for a droplet defined by the gas flow conditions; Sh is the Sherwood number; qf and qc,g are fluxes of phase changes and convective heat on the droplet’s surface, respectively, [W/m2]; wg and wl are the velocity of a flue gas flow and the droplet, respectively, [m/s]; wl,R, [m/s] is the highest velocity of water flow on the droplet’s surface; ρl is water density [kg/m3].
In a cycle of phase change regimes (1), the temperature on the droplet’s surface is described numerically. The local radiating flux in a water droplet is calculated using the methodology [
36], which means the prediction of the existence of an external black radiation source with the temperature of gas and consideration of light spectral effects on the droplet’s surface [
47]. The complex refractive index of water in the thermal radiation spectrum is finite [
43,
44], and therefore an assumption is made that a water droplet does not absorb the light beam falling onto its surface (
qr,l =
qr,g). Thus, the formal equation of thermal flux balance on the droplet’s surface (2) is transformed into the function
TR(
τ), which defines the following integral equation:
In this Equation (8), the Sherwood number and the Nusselt number are defined by the correlation of a high degree of credibility from Clift et al. [
48]:
Equation (8) is a transcendental function that can be solved numerically only with an iterative scheme. Therefore, the boundary conditions for the system of Equations (1)–(9) describing the combined heat and mass transfer of a droplet in a flue gas flow are formulated with respect to the yet unknown temperature of the droplet’s surface, denying the effect of the processes of heat transfer and phase changes in the droplet on flue gas flow parameters:
The mathematical model (1–10) of combined heat and mass transfer describes the phase change problem known as the “single droplet” of a semi-transparent liquid. This problem is also the base for research into the numerical modeling of a two-phase flow of droplets and gas [
49]. The numerical solution scheme is formed by entering the radial dimensionless
η = r/R coordinate, which ensures a constant droplet radius under the regimes of the phase change cycle in the droplet (1). In the range of radial coordinate change
η ≡ 0
1, the number of
J control points
ηj is uniformly selected when
J = 41 [
50]:
To define the time grid, the time scale of the Fourier number
is introduced. In this scale, the multiplier of the connection between Fo time and τ scales is defined by the initial radius
R0 of droplets with different dispersity and by the uniform temperature coefficient
a0 selected for water with the temperature of 40 °C. The duration
of the cycle of phase change regimes
for droplets with different dispersity is then close to [
43]. Therefore, the time scale Fo for droplets different in size is graduated in equal
variation steps, ensuring that the droplets of different sizes have an individual
step on the real-time scale:
It is assumed that for the initial time
τ1 = 0, all parameters of heat and mass transfer
P0 are known. The instantaneous surface temperature
TR,i of the droplet is numerically defined by the Equation (8) according to the following iterative scheme:
The influence of the temporal gradient of the droplet’s surface temperature and of the radiation flow absorbed in the droplet estimating
fn in the equation (13) is defined numerically according to the following scheme:
The radial coordinate integrals in the scheme (14) are solved analytically according to the methodology described in [
36]. The iterative
it = 1
IT cycle to determine the instantaneous temperature
TR,i of a droplet is performed by the fastest descent method, minimizing the expression (13) at each control time period
τi, starting from
τi = 2. The instantaneous temperature
TR,i of the droplet’s surface is equated with the temperature
TR,i,IT selected for the final
IT iteration of the iteration cycle:
TR,i =
TR,i,it=IT. The final
IT iteration of the iteration cycle is considered to be the
it iteration in which the calculated heat fluxes moving toward and away from the droplet’s surface correspond with each other by reliability higher than 99.9 percent. The parameters of droplet
Pi,it (droplet diameter 2
Ri,it, temperature field in the droplet
Tj,i,it and the velocity of the slipping droplet Δ
wi,it) that are necessary for each iteration in the iteration cycle
it > 1 and that are yet unknown are equated to those calculated in the previous iteration:
Pi,it>1 ≡
Pi,it-1. For the first iteration
it = 1:
Pi,it = 1 ≡
Pi-1. In order to calculate the local radiation flux in the droplet, the spectral complex refractive index of water must be defined according to data in [
43,
44], i.e., taking 155
ωb values uniformly with respect to the wavelength
ωb=1
/λb in the range from
λb = 0.8 to
λb = 200 micrometers in the radiation spectrum as recommended in [
35]. Integration according to the wave number was performed by the rectangular method, and according to the angular coordinate the integration was done by the Gaussian method according to a 5-point scheme. Optical spectral effects (the reflection of a light beam on the outer and inner surfaces of the droplet, the light beam’s refraction at the interphasial contact boundary and its absorption in the droplet, as well as the Brewster’s angle) were evaluated according to the recommendations in [
47]. After each successive iteration, droplet diameter and movement velocity in respect of the flue gas flow were corrected by numerically solving the equation system of phase change dynamics (2). The temperature distribution in the droplet in the case of combined heat transfer through convection and radiation, when
kc > 1, is corrected according to the numerical scheme:
Other parameters
Pi of heat and mass transfer in the droplet are calculated according to the numerical schemes that were drawn based on the recommendations in [
46].
3. Results
The numerical study of the phase change of water droplets focused on the technology of introducing liquid catalysts into the flue gas flow of a biofuel furnace to reduce the concentration of toxogens. For this technology, it is very important to ensure that the sprayed water evaporates as quickly as possible so that moisture—which results in corrosion—does not enter the heat exchangers used in flue gas technological cooling. Biofuel flue gas was treated as a mixture of dry air and water vapor gas. It was set that a flue gas flow of 1000 °C and of the humidity of Xv = 0.25, according to the volume of water vapor, flows out from the biofuel furnace at a speed of 15 m/s. It was assumed that the water vapor condensate sprayed into the flue gas is of 40 °C of temperature and is accumulated in a condensing economizer. The sprayed condensate is expected to split into groups of small droplets (equivalent diameters 25 and 50 micrometers), medium-sized droplets (equivalent diameters 100 and 180 micrometers), large droplets (equivalent diameters 300 and 500 micrometers), and very large droplets (equivalent diameters 750 and 1000 micrometers) when the ratio of the sprayed condensate to flue gas flows is Gl/Gg ≈ 0. Therefore, droplet transfer processes have no significant influence on the parameters of the flue gas flow. Convective heating was defined by the initial velocity of 50 m/s for droplets slipping in the flue gas flow.
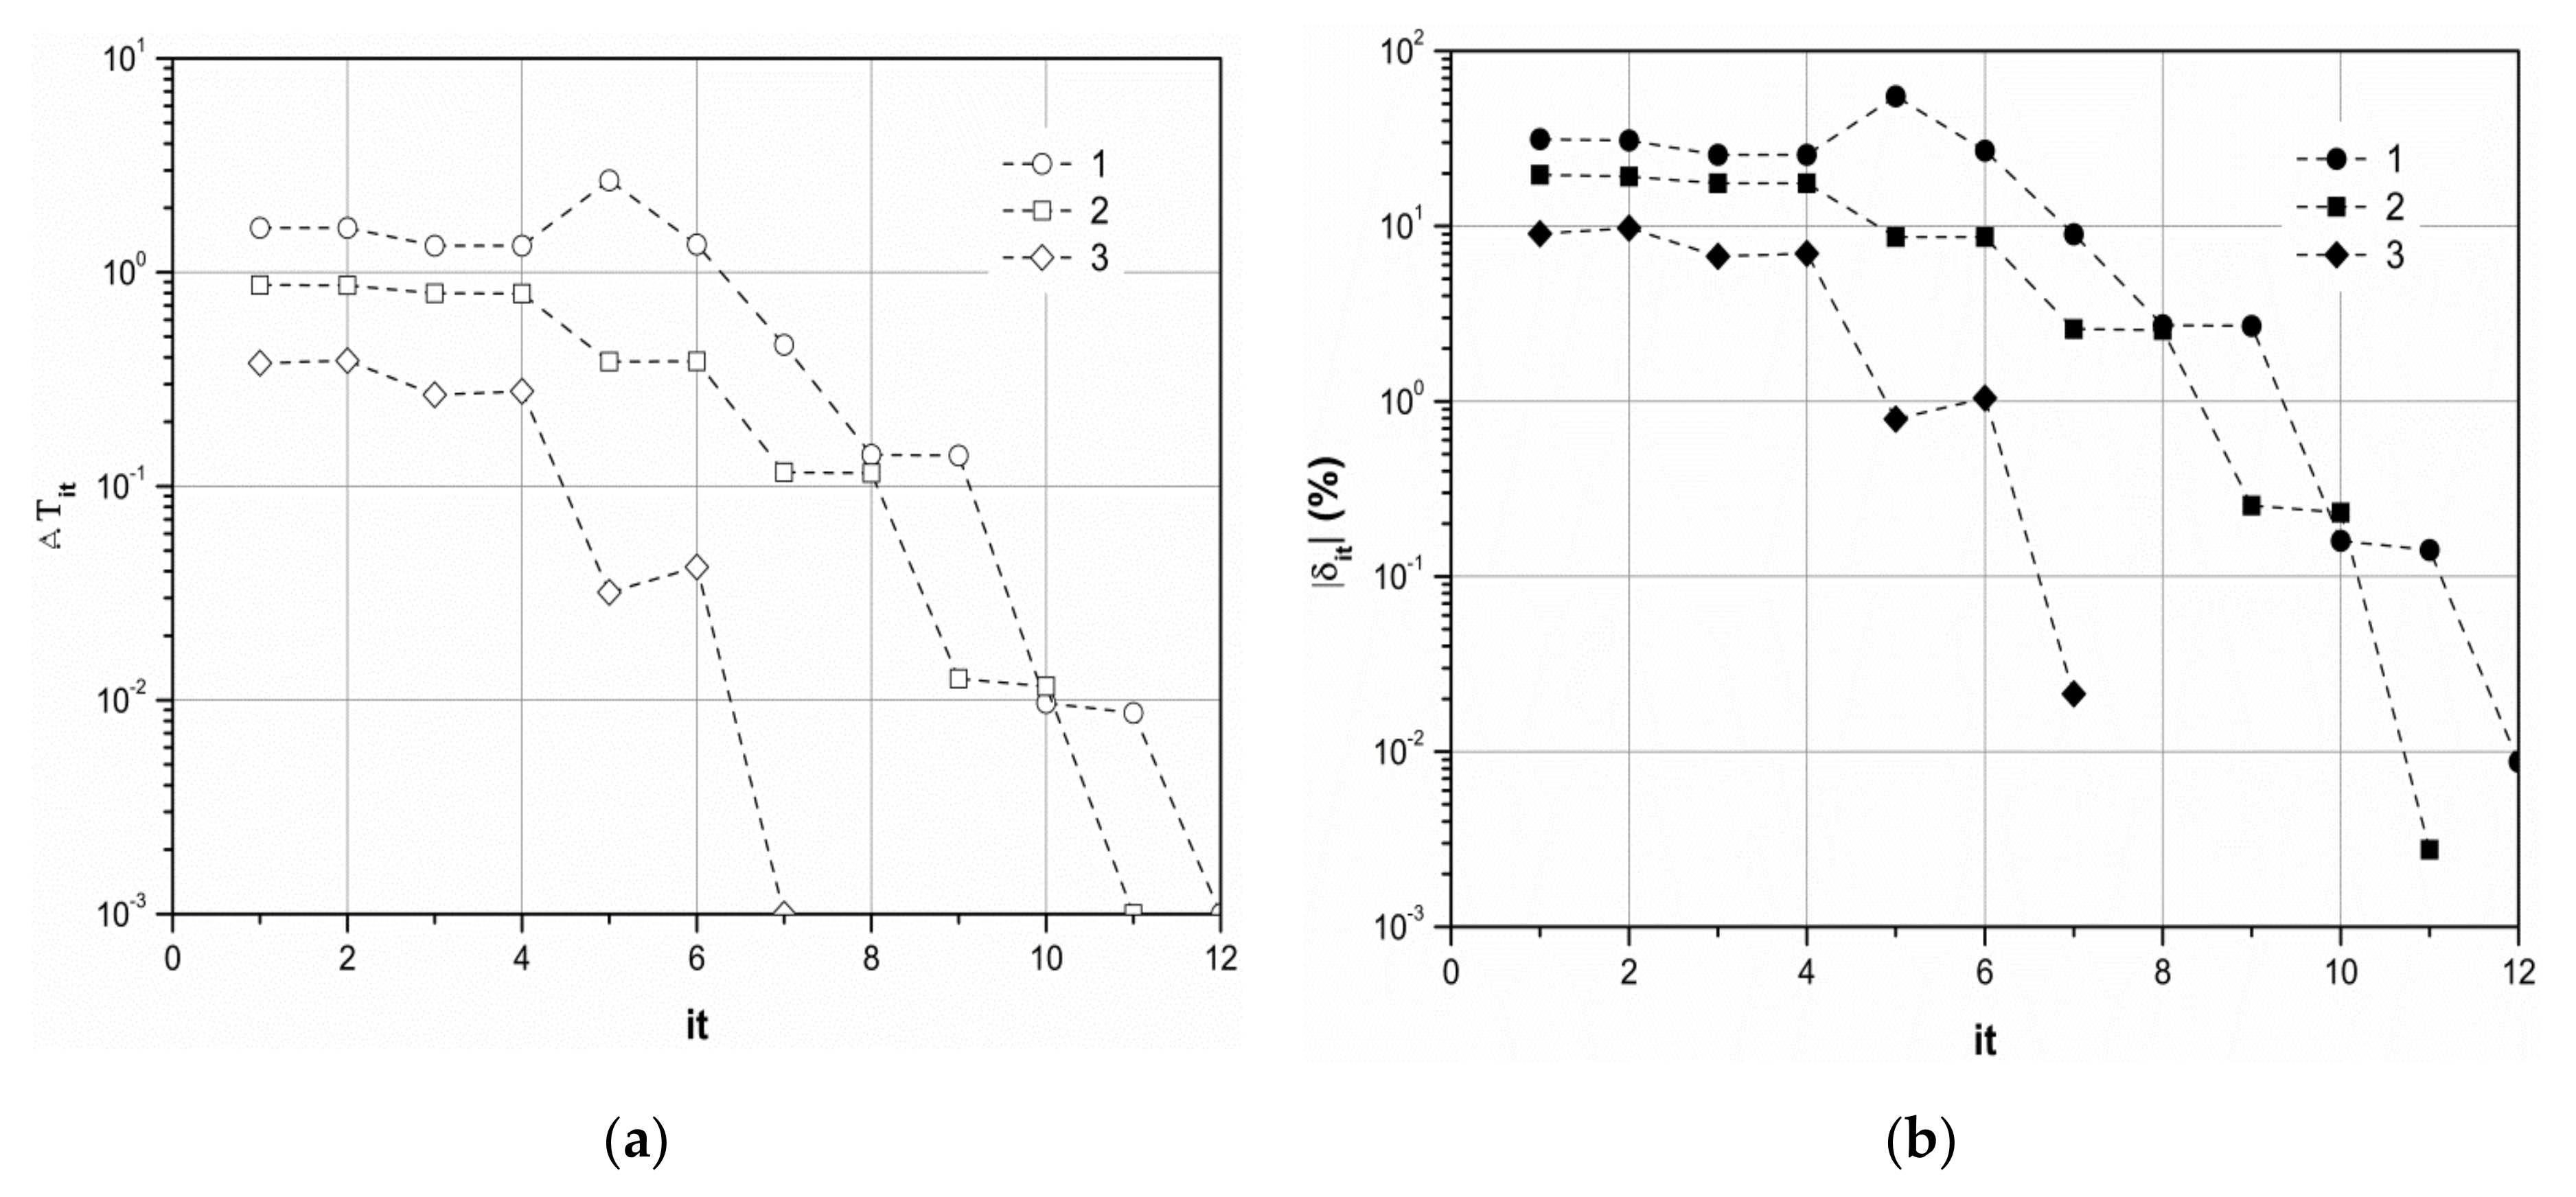
It was trying to ensure that each iteration cycle would have a defined instantaneous temperature
TR,i on the droplet’s surface which would ensure that the imbalance of calculated heat fluxes moving toward and away from the droplet’s surface is less than one-tenth of a percent.
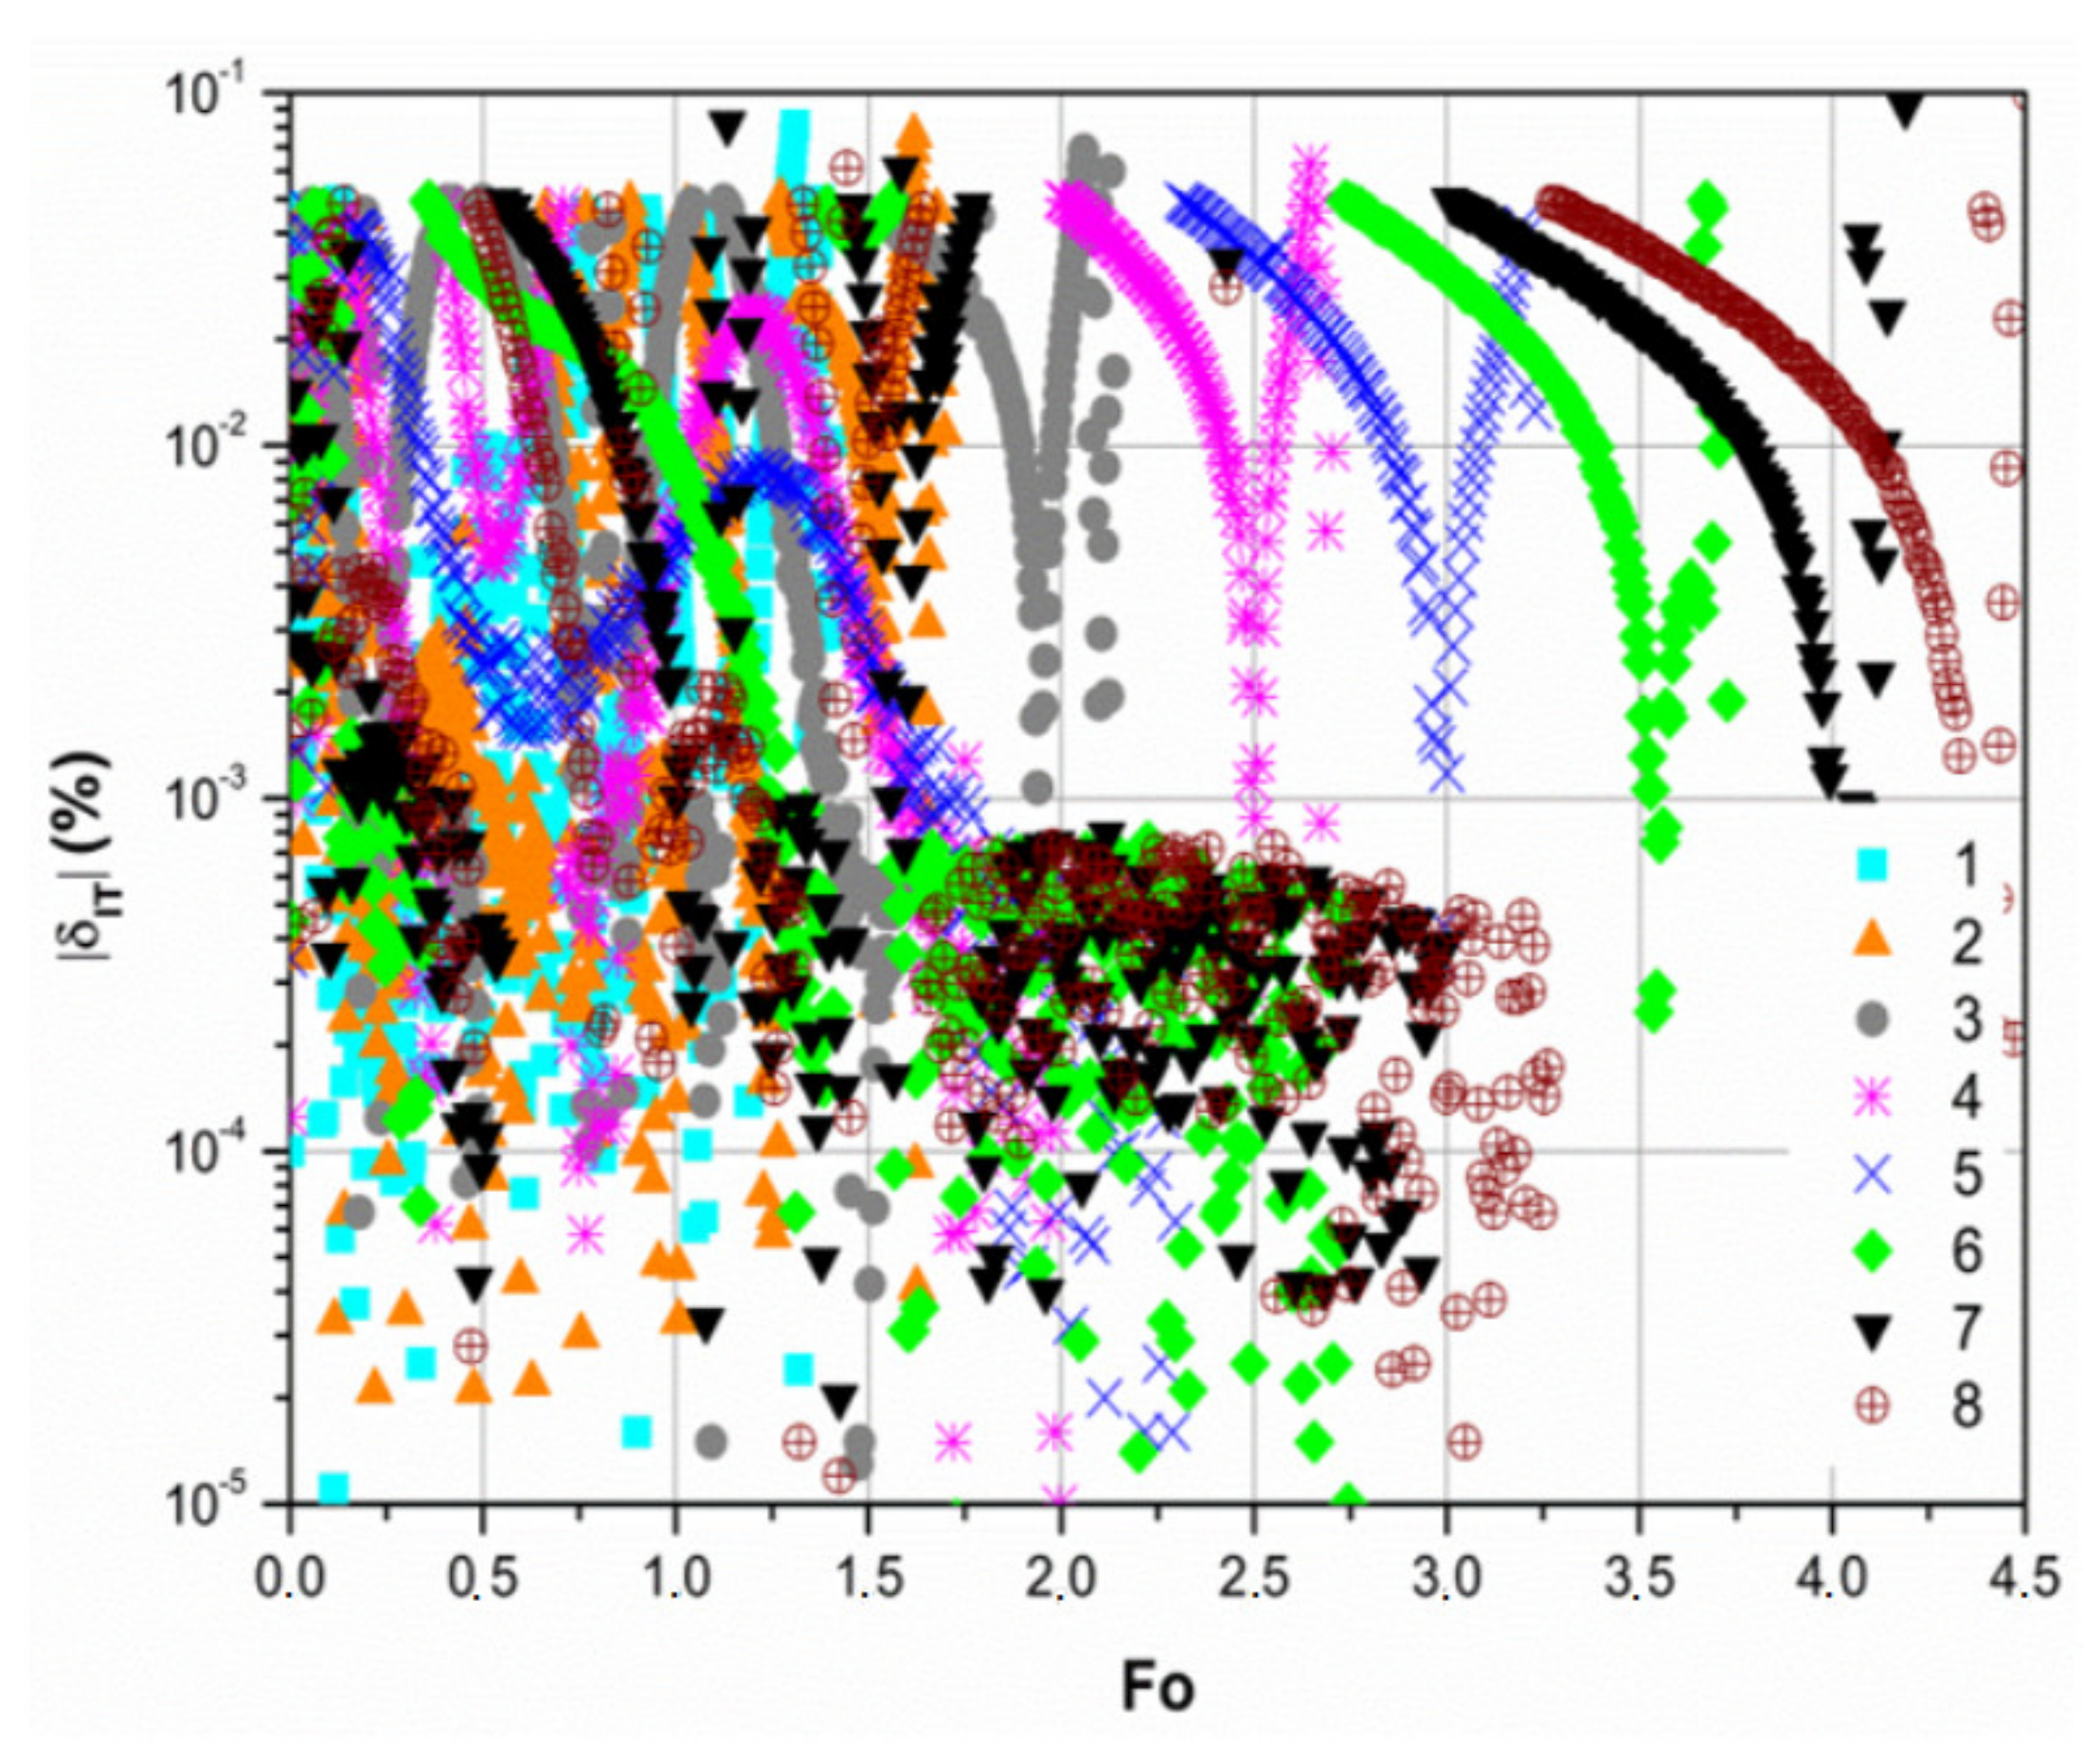
Figure 1 shows that in most cases the imbalance of the calculated heat fluxes on the droplet’s surface in an iteration cycle is significantly less than 0.1 percent. Examples of the executed iteration cycles are given in
Figure 2. It is clearly seen that the imbalance of the calculated heat fluxes (
Figure 2b) is very sensitive to the selected average temperature
TR,i,it on the droplet’s surface (
Figure 2a). In order to ensure the conformity of high reliability of heat fluxes moving toward and away from the surface, it is necessary to take into account the change in the temperature
TR,i on the droplet’s surface, which is less than one-hundredth of a degree.
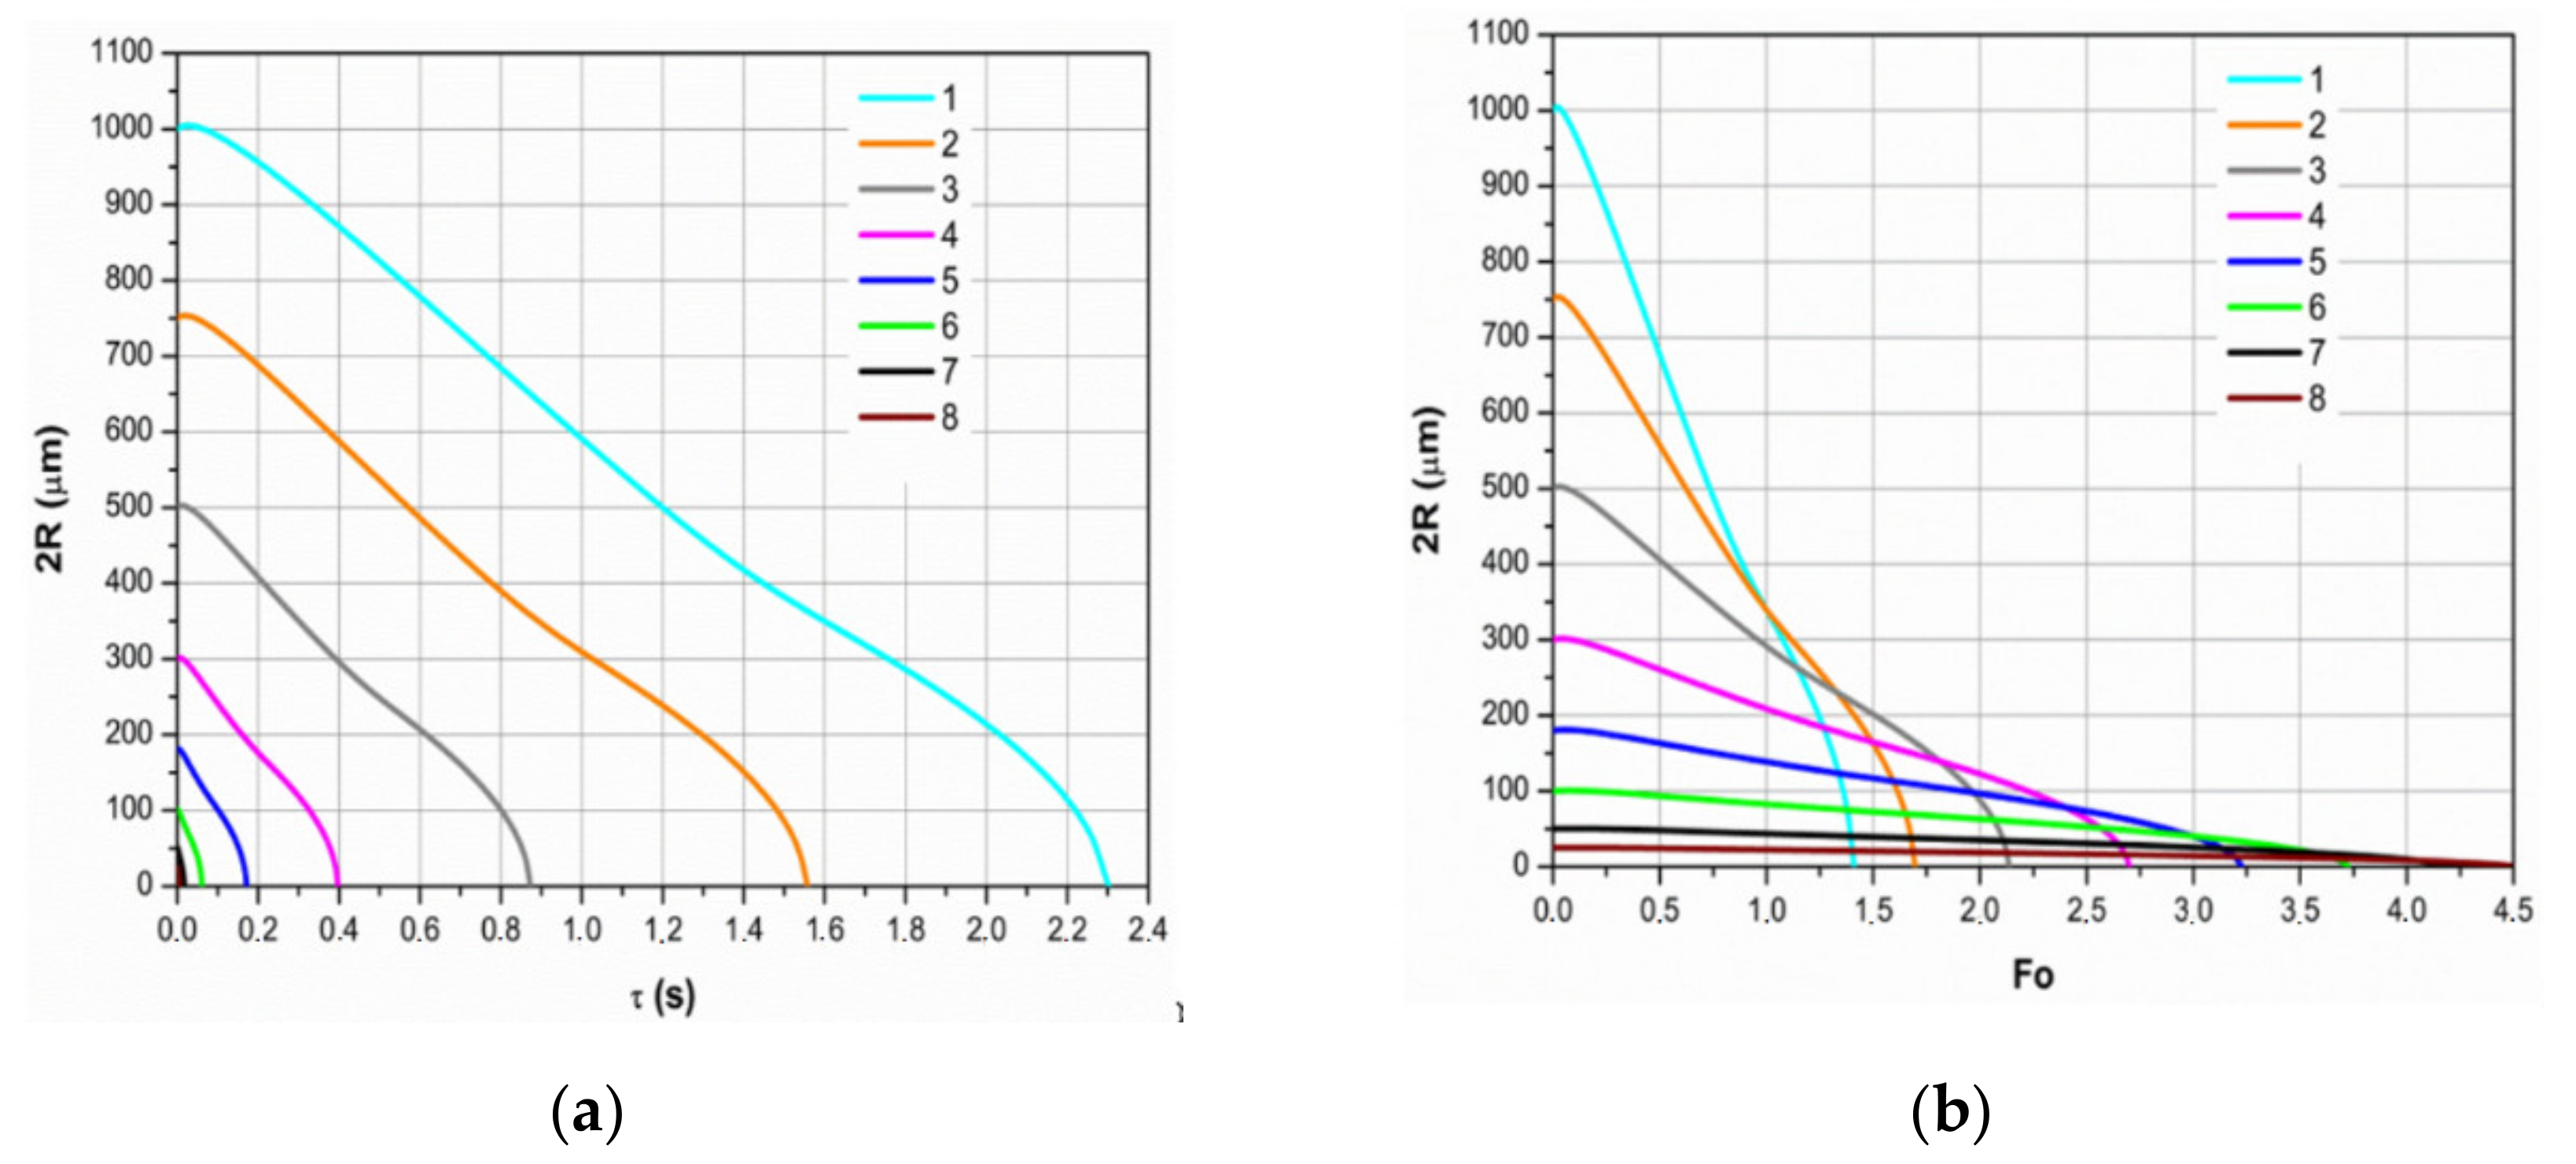
The diagram of the temporal 2
R(
τ) function of the droplet’s diameter, which defines the dynamics of phase changes of the droplet in a cycle (1), is sensitive to the dispersity of sprayed water (
Figure 3a), and therefore the graphic analysis of temporal functions of heat and mass transfer parameters
P(
τ) of the droplet cannot be conveniently applied. The obtained results of the conducted numerical investigation are further analyzed in the time scale of the Fourier number, where the graphic interpretation of 2
R(Fo) functions (
Figure 3b) and of other transfer parameter
P(Fo) functions is far more convenient.
A spontaneous change of the vector of the calculated fluxes ensures the versatility of the model for heat and mass transfer in the droplet (8) which defines the interaction between the processes of combined transfer in a cycle of consistently changing regimes of condensation, transitional evaporation, and equilibrium evaporation. The variation of the vector of the phase change flux, which happens in the transition from the condensation regime to the evaporation regime, is ensured by the calculated value of the vapor flow which changes spontaneously from the negative value in the condensation region to the positive value in the evaporation region. The theoretically possible change in the external convection flow is defined by the difference in temperatures
Tg and
TR: the calculated
qcg would automatically become negative if the
TR >
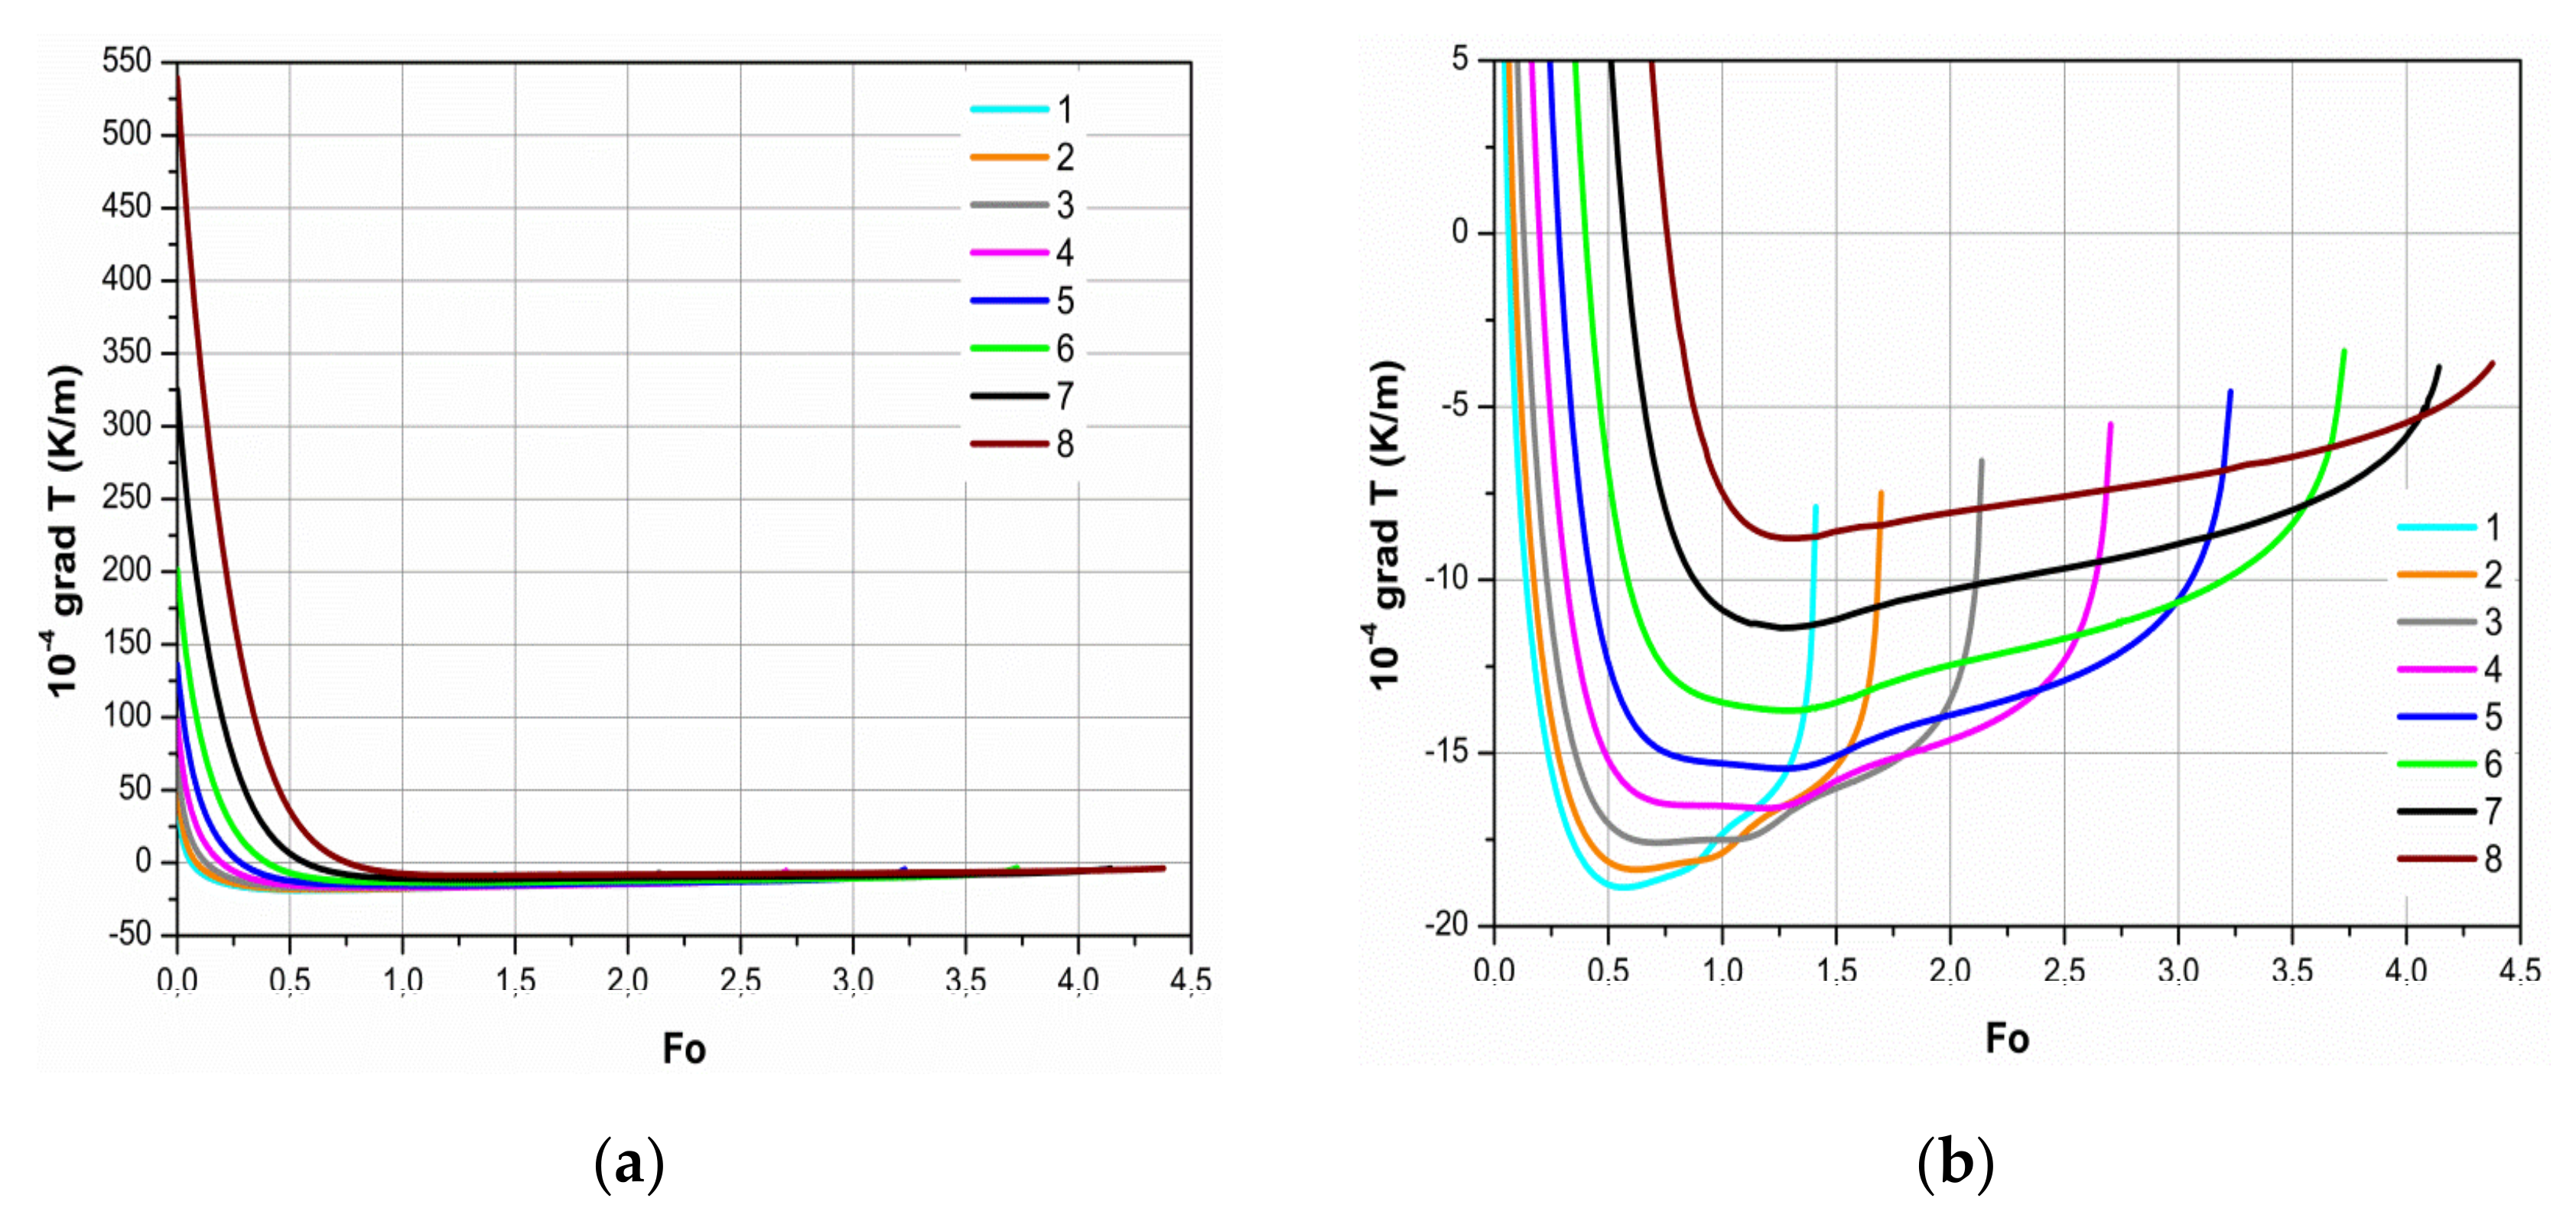
Tg condition became true. The change in the calculated convective flow of internal heat from negative to positive is ensured by the formation of a negative gradient temperature field in the droplet under the influence of thermal radiation absorbed in the droplet (
Figure 4). In the initial stage of phase changes, the surface layers of the droplet heat up very intensively (
Figure 5). Therefore, in the condensation regime, the temperature gradient in the droplet (
Figure 4a) is approximately 100 times higher compared to the equilibrium evaporation regime (
Figure 4b), but decreases rapidly in the transitional regime.
In the case of combined heating, the mechanism of the external cumulative effect of convective and radiative components of heat fluxes on the thermal state and phase change of the droplet is unique. The heat flux of external convection is provided to the surface of the droplet, and therefore it can directly participate in the process of water surface evaporation; however, the water can only be heated up by that part of this flux which flows into the droplet by internal heat convection while the temperature gradient is positive (
Figure 4). Meanwhile, the radiative component of the external cumulative heat flux is absorbed in the droplet and therefore heats the water directly. A part of the absorbed radiation flux can flow out by internal heat convection to the surface of the droplet and participate in the water surface vaporization process only when the temperature field with a negative gradient is formed in the droplet. This is clearly defined by the moment at which the temperature gradient becomes zero (
Figure 4b). The difference between the mechanisms in convective heat transfer and heat transfer by radiation results in a peculiar role of these mechanisms in the interaction between complex transfer processes, which defines the complex dynamics in the droplet’s thermal state variation under the phase change regimes (
Figure 5).
Under the regimes of condensation and transitional evaporation, the droplet experiences intensive heating (
Figure 5, a lines). The Fourier number Fo
e, which describes the duration of the transition regime in phase changes, can be conditionally defined by the droplet’s heat up to the highest temperature
tR,max. This temperature can be considered as the temperature
te that defines the start of the equilibrium evaporation regime in the droplet. In the Fourier time scale, the duration of the transitional regime of phase changes for large droplets becomes shorter (
Figure 5a). Fo
e is 1.022, 0.937, 0.896, 0.872, 0.829, 0.741, 0.648, and 0.528, when the initial diameter of the droplet is 25, 50, 100, 180, 300, 500, 750, and 1000 micrometers, respectively. However, large droplets start evaporating under the equilibrium regime when heated up to a higher temperature. For previously defined large droplets, the temperature
te,max is 83.83, 84.28, 85.15, 86.35, 87.8, 89.63, 91.26, and 92.44 °C, respectively, i.e., in the previously mentioned droplet dispersity range, it increases by almost 9 °C for a droplet of one millimeter in diameter compared to a droplet with 25 micrometers in diameter. The equilibrium evaporation of large water droplets of an order of several millimeters in diameter in the case of combined heating in the air heated to 860 °C and surrounded by a radiating spherical iron wall, was experimentally investigated in [
51]. A droplet was hung on a thermocouple at the bottom of the capillary glass tube in the centre of the chamber and was fed by that tube with heated water until the thermal state of the evaporating droplet stabilized as well as its projection, which was magnified several times on the screen. The equilibrium evaporation rate of the droplet was assumed equal to the measured flow rate of the water fed through the tube. Air was sucked out from the chamber at a rate of 1 cm/s. Thus, the droplet evaporated under combined radiation-convection heating conditions. When the radiating wall was heated up to the maximum temperature of 860 °C, the measured temperature of evaporating bulk droplets of 2–3 mm in diameter was nearly 95 °C. This experimental temperature in
Figure 5a was given assuming that the droplet heated up to this temperature under the transitional phase change regime during the defined time Fo
e = 0.4, but its state could vary depending on the actual heating duration till the equilibrium regime and this duration is defined by a number of factors. During the experiments of the previously discussed work [
49], it actually took several hours to reach the equilibrium evaporation regime. Meanwhile in our work, the curves of the calculated
tR(Fo) functions (
Figure 5a) of water droplets with diameters smaller than 1500 micrometers go below the discussed experimentally defined temperature of equilibrium evaporation. Thus, the equilibrium evaporation temperature of water droplets sprayed into the 1000 °C flue gas flow in a biofuel furnace is lower than the equilibrium evaporation temperature of bulk droplets in the 860 °C radiation flux. This only confirms the importance of the droplet dispersity factor for the interaction between complex transfer processes in radiation fluxes. In turn,
tR(Fo) evaporation function (
Figure 5a, curve 11) of the bulk water droplet with the diameter of 3000 micrometers in the 860 °C radiation flux corresponds well to the experimental equilibrium evaporation temperature
te of work [
51] (
Figure 5a, dotted line 12) at the end of the transitional evaporation regime. This confirms the reliability of the numerical modeling methodology and the results presented in our work.
The complex dynamics in the droplet’s thermal state variation under the phase change regimes is clearly illustrated by the change of non-isothermality in the droplet defined by the difference between the temperatures of the droplet’s surface and the centre (
Figure 5b). When the surface layers of the droplet heat up rapidly in the condensation regime and the heat up slows down under the transitional evaporation regime, the droplet forms a first and very clear peak of non-isothermality (
Figure 5b). It depends on the size of the droplet and earlier defined dispersity to droplets are 7.97, 8.7, 9.61, 10.49, 11.39, 12.38, 13.26, and 13.91 °C, respectively. In the transitional evaporation regime, the droplet’s thermal state variation is defined by factors of water circulation and radiation absorption in the droplet, which make different influences. The absorption of radiation allows a more intensive heating of the central layers of the droplet, and water circulation allows the heating of the layers to be more uniform. Non-isothermality in the droplet in the transitional evaporation regime under the influence of these changing factors changes clearly in a non-linear form, which is also illustrated by actually three extremum points observed in graphs
TR(Fo)-
TC(Fo) of larger droplets (
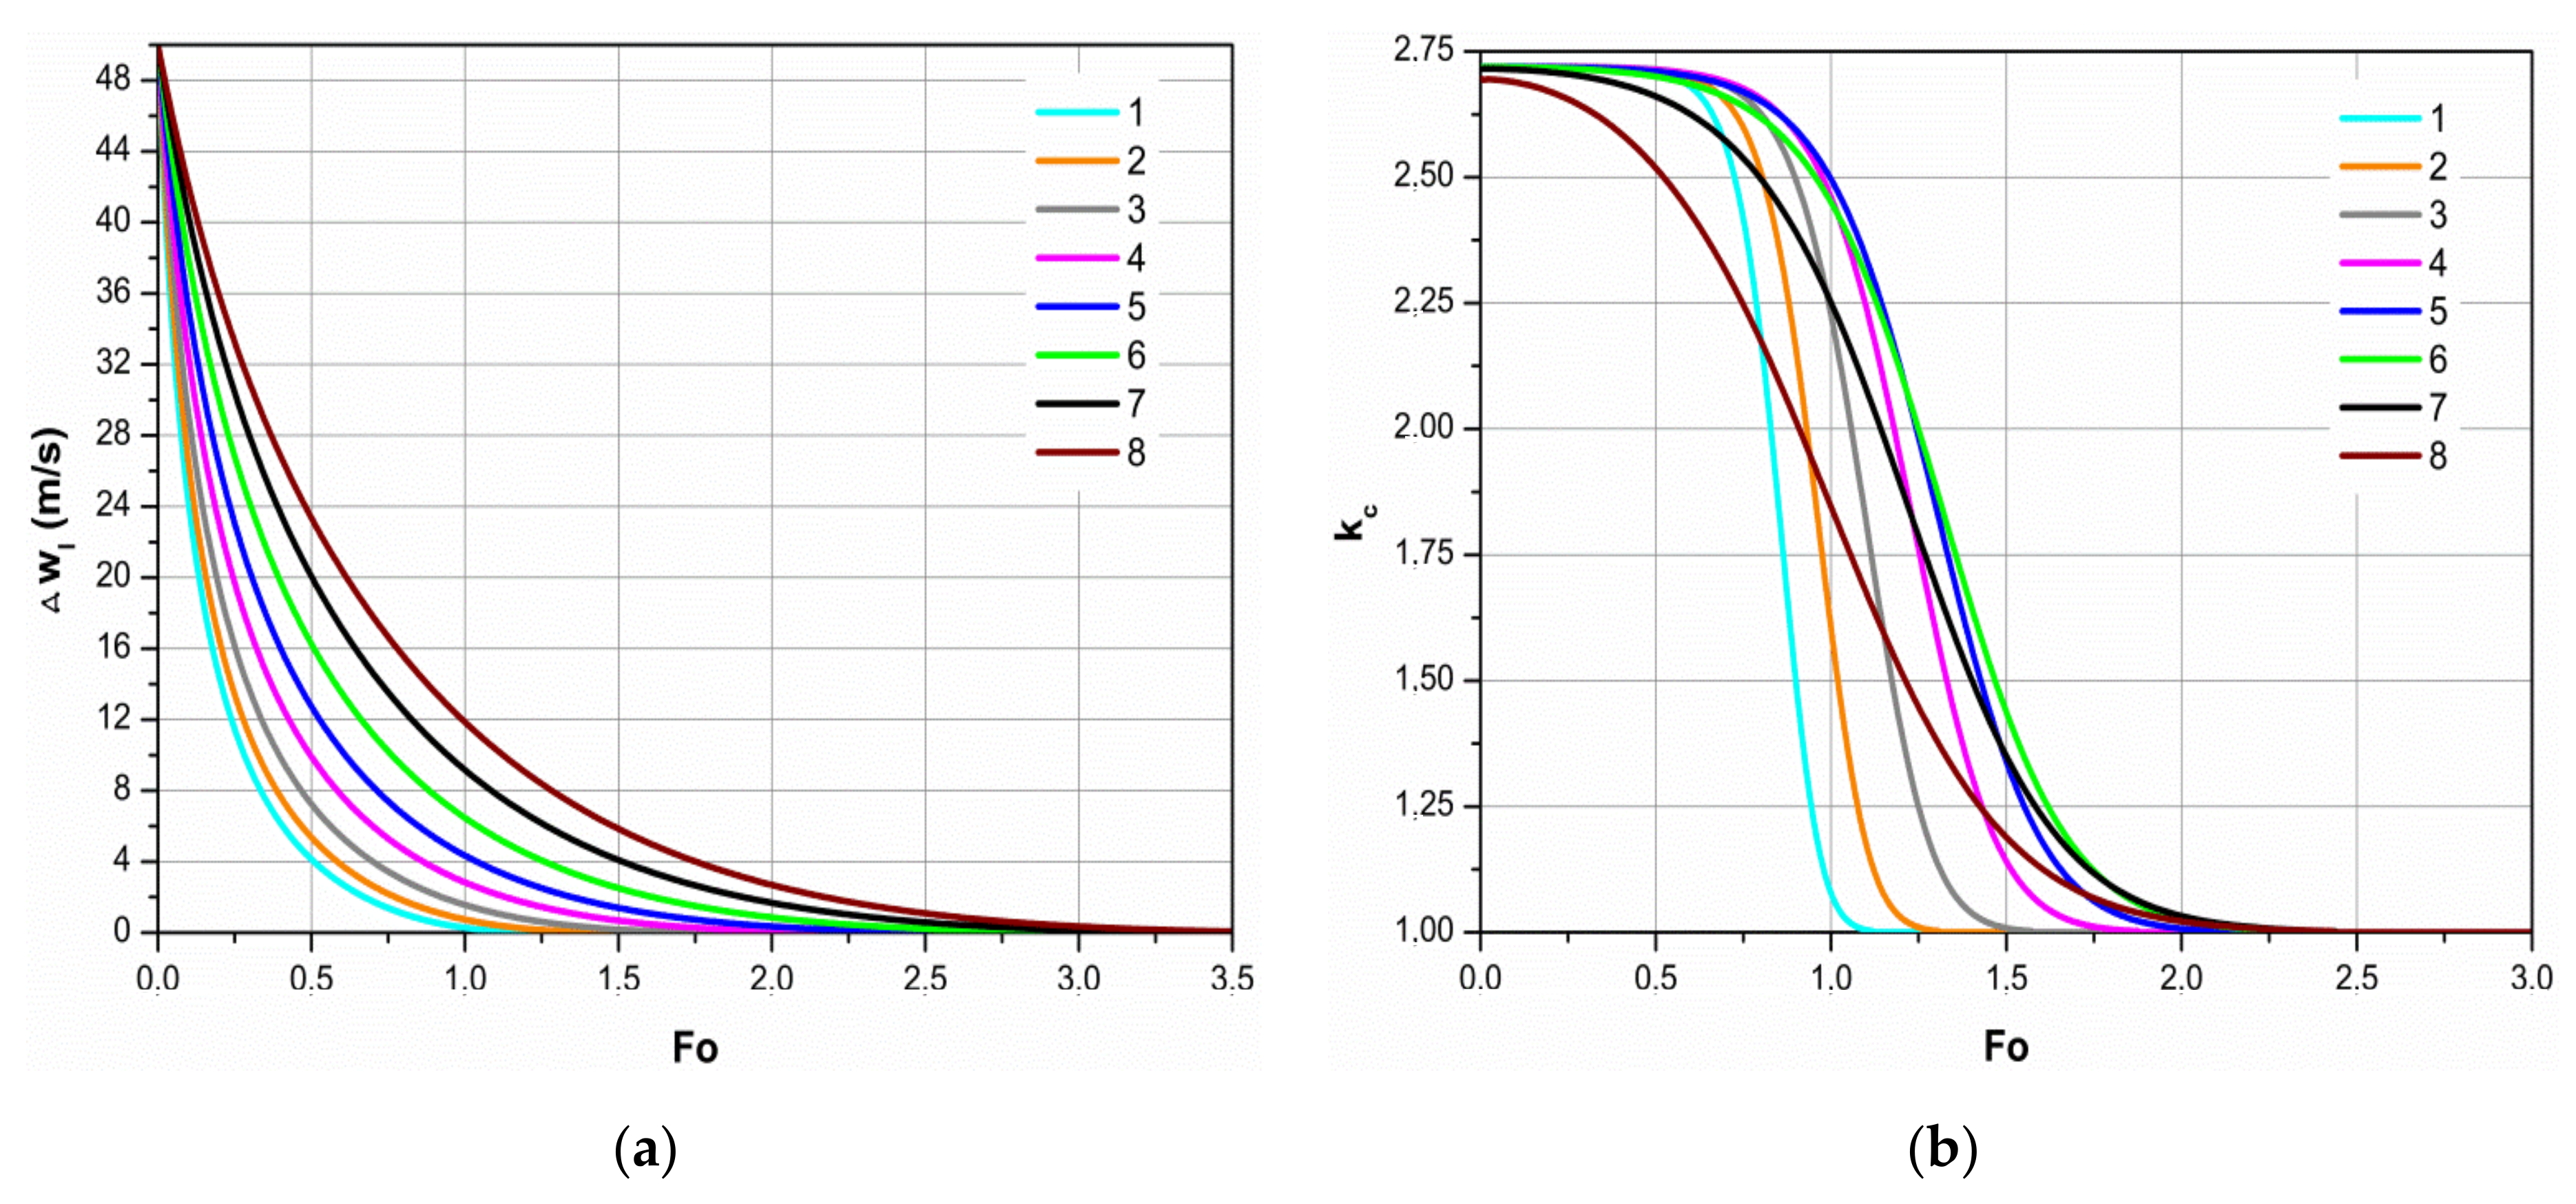
Figure 5b). The resistance forces rapidly inhibit the droplet from slipping in the flue gas flow (
Figure 6a), thus rapidly reducing the intensity of convective heat transfer in the droplet (
Figure 6b). Therefore, the peak of non-isothermality formed in the droplet at the end of the transitional evaporation regime (
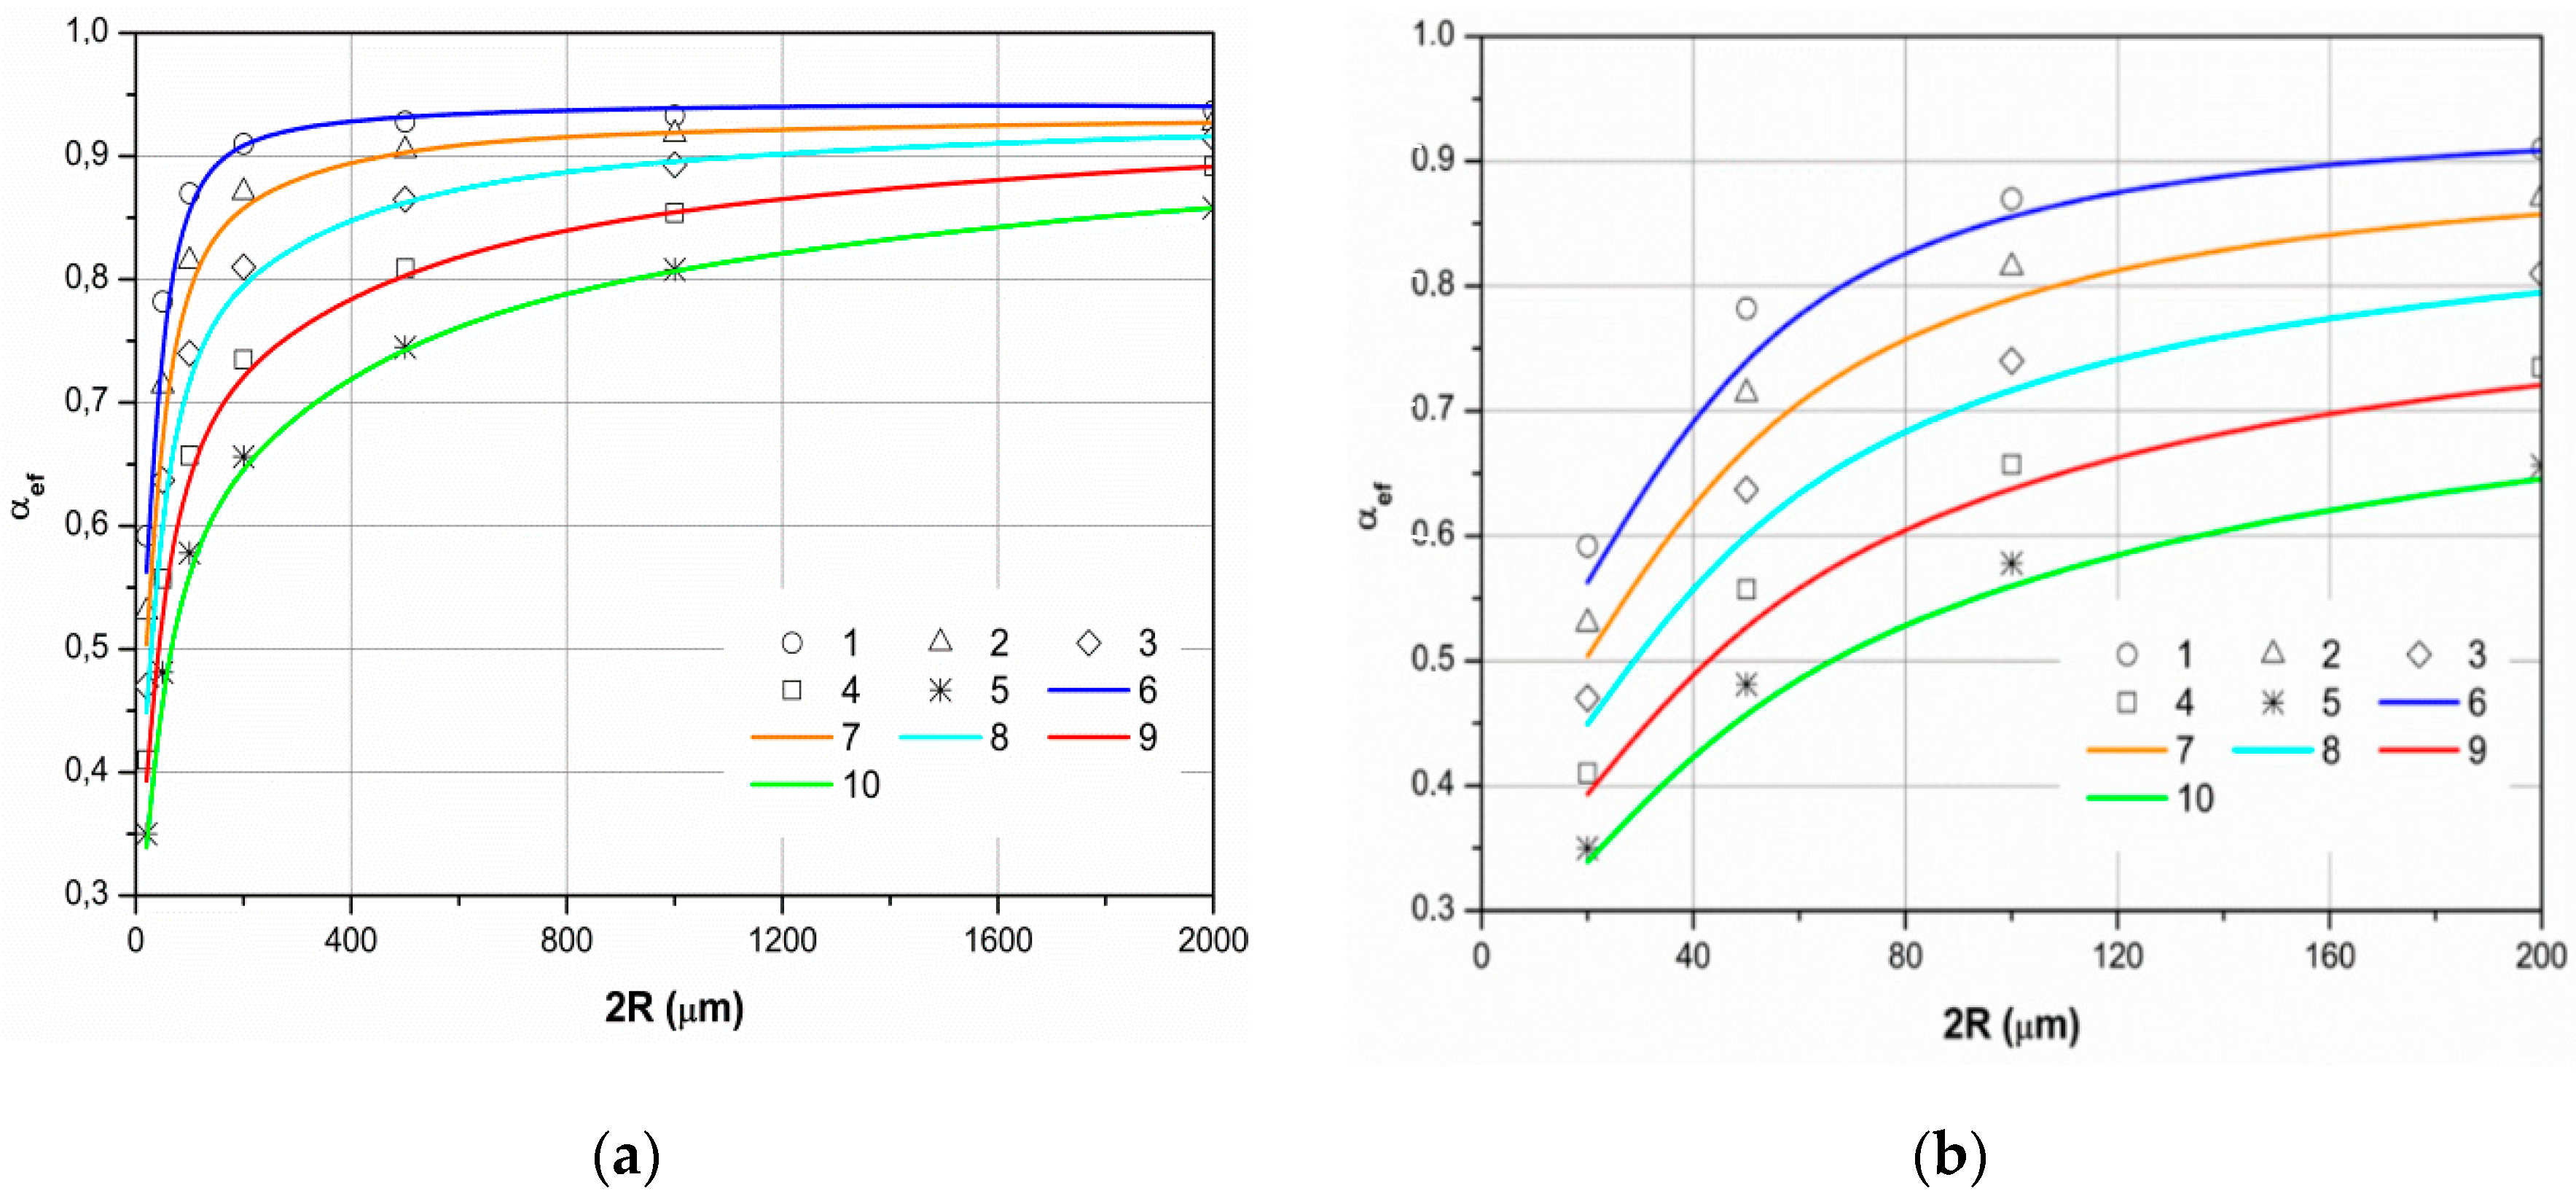
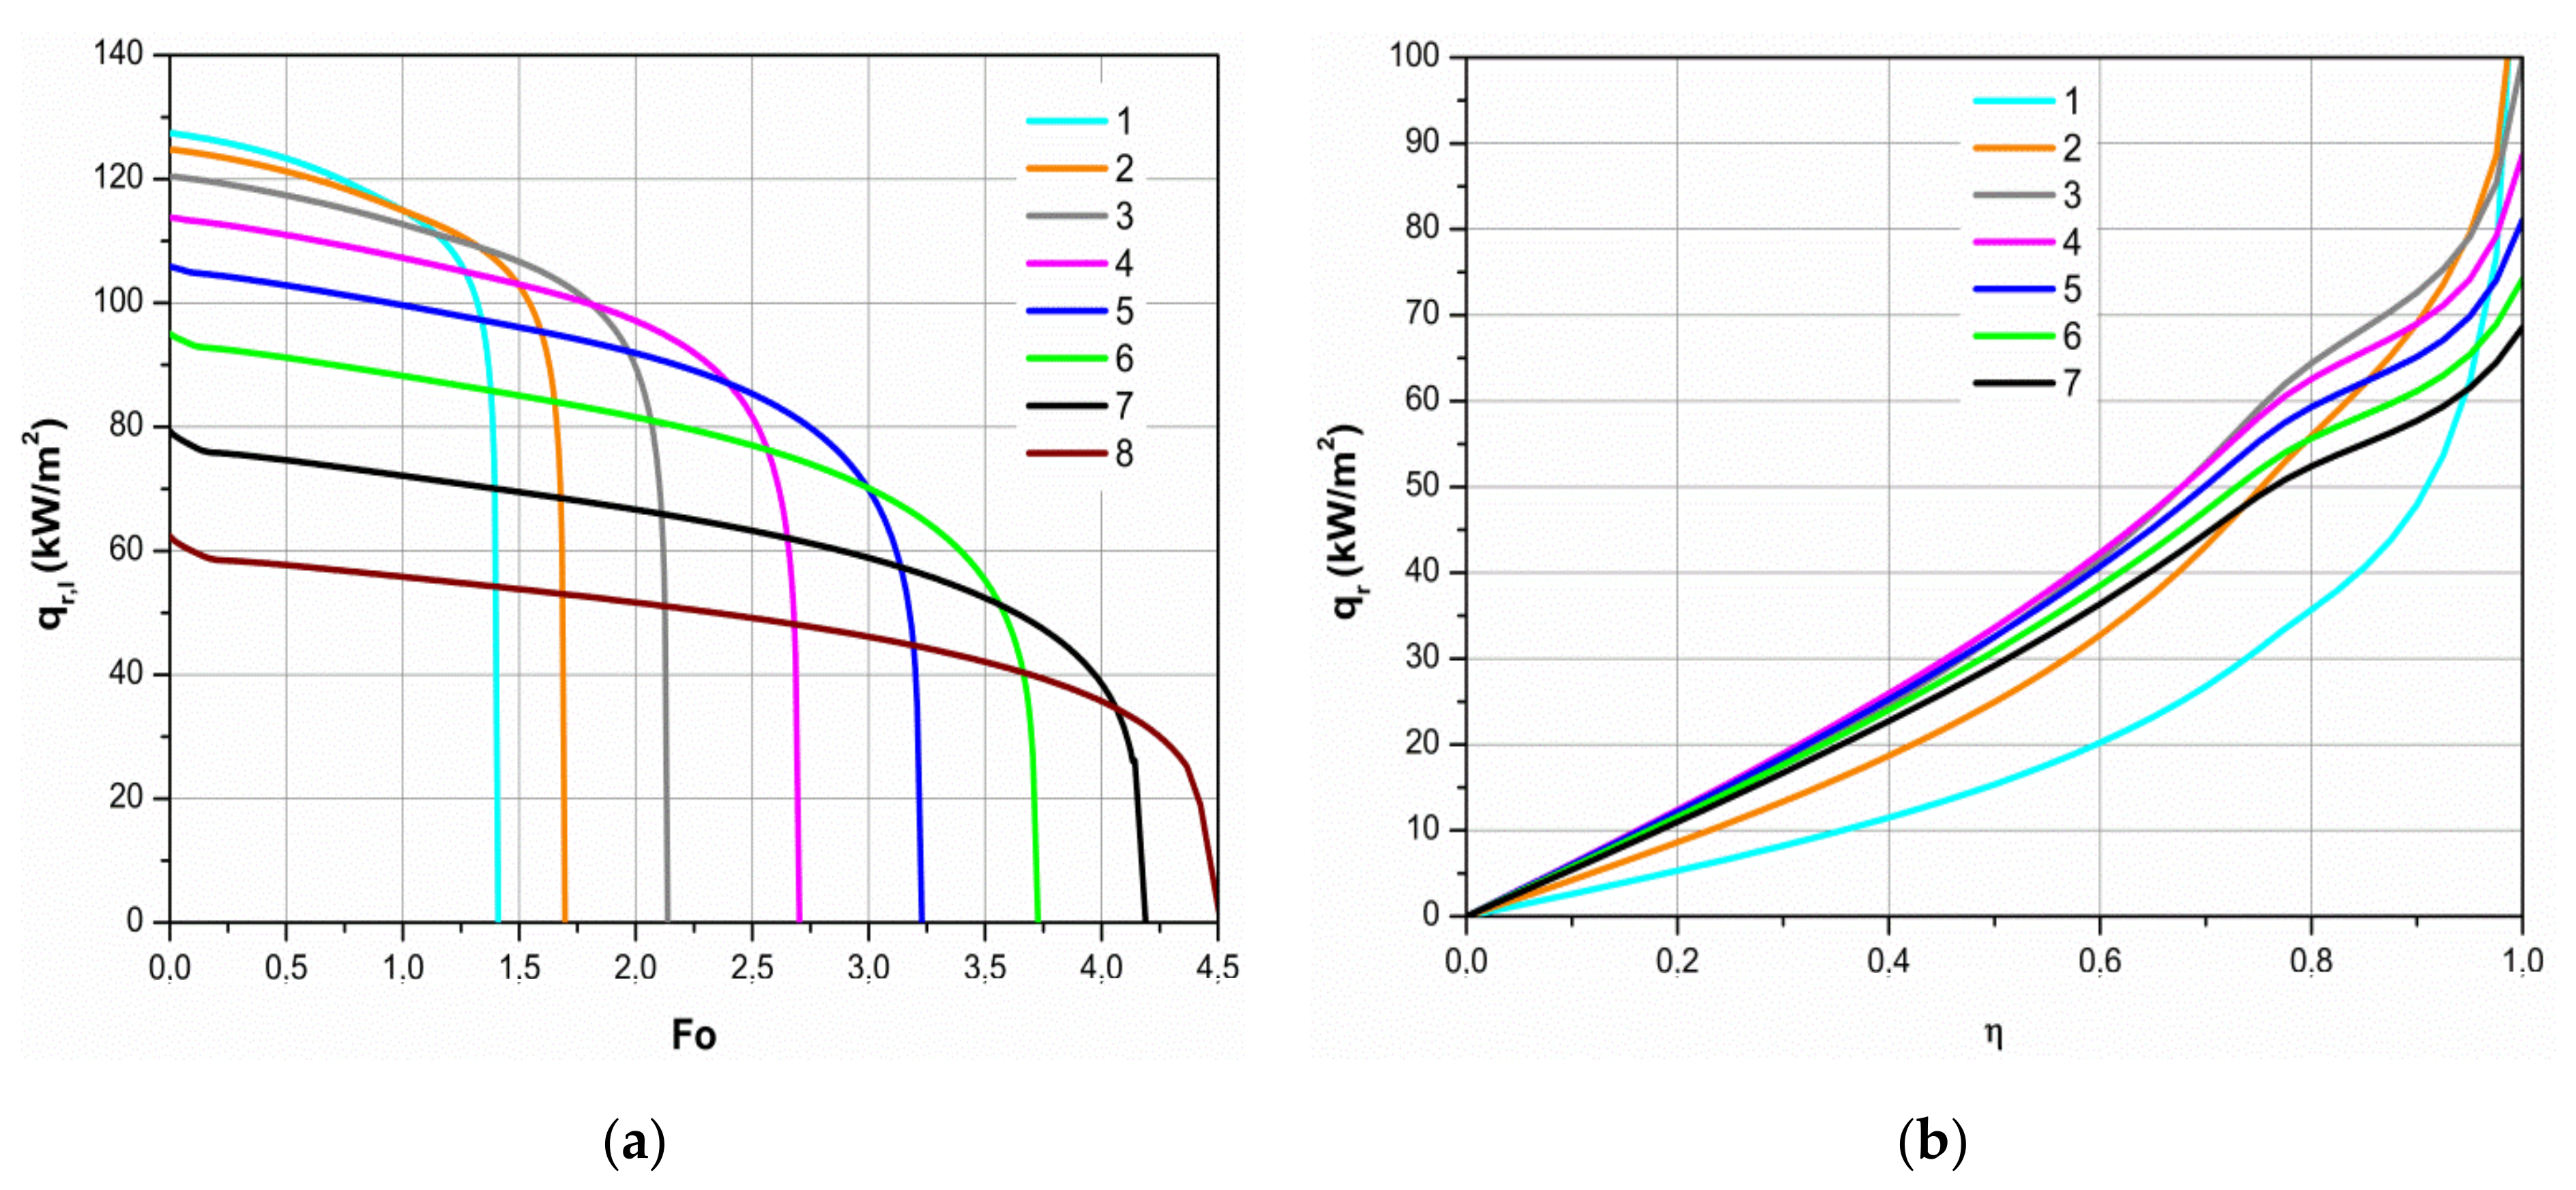
Figure 5b) is defined by the radiation absorption factor in semi-transparent water. The absorbed radiation flux depends on the water droplet size (
Figure 7a). Droplet dispersity defines the distribution of local radiation flux in it (
Figure 7b). In moderately dispersed and large droplets, the radiation is intensively absorbed in the surface layers of droplets, while in the smaller droplets, the absorption is also significant in the central layers. This is very important for the droplet heating process. The local radiation flux is defined by a spectral model based on the geometric optics [
36], the results of which in terms of the effective absorption coefficient is in good correlation with the results obtained during calculations based on Mi theory [
35] (
Figure 8). The temperature gradient that ensures the takeoff of the absorbed radiation flux by internal heat convection to the droplet’s surface, which is necessary for equilibrium evaporation, also depends on the dispersity of the droplet (
Figure 4b). Therefore, at the end of the transitional evaporation regime, the difference between
TR and
TC temperatures depends on the droplet’s size and the previously defined dispersity for droplets
and is 0.38, 0.86, 1.75, 2.98, 4.37, 5.96, 7.28, and 8.24 °C, respectively.
Interestingly, under the equilibrium evaporation regime, droplets cool down and evaporate once they reach a state that is practically very close to the isothermal state (
Figure 5b), which can be defined by
te,min ≈ 83.5 °C temperature in the modeled cases (
Figure 5a). Thus, the droplet’s thermal state variation is defined by the variation in the droplet’s internal heat exchange regimes during phase changes of the droplet. Several important aspects allow these conditions. The essential aspects are the sudden attenuation of the internal convective heat transfer flux in the initial stage of the droplet phase changes (
Figure 7b) and the change of its energy nature and the clear attenuation of the radiation flux in the droplet in the final evaporation stage (
Figure 7a). As already mentioned, the attenuation of convective heat transfer in the droplet is defined by the dynamics of the effective thermal conductivity parameter estimating the intensity of water circulation (
Figure 6b). The dynamics is influenced by the rapid deceleration of the droplet slip in the gas flow because of resistance forces (
Figure 6a). Initially, the circulation of the water in the droplet is very intense, and thus the parameter of effective thermal conductivity
kc is close to the maximum theoretical value of 2.73 [
34]. In the transitional evaporation regime, the parameter
kc decreases rapidly and reaches value 1 (
Figure 6a). Thus, the combined heat transfer by radiation and convection in the droplet consistently changes to the case of combined heat transfer by radiation and conduction. The droplet decreases rapidly during equilibrium evaporation (
Figure 3) and the contribution of radiation to the energy balance of the droplet combined heat transfer decreases (
Figure 7a). Therefore, in the final stage of droplet evaporation, the heat transfer regime in the droplet rapidly approaches the case typical to conductive heating. In the final equilibrium evaporation stage, in all modeled cases, the droplets cooled down to
te,min ≈ 83.5 °C, which is conditioned only by the gas flow temperature and humidity for the case of droplets heated by conductivity [
32].
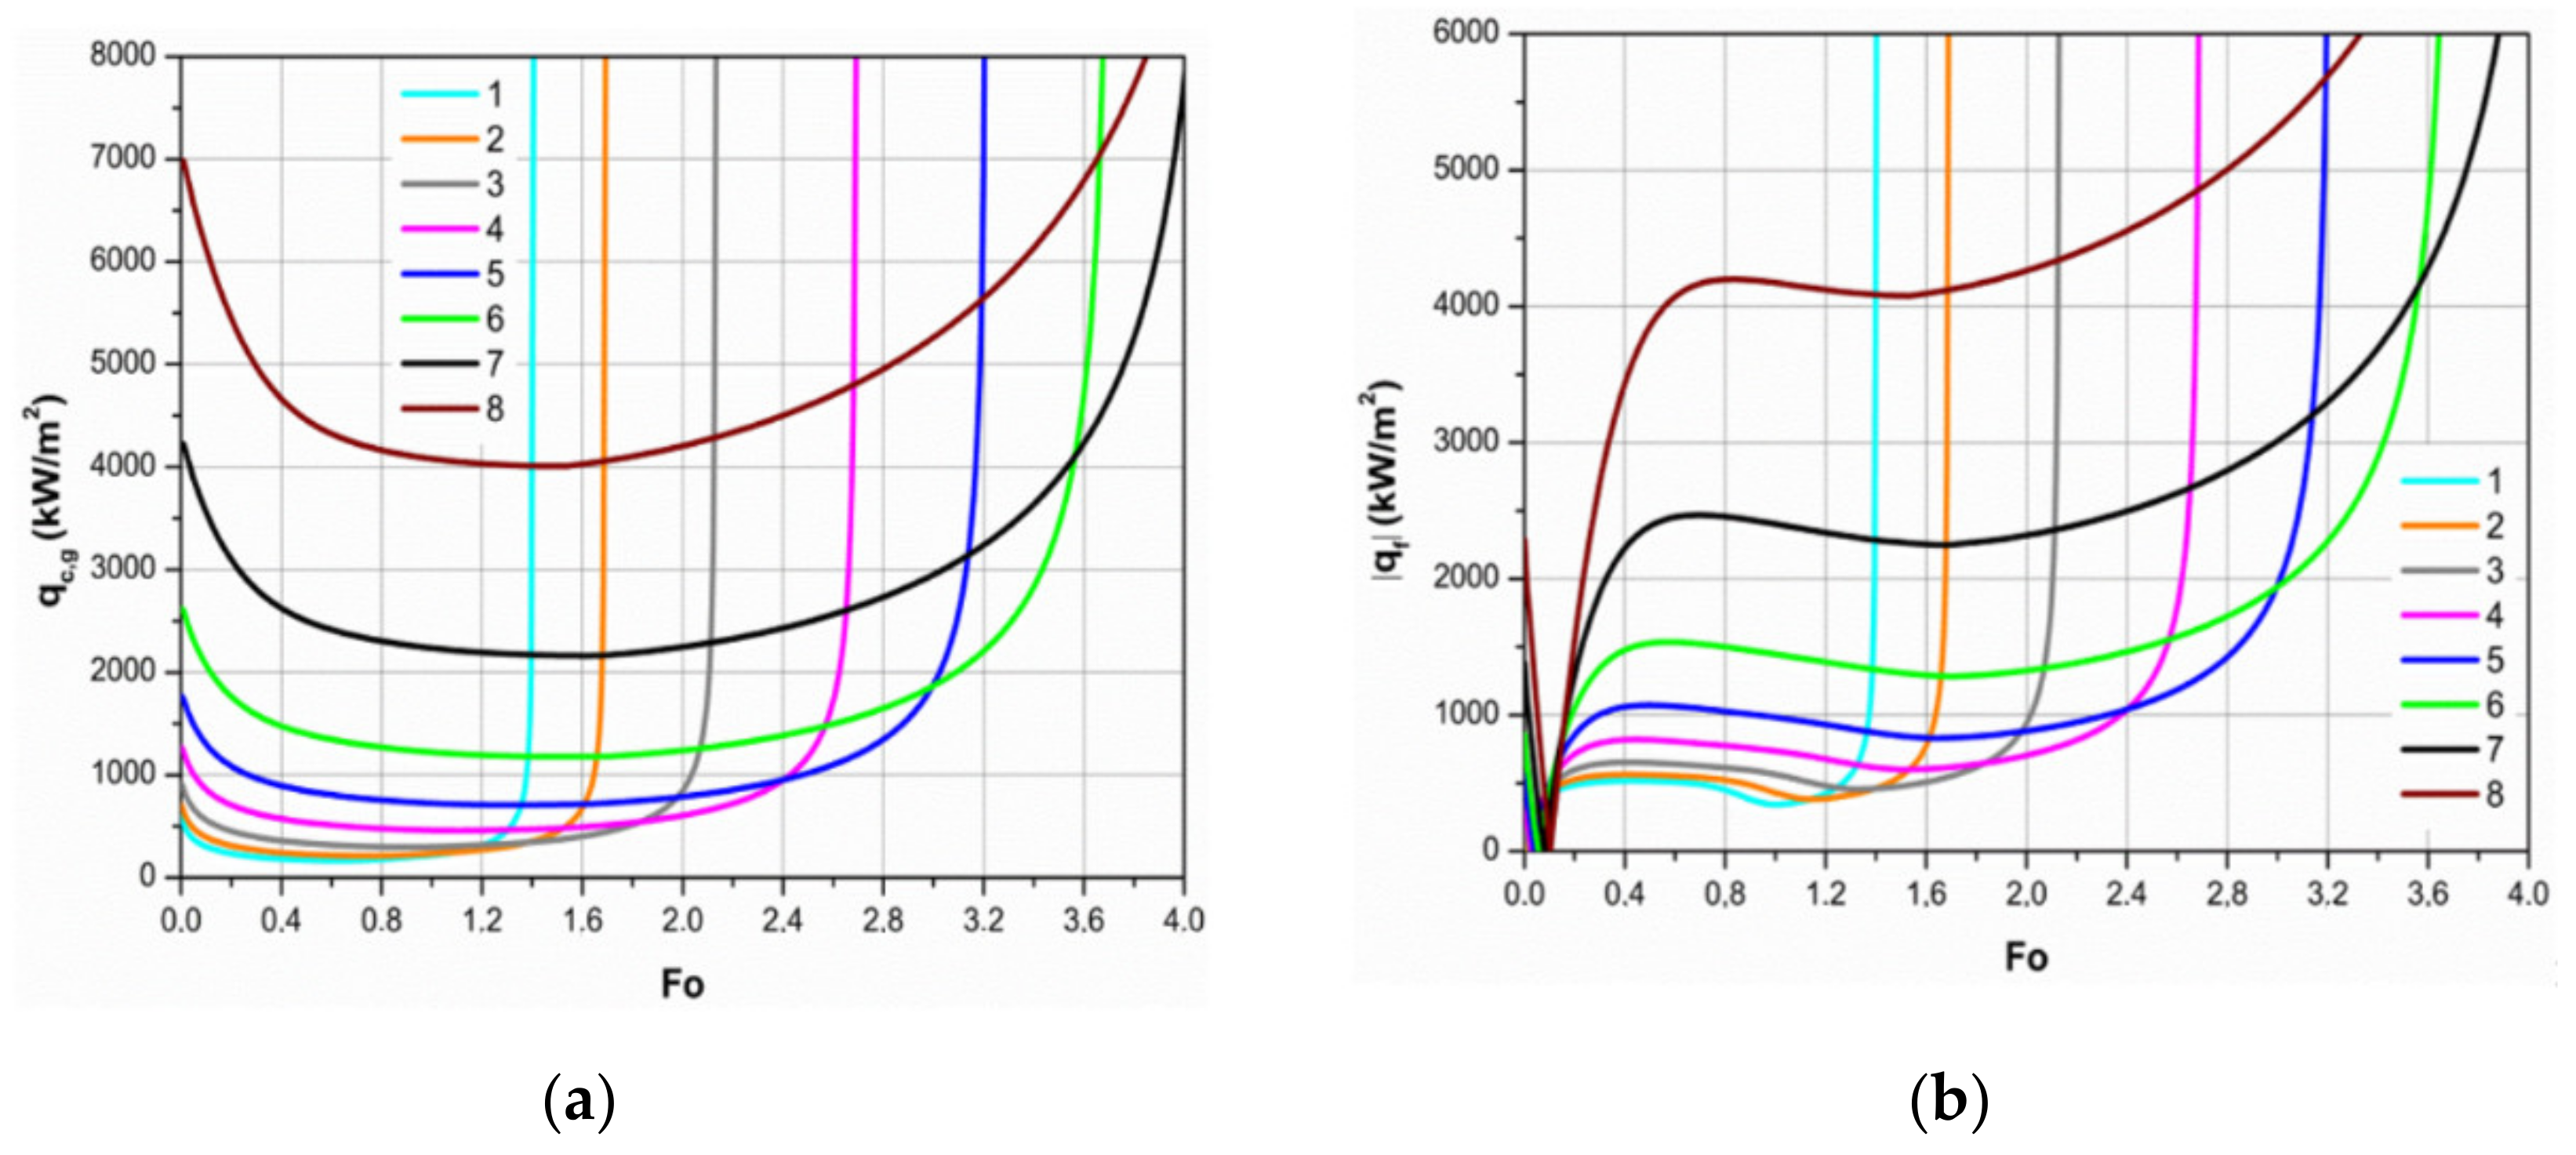
Processes of the droplet’s internal and external heat transfer are closely related, but their interaction is unique. For internal heat transfer, the key factors defining the interaction between the processes are the already mentioned water circulation and radiation absorption in the semi-transparent droplet, while for the interaction between external heat and mass transfer processes, the key factor is the Stefan flow. Droplet dispersity is also an important factor in the interaction between internal as well as external transfer processes of the droplet. Not only the droplet dispersity defines the process of thermal radiation absorption but also influences the intensity of the convection flow of external heat and mass transfer (
Figure 9a) and phase change heat flux (
Figure 9b) in the droplet.
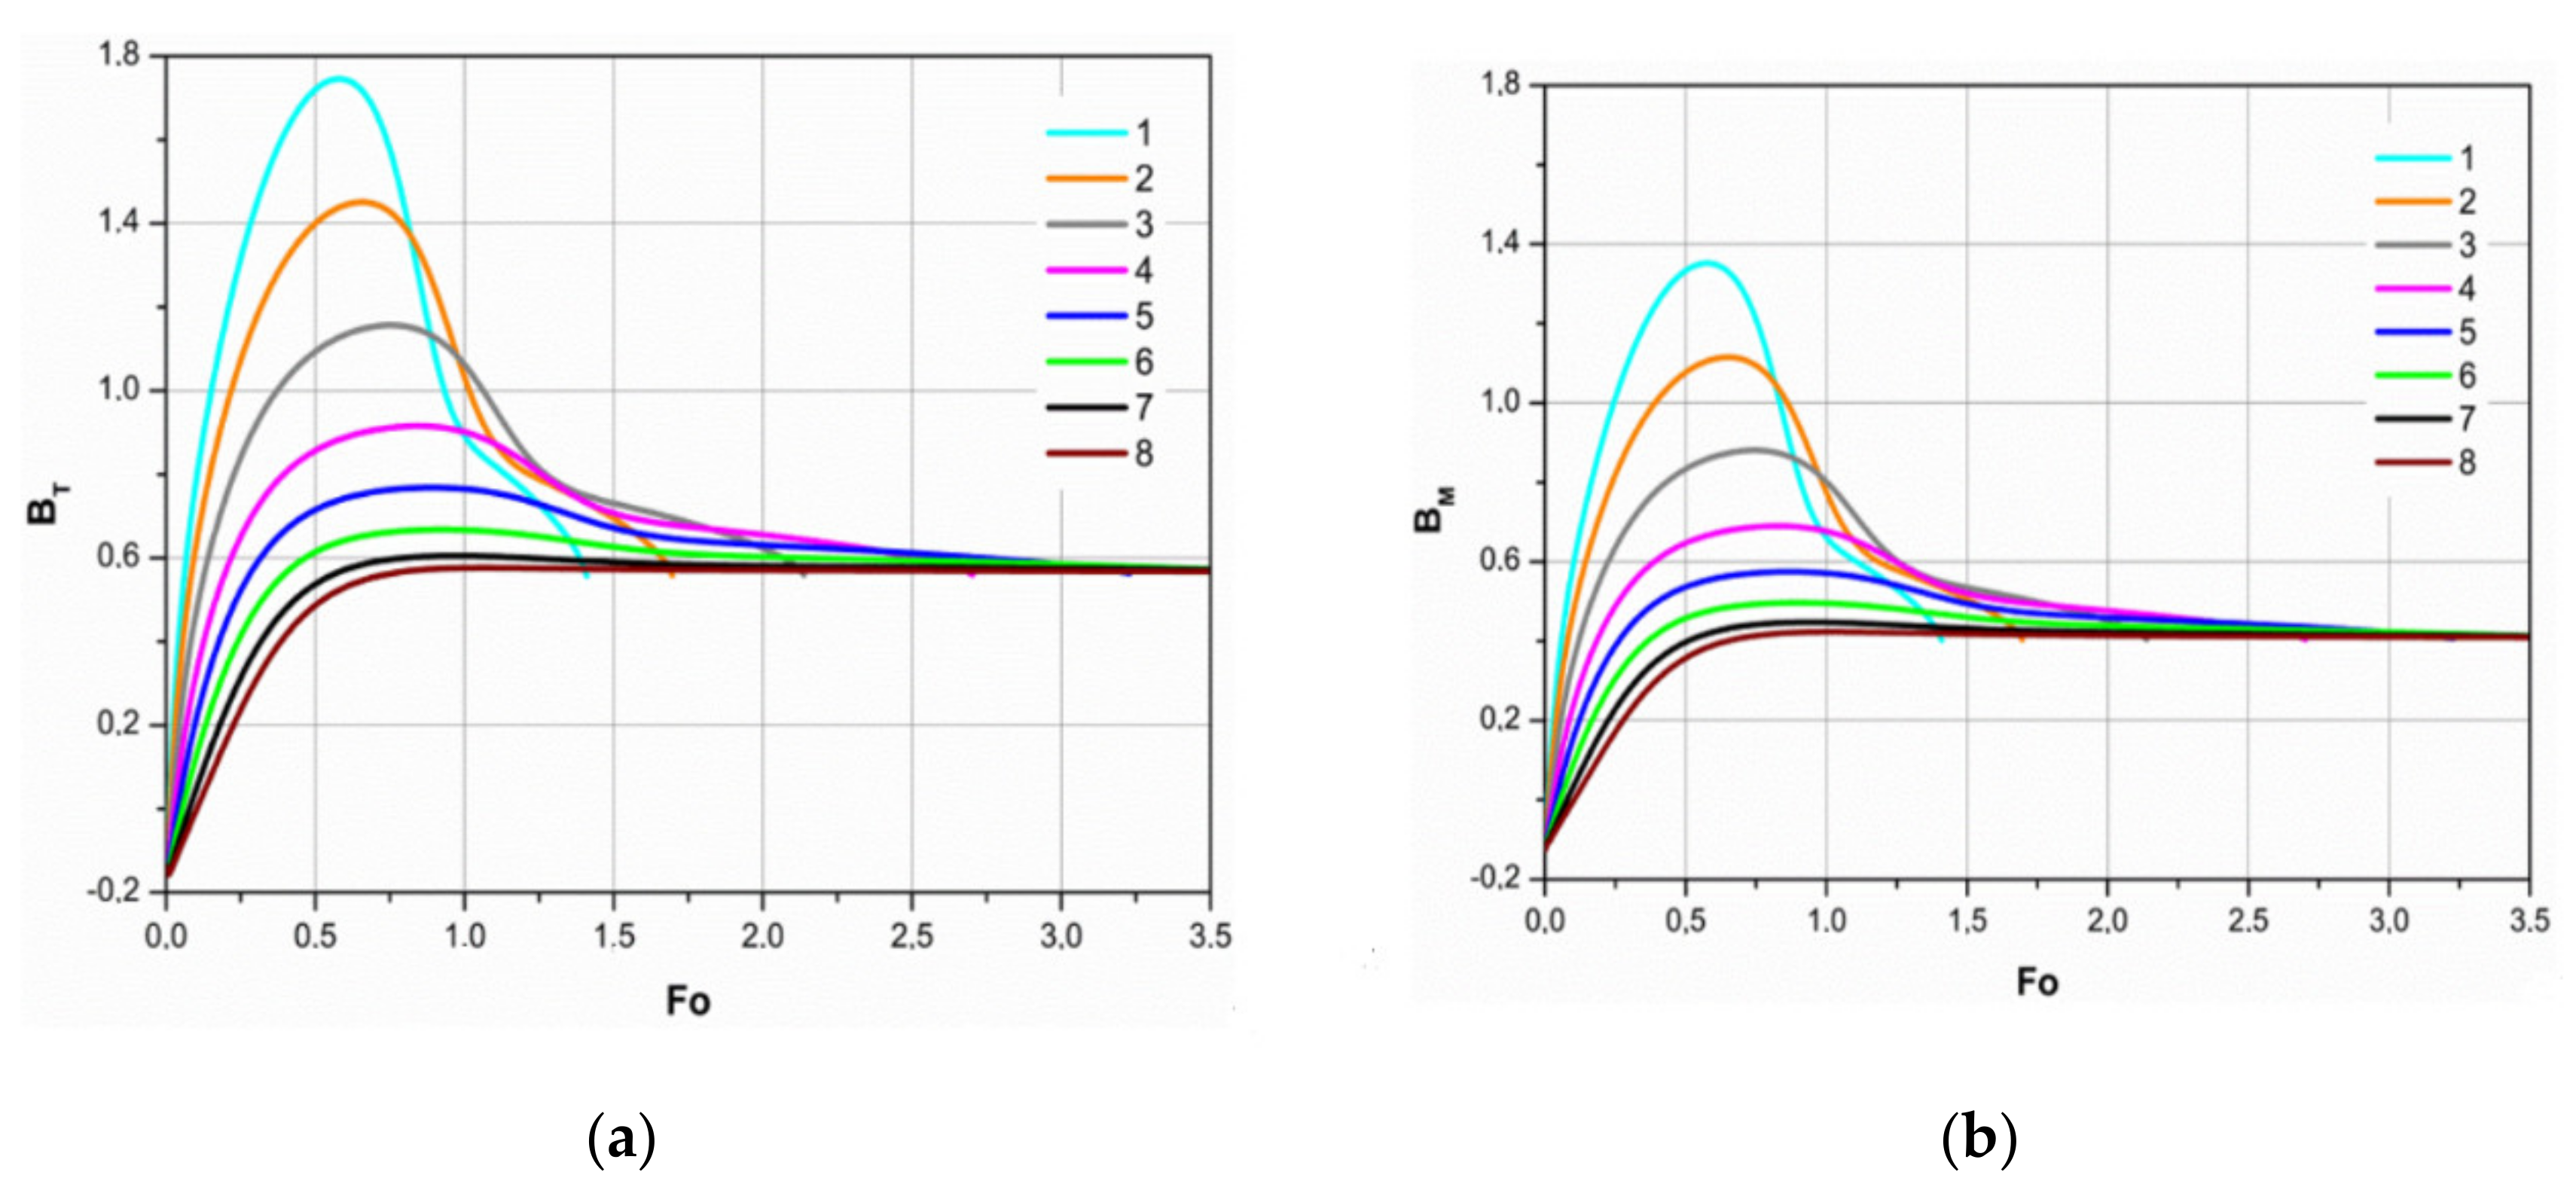
The influence of the Stefan flow on external convective heating is defined by the dynamics of the Spalding transfer B
T number (
Figure 10a), and its influence on the droplet’s phase change is defined by the dynamics of the Spalding mass transfer B
M number (
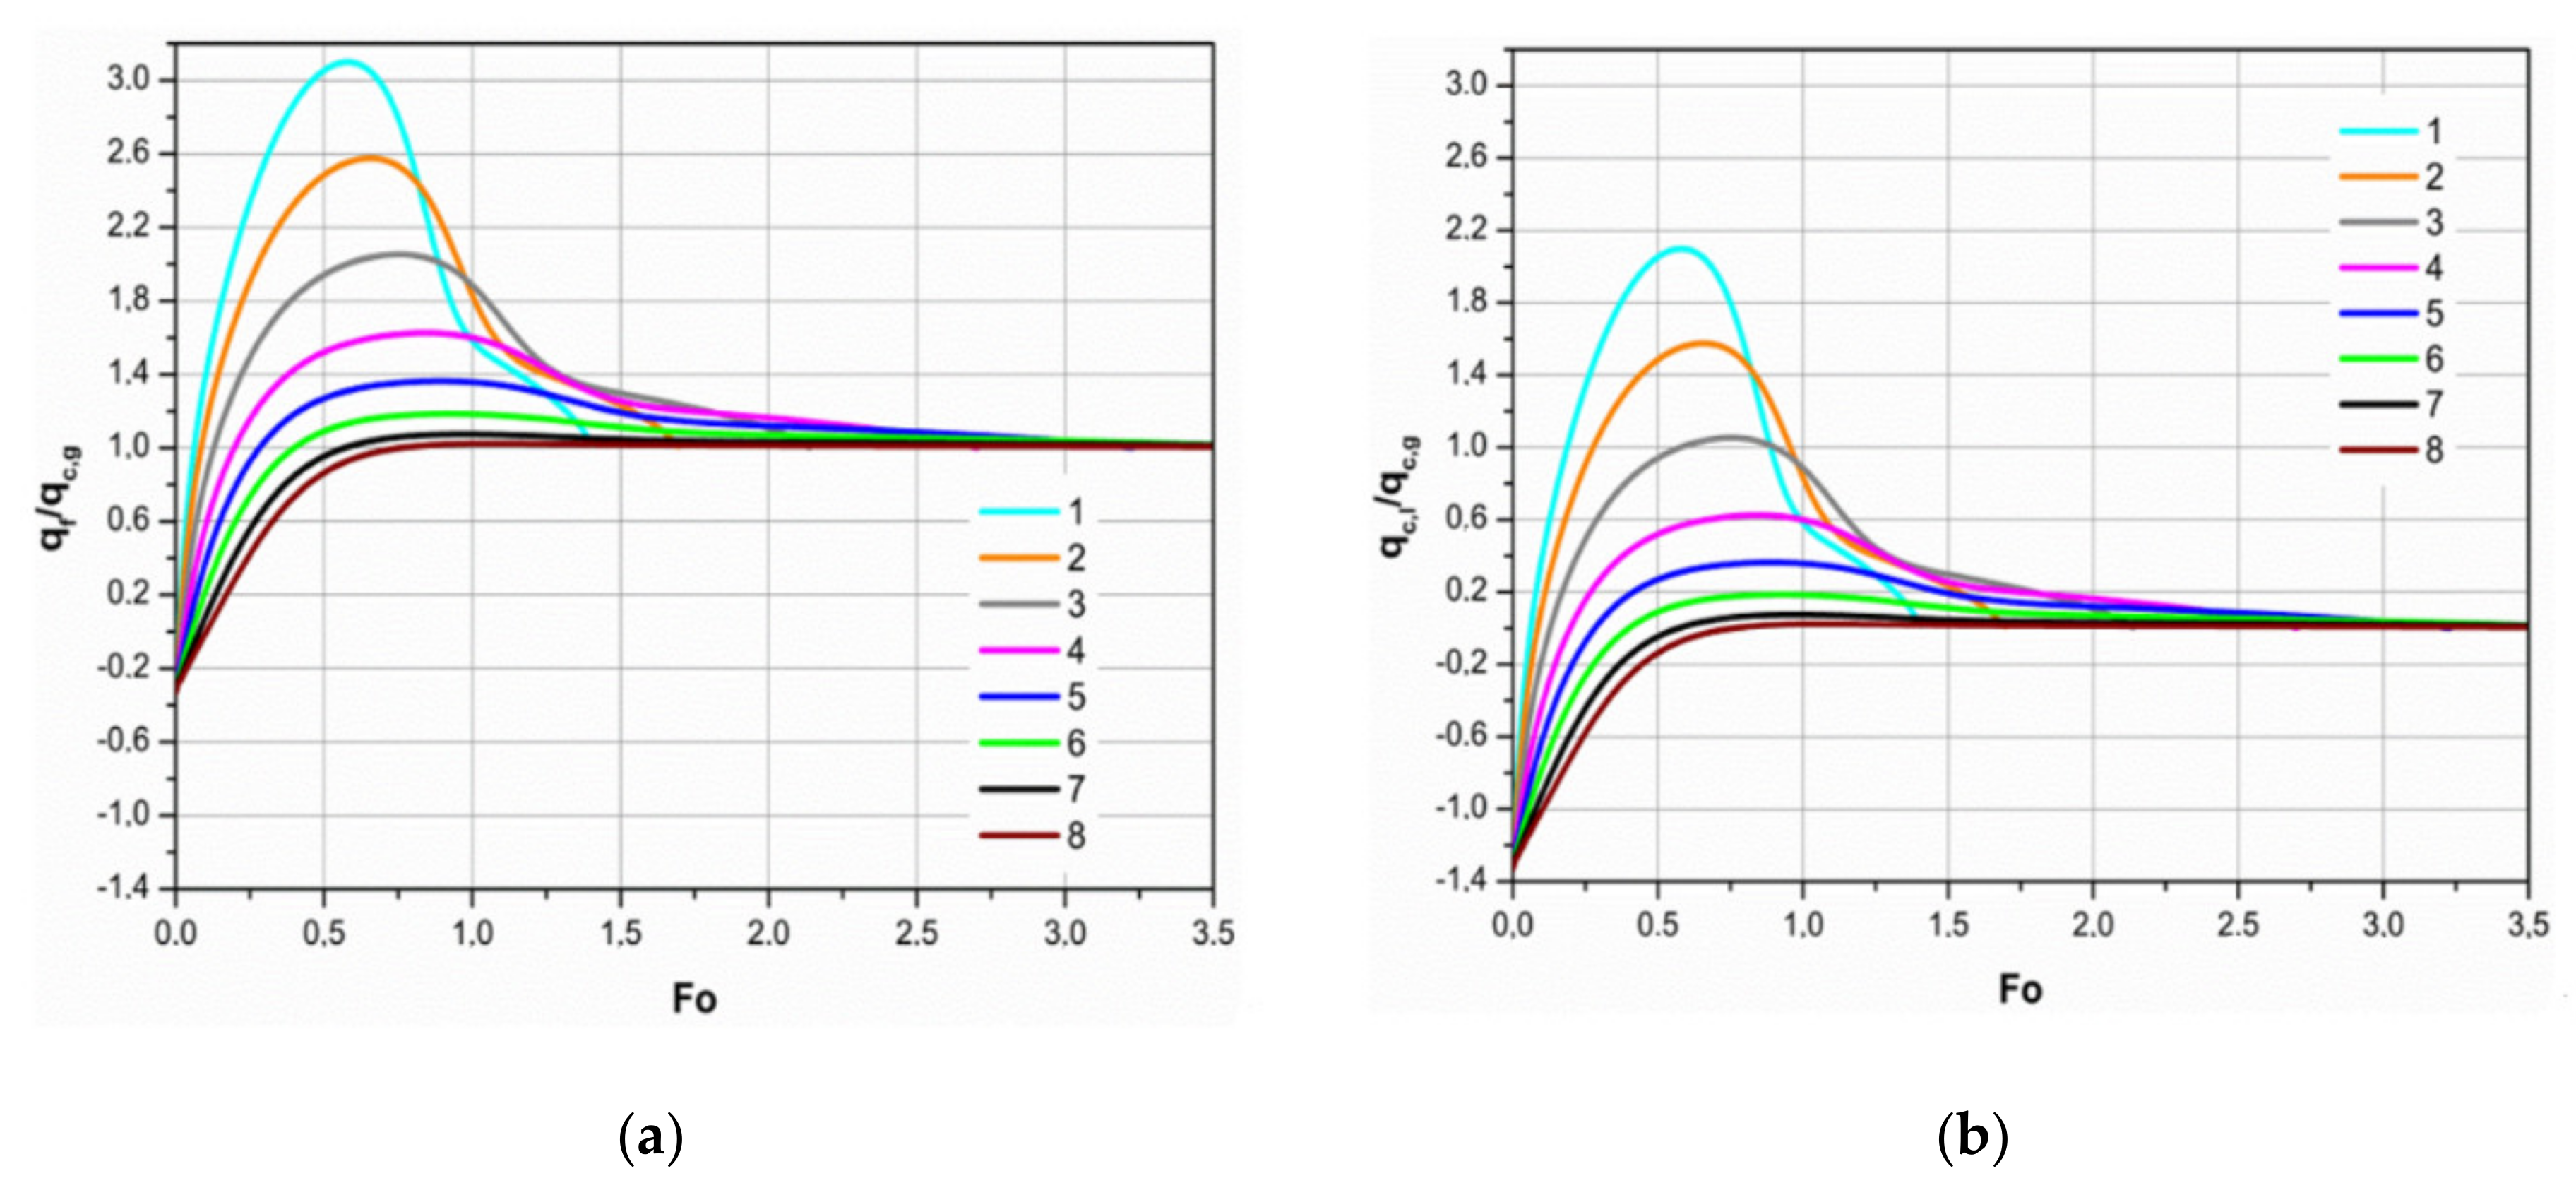
Figure 10b). The relation between heat fluxes
qf/
qc,g, which distinguishes for its unique variation in phase change regimes of the droplet, is important to the Spalding transfer B
T number (
Figure 11a).
The variation in the heat flux
qf of the droplet’s phase changes is defined by the dynamics of the relation between internal and external convection flows
qc,l/
qc,g (
Figure 11b), which describes the change in distribution of the droplet’s external convection heat flux (
Figure 8a) to the heat fluxes heating and evaporating water. In the condensation regime, both heat fluxes
qf and
qc,g are diverted to the droplet’s external surface by internal heat convection, and hence
when Fo < Fo
co. The condensation regime ends and the droplet evaporation regime begins in the time moment, when
qf/
qc,g = 0, and hence
qc,l/
qc,g = −1 (
Figure 11). In the moment when
qc,l/
qc,g = 0, a temperature field with the negative gradient forms in the droplet. Until then,
qc,l flux corresponded by the source of its energy to a part of the
qc,g flux that heated the water. Later on in the transitional evaporation regime, by the source of its energy, the
qc,l flux corresponds to a part of the
qr flux that takes part in the water evaporation process. Under the equilibrium evaporation regime, the relation between
qc,l/
qc,g is also influenced by the change in the enthalpy of the cooling droplet; the input of the change can be defined based on the temporal gradient of the average temperature of the droplet’s mass:
Thus, based on the methodology of this research, the calculated Spalding transfer B
T and B
M numbers, defining the interaction between transfer processes, can have positive as well as the negative values (
Figure 10). Under the evaporation regime, the calculated B
T and B
Mnumbers have positive values. The functions that are based on these values and that have already become classic are widely applied in the evaluation of the influence of the Stefan flow on heat and mass transfer processes within fuel droplets in equilibrium evaporation, when the heat served to the droplet results only in evaporation of the droplet. In the transitional evaporation regime, a part of the heat obtained by the droplet heats the liquid in the droplet. Therefore, the influence of the Stefan flow in the transitional evaporation regime is weaker compared to the equilibrium evaporation regime. It is demonstrated by decreased values of calculated B
T and B
Mnumbers, but these numbers still remain positive [
8,
34,
45], which is also considered in our research. Another important aspect of the research is that the Spalding B
T and B
M numbers are adapted also to the droplet’s condensation regime. Thus, the calculated B
T and B
M numbers gain negative values (
Figure 10).
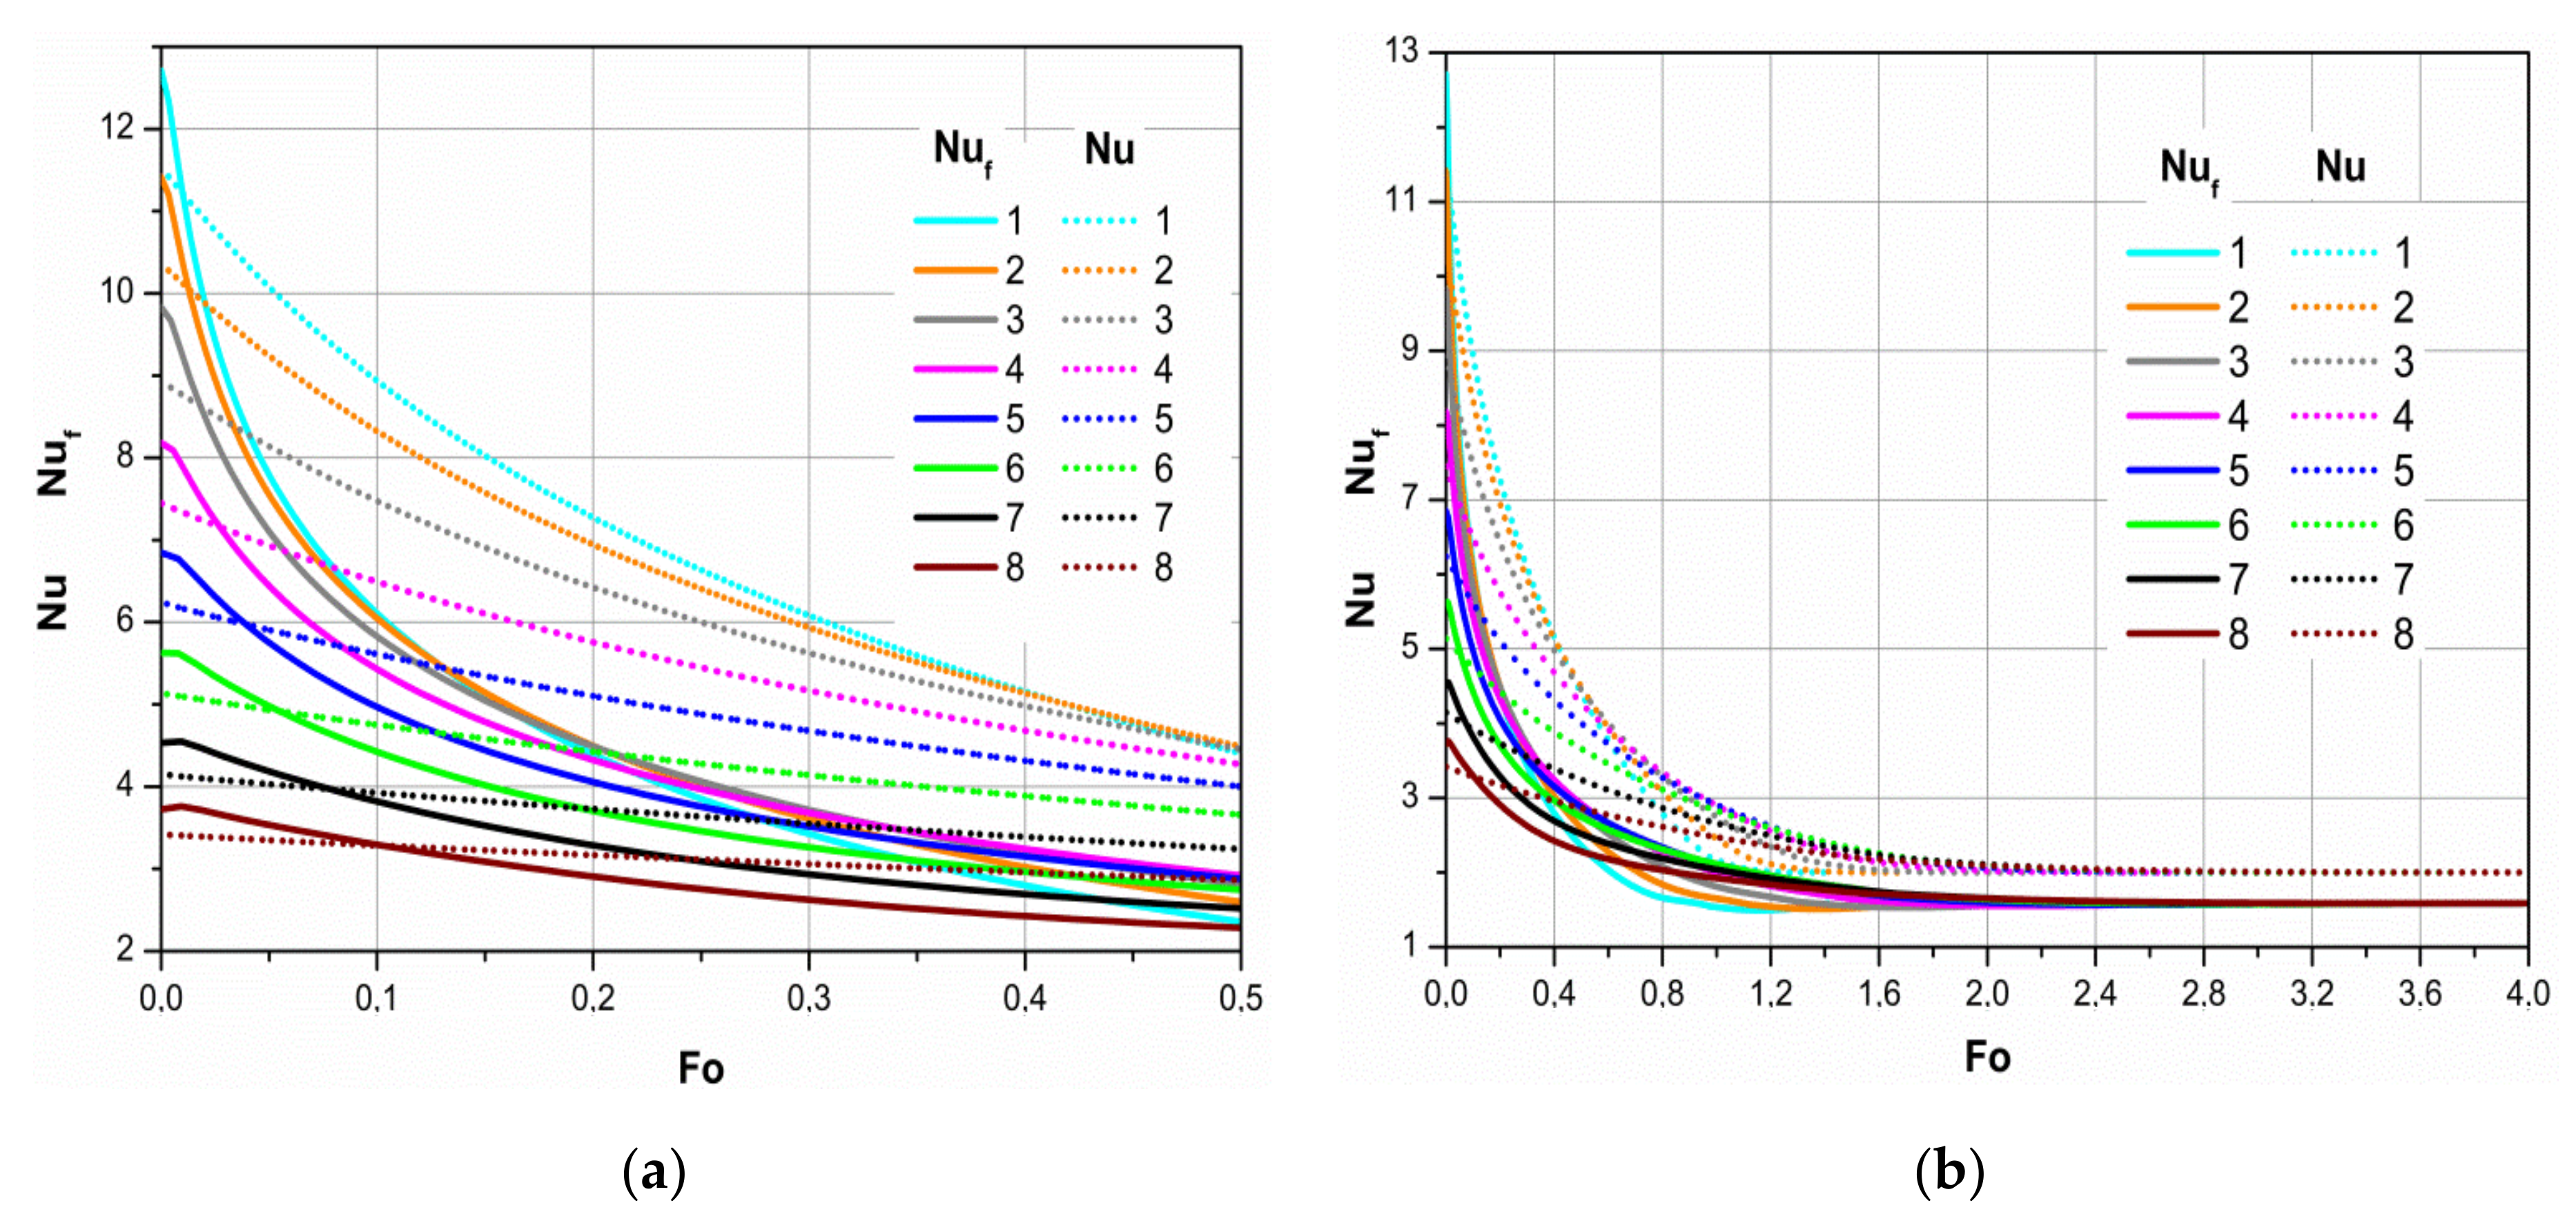
The influence of the Stefan flow on convective heating in phase change regimes of the droplet is clearly defined by a discrepancy between the dynamics of the modified Nusselt Nu
f number (
Figure 12 solid lines) and the dynamics of the classical Nusselt Nu number (
Figure 12 dashed lines), which defines convective heating in a non-evaporating droplet. Under the condensation regime, the curve in the graph of the function Nu
f(Fo) is situated above the curve of the Nu(Fo) graph (
Figure 11a) meaning that the Stefan flow enforces convective heating. For the droplets with previously defined dispersity, Nu
f,0 is 3.72, 4.53, 5.63, 6.85, 8.18, 9.83, 11.42, and 12.71 respectively, and Nu
0 is 3.41, 4.15, 5.14, 6.24, 7.45, 8.94, 10.37, and 11.54. Although the Nusselt number is sensitive to droplet dispersity in both cases, the Nu
f number increases by ≈10 per cent at the beginning of the condensation regime under the influence of the Stefan flow. Later through the condensation regime, the influence of the Stefan flow weakens, and for the beginning of evaporation, Nu
f = Nu (
Figure 12a).
Under the evaporation regime, the curve in the graph of the function Nu
f(Fo) is situated below the curve of the Nu(Fo) graph (
Figure 12a) meaning that the Stefan flow weakens convective heating. Under the transitional evaporation regime, lower heating input is needed to heat up the water in the droplet. Thus, while the intensity of evaporation grows, the influence of the Stefan flow increases rapidly, then starts to weaken in the equilibrium evaporation regime; finally, it becomes stable for all droplets with value Nu
f/Nu ≈ 0.79, when Nu = 2 (
Figure 12b).
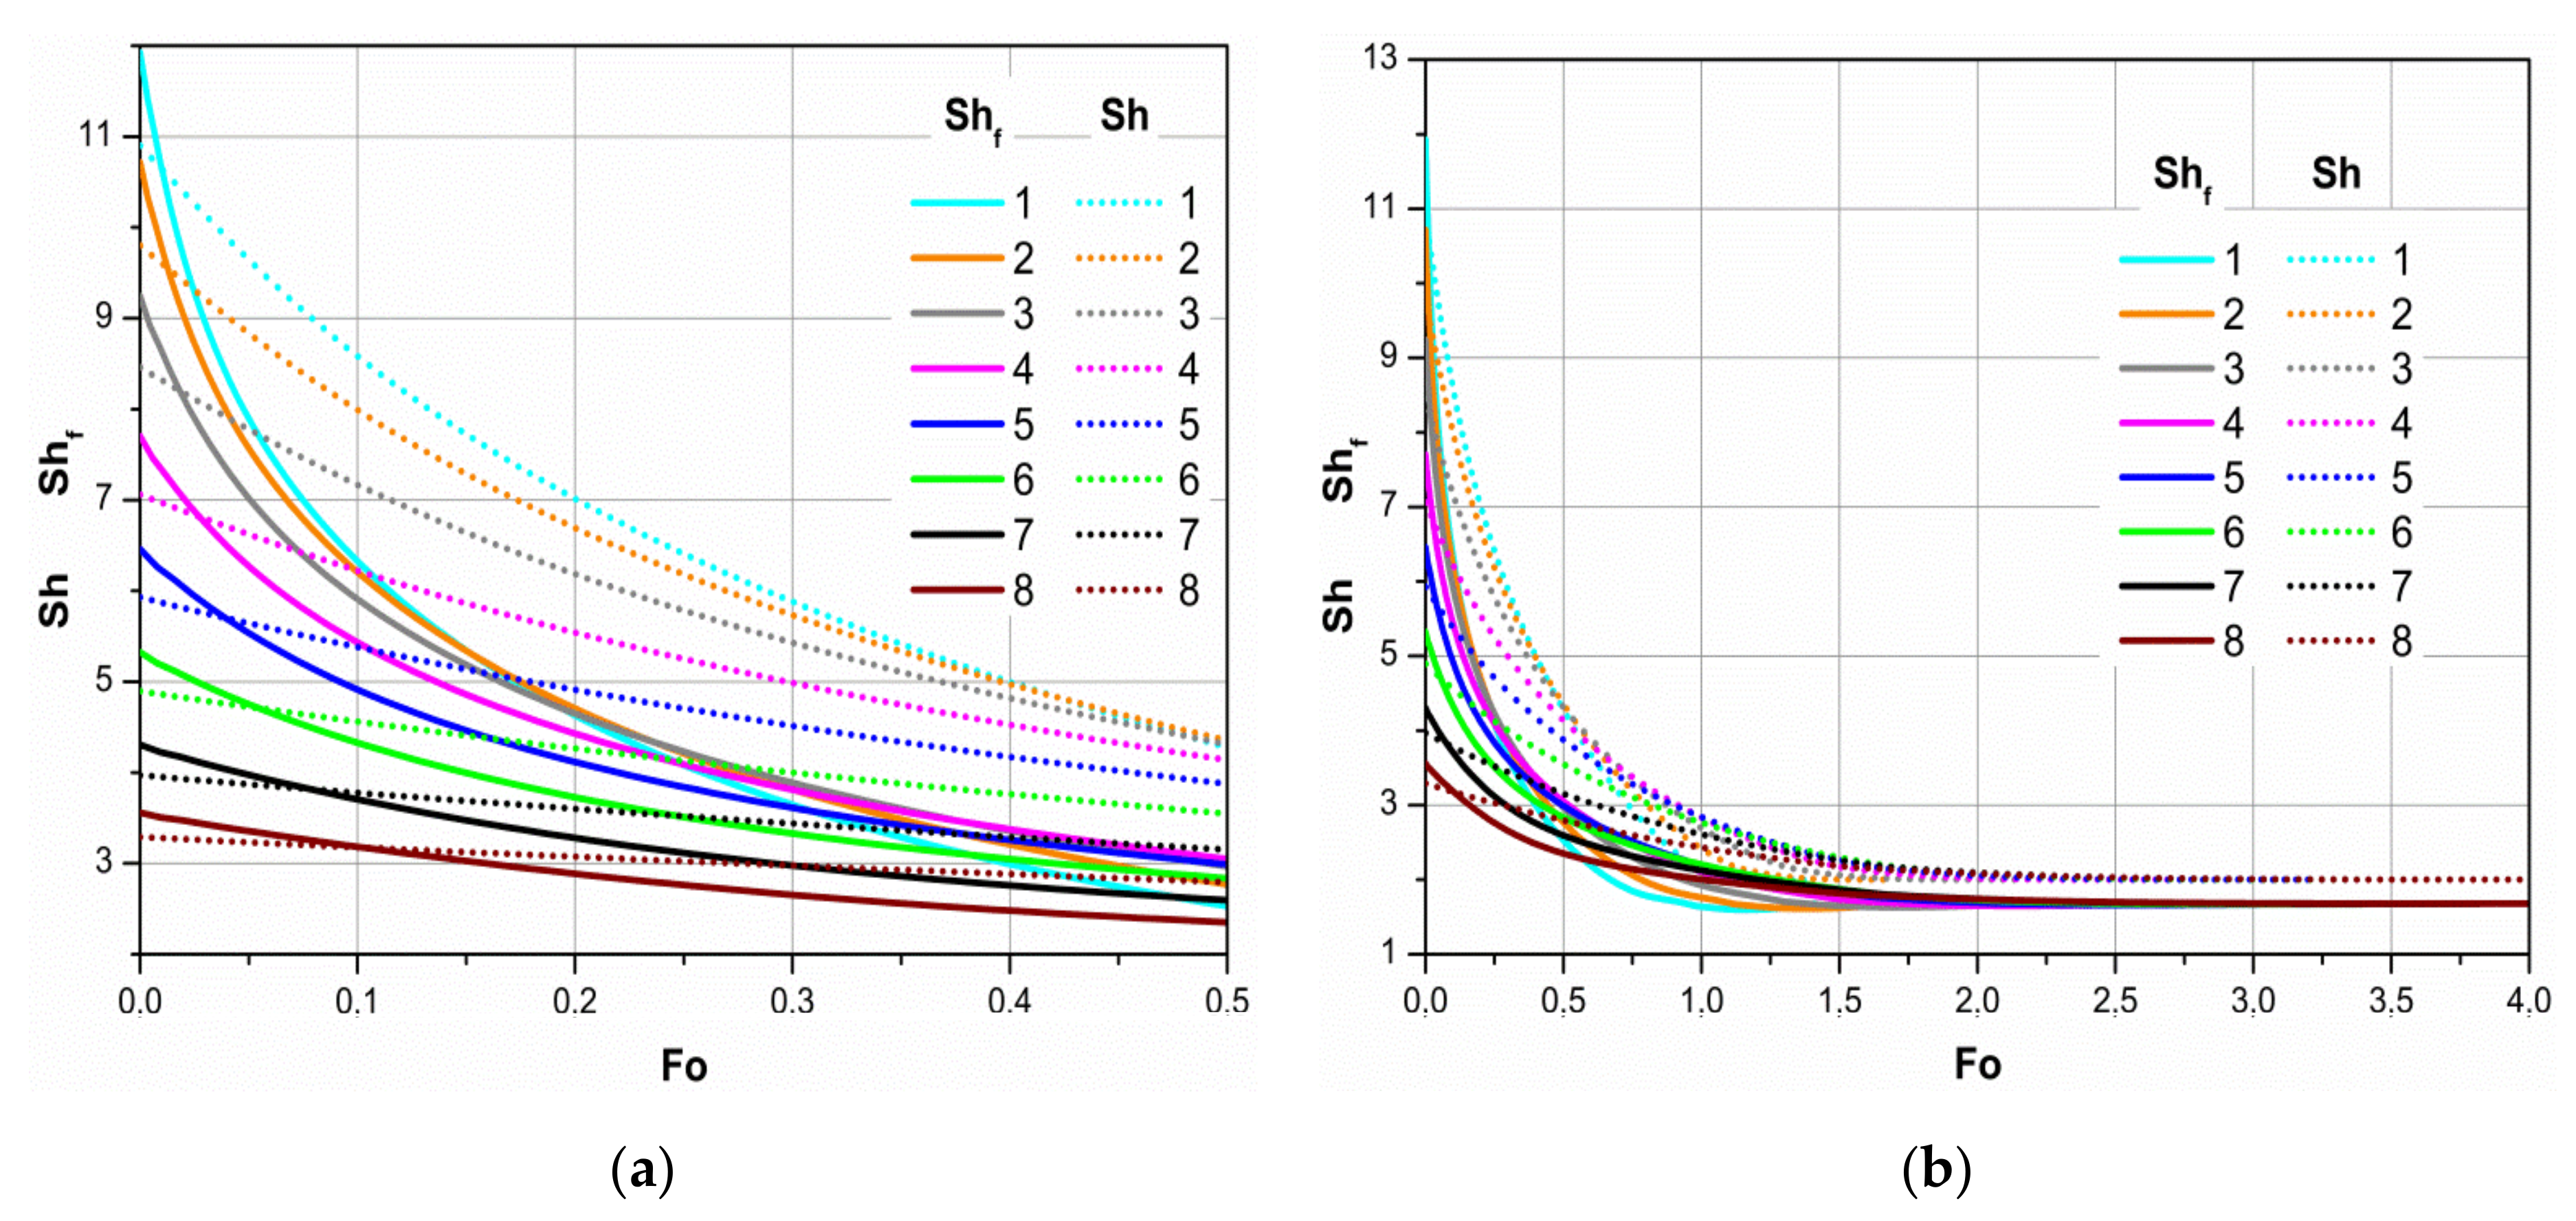
The influence of the Stefan flow on phase changes in the droplet is clearly defined by a discrepancy between the dynamics of the modified Sherwood Sh
f number (
Figure 13 solid lines) and the dynamics of the classical Sherwood Sh number (
Figure 13 dashed lines). In the condensation region, the curve in the graph of the function Sh
f(Fo) is situated above the curve of the Sh(Fo) graph (
Figure 13a) meaning that the Stefan flow enforces the condensation process. For the droplets with previously defined dispersity, Sh
0 is 3.29, 3.97, 4.89, 5.93, 7.06, 8.46, 9.8, and 10.9 respectively, and Sh
f,0 is 3.56, 4.31, 5.32, 6.46, 7.7, 9.24, 10.72, and 11.93. Although the Sherwood number is sensitive to droplet dispersity in both cases, the Sh
f number increases by ≈9 percent at the beginning of the condensation regime under the influence of the Stefan flow. Later through the condensation regime, the influence of the Stefan flow weakens, and for the beginning of evaporation, Sh
f = Sh (
Figure 13a). In the evaporation regime, the curve in the graph of the function Sh
f(Fo) is situated below the curve of the Sh(Fo) graph (
Figure 13a) meaning that the Stefan flow weakens evaporation. In the transitional evaporation regime, the influence of the Stefan flow is consistently growing, and in the equilibrium evaporation regime, the influence starts to weaken; however, it becomes stable for all droplets in the case of Sh/Sh
f ≈ 1.2 value, when Sh = 2 (
Figure 13b).
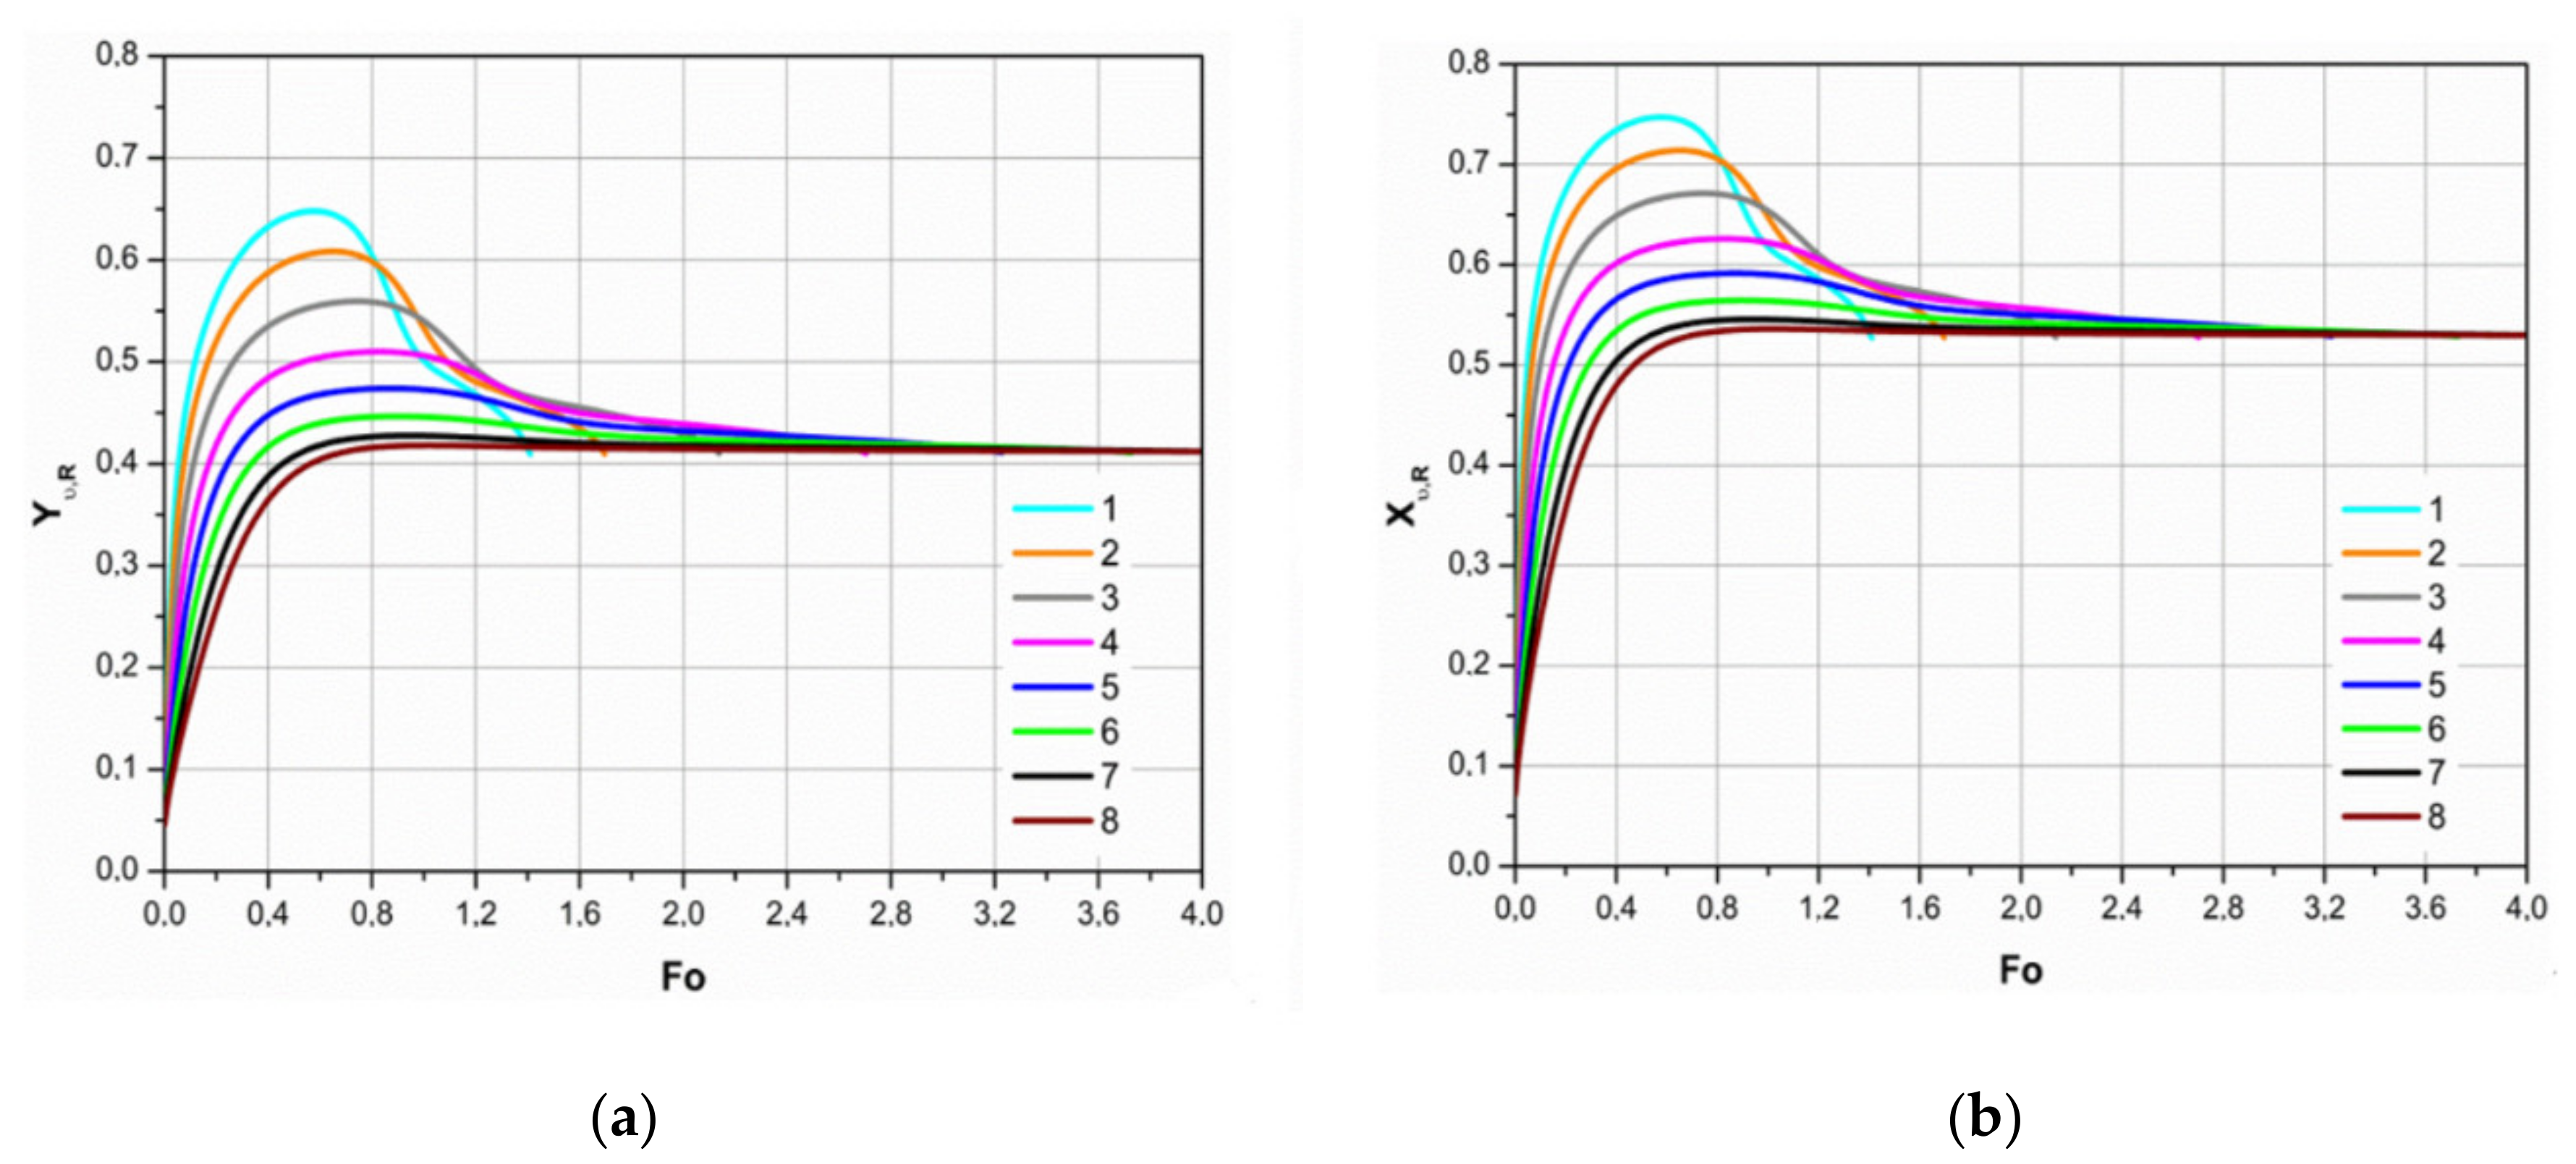
The temporal function
TR(Fo), which describes the dynamics of the temperature at the droplet’s surface in phase change regimes of the droplet (
Figure 5a), is essential to the B
T(Fo) function of the Spalding number for heat transfer since the temporal function qualitatively defines the graph of the B
T(Fo) function. The dynamics of the mass part of water vapor
Yv,R(Fo) in gas mixture at the droplet (
Figure 14a) is considerably important to the B
T(Fo) function of the Spalding number for mass transfer since this dynamics is directly related to the temporal
Xv,R (Fo) function of the volumetric part
Xv,R =
pv,R/
pg of vapor (
Figure 14b).
pv,R is the pressure of saturated water vapor defined by the
TR temperature, and hence the
TR(Fo) function does qualitatively define the
Yv,R (Fo) function. Therefore, in the interaction between the processes of combined transfer, the influence of the droplet’s surface temperature—although not direct—can be regarded as defining.
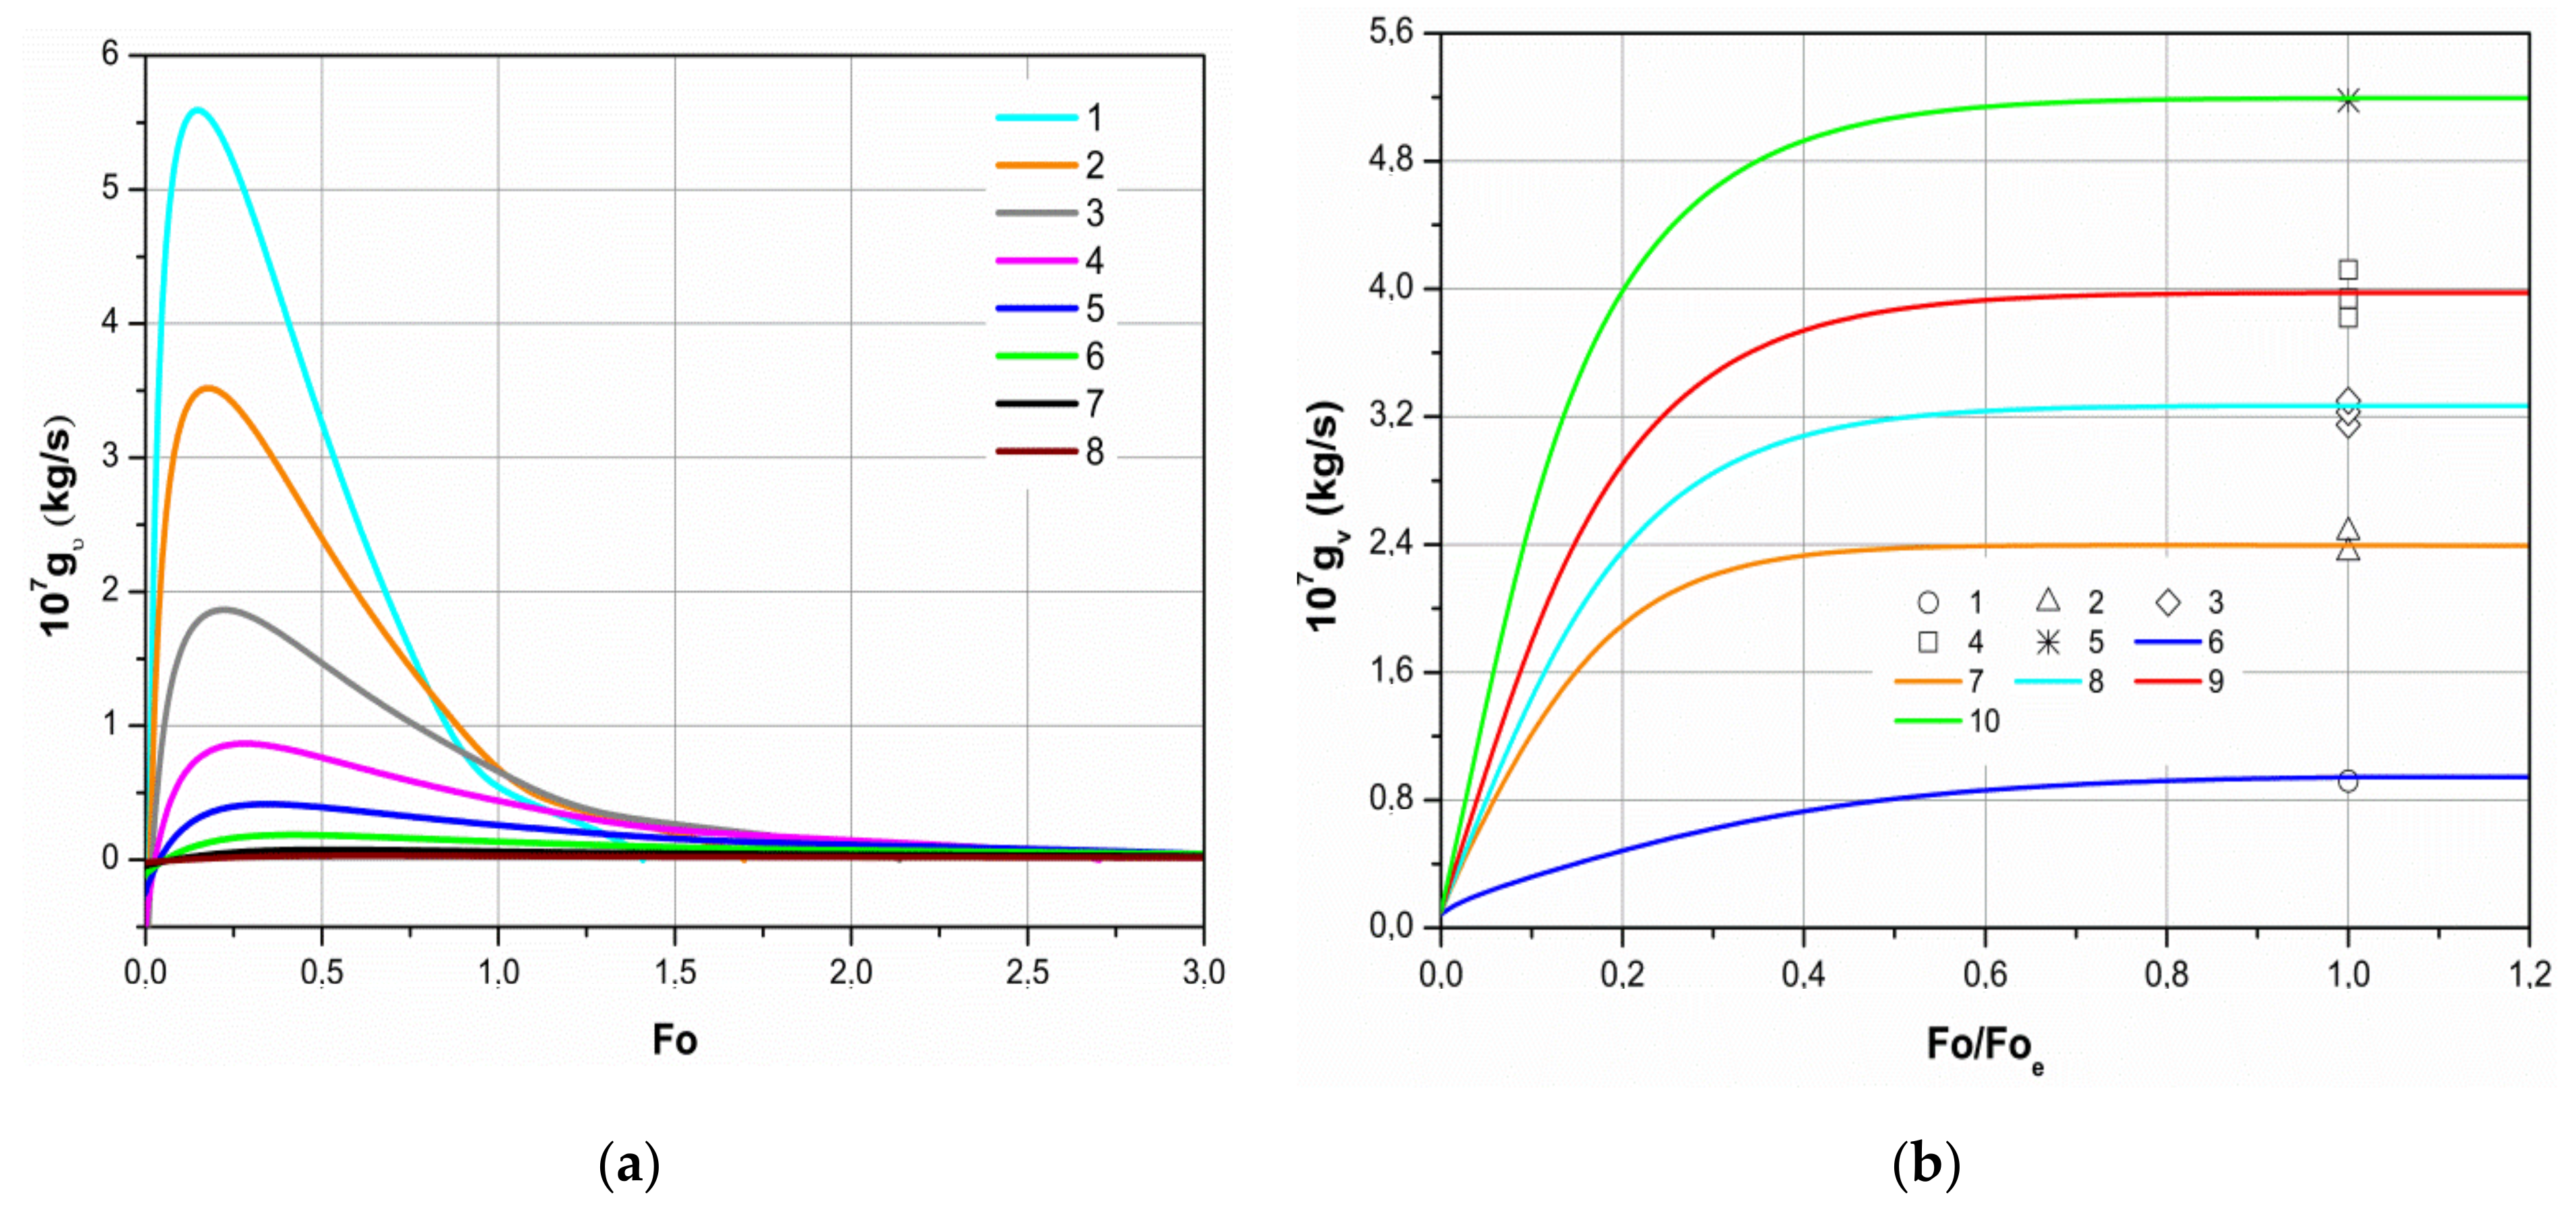
The analyzed active interactions between the processes of combined transfer define phase change processes happening at the surface of droplets (
Figure 15), which are relevant to liquid spray technologies. The vapor flow decreases consistently to zero in the condensation regime, where the droplet’s surface heats up and approaches the temperature of the dew point, then reaches its maximum in the transitional evaporation regime, and decreases consistently together with the droplet in the equilibrium evaporation regime (
Figure 15a). The flow and density of vapor is clearly influenced by the size of the droplet. At the beginning of the condensation regime, vapor flow for the droplets with previously defined dispersity
is 0.0188, 0.0456, 0.1127, 0.246, 0.489, 0.978, 1.702, and 2.52 kg/s respectively, and the density
of vapor flow is 0.96, 0.58, 0.359, 0.2418, 0.173, 0.1246 0.0963, and 0.0804 kg/(m
2s), respectively. Under the transitional evaporation regime, vapor flow increases for the droplets with previously defined dispersity to
0.0287, 0.0645, 0.146, 0.291, 0.54, 1.042, 1.803, and 3.05 kg/s respectively, and the density of vapor flow increases to
1.813, 1.054, 0.643, 0.441, 0.336, 0.272, 0.24, and 0.226 kg/(m
2s) respectively. The calculated vapor flow rate (g
v,e [kg/s]) of the hypothetical droplet (the diameter of which stays unchanged during phase changes) in equilibrium evaporation correlates well with the results of an earlier discussed experiment in [
51] (
Figure 15b). The vaporization of the hypothetical droplet was modeled according to the discussed methodology, except the droplet’s diameter was artificially kept constant.
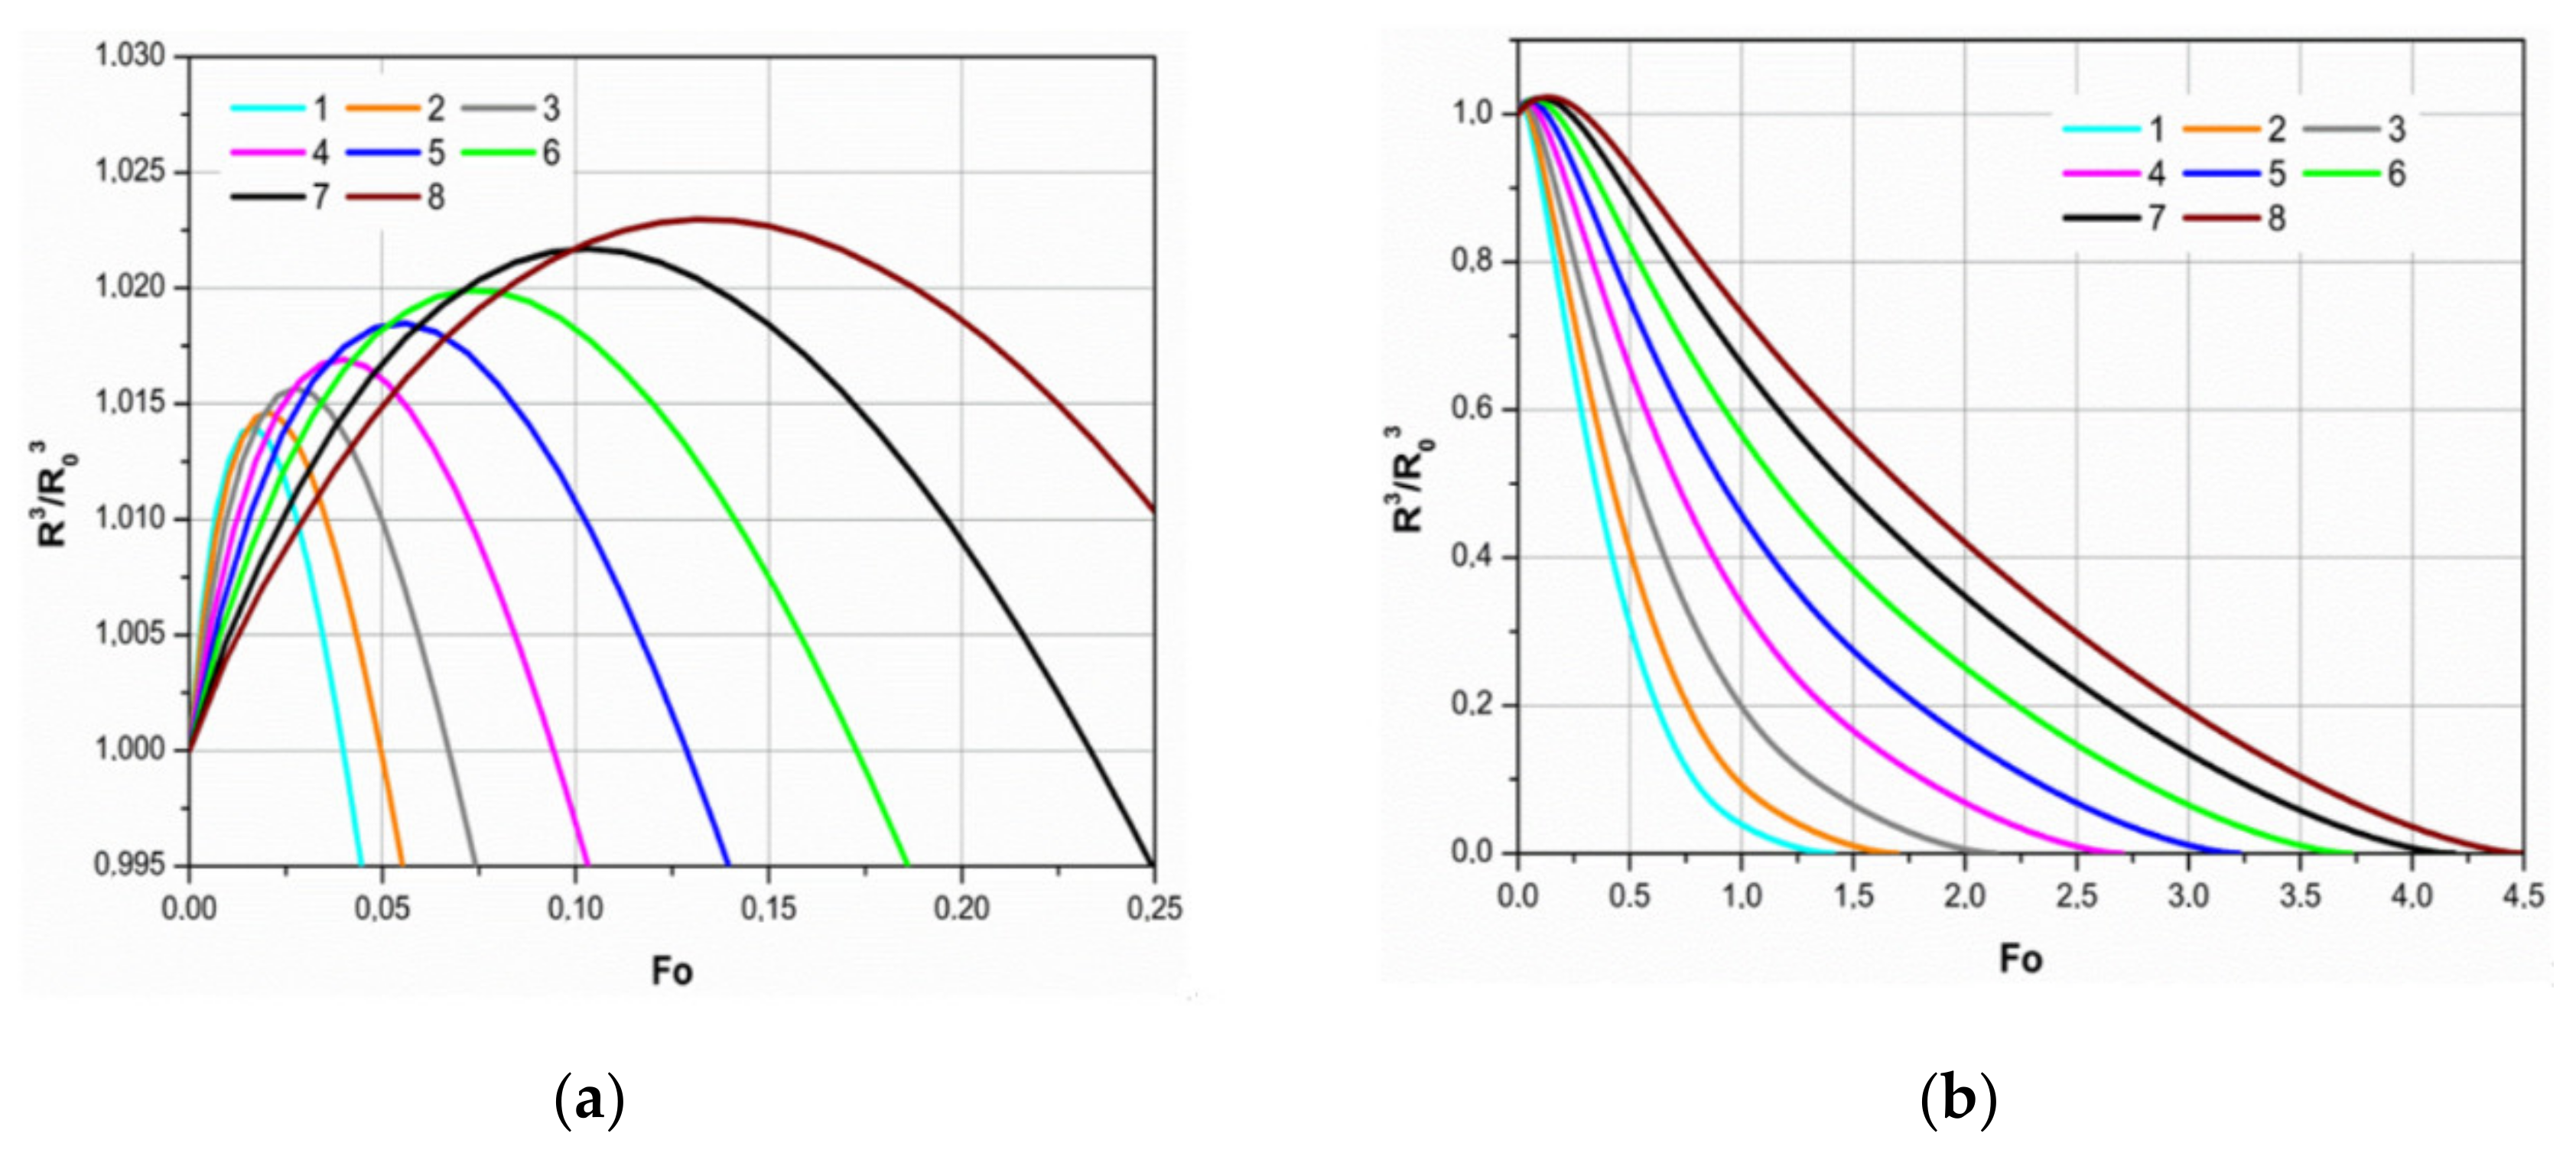
The dynamics of vapor flow at the droplet’s surface define the change in droplet volume in phase change regimes (
Figure 16). At the initial stage of the transitional regime, the key factor for the modeled cases of droplet volume increase is the expansion of heated water (
Figure 16a). Although larger droplets heat up to higher temperatures (
Figure 5a), the relative volume of smaller droplets increases over 2 percent, and the volume of larger droplets increases up to 1.5 percent. The nature of variation of the relative volume of smaller droplets under the equilibrium evaporation regime is close to linear, and radiation influence is more significant on the evaporation of larger droplets, and thus the curves of their volumetric variation are clearly non-linear (
Figure 16b).
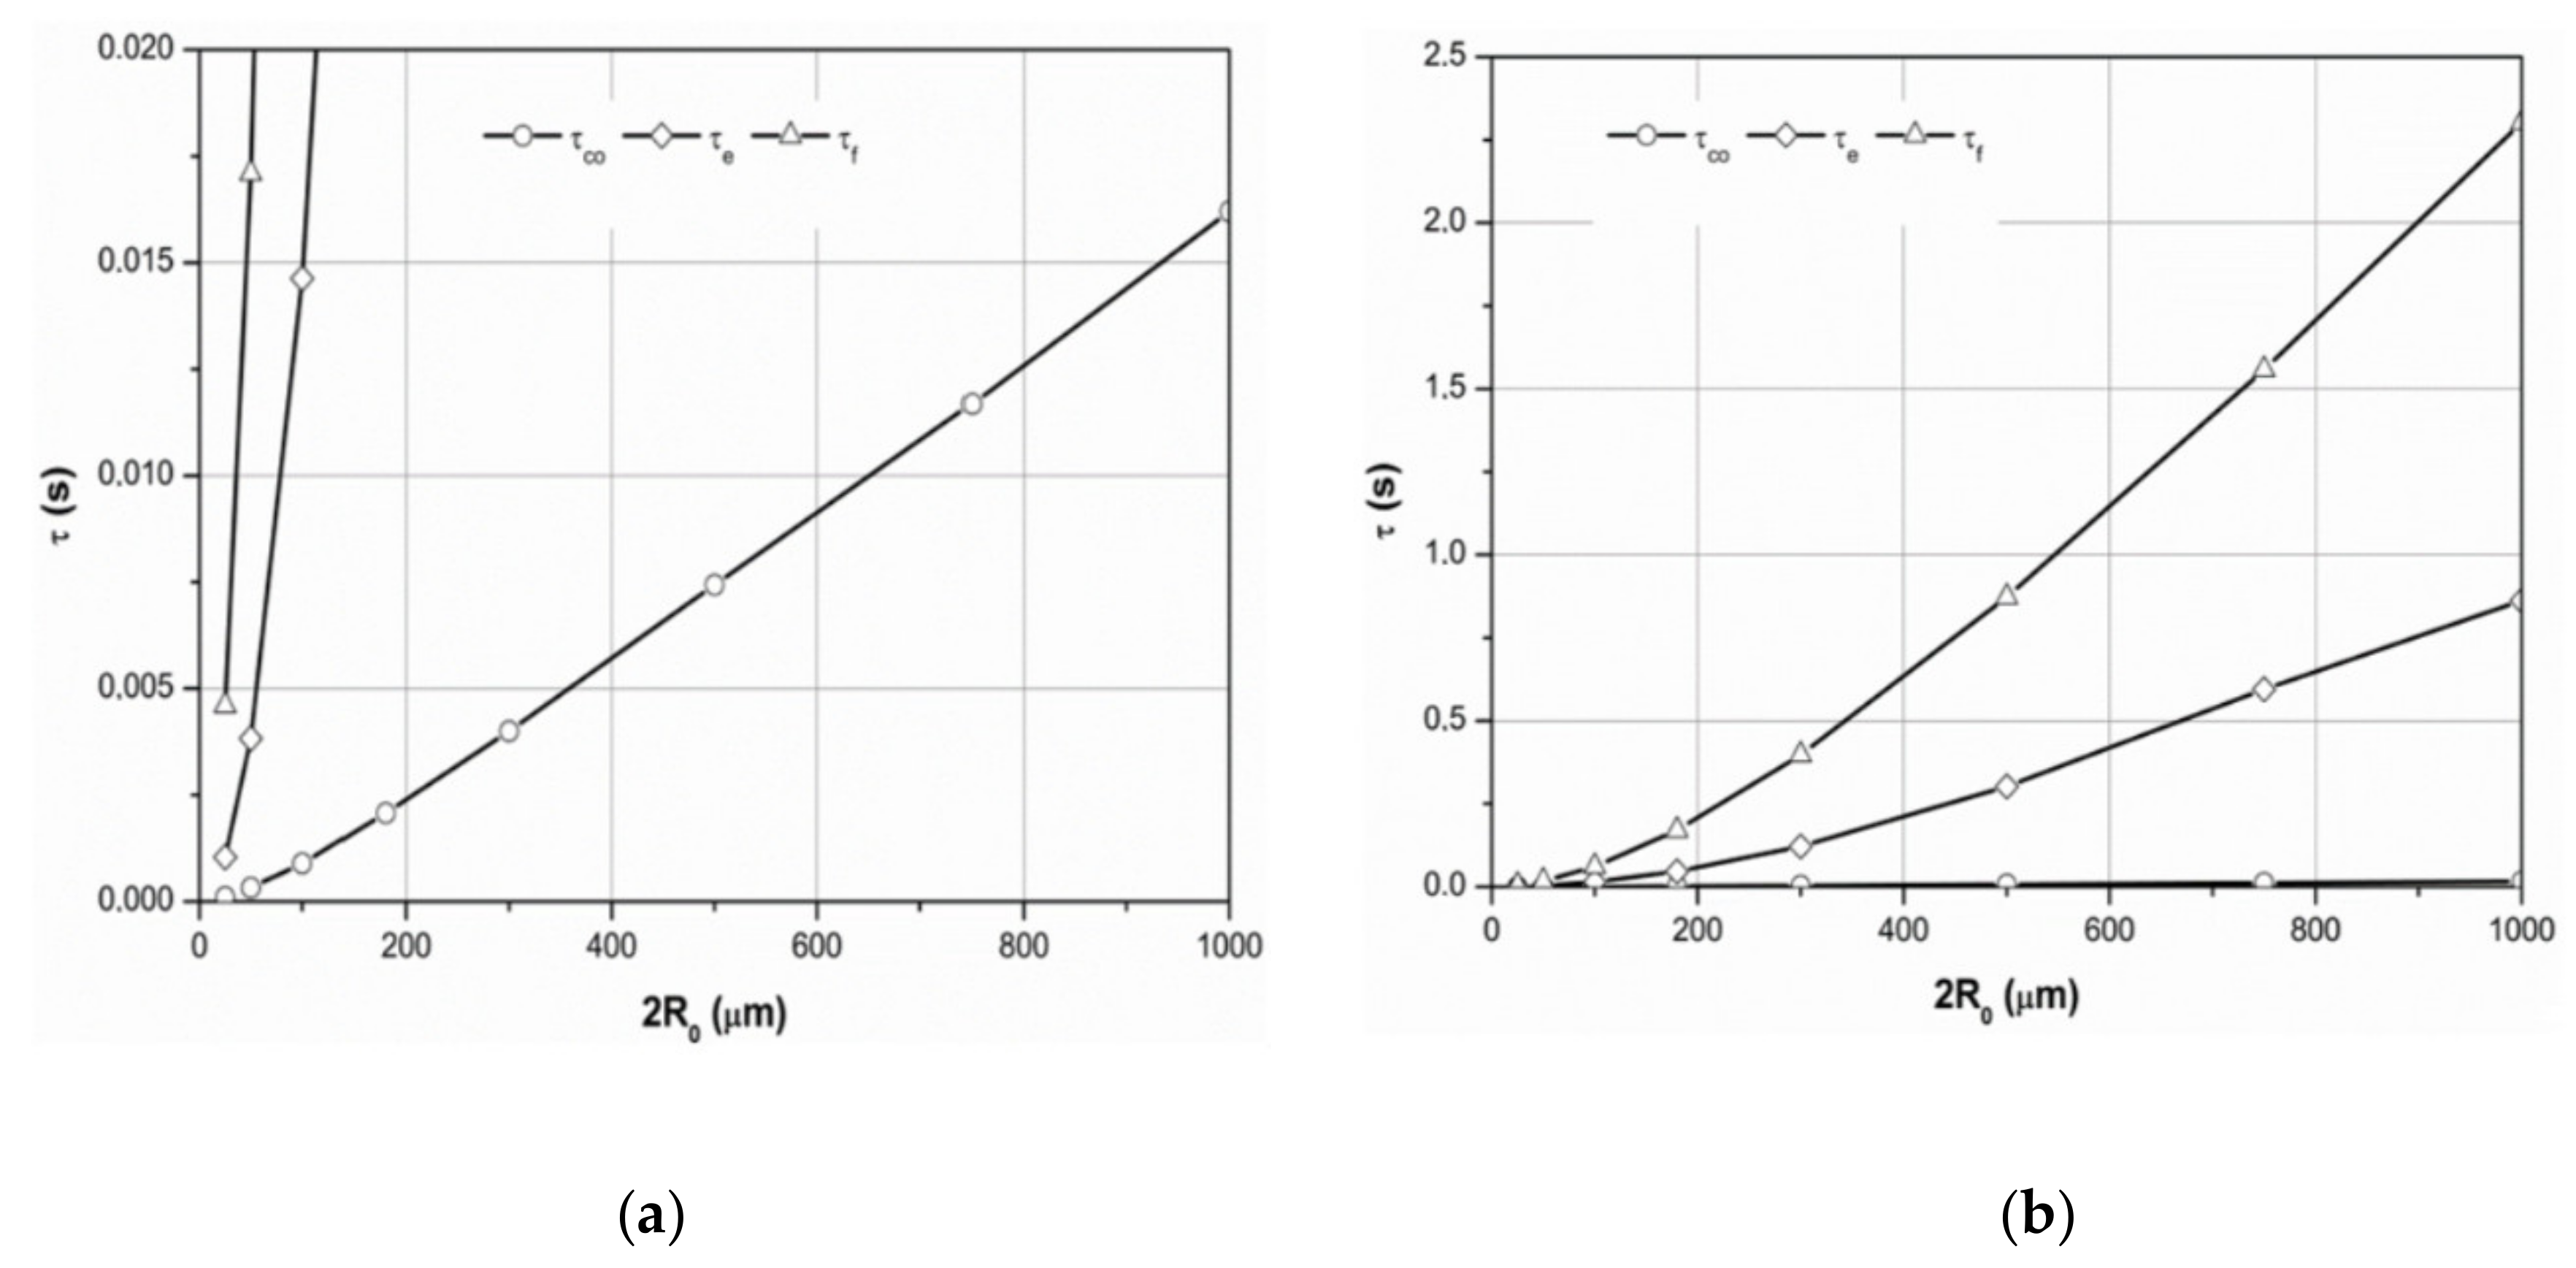
Figure 17 defines the influence of droplet dispersity on the duration of phase change regimes and summarizes the results obtained during the numerical investigation into the phase change cycle in the water droplet. As the figure demonstrates, the most considerable changes in the phase change process of the water droplet happen when the vapor condensation regime changes to the water evaporation regime when water droplets of 40 °C sprayed into flue gas of 1000 °C heat up rapidly to the temperature of the dew point. Hence, the condensation regime is short compared to the droplet evaporation regime.

