
Improvement of Self-Starting Capabilities of Vertical Axis Wind Turbines with New Design of Turbine Blades

1
Department of Mechanical Engineering, Kingston University, London SW15 3DW, UK
2
Department of Mechanical Engineering, St. Petersburg State Marine Technical University, 190121 St Petersburg, Russia
*
Author to whom correspondence should be addressed.
†
Kingston University, London SW15 3DW, UK.
‡
These authors contributed equally to this work.
Sustainability 2021, 13(7), 3854; https://0-doi-org.brum.beds.ac.uk/10.3390/su13073854
Submission received: 24 February 2021
/
Revised: 23 March 2021
/
Accepted: 26 March 2021
/
Published: 31 March 2021
(This article belongs to the Special Issue Design and Optimization of Renewable Energy Systems)
Abstract
:A lift-driven vertical axis wind turbine (VAWT) generates peak power when it is rotating at high tip-speed ratios (TSR), at which time the blades encounter angles of attack (AOA) over a small range from zero to 30 degrees. However, its ability to self-start is dependent upon its performance at low TSRs, at which time the blades encounter a range of AOAs from zero to 180 degrees. A novel vented aerofoil is presented with the intention of improving the performance of a lift-driven VAWT at low TSRs without hampering the performance of the wind turbine at high TSRs. Computational fluid dynamics (CFD) simulation is used to predict the aerodynamic characteristics of a new vented aerofoil based on the well documented NACA0012 profile. Simulations are performed using the SST turbulence model. The results obtained show a reduction in the coefficient of tangential force (the force that generates torque on the wind turbine) at low AOAs (less than 90 degrees) of no more than 30%, while at high AOAs (more than 90 degrees) an improvement in the tangential force of over 100% is observed. Using a simple momentum based performance prediction model, these results suggest that this would lead to an increase in torque generation by a theoretical three-bladed VAWT of up to 20% at low TSRs and a minor reduction in coefficient of performance of up to 9% at TSR of 2 and closer to 1% at higher TSRs.
1. Introduction
Improvement of the efficiency and reliability of wind turbines is of particular importance in terms of design and optimization of renewable energy sources and economic justification of wind farms [1]. Computational methods play an important role in development of prediction methodology of the performance of wind turbines installed in the objects of existing infrastructure or specific local environment.
1.1. Design of Wind Turbines
There are many different designs of wind turbines. They may be defined by the orientation of the axis of rotation, for example, horizontal axis wind turbines (HAWT) and vertical axis wind turbines (VAWT), or they may be defined by the aerodynamic force that drives the rotation, for example, lift-driven and drag-driven wind turbines. These different technologies offer advantages and disadvantages that are inherent in their design.
One particular design is the lift-driven VAWT. A lift-driven VAWT uses aerofoil profiles as the cross section of the blades to create high lift with little drag. One disadvantage of this type of wind turbine is the low torque it generates at low tip speed ratios (TSRs). This means many lift-driven VAWTs are unable to self-start and require some energy input to allow the wind turbine to reach its peak performance band at higher TSRs.
Given the problem that lift-driven VAWTs perform badly at low TSRs, it is important to offer a possible solution through the use of computational fluid dynamics (CFD) as a method to assess and compare the aerodynamic characteristics of a newly presented blade for a VAWT with standard blades currently in use. It is the intention of creating a blade for a lift-driven VAWT that has the aerodynamic characteristics to improve wind turbine performance at low TSRs, whilst at the same time having little or no negative effects on the performance of the wind turbine at high TSRs. The new blade design features vents on the trailing faces which have been placed there with the intention of increasing drag when the air approaches from behind the blade, but without significantly increasing drag when the fluid approaches from in front of the blade. The predicted aerodynamic characteristics of this new blade is used in a simple momentum-based performance prediction model for a VAWT. The predicted performance of a VAWT using the new vented blades is compared to that of a VAWT using standard blades.
Direct numerical simulation (DNS) of turbulent flow is able to resolve all turbulent length and time scales but applicable to simple geometry and low Reynolds number flows due to high-computational costs. Solution with Reynolds averaged Navier–Stokes equations (RANS) is capable to predict time or statistical averages usuing moderate computational resources, but introduces some level of uncertainties, because turbulence models are used to close RANS. Large-eddy simulation (LES) is an alternative to DNS and RANS. It resolves large length and time scales, and sub-grid scale models are applied to take into account the effect of the smallest unresolved turbulent scales.
1.2. Performance of Lift-Driven Vawts
VAWTs operate at a much lower Reynolds number and aerofoils experience a much larger range of AOAs compared to aerospace applications. Wind tunnel tests on various aerofoils (NACA0009, -0012, -0015 and -0012H) over a full range of AOAs from 0 to 180 degrees were performed in [2,3,4,5]. Experiments were conducted in a wind tunnel with blade profiles having chord lengths of approximately 15 cm and Reynolds number ranging from to . It was found that the NACA0015 aerofoil offered the best results for the performance of a lift-driven VAWT.
Additional high AOA studies of the NACA0012 aerofoil include [3,6,7,8] where both experimental and CFD analysis on NACA0012 aerofoil was performed. A good agreement between observations and predictions up to AOA of 10° were found. Beyond that CFD did not predict some flow features that were observed experimentally. Other studies using CFD to assess the performance characteristics of lift-driven VAWTs include those reported in [9,10,11,12,13]. There are many other investigations into novel ways in which to increase the performance of VAWTs at low TSRs [14,15,16,17]. However, the majority result in a significant loss in performance at high TSRs.
A review of the different models for performance prediction of lift-driven VAWTs was presented in [18]. These include the single stream model, and multiple stream tube (MST) model, double multiple stream tube (DMST) model, vortex model and cascade model. The findings were that the single stream tube model always predicted higher power than experimental results, the MST model (it is applicable to low solidity lightly loaded turbines) usually gave a lower power than experiments. Finally, the DMST model that separates upstream and downstream induced velocities gave more accurate predictions, but over-predicted slightly. Comparison of CFD predictions with those obtained from the DMST model was carried out in [16]. The CFD model showed better performance at lower TSRs compared to the DMST model.
A parametric study of TSR, solidity and aerofoil sections for VAWTs was performed in [19]. The findings noted that coefficient of performance is not strictly a function of TSR. In addition, their CFD predictions suggested that coefficient of performance is influenced by 3D effects, solidity and Reynolds number. The maximum power occurs with a chord to radius ratio of 6 and TSR of 5.
An investigation into flow separation on straight and twisted blade VAWTs was performed in [20]. It was an experimental study that used light weight tufts attached to the blades to give a way to observe the flow characteristics at large scales. For the straight blade investigation, a blade with NACA0015 profile and a chord length of 450 mm (although the trailing edges were rounded to make it 400 mm) was used. The canted blade used had a NACA0013 profile. It was basically a straight blade tilted at 40° to the vertical and twisted to maintain constant pitch relative to the central shaft. The experiments were performed at . For the straight blade, flow reversal occurs on the inner surface of the blade from 60 down to 250 degrees. Increasing the toe out pitch led to a delay in flow separation and a decrease in the maximum fraction of the blade experiencing flow reversal. This was at a TSR of 1.6 which is the peak power speed. For the canted blades a TSR of 2.5 was used and less flow separation was observed.
CFD analysis of the standard k– and RNG k– turbulence models on the prediction of VAWT performance was carried out in [21]. The VAWT model used three blades with a NACA0018 aerofoil, a chord length of 0.1 m, a radius 0.45 m, and a wind speed of 15 m/s. A structured mesh was used with a first layer thickness of . The three blades were set to rotate in a separate region. The torque was measured and compared for different turbulence models. The velocity distributions were similar for both turbulence models, the pressure distributions were close, but the values for torque were quite different, with the RNG k– turbulence model predicting higher values than the standard k– model.
The effect of wind turbine starting capability on overall energy yield was investigated in [22]. For certain cases, when the improved self-starting design was implemented, a decline in the overall energy generation was observed. A genetic algorithm is used in [23] to optimize the airfoil shape considering a balance between the aerodynamic and structural performance of airfoils.
CFD simulations of a three-blade straight blade VAWT was performed in [11]. The VAWT used NACA0015 aerofoils with a chord length of 0.42 m and had a radius of . A free stream velocity of 10 m/s was used with the inlet located upstream, the outlet downstream and the side walls at a distance of from the centre of the VAWT. Four different TSRs were simulated (0.7, 1.11, 1.46 and 1.96). Upon comparison with data of [24], it was noted that the LES provided the best agreement with the experimental results and that the model could provide an effective way to evaluate the self-starting capabilities of VAWTs. The LES predictions of the coefficient of power were in a good agreement with experimental results. However, the 2D and 3D URANS significantly overpredicted the coefficient of power. Previous suggestions for the reasons of this overprediction had been attributed to the inability of URANS to properly model tip vortices and flow divergence. However, LES also had this inability, so it was suggested that it is simply lack of ability of URANS to accurately predict lift force beyond stall that leads to the overprediction of the coefficient of power [11].
2D CFD simulations of a three blade VAWT using NACA0021 aerofoils was conducted in [10]. The simulations were performed for for TSRs from 1.44 to 3.30. It was observed 2.33 was the optimum TSR. The results plot the torque coefficients of each blade through one revolution and their work suggests that instantaneous power coefficients that exceed the Betz limit were observed at this TSR. Compared with experimental results, 2D URANS simulations tend to overestimate the power coefficients, although they can approximately replicate the variation trend of experimental power coefficients [10,24,25]. Some researchers attributed this discrepancy to the effects of the tip loss or flow divergence in real VAWTs, both of which are not reflected in 2D URANS simulations [11].
An investigation into the performance of lift-driven VAWTs comparing an extensive library of aerofoils was presented in [26]. This work concentrated on five series of symmetric and non-symmetric aerofoil shapes (NACA00XX, NACA63XXX, S-series, A-series and FX-series—20 aerofoils in total). Of the symmetric aerofoils tested, the NACA0018 was found to be the best, while the overall best aerofoil was found to be the S-10146. The results show that the choice of aerofoil leads to differences in efficiencies of over 10%. The operating range for the wind turbine consisted of the symmetric aerofoils is wider than the non-symmetric one. This means the stall can be delayed by using symmetric aerofoils. The wind turbine consisted of the symmetric aerofoils has a higher performance than the non-symmetric aerofoils turbine (the maximum power coefficient corresponds to NACA0018 aerofoil). A large-eddy simulation and an actuator line model are introduced in [27] to simulate the wake field and aerodynamic loads of wind turbines with different longitudinal spacings.
There is a risk that altering the aerofoil’s aerodynamic characteristics also have an effect on the aerofoil’s aerodynamic characteristics at AOAs less than 30 degrees. If the drag is increased or the lift is reduced in this range then this would have a negative effect on the torque produced and reduce the performance of the wind turbine at high TSRs, thus reducing the power output. Increasing the drag or decreasing the lift at AOAs more than 90 degrees, then that results in an increase of coefficient of axial force which increases the torque at low TSRs. This means that less energy input is required to get the wind turbine rotating at low TSRs.
1.3. Self-Starting Capabilities of Lift-Driven Vawts
At low TSRs and low wind speeds, the torque generated by the VAWT is often not large enough to overcome the resistance of the electrical generator, so lift-driven VAWTs require some initial energy input before they can start generating energy themselves (low self-start capabilities). A numerical and experimental analysis of the patent of a device to be used in vertical-axis wind turbines (VAWTs) under extreme wind conditions is carried out in [28].
There are a variety of solutions discussed in [5] that can improve starting capabilities of lift-driven VAWTs including increased solidity, cambered blades, inclined blades, helical blades, turbines connected to generators which can operate as motors and variable pitch blades.
Using a purely theoretical estimations it was noted that for the case of a lift-driven VAWT with NACA0015 aerofoils, the rotor would be capable of self-starting if six blades were utilized to increase solidity [19].
A novel VAWT design aimed at capturing the shed vortices that occur at the tips of the blades and hinder performance was offered in [29]. Having successfully prevented vortex shedding this study requires further work to assess the performance of the wind turbine in terms of power compared to traditional designs.
A time-stepping approach based on the aerodynamic characteristics of the NACA0012 aerofoil to determine the parameters that affect the self-starting capability of a Darrieus wind turbine was used in [7]. By specifying a set of initial parameters such as TSR and the number and azimuthal position of the blades, a lookup function finds the force on the blade at the certain AOA, and the acceleration of the rotor is calculated. This acceleration is applied over a short time interval to calculate the AOA to use for the following time step. It was shown that a lightly loaded three-bladed rotor should be able to self-start in steady wind conditions from any starting position, whereas a two-bladed rotor is only able to self-start depending on its start position. The model did not take into account any tip effects and also did account for the disrupted airflow the blades encounter when in the downstream position.
Some experimental studies have been performed in order to evaluate self-start capabilities of VAWTs. For example, a two-tiered three blade rotor with the two tired shifted by an angle of 90 degrees was used in [30]. It was seen a 1 kW unit start in a wind speed of 2.4–2.6 m/s and reached efficiency of around 39%. The effect of using pitch control on a Darrieus water turbine to minimize shaking was studied in [5]. In addition, variation of pitch was shown to improve the turbine’s ability to self-start. The self-starting capabilities of a three-bladed H-rotor VAWT was demonstrated ed experimentally in [31].
A parametric CFD study of number of blades, chord length, TSRs, various profiles and pitch and phase angles for VAWT was performed in [32]. It was found optimal parameters to be three blade rotor, NACA0012 blade profile, chord length of 0.14 m, rotor radius of 0.5 m in a flow of 2 m/s operating at a TSR of 2.4 with a maximum pitch angle of 9 degrees and a phase angle of 5 degrees.
An analysis of the flow around different cambered VAWT blades in a stopped position was carried out in [15], and hence the analysis covered a range of AOAs from zero to 360 degrees. It was found that the best performance came from aerofoils with camber profiles in the middle of the blade and with curves between 4 and 6% of the chord line size. That is to say aerofoils with these properties were predicted to increase the ability of VAWTs to self-start while not causing a drop in performance. Efforts to develop blade profiles that improve the ability of VAWTs to self-start while still giving reasonable performance at high TSRs were continued in [33].
The DMST model with CFD simulations of a three blade VAWT using the NACA0012 profile was compared in [12]. The results obtained suggest self-starting does not occur. 2D and 3D CFD simulations of straight blades VAWTs were carried out in [34]. The results computed were compared with other predictions. Design and analysis of wind flow modifier modelling of a vertical axis wind turbine for low wind profile urban areas is considered in [35]. A simulation is carried out to examine the performance of an efficient low aspect ratio C-shaped rotor and a proposed involute-type rotor.
The effects of pitch angle and camber on the performance of VAWTs was studied in [13]. ANSYS Fluent solver was used to run the CFD simulations which covered three blade profiles with different cambers and a variation in pitch angle between and degrees. A three-bladed rotor was used and start-up was simulated at a wind speed of 10 m/s. The simulation used a sliding mesh technique that was divided into three regions (a small region around each aerofoil and a slightly larger region encompassing the blades were allowed to rotate, while the rest of the flow domain remained stationary). Comparing all three blades at each pitch angle saw the blade with the largest camber show the best self-starting capabilities. In addition, all blades showed better self-starting capabilities when pitched at degrees. However, once the rotor is rotating all blades show best performance when pitched at 5 degrees, with the medium cambered NACA2412 aerofoil giving the best performance of all three blades.
1.4. Improvement of Self-Starting Capabilities
A new vented aerofoil based on the profile of the NACA0012 aerofoil is presented with the intention of improving the performance of lift-driven VAWT at low TSRs, whilst not compromising performance al higher TSRs. The aerofoil features vents on the trailing edges which are intended to increase drag at AOA greater than 90°, without significantly reducing lift and increasing drag at AOA less than 90°. It is expected this will lead to an increase in the axial force on the aerofoil at AOAs greater than 90° and thus improve the self-starting capabilities of a lift-driven VAWT without causing a major loss in power production at high TSRs.
CFD solver is used to compare the aerodynamics characteristics of this new vented aerofoil design with those of a standard NACA0012 aerofoil for a range of AOAs from 0 to 180 degrees in step of 10 degrees or less at to . The aerodynamic characteristics of the two aerofoils are observed to be similar. However, the new vented aerofoil design does offer a slight increase in tangential force coefficient at AOA greater 90 degrees thus marginally increasing torque at low TSRs.
The paper is organized as follows. A background of wind turbine technology with a focus on the theory of lift-driven VAWTs is presented in Section 2. A description of the solid models to be used in the numerical simulations is provided in Section 3. A detailed description of the processes undertaken to ensure an accurate CFD model is described in Section 4. CFD results and their discussion are reported in Section 5. The predicted aerodynamic characteristics of the vented aerofoil are compared with those of the standard aerofoil. The performance prediction model is introduced in Section 6, and the effect of the aerodynamic characteristics of the blade profile on the performance of the wind turbine is then analyzed. Conclusions are drawn from the processes performed and results obtained in Section 7.
2. Physics of Vawt
A flow of fluid imparts an overall force on an object. In the case of an aerofoil the convention is to split this force into the drag force, (the force in the direction parallel to the flow), and the lift force, (the force in the direction normal to the flow). Even if the aerofoil is tilted at some AOA, the forces are still defined with respect to the direction of the fluid rather than the aerofoil.
The dimensionless coefficients of these forces are defined as follows
where is the fluid density, U is the apparent velocity of the flow as seen by the aerofoil and A is the area of the aerofoil.
For the case of a lift-driven VAWT, it is more convenient to observe the components of the overall force with relation to the aerofoil itself, that is the axial force, , and the normal force, , as shown in Figure 1. In terms of lift and drag coefficients, these forces are expressed as follows
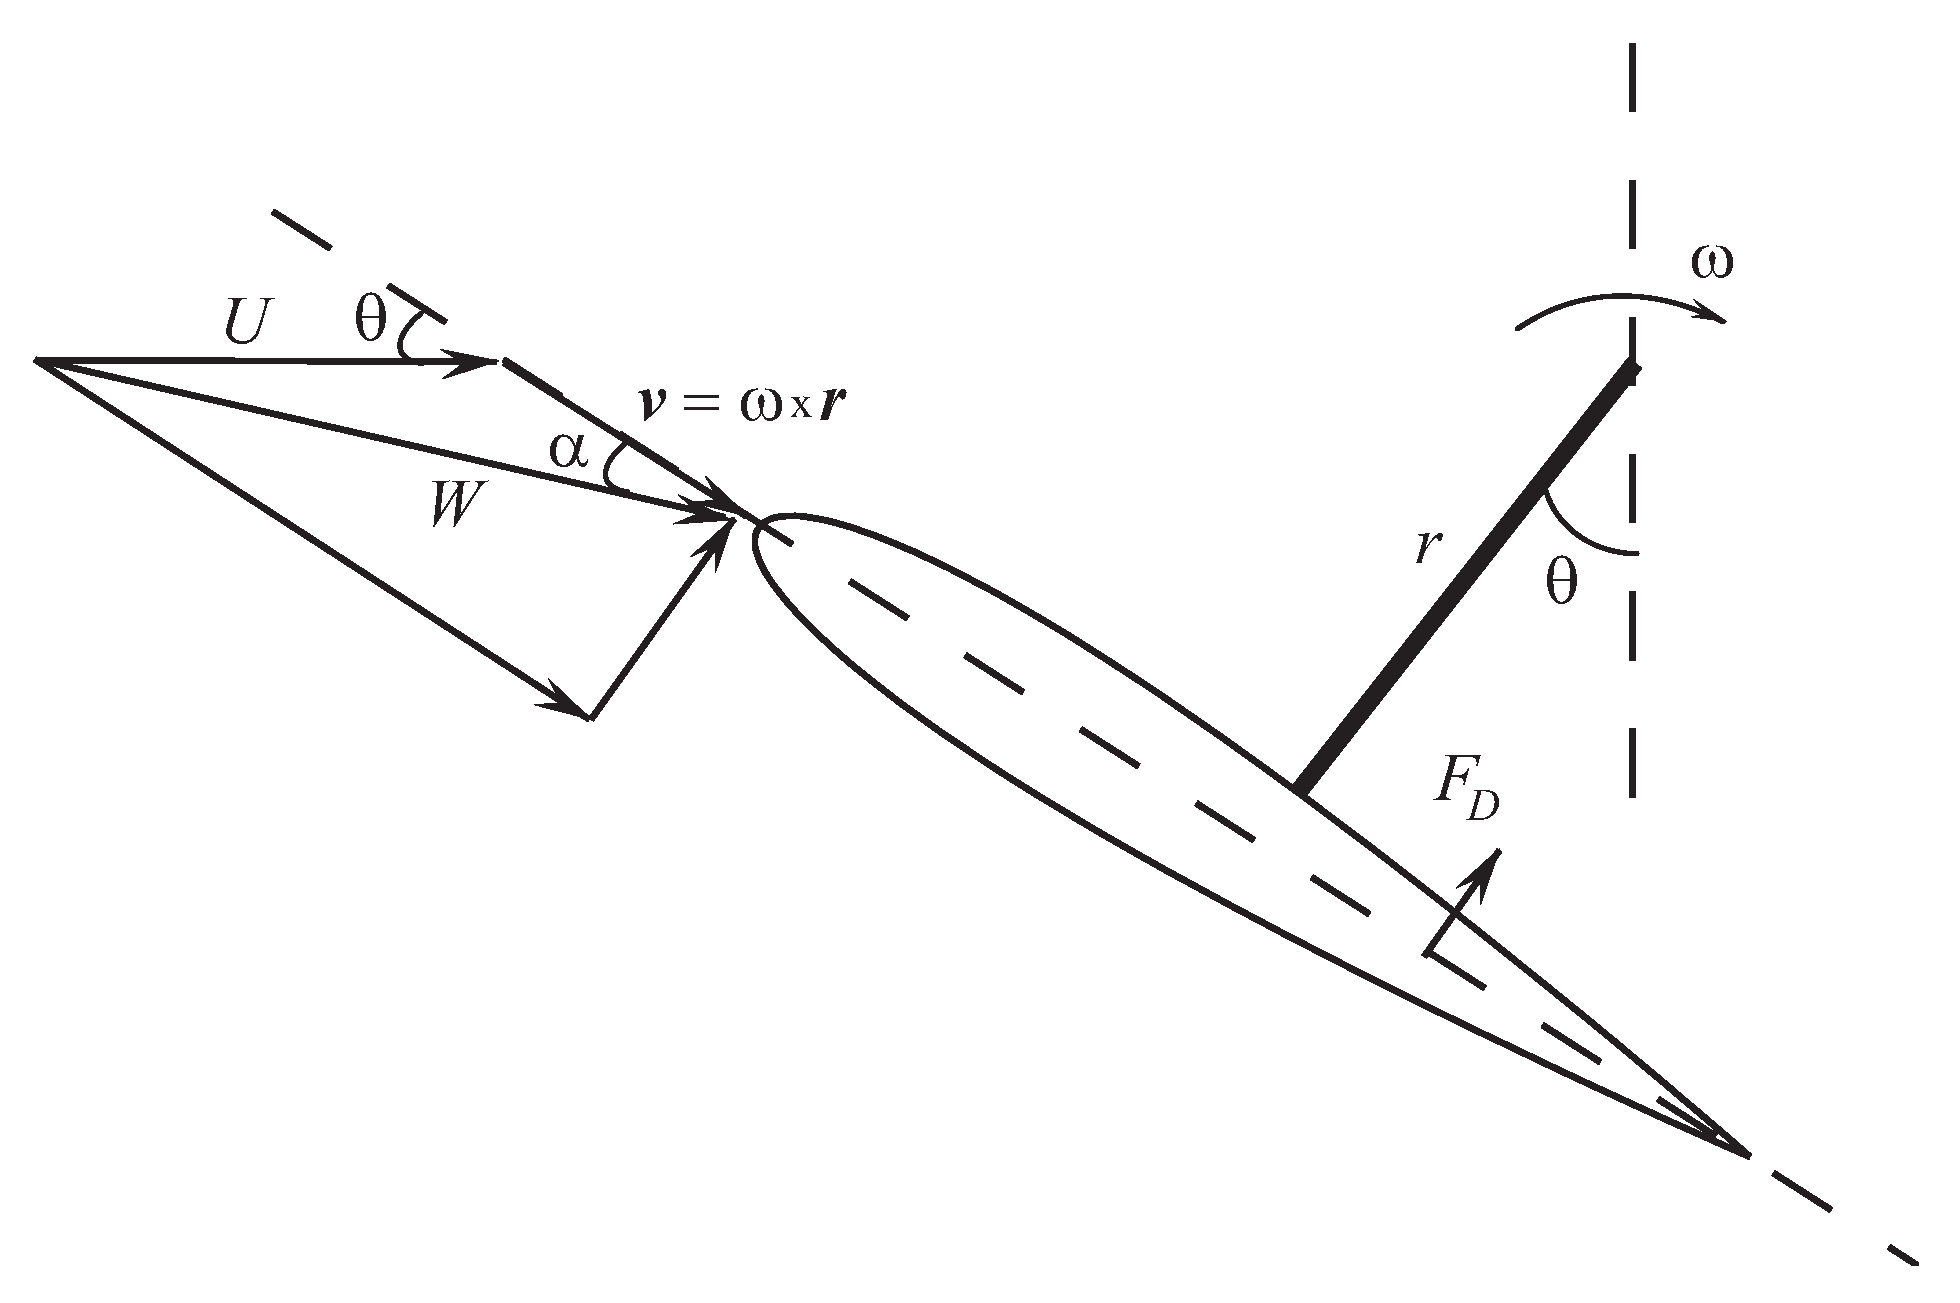
Since a blade of a VAWT is fixed in the radial direction, as seen in Figure 2, it is therefore the axial force (in the direction tangential to the rotation of the VAWT) which drives the wind turbine.
Figure 2 illustrates the apparent flow velocity and AOA experienced by the rotating aerofoil. The components of apparent fluid velocity, W, in x and y directions are expressed as and , where is angular position, is angular velocity, r is the radius of the VAWT, and U is the wind speed. AOA, , is given by
The TSR is the ratio of the tangential velocity of the blade to the wind speed and is given by
The Reynolds number is a dimensionless characterization of the flow regime and is given by , where C is the chord length of the aerofoil and is the dynamic viscosity of the fluid.
The instantaneous torque on a single aerofoil of a straight blade VAWT is expressed as follows
where is the tangential force coefficient. The torque coefficient is defined as , where Q is the average torque. The power coefficient is .
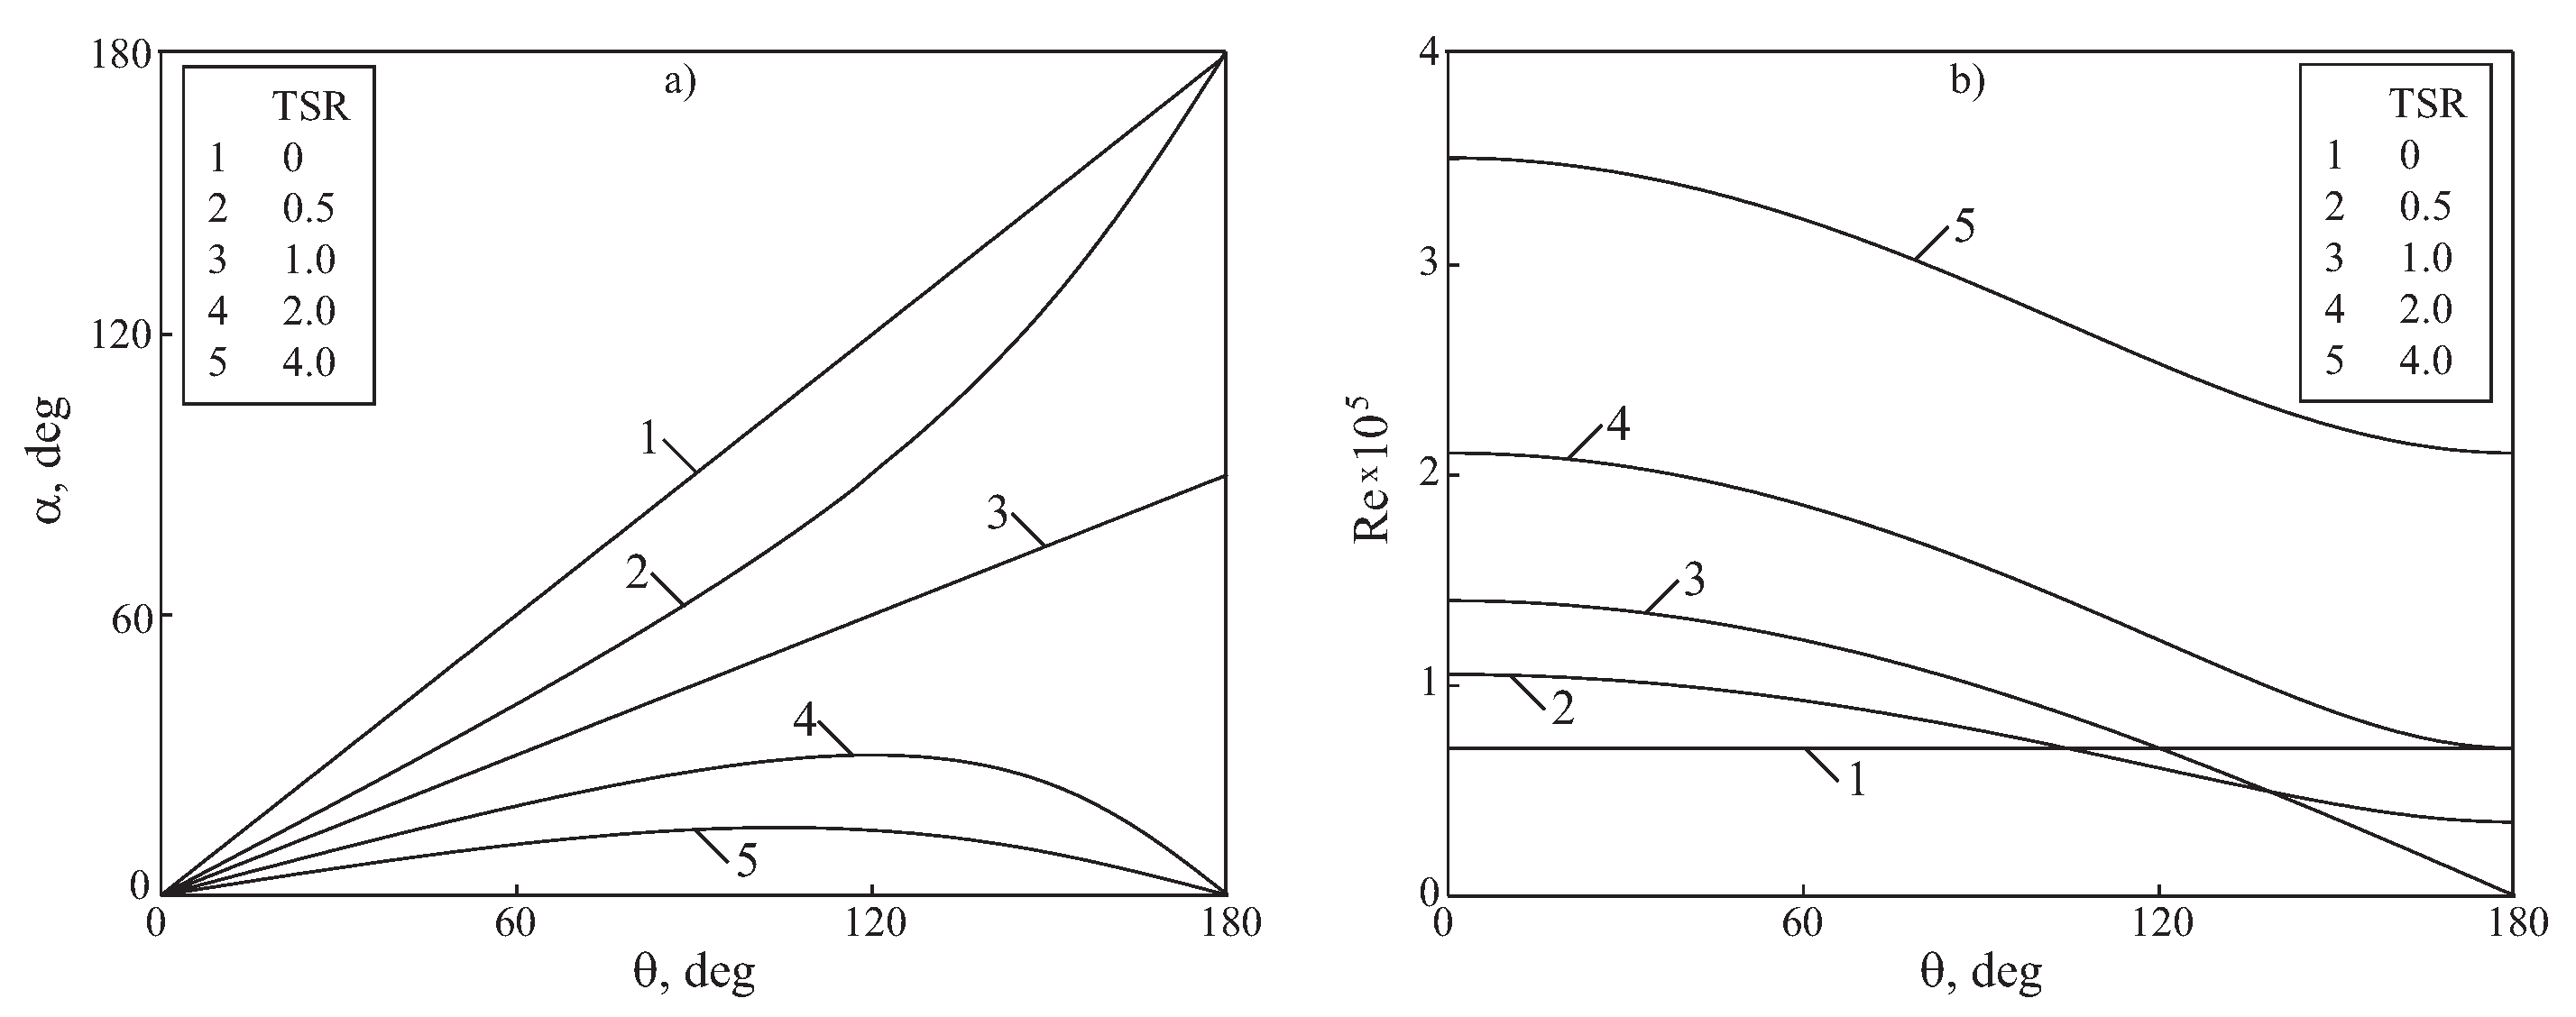
Knowing this allows for analysis of the Reynolds number and AOA experienced by the aerofoil during a full revolution of a VAWT at varying TSRs. Figure 3a shows that at a TSR of zero (that is when the wind turbine is stationary) an aerofoil experiences an AOA anywhere from 0 to 180 degrees. This happens until the VAWT reaches a TSR of 1. Beyond the aerofoil never experiences an AOA greater than 90° and as the VAWT reaches high TSRs the range of AOAs experienced decreases further. Peak performance of lift-driven VAWTs occur at high TSRs (). This point is explained by observing the peak in the tangential force coefficient of an aerofoil which occurs at the low AOAs that are continually experienced at high TSRs.
Figure 3b also shows the Reynolds numbers experienced by an aerofoil used on a small VAWT in wind speeds of 5 m/s and cord length of m, which is a typical cut-in wind speed for small VAWTs. Up to a TSR of 1, the Reynolds number of the flow is no higher than around . At peak performance, at TSRs of larger than 4, Reynolds number reaches .
At , when the VAWT is not moving, depending on the angular position of the aerofoil, it may be subject to an AOA from anywhere between 0 and 180 degrees. However, should the VAWT be rotating at , then the aerofoil experiences an AOA ranging from 0 to 30 degrees. This range continues to decrease as the TSR increases.
3. Solid Model
The aerofoil profile that is used in CFD study to compare the aerodynamic characteristics of a standard blade and a new vented blade is the NACA0012 profile.
3.1. Standard Aerofoil
The NACA aerofoil series is characterized by the set of numbers that follows the acronym. The first digit describes the maximum camber as a percentage of the chord length, the second digit describes the distance of maximum chamber from the aerofoil leading edge, and the last two digits describe the maximum thickness of the aerofoil as a percentage of the chord length.
For a symmetrical NACA aerofoil, that is aerofoils with the name NACA00xx, there is an equation which describes the shape
where C is the desired chord length and T is the thickness fraction ( for the NACA0012 aerofoil). Standard NACA0012 aerofoil is shown in Figure 4.
3.2. Vented Aerofoil
A selection of vented blades based on the NACA0012 aerofoil have been designed and modelled. The different designs vary by way of number of vents, vent opening thickness and spacing between each vent. A cross section of one of the vented aerofoils is shown in Figure 5. The vent opening is the gap size of each vent. Vent spacing is the distance from the start of one vent to the start of the next vent. The opening ratio of the aerofoil is the ratio of the total opening of all vents to the total thickness of the aerofoil. The vent pattern is symmetric about the chord line. Solid models of the standard and vented blades are presented in Figure 6.
Details of the six varying vented aerofoils are presented in Table 1. Case A corresponds to the standard NACA0012 aerofoil. In other cases, number of vents, vent opening, vent spacing and opening ratio vary.
4. Numerical Simulation
CFD solver was used to carry out a numerical simulation and to determine the aerodynamic characteristics of the vented aerofoils.
The incompressible Navier–Stokes equations are appropriate for solving the VAWT aerodynamics, because the resultant flow velocity has generally the Mach number less than 0.3. Unlike the aerofoil blades in an aircraft, VAWT blades experience high AOAs beyond the stall angle, when they operate at a low TSR (). Due to the symmetrical nature of aerofoils, and also to reduce computational expense, RANS investigation is performed in 2D domain.
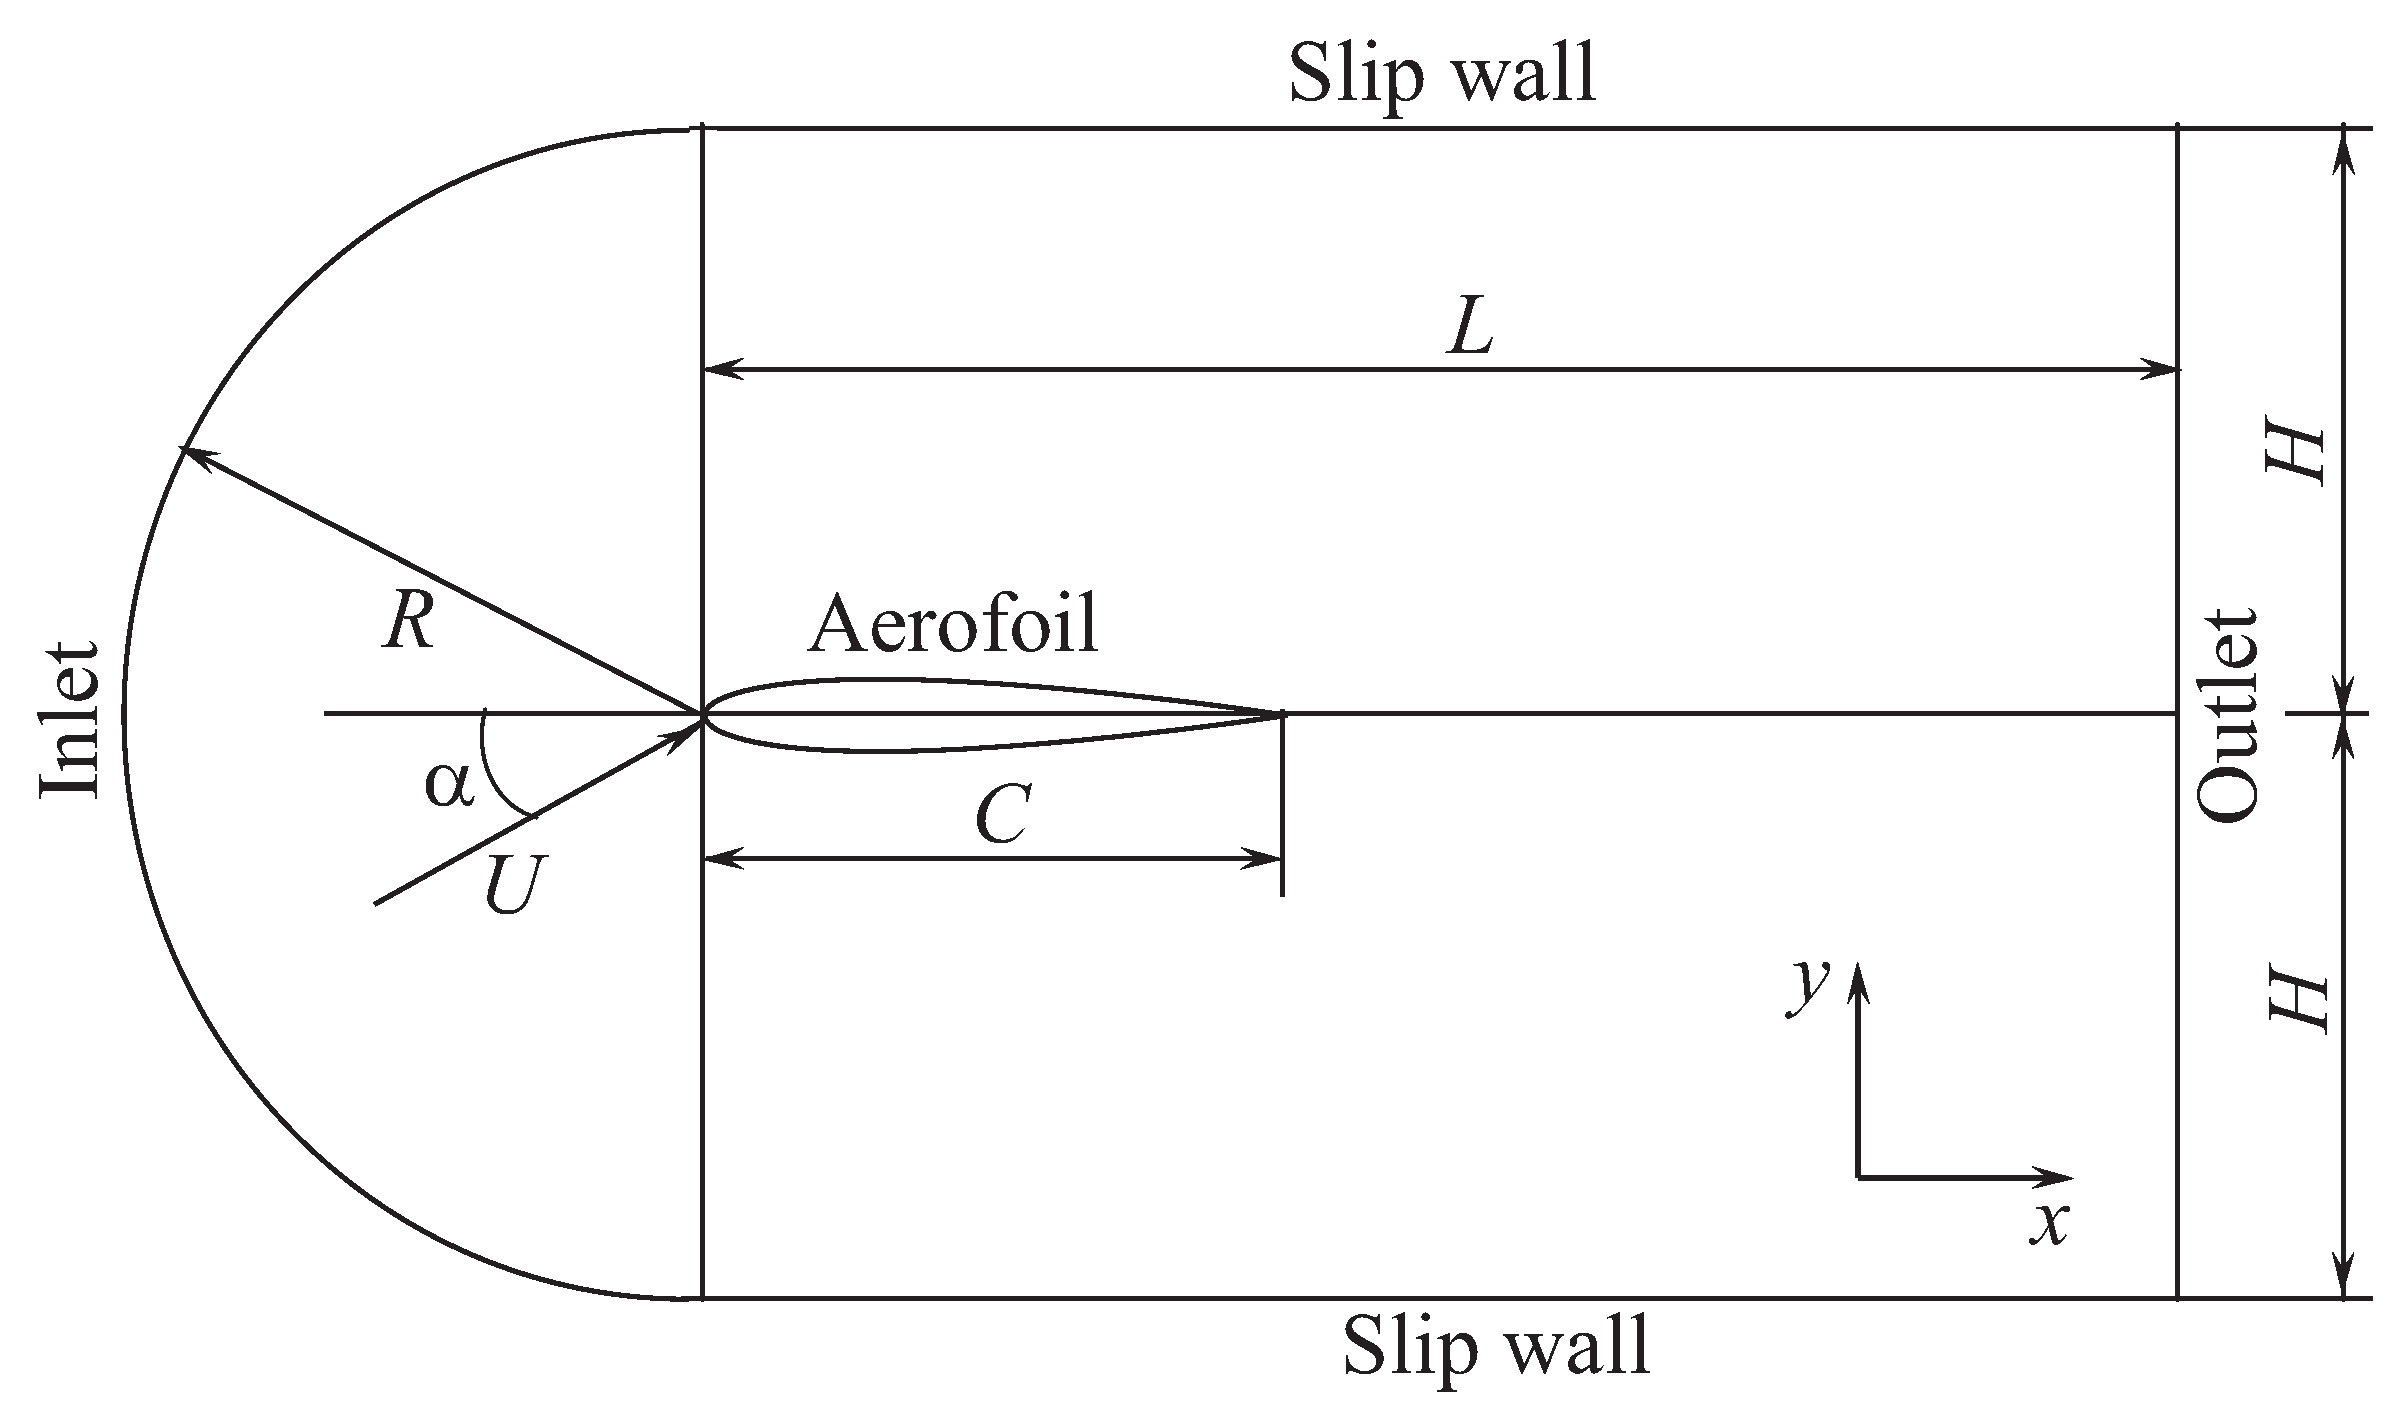
Figure 7 shows the geometric scheme and boundary conditions in the CFD model of a single aerofoil. In 3D calculations, the domain is extruded some thickness in the spanwise direction depending on AOA. The inlet boundary is a semi-circular boundary with radius and centre located at the tip of the aerofoil when the AOA is zero degrees. The inlet boundary is located far away from the aerofoil to avoid wave reflection. The AOA is adjusted by rotating the aerofoil about the mid-point of the chord line and is measured relative to the x axis. The length of the domain is the distance from the aerofoil tip to the outlet and .
Free stream velocity corresponding to the Reynolds number and degree of turbulence (about 5%) are specified on the inlet boundary. Top and bottom boundaries are treated as free-slip walls. No-slip and no-penetration boundary conditions are applied to the aerofoil. Non-reflecting boundary conditions are used on the outlet boundary. Periodic boundary conditions are used in spanwise direction.
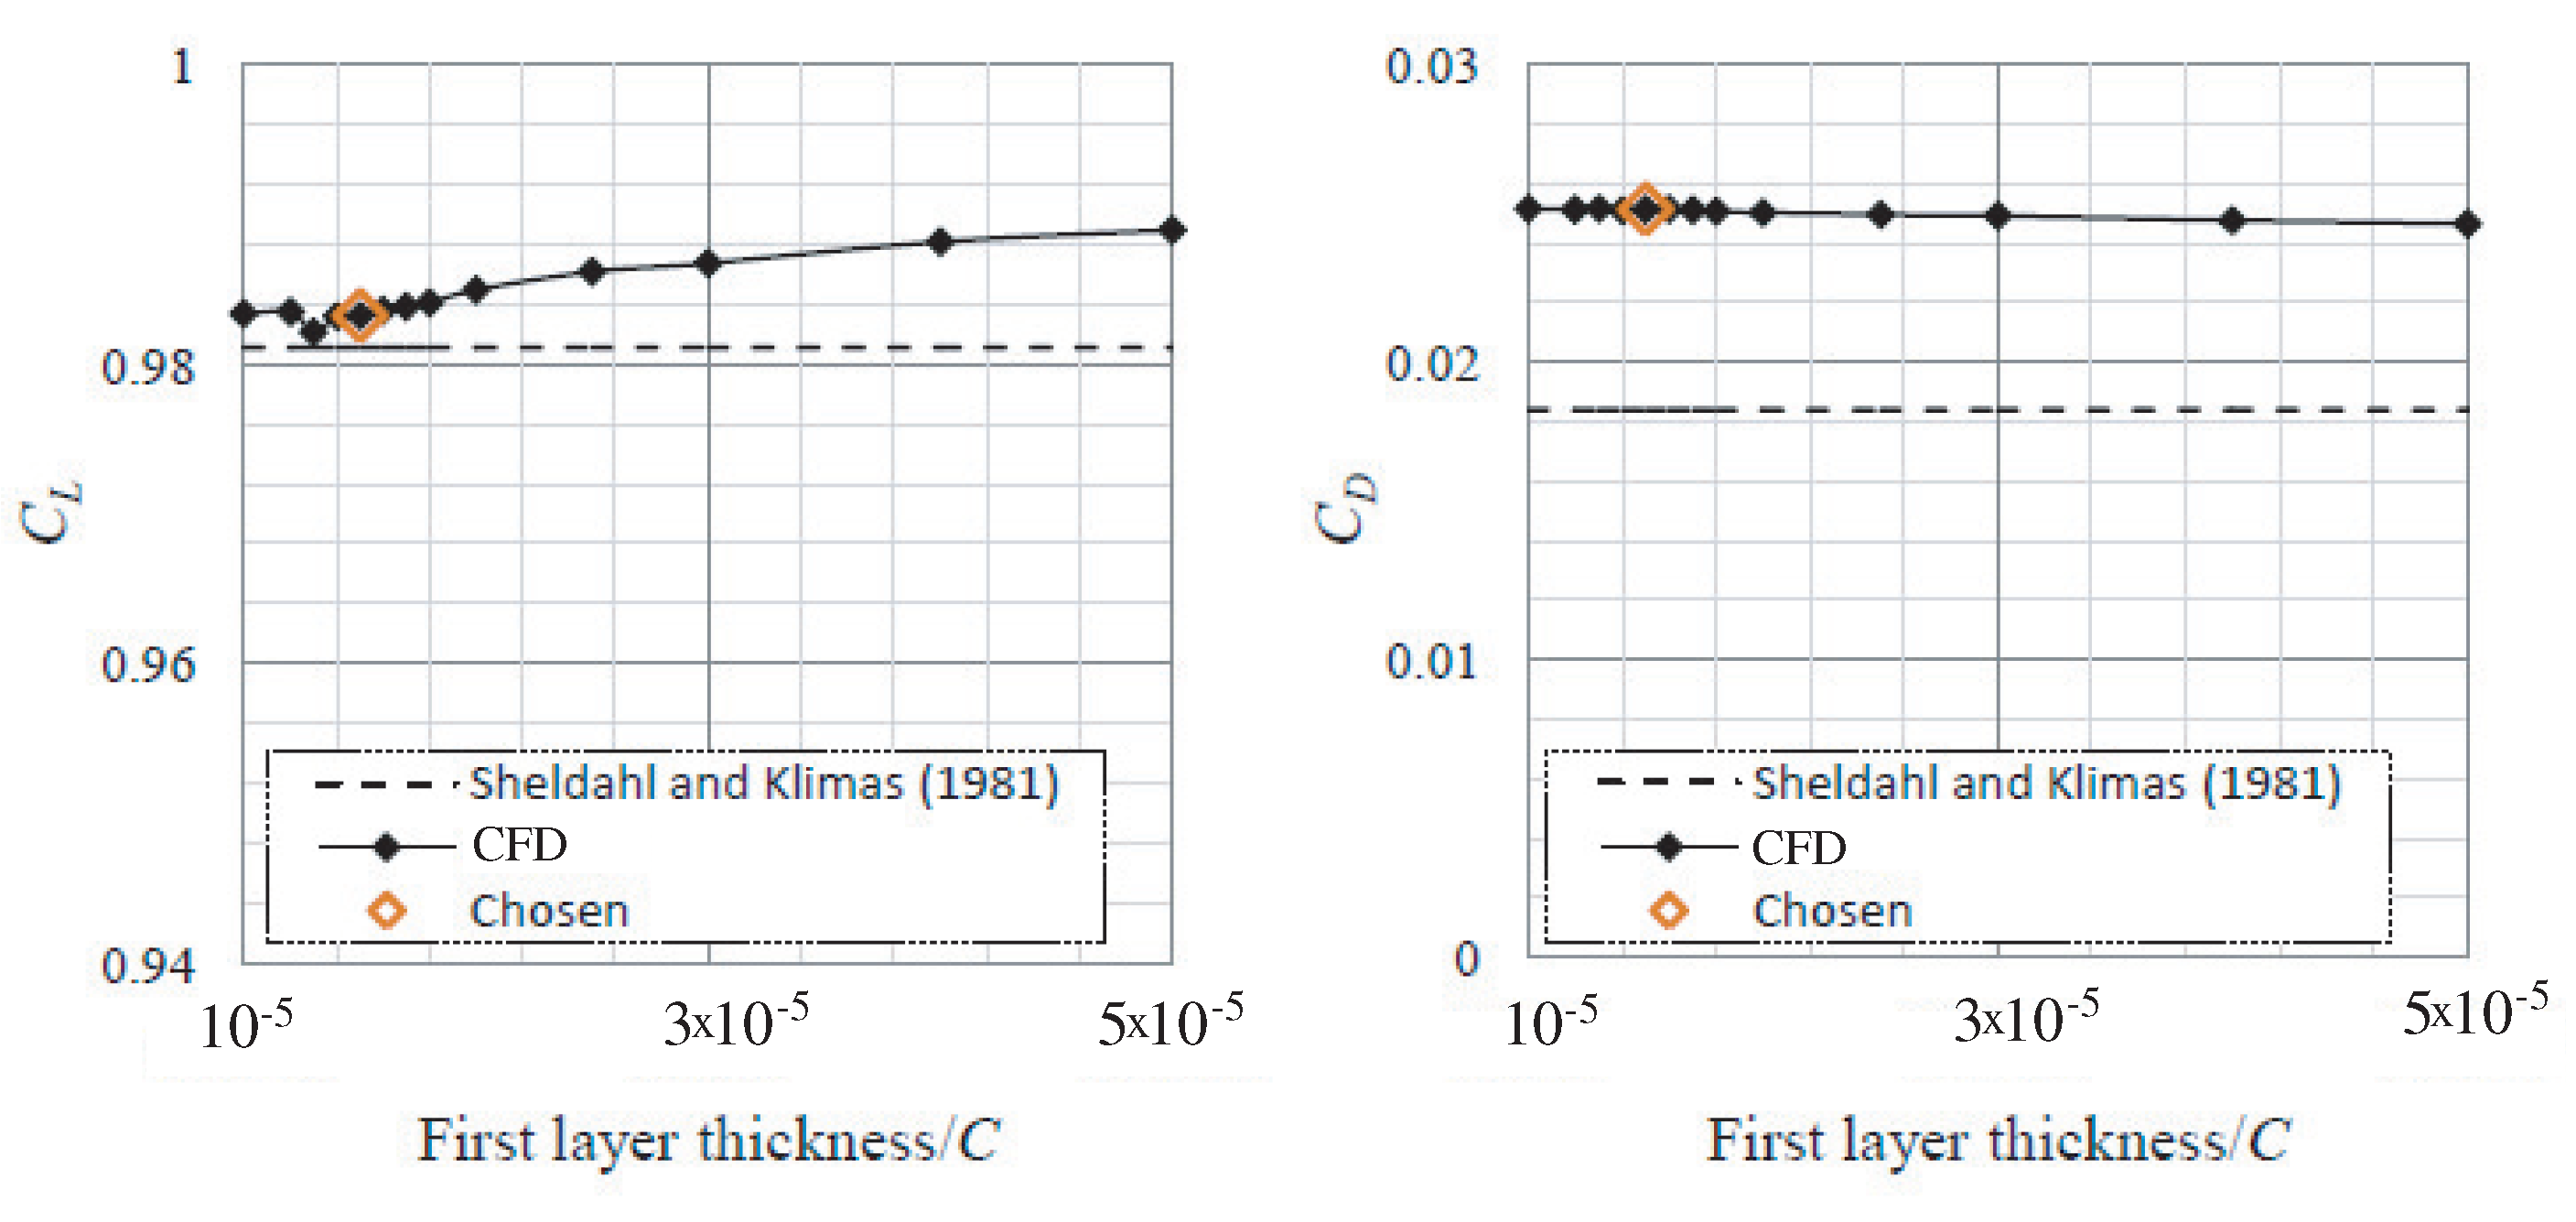
SST turbulence model puts certain requirements on the properties of the mesh to enable the acquisition of an accurate flow prediction. In the near-wall region, the SST model requires a yplus value of . Another requirement of the SST model is that the boundary layer must be resolved by at least 15 mesh points (or mesh layers). The first layer thickness that should yield a desired yplus and the boundary layer thickness are estimated using the semi-empirical correlations for the flat plate. The mesh resolution is optimized for the highest Reynolds number used in this study ().
The RANS simulations have been performed using a first layer thickness as low as . In all cases a growth rate of 1.2 is used for the inflation layer and it is ensured there are enough layers that the inflation layer entirely covers the boundary layer. In the case of the chosen first layer thickness of , 26 layers were required to ensure the inflation layer completely covered the boundary layer. In all calculations, yplus coordinate is uniformly distributed along aerofoil except small area near the stagnation point where yplus is about 1.
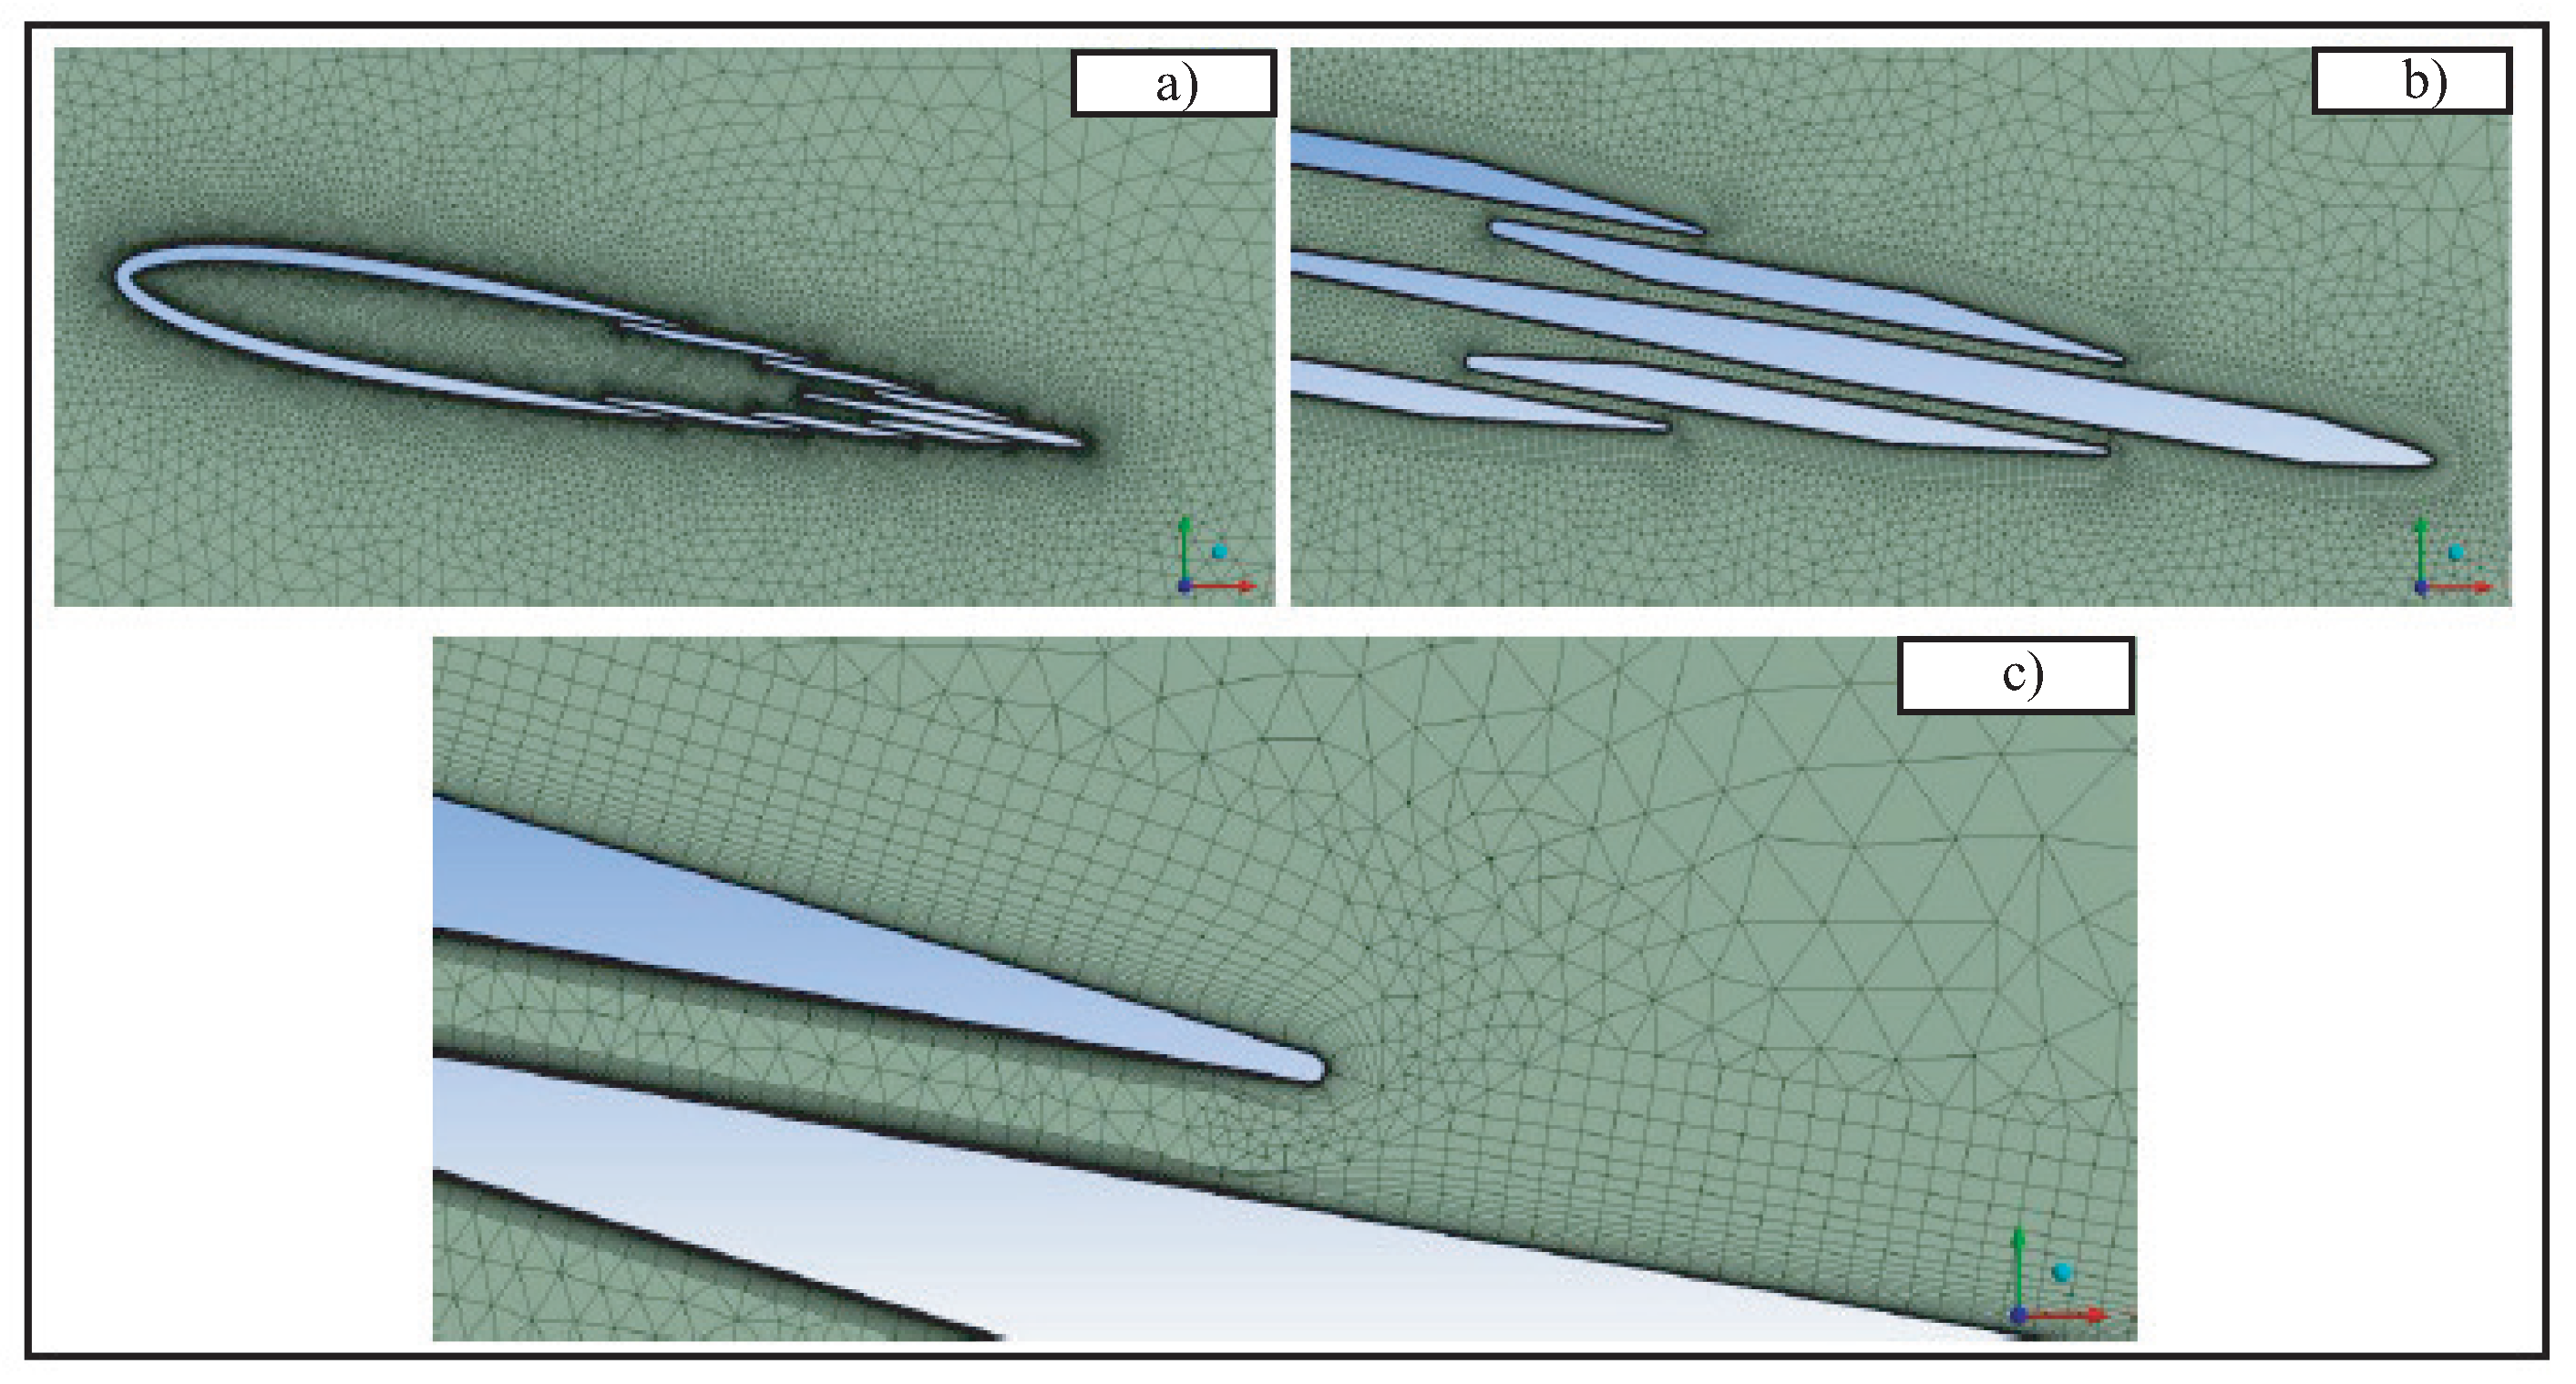
A hybrid mesh which combines a structured mesh in the near wall region and unstructured mesh in the remaining part of the computational domain is used. A mesh convergence study to find the optimum mesh parameters has been carried out on the standard NACA0012 aerofoil at an AOA of 10° and a Reynolds number of . These optimum parameters are given in Table 2.
To allow for proper comparison between the standard aerofoil and the vented aerofoil, similar meshes are used, so all the parameters listed in Table 2 apply to the vented aerofoil mesh too. Additional information on the vented aerofoil mesh is given in Table 3. The inflation layer on the inner part of the vented aerofoil is reduced to allow it to fit inside the vents so there is a separate setting for the inflation on the inner part of the aerofoil.
Figure 8 shows transition from the outer inflation layer settings to the inner the inflation layer on the vented aerofoil. Having to mesh inside the vented aerofoil demonstrates the reason behind using a hybrid mesh with unstructured elements beyond the inflation layer.
Figure 9 shows how the predicted values of lift and drag converge as the first layer thickness is reduced. For reference, the experimental values for the NACA0012 as measured by [4] at are displayed.
The segregated approach was selected to solve the discretized continuity and momentum equations, and a second-order implicit formula was used for the temporal discretization. The SIMPLEC scheme was used to solve the pressure–velocity coupling. In the SST model, the second-order upwind discretization scheme and third-order MUSCL discretization scheme were applied for pressure and other variables, respectively.
5. Results and Discussion
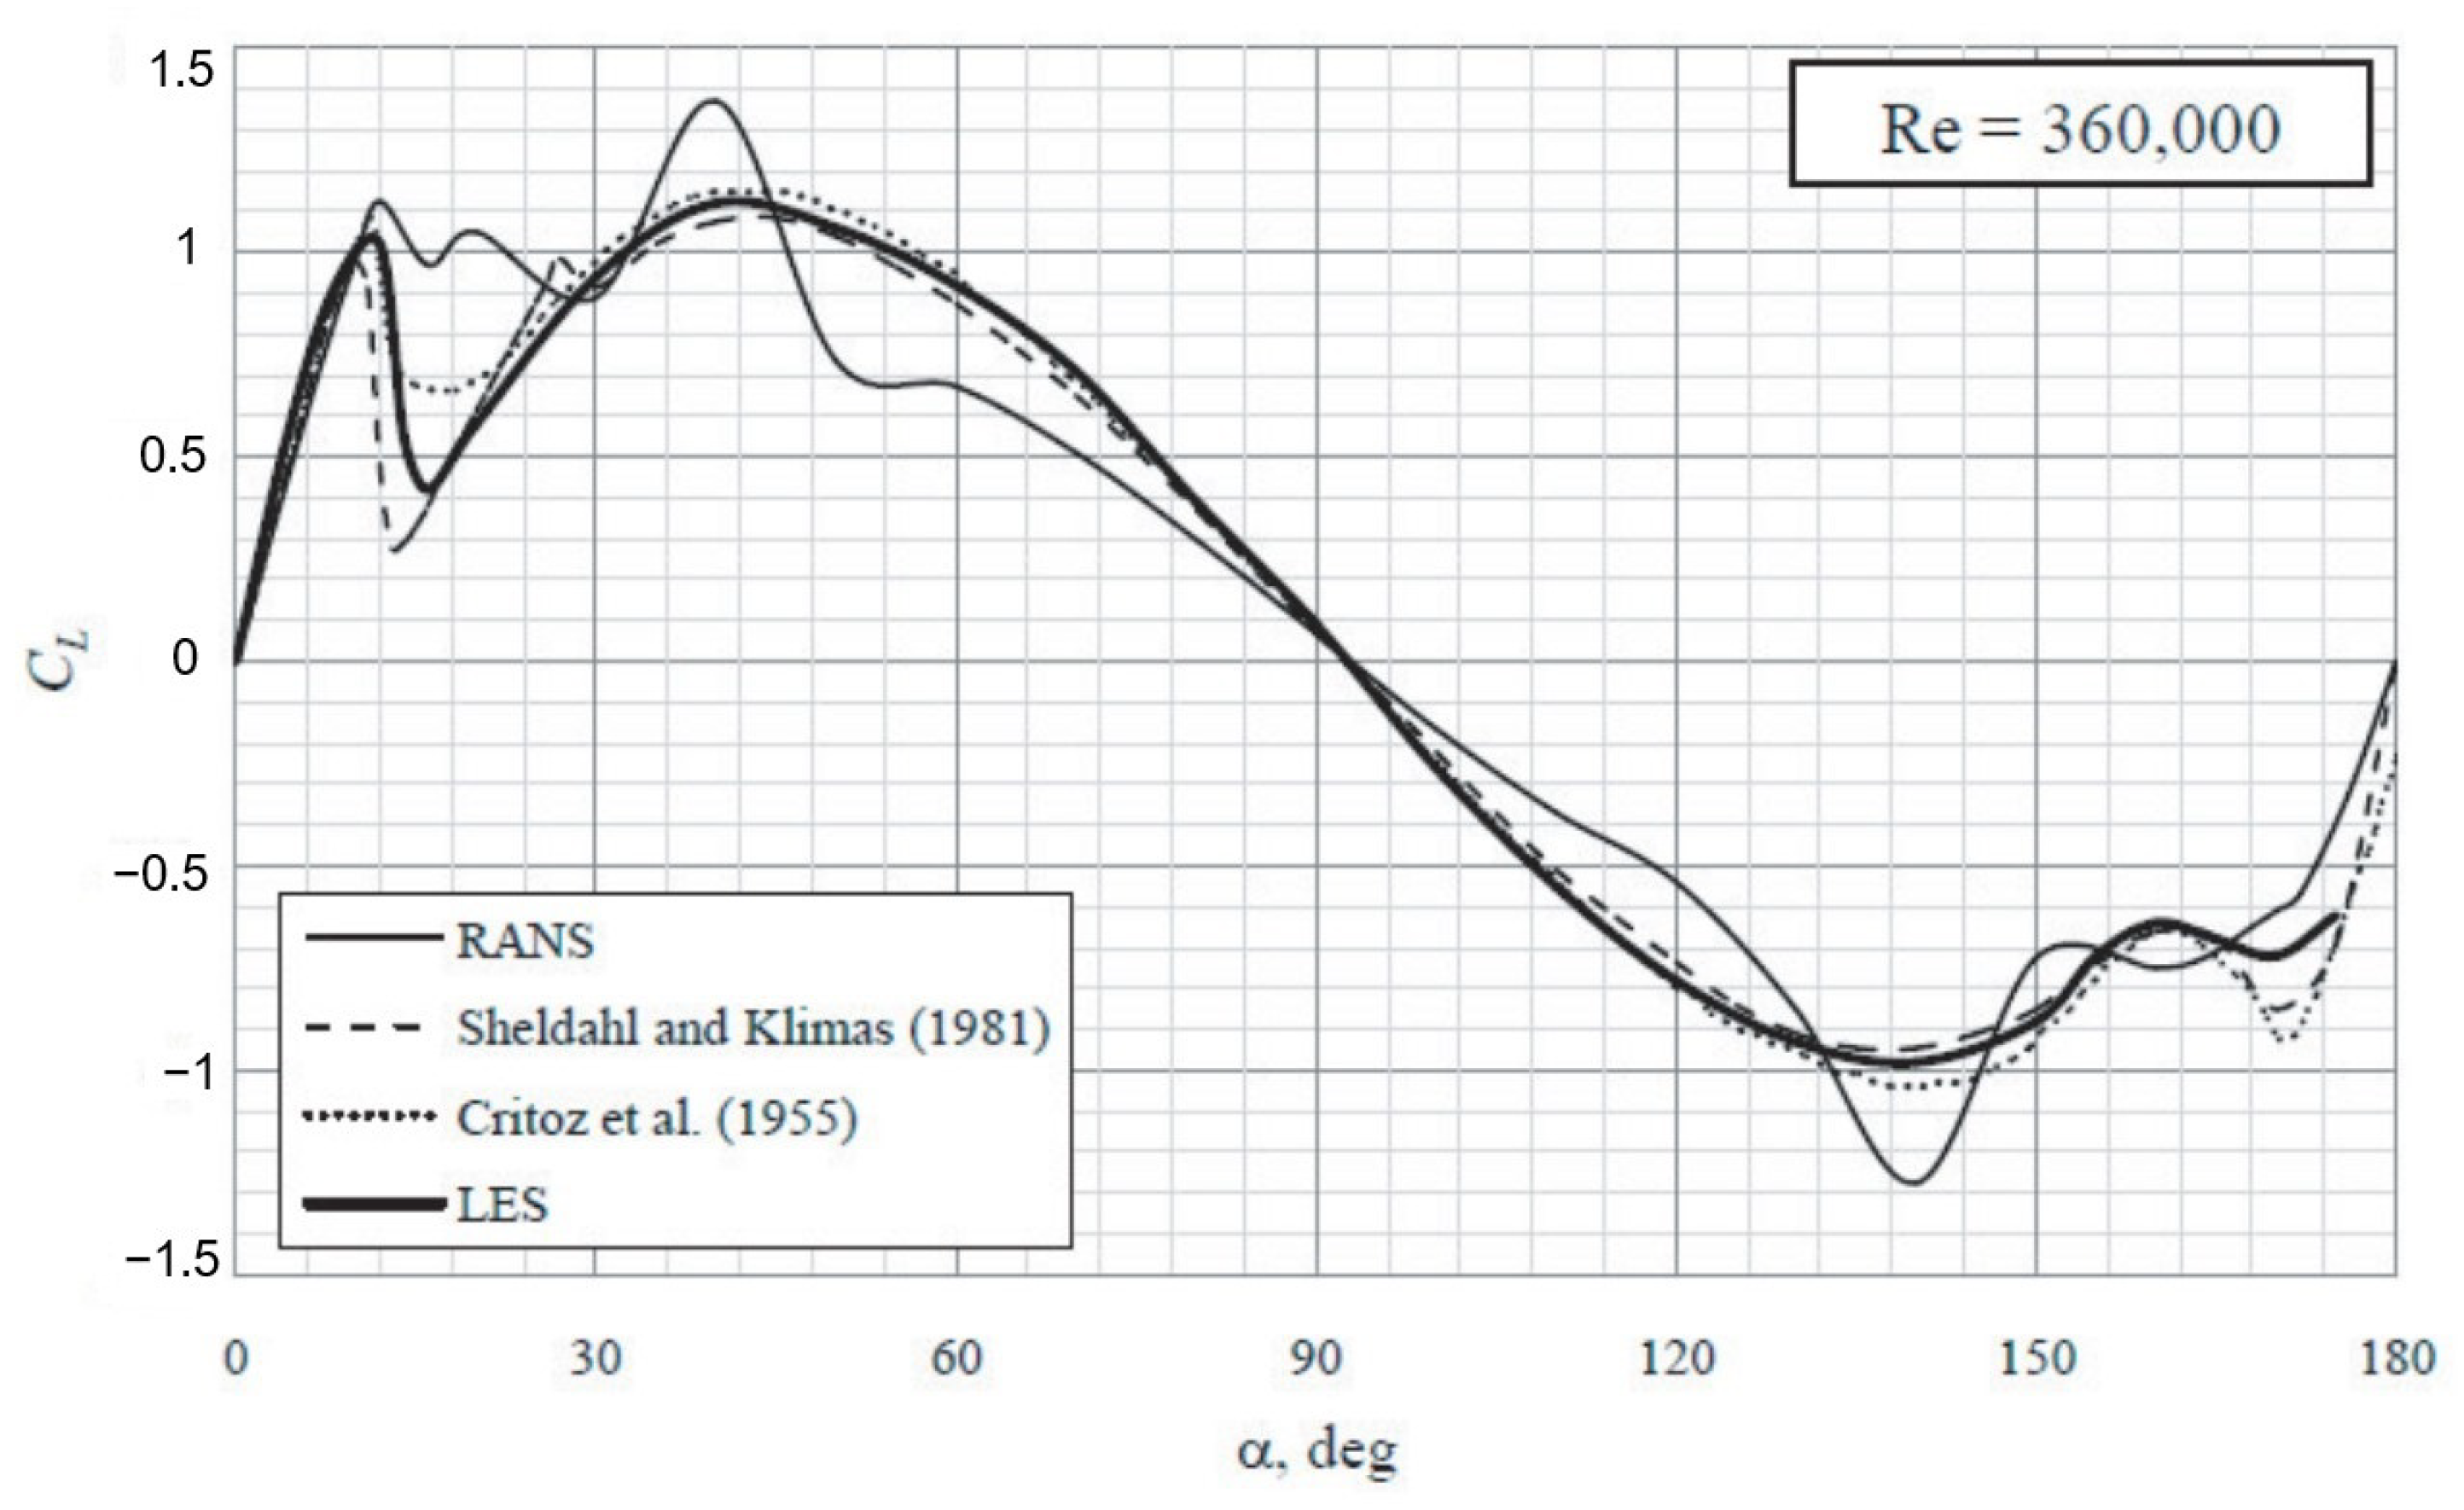
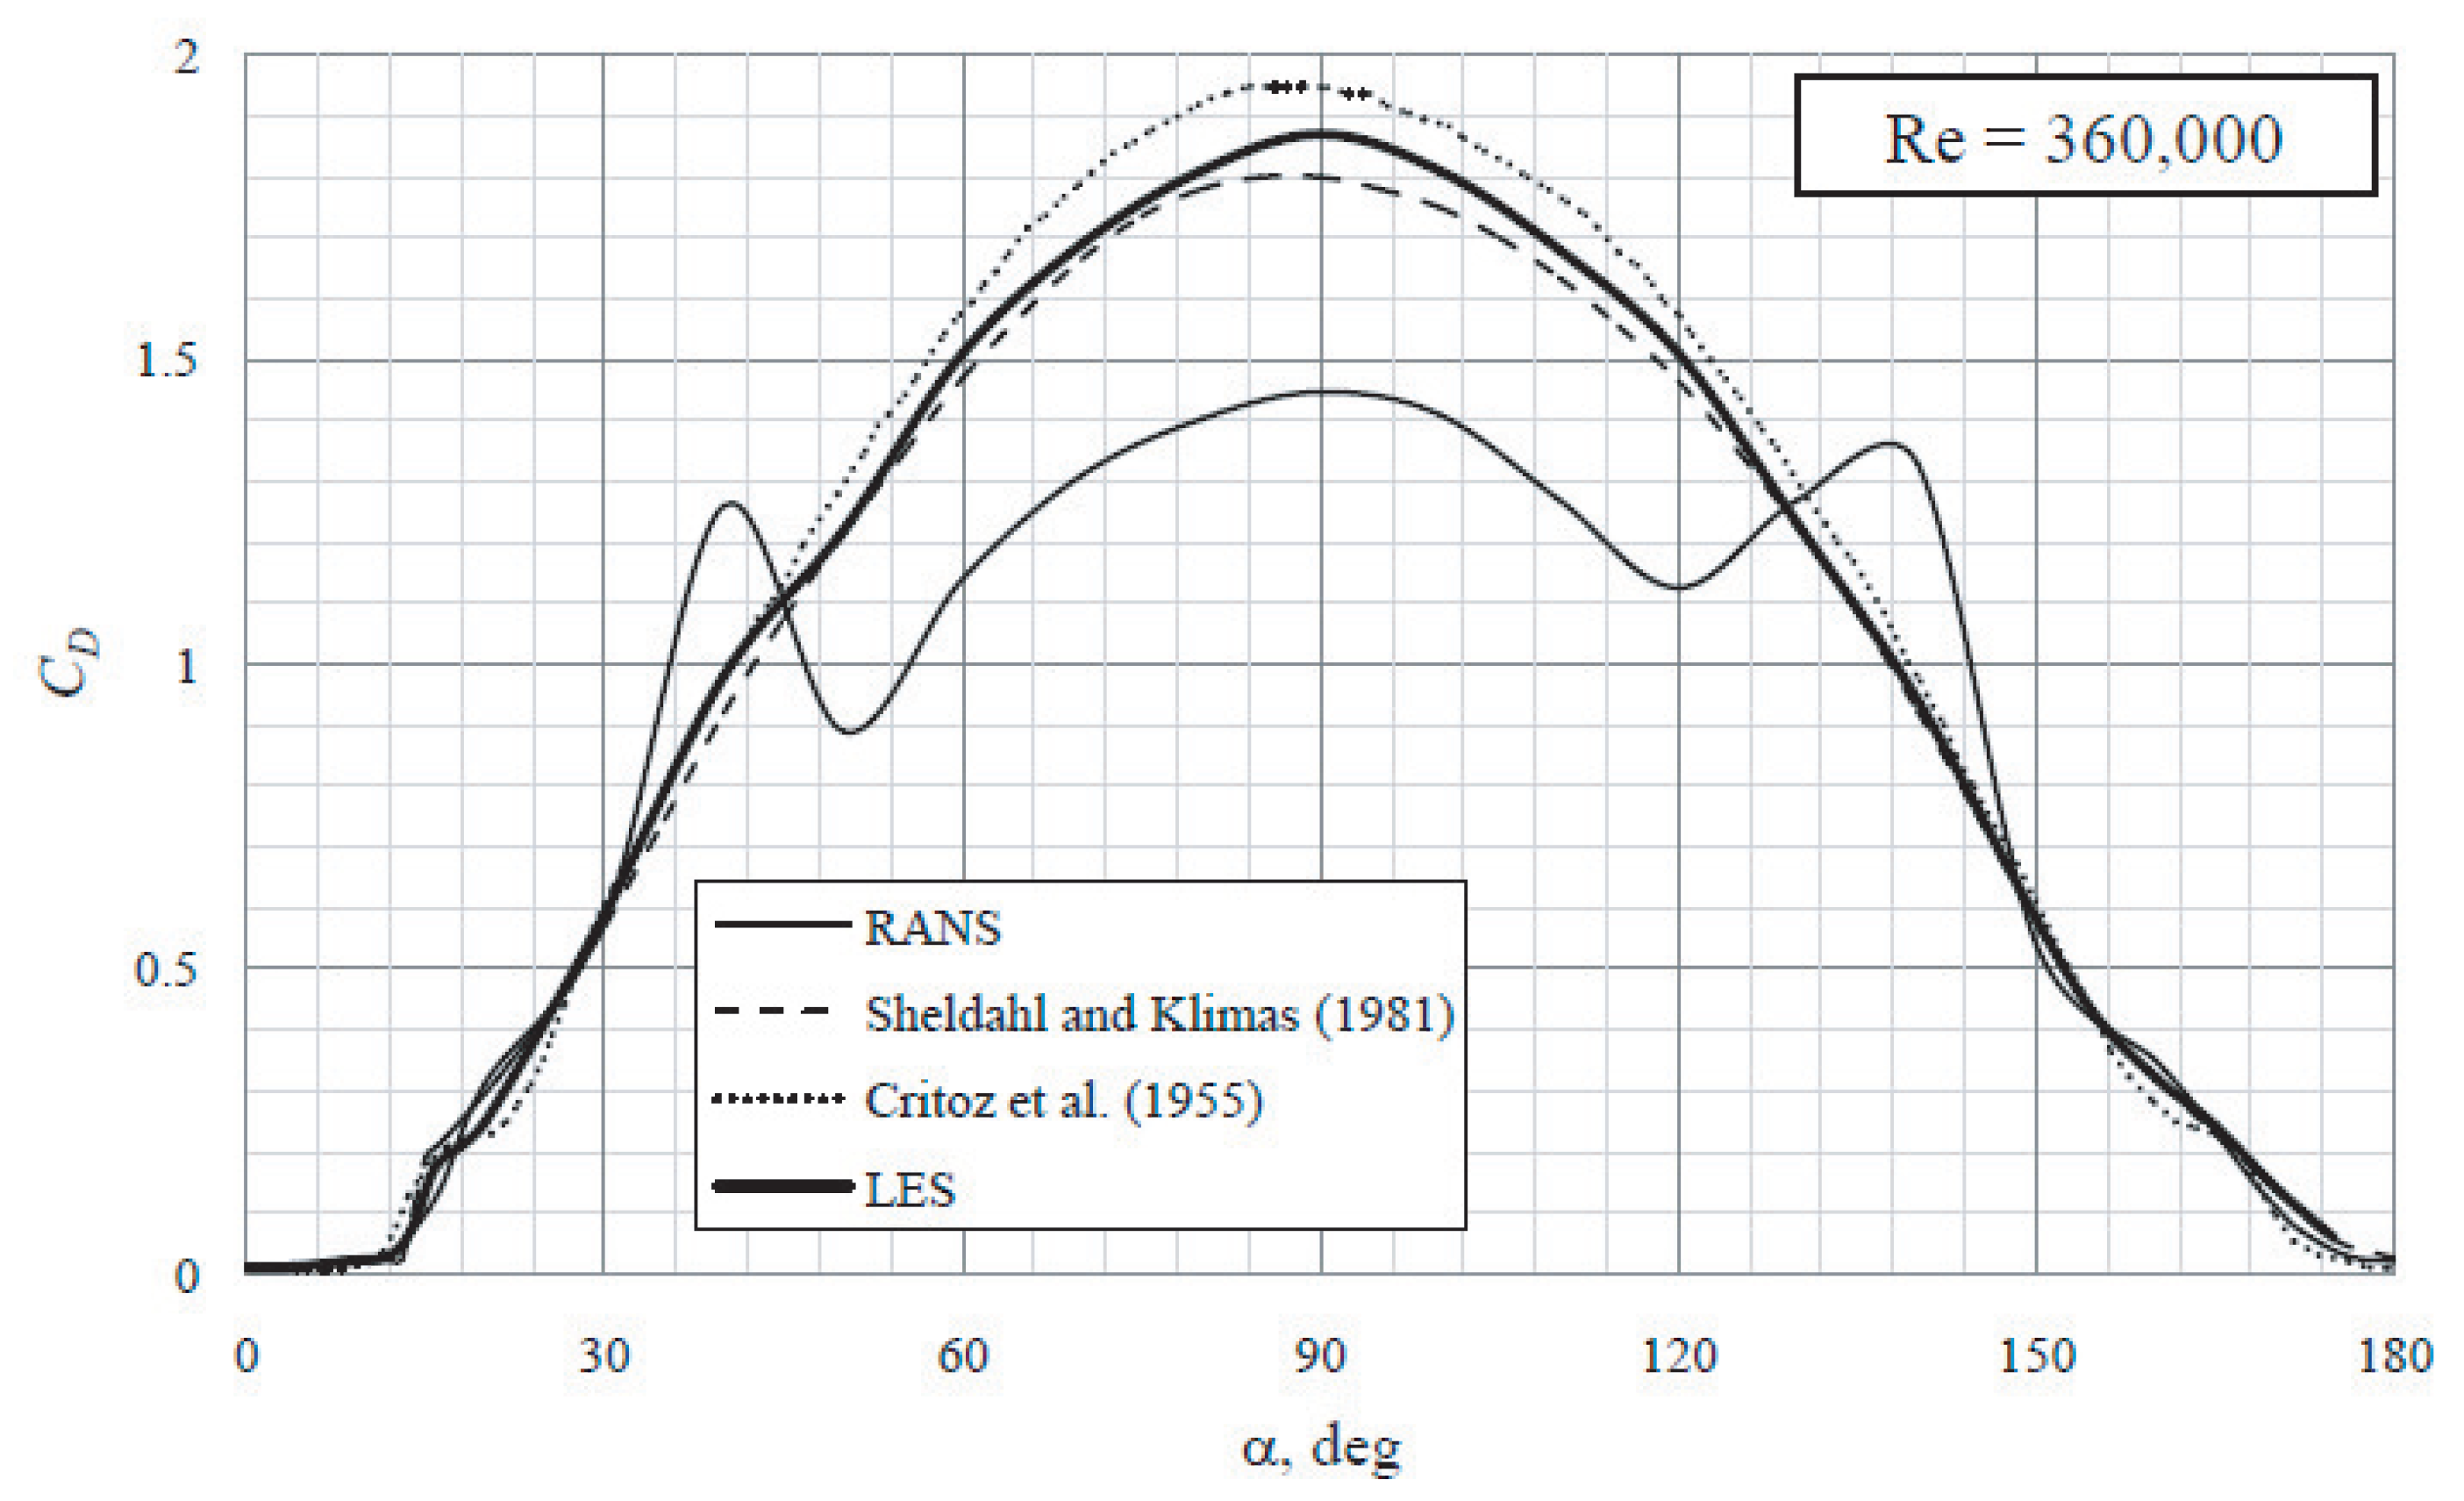
The results obtained for the standard NACA0012 aerofoil are validated against that which has been produced in previous experimental works and CFD predictions. Simulations have been performed for a range of AOAs from 0 to 180 degrees in steps no greater than 10° at and . Figure 10 and Figure 11 show that overall there is a good similarity between the experimental measurements of [2,3,4,5], and the CFD predictions. At = 30° there is excellent agreement between all observations and the CFD predictions based on RANS and LES, but then at = 40° the CFD predicts sharp peaks in lift and drag which were not observed experimentally. The wind tunnel results show a hysteresis loop caused by a deep stall, which may have been induced by the slow rolling of the aerofoil section in the wind tunnel experiments. In CFD simulations, the aerofoils at different AOAs were completely static, and thus no such a hysteresis loop could be observed.
Comparison with data from previous works [4,7] shows that results obtained with SST model are acceptable (these results are not presented here). Some notable difference include the two peaks in lift at AOA of 40 and 140 degrees which have been overpredicted by the SST model. This is likely due to the SST model’s failure to predict large scale turbulence which has been seen to occur at this AOA [11]. In addition, the onset of stall has been predicted slightly later than both experimental observations from [4,7]. Despite these variations from previous works, it is judged that the model used in this investigation is adequate to at least make an initial comparison between the aerodynamic characteristics of a standard aerofoil and a vented aerofoil.
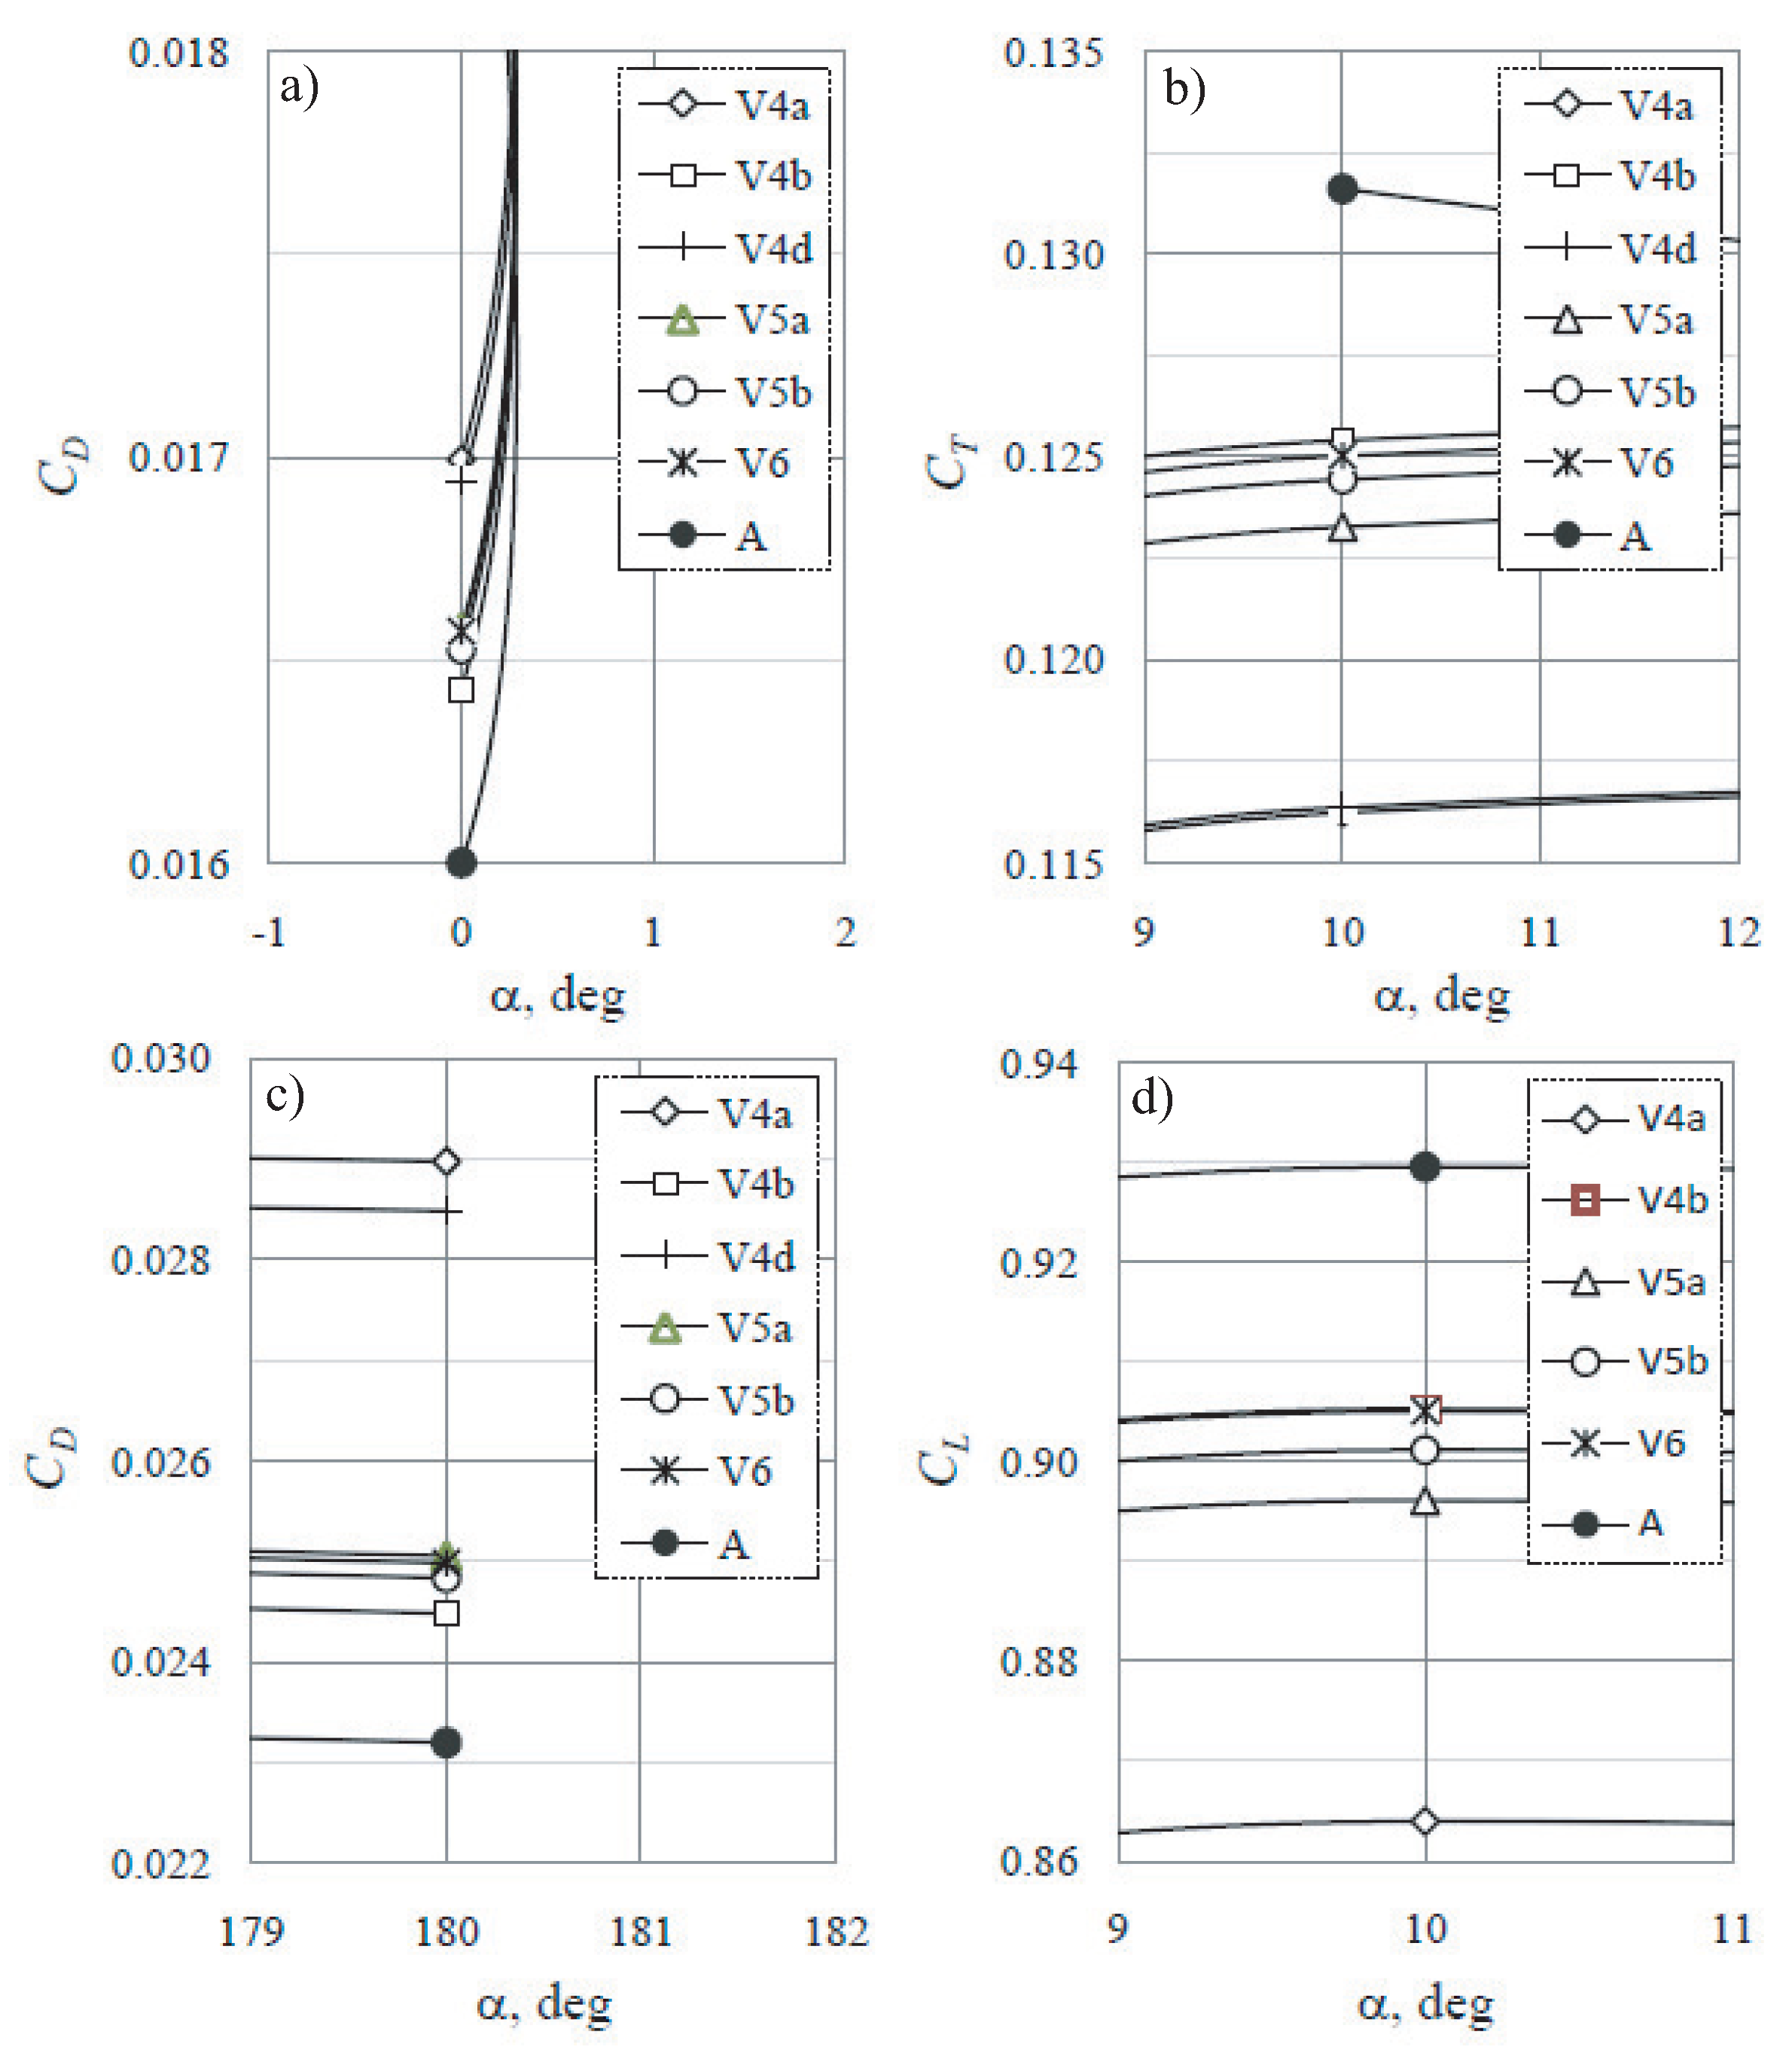
Initial simulations were performed with all the aerofoils described in Table 1 at for AOAs of 0°, 10°, and 180°. Selected results are shown in Figure 12.
Figure 12a shows that there is an increase in drag with all the vented aerofoils compared with the standard NACA0012 aerofoil (denoted A in the figure) at an AOA of zero degrees. This result was expected, but to maintain performance at high TSRs as little increase as possible is required. Of all the vented aerofoils, the V4a and V4d (the aerofoils with the biggest opening ratio) show the largest increase in drag. The V4b case with the smallest opening ratio shows a marginally smaller increase in drag compared to the other three vented aerofoils.
Aerofoils show the biggest variation from the standard aerofoil. reduction in tangential force at an AOA of 10°, which again was expected, and leads to a reduced performance of the VAWT at high TSRs. Furthermore, like at AOA of zero degrees, the V4a and V4d aerofoils show the biggest variation from the standard aerofoil.
Figure 12c shows the drag characteristics of the vented aerofoils as compared to the standard aerofoil at an AOA of 180°. This is an indicator as to the effect the blade may have on the performance of a VAWT at low TSRs. All vented aerofoils show an increase in drag, but the vented aerofoils V4a and V4d give a significant increases compared to the other vented aerofoils.
Figure 12d shows that the lifts experienced by all aerofoils as a function of AOA are similar. Vented aerofoils give slightly less lift compared to the standard aerofoil.
The V4a design greatly increased drag at AOA of 180°. This is due to it having the highest opening ratio of all designs. However, because it also has the largest vent opening, the V4a design exhibits the greatest decrease in axial force at AOA of 10°. Due to the desire to reduce axial force as little as possible for AOAs between 0 and 90 degrees, it is decided to use the V6 design for the investigation over a full range of AOAs between 0 and 180 degrees.
To continue this investigation, the aerodynamic characteristics of the vented aerofoils V4a and V6 (with the open inside) and V4d (with the closed inside) for a range of AOAs from 0 to 180 degrees are predicted and compared to those of the standard NACA0012 aerofoil. Simulations were performed using the V6 vented aerofoil design at and for a full range of AOAs from 0 to 180 degrees in steps of 10 degrees.
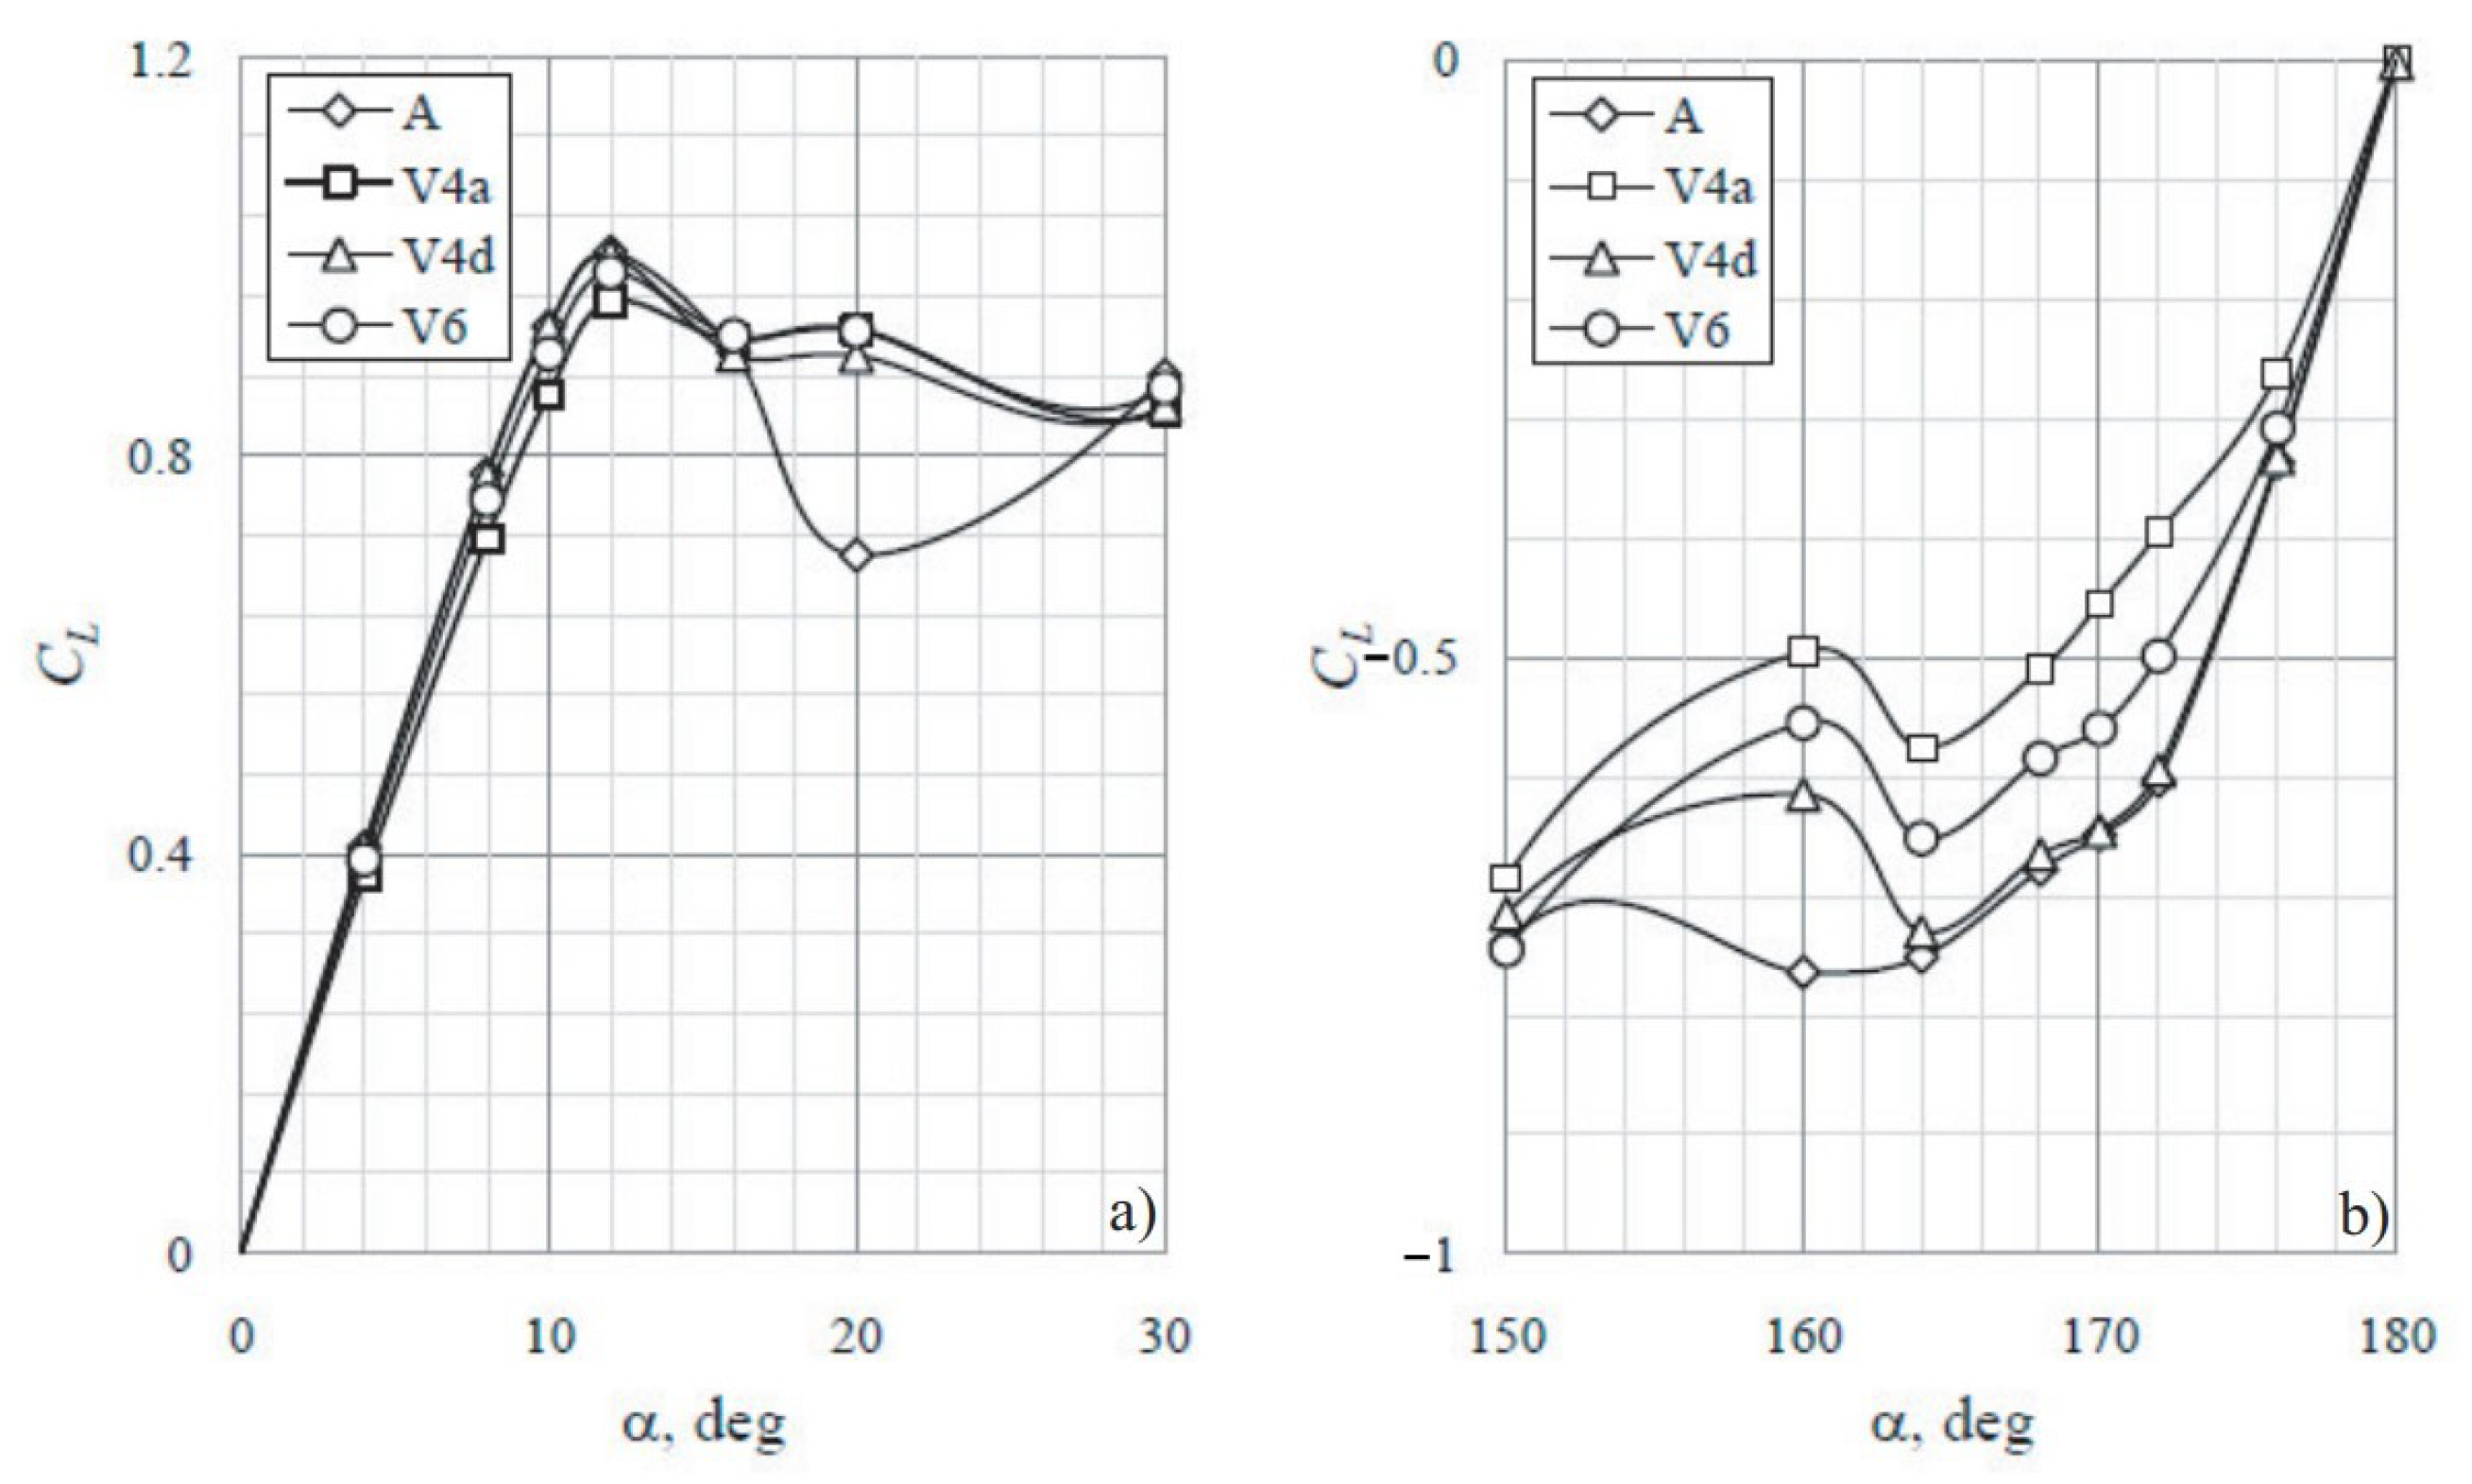
Figure 13 shows how the coefficient of lift varies as a function of AOA for the different geometries. From 0 to 16 degrees there appears to be little variation, but at = 20° the standard aerofoil shows a pronounced dip in lift compared to all three vented aerofoils. A peak in lift occurs at = 40°, at which point the standard aerofoil produces the most lift, closely followed by the vented V6 aerofoil (which features the smallest vent opening size). The V4d (which has a closed internal structure) produces slightly less lift, followed by the V4a aerofoil which produces the least. From 50 to 120 degrees, there appears to be little variation in lift. At = 130° the standard aerofoil shows a pronounced increase in lift compared to all three vented aerofoils, before all four geometries exhibit a peak at = 140° with properties similar to that which occurred at = 40°. At = 150° all four geometries show very similar lift, but beyond this angle the greatest variation between geometries occurs. From 160 to 180 degrees the vented aerofoils V4a and V6 with the open inside geometry show a significant reduction in lift compared to that of the standard aerofoil (case A) and the vented V4d closed inside aerofoil.
Figure 14 allows for closer inspection of the lift characteristics of the aerofoil and shows there is a slight reduction in lift at the low, pre-stall AOAs from the vented V4a and to a lesser extent from the V6 aerofoil. The V4d closed inside aerofoil, however, matches the performance of the standard aerofoil. This trend is also seen at the high AOAs (between 164 and 180 degrees), but with a more pronounced difference. At AOA of 160°, unlike the previously discussed trend, all three vented aerofoils experience a reduction in lift that is not experienced by the standard aerofoil.
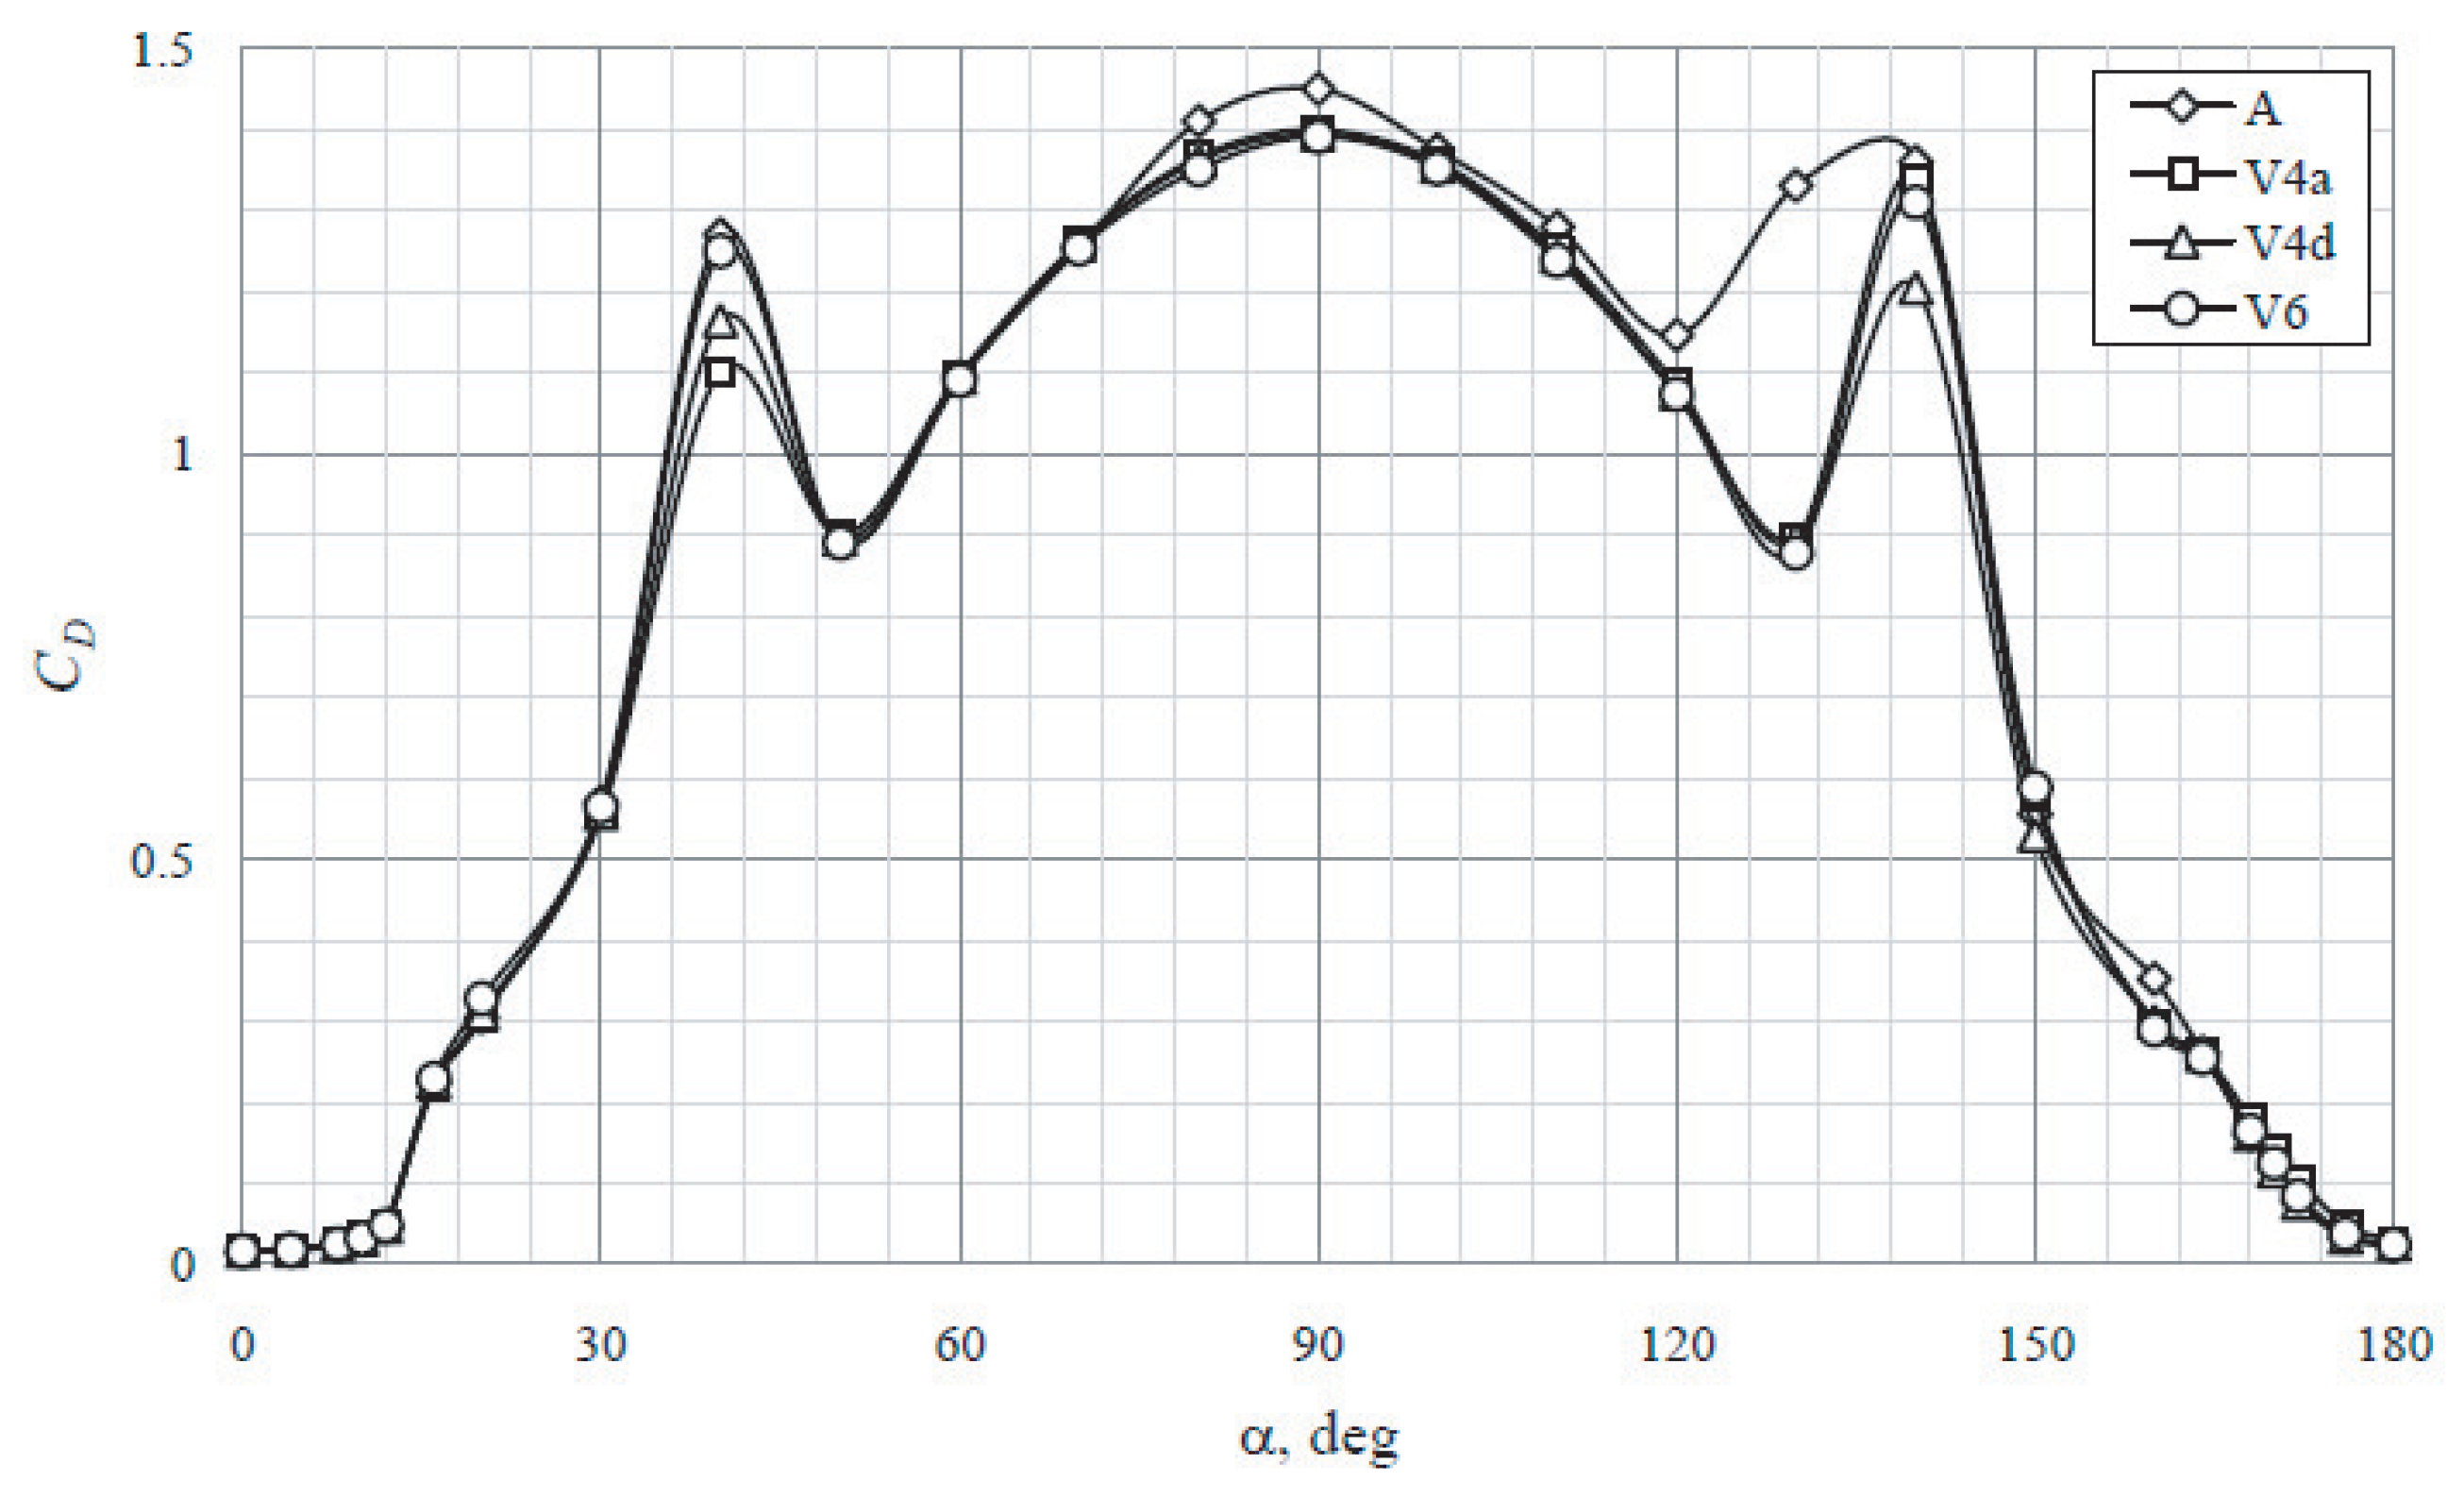
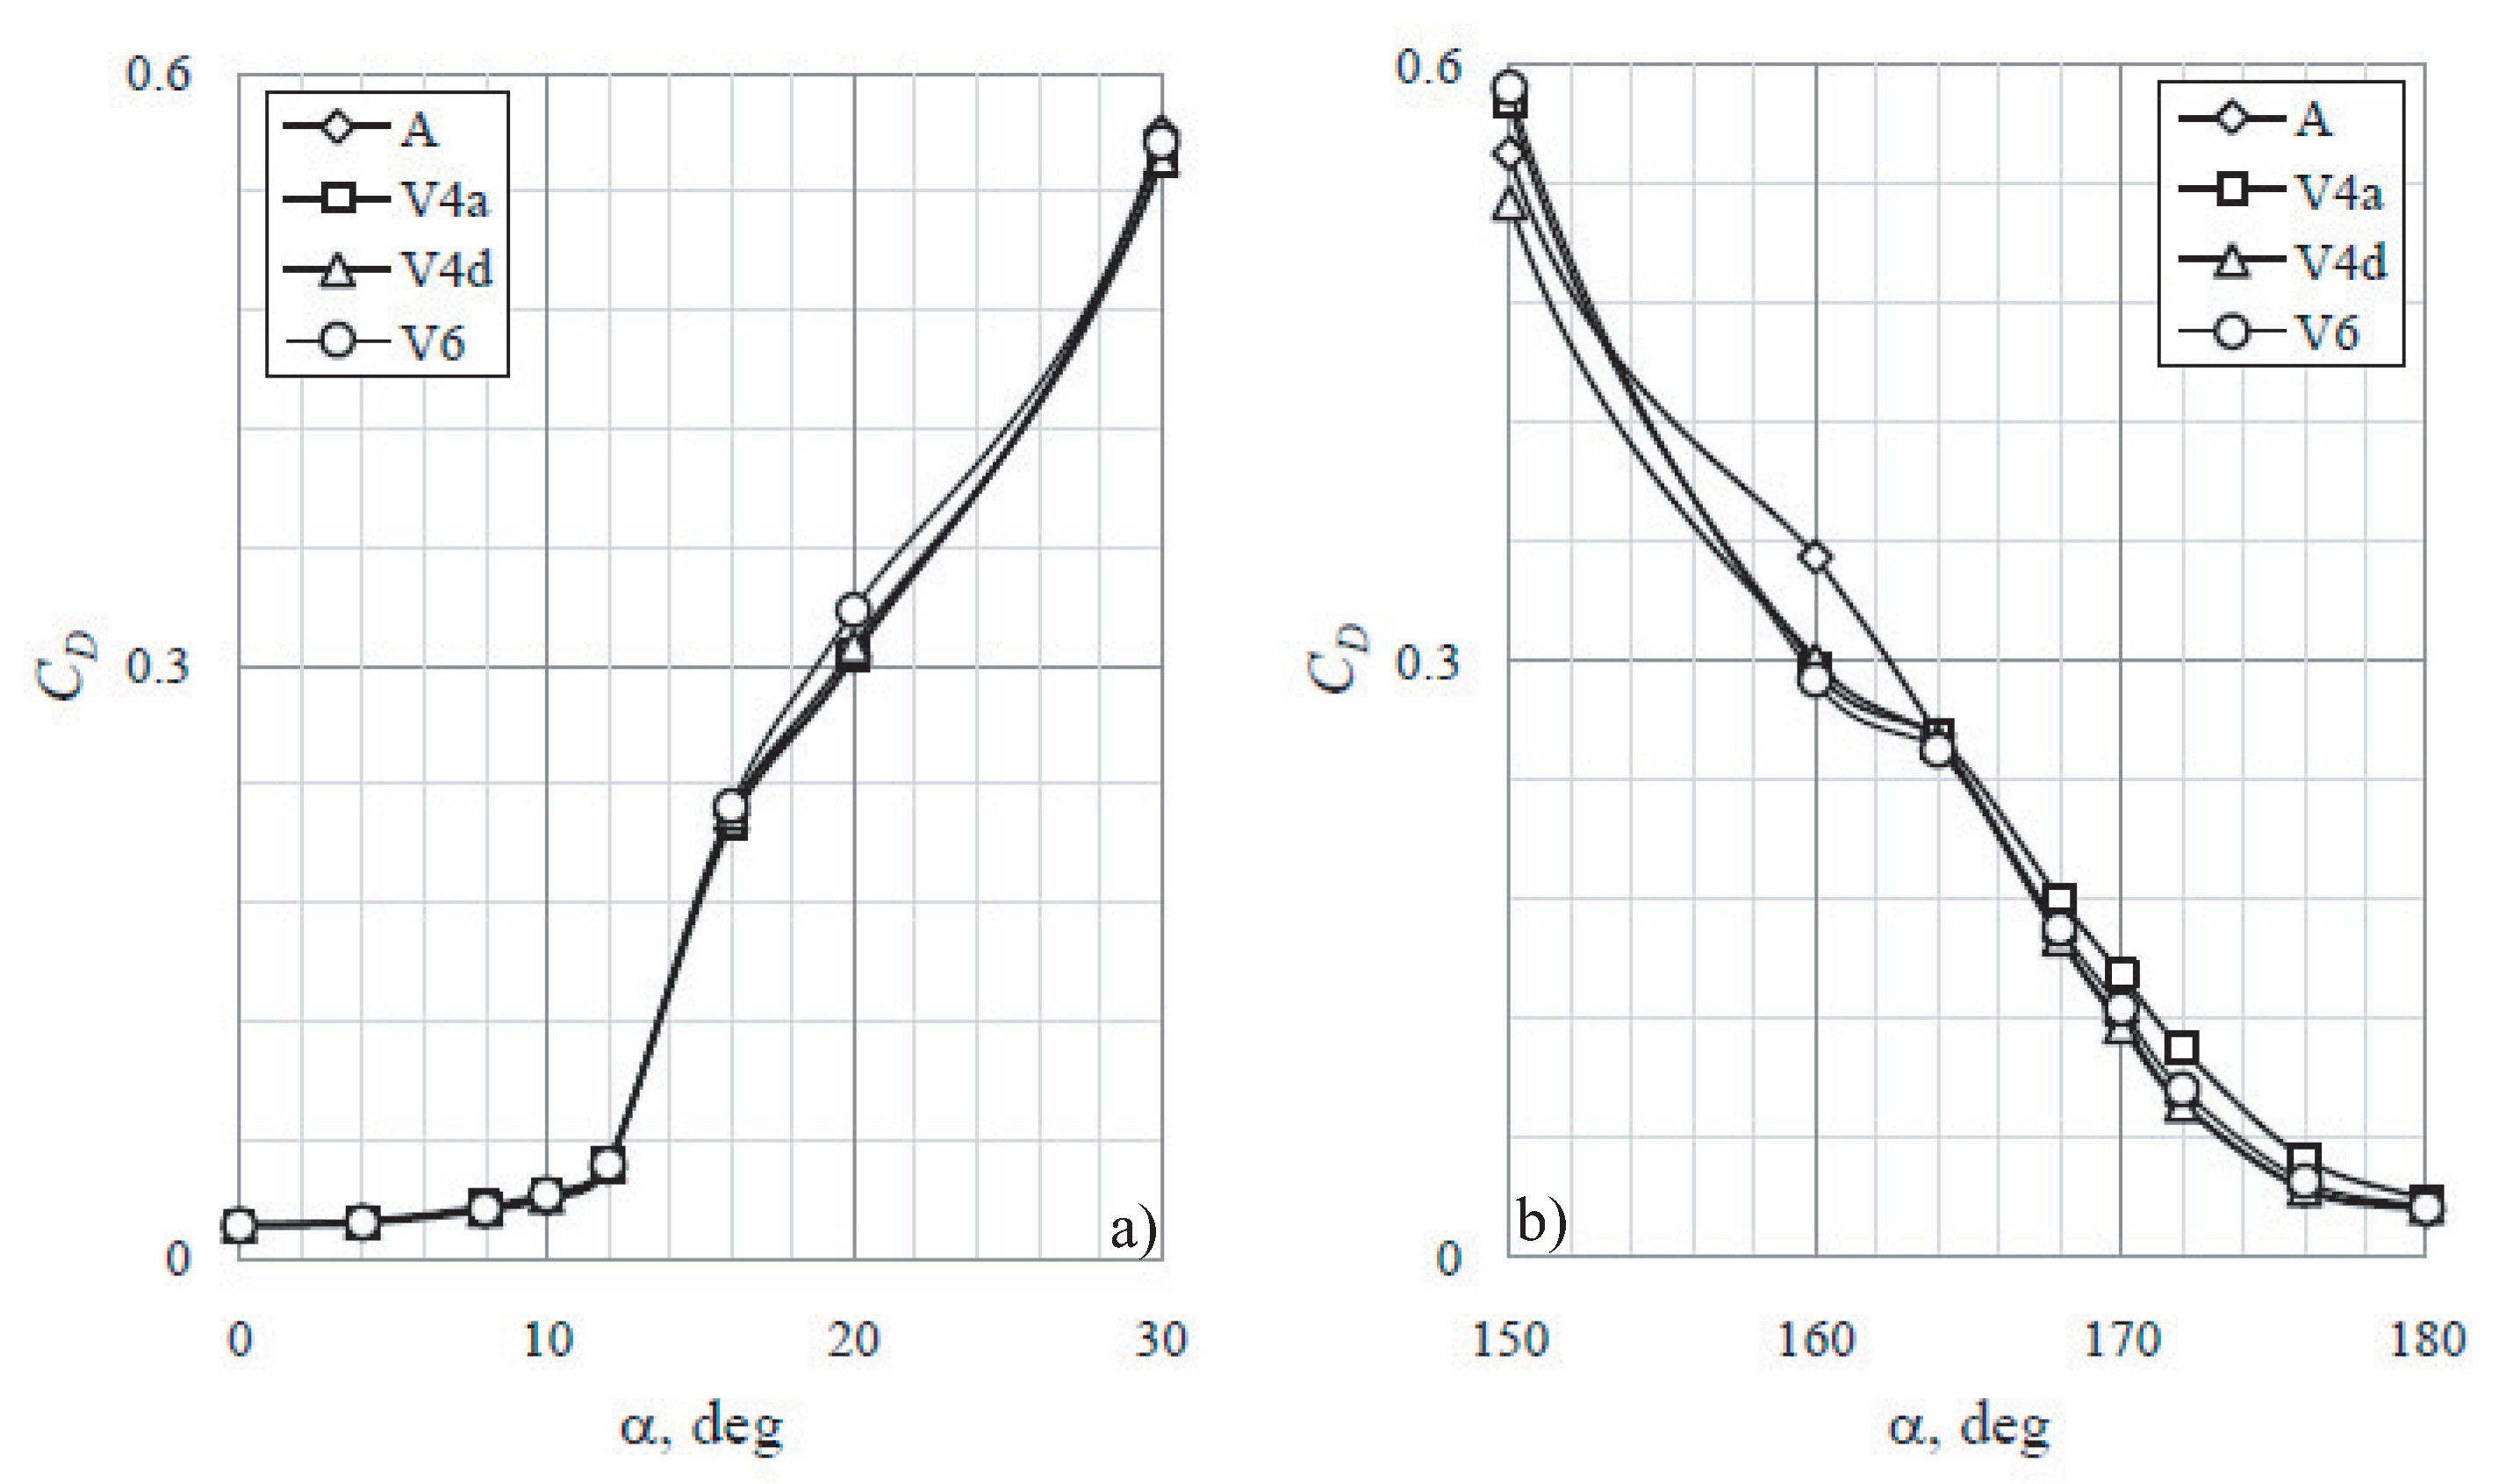
The variation in the coefficient of drag properties for the four aerofoils is presented in Figure 15 and in more detail in Figure 16. There is much less variation between the different aerofoils’ drag properties than there is for lift. A noticeable difference occurs at AOA of 40° where all aerofoils show a discontinuity and peak in drag with the standard aerofoil experiencing the highest drag of all. There is a similar peak at AOA of 140° where similar results are observed. Around AOA of 90° the standard aerofoil again shows a slight increase in drag compared to the vented aerofoils. Beyond AOA of 164° the vented V4a aerofoil experiences the highest drag as was initially expected.
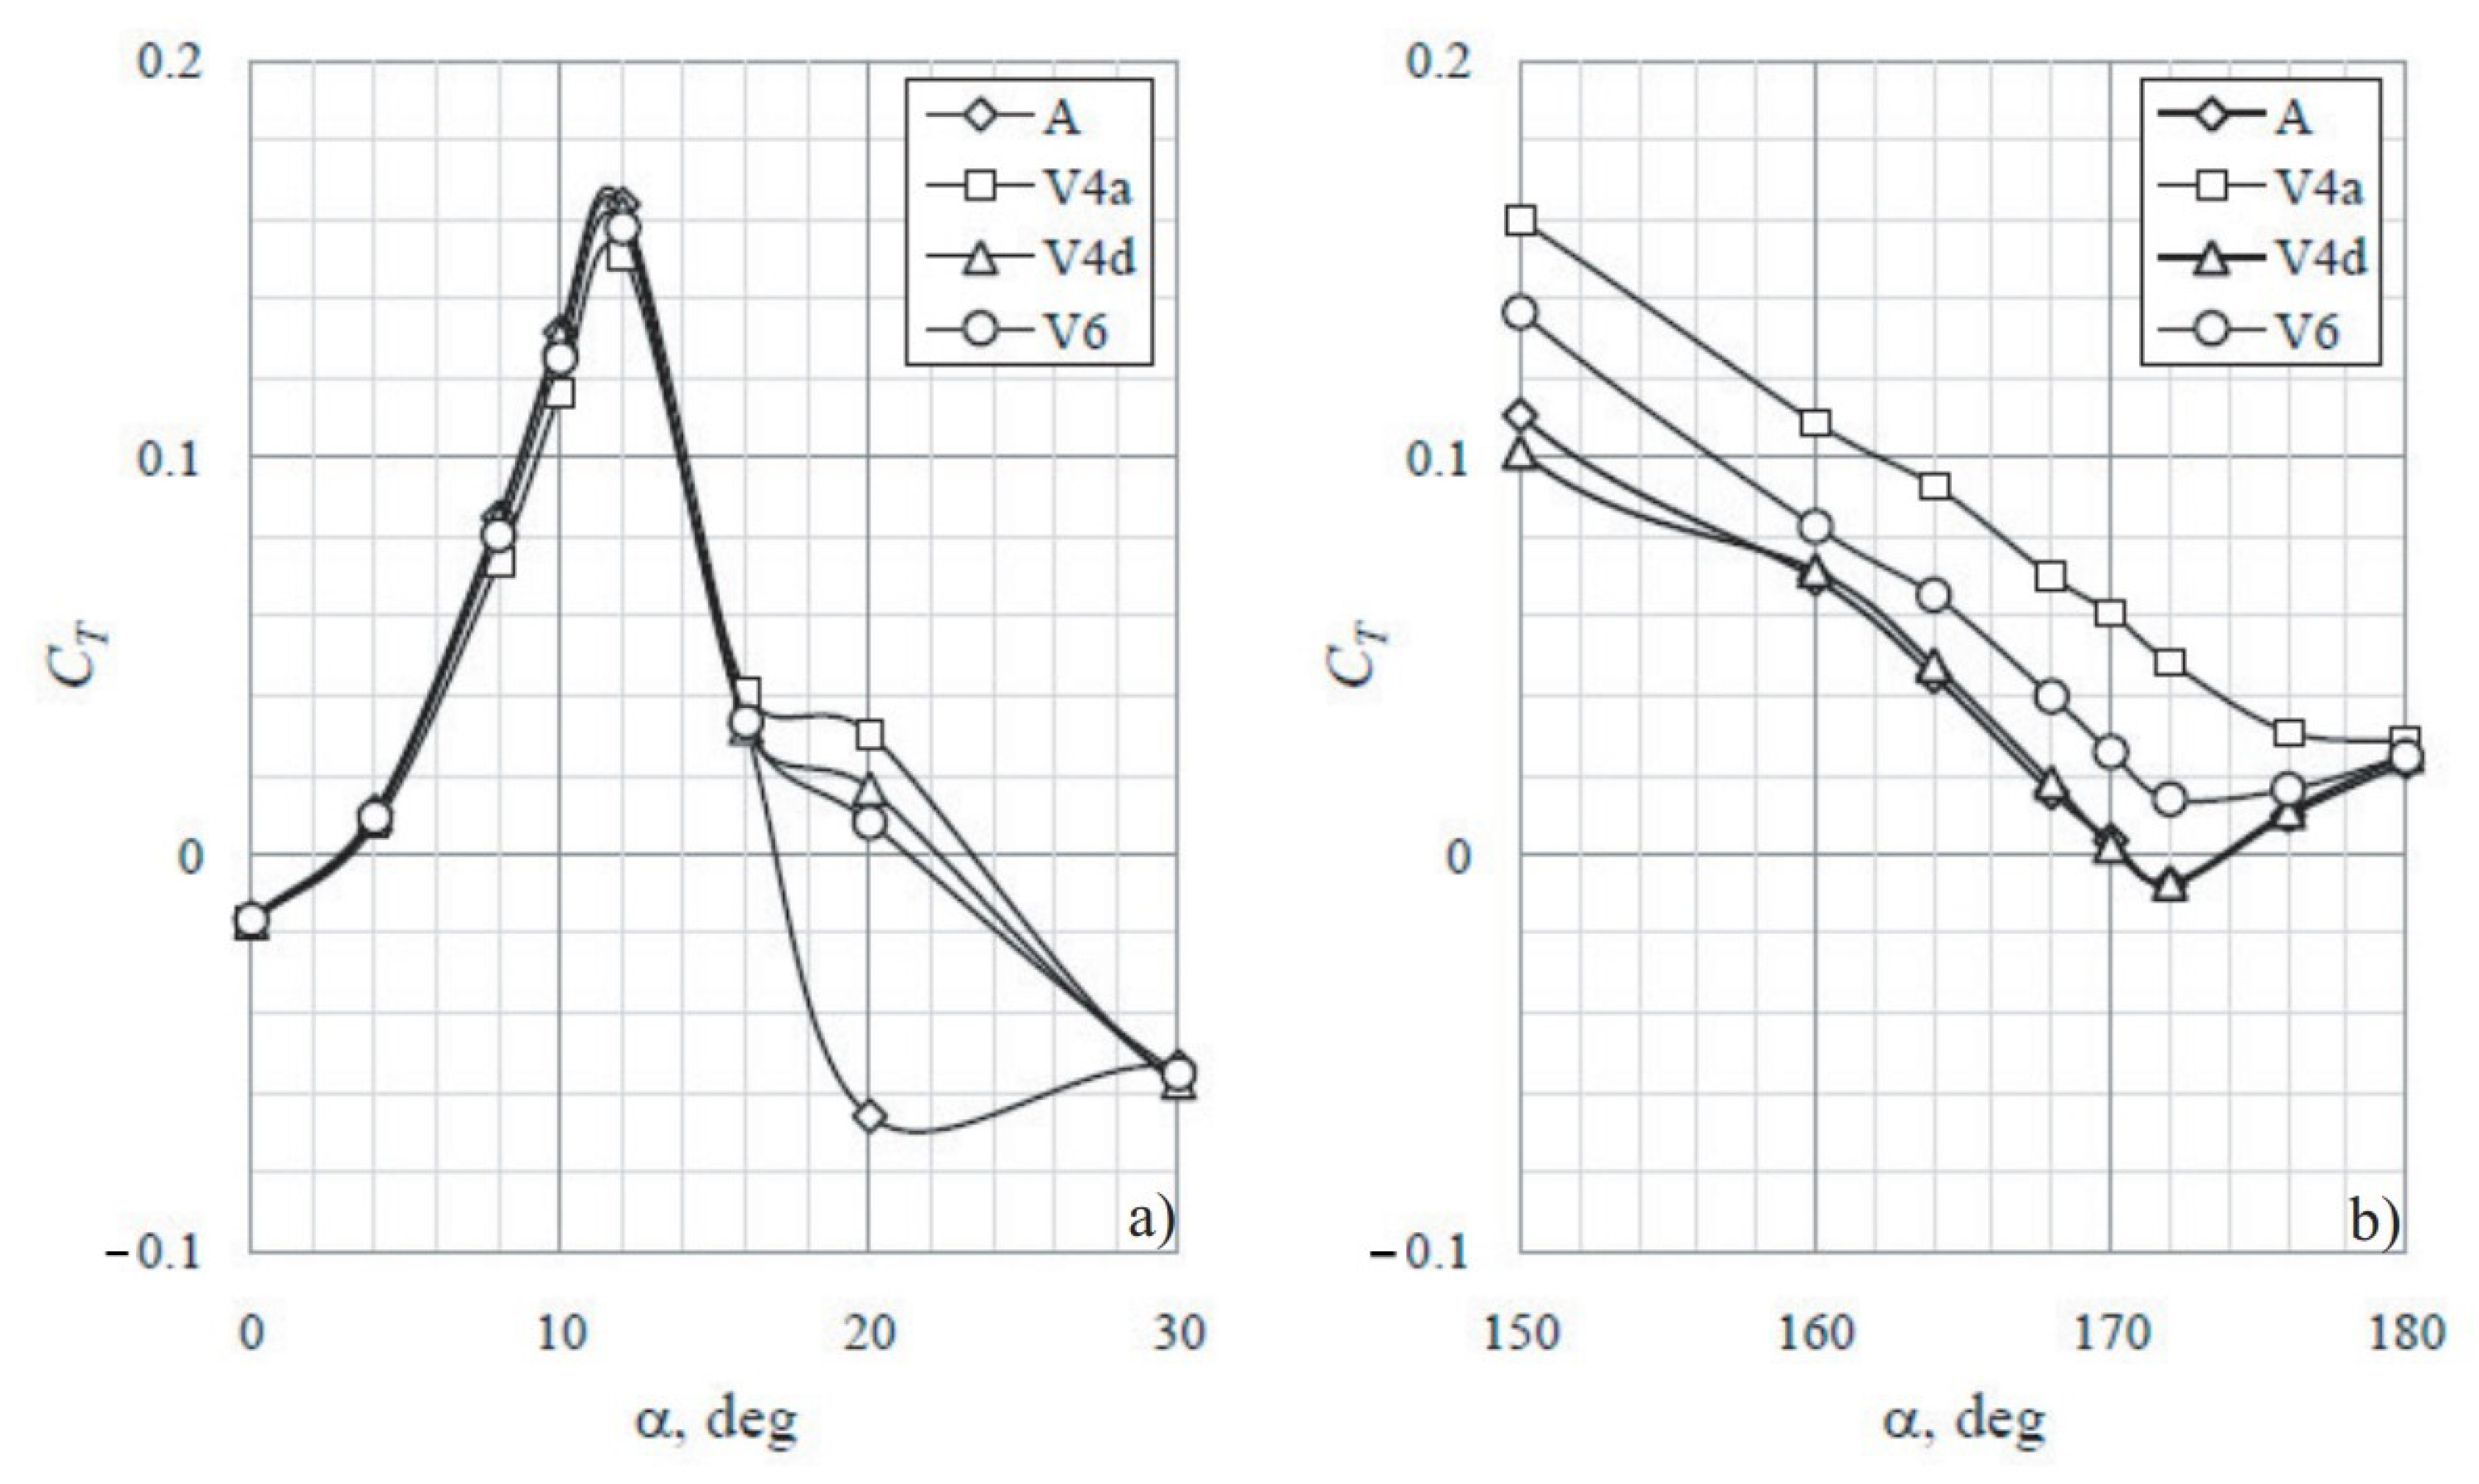
The effect that these observations have on the coefficient of tangential force that is experienced by the aerofoils is calculated. Figure 17 and Figure 18 show that there is a small reduction in tangential force for the vented aerofoils at low AOAs, while at high AOAs (between 140 and 180 degrees) there is a significant increase in tangential force. It is the vented V4a with the open inside that shows the greatest reduction in tangential force at low AOAs, but this reduction is not more than 30% over the range of AOAs between zero and 16 degrees, whereas at high AOAs an increase in tangential force of over 100% is predicted at AOAs in the range between 164 and 176 degrees. The V6 open inside aerofoil also shows a marked increase in tangential force over this range of AOAs, but the V4d closed inside aerofoil shows more similar results to that of the standard aerofoil.
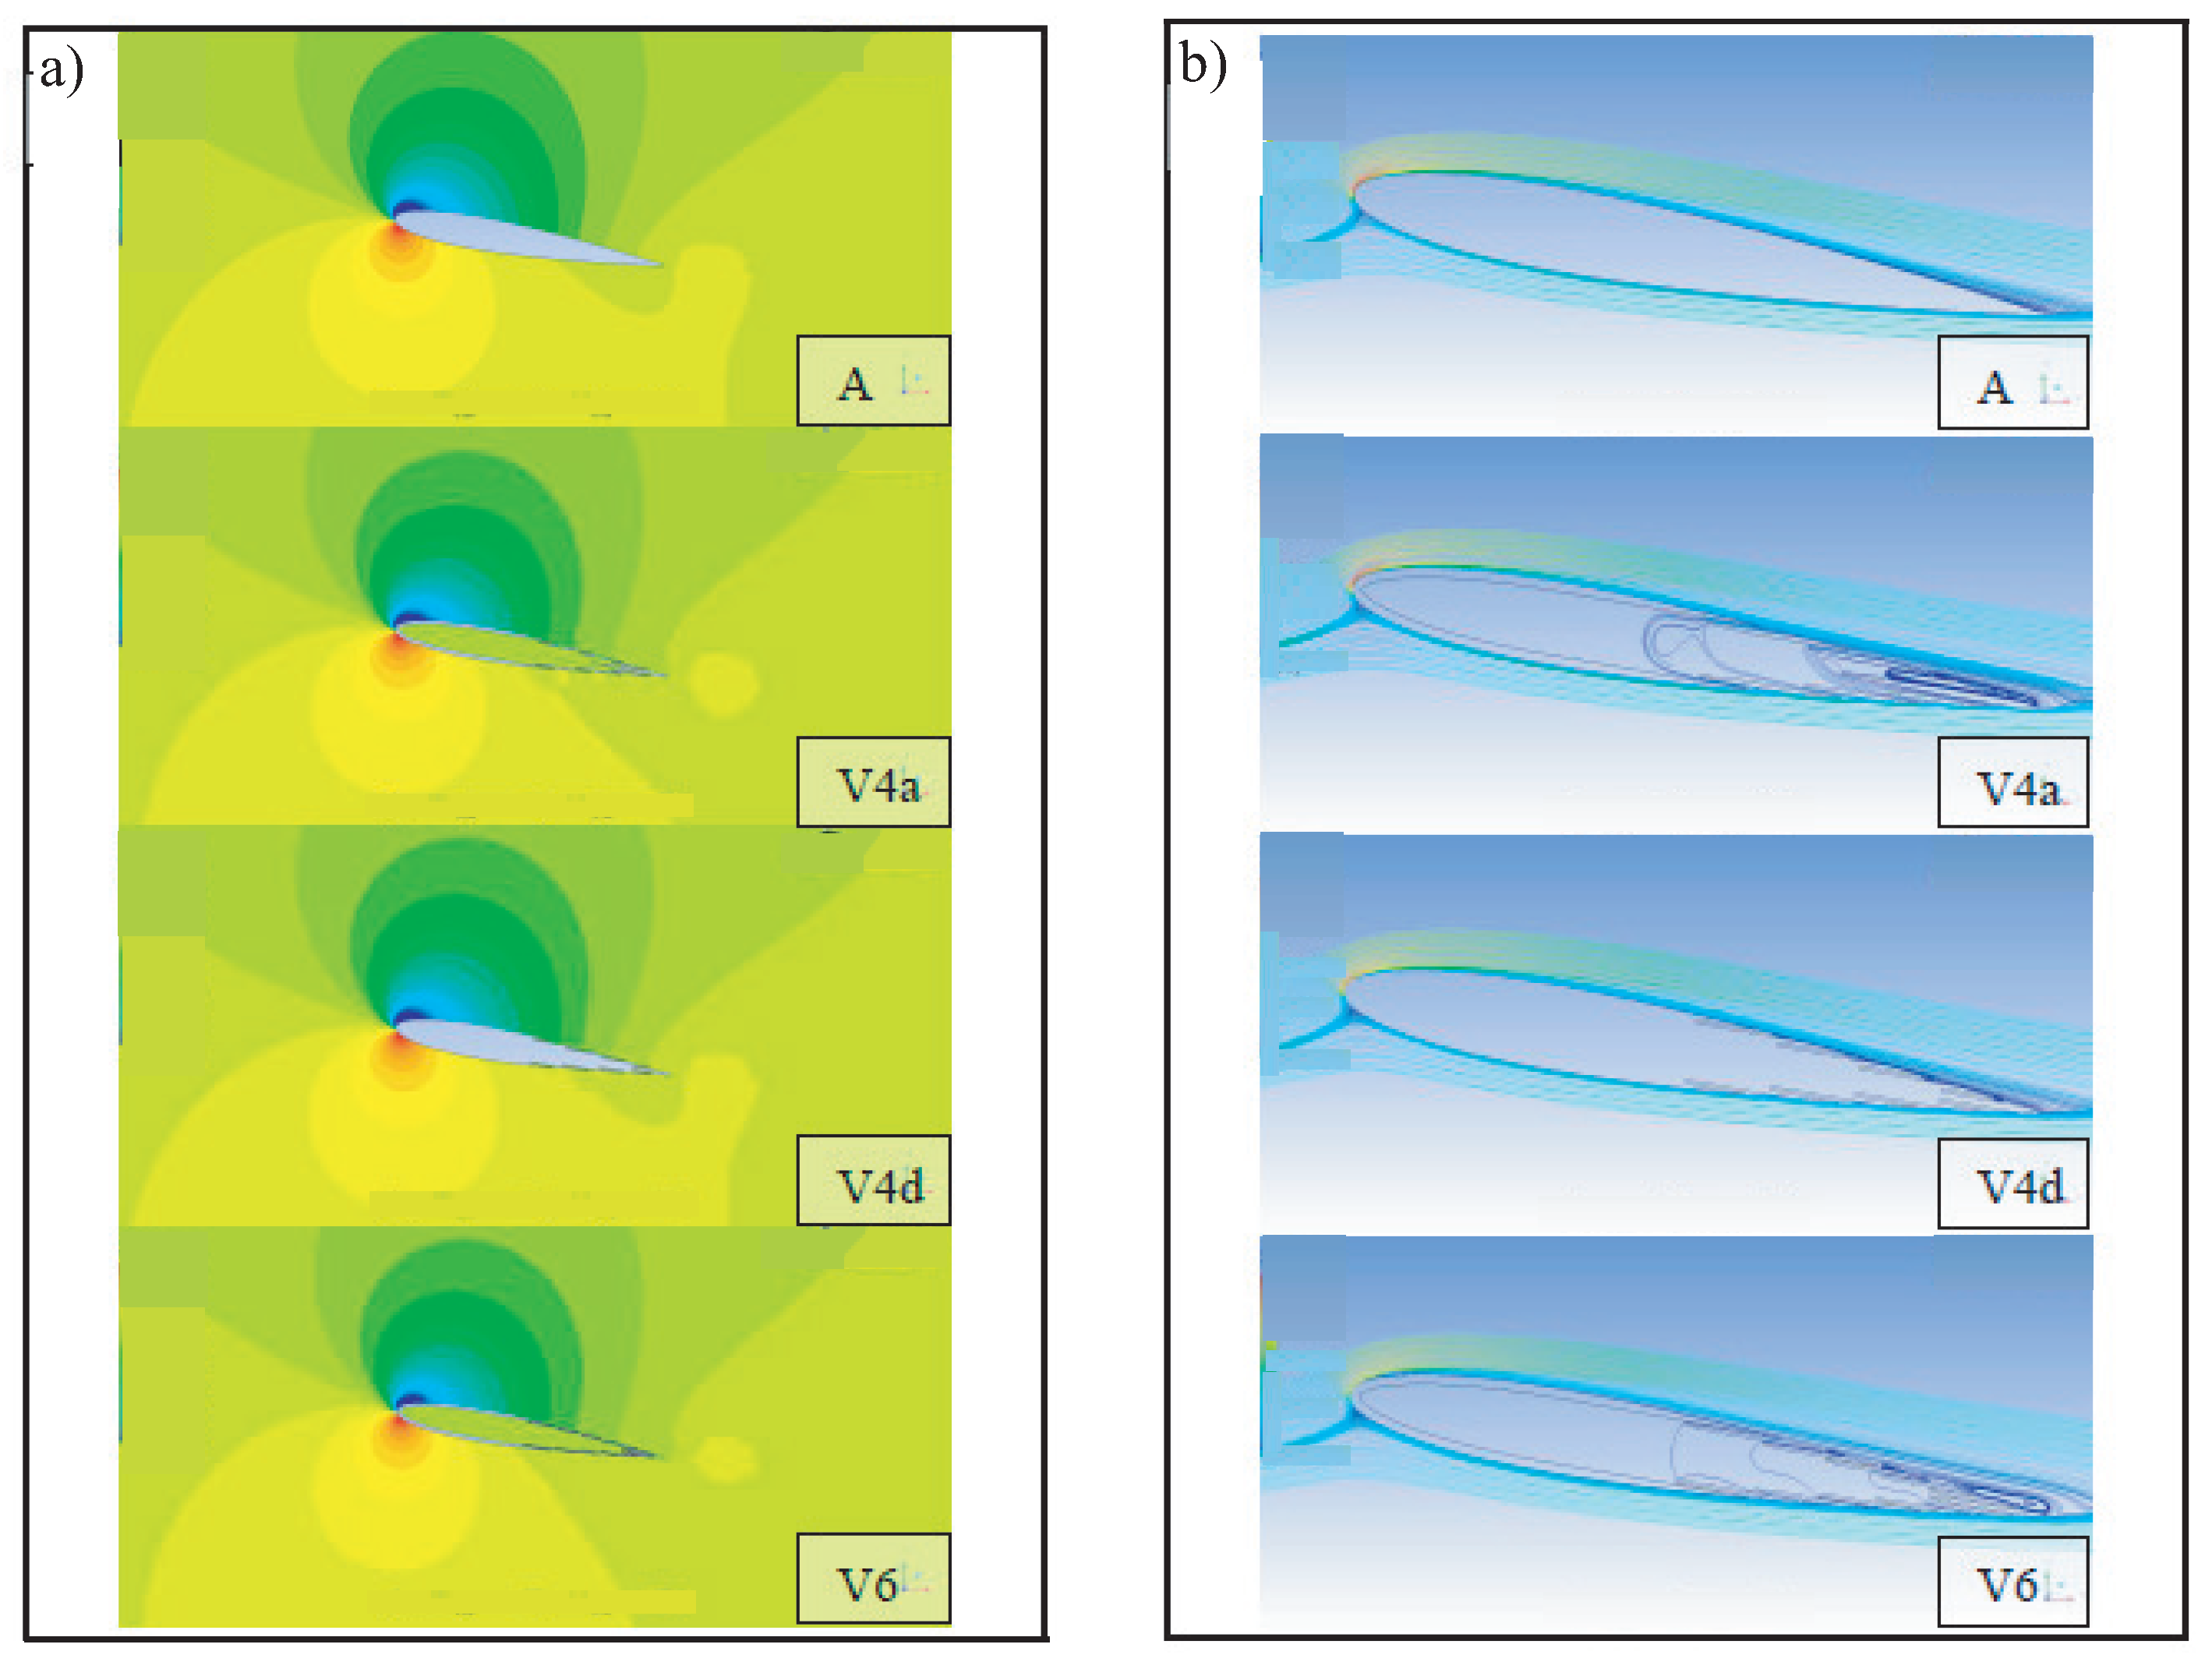
To analyze the reasons for these observations it is necessary to inspect the flow features by way of pressure contours and streamline plots which are presented in Figure 19, Figure 20, Figure 21 and Figure 22 for AOAs of 10°, 12°, 172° and 176°, respectively.
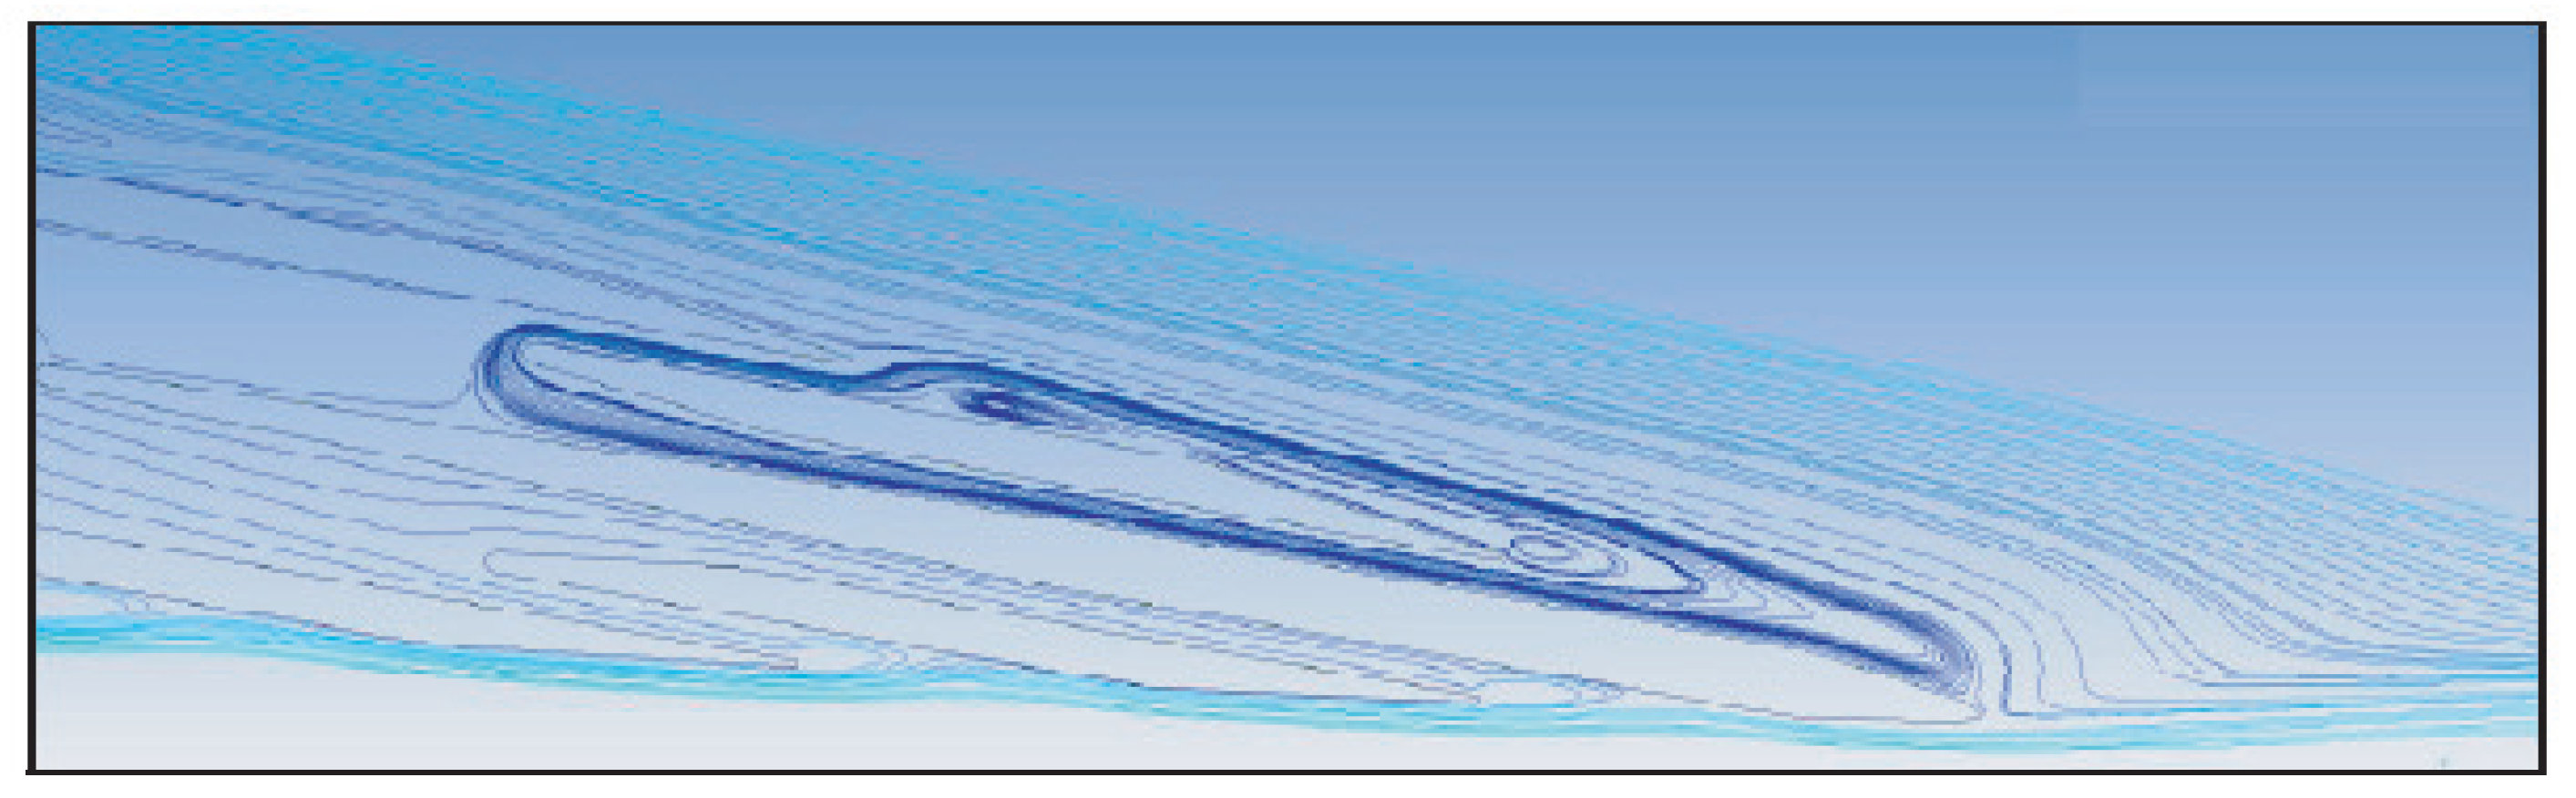
At = 10° there is little noticeable difference between the pressure contours and streamlines for the various geometries which are presented in Figure 19. The flow over the standard aerofoil shows no visible signs of detachment. Similarly, the flow over the V4d closed inside aerofoil also show no separation, although for small vortices can be observed at the discontinuities of the aerofoil surface. To observe the flow over the open inside aerofoils it can be seen that the flow over the V4a and V6 aerofoils has started to separate on the upper surface of the trailing edge, but interestingly a reduction in the size of the separation bubble on the V4a aerofoil is seen. This appears to be due to the increased opening sizing of the vents which allows air to flow through the vents from the inside and prevent the vortices that were observed to form at the surface discontinuities on the V4d and V6 aerofoils. In fact, a circulation pattern which flows into the aerofoil through the last vent and back out through the previous vent occurs in the case of the V4a aerofoil and is shown more closely in the vector plot in Figure 21.
Figure 20 shows that separation has occurred on the upper surface of the trailing edge of all four aerofoil geometries for = 12°. For the case of the V4a aerofoil it can be seen that flow from the inside of the aerofoil to the outside prohibits vortices forming at the discontinuities of the aerofoil upper surface at the first two vent openings. This flow enters the aerofoil from the vents on the lower surface.
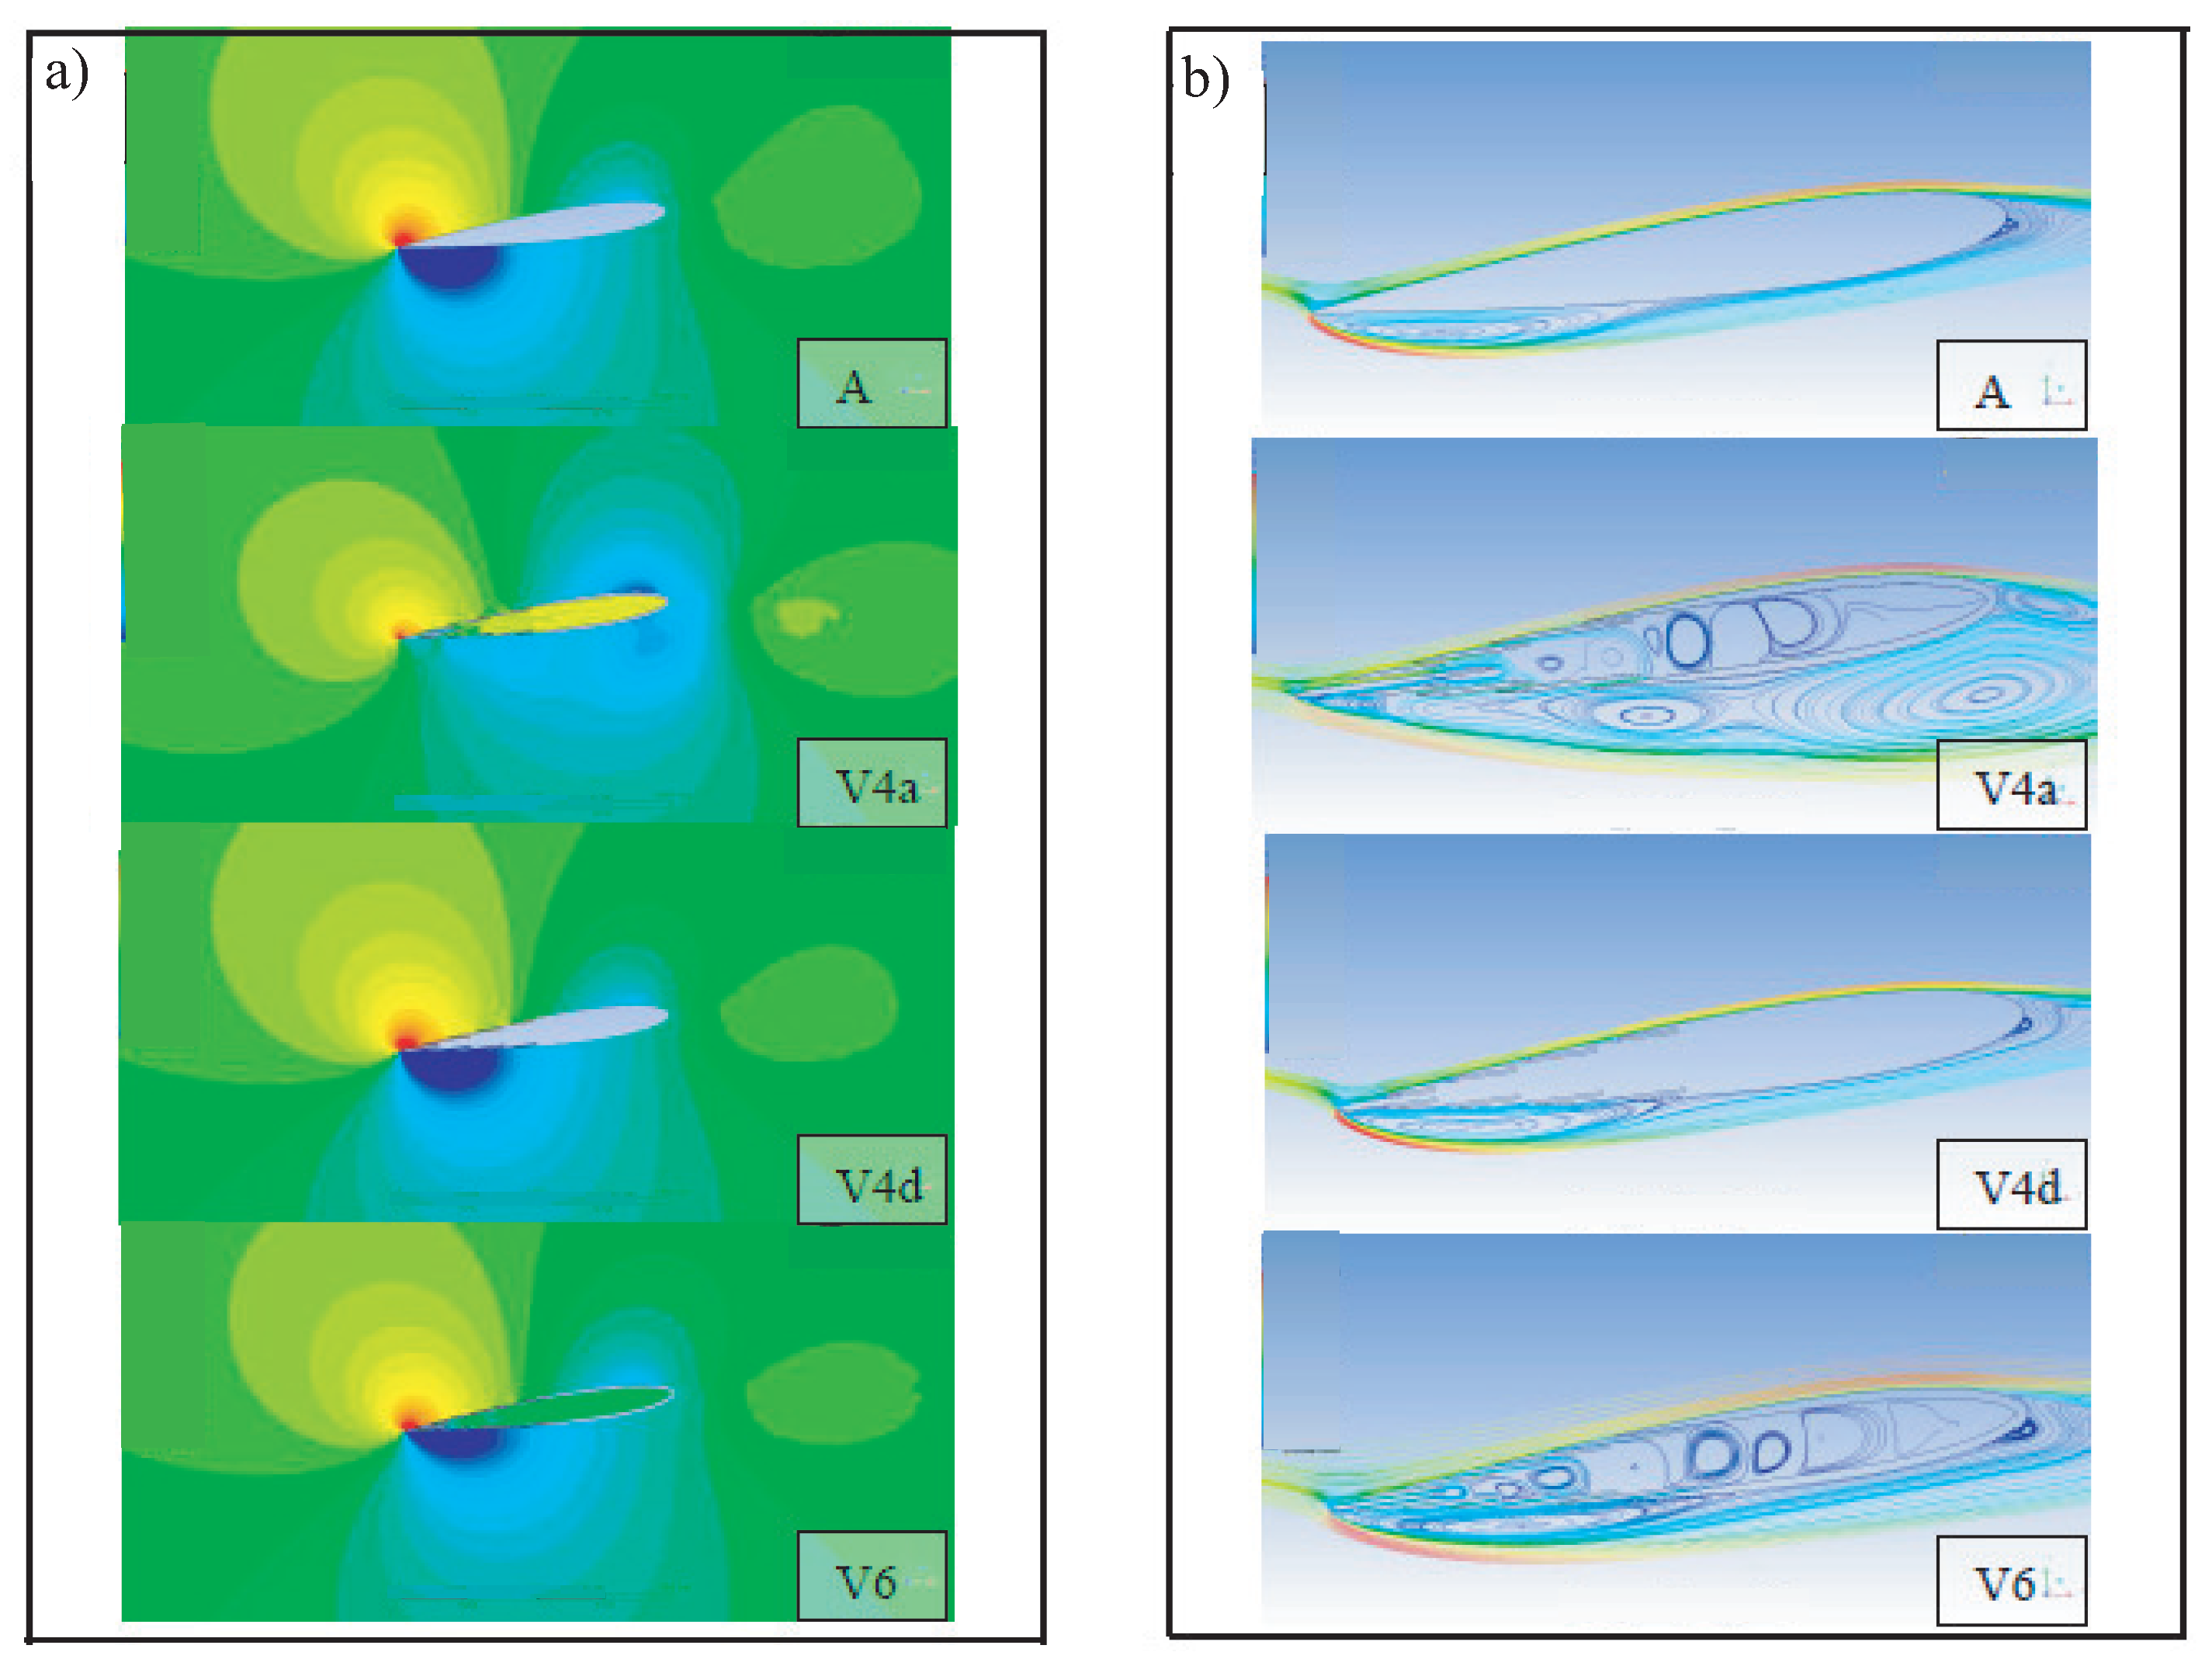
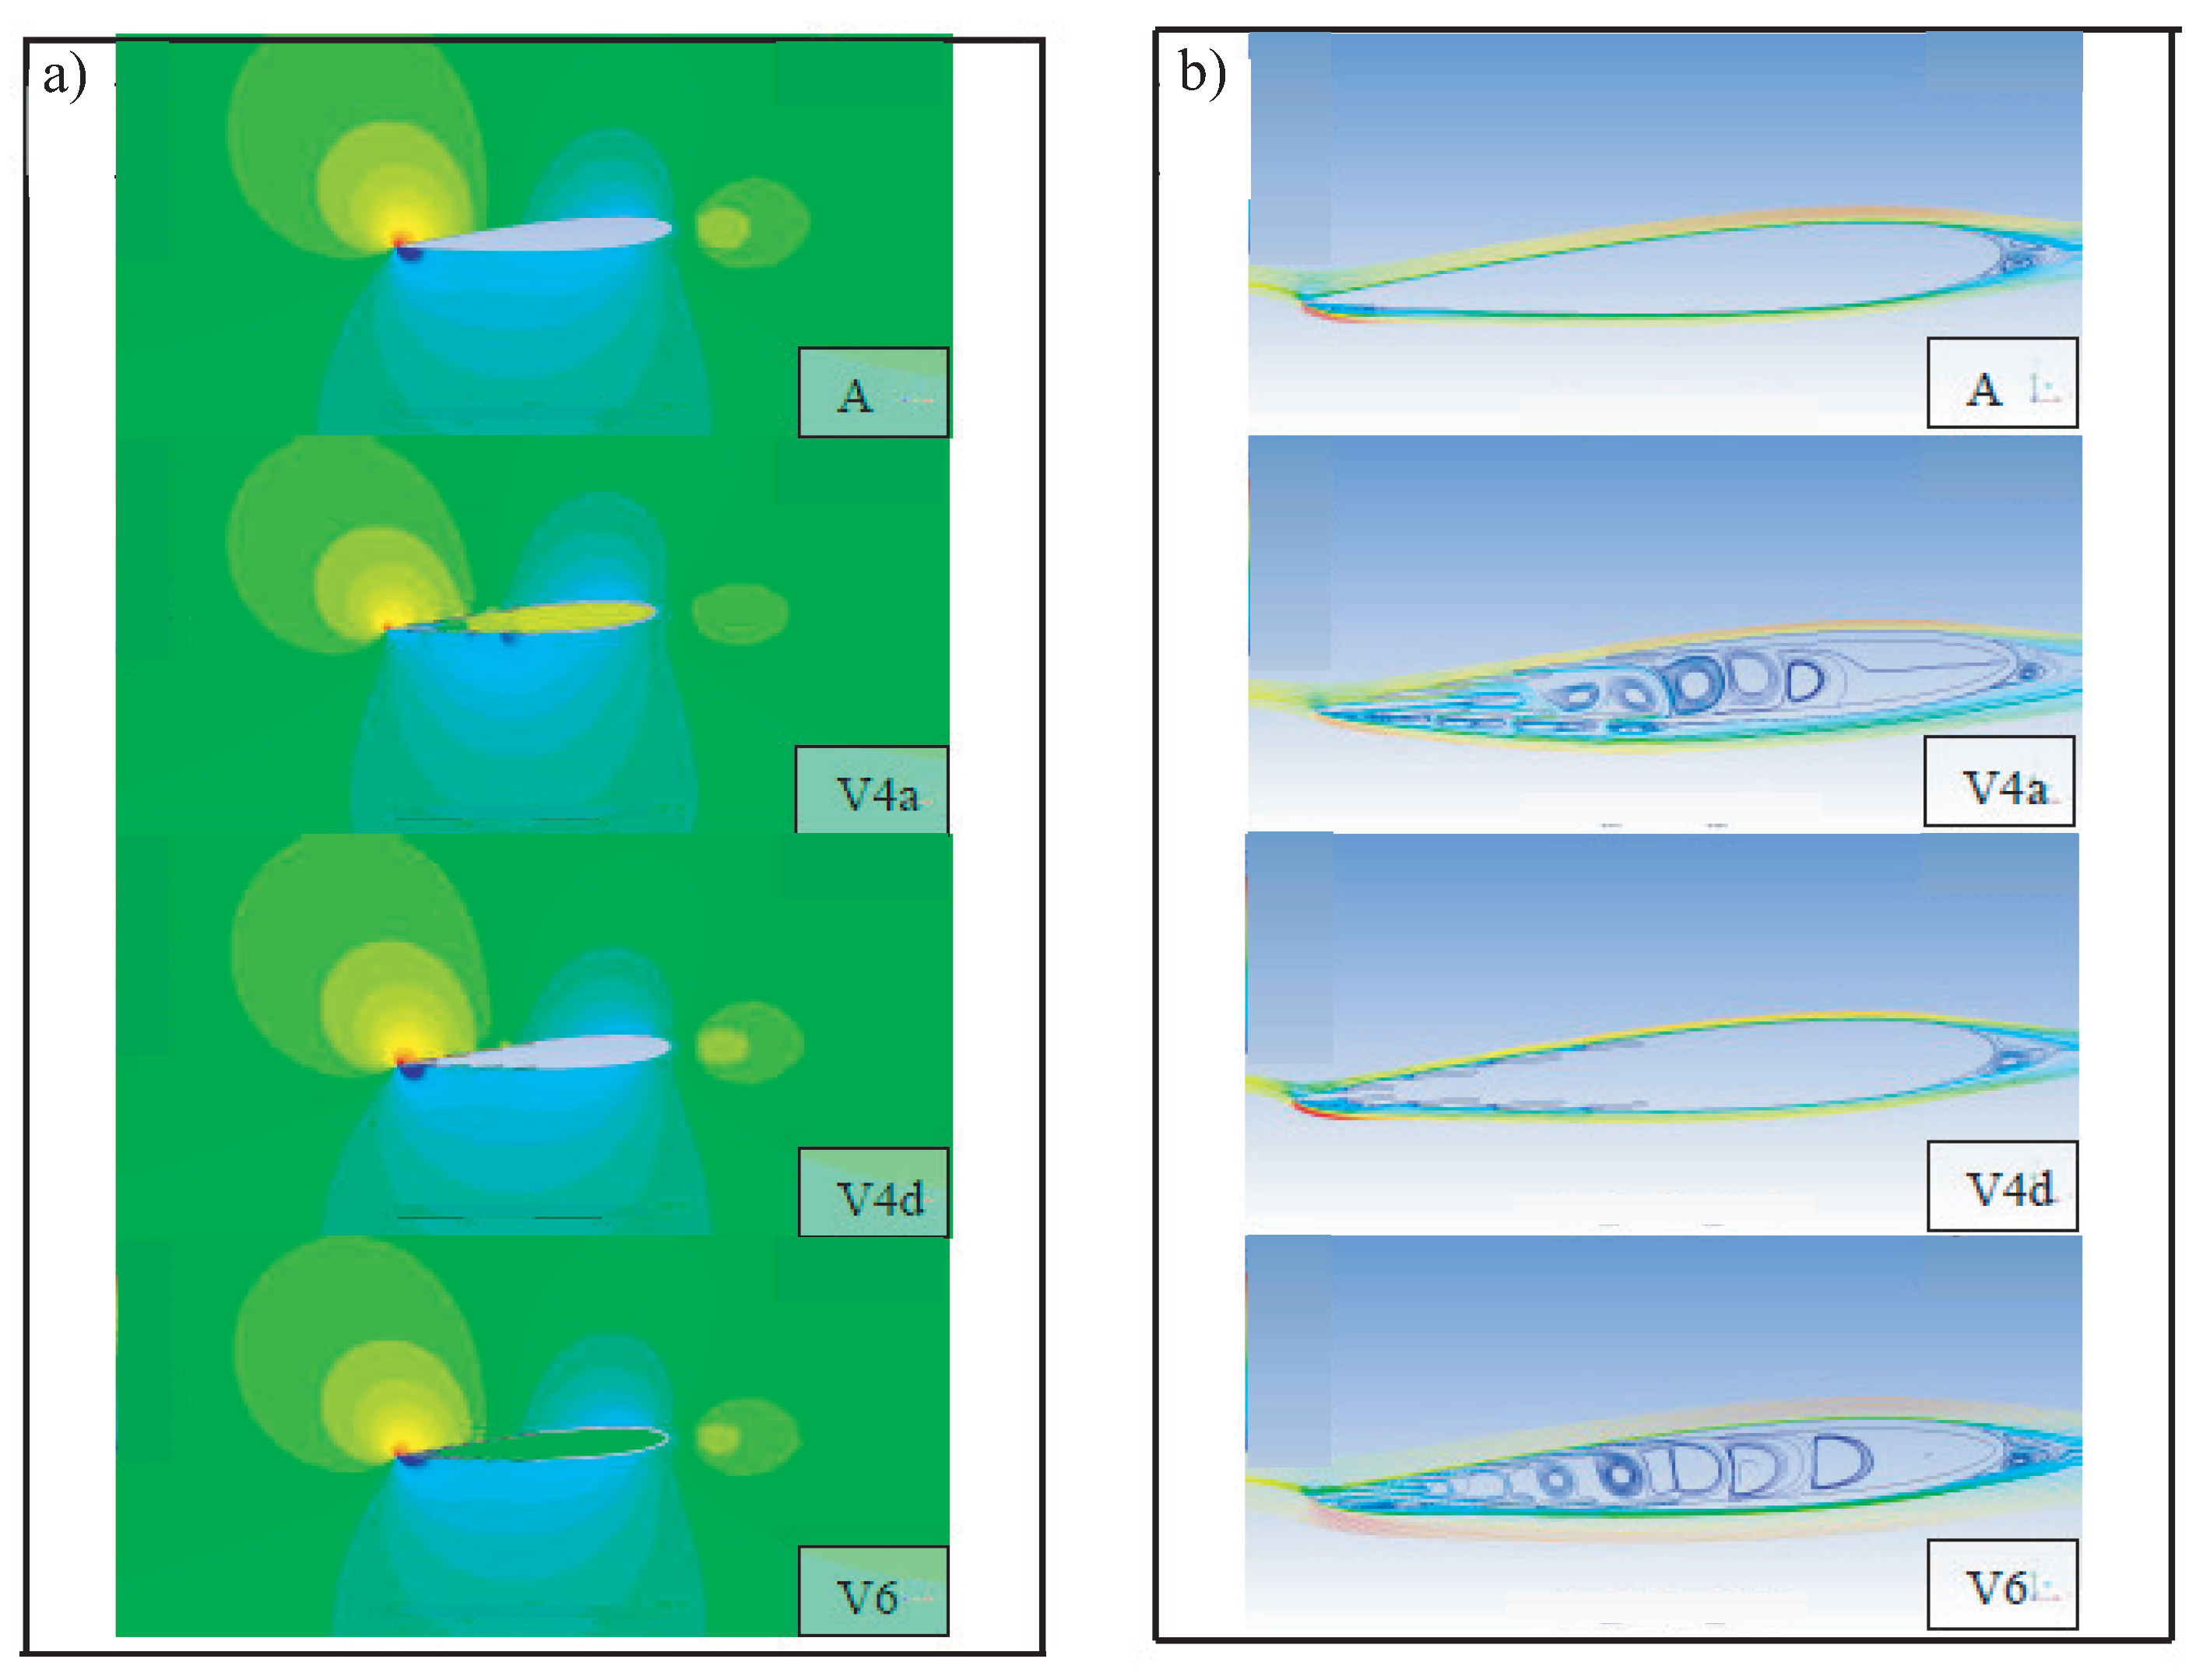
Figure 22 and Figure 23 show pressure contours and streamlines for two AOAs beyond 90°, namely = 172° and 176°, respectively. Many similarities exist between the flow around the standard aerofoil (case A) and two of the vented aerofoils (cases V4d and V6). The three geometries all show separation of comparable size at the leading and trailing edges for both = 172° and 176°. The V4a aerofoil, on the other hand, shows different characteristics. At = 172° the flow is completely separated and multiple large vortices have formed on the lower surface. At = 176° vortices have formed at each of the vent openings. It is these factors which cause the V4a aerofoil to experience a lower lift value and slightly higher drag value compared to the other aerofoils at these angles of attack.
It is interesting that the V4d and V6 vented aerofoils show similar flow patterns to that of the standard aerofoil, while it is only the V4a aerofoil that shows noticeable differences. This would suggest that it is the combination of both larger vent openings and the open inside of the V4a that contribute to the observed aerodynamic characteristics.
A larger region of lower pressure is observed behind the standard aerofoil. The region behind the vented aerofoil has a smaller region of low pressure. The increase in axial force for the vented aerofoil sit this AOA is actually caused by the reduced lift experienced by the vented aerofoil as a result of this low pressure region. An explanation for this is that the opening on the low pressure side of the vented aerofoil has expelled air that has entered on the high pressure side. This expelled air seems to act as a cushion for the separated flow and thus reduced the size of the vortex that has formed in the region. In the case of the standard aerofoil the vortex that has formed is larger causing the larger area of low pressure which has led to the increased lift.
A modification is now being considered where by a division is placed along the centre of the vented aerofoil that stops any air that enters on the high pressure side to flow out of the low pressure side.
6. Performance Prediction
The effect that the aerofoil’s aerodynamic characteristics has on the performance of the wind turbine is analyzed. The model used is simple, in that it does not take into account wake effects or unsteady occurrences that occur in the flow. However, it allows for a comparison of the different aerofoils. The following predictions have been made for a theoretical three-bladed VAWT with radius of 1 m and chord length of 0.2 m.
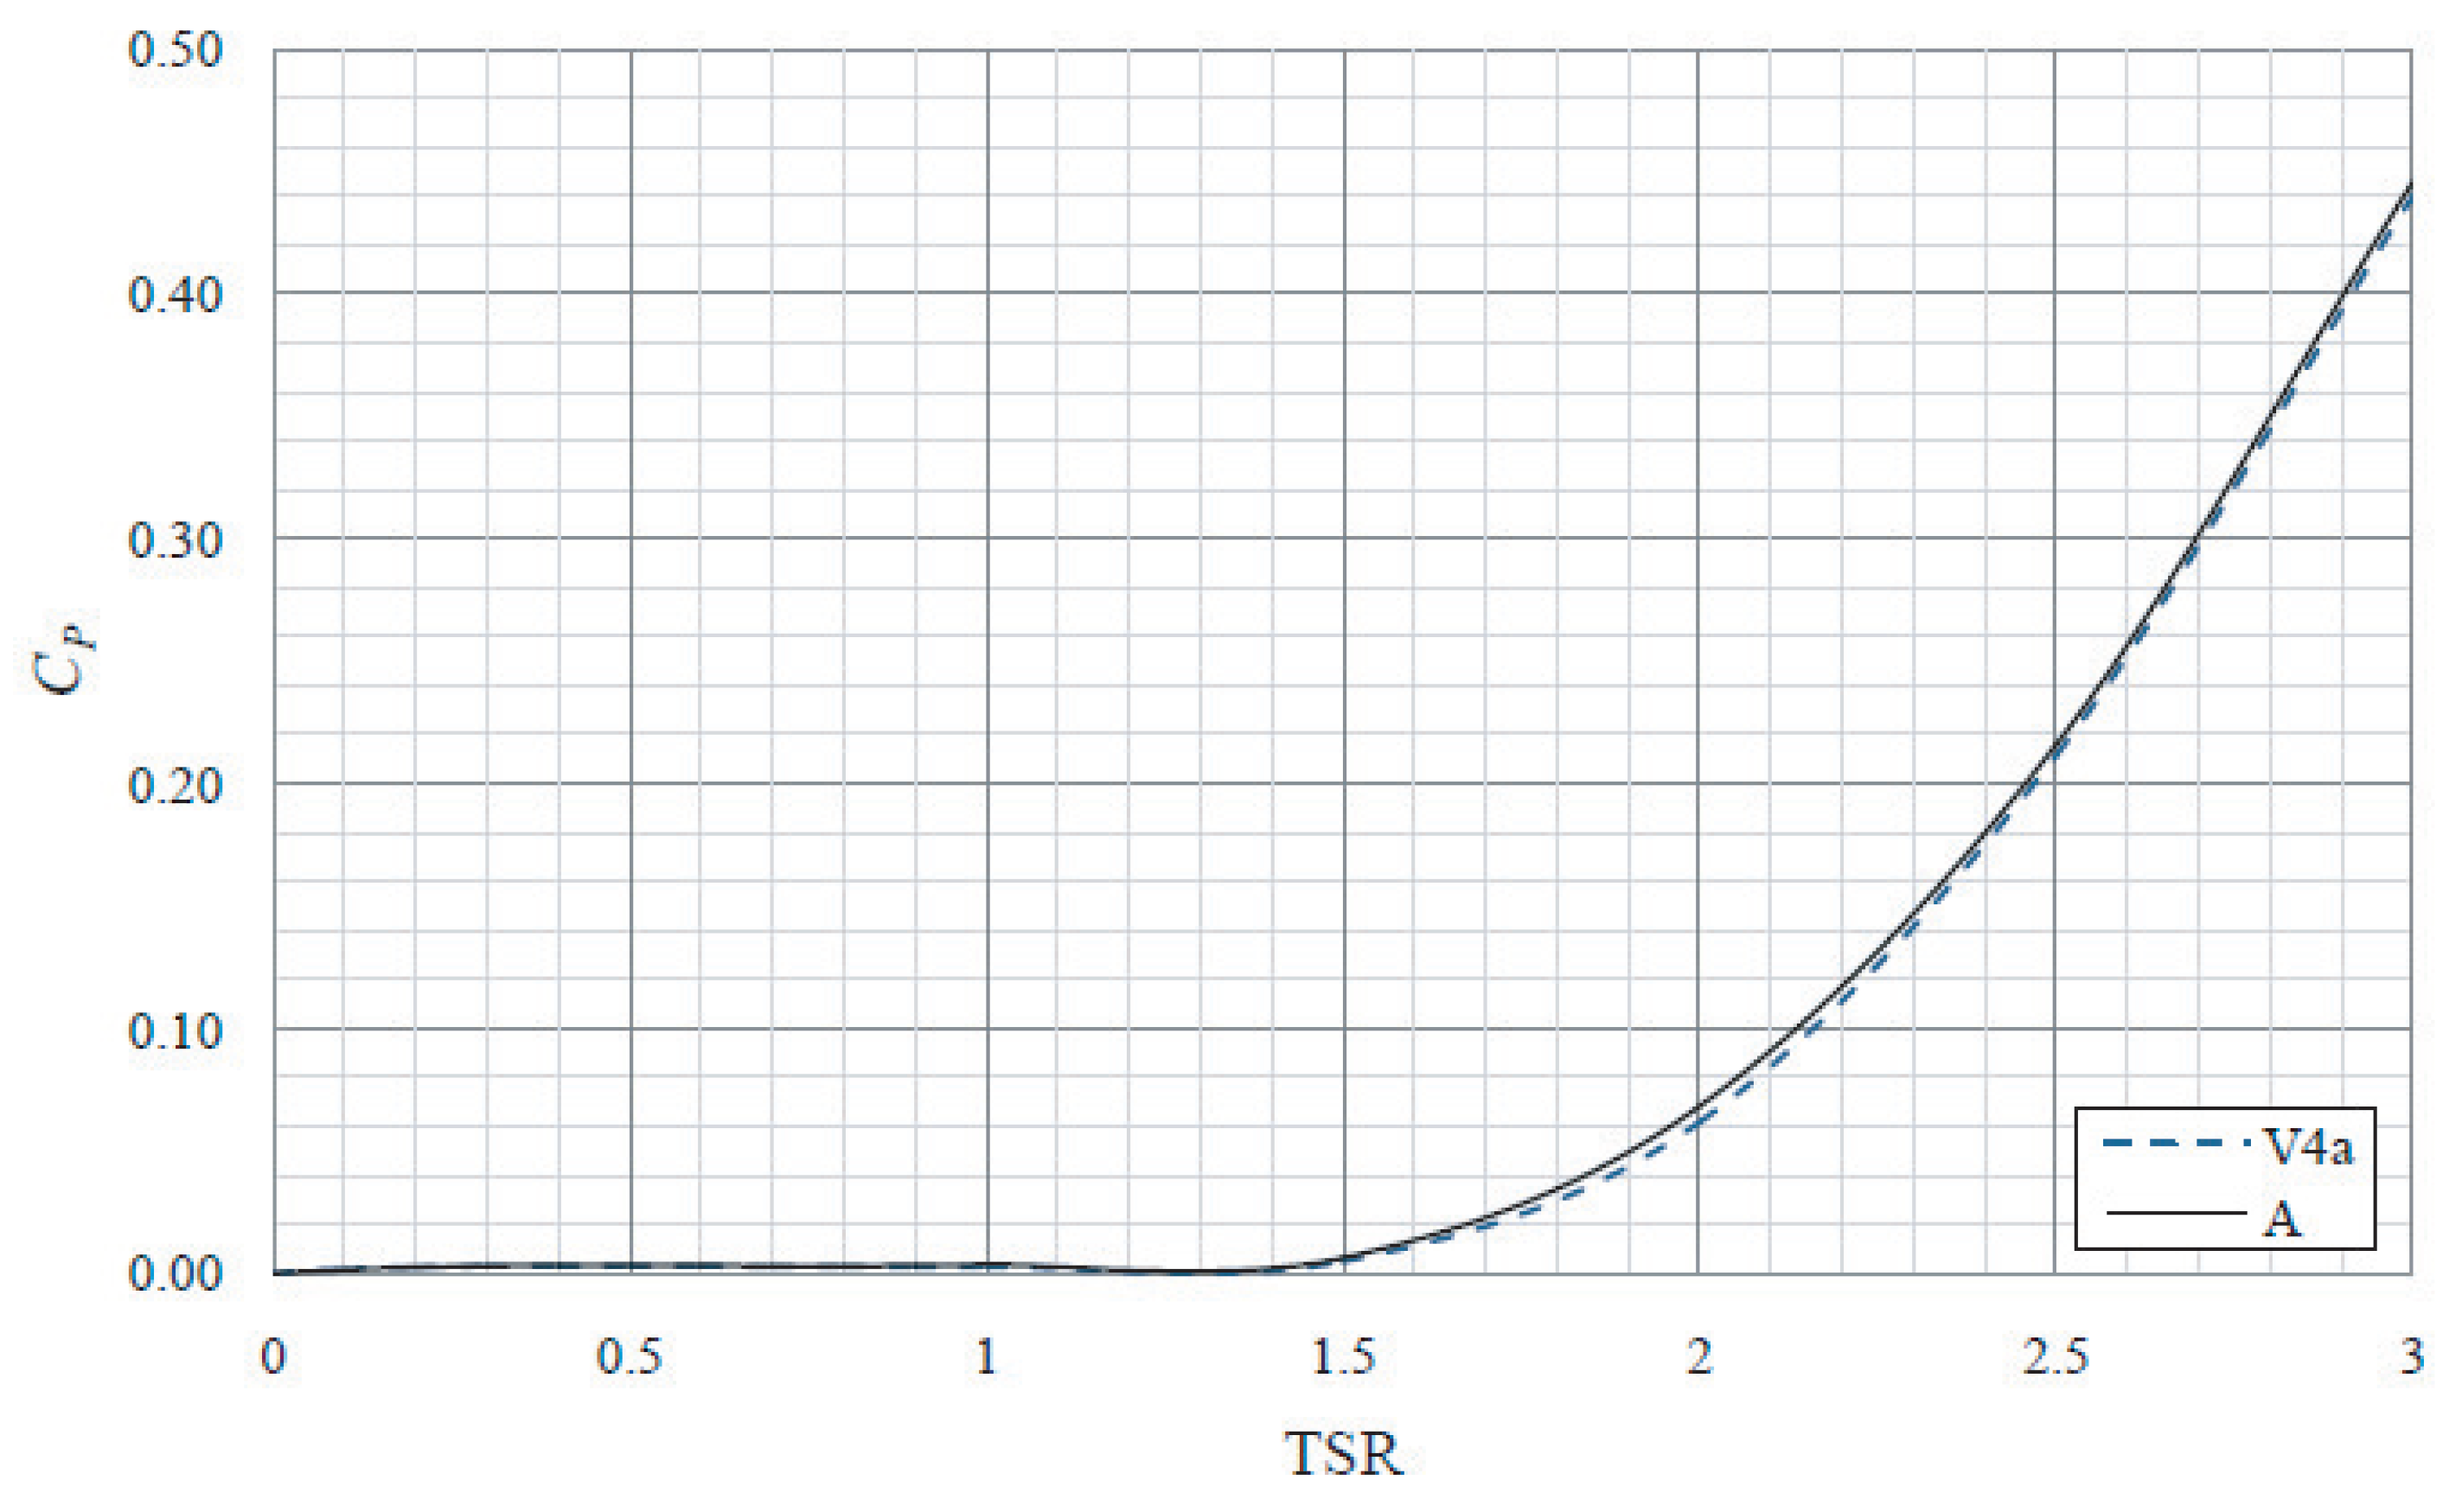
Figure 24 shows a small decrease of coefficient of power at TSRs larger than 1.5. At TSR of 2 there is a decrease of about 9%, and at TSR of 3 this decrease is about just over 1%.
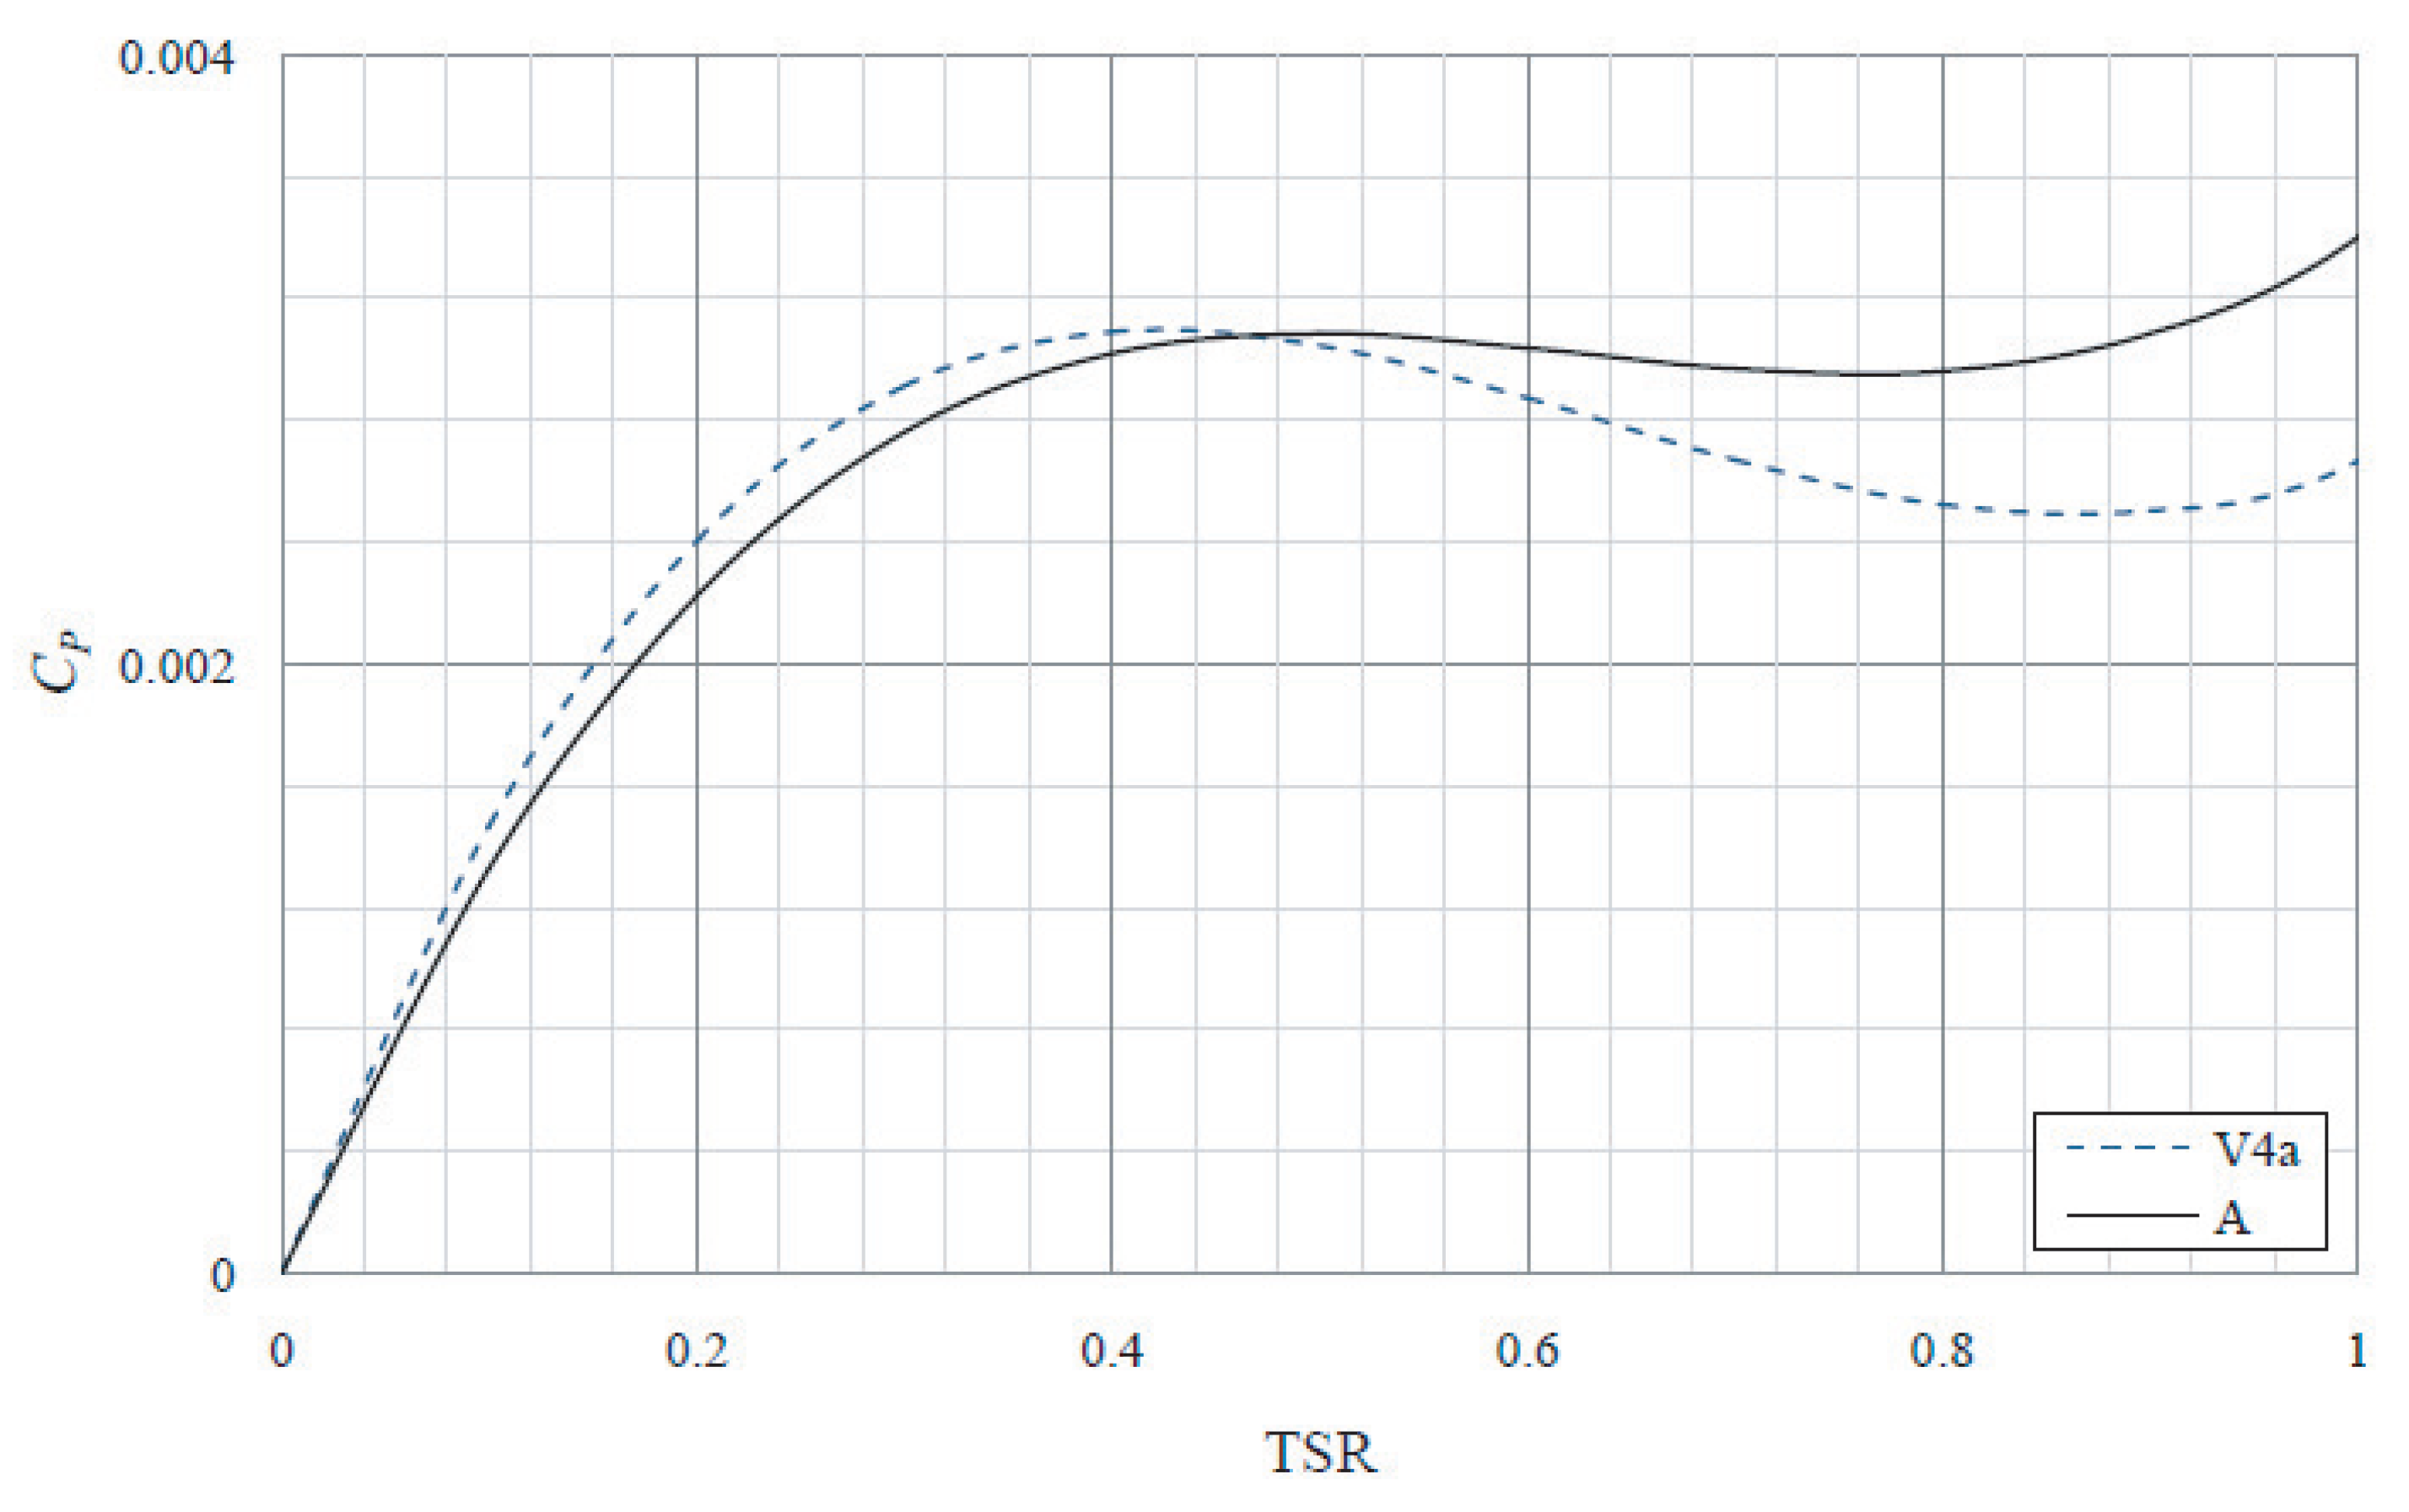
Figure 25 shows in more detail the variation in coefficient of power at low TSRs smaller than 1. From stationary to TSR of 0.5 the vented blade shows an increase in coefficient of power of up to 8%. However, beyond TSR of 0.5 the vented blade produces a decrease in coefficient of power of up to 20% at TSR of 1.
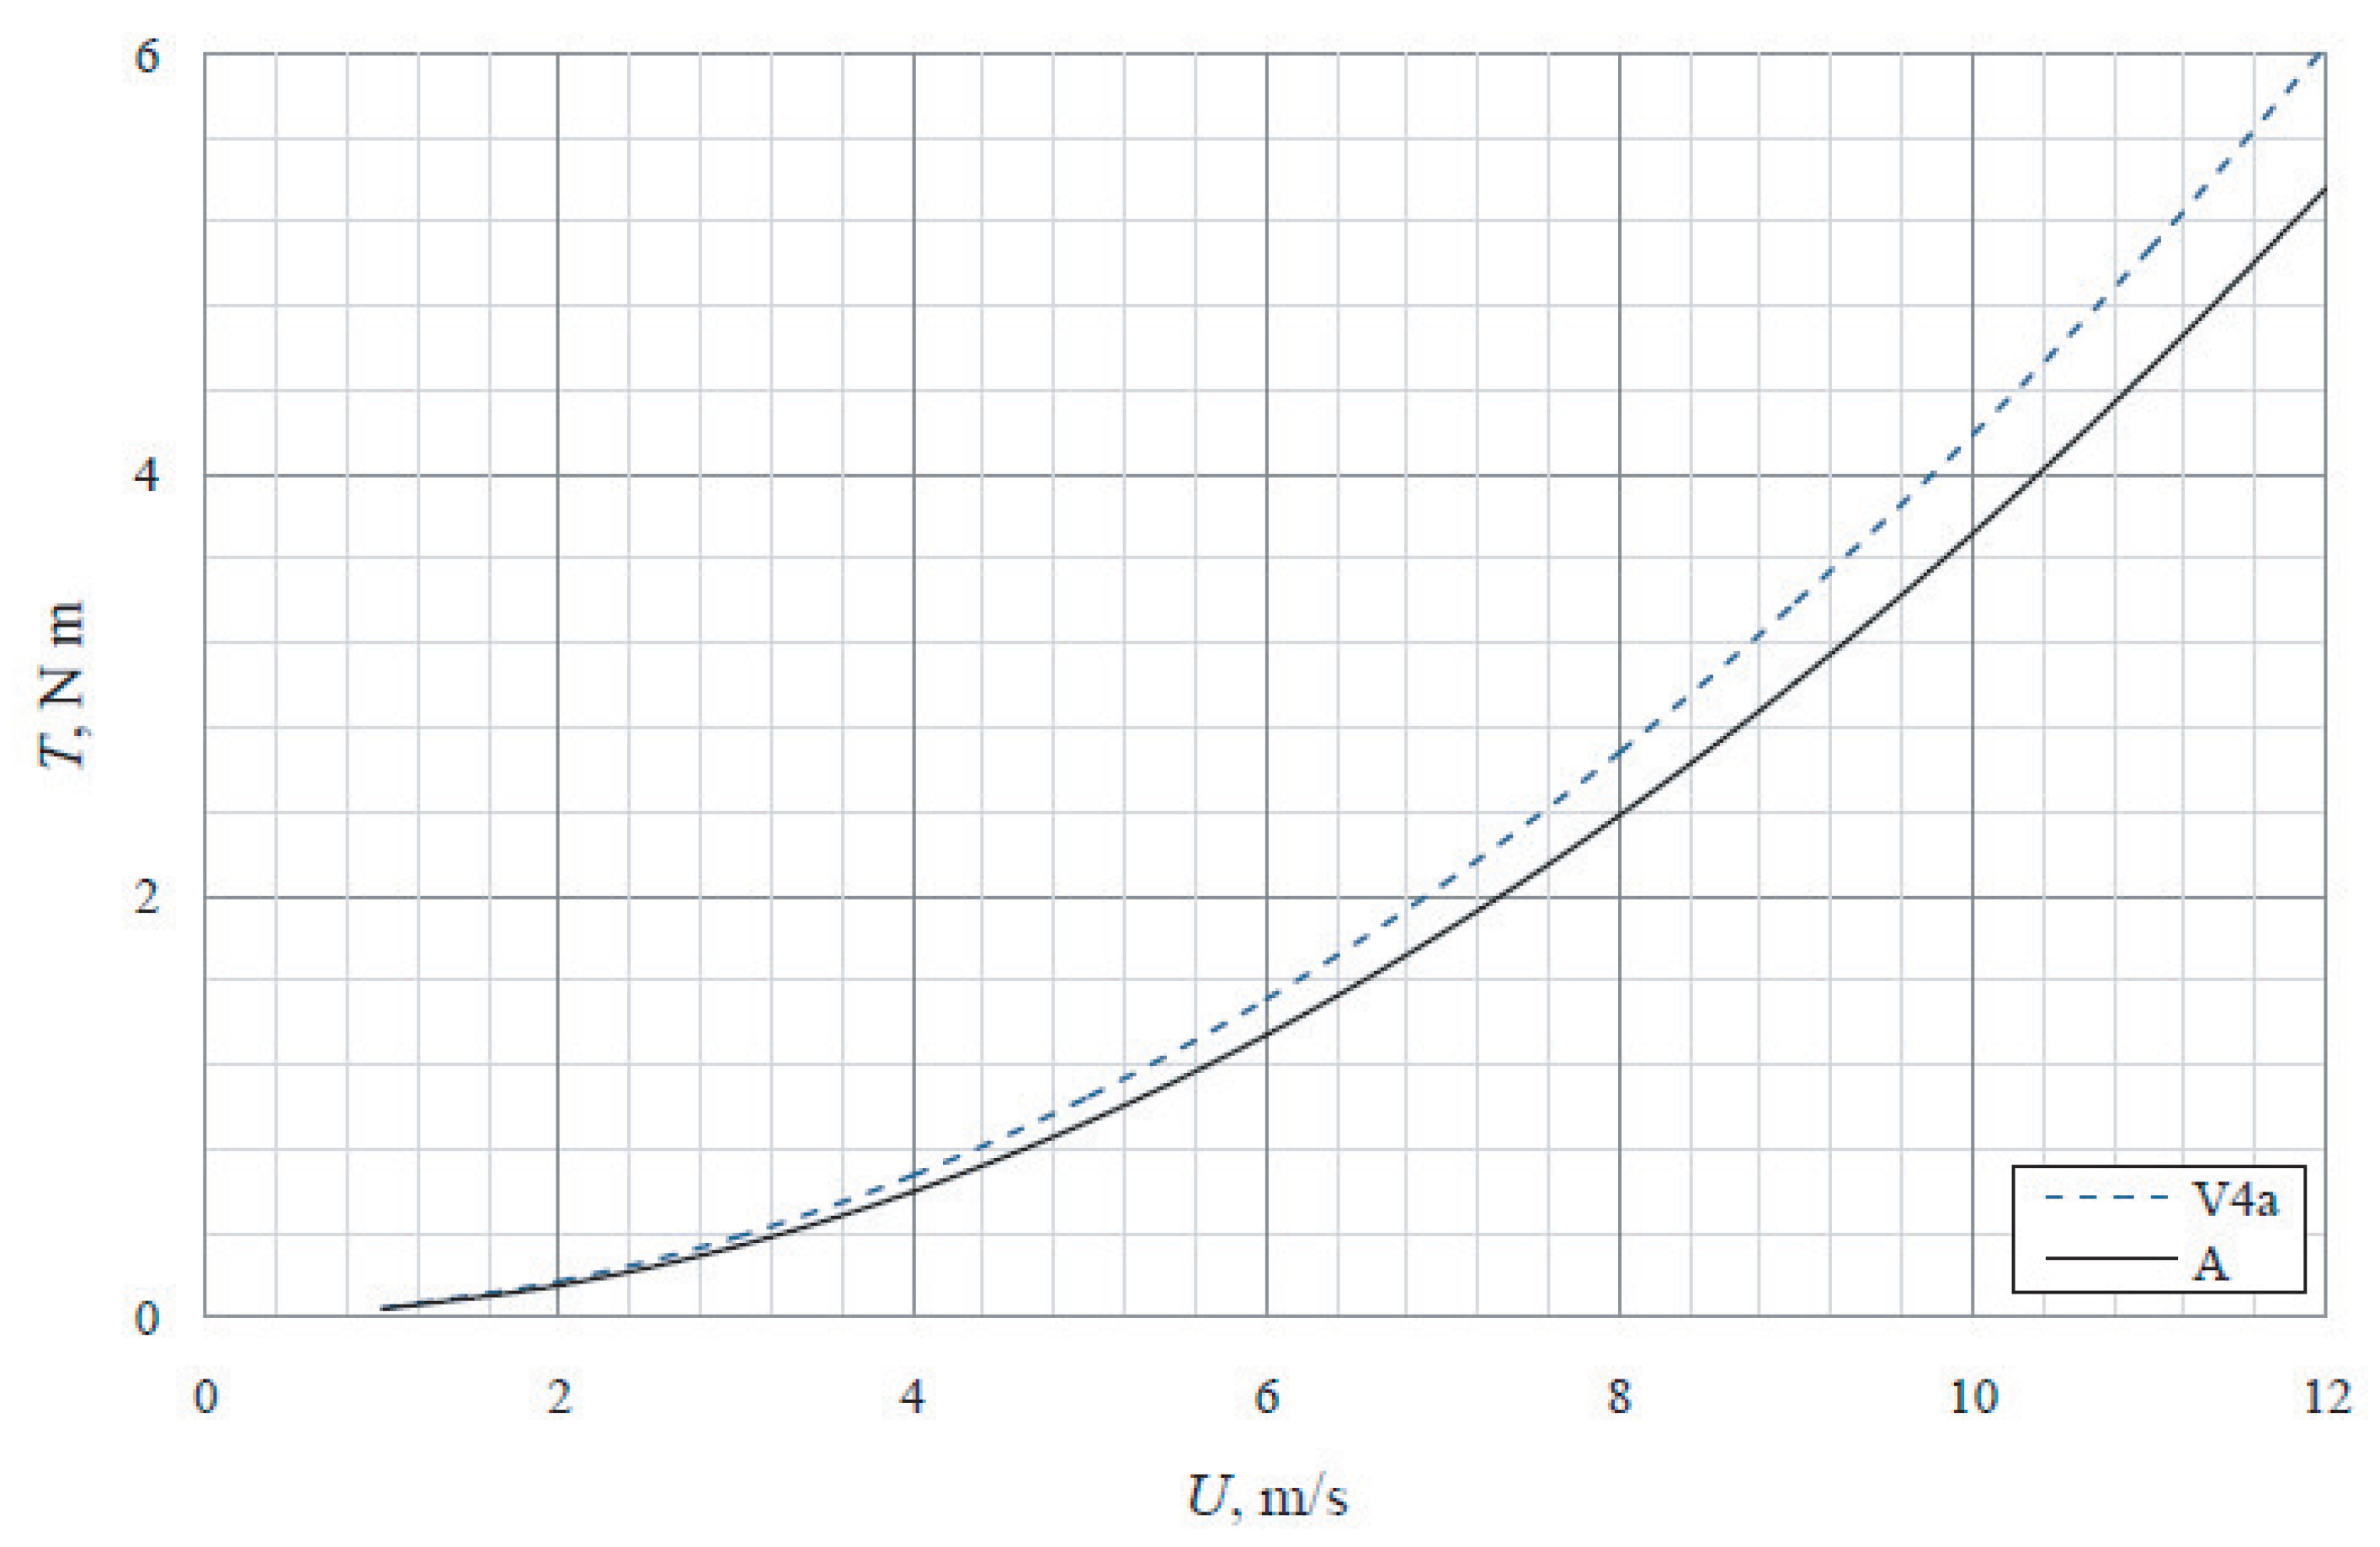
The averaged trust coefficient for the standard aerofoil is 0.0157 (case A) and it is equal to 0.0177 for the vented aerofoil (case V4). The average thrust coefficient on the stationary VAWT is predicted to be increased by 11.2%. This would lead to improved self-start ability. Figure 26 shows dependence of average starting torque on wind speed (the height is equal to 2 m).
From the results presented in this section it has been shown that a VAWT with the new vented blade design would offer a slight increase in self-starting capability and performance at TSRs smaller than 0.5. It has also been shown that the performance at high TSRs would decrease but only by a small amount.
7. Conclusions
A modified vented NACA0012 aerofoil was presented in an effort to increase the torque produced by a VAWT at low TSR (). CFD was used to predict the aerodynamic characteristics of a new vented aerofoil design based on the well-known NACA0012 aerofoil. The SST turbulence model was used with the ANSYS CFX solver and steady state simulations were performed. Simulations have been run over a full range of AOAs from 0 to 180 degrees at and on both the standard NACA0012 and the modified vented design. The results computed have been validated against existing data and deemed suitable to use for initial investigation into the potential advantages this new aerofoil design can offer.
Comparisons have been made between the aerodynamic characteristics of different aerofoils. The outcome was in line with expectation in that axial force was increased in the range AOAs between 90 and 180 degrees. However, the reason for this was not as expected. An explanation for this unexpected result has been presented and an idea for a further modification has been suggested.
Using CFD it has been predicted that the vented aerofoil design V4a with an open inside configuration experiences an increase in coefficient of tangential force of over 100% compared to the standard aerofoil at very high AOAs between 160 and 180 degrees. This has been observed to be due to a reduction in lift as opposed to previously expected increase in drag. In contrast, at low AOAs between 0 and 30 degrees only a slight reduction in tangential force has been observed.
Using a simple momentum-based performance prediction model, these results suggest that this would lead to an increase in torque generation by a theoretical three-bladed VAWT of up to 20% at low TSRs and only a minor reduction in coefficient of power of up to 9% at TSR of 2 and closer to 1% at higher TSRs.
Further modification of the vented design could be made. For example, reduce the number of vents from 8 to 6 and increase the vent opening size could further reduce the lift produced at high AOAs. How much impact it would have on the aerodynamic characteristics at low AOAs, however, is to be discovered. Different aerofoil profiles could be used, for example the NACA0015 and NACA0018 aerofoils have been widely used in VAWT research and have been observed to offer improved performance characteristics.
The study covers an investigation into the aerodynamic performance of the new blade design. Other considerations for the feasibility of this blade, which have not been analyzed, include the structural integrity and cost of production of this new design. Although these are two very important considerations of a design, they are secondary considerations when compared to the aerodynamic performance. Only after this initial study into the aerodynamic performance of the design has been assessed, and subject to favorable results which suggest this design can offer a solution to the initial problem, will these considerations be addressed.
The study is fundamental and the first step to understand the physics of the flow and flow pattern around the vented airfoil. A more deep study is required to demonstrate how a small increase of the torque helps the wind turbine to start.
Author Contributions
Conceptualization, S.M. and K.V.; methodology, S.M.; software, I.O.; validation, S.M. and I.O.; formal analysis, K.V.; investigation, S.M.; resources, K.V.; writing—original draft preparation, K.V.; writing—review and editing, I.O.; visualization, S.M.; supervision, K.V. All authors have read and agreed to the published version of the manuscript.
Funding
The research is partially funded by Ministry of Science and Higher Education of Russian Federation as part of World-Class Research Centers program “Advanced Digital Technologies” (contract No. 075-15-2020-903 dated 16.11.2020).
Institutional Review Board Statement
Not applicable.
Informed Consent Statement
Not applicable.
Conflicts of Interest
The authors declare no conflict of interest.
References
- Hernandez, O.S.; Volkov, K.; Mederos, A.C.M.; Padryn, J.F.M.; Lorenzo, A.E.F. Power output of a wind turbine installed in an already existing viaduct. Renew. Sustain. Energy Rev. 2015, 48, 287–299. [Google Scholar] [CrossRef]
- Jacobs, E.N.; Sherman, A. Airfoil Section Characteristics as Affected by Variations of the Reynolds Number; NACA Technical Report; TR-586; NACA: Phoenix, AZ, USA, 1937.
- Critzos, C.C.; Heyson, H.H.; Boswinkle, R.W. Aerodynamic Characteristics of NACA 0012 Airfoil Section at Angles of Attack from 0° to 180°; NACA Technical Note; TN-3361; NACA: Phoenix, AZ, USA, 1955.
- Sheldahl, R.E.; Klimas, P.C. Aerodynamic Characteristics of Seven Symmetrical Airfoil Sections through 180 Degree Angle of Attack for Use in Aerodynamic Analysis of Vertical Axis Wind Turbines; SANDIA Technical Report; SAND80-2114; SANDIA: Livermore, CA, USA, 1981. [Google Scholar]
- Kirke, B.; Lazauskas, L. Variable pitch Darrieus water turbines. J. Fluid Sci. Technol. 2008, 3, 430–438. [Google Scholar] [CrossRef] [Green Version]
- Claessens, M.C. NACA 0018 Measurement Report; Technical Report; Delft University of Technology: Delft, The Netherlands, 2006. [Google Scholar]
- Dominy, R.; Lunt, P.; Bickerdyke, A.; Dominy, J. Self-starting capability of a Darrieus turbine. Proc. Inst. Mech. Eng. J. Power Energy 2007, 221, 111–120. [Google Scholar] [CrossRef] [Green Version]
- Worasinchai, S.; Ingram, G.; Dominy, R. A low-Reynolds-number, high-angle-of-attack investigation of wind turbine aerofoils. Proc. Inst. Mech. Eng. J. Power Energy 2011, 225, 748–763. [Google Scholar] [CrossRef]
- Simao Ferreira, C.J.; van Zuijlen, A.; Bijl, H.; van Bussel, G.; van Kuik, G. Simulating dynamic stall in a two-dimensional vertical-axis wind turbine: Verification and validation with particle image velocimetry data. Wind Energy 2010, 13, 1–17. [Google Scholar] [CrossRef]
- Castelli, M.R.; Englaro, A.; Benini, E. The Darrieus wind turbine: Proposal for a new performance prediction model based on CFD. Energy 2011, 36, 4919–4934. [Google Scholar] [CrossRef]
- Li, C.; Zhu, S.; Xu, Y.L.; Xiao, Y. 2.5D large-eddy simulation of vertical axis wind turbine in consideration of high angle of attack flow. Renew. Energy 2013, 51, 317–330. [Google Scholar] [CrossRef] [Green Version]
- Biadgo, A.M.; Simonovis, A.; Komarov, D.; Stupar, S. Numerical and analytical investigation of vertical axis wind turbine. FME Trans. 2013, 41, 49–58. [Google Scholar]
- Chen, C.C.; Kuo, C.H. Effects of pitch angle and blade camber on flow characteristics and performance of small-size Darrieus VAWT. J. Vis. 2013, 16, 65–74. [Google Scholar] [CrossRef]
- Gupta, R.; Biswas, A.; Sharma, K.K. Comparative study of a three-bucket Savonius rotor with a combined three-bucket Savonius-three-bladed Darrieus rotor. Renew. Energy 2008, 33, 1974–1981. [Google Scholar] [CrossRef]
- Batista, N.C.; Melicio, R.; Matias, J.C.O.; Catalao, J.P.S. Self-start evaluation in lift-type vertical axis wind turbines: Methodology and computational tools applied to asymmetrical airfoils. In Proceedings of the International Conference on Power Engineering, Energy and Electrical Drives, Malaga, Spain, 11–13 May 2011. [Google Scholar] [CrossRef]
- Beri, H.; Yao, Y. Computational analysis of vertical axis wind turbine with open-able airfoil. In Proceedings of the Asia–Pacific Power and Energy Engineering Conference, Wuhan, China, 25–28 March 2011. [Google Scholar]
- Beri, H.; Yao, Y. Double multiple stream tube model and numerical analysis of vertical axis wind turbine. Energy Power Eng. 2011, 3, 262–270. [Google Scholar] [CrossRef] [Green Version]
- Islam, M.; Ting, D.S.-K.; Fartaj, A. Aerodynamic models for Darrieus-type straight-bladed vertical axis wind turbines. Renew. Sustain. Energy Rev. 2008, 12, 1087–1109. [Google Scholar] [CrossRef]
- Vassberg, J.C.; Gopinath, A.K.; Jameson, A. Revisiting the vertical-axis wind-turbine design using advanced computational dynamics. AIAA Paper 2005, 47. [Google Scholar]
- Armstrong, S.; Fiedler, A.; Tullis, S. Flow separation on a high Reynolds number, high solidity vertical axis wind turbine with straight and canted blades with fences. Renew. Energy 2012, 41, 13–22. [Google Scholar] [CrossRef]
- Yao, J.; Wang, J.; Yuan, W.; Wang, H.; Cao, L. Analysis on the influence of turbulence model changes to aerodynamic performance of vertical axis wind turbine. Procedia Eng. 2012, 31, 274–281. [Google Scholar] [CrossRef] [Green Version]
- Worasinchai, S.; Ingram, G.; Dominy, R. Effects of wind turbine starting capability on energy yield. J. Eng. Gas Turbines Power 2012, 134, 1–9. [Google Scholar] [CrossRef]
- De Tavernier, D.; Ferreira, C.; van Bussel, G. Airfoil optimisation for vertical-axis wind turbines with variable pitch. Wind Energy 2019, 22, 547–562. [Google Scholar] [CrossRef]
- McLaren, K.W.; Tullis, S.W.; Ziada, S. Vibration response behaviour of a high solidity, low rotational velocity, vertical axis wind turbine. ASME Paper 2010, 30541. [Google Scholar]
- Howell, R.; Qin, N.; Edwards, J.; Durrani, N. Wind tunnel and numerical study of a small vertical axis wind turbine. Renew. Energy 2010, 35, 412–422. [Google Scholar] [CrossRef] [Green Version]
- Mohamed, M.H. Performance investigation of H-rotor Darrieus turbine with new airfoil shapes. Energy 2012, 47, 522–530. [Google Scholar] [CrossRef]
- Ning, X.; Wan, D. LES Study of wake meandering in different atmospheric stabilities and its effects on wind turbine aerodynamics. Sustainability 2019, 11, 6939. [Google Scholar] [CrossRef] [Green Version]
- Moleyn Baca, J.A.; Expysito Gonzalez, A.J.; Gutirrez Montes, C. Analysis of the patent of a protective cover for vertical-axis wind turbines (VAWTs): Simulations of wind flow. Sustainability 2020, 12, 7818. [Google Scholar] [CrossRef]
- Zannetti, L.; Gallizio, F.; Ottino, G. Vortex capturing vertical axis wind turbine. J. Phys. Conf. Ser. 2007, 75, 012029. [Google Scholar] [CrossRef]
- Gorelov, D.N.; Krivospitsky, V.P. Prospects for development of wind turbines with orthogonal rotor. Thermodyn. Aeromechanics 2008, 15, 153–157. [Google Scholar] [CrossRef]
- Hill, N.; Dominy, R.; Ingram, G.; Dominy, J. Darrieus turbines: The physics of self-starting. Proc. Inst. Mech. Eng. J. Power Energy 2009, 223, 21–29. [Google Scholar] [CrossRef]
- Hwang, I.S.; Lee, Y.H.; Kim, S.J. Optimization of cycloidal water turbine and the performance improvement by individual blade control. Appl. Energy 2009, 86, 1532–1540. [Google Scholar] [CrossRef]
- Batista, N.C.; Melicio, R.; Matias, J.C.O.; Catalao, J.P.S. New blade profile for Darrieus wind turbines capable to self-start. In Proceedings of the IET Conference on Renewable Power Generation, Edinburgh, UK, 6–8 September 2011. [Google Scholar]
- Rossetti, A.; Pavesi, G. Comparison of different numerical approaches to the study of the H-Darrieus turbines start-up. Renew. Energy 2013, 50, 7–19. [Google Scholar] [CrossRef]
- Anthony, M.; Prasad, V.; Raju, K.; Alsharif, M.H.; Geem, Z.W.; Hong, J. Design of rotor blades for vertical axis wind turbine with wind flow modifier for low wind profile areas. Sustainability 2020, 12, 8050. [Google Scholar] [CrossRef]
Figure 1.
Forces in relation to aerofoil geometry.

Figure 2.
Apparent flow as seen by a rotating aerofoil (looking down from above a VAWT).

Figure 3.
AOAs and Reynolds numbers experienced by aerofoil at varying TSRs.

Figure 4.
Standard NACA-0012 aerofoil.

Figure 5.
Cross section of vented aerofoil (a) with open inside and (b) with closed inside.

Figure 6.
Solid models of (a) the standard blade and (b) the vented blade.

Figure 7.
Geometry of the computational domain and boundary conditions.

Figure 8.
Vented aerofoil mesh. Fragments (a–c) show different details of the mesh.

Figure 9.
Variation in lift and drag as a function of first layer thickness ( = 10°, ).

Figure 10.
Lift as a function of AOA at .

Figure 11.
Drag as a function of AOA at .

Figure 12.
Comparison of aerodynamic performance of the different vented aerofoils reference to the standard aerofoil: (a) drag at = 0°, (b) tangential force at = 10°, (c) drag at = 180°, (d) lift at = 8° for all vented and standard aerofoils.
Figure 12.
Comparison of aerodynamic performance of the different vented aerofoils reference to the standard aerofoil: (a) drag at = 0°, (b) tangential force at = 10°, (c) drag at = 180°, (d) lift at = 8° for all vented and standard aerofoils.

Figure 13.
Lift as a function of AOA at .

Figure 14.
Lift as a function of AOA over range (a) 0° < < 30° and (b) 150° < < 180° at .

Figure 15.
Drag as a function of AOA at .

Figure 16.
Drag as a function of AOA over range (a) 0° < < 30° and (b) 150° < < 180° at .

Figure 17.
Tangential force as a function of AOA at .

Figure 18.
Tangential force as a function of AOA over range (a) 0° < < 30° and (b) 150° < < 180° at .
Figure 18.
Tangential force as a function of AOA over range (a) 0° < < 30° and (b) 150° < < 180° at .

Figure 19.
Pressure coefficient contours (a) and stream lines (b) for selected geometries at = 10° ().
Figure 19.
Pressure coefficient contours (a) and stream lines (b) for selected geometries at = 10° ().

Figure 20.
Pressure coefficient contours (a) and stream lines (b) for selected geometries at = 12° ().
Figure 20.
Pressure coefficient contours (a) and stream lines (b) for selected geometries at = 12° ().

Figure 21.
Close-up of the trailing edge of the streamline plot for the vented V4a aerofoil for = 10° at ().
Figure 21.
Close-up of the trailing edge of the streamline plot for the vented V4a aerofoil for = 10° at ().

Figure 22.
Pressure coefficient contours (a) and stream lines (b) for selected geometries at = 172° ().
Figure 22.
Pressure coefficient contours (a) and stream lines (b) for selected geometries at = 172° ().

Figure 23.
Pressure coefficient contours (a) and stream lines (b) for selected geometries at = 176° ().
Figure 23.
Pressure coefficient contours (a) and stream lines (b) for selected geometries at = 176° ().

Figure 24.
Coefficient of power as a function of TSR for three-bladed VAWT.

Figure 25.
Coefficient of power as a function of TSR for three-bladed VAWT.

Figure 26.
Average starting torque on a stationary three-bladed VAWT as a function of wind speed.


Table 1.
Different vented aerofoils used in CFD simulations.
| Case | Number of Vents | Vent Opening | Vent Spacing | Opening Ratio | Inside |
|---|---|---|---|---|---|
| V4a | 8 | 0.33 | Open | ||
| V4b | 8 | 0.20 | Open | ||
| V4d | 8 | 0.33 | Closed | ||
| V5a | 10 | 0.27 | Open | ||
| V5b | 10 | 0.25 | Open | ||
| V6 | 12 | 0.28 | Open | ||
| A | 0 | — | — | — | Closed |
Table 2.
Mesh parameters for standard aerofoil.
| Inflation layer | First layer thickness | |
| Number of layers | 26 | |
| Growth rate | 1.2 | |
| Aerofoil edge sizing | Flow-wise | |
| Span-wise | 1 | |
| Body of influence | Radius 1 | |
| Sizing 1 | ||
| Growth rate | 1.12 | |
| Radius 2 | ||
| Sizing 2 | ||
| Growth rate | 1.12 | |
| Global parameters | Max face size | |
| Growth rate | 1.12 | |
| Statistics | Number of nodes | 175,000 |
| Number of cells | 380,000 |
Table 3.
Mesh parameters for vented aerofoil.
| Inner aerofoil inflation | First layer thickness | |
| Number of layers | 26 | |
| Growth rate | 1.08 | |
| Statistics | Nodes | 500,000 |
| Elements | 1,100,000 |
Publisher’s Note: MDPI stays neutral with regard to jurisdictional claims in published maps and institutional affiliations. |
© 2021 by the authors. Licensee MDPI, Basel, Switzerland. This article is an open access article distributed under the terms and conditions of the Creative Commons Attribution (CC BY) license (https://creativecommons.org/licenses/by/4.0/).
Share and Cite
MDPI and ACS Style
Mitchell, S.; Ogbonna, I.; Volkov, K. Improvement of Self-Starting Capabilities of Vertical Axis Wind Turbines with New Design of Turbine Blades. Sustainability 2021, 13, 3854. https://0-doi-org.brum.beds.ac.uk/10.3390/su13073854
AMA Style
Mitchell S, Ogbonna I, Volkov K. Improvement of Self-Starting Capabilities of Vertical Axis Wind Turbines with New Design of Turbine Blades. Sustainability. 2021; 13(7):3854. https://0-doi-org.brum.beds.ac.uk/10.3390/su13073854
Chicago/Turabian StyleMitchell, Samuel, Iheanyichukwu Ogbonna, and Konstantin Volkov. 2021. "Improvement of Self-Starting Capabilities of Vertical Axis Wind Turbines with New Design of Turbine Blades" Sustainability 13, no. 7: 3854. https://0-doi-org.brum.beds.ac.uk/10.3390/su13073854
Note that from the first issue of 2016, this journal uses article numbers instead of page numbers. See further details here.