
Analyzing Local Government Capacity and Performance: Implications for Sustainable Development


Department of Public Administration, Gachon University, Seongnam-si, Gyeonggi-do 13120, Korea
Sustainability 2021, 13(7), 3862; https://0-doi-org.brum.beds.ac.uk/10.3390/su13073862
Submission received: 15 February 2021
/
Revised: 23 March 2021
/
Accepted: 25 March 2021
/
Published: 31 March 2021
(This article belongs to the Section Sustainable Urban and Rural Development)
Abstract
:Local infrastructure development is a crucial goal for sustainable development, for which local governments take charge of developmental policies. This implies that the capacity of the local government determines the performance of the developmental policies—local infrastructure development. In this sense, this study investigated the impact of local government capacity, measured via the quantity and the quality of human and financial resource factors, on its performance. Moreover, the study examined which of the multidimensional government capacity components affect performance, controlling a competition effect or spillover effect among localities. The study analyzed panel data containing six years (2013–2018) of information on 152 local bodies in Korea, employing the spatial autoregressive model, which is useful for controlling geographical spatial effects. The data show that, unlike the quality factors, the quantity of government capacity does not have a significant effect on its performance. Furthermore, the data also indicated that there are competition effects in relation to the performance of local development. The results imply that local governments need to improve the quality of managerial government capacity in order to increase their sustainable development performance.
1. Introduction
Public policy can be simply divided into developmental and redistributive policies. Redistributive policies are related to reallocating societal resources, and developmental policies refer to establishing the physical and social infrastructure that is necessary to facilitate economic growth. As regards the type of policies, in many countries, the central government takes charge of redistributive policies. This is because, at the very least, people in a country should receive equal minimum welfare benefits, regardless of where they live. However, local governments are in charge of developmental policies due to the fact that local developments must be designed and implemented according to their own specific characteristics [1].
Among the two types of policies, this study focuses on the developmental policies related to local development. In particular, this study analyzes the degree of infrastructure development resulting from the developmental policies implemented by local governments and discusses implications for sustainable development. In general, sustainable development is recognized as an integrated approach that pursues the three core values of economy, society, and the environment. Though various different kinds of sustainable development goals (SDGs) have been suggested, infrastructure development is enshrined within SDGs as a crucial element. This means that infrastructure development, as social overhead capital (SOC), is not just a sufficient condition for sustainable development, but a necessary one. In this sense, continuous and successful promotion of infrastructure development is an important performance goal of local governments.
While various different determinants of the performance of local governments have been discussed, the most significant factor in public policy is the capacity of the government. Several studies have been conducted on government capacity (GC) [2,3,4], reporting on the relationship between GC and government performance [5,6,7,8,9]. However, several questions remain that have not been clearly answered. First, most prior studies have not provided a theoretical framework for the link between GC and performance. Second, such studies have also not suggested a theoretical background for the measurement of GC. The literature indicates that authors use their intuition and experience for measuring this. Third, prior studies have not clearly explained which factors within GC influence performance and which factors do not. Most studies have regarded GC as just one factor, such as the number of civil servants; however, it should be studied in the context of more diverse and detailed factors, with the impact of the various aspects of GC being tested. Consequently, to fill in the knowledge gaps of the literature, this study adopted two theories: Systems theory, that implies the dependence of policy output on input and throughput, and Resource based theory, that demonstrates the importance of resources for better performance. By employing these theories, this research presents the theoretical background and a framework for the concept and measurement of GC, the relationship between GC and performance, and for testing performance competition between local governments in the context of infrastructure development.
Specifically, this study seeks to address three research questions pertaining to the association between GC and performance. First, this study tested whether local government capacity has a positive effect on performance. Secondly, if so, which specific multidimensional local government capacity components affect performance was investigated. Finally, the study examined whether the performance of local governments is affected by neighboring local governments. That is, the research determined whether there is a competition effect or spillover effect between localities and in what direction this affects performance.
To answer these questions, the study defined GC as human and financial resources, while defining performance as infrastructure development. Then, the study gathered data on local governments’ GC and performance in Korea, between 2013 and 2018. Local governments in Korea consist of 17 macro-level and 226 primary-level bodies. Macro-level bodies represent one special city (Seoul), six metropolitan cities such as Busan and Incheon, and eight “DOs” for example Gyeonggi-do and Gangwon-do, which are similar to provinces. Primary-level bodies fall within the jurisdiction of each macro-level body, which affects the degree of local development. Specifically, 74 primary-level entities under the special and metropolitan cities are relatively well developed with a higher level of infrastructure than the other 152 ones in “Dos.” This study investigates the 152 developing entities, focusing on the association between GC and performance by using a spatial autoregressive model (SAR) to control spatial effects.
As explained in detail in the following sections, the findings of the study are as follows. Not all components of GC affect the performance of developmental policies, however, the quality of GC does. The study demonstrates that the inefficiency factor negatively affects government performance, while fiscal autonomy of revenue collection yielded positive effects. Additionally, the inter-local competition effect pertaining to infrastructure development can clearly be observed.
The rest of this article is structured as follows. The next section provides the theoretical framework and reviews prior research used to devise the hypotheses. In the third section, the methodology of the study is described, and the results of the regression analysis are presented. The final section discusses the implications of the findings.
2. Government Capacity and Performance
2.1. Government Capacity
Many scholars in the field of public policy have examined the concept of GC. However, consensus has not been reached on how to define or measure it. This study reviewed prior literature regarding the concept and the measurement of GC and endeavored to find alternative uses for it. In the context of different research studies, the concept of capacity was reviewed to compare how the various studies defined and utilized capacity. Then, this study reviewed empirical research about GC that investigated management and fiscal capacity.
The dictionary definition (https://www.lexico.com/en/definition/capacity, accessed on 1 January 2021) of capacity is “the ability or power to do, experience, or understand something,” “the maximum amount that something can contain,” or “amount that something can produce.” A related term, capability, is defined in the dictionary (https://www.lexico.com/en/definition/capability, accessed on 1 January 2021) as “power or ability,” “the extent of someone’s or something’s ability,” or “forces or resources giving a country or state the ability to undertake a particular kind of military action.” The common ground between the meanings of capability and capacity is “ability.” While capability focuses on “ability” or “resources,” capacity additionally encompasses the meaning of volume to contain something [10]. For “ability,” the two concepts—capability and capacity—have the same dictionary meaning. Academic literature rarely distinguishes between the two terms. Most studies in the field of public administration or political science account for the two terms as the power or the ability of government, and regard them as having interchangeable definitions.
The first mention and conceptualization of GC occurred in a number of pioneering studies (see Table 1 and Table 2) [2,3,4,11]. Honadle [4] defined capacity as “the ability to anticipate and influence change; make informed, intelligent decisions about policy; develop programs to implement policy; attract and absorb resources; manage resources; and evaluate current activities to guide future actions.” Ingraham and Donahue [12] stated that management capacity indicates “government’s intrinsic ability to marshal, develop, direct, and control its human, physical, and information capital to support the discharge of its policy directions” (p. 577). Similarly, Donahue, Selden and Ingraham [3] described management capacity as a “government’s ability to develop, direct, and control its resources to support the discharge of its policy and program responsibilities” (p. 384). Second movers adopted the former studies’ conceptualization and expanded or applied capacity according to research focuses. Van Slyke [13] demonstrated management capacity as “personnel, oversight and program audit capabilities, and the necessary communication and political skills” (p. 296). Particularly, for management capacity, personnel must possess “contract-management experience, policy expertise, negotiation, bargaining, and mediation skills” (p. 296). Meanwhile, Hou, et al. [14] classified GC as “the administrative capacity approach” and “the governance capability approach.” The former refers to aspects of the administration that considers “the importance of policies, procedures, and resources governing administrative action” (p. 300). The latter approach embraces external aspects such as political influences. The authors considered capability as the rules or equilibrium that are devised and restricted by political choice, an institution, and the rule of law—adopting the perspective of New Institutional Economics [10].
2.1.1. Management Capacity
Most empirical literature has not developed its own theoretical concept of “capacity.” The research literature asserts that the concept of GC “does not exist on its own” but rather exists “in relation to its application” [16] (p. 6). Thus, many studies have presented their measurement methods without a thorough discussion on the definition of GC. Carley, et al. [17] demonstrated capacity in terms of relevant technical skills, relevant organizational experiences, adequate resources, cognitive skills, and human capital (p. 116). They operationalized GC with two variables: policy experience and financial management. To measure the concept of administrative capacity, Terman and Feiock [16] used five components: overall capacity, managerial capacity, dedicated sustainability staffing, lack of staff capacity, and lack of information resources. Terman and Feiock [18] (a) measured “administrative capacity” using the number of financial management employees; (b) “policy capacity” was quantified as a dummy variable coded as “1” if the city had at least one member for sustainability programs; and (c) “management structure” was coded as “1” if a municipality was managed using a council-manager system (p. 333).
2.1.2. Fiscal Capacity
While GC mainly concerns management capacity, a subordinate concept to GC is about fiscal policy. It is called fiscal capacity but is also referred to as “tax capacity,” because major revenues come from taxes [21,22,23,24,25,26,27]. Literature has discussed fiscal capacity chiefly as pertaining to the ability to raise revenue. The Advisory Commission on Intergovernmental Relations [28] defined fiscal capacity as “the resources which a taxing jurisdiction can tax to raise revenue for public purposes” (p. 3). As the aspect focuses on how much revenue governments can secure through taxes, some scholars prefer the term tax capacity over fiscal capacity [27,29,30]. ACIR defines tax capacity as “the capability of a governmental entity to finance its public services” [29] (p. 158).
The other approach to fiscal capacity focuses on the portion of government revenue dedicated to spending. When evaluating the fiscal policy, it is critical to consider how to secure and use the revenue. Following that rationale, higher fiscal capacity would point to a government’s potential ability to obtain revenue, and higher fiscal capacity helps governments to develop public services. Mikesell [31] insisted that “states with higher fiscal capacity have greater budgetary possibilities than do those with lower capacity” (p. 545). Similarly, Hou and Moynihan [8] used the concept of countercyclical fiscal capacity (CCFC) and stated that fiscal capacity “also includes the ability to allocate financial resources to deal with future events” (p. 141). CCFC indicates “the fiscal [tool] to minimize disruption from revenue shocks” (p. 142). Borge, et al. [32] demonstrated the relationship between fiscal capacity and government efficiency, asserting that fiscal capacity could lower efficiency. They used government revenue as a proxy for fiscal capacity. Wang and Zhao [33] used the concept of fiscal capacity to explain government behavior and, for measuring fiscal capacity, employed per capita annual state revenue.
In sum, the research literature on fiscal capacity was reviewed using two aspects: securing and using revenue. As these aspects both concern revenue, any method used to measure fiscal capacity should choose a variable that reflects revenue. Another implication from the review is that the measurement of fiscal capacity can vary according to the topic of research or the purpose [10]. Mikesell [31] stated, “no single approach to capacity measurement will meet all analytical expectations.” Thus, provided that the measurement retains inherent attributes of fiscal capacity, the measurement method can be flexible.
2.2. Theoretical Framework for the Association between Government Capacity and Performance
This section proposes the theoretical framework of the present study by presenting two background theories: Systems theory and Resource-Based Theory (RBT). Systems theory provides the background logic that is used to explain how GC affects performance. RBT concerns the measurement of GC and the reason for the significance of GC in terms of performance.
2.2.1. Systems Theory
Systems theory is “an approach to organizations that focuses on how they translate inputs into outputs” [34]. Historically, system thinking existed in the form of a theory to explain organizations. However, since von Bertalanffy’s research, scholars have used General Systems Theory (GST), which can be applied to public policy fields [35] (p. 394).
Systems theory is categorized into two approaches: closed system and open system. The former regards an organization as a machine which is not affected by the environment. This approach focuses on “the internal workings of the system” [34]. Therefore, it has a mechanistic or nonliving systems approach. The open-system approach supposes that an organization is open to the environment. Like organic or living systems, organizations react to the impact of the environment and interact with each other [10].
However, the modern organization theory is more in tune with the open-systems theory [34,35,36,37]. As an open-system, an organization receives “inputs of resources”, administers transformational processes, and then produces outputs such as public services. Even after outputs, the open-system operates as a feedback loop, a learning process for a government (organization) to reflect an experience to the new recurring process [34]. By cycling through the phases of the system, a government becomes a more effective and efficient organization [10].
The most significant thing for any organization is self-preservation. Systems theory focuses on the purpose of government (organization) and seeks the best way to fulfill the aim—via the process of translating inputs into outputs. Two abilities are essential to an organization’s successful processes and viability: (1) “capacity to manipulate or adapt to its external environment” and (2) “capacity to suppress or moderate internal threats” [34] (pp. 102–104). That is, the systems theory implies that as an open-system, an organization must continue to improve its capacity, monitor environmental changes, and adapt to make the best use of the changes [10].
2.2.2. Resource-Based Theory
GC is closely associated with resources. Resources remarkably affect strategies to build capacity; resources are a feature of higher-capacity organizations. Public policy scholars recently have acknowledged the emerging importance of resources by citing RBT [38,39].
RBT or the Resource-Based View (RBV) emerged when Wernerfelt [40] proposed the concept, which insists that a firm’s performance is dependent on its resources. Before the RBT, the dominant paradigm in industrial organization economics was SCP (structure-conduct-performance), which contends that a firm’s market power impacts performance in the industry structure [41]. According to RBT, organizations that outperform others have a diverse portfolio of idiosyncratic resources [39,41,42]. RBT had previously been discussed mainly in the areas of business administration and economics; however, several scholars in public administration have accepted and used the theory [39,43,44,45,46,47].
Recognizing that resources are crucial to the performance of an organization, it needs to first define the concept of “resource.” Barney and Clark [41] proposed four attributes that a firm’s resources should have:
(a) it must be valuable, in the sense that it exploits opportunities and/or neutralizes threats in a firm’s environment, (b) it must be rare among a firm’s current and potential competition, (c) it must be imperfectly imitable, and (d) a firm’s organizational process must be able to exploit it.(p. 57)
In terms of examples of resources, prior literature [38,39] reviews the concept of “resources” as a broad term that refers to the diverse types of assets that an organization can exploit to achieve performance and goals. In support of this perspective, Barney [48] stated, “resources include all assets, capabilities, organizational processes, firm attributes, information, knowledge, etc. controlled by a firm that enable the firm to conceive of and implement strategies that improve its efficiency and effectiveness” (p. 101). In an empirical study that accounted for RBT, Lee and Whitford [39] proposed six organizational resources that predicted performance: “administrative (structural) resources, human resources, financial resources, physical resources, political resources, and reputation resources” (p. 690). These factors affect organizational performance, which implies that RBT is meaningful in predicting performance [10].
2.2.3. Framework for the Link between Government Capacity and Performance
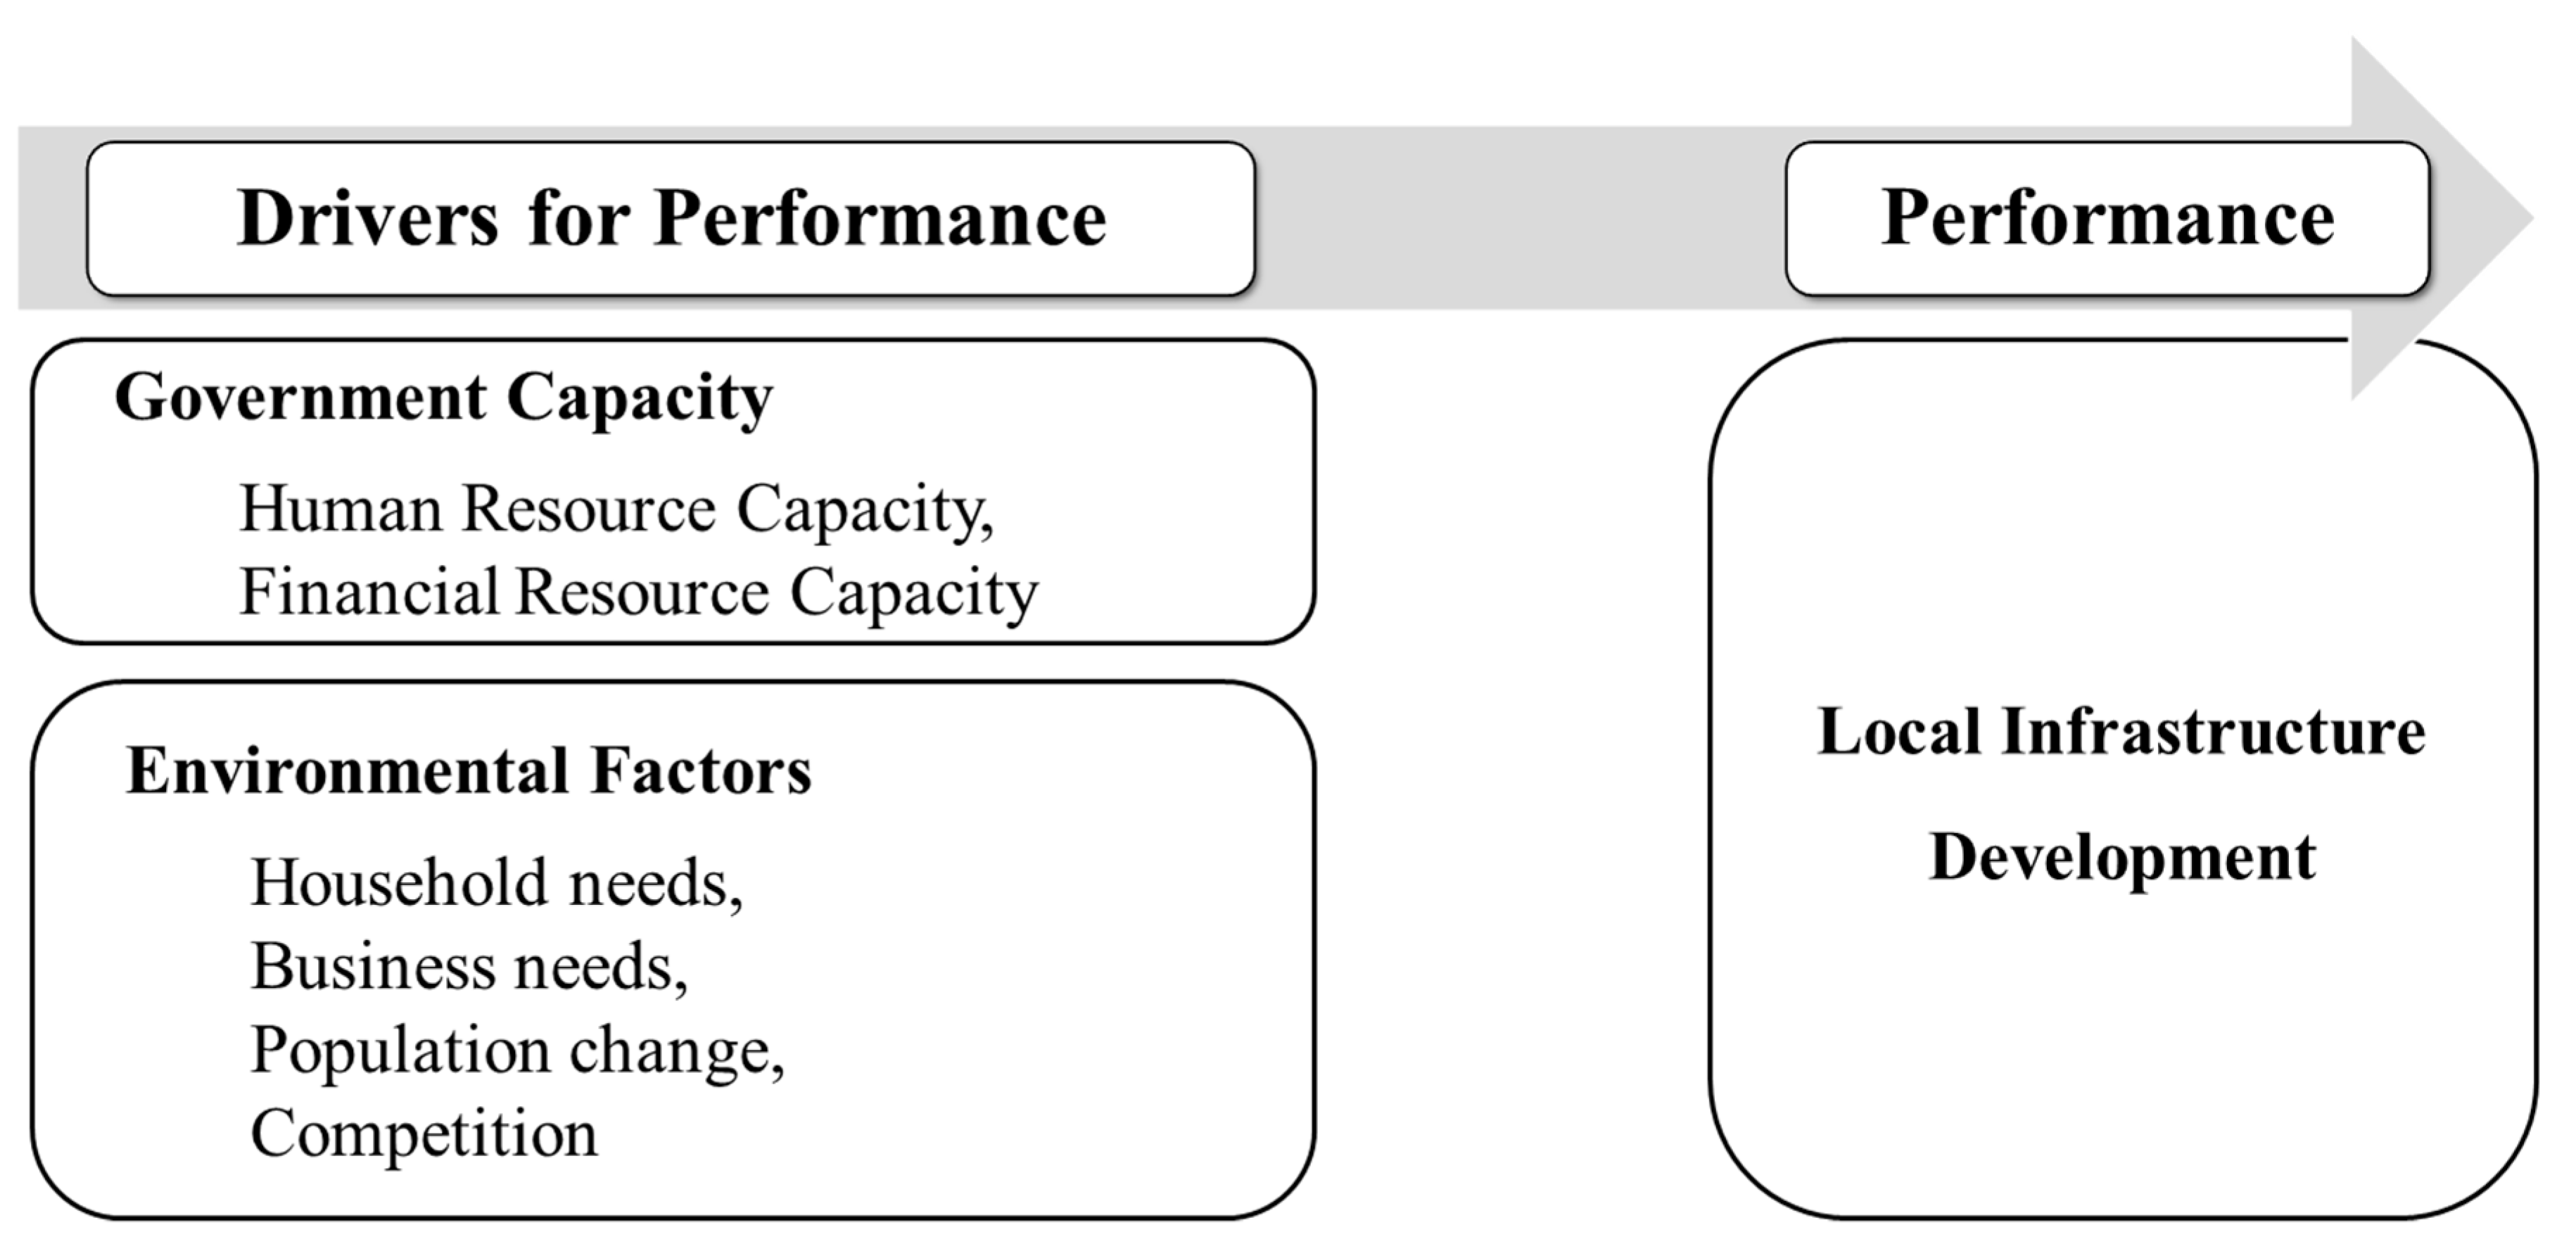
Borrowing from systems theory and RBT, this study established a theoretical framework linking GC and performance. First, the implication of systems theory is that output is a result of input and throughput. That is, the performance of government depends on how well the phases of input and throughput performed. In addition, because government is an open-system organization, the adaptability and manipulability of the external environment are also significant; the input and throughput phases must secure abilities (capacities). Second, RBT implies that good resources are key factors enabling a government to exceed the benchmarks set by its neighbors. RBT also provides a background to identify the factors that are considered to be components of GC. An empirical study [39] supported the rationale of RBT by considering several resources to be components of capacity (e.g., administrative, human, and financial resources) [10].
Based on systems theory and RBT, this study proposed a framework for the relationship between GC and performance. The framework, Figure 1, presents an open system, in which output (performance) depends on input/throughput (GC, local needs, and competition).
Government can control or manage only GC, among the factors of input and throughput. Thus, this study focuses on GC which is the key independent variable affecting its performance.
3. Research Methods and Results
3.1. Research Hypotheses and Conceptual Framework
This study analyzed the link between GC and local development performance, considering the competition effect and other variables’ influences. Based on the previous studies [7,10,39,41] and theoretical backgrounds regarding the relation between GC and performance, I hypothesized that more capable local governments would achieve a greater performance.
Hypothesis 1 (H1):
More capable governments will achieve a greater performance.
The study also included an analysis of the impact of surrounding localities. Studies such as Berry and Baybeck [49] illustrate how local government policies are diffused, with learning hypotheses and benefit competition hypotheses. In other words, development or benchmarking by referring to the policy cases of neighboring local governments would affect a local government. In this regard, I posed a research hypothesis asserting that interlocal competition would affect local governments’ performance.
Hypothesis 2 (H2):
The competition factor will affect performance.
3.2. Research Design and Method
3.2.1. Data and Unit of Analysis
To conduct regression analyses, I collected data on local governments’ capacity and performance. First, the Local Government Yearbook issued by the Korea Research Institute for Local Administration (KRILA) and the Local Finance Yearbook from the Ministry of Public Administration and Security was used. Second, statistical data for measuring policy environmental variables were collected and compiled nationwide from the Statistics City Yearbook of Korea by the Korea National Statistical Office (KOSIS).
The unit of analysis was local government. Korea’s Local Autonomy System consists of one central government; 17 high-level governments including Seoul Special City, six metropolitan cities, and eight provinces (‘DO’); and 226 low-level local governments which are ‘si,’ ‘gun,’ and ‘gu.’ The research selected only 152 primary-level bodies for quantitative analysis, because the other 74 low-level bodies which fall within Seoul or six metropolises are absolutely well developed with a higher level of infrastructure than the 152 localities. The study pooled the data for 152 low-level local governments of Korea, from 2013 to 2018. Consequently, this left us with 152 local governments and 760 observations for the research model, which decreased to 152 after accounting for a one-year lag for explanatory variables.
3.2.2. Dependent and Explanatory Variables
The analysis used local infrastructure development as the dependent variable which indicates the performance of local governments’ developmental policies. Specifically, the dependent variable is operationalized and measured by “infrastructure development rate” indicator which is reported by the Korea Research Institute for Local Administration (KRILA), a government-affiliated body and established by the KRILA Act. According to the Local Government Yearbook, annually released by KRILA, the rate is computed as the average of water supply rate, sewer treatment rate, and urban area ratio. Specifically, the water supply rate means the proportion of the population receiving water among the total population (water supply population/total population). The sewerage treatment rate is calculated from among the total population as the ratio of persons receiving related services through public sewage treatment facilities and wastewater termination facilities. The urban area ratio represents the proportion of densely developed territory, and in this study, the ratio was calculated by dividing the sum of areas of residential, commercial, and industrial urban land uses by the total city area. In this article, therefore, a higher infrastructure development rate, integrating the three factors, indicates a better performance of local governments.
The independent variable is GC, which was categorized into four dimensions: human resource capacity 1 (HC1), human resource capacity 2 (HC2), financial resource capacity 1 (FC1), and financial resource capacity 2 (FC2). On the one hand, the human resource capacity is the number of civil servants normalized by 1000 residents (HC1) and the percentage of senior officials (HC2) in which higher values mean inefficient management. Based on prior conceptual and empirical studies of capacity, HC1 signifies the quantity of an organization’s resources. Some previous literature reported that larger organizations achieved greater performance, e.g., [9,10,15,16]. While HC1 reflects the quantity of HC, HC2 refers to the quality of HC, which is measured as the percentage of senior officials who are high-ranking officials at Level 5 or higher. Higher percentage is regarded as a higher degree of inefficiency, because it means that the ratio of managers to non-managers is higher. On the other hand, financial resource capacities are set as the own source revenue ratio (FC2) and expenditure size (FC1). The own source revenue ratio is calculated by dividing own source (local tax and non-tax revenue) by total revenue. Expenditure size is normalized by the number of residents, therefore FC1 means per capita expenditure of a city.
A number of controls were also included in the model to account for other plausible explanations of local development. Infrastructure development is associated with the local needs of households and businesses. “Households’ needs” were measured by population density, which indicates the number of residents per unit of area and is associated with more development needs [50]. Additionally, the higher the number of companies, the higher the demand for local development, because a local firm wants favorable business environments, such as high-quality infrastructure, for improving profits. Therefore, the analysis model controlled for “businesses’ needs”, which was operationalized as the number of companies. Moreover, “population change” in a region affects the need for local development. The change is computed by the sum of differences between births and deaths, and migration. Lastly, the study controlled for “competition effect” in that local governments compete with neighboring localities to expand and improve local infrastructure. The effect is returned by spatial coefficients.
Table 3 presents all variables used in the model, along with their description and data sources.
3.2.3. Estimation Routine
The study used the Spatial Autoregressive Model (SAR) for panel data to control the geographical spatial effect, competition effect, between local governments. Specifically, the study used SAR with the fixed effect model to control the effects of time-invariant variables. By using a geographic information system (GIS) program (GeoDa 1.18 and QGIS 3.16), the connectivity map and weight matrix (152 × 152 dimensions) were created. I then estimated the test model with the log of “infrastructure development rate” as the dependent variable on the left-had side of the equation. The regression equation is as follows:
where are strictly exogenous regressors, W is a matrix of weights, and r is a parameter of spatial coefficient.
The SAR model produces outputs of three kinds of impacts: direct impact, indirect impact, and total impact. The direct effects of an explanatory variable indicate its prediction on the dependent variable. The indirect effect would be the impact of the surrounding neighbors’ predictors on the locality’s outcome, which can be regarded as competition effects or spillover effects.
Additionally, the analysis model is a log-linear model, so coefficients indicate the percentage change of dependent variable per additional one unit change of X and the effects are calculated by using derivatives. This means that the explanatory variables affect the rate of expenditure change (), not the unit change [51]. Specifically, the change in the dependent variable is computed as .
3.3. Results: Explaining the Effect of Government Capacity on Performance
Table 4 presents the regression results. The regression model seeks to capture the effect of GC variables—HC1, HC2, FC1, and FC2—on government performance, for which log(infrastructure development rate) was used.
I start with the results for the two hypotheses. First, to test H1, which suggests the relationship between GC and performance, the model used the four GC variables. Yet, only three GC variables—HC2, FC1 and FC2—reach statistical significance. Regarding the direct effect, the coefficient on HC2, the percentage of senior officials, which indicates the inefficiency of local governments, for local development is negative. Specifically, if the percentage of senior officials increases by one unit, the local infrastructure development rate would decrease by 1.65%. It is calculated by for which exp(−0.0166) = 0.9835, therefore = −0.0165. For FC2, which is operationalized by the own source revenue ratio, an additional one ratio would increase the performance by 0.21%, ceteris paribus. In addition, FC1 measured by expenditure of local governments also shows explanatory powers in which a government spending more than others had a higher infrastructure development rate. However, the other GC variable failed to support the association with the dependent variable, which means that the analysis results do not support the expectation that the size of governments operationalized by the number of civil servants affects the local development. These results indicate that the performance of local governments is more affected by the quality of GC rather than just the size. That is, the higher the proportion of civil servants at non-managerial levels and the higher the proportion of its own revenue resources, the higher the level of local government performance. It implies that managerial efficiency and financial soundness are significant for government performance. This result partially supports H1 which expects the positive association between GC and performance.
Second, the study found that local government infrastructure development as an indicator of its performance is affected by neighboring localities’ policy choices. The coefficient on the competition effect for local infrastructure development is positive, indicating the presence of positive competition among neighbors. In addition, the coefficient is statistically significant at the 5% level. This result indicates support for the inter-local competition hypothesis (H2), predicting that local governments compete in increasing their infrastructure development rate.
Finally, the analysis examined the effects of the control variables. The estimation revealed that businesses’ needs are positively associated with local government performance. In other words, localities in which there are higher level of businesses’ needs for infrastructure development are likely to focus on upgrading their infrastructure. However, coefficients of other variables such as households’ needs and population change are not statistically significant. It implies demographic variables are less important, at least in this data, for local governments’ developmental policy compared to businesses’ needs.
4. Discussion and Conclusions
The issue of uneven regional development is a critical social problem to be solved. In general, local bodies in Korea have substantially and rapidly developed over a short period of time compared to the past. However, there is a wide gap in the degree of development, such as infrastructure, between urban and rural localities, and uneven development among low-level local bodies under Seoul and the other provinces. This problem is not limited to Korea but is also faced by other developed and developing countries. To solve the problem, different levels of development must be mitigated, which can ensure local sustainability.
This article focuses on the importance of local government’s capacity to improve local development level rather than other factors, because local governments are in charge of developmental policies in a country, and GC could be improved by policy efforts. This study, therefore, began with the question of which GC factors affect government performance. In addition, referring to Tiebout’s hypothesis, this study examined whether local governments compete with neighboring localities to improve their performance.
As a result, the analysis data show that not all components of GC would affect government performance. HC1, for instance, does not have a statistical significance on the performance. It is consistent with some previous literature [7,16,18] in which the effect of government size on performance, such as the number of employees, was not statistically significant [16,18] or showed negative association in particular models [7]. Meanwhile, the inefficiency of personnel composition has negative effects on government performance, which indicates that the quality of GC, such as HC2, has explanatory power for performance. As Ukeles [52] insisted that “working smarter” or “doing more with less” is more crucial than the size of resources, the analysis implied that local governments need to focus more on reducing inefficiency for enhancing GC to achieve effective local development.
In terms of the other components of GC, the results imply that a local government with relatively sufficient financial resources is more advantageous for superior performance, consistent with previous studies [8,31,32]. Since local governments in Korea, similar to other countries, are required to use a balanced budget system, a higher expenditure means securing a larger revenue, which in turn means a high financial capacity for better performance. Besides, the effect of own-source revenue ratio indicates that local governments with higher financial operational autonomy are likely to devise and put into effect developmental policies independently, which is closely associated with better performance. Furthermore, the data show that inter-local competition would play a role in improving government performance. The local infrastructure development as the operationalized variable for performance is affected by neighboring localities because of performance diffusion or spillover effect.
The results of the study have strong implications about how local governments would set directions for developmental policies. First, local governments are recommended to review their organizational structure and human resource management. If there are inefficient characteristics regarding personnel composition, they should try to remedy the problems. In other words, to achieve successful local development, it is better for local governments to pay attention to improving efficiency rather than just increasing their size. Second, an important piece of empirical evidence is that high fiscal soundness positively impacts government performance. Local governments are required to establish a decent plan for securing their revenue sufficiently and for managing debt stability, to meet the demands for local development. To do so, local authorities need to pursue both strategies simultaneously: improving financial autonomy by increasing tax effort for more own-source revenue and securing more revenue for development policy by acquiring central government grants.
As highlighted, the contributions of the study to theory and practice are: (1) the relationship between GC and performance was empirically investigated, proposing a theoretical framework and the developed measurements; (2) the proposed concept of GC and the measurement of government performance can be applied to the field of local government studies; and (3) the empirical model suggests that practitioners develop strategies in terms of reducing inefficiency and securing revenue for sustainable development.
The analysis also raises questions for further investigations. First, this article addressed only one aspect among diverse dimensions of sustainable development. Though infrastructure development is definitely a necessary condition for local sustainability especially regarding economic development, it is obvious that both social development and environmental protection should be discussed simultaneously for clarifying sustainable development. This caveat could be a signpost for future studies to analyze another case of developmental policy from the perspective of sustainability. Second, the study finds that superior quality of government capacity would be beneficial for better performance by analyzing infrastructure development such as water and sewage. However, there are different examples of local infrastructure which are administered by local governments. Future studies need to investigate other infrastructures, for instance transportation and energy, in terms of local government capacity. Third, this study categorized policies most simply and focused on developmental policies for the purpose of research. However, as policy typologies, there are various ways to typify a policy. For example, Paul E. Peterson classified policies into three categories, adding allocational policies in his study, i.e., “City Limits.” Furthermore, Theodore J. Lowi’s famous typology presented four types of policies: distributive, redistributive, regulative, and constituent. Different kinds of policies could be addressed by future research. Lastly, the findings of the study comprise only one strand of evidence of the association between local government capacity and performance with the case of Korea. Future research could examine the relationship by expanding the time period of data or identifying additional key variables suitable for other countries.
Funding
This work was supported by the Ministry of Education of the Republic of Korea and the National Research Foundation of Korea (NRF-2018S1A5A8027336).
Institutional Review Board Statement
Not applicable.
Informed Consent Statement
Not applicable.
Data Availability Statement
Not applicable.
Conflicts of Interest
The author declares no conflict of interest.
References
- Peterson, P.E. The Price of Federalism; Brookings Institution: Washington, DC, USA, 1995. [Google Scholar]
- Bowman, A.O.M.; Kearney, R.C. Dimensions of State Government Capability. West. Political Q. 1988, 41, 341–362. [Google Scholar] [CrossRef]
- Donahue, A.K.; Selden, S.C.; Ingraham, P.W. Measuring Government Management Capacity: A Comparative Analysis of City Human Resources Management Systems. J. Public Adm. Res. Theory 2000, 10, 381–412. [Google Scholar] [CrossRef]
- Honadle, B.W. A Capacity-Building Framework: A Search for Concept and Purpose. Public Adm. Rev. 1981, 41, 575–580. [Google Scholar] [CrossRef]
- Christensen, R.K.; Gazley, B. Capacity for public administration: Analysis of meaning and measurement. Public Adm. Dev. 2008, 28, 265–279. [Google Scholar] [CrossRef]
- Hall, J.L. Assessing Local Capacity for Federal Grant-Getting. Am. Rev. Public Adm. 2008. [Google Scholar] [CrossRef]
- Hall, J.L. The Forgotten Regional Organizations: Creating Capacity for Economic Development. Public Adm. Rev. 2008, 68, 110–125. [Google Scholar] [CrossRef]
- Hou, Y.; Moynihan, D.P. The Case for Countercyclical Fiscal Capacity. J. Public Adm. Res. Theory 2008, 18, 139–159. [Google Scholar] [CrossRef] [Green Version]
- Howlett, M. Policy analytical capacity and evidence-based policy-making: Lessons from Canada. Can. Public Adm. 2009, 52, 153–175. [Google Scholar] [CrossRef]
- Choi, N. Government Capacity and the Acquisition, Implementation, and Impact of ARRA Funds; Florida International University: Miami, FL, USA, 2016. [Google Scholar]
- Gargan, J.J. Consideration of Local Government Capacity. Public Adm. Rev. 1981, 41, 649–658. [Google Scholar] [CrossRef]
- Ingraham, P.W.; Donahue, A.K. Dissecting the black box revisited: Characterizing government management capacity. In Governance and Performance: New Perspectives; Heinrich, C.J., Lynn, L.E., Eds.; Georgetown University Press: Washington, DC, USA, 2000; pp. 292–318. [Google Scholar]
- Van Slyke, D.M. The Mythology of Privatization in Contracting for Social Services. Public Adm. Rev. 2003, 63, 296–315. [Google Scholar] [CrossRef]
- Hou, Y.; Moynihan, D.P.; Ingraham, P.W. Capacity, Management, and Performance: Exploring the Links. Am. Rev. Public Adm. 2003, 33, 295–315. [Google Scholar] [CrossRef] [Green Version]
- Topinka, J.P. Does Management Capacity Increase Organizational Performance? An Empirical Analysis of Public Housing Agencies. Ph.D. Thesis, Florida International University, Ann Arbor, MI, USA, 2011. [Google Scholar]
- Terman, J.; Feiock, R. Improving Outcomes in Fiscal Federalism: Local Political Leadership and Administrative Capacity. J. Public Adm. Res. Theory 2014. [Google Scholar] [CrossRef]
- Carley, S.; Nicholson-Crotty, S.; Fisher, E.J. Capacity, Guidance, and the Implementation of the American Recovery and Reinvestment Act. Public Adm. Rev. 2015, 75, 113–125. [Google Scholar] [CrossRef]
- Terman, J.; Feiock, R. Third-Party Federalism: Using Local Governments (and Their Contractors) to Implement National Policy. Publius J. Fed. 2015, 45, 322–349. [Google Scholar] [CrossRef]
- Collins, B.K.; Gerber, B.J. Redistributive Policy and Devolution: Is State Administration a Road Block (Grant) to Equitable Access to Federal Funds? J. Public Adm. Res. Theory 2006, 16, 613–632. [Google Scholar] [CrossRef]
- Jennings, E.T.; Hall, J.L.; Zhang, Z. The American Recovery and Reinvestment Act and State Accountability. Public Perform. Manag. Rev. 2012, 35, 527–549. [Google Scholar] [CrossRef]
- Akin, J.S. Fiscal Capacity and the Estimation Method of the Advisory Commission on Intergovernmental Relations. Natl. Tax J. 1973, 26, 275–291. [Google Scholar] [CrossRef]
- Compson, M.L. Historical Estimates of Total Taxable Resources for U.S. States, 1981–2000. Publius J. Fed. 2003, 33, 55–72. [Google Scholar] [CrossRef]
- Dincecco, M.; Prado, M. Warfare, fiscal capacity, and performance. J. Econ. Growth 2012, 17, 171–203. [Google Scholar] [CrossRef] [Green Version]
- Fox, W.F. Fiscal capacity or resource capacity? In Proceedings of the Annual Conference on Taxation Held under the Auspices of the National Tax Association-Tax Institute of America; National Tax Association: Washington, DC, USA, 1977; pp. 389–396. [Google Scholar]
- Kincaid, J. Fiscal Capacity and Tax Effort of the American States: Trends and Issues. Public Budg. Financ. 1989, 9, 4–26. [Google Scholar] [CrossRef]
- Ladd, H.F. Local Education Expenditures, Fiscal Capacity, and the Composition of the Property Tax Base. Natl. Tax J. 1975, 28, 145–158. [Google Scholar] [CrossRef]
- Lucke, R.B. State Tax Capacity and the Representative Tax System. J. Educ. Financ. 1984, 9, 332–357. [Google Scholar]
- ACIR. Measures of State and Local Fiscal Capacity and Tax Effort; U.S. Advisory Commission on Intergovernmental Relations: Hartford, CT, USA, 1962. [Google Scholar]
- Berry, W.D.; Fording, R.C. Measuring State Tax Capacity and Effort. Soc. Sci. Q. 1997, 78, 158–166. [Google Scholar]
- Tannenwald, R.; Cowan, J. Fiscal Capacity, Fiscal Need, and Fiscal Comfort among U.S. States: New Evidence. Publius J. Fed. 1997, 27, 113–126. [Google Scholar] [CrossRef]
- Mikesell, J. Changing State Fiscal Capacity and Tax Effort in an Era of Devolving Government, 1981–2003. Publius J. Fed. 2007, 37, 532–550. [Google Scholar] [CrossRef]
- Borge, L.-E.; Falch, T.; Tovmo, p. Public sector efficiency: The roles of political and budgetary institutions, fiscal capacity, and democratic participation. Public Choice 2008, 136, 475–495. [Google Scholar] [CrossRef]
- Wang, Y.; Zhao, Z.J. Motivations, Obstacles, and Resources. Public Perform. Manag. Rev. 2014, 37, 679–704. [Google Scholar] [CrossRef]
- Kettl, D.F. The Politics of the Administrative Process; CQ Press: Washington, DC, USA, 2011. [Google Scholar]
- Wang, T.-W. From general system theory to total quality management. J. Am. Acad. Bus. 2004, 4, 394–400. [Google Scholar]
- Miller, J.G. Living systems: Basic concepts. Behav. Sci. 1965, 10, 193–237. [Google Scholar] [CrossRef]
- Sitkin, S.B.; Sutcliffe, K.M.; Schroeder, R.G. Distinguishing Control From Learning in Total Quality Management: A Contingency Perspective. Acad. Manag. Rev. 1994, 19, 537–564. [Google Scholar] [CrossRef]
- Bryson, J.M.; Ackermann, F.; Eden, C. Putting the Resource-Based View of Strategy and Distinctive Competencies to Work in Public Organizations. Public Adm. Rev. 2007, 67, 702–717. [Google Scholar] [CrossRef]
- Lee, S.-Y.; Whitford, A.B. Assessing the Effects of Organizational Resources on Public Agency Performance: Evidence from the US Federal Government. J. Public Adm. Res. Theory 2012. [Google Scholar] [CrossRef]
- Wernerfelt, B. A Resource-Based View of the Firm. Strateg. Manag. J. 1984, 5, 171–180. [Google Scholar] [CrossRef]
- Barney, J.B.; Clark, D.N. Resource-Based Theory: Creating and Sustaining Competitive Advantage; Oxford University Press: Oxford, UK; New York, NY, USA, 2007. [Google Scholar]
- Barney, J.B.; Ketchen, D.J.; Wright, M. The Future of Resource-Based Theory: Revitalization or Decline? J. Manag. 2011, 37, 1299–1315. [Google Scholar] [CrossRef]
- Dawes, S.S.; Cresswell, A.M.; Pardo, T.A. From “Need to Know” to “Need to Share”: Tangled Problems, Information Boundaries, and the Building of Public Sector Knowledge Networks. Public Adm. Rev. 2009, 69, 392–402. [Google Scholar] [CrossRef]
- Graddy, E.A.; Chen, B. Influences on the Size and Scope of Networks for Social Service Delivery. J. Public Adm. Res. Theory 2006, 16, 533–552. [Google Scholar] [CrossRef] [Green Version]
- Haughton, G. Environmental Justice and the Sustainable City. J. Plan. Educ. Res. 1999, 18, 233–243. [Google Scholar] [CrossRef]
- Pitts, D.W. Diversity, Representation, and Performance: Evidence about Race and Ethnicity in Public Organizations. J. Public Adm. Res. Theory 2005, 15, 615–631. [Google Scholar] [CrossRef]
- Yang, K.; Hsieh, J.Y.; Li, T.S. Contracting Capacity and Perceived Contracting Performance: Nonlinear Effects and the Role of Time. Public Adm. Rev. 2009, 69, 681–696. [Google Scholar] [CrossRef]
- Barney, J. Firm Resources and Sustained Competitive Advantage. J. Manag. 1991, 17, 99–120. [Google Scholar] [CrossRef]
- Berry, W.D.; Baybeck, B. Using Geographic Information Systems to Study Interstate Competition. Am. Political Sci. Rev. 2005, 99, 505–519. [Google Scholar] [CrossRef]
- Choi, S.O.; Bae, S.-S.; Kwon, S.-W.; Feiock, R. County Limits: Policy Types and Expenditure Priorities. Am. Rev. Public Adm. 2010, 40, 29–45. [Google Scholar] [CrossRef]
- Choi, N.; Neshkova, M.I. Inequality and competition in state redistributive systems: Evidence from welfare and health. Am. Rev. Public Adm. 2019, 49, 554–571. [Google Scholar] [CrossRef]
- Ukeles, J.B. Doing More with Less: Turning Public Management Around; Amacom: New York, NY, USA, 1982. [Google Scholar]
Figure 1.
Schematic Model.


Table 1.
Concept of Capacity.
| Authors | Concept of Government Capacity |
|---|---|
| Honadle [4] | “the ability to anticipate and influence change; make informed, intelligent decisions about policy; develop programs to implement policy; attract and absorb resources; manage resources; and evaluate current activities to guide future actions.” |
| Ingraham and Donahue [12] | Management Capacity is “government’s intrinsic ability to marshal, develop, direct, and control its human, physical, and information capital to support the discharge of its policy directions.” |
| Bowman and Kearney [2] | Capability of state government means “(1) to respond effectively to change; (2) to make decisions efficiently, effectively (i.e., rationally) and responsively; and (3) to manage conflict.” |
| Van Slyke [13] | public-management capacity as “personnel, oversight and program audit capabilities, and the necessary communication and political skills” |
| Hou, Moynihan and Ingraham [14] | “the importance of policies, procedures, and resources governing administrative action” |
| Topinka [15] | “power” |
Source: Choi [10].
Table 2.
Definitions and Measurements of Government Capacity.
| Studies | Components of Capacity | Measurement |
|---|---|---|
| Carley, Nicholson-Crotty and Fisher [17] | Relevant technical skills, relevant organizational experiences, adequate resources, cognitive skills, and human capital | Government relevant experience (the number of years of a state’s renewable portfolio standards (RPS) for the electricity policy),financial management capacity (financial management scores of GPP) |
| Bowman and Kearney [2] | Responsiveness, efficient and effective decision making, and conflict management | Factor analysis from 32 variables |
| Collins and Gerber [19] | Ability to compete for and to manage grant contracts | The number of financial administrators and other government administrators for every 1000 county residents |
| Jennings, et al. [20] | Human, physical, and information capital to support the discharge of its policy directions (accepting the definition of Ingraham and Donahue) | GPP scores of four dimensions (human resources, financial management, infrastructure, information) |
| Terman and Feiock [18] | (1) Administrative capacity, (2) Policy capacity, (3) Management structure | (1) The number of financial management employees, (2) dummy, if the city had a member for sustainability programs (1/0), (3) Council-manager form |
| Terman and Feiock [16] | (1) Overall capacity, (2) Managerial capacity, (3) Dedicated sustainability staffing, (4) lack of staff capacity, (5) lack information resource | (1) Number of financial management staff members per 1000 residents, (2) Council-manager form, (3~5) from survey questions |
Source: Choi [10].
Table 3.
Description of Variables in the Model.
| Variable | Description |
|---|---|
| Log infrastructure development rate | ln[(water supply rate + sewer treatment rate + urban area ratio)/3] |
| Human Resource Capacity 1 | Number of civil servants/1000 residents |
| Human Resource Capacity 2 | Percentage of senior officials (level 5 or higher) |
| Financial Resource Capacity 1 | Expenditure/residents |
| Financial Resource Capacity 2 | Own source revenue ratio |
| Households’ needs | Population Density (Residents/km2/1000) |
| Businesses’ needs | Number of firms/1000 residents |
| Population change | (Births − deaths + net migration)/1000 |
| Competition effect | Spatial coefficients (rho) |
Data source: Local Government Yearbook, Local Finance Yearbook, Statistics City Yearbook, e-local index by KOSIS.
Table 4.
Regressions Results for Local Development (2013–2018).
| Coef. | SD | Direct Effect | Indirect Effect | Total Effect | ||||
|---|---|---|---|---|---|---|---|---|
| Coef. | SD | Coef. | SD | Coef. | SD | |||
| Human Resource Capacity 1 (HC1) | 0.0004 | 0.0015 | 0.0005 | 0.0016 | 0.0004 | 0.0012 | 0.0009 | 0.0028 |
| Human Resource Capacity 2 (HC2) | −0.0154 ** | 0.0074 | −0.0166 | 0.0076 | −0.0118 | 0.0057 | −0.0284 | 0.0131 |
| Financial Resource Capacity 1 (FC1) | 0.0065 *** | 0.0019 | 0.0070 | 0.0019 | 0.0050 | 0.0014 | 0.0120 | 0.0033 |
| Financial Resource Capacity 2 (FC2) | 0.0020 ** | 0.0009 | 0.0021 | 0.0009 | 0.0015 | 0.0007 | 0.0035 | 0.0016 |
| Households’ needs | −0.0216 | 0.0150 | −0.0226 | 0.0154 | −0.0162 | 0.0113 | −0.0388 | 0.0265 |
| Businesses’ needs | 0.0029 *** | 0.0009 | 0.0031 | 0.0009 | 0.0022 | 0.0007 | 0.0053 | 0.0015 |
| Population change | 0.0008 | 0.0006 | 0.0008 | 0.0007 | 0.0006 | 0.0005 | 0.0014 | 0.0011 |
| Competition effect | 0.4483 *** | 0.0355 | ||||||
| Log-likelihood | 1174.218 | |||||||
| R2 | 0.1476 | |||||||
| Number of Observations | 760 | |||||||
| Number of Local governments | 152 | |||||||
Note: *** p < 0.01, ** p < 0.05. Time period: 5 waves (DV: 2014–2018, IV: 2013–2017); DV: log(infrastructure development rate). Stata syntax: xsmle, wmat model(sar) effects fe.
Publisher’s Note: MDPI stays neutral with regard to jurisdictional claims in published maps and institutional affiliations. |
© 2021 by the author. Licensee MDPI, Basel, Switzerland. This article is an open access article distributed under the terms and conditions of the Creative Commons Attribution (CC BY) license (https://creativecommons.org/licenses/by/4.0/).
Share and Cite
MDPI and ACS Style
Choi, N. Analyzing Local Government Capacity and Performance: Implications for Sustainable Development. Sustainability 2021, 13, 3862. https://0-doi-org.brum.beds.ac.uk/10.3390/su13073862
AMA Style
Choi N. Analyzing Local Government Capacity and Performance: Implications for Sustainable Development. Sustainability. 2021; 13(7):3862. https://0-doi-org.brum.beds.ac.uk/10.3390/su13073862
Chicago/Turabian StyleChoi, NakHyeok. 2021. "Analyzing Local Government Capacity and Performance: Implications for Sustainable Development" Sustainability 13, no. 7: 3862. https://0-doi-org.brum.beds.ac.uk/10.3390/su13073862
Note that from the first issue of 2016, this journal uses article numbers instead of page numbers. See further details here.