
The Effect of Music Tempo and Volume on Acoustic Perceptions under the Noise Environment

School of Environmental and Municipal Engineering, Qingdao University of Technology, Qingdao 266033, China
*
Author to whom correspondence should be addressed.
Sustainability 2021, 13(7), 4055; https://0-doi-org.brum.beds.ac.uk/10.3390/su13074055
Submission received: 24 February 2021
/
Revised: 24 March 2021
/
Accepted: 25 March 2021
/
Published: 6 April 2021
Abstract
:This study aimed to investigate the distracting or masking effects of music tempo and volume, based on subjective evaluation under noise conditions. Two experiments were conducted with 32 participants. In the first one, the experimental conditions were set as follow: (1) the sound pressure levels of music are 45 dB, 60 dB, and 75 dB; (2) music tempos are 70 beats per minute (BPM), 110 BPM, and 150 BPM; (3) sound pressure levels of noise are 45 dB, 60 dB, and 75 dB; and (4) the noise types are talkers’ babble, traffic noise, and construction noise. All conditions on human acoustic perception were analyzed by orthogonal experiment. Based on part one, the second experiment was conducted. Sound pressure levels (50 dB, 60 dB, and 70 dB) of noise and sound pressure levels (50 dB, 60 dB, and 70 dB) of music and music tempo (70 BPM, 110 BPM, and 150 BPM) were assessed by subjective evaluation. The results showed although different types of noise had different effects on human perceptions, noise types had a small effect on acoustic comfort considering the superimposed music. Music can improve the acoustic environment. The sound pressure levels had significant effects on acoustic sensation. The tempo of the music affected the acoustic sensation insignificantly. Sound pressure levels of noise, music tempo, and sound pressure levels of music significantly affect acoustic comfort. The best acoustic environment in this study utilized superimposed 70 BPM, 60 dB music in a 50 dB noise environment. These results suggest that music can enable new strategies to improve indoor environmental satisfaction. Based on the findings, the effect of music on acoustic perceptions under the noise environment should be taken into account when aiming to enhance comfort in noisy environments.
1. Introduction
Noise is defined as “irrelevant or meaningless data or output occurring along with desired information”, and generally refers to an acoustic phenomenon involving undesirable and disturbing sounds [1,2]. Noise pollution has been recognized as being among the most disturbing environmental parameters in a variety of epidemiological studies [3,4,5,6] and in a World Health Organization document [7]. Noise pollution has become more and more severe with the development of modern society, arousing widespread concern in society [8]. Noise is widely present both indoors and outdoors, seriously affecting the environments and human comfort [9,10,11].
Acoustic comfort evaluation is essential in indoor environments, in which the risk of hearing damage is relatively low but annoyance brought by noise noticeably affects subjective health [12,13,14]. Moreover, environmental noise causes mental stress and loss of concentration, which can adversely affect workers’ performance [15]. Thus, some noise control engineering approaches for reducing noise have been developed [16,17,18,19]. However, these noise control engineering methods were usually not mobile or economically viable. Some researches demonstrated that a reduction of the sound pressure level (SPL) in an environment does not necessarily increase comfort, because other annoying sounds such as the conversations of other passengers or coach sounds become audible, an issue found in transportation systems, such as in aircraft and railway cabins [20,21]. Thus, an alternative method has been proposed to enhance noise perception by adding desirable sounds or other sensations to mask or distract attention from outdoor environmental noise. This method was confirmed in the urban soundscape [22,23,24,25,26].
The International Organization for Standardization [27] defines a soundscape as “an acoustic environment that is perceived or experienced and/or understood by a person or people in context.” The earliest soundscape studies were conducted in a variety of urban environments [28]. The soundscape of urban areas is an important aspect for the comfort of people in general [29,30]. To assess the soundscape quality, descriptors [31], frameworks [32], and methodologies for data collection have been developed [33]. Environmental studies have shown that birdsong and water sounds have been used to improve the soundscape quality [34,35,36].
However, only a few studies have researched perceptual methods to improve noise perception in an indoor environment. Yang et al. [37] researched indoor water sounds in terms of perceptual enhancement of environmental noise through openings for natural ventilation, finding that indoor water sound can reduce annoyance and increase feelings of naturalness, calmness, and pleasantness.
Music is a powerful, emotionally induced source of human enjoyment [38,39,40]. Due to its characteristics of various melodies, speeds, and tones, music has different effects on people’s sensory organs. Music can effectively relieve stress and make people healthy. This ability is a reaction of human instinct, and changes in emotions directly affect the feelings of people in a building. Oldham’s research showed that background music can effectively improve work efficiency [41]. Rauscher et al. reported on the “Mozart effect” [42]. Thus, a question arises: can music improve noise perception in an indoor environment?
This study includes two experiments that attempt to investigate the distracting or masking effects of music tempo and volume through a subjective assessment under different noise conditions. Furthermore, some suggestions about improving the noise environment are proposed.
2. The First Experiment
2.1. Methods
2.1.1. Participants
Sixteen subjects participated in all sessions. The same number of males (8 persons) and females (8 persons) were recruited to participate in this experiment. Before the experiment, hearing screening tests were carried out with an audiometer (AD 104, China) to ensure all the participants had normal hearing. Before the day of implementing the experiments, the participants were asked to have good rest, avoid stimulants such as alcohol and caffeine, and prevent overwork. The characteristics of the subjects are shown in Table 1.
The subjects were divided into eight groups of one male and one female randomly. During the experiment, subjects wore a standard ensemble. The thermal resistance of clothing is 0.6 Clo (1Clo = 0.155 m2·K/W).
All of the subjects provided informed consent and were given information about the experiment via a short presentation before the test, which included a detailed explanation about the questionnaire. The subjects received financial support as compensation.
2.1.2. Testing Environment
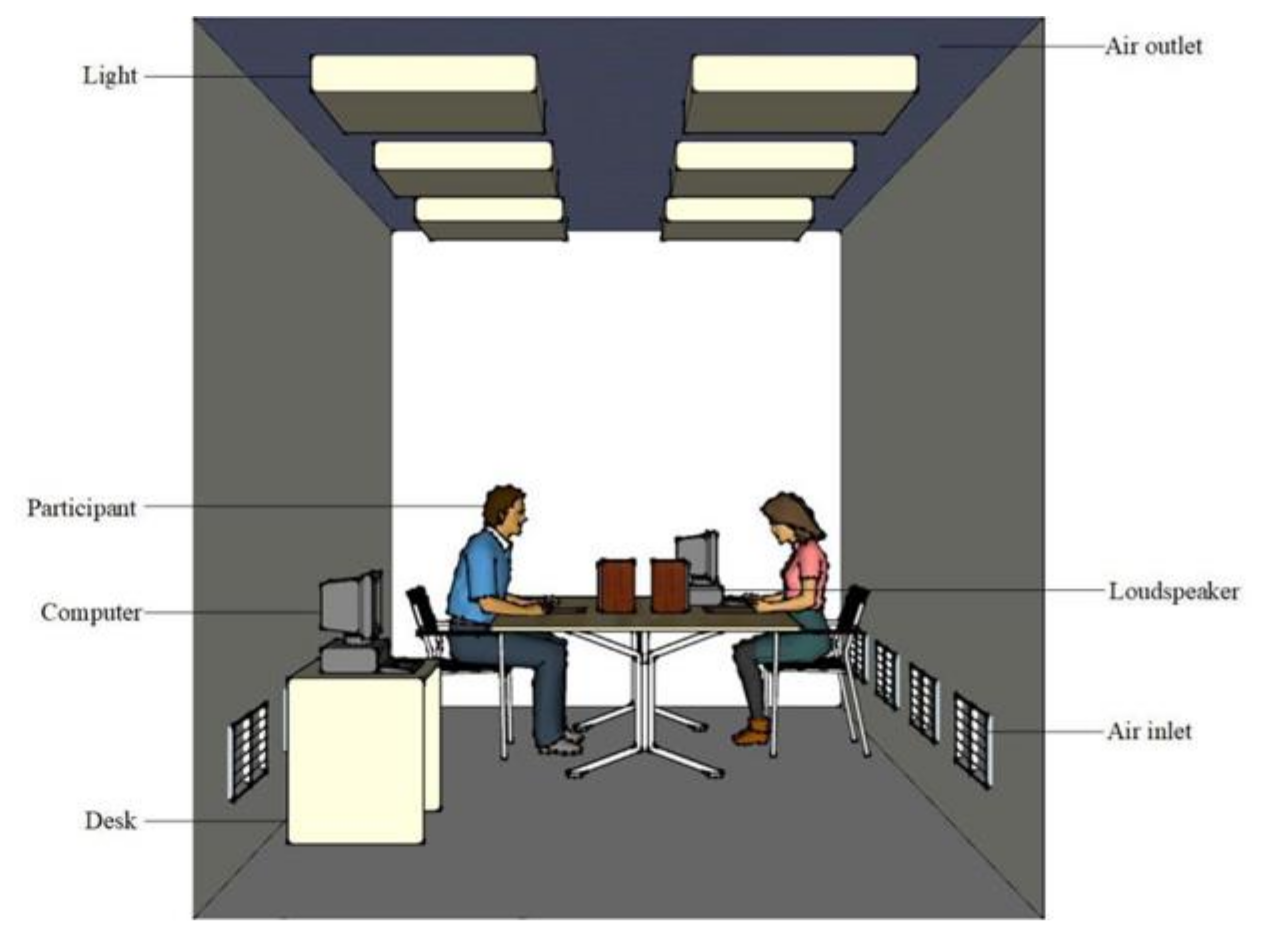
The experiment was conducted in an indoor environmental room at the Qingdao University of Technology. The dimensions of the room were 5.0 m × 3.0 m × 2.6 m (L × W × H). The room temperature was controlled using air conditioners. Room temperature and relative humidity were measured at the height of 1.2 m by a sensor (Testo174H, Testo, Lenzkirch, Germany). The temperature was 25 °C and the relative humidity was 60%, which satisfied the ASHRAE standard 55-2013 [43] for thermal comfort. The air velocity was less than 0.1 m/s. The illuminance level along the desk surface was 560 lx, on average, with the measurements taken by an illuminance sensor (TES-136, TES, Taiwan, China). All the measurements were operated near the position of the subjects. Two loudspeaker systems were used for playing noise and music. The layout of the room is shown in Figure 1.
2.1.3. Acoustic Conditions
The noise types selected in this experiment were talkers’ babble, traffic noise, and construction noise. Talkers’ babble was recorded on the market. Traffic noise was recorded on the highway. The construction noise was recorded on the construction site. As lyrics can have a great influence on people’s emotions and feelings, in order to avoid the subjective influence of lyrics, all the samples of the music were selected without lyrics. Usually, beats per minute (BPM) is used to describe the tempo of music. The larger the BPM, the faster the tempo of the music. Conversely, a smaller BPM means the tempo of the music is slower. Three tempos of music were chosen: 70 BPM, 110 BMP, and 150 BPM. The 70 BPM music presented was classical music, the 110 BPM music was pop music, and the 150 BPM music was rock and roll music. In order to explore the effects of different sound pressure levels, the following sound pressure levels (SPL) were chosen: 75 dB, 60 dB, and 45 dB, as shown in Table 2. In the previous study [37], equivalent continuous A-weighted sound pressure levels (LAeq) showed a strong correlation with acoustic sensations. Thus, sound pressure levels used in this study were LAeq. A simple questionnaire survey was conducted during sampling to ensure that subjects had never been exposed to the selected music, so as to exclude the influence of subjective factors. The noise was played by an amplifier (Sangnou, Beijing, China). The music was played with a loudspeaker (Alibaba, Hangzhou, China).
2.1.4. The Design of the Orthogonal Experiment
To achieve the experimental purpose and reduce the experimental amount without affecting the accuracy and reliability of results, an orthogonal experimental method was used to investigate human perceptions. Noise types, the sound pressure levels of noise, the sound pressure level of music, and music tempo were determined as four factors of the orthogonal experiment and each factor had three levels, as shown in Table 2. The orthogonal array of the nine conditions is shown in Table 3, designed according to the orthogonal design table L9 (34).
2.1.5. Experimental Procedure
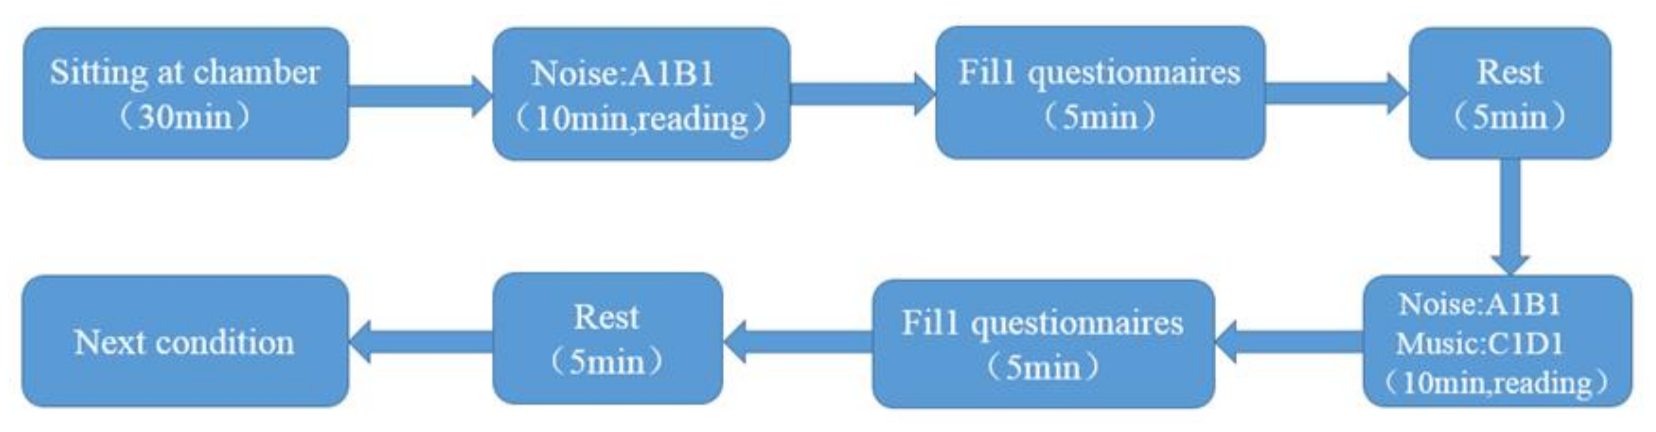
Participants were divided into eight groups. They participated in all experimental conditions. Upon arrival, the participants entered the room and were required to sit down for 30 min to keep calm before the experiment. The reading materials and subjective questionnaires were distributed and then the noises were played. The participants read the materials to simulate office conditions. After 10 min, human perceptions were investigated by the questionnaire. Then, subjects rested for 5 min. Next, the noise and music was played. After 10 min, human perceptions were collected. Taking experiment 1 as an example, an illustration of the experimental procedure is shown in Figure 2.
In each questionnaire, the subjects were asked for their acoustic sensation and acoustic comfort. Navai and Veitch [44] defined acoustic comfort as “a state of contentment with acoustic conditions”. Acoustic sensation and acoustic comfort have been frequently used in environmental noise research [45,46,47,48]. The acoustic sensations vote (ASV) was based on a 5-point sensation scale, which defined 0 = quiet and 4 = very noisy. Acoustic comfort was assessed using a 5-point scale (from 0 = comfortable and 4 = extremely uncomfortable).
Experimental staff controlled the environmental stability of the room. During the experiment, the subjects could not communicate with each other and remained quiet to avoid mood swings. They were asked to read the newspaper. Each group of experiments was carried out over three days. All test conditions of the subjects were completed in the morning or in the afternoon to reduce errors caused by different human body conditions in different periods. Although the rest time was set after the sound was played, it was still important to offer the samples to the participants in a counterbalanced way to prevent order effects. Three groups of subjects followed the experimental sequence 1–9. Three groups of subjects followed the experimental sequence of 9–1. Two groups of subjects took part in nine experiments in a random order.
2.2. Results
2.2.1. The Perceptions under Differing Noise Environments
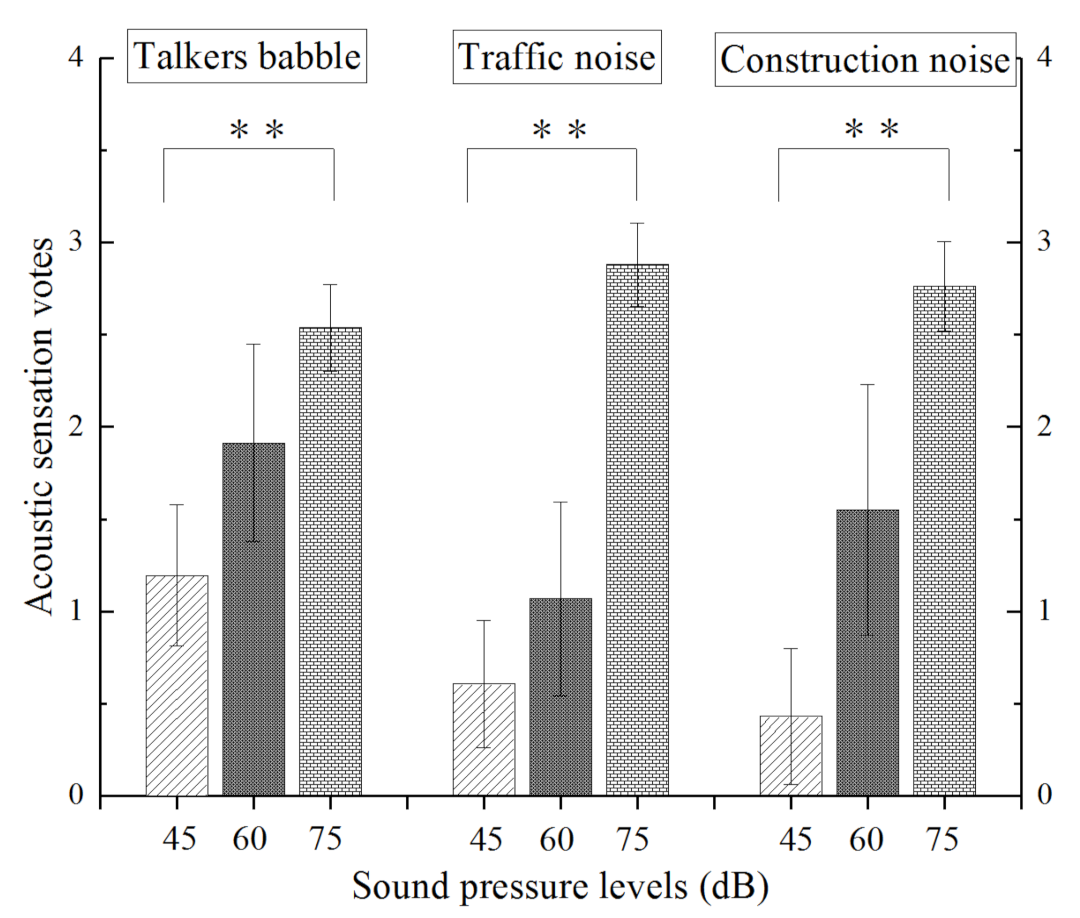
The ASVs under different noise conditions are shown in Figure 3. For each noise condition, the mean value of the ASV increased significantly as the sound pressure level increased (p < 0.01).
In a noise environment of 45 dB, the subjects felt that the talkers’ babble was loudest. Under these conditions, the subjects voted the construction noise as the lowest acoustic sensation. Under low-level noise, talkers’ babble made people feel that the environment was noisy however construction noise had little effect on people. In the 60 dB noise environment, the talkers’ babble still made the subjects feel as though the environment was noisy and the traffic noise had the least impact. In the 75 dB noise environment, the values of ASVs were similar.
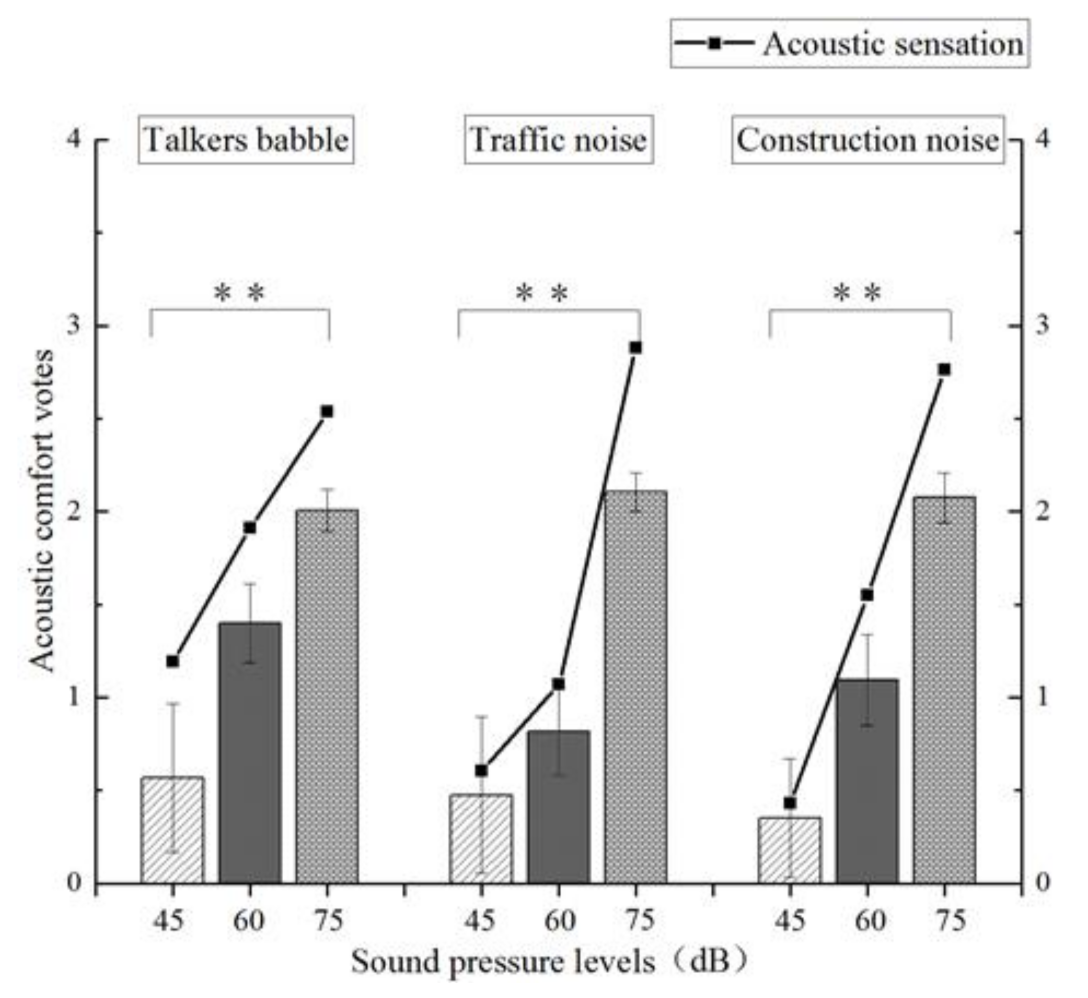
The acoustic comfort votes (ACVs) of subjects are shown in Figure 4. Under the same type of noise condition, ASVs and ACVs both increased significantly with the increase of noise sound pressure level (p < 0.01).
The influence of different kinds of noise on acoustic comfort was analyzed. Under the 45 dB and 60 dB noise environment, talkers’ babble had the largest influence on acoustic comfort. Under the 75 dB noise environment, traffic noise has the greatest influence on acoustic comfort.
2.2.2. The Perceptions under a Combined Noise and Music Environment
To explore the influence of music on the human perceptions of a noisy environment, the acoustic perception research was launched under combined noise and music. The results were recorded as follows in Table 4.
The orthogonal table of the acoustic sensation voting was analyzed. The range was used to judge the primary and secondary order affecting the acoustic sensation of humans and calculations were performed. The results are shown in Table 5.
The difference in the range indicates that factors have different effects on the experimental results. By the range R SPL of noise > R SPL of music > R music tempo > R noise types, it can be concluded that the noise sound pressure level had the greatest impact on the acoustic perception in the combined sound environment. The sound pressure level of music had the second greatest impact. However, the types of noise had little effect on acoustic perceptions. Therefore, it was rational that adjusting the sound pressure level of music first would improve the current fixed noise environment.
The average vote for comfort was analyzed by the range analysis. The results are shown in Table 6.
The result showed that R SPL of noise > R SPL of music > R Music tempo > R Noise types, which indicated that the acoustic comfort in the combined sound environment was the same as the acoustic sensation. The sound pressure level of the noise dominated the acoustic sensation and the comfort of subjects. The second most relevant factor was the sound pressure level of the music. The types of noise had little impact on human perceptions.
3. The Second Experiment
To investigate the distracting or masking effects of a range of music over environmental noise, part two of this study was conducted.
According to the results of part one, part two of the study did not consider the effect of the types of noise. It aimed to evaluate the distracting or masking effects of music tempo and music sound pressure levels based on a subjective assessment under varying environmental noise conditions.
3.1. Methods
3.1.1. Participants
Sixteen subjects participated in this study (male: 8; female: 8). All subjects provided written informed consent before the research. The requirements for the participants were the same as in part one. The subjects’ characteristics are shown in Table 7.
3.1.2. Acoustic Conditions
The optimized experimental conditions were based on the results of part one. As 45 dB noise has little effect on acoustic comfort and music could not improve the perception of a 75 dB noise environment, 50 dB, 60 dB, and 70 dB were chosen in part two of the experiment. The talkers’ babble was chosen in this experiment as shown in Table 8.
3.1.3. Orthogonal Experimental Design
The orthogonal array of the nine experiments is shown in Table 9, designed according to the orthogonal design table L9 (34).
3.1.4. Other Experimental Requirements and Conditions
Other experimental conditions are the same as in part one.
3.2. Results
3.2.1. The Acoustic Perceptions under Differing Noise Environments
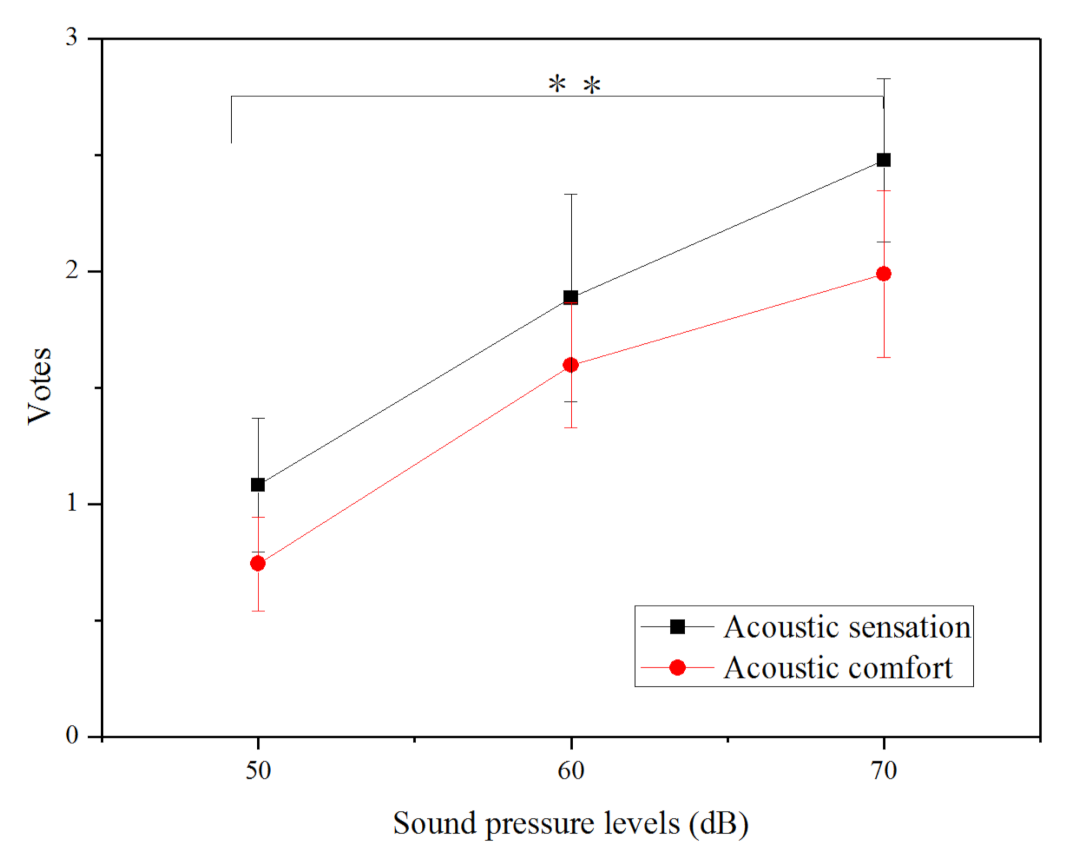
Figure 5 showed the change of acoustic sensations and acoustic comfort in different noise conditions. The votes of acoustic perception significantly increased with increasing noise sound pressure level (p < 0.05). There was a correlation between acoustic sensation and acoustic comfort in the noise environment. The Pearson’s correlation coefficient value was 0.988.
To test the repeatability of the experimental results, the relative standard deviation (RSD) in groups and between groups is calculated in Table 10. This RSD met the requirement for repeated experiments.
3.2.2. The Acoustic Perception under a Combined Noise and Music Environment
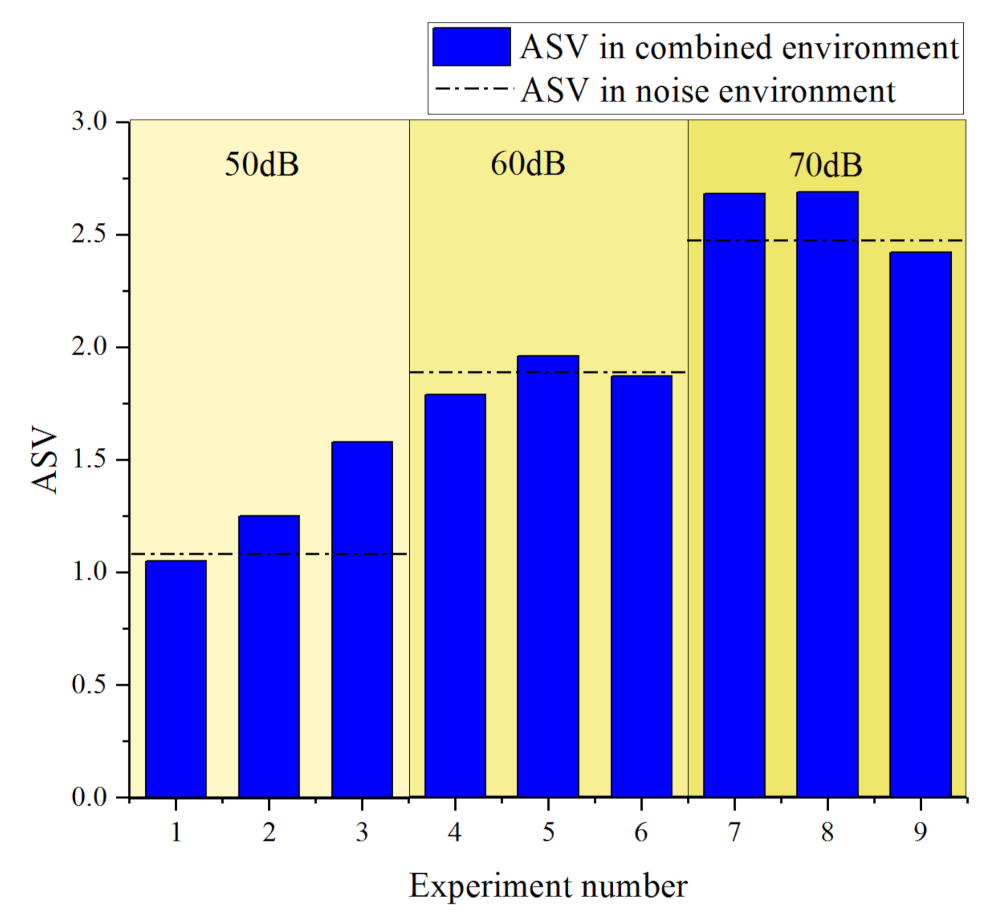
The acoustic sensation votes under different conditions are shown in Figure 6. When 60 dB or 70 dB music was added in 50 dB of noise, the acoustic sensation became loud. The acoustic sensation became slightly smaller when 50 dB music was played in 50 dB of noise. Under the 60 dB noise environment, where music of 50 dB or 60 dB was superimposed, the ASV became smaller, however when music of 70 dB was superimposed the ASV became larger. In a 70 dB noise environment, superimposing 70 dB or 50 dB of music made the participants subjectively believe the sound was increased, whereas when superimposing 60 dB this was the reverse.
According to the sound pressure level superposition principle, where two sound pressure levels with equal values are superimposed, the sound pressure level will be increased by 3 dB compared with the original. However, when music is superimposed in the noisy environment the improvement effect of the music is obvious. When the music is much lower than the noise, the person’s expectations for the music may also cause the acoustic sensation to become larger.
The average votes for acoustic sensation were analyzed by range analysis. The results are shown in Table 11.
The result showed R SPL of noise > R SPL of music > R Music tempo > R Error, which was the same as the results in part one of the study. The results indicate that the sound pressure level of noise dominated the acoustic sensation in the combined acoustic environment. The second factor was the sound pressure level of the music. The BPM of music had the least impact on acoustic sensation.
To analyze the significance of various factors on human perception, analysis of variance was used. The results are shown in Table 12. The sound pressure levels of noise and music had a significant effect on acoustic sensation. However, the BPM of the music affected acoustic sensation insignificantly.
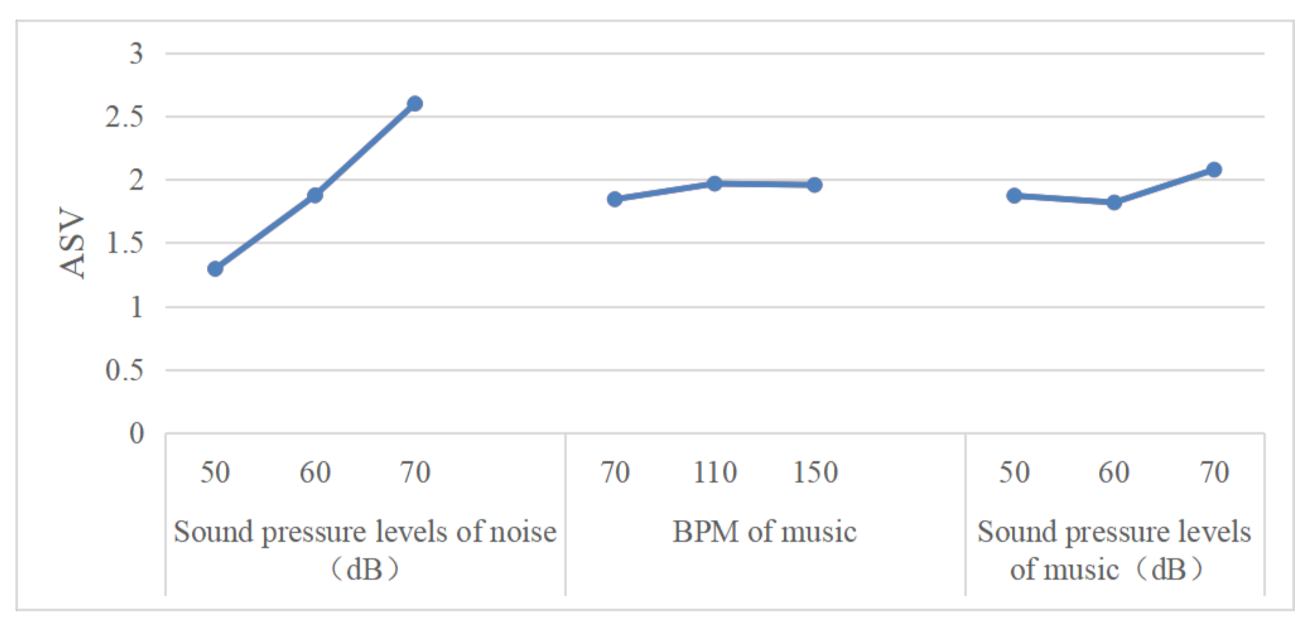
The trend of the ASV is shown in Figure 7. According to the trend graph, 50 dB noise, 70 BPM music, and 60 dB music sounded the best in this study.
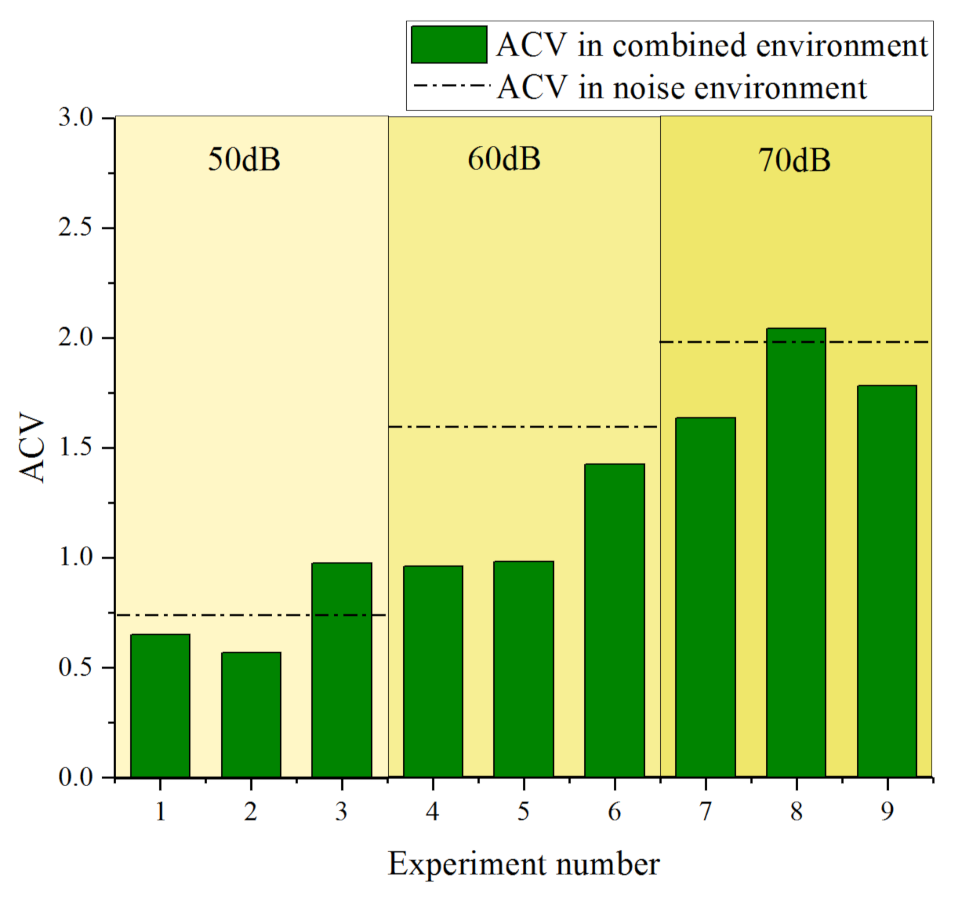
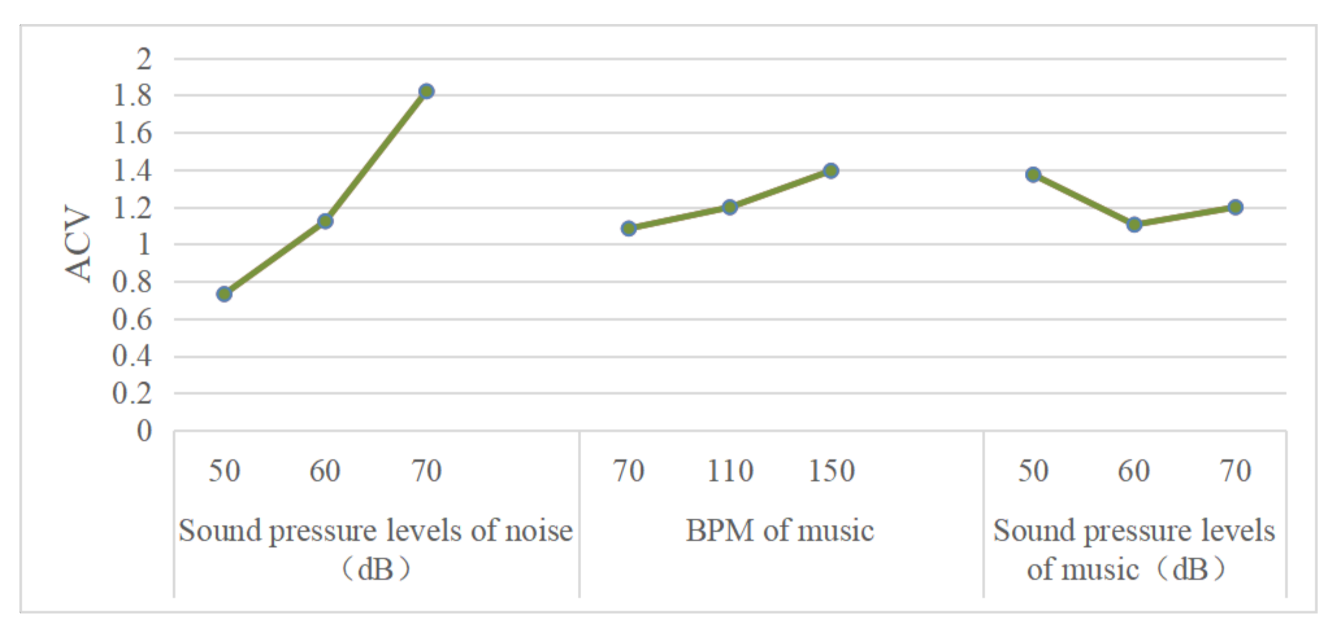
The acoustic comfort levels in different conditions are shown in Figure 8. In environments with 50 dB of noise, superimposing 50 dB or 60 dB of music significantly improves acoustic comfort. At 60 dB of noise, superimposing 50 dB, 60 dB, or 70 dB music improves acoustic comfort. With 70 dB noise, superimposing 60 dB or 70 dB of tone could improve acoustic comfort. When improving the noise environment, the sound pressure level of music should not deviate from the noise sound pressure level too much, and the difference between the noise and music should less than 20 dB.
Table 13 shows the results of the acoustic comfort perceptions in different conditions. The results showed R SPL of noise> R Music tempo > R SPL of music > R Error. In comparison to the results of part one, the order of the influencing factors changed. This may be related to the change of the sound pressure level of the music. The sound pressure levels of the music in part two of the experiment were more acceptable than in part one.
As for acoustic comfort, Table 14 showed the sound pressure level of noise and music and the music tempo had a significant effect. The results were in accordance with the range analysis.
The trend of the ACVs is shown in Figure 9. According to the trend graph, 50 dB noise, 70 BPM music, and 60 dB music sounded the best in this study.
There was a correlation between acoustic sensation and acoustic comfort in the noise environment. The Pearson’s correlation coefficient value was 0.929. The Pearson’s correlation coefficient value in the combined noise environment was less than the value in the noise environment.
4. Discussion
There is a strong correlation between acoustic sensation and acoustic comfort, however, acoustic comfort is different from acoustic sensation. Within the perceptions of acoustic comfort there exists more bias towards the subjective emotions of humans. The correlation coefficient between acoustic comfort and acoustic sensation in the superimposed music conditions is lower than that in the pure noise environment, as music has an effect on emotion, which in turn affects acoustic comfort. The change in the order of influencing factors in the combined music environment also illustrates this point of view.
The music improvement effect was significantly affected by the sound pressure level of noise. However, if the noise level is higher than that of the music, the positive effect will be eliminated in accordance with the results of Yang’s research [37]. When the noise sound level was 75 dB, the music playing cannot contribute to improving the acoustic environment in this study.
In this study, we found that the tempo of 70 BPM is the best, due to the sense of relaxation it induces. The sense of noise increases as the tempo of the music increases. It has been found that 60–80 BPM is close to the human heart rate and therefore more popular [49]. Choosing a suitable music tempo will improve acoustic perceptions.
When using superimposed music to improve acoustic perceptions, the sound pressure level of music should be controlled. The reason is that the large difference between the sound pressure level of the music and the noise sound pressure level limits the improvement effect When the sound pressure level of music is much lower than the noise sound pressure level, it becomes difficult for the music to be recognized or even inaudible according to the sound pressure level superposition theory. When the sound pressure level is much higher than the noise sound pressure level, the music also became a kind of noise. In this study, the difference of sound pressure levels between noise and music should not be more than 20 dB.
Inevitably, there are some limitations of this study. This study was conducted neglecting (ethno)musicological literature, meter/rhythmical patterns, and pitch, etc. These factors will be taken into account in future studies. Another limitation is the sample size. The total number of subjects was 32. Though the relative standard deviations (RSDs) in groups and between groups were calculated, and in some comfort studies the same number of subjects [50,51,52] or fewer subjects [53,54] were involved, the size of the subject sample is considered small. In order to further confirm the results, the expansion of the sample size is necessary for future studies. Besides, the results of this research were based on responses from Chinese students who were in their twenties to thirties. According to research [55], the emotional sensation of music is influenced by cultural backgrounds and age. Thus, the results might not be appropriate to people with different cultural background and ages. Further study is necessary involving people of different cultural backgrounds and ages to obtain a deeper understanding of music’s effect on environmental noise judgment.
5. Conclusions
To improve the human acoustic comfort in noisy environments, a series of experiments were conducted to investigate the distracting or masking effects of music tempo and volume under different noise conditions. We concluded that different noises had different effects on human acoustic perception. Compared with traffic and construction noise, human were greatly affected by talkers’ babble under at levels of 45 dB and 60 dB. At 75 dB, humans were greatly affected by traffic noise. Although different types of noise had different effects on human perceptions, the noise types had a small influence considering the superimposed music to improve the acoustic environment. Music can improve the acoustic environment. The sound pressure levels of noise and music had significant effects on acoustic sensation. The tempo of the music affected acoustic sensation insignificantly. Sound pressure levels of noise, music tempo, and sound pressure levels of music significantly affected acoustic comfort. The best improvement in this study was made where superimposed 70 BPM, 60 dB music was present in a 50 dB noise environment. When the noise sound level was 75 dB, the use of music was not suitable. Choosing the appropriate music tempo and sound pressure level can significantly improve the distracting or masking effect. To improve acoustic perception, the difference of sound pressure levels between noise and music should not be more than 20 dB. The sustainable style of music with appropriate sound levels could make the acoustic environment more comfortable in specific scenarios where background noise is present. Obviously, the outcomes not only help to address noise issues, but provide a feasible solution for creating high-quality acoustic environments in different cultural regions. Hence, these results can be applied as a critical reference in designing and retrofitting acoustic environments in the future.
Author Contributions
Conceptualization, P.L. and H.G.; methodology, H.G.; software, Y.W.; validation, P.L., H.G. and Y.W.; formal analysis, H.G.; investigation, H.C. and H.G.; data curation, H.C.; writing—original draft preparation, P.L. and H.G.; writing—review and editing, P.S. and H.M.; visualization, S.H.; supervision, S.H. All authors have read and agreed to the published version of the manuscript.
Funding
This research was funded by the National Natural Science Foundation of China, grant number 51778305.
Institutional Review Board Statement
Not applicable.
Informed Consent Statement
Not applicable.
Data Availability Statement
Data are available from the corresponding author upon request.
Conflicts of Interest
The authors declare no conflict of interest.
References
- Mama, Y.; Fostick, L.; Icht, M. The impact of different background noises on the Production Effect. ACTA Psychol. 2018, 185, 235–242. [Google Scholar] [CrossRef]
- Noise. Merriam-Webster Online. Merriam-Webster. 1957. Available online: http://www.merriam-webster.com/dictionary/noise (accessed on 15 January 2020).
- Power, M.; Bullinger, M.; Harper, A. The World Health Organization WHOQOL-100: Tests of the universality of quality of life in 15 different cultural groups worldwide. Health Psychol. 1999, 18, 49. [Google Scholar] [CrossRef]
- Evandt, J.; Oftedal, B.; Krog, N.H.; Nafstad, P.; Schwarze, P.E.; Aasvang, G.M. A population-based study on nighttime road traffic noise and insomnia. Sleep 2017, 40. [Google Scholar] [CrossRef]
- Licitra, G.; Fredianelli, L.; Petri, D.; Vigotti, M.A. Annoyance evaluation due to overall railway noise and vibration in Pisa urban areas. Sci. Total Environ. 2016, 568, 1315–1325. [Google Scholar] [CrossRef] [PubMed]
- Gaetano, L.; Bolognese, M.; Palazzuoli, D.; Fredianelli, L.; Fidecaroet, F. Port noise impact and citizens’ complaints evaluation in rumble and mon acumen interreg projects. In Proceedings of the 26th International Congress on Sound and Vibration, Montreal, QC, Canada, 7–11 July 2019. [Google Scholar]
- Guski, R.; Schreckenberg, D.; Schuemer, R. WHO Environmental Noise Guidelines for the European Region: A Systematic Review on Environmental Noise and Annoyance. Int. J. Environ. Res. Public Health 2017, 14, 1539. [Google Scholar] [CrossRef] [Green Version]
- Yuan, M.; Yin, C.; Sun, Y.; Chen, W. Examining the associations between urban built environment and noise pollution in high-density high-rise urban areas: A case study in Wuhan, China. Sustain. Cities Soc. 2019, 50, 101678. [Google Scholar] [CrossRef]
- Hongyu, G.; Hu, S.; Lu, M.; He, M. People’s subjective and physiological responses to the combined thermal-acoustic environments. Build. Environ. 2020, 172, 106709. [Google Scholar]
- Mohammadi, A.; Amador-Jimenez, L.; Nasiri, F. A multi-criteria assessment of the passengers’ level of comfort in urban railway rolling stock. Sustain. Cities Soc. 2020, 53, 101892. [Google Scholar] [CrossRef]
- Guan, H.; Hu, S.; Liu, G.; Zhang, L. The combined effects of temperature and noise on the comfort perceptions of young people with a normal Body Mass Index. Sustain. Cities Soc. 2020, 54, 101993. [Google Scholar] [CrossRef]
- Humphreys, L.; Giudice, S.; Jennings, P.; Cain, R.; Song, W.; Dunne, G. The influence of company identity on the perception of vehicle sounds. Ergonomics 2011, 54, 338–346. [Google Scholar] [CrossRef]
- Crociata, D.; Simone, S.A.; Martellotta, F. Acoustic comfort evaluation for hypermarket workers. Build. Environ. 2013, 59, 369–378. [Google Scholar] [CrossRef]
- van der Zwaag, M.; Dijksterhuis, C.; de Waard, D.; Mulder, B.L.; Westerink, J.; Brookhuiset, B.K. The Influence of Music on Mood and Performance while Driving. Ergonomics 2012, 2012 55, 12–22. [Google Scholar] [CrossRef] [Green Version]
- Martellotta, F.; della Crociata, S.; Simone, A. Laboratory study on the effects of office noise on mental performance. In Proceedings of the Forum Acusticum, Aalborg, Denmark, 27 June–1 July 2011. [Google Scholar]
- James, H.; Shankar, V.; Hodgson, M. Investigation of Airflow and Sound Transmission through Vented-Acoustical Panels for Natural Ventilation. Can. Acoust. 2016, 44, 238–239. [Google Scholar]
- Lee, J.; Mohamed, H.; Chang, J.D. The Effect of Positions of Vertical Glass Fins inside a Double Skin Façade Air Cavity as Acoustical Barriers and Ventilation Potentials. Procedia Eng. 2016, 145, 892–899. [Google Scholar] [CrossRef] [Green Version]
- Tauber, C.; Bajraktari, E.; Lechleitner, J.; Pont, U.; Mahdavi, A. Double Skin Facades with Natural Ventilation Capability: A Case Study of Acoustical Enhancement via Passive and Active (Noise Cancelling) Methods. Appl. Mech. Mater. 2016, 861, 537–544. [Google Scholar] [CrossRef]
- Oldham, D.J.; De Salis, M.H.; Sharples, S. Reducing the ingress of urban noise through natural ventilation openings. Indoor Air 2004, 14, 118–126. [Google Scholar] [CrossRef] [PubMed]
- Pennig, S.; Quehl, J.; Rolny, V. Effects of aircraft cabin noise on passenger comfort. Ergonomics 2012, 55, 1252–1265. [Google Scholar] [CrossRef]
- Patsouras, C.; Fastl, H.; Widmann, U.; Hoelzl, G. Privacy versus sound quality in high speed trains. In Proceedings of the INTERNOISE 2000, Nice, France, 27–30 August 2000. [Google Scholar]
- De Coensel, B.; Vanwetswinkel, S.; Botteldooren, D. Effects of natural sounds on the perception of road traffic noise. J. Acoust. Soc. Am. 2011, 129, EL148–EL153. [Google Scholar] [CrossRef] [PubMed] [Green Version]
- Nilsson, M.E.; Berglund, B. Soundscape quality in suburban green areas and city parks. ACTA Acust. United 2006, 92, 903–911. [Google Scholar]
- Yang, W.; Kang, J. Acoustic comfort evaluation in urban open public spaces. Appl. Acoust. 2005, 66, 211–229. [Google Scholar] [CrossRef]
- Pheasant, R.J.; Horoshenkov, K.V.; Watts, G.R.; Barrett, B.T. The acoustic and visual factors influencing the construction of tranquil space in urban and rural environments tranquil spaces-quiet places? J. Acoust. Soc. Am. 2008, 123, 1446–1457. [Google Scholar] [CrossRef]
- Massimiliano, M.; Pascale, A. Effects of combinations of water sounds and visual elements on the traffic noise mitigation in urban green parks. In Proceedings of the INTERNOISE 2016, Hamburg, Germany, 21–24 August 2016. [Google Scholar]
- ISO. ISO 12913-1: Acoustics-Soundscape-Part 1: Definition and Conceptual Framework; International Organisation for Standardization: Geneva, Switzerland, 2014. [Google Scholar]
- In, H.; Jin, J.; Jeon, Y. Effect of the appropriateness of sound environment on urban soundscape assessment. Build. Environ. 2020, 179, 106975. [Google Scholar]
- Cassina, L.; Fredianelli, L.; Menichini, I.; Chiari, C.; Licitra, G. Audio-Visual Preferences and Tranquillity Ratings in Urban Areas. Environment 2017, 5, 1. [Google Scholar] [CrossRef] [Green Version]
- Raimbault, M.; Lavandier, C.; Bérengier, M. Ambient sound assessment of urban environments: Field studies in two French cities. Appl. Acoust. 2003, 64, 1241–1256. [Google Scholar] [CrossRef]
- Aletta, F.; Kang, J.; Axelsson, Ö. Soundscape descriptors and a con ceptual framework for developing predictive soundscape models. Landsc. Urban Plan. 2016, 149, 65–74. [Google Scholar] [CrossRef]
- Jennings, P.; Cain, R. A framework for improving urban soundscapes. Appl. Acoust. 2013, 74, 293–299. [Google Scholar] [CrossRef] [Green Version]
- Engel, M.S.; Fiebig, A.; Pfaffenbach, C. A Review of Socio-acoustic Surveys for Soundscape Studies. Curr. Pollut. Rep. 2018, 4, 220–239. [Google Scholar] [CrossRef]
- Galbrun, L.; Ali, T.T. Acoustical and perceptual assessment of water sounds and their use over road traffic noise. J. Acoust. Soc. Am. 2013, 133, 227–237. [Google Scholar] [CrossRef] [Green Version]
- Galbrun, L.; Calarco, F.M.A. Audio-visual interaction and perceptual assessment of water features used over road traffic noise. J. Acoust. Soc. Am. 2014, 136, 2609–2620. [Google Scholar] [CrossRef] [PubMed] [Green Version]
- Hao, Y.; Kang, J.; Wörtche, H. Assessment of the masking effects of birdsong on the road traffic noise environment. J. Acoust. Soc. Am. 2016, 140, 978–987. [Google Scholar] [CrossRef] [Green Version]
- Yang, W.; Moon, H.J.; Kim, M.-J. Perceptual assessment of indoor water sounds over environmental noise through windows. Appl. Acoust. 2018, 135, 60–69. [Google Scholar] [CrossRef]
- Panksepp, J. The Emotional Sources of "Chills" Induced by Music. Music. Percept. Interdiscip. J. 1995, 13, 171–207. [Google Scholar] [CrossRef]
- Krumhansl, C.L. An exploratory study of musical emotions and psychophysiology. Can. J. Exp. Psychol. 1997, 51, 336–353. [Google Scholar] [CrossRef] [PubMed] [Green Version]
- Altenmüller, E. Hits to the left, flops to the right: Different emotions during listening to music are reflected in cortical lateralisation patterns. Neuropsychology 2002, 40, 2242–2256. [Google Scholar] [CrossRef]
- Oldham, G.R.; Cummings, A.; Schmidtke, J.M. Listen while you work? Quasi-experimental relations between personal-stereo headset use and employee work responses. J. Appl. Psychol. 1995, 80, 547. [Google Scholar] [CrossRef]
- Rauscher, F.H.; Shaw, G.L.; Ky, C.N. Music and spatial task performance. Nat. Cell Biol. 1993, 365, 611. [Google Scholar] [CrossRef]
- AS. Thermal Environment Conditions for Human Occupancy; ASHRAE Standard: Atlanta, GA, USA, 2013; p. 2013. [Google Scholar]
- Manna, N.; Veitch, J.V. Acoustic Satisfaction in Open-Plan Offices: Review and Recommendations; National Research Council of Canada: Ottawa, ON, Canada, 2003.
- John, J.; Thampuran, A.L.; Premlet, B. Objective and subjective evaluation of acoustic comfort in classrooms: A comparative investigation of vernacular and modern school classroom in Kerala. Appl. Acoust. 2016, 104, 33–41. [Google Scholar] [CrossRef]
- Iachini, T.; Maffei, L.; Ruotolo, F.; Senese, V.P.; Ruggiero, G.; Masullo, M.; Alekseeva, N. Multisensory Assessment of Acoustic Comfort Aboard Metros: A Virtual Reality Study. Appl. Cogn. Psychol. 2012, 26, 757–767. [Google Scholar] [CrossRef]
- Zannin, P.H.T.; Marcon, C.R. Objective and subjective evaluation of the acoustic comfort in classrooms. Appl. Ergon. 2007, 38, 675–680. [Google Scholar] [CrossRef]
- Huang, L.; Zhu, Y.; Ouyang, Q.; Cao, B. A study on the effects of thermal, luminous, and acoustic environments on indoor environmental comfort in offices. Build. Environ. 2012, 49, 304–309. [Google Scholar] [CrossRef]
- Xinsheng, F. Music Therapy; China Press of Traditional Chinese Medicine: Beijing, China, 2002. [Google Scholar]
- Baniya, R.R.; Tetri, E.; Virtanen, J.; Halonen, L. The effect of correlated colour temperature of lighting on thermal sensation and thermal comfort in a simulated indoor workplace. Indoor Built Environ. 2016, 27, 308–316. [Google Scholar] [CrossRef]
- Fanger, P.; Ole, N.; Breum, O.; Jerking, E. Can colour and noise influence man’s thermal comfort. Ergonomics 1977, 20, 11–18. [Google Scholar] [CrossRef] [PubMed]
- Wang, H.; Liu, G.; Hu, S.; Liu, C. Experimental investigation about thermal effect of colour on thermal sensation and comfort. Energy Build. 2018, 173, 710–718. [Google Scholar] [CrossRef]
- Hodder, S.G.; Parsons, K. The effects of solar radiation on thermal comfort. Int. J. Biometeorol. 2006, 51, 233–250. [Google Scholar] [CrossRef] [PubMed]
- Luo, M.; Ji, W.; Cao, B.; Ouyang, Q.; Zhu, Y. Indoor climate and thermal physiological adaptation: Evidences from migrants with different cold indoor exposures. Build. Environ. 2016, 98, 30–38. [Google Scholar] [CrossRef]
- Herrington, J.D. Effects of music in service environments: A field study. J. Serv. Mark. 1996, 10, 26–41. [Google Scholar] [CrossRef]
Figure 1.
The layout of the room.

Figure 2.
Schedule of the test.

Figure 3.
Acoustic sensations votes (ASVs) in different noise conditions (** p < 0.01).

Figure 4.
ACVs and ASVs in different noise conditions (** p < 0.01).

Figure 5.
ASVs and ACVs in different conditions (** p < 0.01).

Figure 6.
The acoustic sensation in different conditions.

Figure 7.
The trend of the ASVs.

Figure 8.
ACVs in different conditions.

Figure 9.
The trend of ACVs.


Table 1.
The properties of the subjects.
| Gender | Age (Year) | Height (cm) | Body Mass (kg) |
|---|---|---|---|
| Male | 24.8 ± 1.5 | 177.1 ± 3.5 | 70.2 ± 8.2 |
| Female | 23.6 ± 1.3 | 163.2 ± 6.1 | 53.8 ± 7.4 |
Table 2.
The factors and levels of the experiment.
| Levels | Noise Types | SPL of Noises (dB) | SPL of Music (dB) | Music Tempo (BPM) |
|---|---|---|---|---|
| 1 | Talkers’ babble | 45 | 45 | 70 |
| 2 | Traffic noise | 60 | 60 | 110 |
| 3 | Construction noise | 75 | 75 | 150 |
Table 3.
The table of orthogonal design.
| Exp. Number | A: Noise Types | B: SPL of Noises | C: SPL of Music | D: Music Tempo | Conditions * |
|---|---|---|---|---|---|
| 1 | 1 | 1 | 1 | 1 | A1B1C1D1 |
| 2 | 1 | 2 | 2 | 2 | A1B2C2D2 |
| 3 | 1 | 3 | 3 | 3 | A1B3C3D3 |
| 4 | 2 | 1 | 2 | 3 | A2B1C2D3 |
| 5 | 2 | 2 | 3 | 1 | A2B2C3D1 |
| 6 | 2 | 3 | 1 | 2 | A2B3C1D2 |
| 7 | 3 | 1 | 3 | 2 | A3B1C3D2 |
| 8 | 3 | 2 | 1 | 1 | A3B2C1D1 |
| 9 | 3 | 3 | 2 | 3 | A3B3C2D3 |
* Taking experiment 3 as an example, which represents A1B3C3D3 conditions, the noise type is talkers’ babble and the sound pressure level of noise is 75 dB. The music tempo is 150 BPM and the sound pressure level of music is 75 dB.
Table 4.
Acoustic sensation votes.
| Exp. Number | Noise Types | SPL of Noises | Music Tempo | SPL of Music | ASV |
|---|---|---|---|---|---|
| 1 | 1 | 1 | 1 | 1 | 0.98 |
| 2 | 1 | 2 | 2 | 2 | 1.71 |
| 3 | 1 | 3 | 3 | 3 | 2.83 |
| 4 | 2 | 1 | 2 | 3 | 1.51 |
| 5 | 2 | 2 | 3 | 1 | 1.84 |
| 6 | 2 | 3 | 1 | 2 | 2.79 |
| 7 | 3 | 1 | 3 | 2 | 1.57 |
| 8 | 3 | 2 | 1 | 1 | 1.57 |
| 9 | 3 | 3 | 2 | 3 | 2.64 |
Table 5.
Range analysis of acoustic sensation.
| Exp. Number | Noise Types | SPL of Noise | Music Tempo | SPL of Music |
|---|---|---|---|---|
| K1 | 5.52 | 4.06 | 5.34 | 4.39 |
| K2 | 6.14 | 5.12 | 5.86 | 6.07 |
| K3 | 5.78 | 8.26 | 6.24 | 6.98 |
| k1 | 1.84 | 1.35 | 1.78 | 1.46 |
| k2 | 2.05 | 1.71 | 1.95 | 2.02 |
| k3 | 1.93 | 2.75 | 2.08 | 2.33 |
| R | 0.21 | 1.40 | 0.30 | 0.87 |
K: represents the summation of the acoustic sensation votes of the same level (1, 2, 3) on the factor column (noise type, noise sound pressure level, music sound pressure level, etc.). k: represents the horizontal average of K in the column, k = K/3. R: range, R = kmax–kmin or R = Kmax–Kmin, the intuitive calculation of the R value of this experiment is calculated by k value.
Table 6.
Range analysis of acoustic comfort.
| Exp. Number | Noise Types | SPL of Noises | Music Tempo | SPL of Music | ACV |
|---|---|---|---|---|---|
| 1 | 1 | 1 | 1 | 1 | 0.53 |
| 2 | 1 | 2 | 2 | 2 | 1.13 |
| 3 | 1 | 3 | 3 | 3 | 2.10 |
| 4 | 2 | 1 | 2 | 3 | 0.87 |
| 5 | 2 | 2 | 3 | 1 | 1.29 |
| 6 | 2 | 3 | 1 | 2 | 2.01 |
| 7 | 3 | 1 | 3 | 2 | 0.89 |
| 8 | 3 | 2 | 1 | 1 | 1.17 |
| 9 | 3 | 3 | 2 | 3 | 1.93 |
| K1 | 3.763 | 2.288 | 3.706 | 2.988 | |
| K2 | 4.163 | 3.588 | 3.925 | 4.025 | |
| K3 | 3.981 | 6.031 | 4.275 | 4.894 | |
| k1 | 1.254 | 0.763 | 1.235 | 0.996 | |
| k2 | 1.388 | 1.196 | 1.308 | 1.342 | |
| k3 | 1.327 | 2.010 | 1.425 | 1.631 | |
| R | 0.133 | 1.248 | 0.190 | 0.635 |
Table 7.
The characteristics of the subjects.
| Gender | Age (Year) | Height (cm) | Body Mass (kg) |
|---|---|---|---|
| Male | 23.5 ± 1.2 | 178.1 ± 3.0 | 71.2 ± 10.3 |
| Female | 24.6 ± 1.3 | 165.2 ± 6.1 | 52.7 ± 6.9 |
Table 8.
The factors and levels of the experiment.
| Noise Types | Levels | SPL of Noise (dB) | SPL of Music (dB) | Music Tempo (BPM) |
|---|---|---|---|---|
| Talkers’ babble | 1 | 50 | 50 | 70 |
| 2 | 60 | 60 | 110 | |
| 3 | 70 | 70 | 150 |
Table 9.
The table of orthogonal design.
| Exp. Number | A: SPL of Noise | B: Music Tempo | C: SPL of Music | D: Error | Conditions * |
|---|---|---|---|---|---|
| 1 | 1 | 1 | 1 | 1 | A1B1C1 |
| 2 | 1 | 2 | 2 | 2 | A1B2C2 |
| 3 | 1 | 3 | 3 | 3 | A1B3C3 |
| 4 | 2 | 1 | 2 | 3 | A2B1C2 |
| 5 | 2 | 2 | 3 | 1 | A2B2C3 |
| 6 | 2 | 3 | 1 | 2 | A2B3C1 |
| 7 | 3 | 1 | 3 | 2 | A3B1C3 |
| 8 | 3 | 2 | 1 | 1 | A3B2C1 |
| 9 | 3 | 3 | 2 | 3 | A3B3C2 |
* Taking experiment 3 as an example, which represents A1B3C3 conditions, the noise type is talkers’ babble and the sound pressure level is 50 dB. The music tempo is 150 BPM and the sound pressure level is 70 dB.
Table 10.
RSD in groups and between groups.
| Item | Groups | Sound Pressure Levels (dB) | RSD |
|---|---|---|---|
| Acoustic sensation | In groups | 50 | 0.060 |
| 60 | 0.031 | ||
| 70 | 0.000 | ||
| Between groups | 50 | 0.244 | |
| 60 | 0.233 | ||
| 70 | 0.094 | ||
| Acoustic comfort | In groups | 50 | 0.000 |
| 60 | 0.063 | ||
| 70 | 0.053 | ||
| Between groups | 50 | 0.180 | |
| 60 | 0.112 | ||
| 70 | 0.167 |
Table 11.
Range analysis of ASV.
| Exp. Number | SPL of Noise | Music Tempo | SPL of Music | Error | ASV |
|---|---|---|---|---|---|
| 1 | 1 | 1 | 1 | 1 | 1.05 |
| 2 | 1 | 2 | 2 | 2 | 1.25 |
| 3 | 1 | 3 | 3 | 3 | 1.58 |
| 4 | 2 | 1 | 2 | 3 | 1.79 |
| 5 | 2 | 2 | 3 | 1 | 1.96 |
| 6 | 2 | 3 | 1 | 2 | 1.87 |
| 7 | 3 | 1 | 3 | 2 | 2.68 |
| 8 | 3 | 2 | 1 | 1 | 2.69 |
| 9 | 3 | 3 | 2 | 3 | 2.42 |
| K1 | 3.88 | 5.53 | 5.62 | 5.71 | |
| K2 | 5.62 | 5.9 | 5.45 | 5.8 | |
| K3 | 7.79 | 5.87 | 6.23 | 5.79 | |
| R | 1.30 | 0.12 | 0.26 | 0.03 |
Table 12.
Analysis of variance.
| Factors | F | Significant | |
|---|---|---|---|
| Acoustic sensation | SPL of noise | 1461.143 | ** |
| Music tempo | 16 | ||
| SPL of music | 64.06767 | * | |
| Error |
** p < 0.01, * p < 0.05.
Table 13.
Range analysis of ACV.
| Exp. Number | SPL of Noise | Music Tempo | SPL of Music | Error | ACV |
|---|---|---|---|---|---|
| 1 | 1 | 1 | 1 | 1 | 0.65 |
| 2 | 1 | 2 | 2 | 2 | 0.57 |
| 3 | 1 | 3 | 3 | 3 | 0.98 |
| 4 | 2 | 1 | 2 | 3 | 0.96 |
| 5 | 2 | 2 | 3 | 1 | 0.98 |
| 6 | 2 | 3 | 1 | 2 | 1.43 |
| 7 | 3 | 1 | 3 | 2 | 1.64 |
| 8 | 3 | 2 | 1 | 1 | 2.04 |
| 9 | 3 | 3 | 2 | 3 | 1.78 |
| K1 | 2.19 | 3.25 | 4.12 | 3.68 | |
| K2 | 3.37 | 3.59 | 3.31 | 3.63 | |
| K3 | 5.46 | 4.18 | 3.59 | 3.72 | |
| R | 1.09 | 0.31 | 0.27 | 0.03 |
Table 14.
Analysis of variance.
| Factors | F | Significant | |
|---|---|---|---|
| Acoustic comfort | SPL of noise | 1432.306 | ** |
| Music tempo | 115.8571 | ** | |
| SPL of music | 87.4898 | * | |
| Error |
** p < 0.01, * p < 0.05.
Publisher’s Note: MDPI stays neutral with regard to jurisdictional claims in published maps and institutional affiliations. |
© 2021 by the authors. Licensee MDPI, Basel, Switzerland. This article is an open access article distributed under the terms and conditions of the Creative Commons Attribution (CC BY) license (https://creativecommons.org/licenses/by/4.0/).
Share and Cite
MDPI and ACS Style
Liang, P.; Guan, H.; Wang, Y.; Chen, H.; Song, P.; Ma, H.; Hu, S. The Effect of Music Tempo and Volume on Acoustic Perceptions under the Noise Environment. Sustainability 2021, 13, 4055. https://0-doi-org.brum.beds.ac.uk/10.3390/su13074055
AMA Style
Liang P, Guan H, Wang Y, Chen H, Song P, Ma H, Hu S. The Effect of Music Tempo and Volume on Acoustic Perceptions under the Noise Environment. Sustainability. 2021; 13(7):4055. https://0-doi-org.brum.beds.ac.uk/10.3390/su13074055
Chicago/Turabian StyleLiang, Ping, Hongyu Guan, Yuezhen Wang, Han Chen, Pengfei Song, Haonan Ma, and Songtao Hu. 2021. "The Effect of Music Tempo and Volume on Acoustic Perceptions under the Noise Environment" Sustainability 13, no. 7: 4055. https://0-doi-org.brum.beds.ac.uk/10.3390/su13074055
Note that from the first issue of 2016, this journal uses article numbers instead of page numbers. See further details here.