Article

An Approach to the Operation Modes and Strategies for Integrated Hybrid Parabolic Trough and Photovoltaic Solar Systems

by
José A. López-Álvarez
1,
Miguel Larrañeta
1,*,
Elena Pérez-Aparicio
1,
Manuel A. Silva-Pérez
2 and
Isidoro Lillo-Bravo
2
1
Andalusian Association for Research and Industrial Cooperation (AICIA), 41092 Seville, Spain
2
Department of Energy Engineering, University of Seville, 41092 Seville, Spain
*
Author to whom correspondence should be addressed.
Sustainability 2021, 13(8), 4402; https://0-doi-org.brum.beds.ac.uk/10.3390/su13084402
Submission received: 25 March 2021 / Revised: 8 April 2021 / Accepted: 12 April 2021 / Published: 15 April 2021
(This article belongs to the Special Issue Solar Power System and Sustainability)

Abstract

:
Concentrated solar power (CSP) and photovoltaic (PV) solar systems can be hybridized, creating synergies: on one hand procuring dispatchability by storing thermal energy, and on the other hand generating electricity at a highly competitive prize. In this paper, we present an approach to the operation strategies and modes for integrated hybrid CSP + PV systems. We focus on parabolic trough (PT) solar plants, especially those operating in the south of Spain. Our study consists in the definition of suitable states for each of the subsystems that constitute a hybrid solar plant. We then propose modes from the combination of suitable states and establish the conditions for the transition between modes depending on the operation strategy. We propose two operation strategies: demand coverage and base load production. The results of this paper can be used in decision making for hybrid solar system simulation programs.

1. Introduction

The COVID-19 pandemic has caused more disruption in the energy sector than any other event in recent history. Before the COVID-19 crisis, the increase in energy demand between 2019 and 2030 was estimated at 12%. Currently, it is quantified as between 4% and 9%. Renewable energies play a fundamental role in meeting the increasing energy demand, since they can satisfy 80% of this increase in global energy demand until 2030. Solar energy is the main engine for growth, setting new highs for installed capacity every year after 2022 [1]. In the last year, solar energy has increased installed power worldwide by almost 20% [2].
Large-scale electricity generation using solar energy is currently feasible through two perfectly differentiated technologies: photovoltaic (PV) solar technology and concentrated solar power (CSP) technology. PV technology consists in the direct conversion of sunlight into electrical energy by means of photovoltaic cells. On the other hand, CSP technology is based on the indirect conversion of sunlight by means of steam turbines [3].
Both technologies are nowadays in times of competitiveness and complementarity. PV technology presents learning curves with large slopes and a modular and simple nature that favors the rapid start-up of plants. Currently, PV technology is a mature technology, with competitive production costs [4]. PV systems hardly present moving parts and generate electrical energy directly from solar radiation, which simplifies the process. Their power generation is sensitive to radiation disturbances. These systems present a fast response time, sometimes generating inconveniences from the point of view of the stability of the grid. On the other hand, their costs are significantly lower than those of CSP. Their main disadvantage is their inability to store large amounts of energy efficiently at a competitive cost [5].
CSP systems’ complexity is generally higher. They broadly consist in a concentrator, a receiver, a power block and a thermal energy storage (TES) system, which has a significant impact on the higher cost of the electricity production in these plants. CSP plants make use of synchronous generators identical to those used in conventional power plants, reducing the impact of the cloud transients on the stability of the grid. However, CSP systems exploit the direct component of the solar radiation, which presents steeper ramps due to the cloud transients than the global radiation exploited by PV systems [6].
In any case, the great advantage of CSP systems consists in their availability to store the thermal energy obtained from the concentration of direct solar radiation into a thermal fluid in the solar field. The thermal energy storage (TES) system, generally compounded by molten salts [7], allows large amounts of energy to be stored, increasing the dispatchability of the system and favoring the decoupling of electrical energy generation [8]. CSP has recently reached production costs higher than PV and is less competitive [4].
Both PV and CSP systems are complementary: on one hand, high-quality energy production at low cost, and on the other hand, the capability of decoupling power production from the solar resource availability. Maximizing their synergies would be an interesting alternative to the global electricity system and would promote sustainable development [9]. The literature includes different hybridization alternatives, although we can classify hybrid systems into two groups, compact and non-compact systems [10]:
  • Non-compact hybrid systems consist in the hybridization of a PV plant and a CSP plant that can operate independently. The hybridization is conducted by the control system by means of the electric power dispatch selection. We can find two configurations in this hybridization technology: PV-CSP and concentrated PV-CSP (CPV-CSP).
  • In compact hybrid systems, the integration is carried out by a single system in which photons with enough energy to overcome the band gap of a PV semiconductor material are used by the PV system for the direct conversion of solar energy into electricity. Photons that do not have enough energy to exceed the band gap are converted into heat, taking advantage of this thermal energy for the subsequent production of electricity through a Rankine cycle. There are three subsystems in this technology: PV topping, spectral beam splitting (SBS) and combined PV topping and SBS.
Hybrid PV-CSP projects are an attractive solution for the main companies in the sector, who value the increase in the capacity factor (CF) and the reduction in the levelized cost of energy (LCOE) [11,12,13] of the combined systems. There are several commercial PV-CSP projects in operation or under construction; all of them present non-compact configurations. Table 1 presents the most relevant commercial hybrid PV-CSP projects.
The development of hybrid system simulation tools is crucial for a deeper knowledge of the performance of hybrid CSP + PV systems. At the moment, the common practice is to use in-house simple built algorithms to run hybrid plant simulations [20] or to combine outputs of independent solar plant simulations from well-known simulation tools [21,22,23]. However, there is a rising interest in the availability of open and flexible tools for the simulation of hybrid solar plant performance, in which the operation strategies and modes are crucial. In recent approaches, the implemented operation strategies and modes in the simulation tools were developed focusing on several aims. Platzer et al. [24] simulated a CPV-CSP plant to check the cost reduction of the heliostat field, with an operation strategy based on PV production during the day and TES during the night. Cocco et al. [25] studied the improvement of the manageability of hybrid solar plants. The aim was to soften the effects of the variability and intermittency of the solar energy production. Two different control strategies were considered: one focusing on a full integration in which the CPV and CSP plants operate in a complementary way, keeping the output power fixed and maximizing the duration of the application of the power, and the other focusing on a partial integration where the CPV and CSP operate independently, keeping the total output power of the system fixed. The result of the study showed that the fully integrated strategy maximizes the hybrid plant total production time while the partially integrated strategy maximizes each plant’s production separately. The fully integrated strategy reaches higher production performances and a higher number of operation hours. Zurita et al. [26,27] studied a hybrid plant with a TES system and a battery energy storage system (BESS) to store the electrical energy produced in the PV field. The results show the necessity of a cost reduction of the BESS in order to achieve a competitive technology. In another approach, they also implemented two different operation modes in a plant with TES and BESS [28]. The first operation mode controls the CSP plant as a back-up of the PV plant and activates the BESS only when the TES needs to be supplemented. The second operation mode operates the BESS as the first back-up of the PV plant, activating the CSP plant only when the BESS reaches its minimum operational capacity.
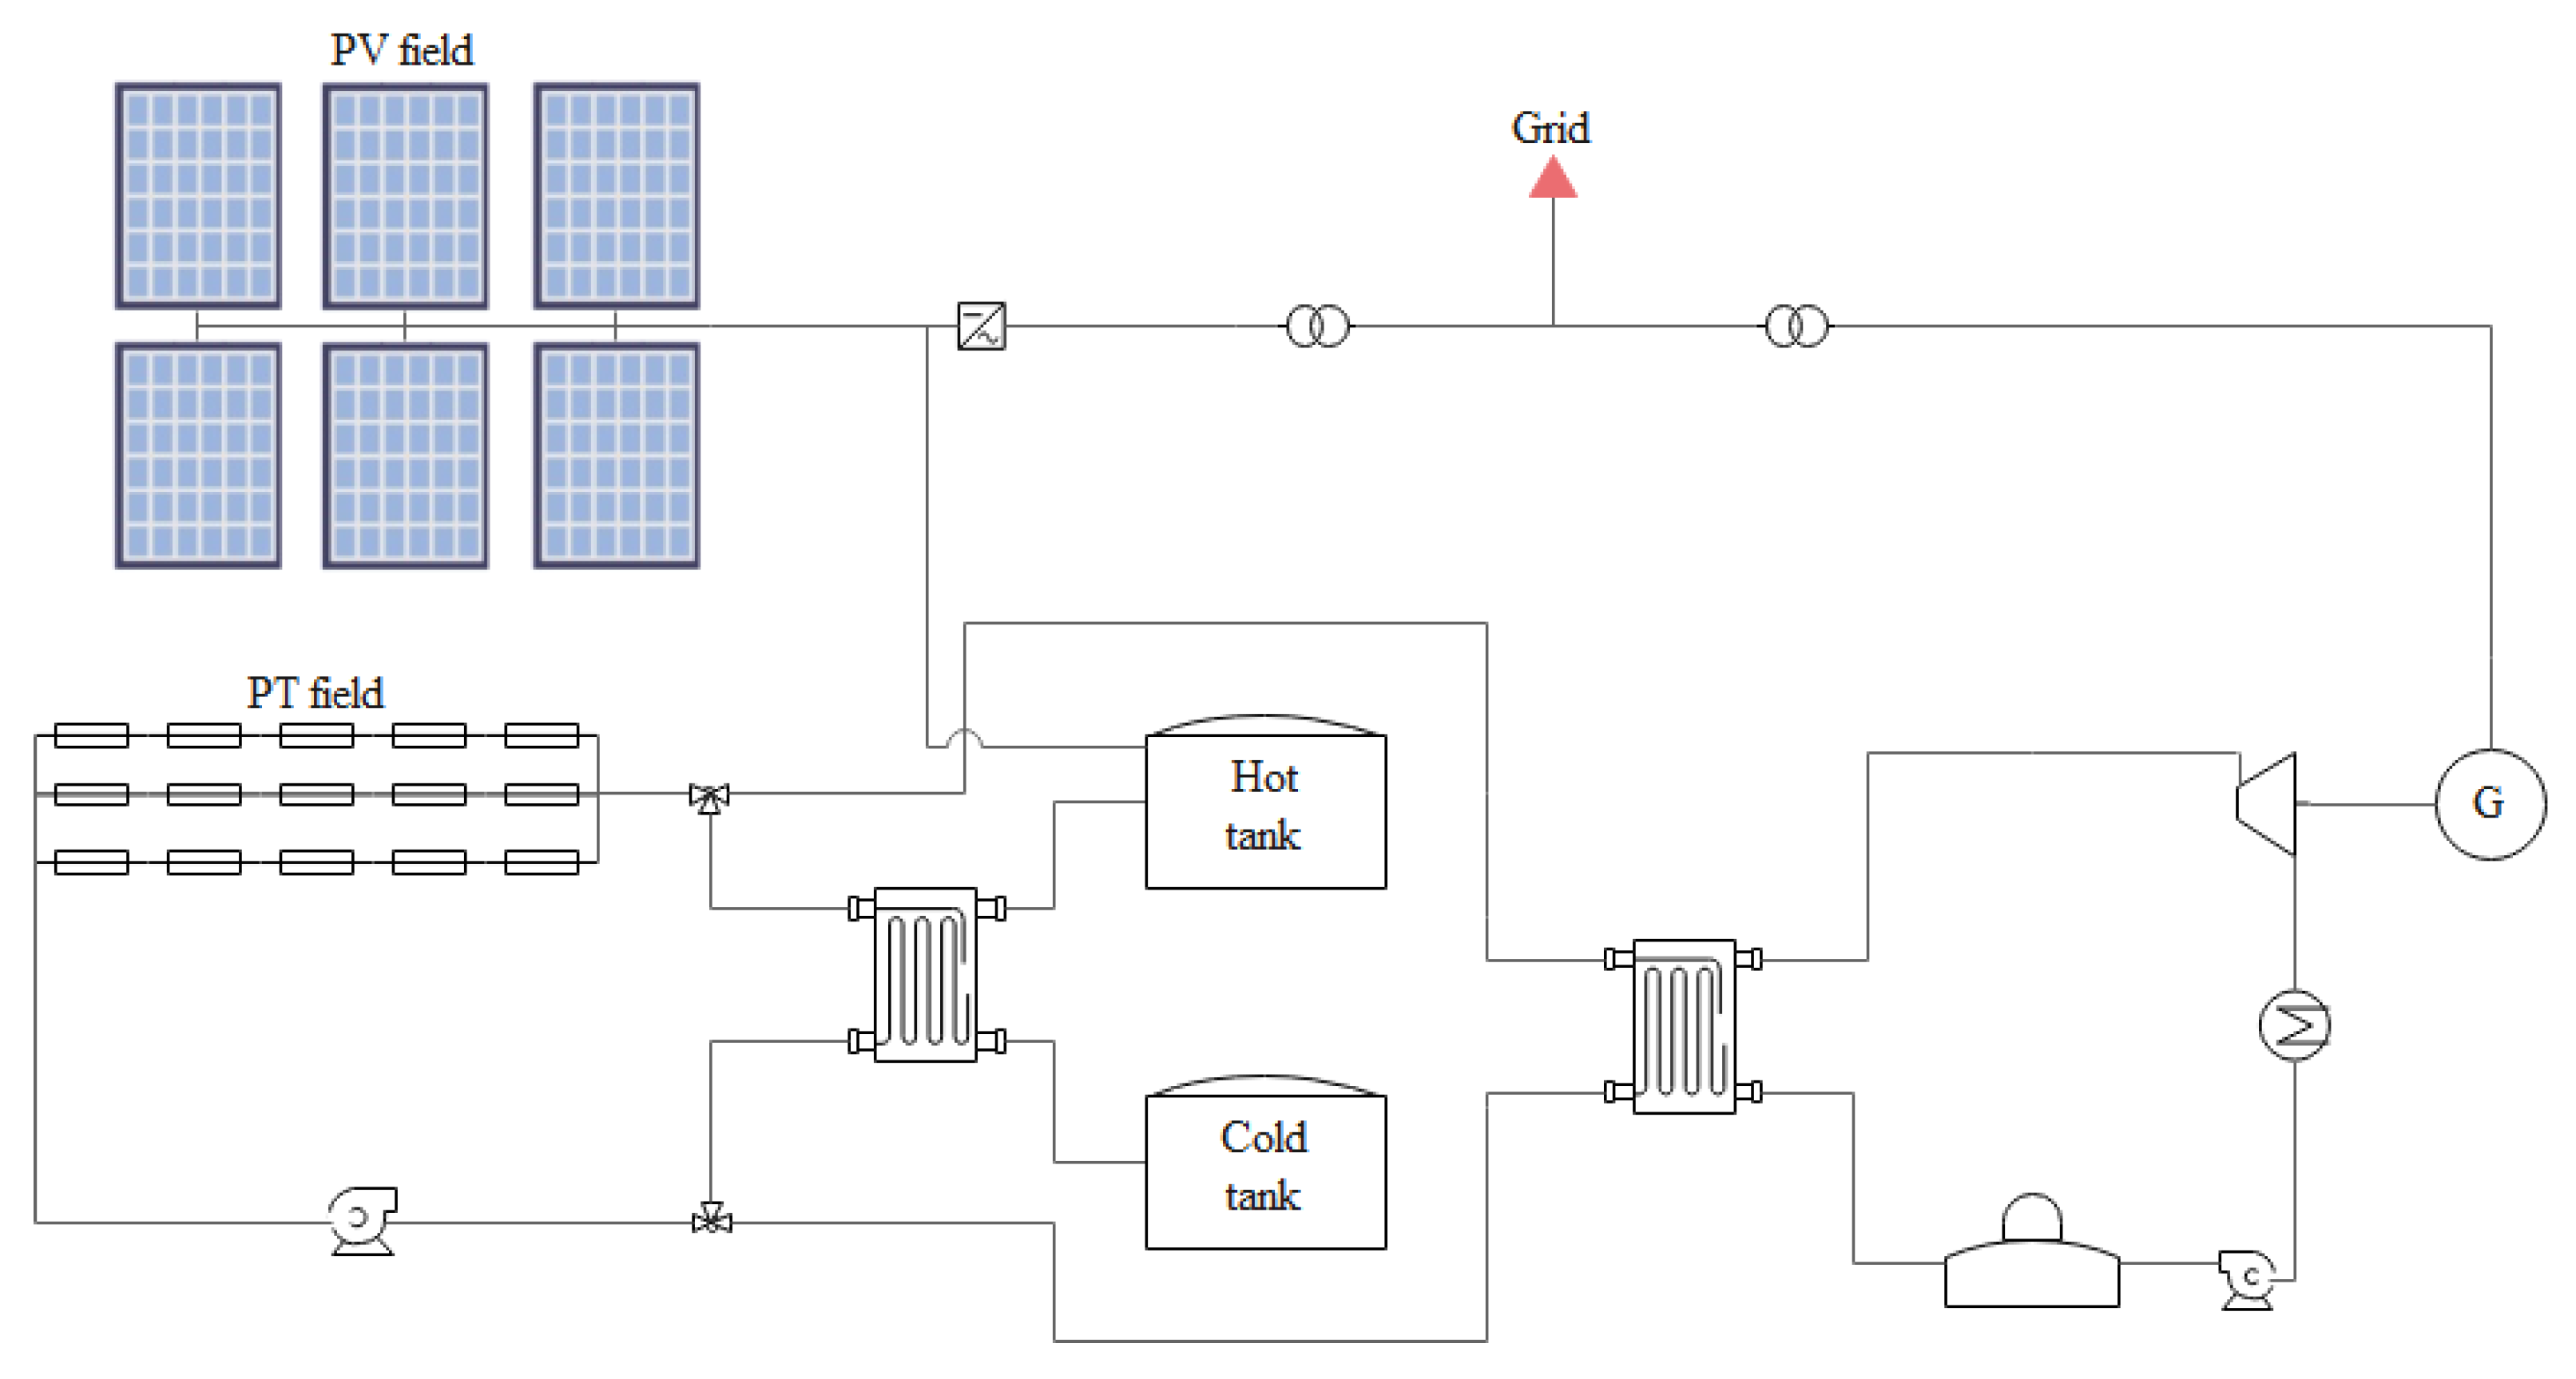
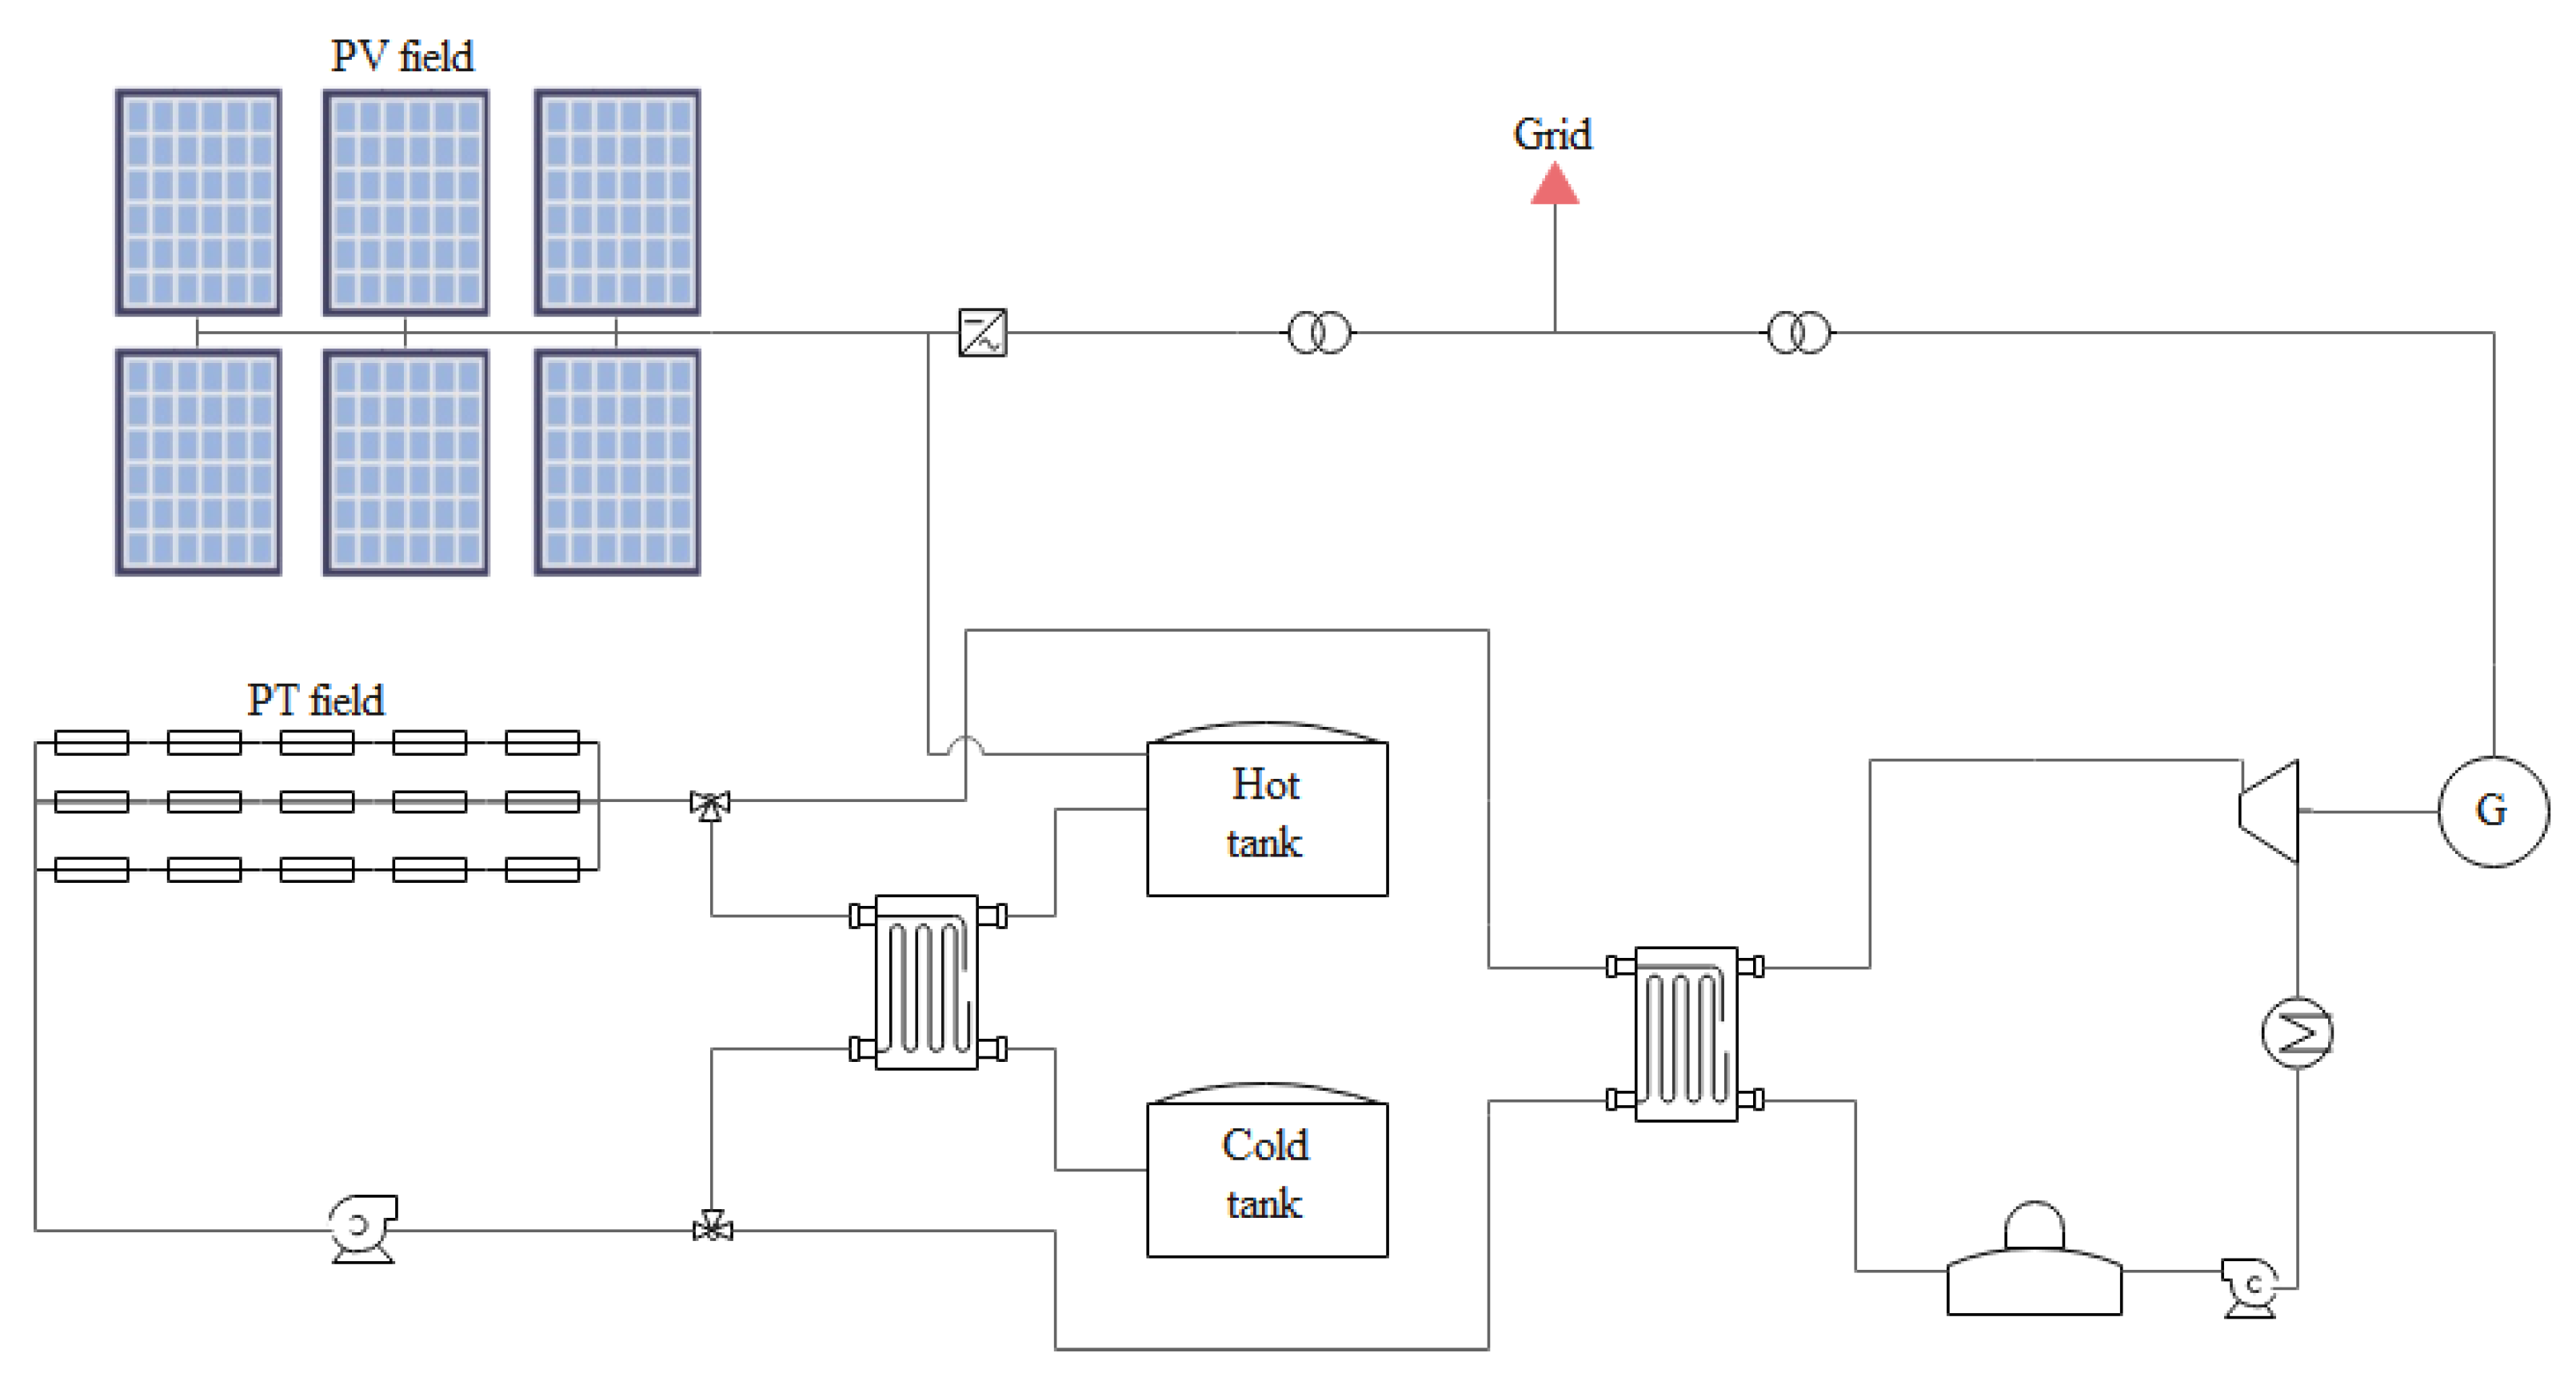
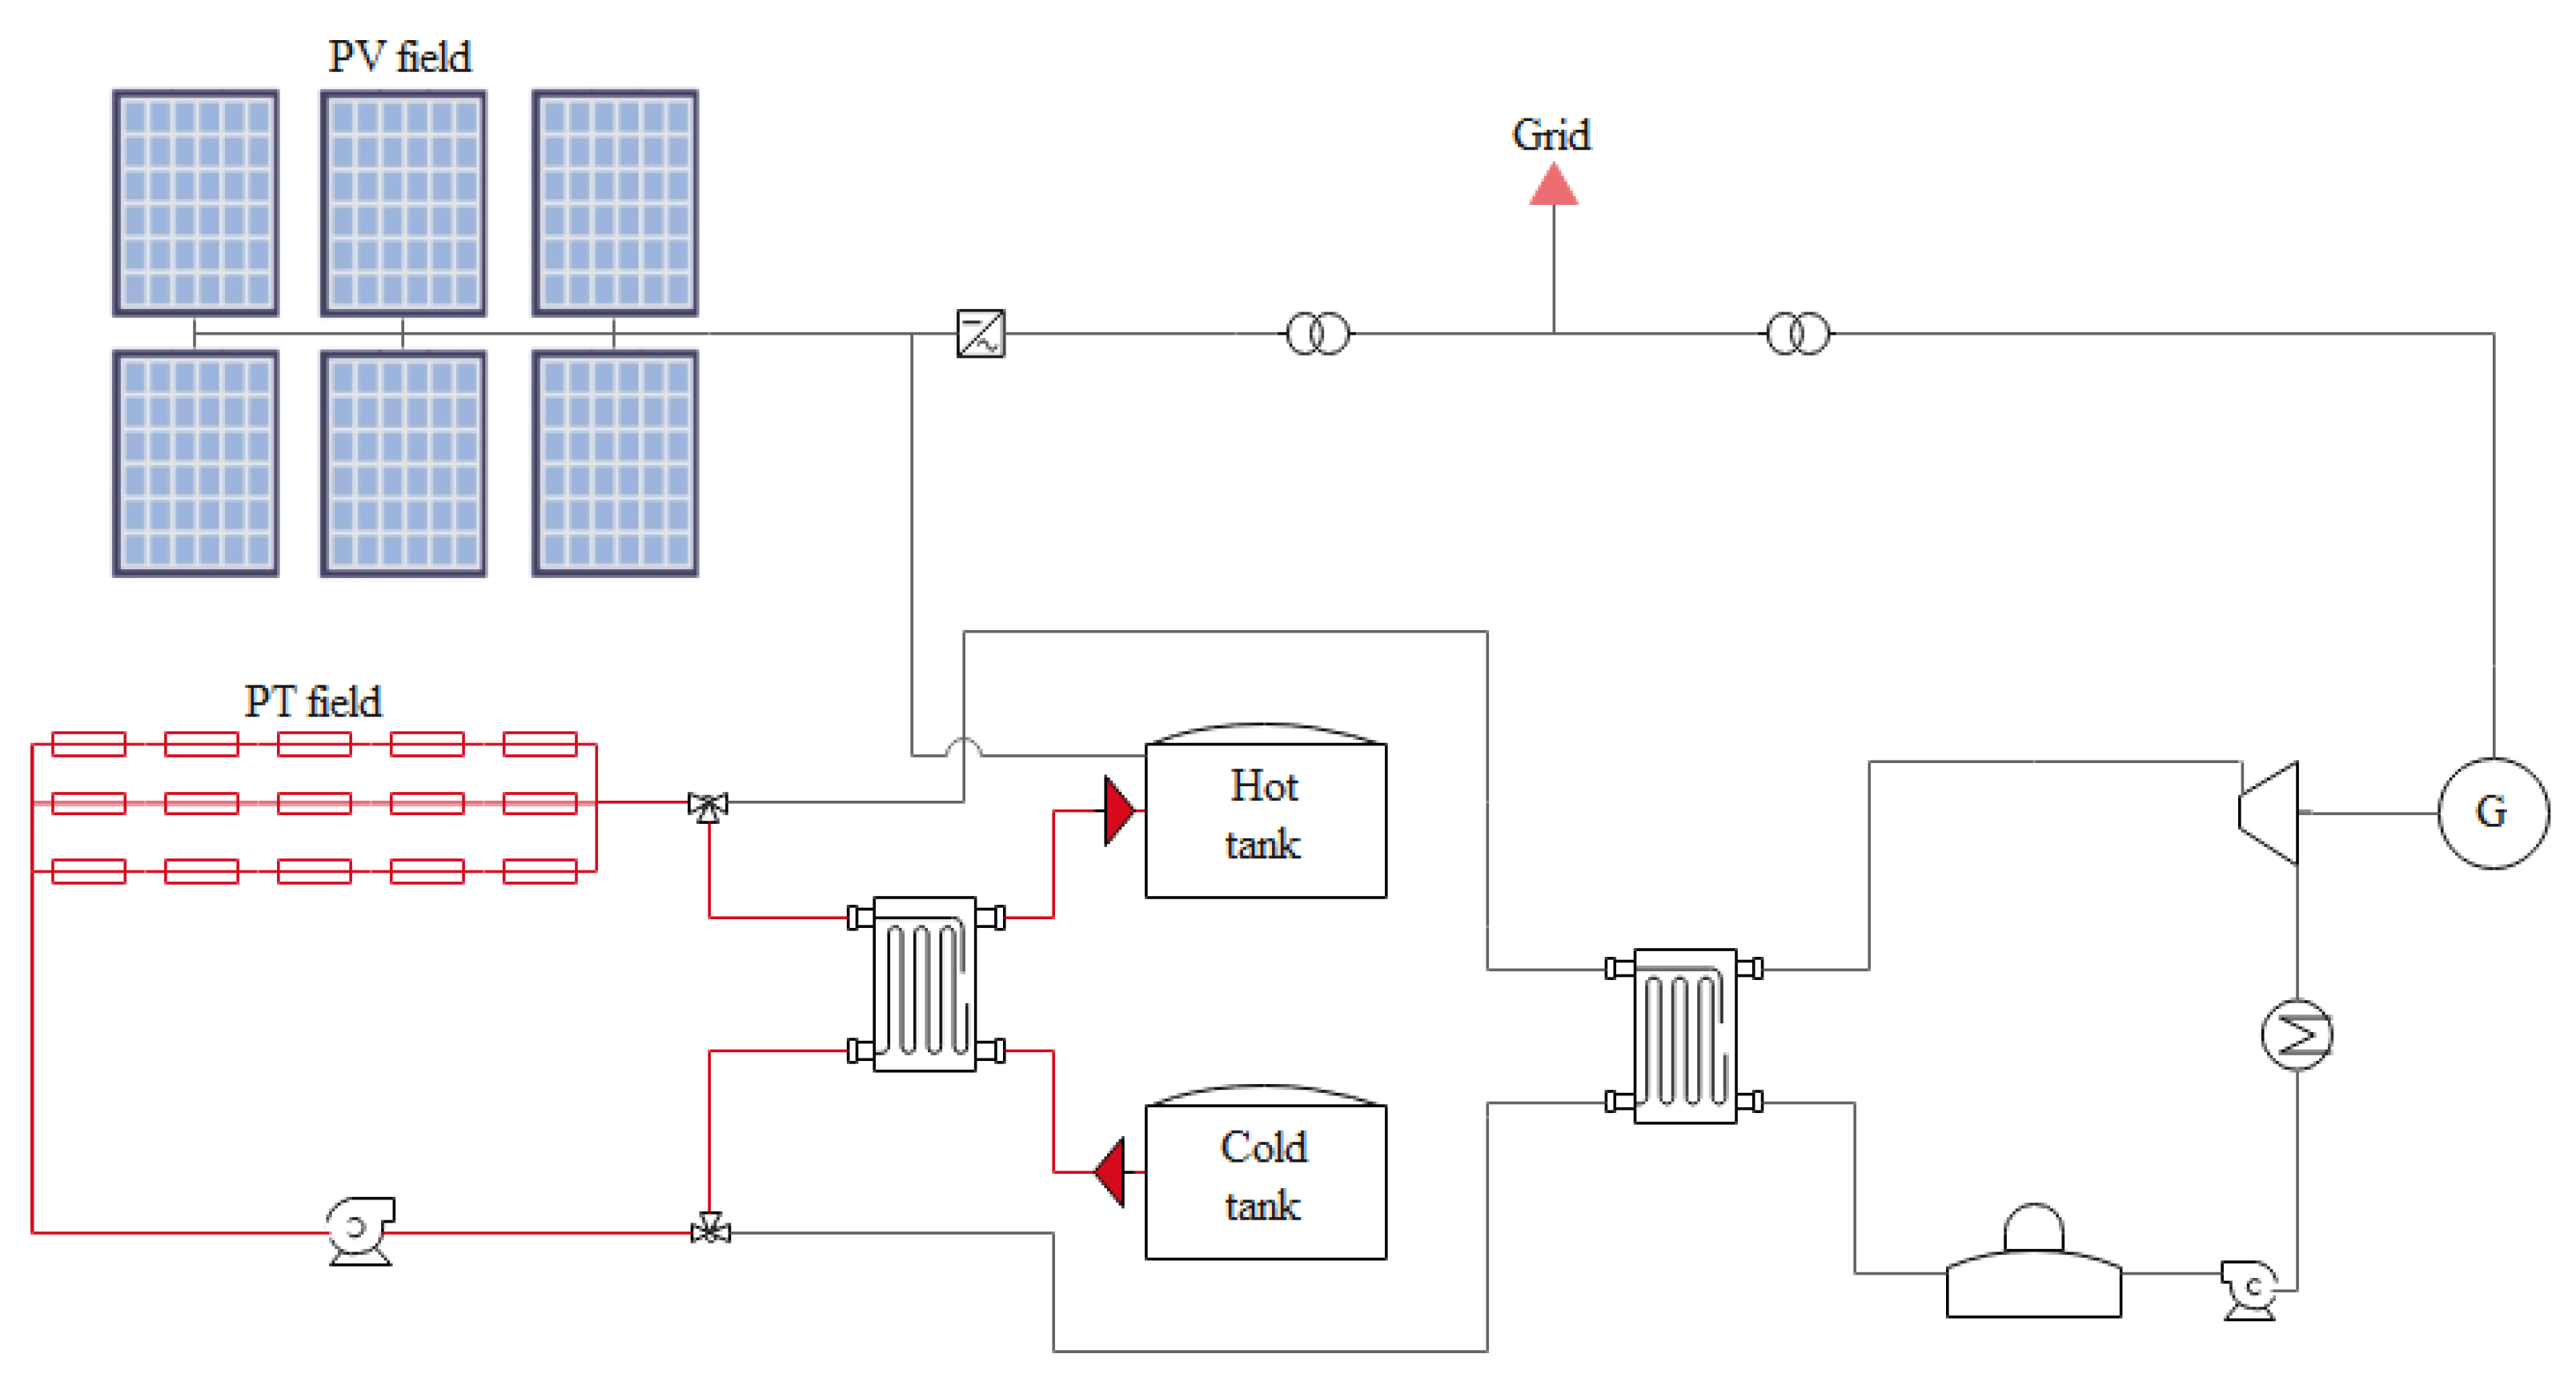
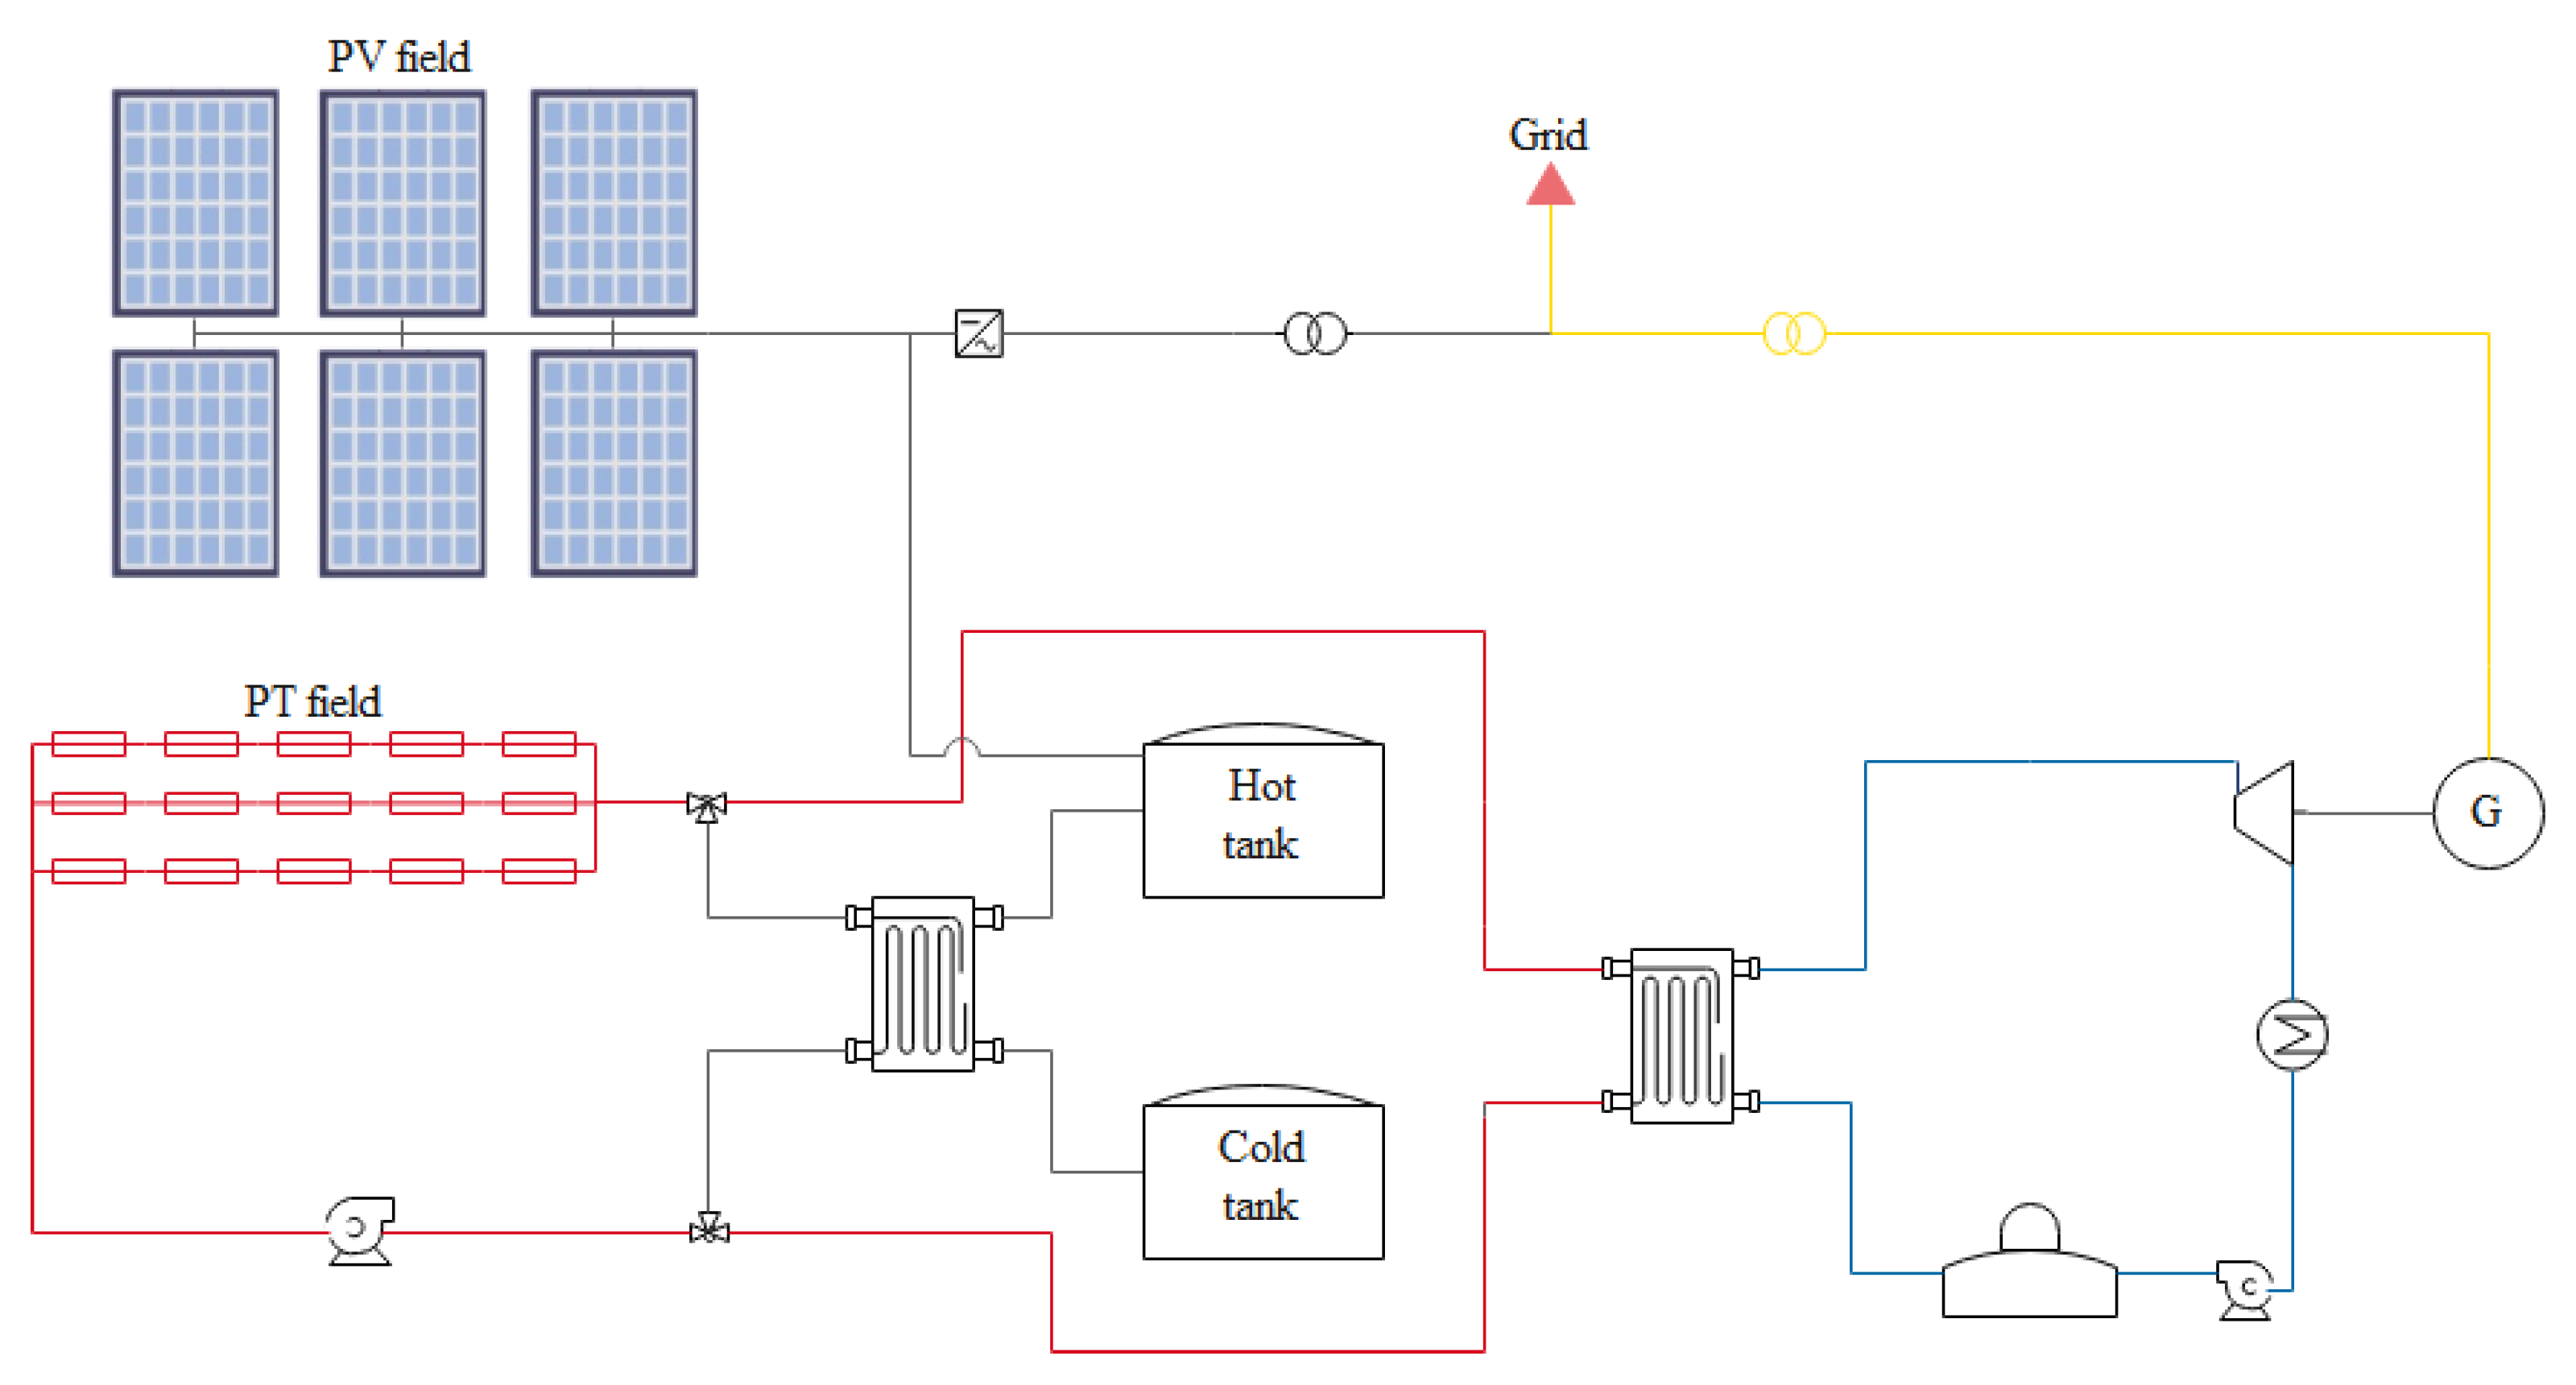
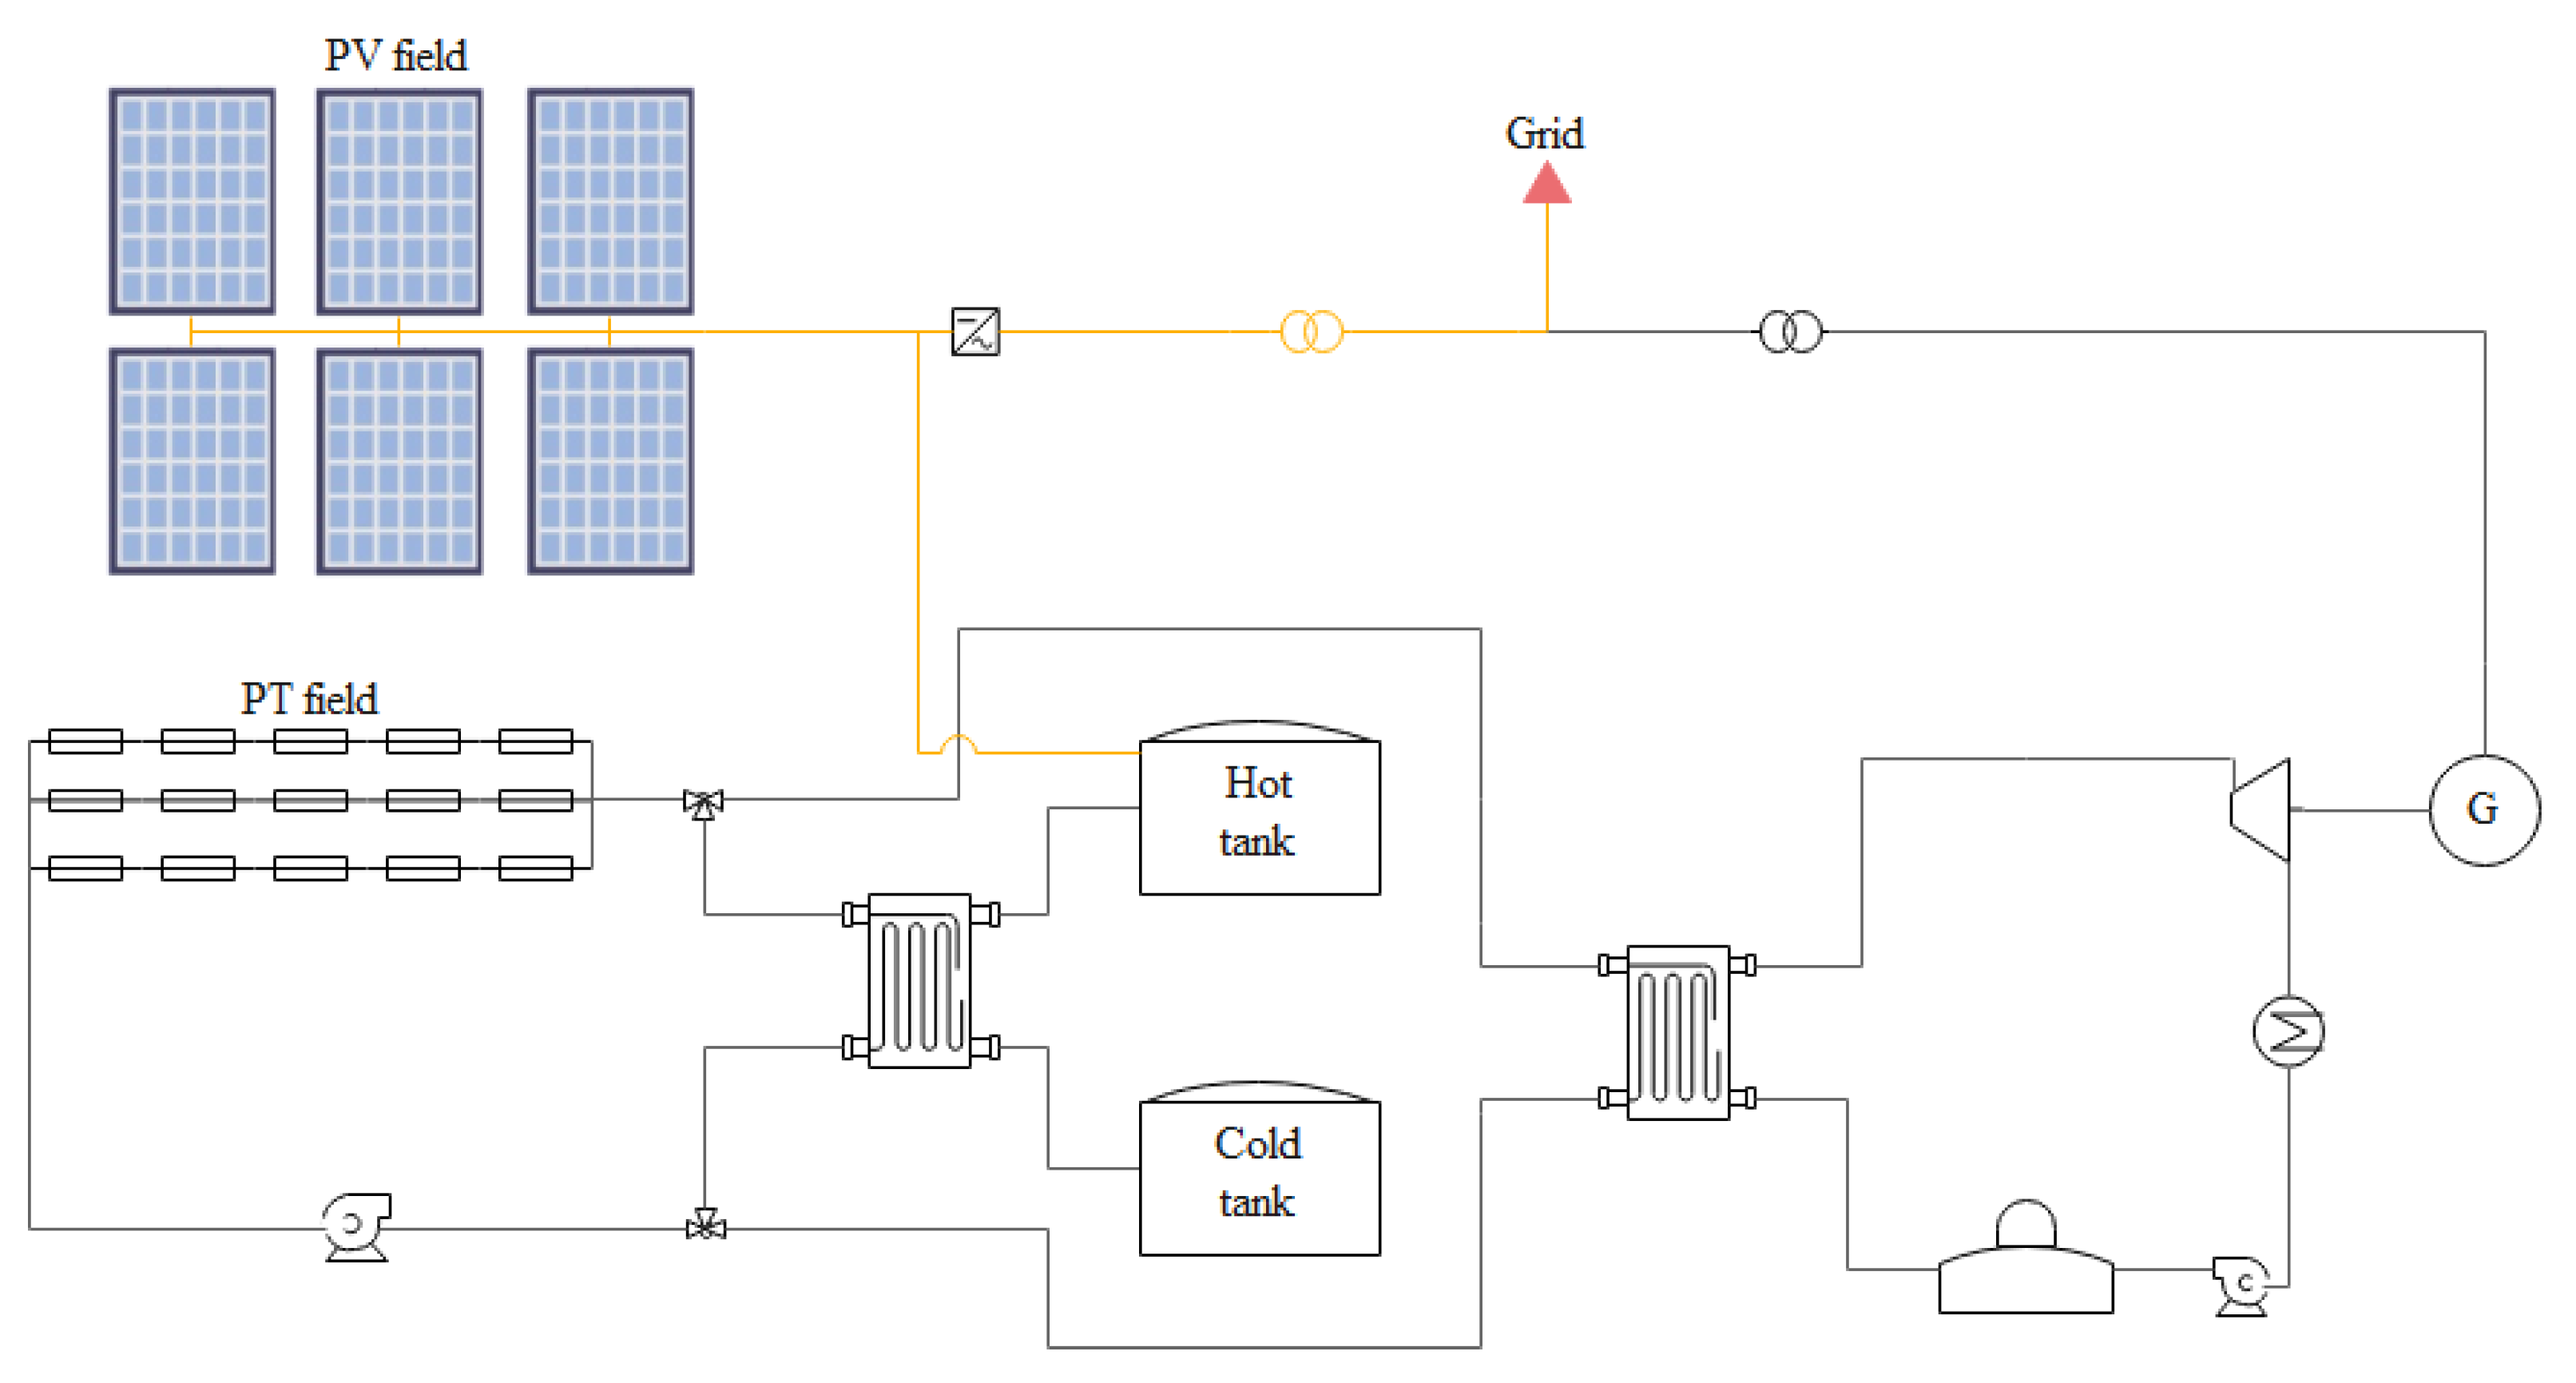
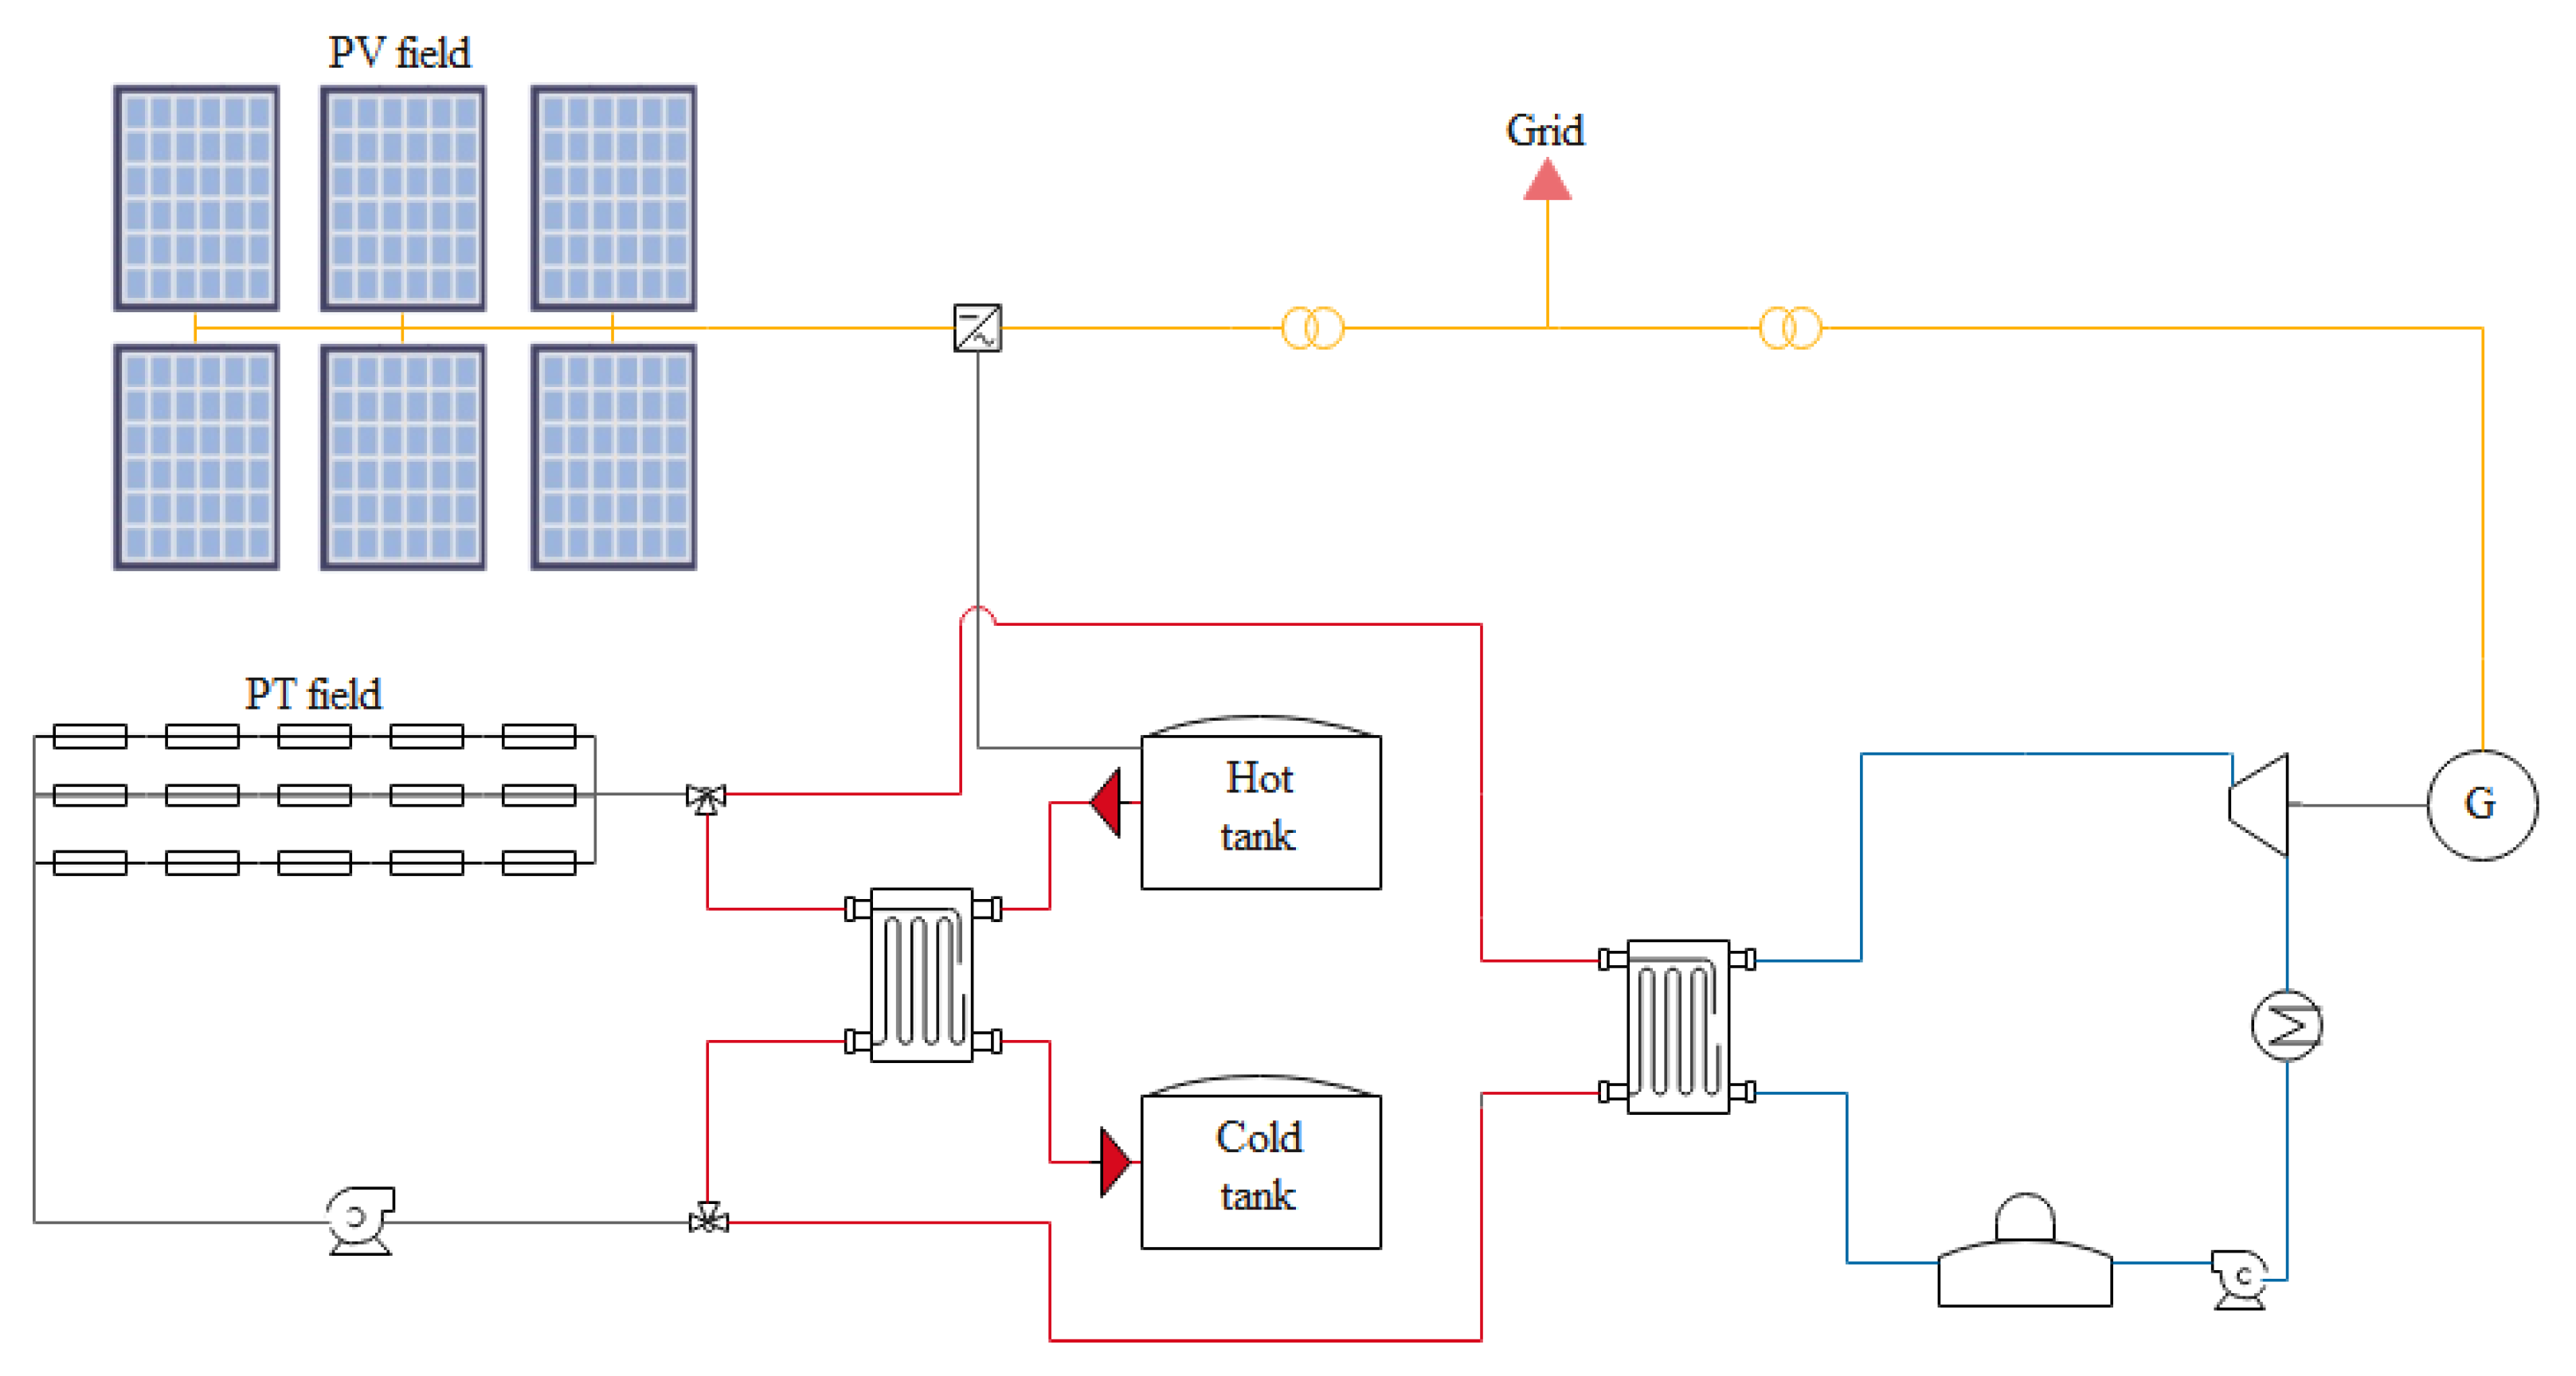
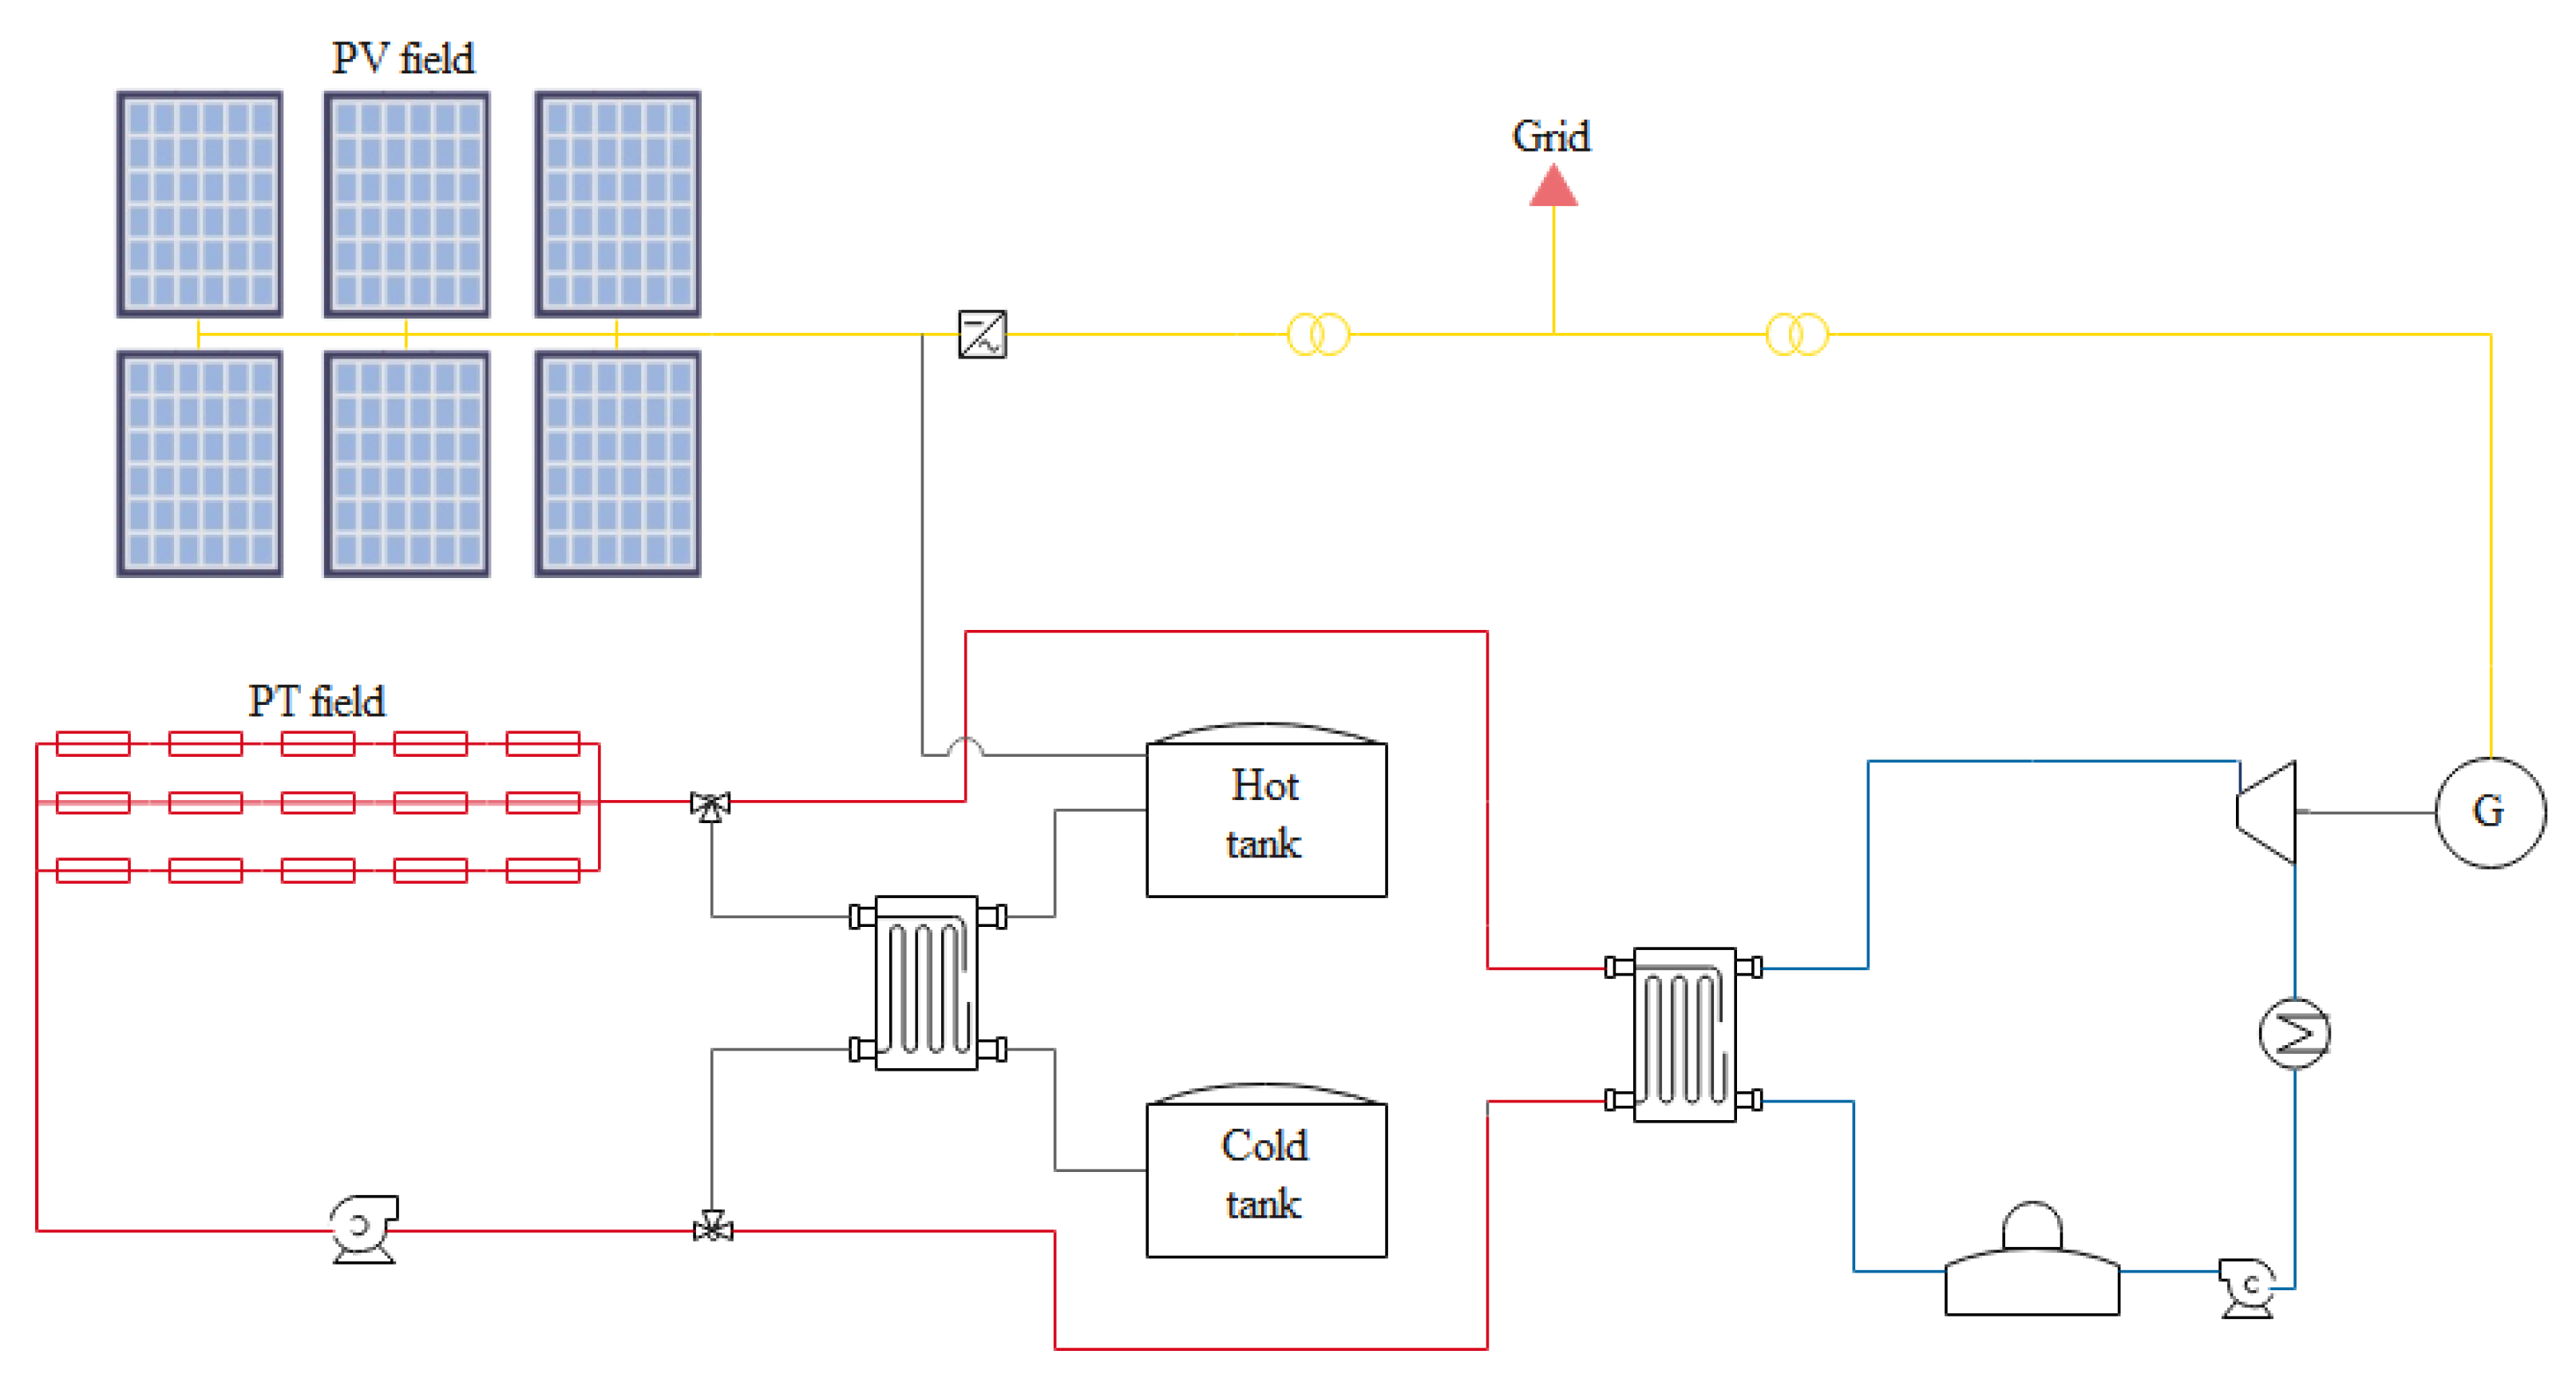
In the present study, we elaborate the operation modes of integrated hybrid non-compact PV + CSP systems focusing on two operation strategies: maximum capacity factor and real-time demand coverage, where the CSP field consists in a parabolic trough (PT) field [29]. The approach we present can be used for the development of other operation strategies for near-future hybrid solar plant configurations. We differentiate three subsystems: a PT solar field, a PV solar field, and a TES in which the thermal and electrical energy produced from the solar fields will be integrated. The common TES of PT plants is thought to be retrofitted in order to be able to also absorb the electrical energy produced from the PV field. There is an active investigation on this matter [30,31].
This research presents, for the first time, a step-by-step procedure for the determination of the energy flows within the subsystems of hybrid integrated CSP + PV systems. We propose a systematic method to determine operation modes and their transitions depending on the operation strategy, scalable to other hybrid solar plant configurations. This paper is the first step of a greater endeavor in which we intend to optimize the relative sizes of the subsystems constituting a hybrid integrated non-compact PT + PV system, assuming the boundary conditions established by the CSP plants in operation in Andalusia, in the south of Spain. We first create the brain of a simulation tool for the decision making in terms of the energy flows within the solar plant to develop an open-source simulation tool, which at least will be used to facilitate evaluation of a possible retrofitting of the CSP plants in operation in Andalusia by means of the integration of a PV system [32]. There are 50 CSP plants in Spain, most of them located in Andalusia [33]. Retrofitting of CSP plants is highly attractive in Spain due to the common plant configurations where the options for improvement are remarkable.
The paper is organized as follows: Section 2 presents the solar system under analysis, defining the subsystems and their possible states. Section 3 presents the proposed operation modes. Finally, in Section 4, we propose two operation strategies by defining the transitions between the operation modes.

2. Hybrid Solar Plant Configuration

We focus our research on retrofitting CSP plants in operation in Andalusia. Therefore, we start from the most common configuration with a PT field and a TES. The thermal energy produced in the PT field can be taken directly to the power block and/or to the TES. The TES consists in a hot and a cold molten salts tank. Whether the thermal fluid is thermal oil or molten salts is not relevant in the elaboration of the operation modes. Thus, the operation modes presented in the next sections can be extrapolated to CSP plants that work with only one sole thermal fluid, like the latest central receiver plants [34].
The PV output is inverted into AC and can be sent either to the grid and/or to the TES. In Figure 1, we present an overview of the hybrid solar plant configuration.

2.1. Subsystem States

Our method for the elaboration of the operation modes consists, in a first step, in the definition of subsystems and their possible states. We consider three subsystems: the PV solar field, the CSP solar field and the TES. The solar fields present three possible states:
  • Available and non-operating (A-nO)
  • Available and operating (A-O)
  • Non-available (nA)
The TES presents four possible states:
  • Available charging (A-C)
  • Available discharging (A-D)
  • Saturated (S)
  • Non-available (nA)
In Table 2, we summarize the defined subsystems and their possible states.

2.2. State Combinations

We can consider every situation that may take place in the operation of the plant in terms of the energy flows by the combination of the previously defined possible states. We can establish 36 combinations from Table 2. The combination of possible states leads to real and unreal situations as summarized in Table 3.
There are eight unreal state combinations:
  • Combinations 1, 9, 25 and 33: The TES cannot be charging if the solar fields are not operating.
  • Combinations 6, 7 and 8: From the efficiency point of view, it makes no sense to produce electricity from the CSP solar field through the power block while the PV solar field is available. We prioritize the usage of the PV field electricity produced for the direct supply to the grid and the CSP solar field thermal energy produced for its storage in the TES. In combinations 6–7 and 8, the PV solar field would be available but not operating while there is enough solar radiation since the CSP solar field would be operating to produce electricity.
  • Combination 14: The solar fields would be available but only the PV field would be operating. We then would be using the PV field and the energy from the TES (its state is available and discharging) to produce the electrical energy. It makes no sense to discharge TES and not to use the CSP field while there is enough solar radiation since the PV solar field would be operating to produce electricity.

3. Hybrid Solar Plant Operation Modes

To define the different operation modes in the hybrid PV-CSP plant, we cluster the real state combinations defined in Section 2.2 into 13 operation modes that would represent all the possibilities in terms of energy flows of the hybrid solar plant. In the following figures, the yellow lines represent the electrical energy produced in the PV field, the red lines represent thermal energy produced in the CSP solar field or stored in the TES, and the blue lines represent the power block.

3.1. Mode A

Table 4 presents the state combinations and main plant subsystem conditions of mode A. We include the power block condition in Table 4 for a better understanding of the operation mode. Figure 2 shows the energy flows in the hybrid solar plant layout in mode A.
  • The solar fields are not operating, either for technical reasons or due to negligible solar radiation levels.
  • The TES is either unavailable or saturated. This mode may lead to partial defocusing of the CSP solar field.
  • Power block is off.

3.2. Mode B

Table 5 shows the state combinations and main plant subsystem conditions of mode B. Figure 3 presents the energy flows in the hybrid solar plant layout in mode B.
  • The solar fields are not operating, either for technical reasons or due to negligible solar radiation levels.
  • There is thermal energy available in the TES, which is discharging it to the power block.
  • The power block is working and generating electricity.

3.3. Mode C

Table 6 shows the state combinations and main plant subsystem conditions of mode B. Figure 4 presents the energy flows in the hybrid solar plant layout in mode C.
  • The PV field is available but not operating. This is an unlikely situation caused by rare events such as grid connection issues or economic interests.
  • The CSP field is operating, sending the generated thermal energy to the TES.
  • The power block is not working.

3.4. Mode D

Table 7 shows the state combinations and main plant subsystem conditions of mode D. Figure 5 presents energy flows in the hybrid solar plant layout in mode D.
  • The PV field is non-available.
  • The CSP field is operating. The power block and the TES receive the thermal energy generated in the CSP field.
  • The power block is working and generating electricity.

3.5. Mode E

Table 8 shows the state combinations and main plant subsystem conditions of mode E. Figure 6 presents the energy flows in the hybrid solar plant layout in mode E.
  • The PV field is non-available.
  • The CSP field is operating. The thermal energy sent to the power block comes together from the CSP field and the TES.
  • The power block is working and generating electricity.

3.6. Mode F

Table 9 shows the state combinations and main plant subsystem conditions of mode F. Figure 7 presents the energy flows in the hybrid solar plant layout in mode F.
  • The PV field is non-available.
  • The CSP field is operating. The thermal energy generated in the CSP field is sent to the power block.
  • The TES is either unavailable or saturated. This mode may lead to partial defocusing of the CSP solar field.
  • The power block is working and generating electricity.

3.7. Mode G

Table 10 shows the state combinations and main plant subsystem conditions of mode G. Figure 8 presents the energy flows in the hybrid solar plant layout in mode G.
  • The PV field is operating. The electrical energy generated in the PV field is enough to inject it into the grid and to generate surpluses sent to the TES. If the power injected into the grid is null, the TES stores all the energy produced in the field.
  • The CSP field is not operating or non-available.
  • The power block is not working.

3.8. Mode H

Table 11 shows the state combinations and main plant subsystem conditions of mode H. Figure 9 presents the energy flows in the hybrid solar plant layout in mode H.
  • The PV field is operating. The electrical energy generated in the PV field is injected into the grid.
  • The CSP field is not operating or non-available.
  • The TES is saturated or non-available. This mode may lead to partial disconnections of the PV solar field.
  • The power block is not working.

3.9. Mode I

Table 12 shows the state combinations and main plant subsystem conditions of mode I. Figure 10 presents the energy flows in the hybrid solar plant layout in mode I.
  • The PV field is operating. We inject the energy produced in the PV field into the grid.
  • The CSP field is not available.
  • The TES is discharging thermal energy to the power block.
  • The power block is working and generating electricity.

3.10. Mode J

Table 13 shows the state combinations and main plant subsystem conditions of mode J. Figure 11 presents the energy flows in the hybrid solar plant layout in mode J.
  • The PV field is operating. We inject the energy produced in the PV field into the grid.
  • The CSP field is operating. The power block and the TES receive the thermal energy generated in the CSP field.
  • The power block is working and generating electricity.

3.11. Mode K

Table 14 shows the state combinations and main plant subsystem conditions of mode K. Figure 12 presents the energy flows in the hybrid solar plant layout in mode K.
  • The PV field is operating. We inject the energy produced in the PV field into the grid. Even though it is inadvisable due to the low efficiency levels, if there are surpluses, the TES receives this.
  • The CSP field is operating, sending the generated thermal energy to the TES.
  • The power block is not working.

3.12. Mode L

Table 15 shows the state combinations and main plant subsystem conditions of mode L. Figure 13 presents the energy flows in the hybrid solar plant layout in mode L.
  • The PV field is operating. We inject the energy produced in the PV field into the grid. Even though it is inadvisable due to the low efficiency levels, if there are surpluses, the TES receives this.
  • The CSP field is operating. The power block receives the thermal energy generated in the CSP field.
  • The TES is either unavailable or saturated. This mode may lead to partial defocusing of the CSP solar field.
  • The power block is working and generating electricity.

3.13. Mode M

Table 16 shows the state combinations and main plant subsystem conditions of mode M. Figure 14 presents the energy flows in the hybrid solar plant layout in mode M.
  • The PV field is operating. We inject the energy produced in the PV field into the grid.
  • The CSP field is operating. The power block receives the thermal energy generated in the CSP field.
  • The TES is discharging thermal energy to the power block.
  • The power block is working and generating electricity.
The total efficiency of the hybrid solar plant will be influenced by the efficiency of the components that interfere in each operation mode. We propose ten components with their corresponding efficiency:
  • ηPV is the PV field efficiency
  • ηDC-AC is the inverter efficiency
  • ηTPV is the PV transformer efficiency
  • ηRPV is the electrical heater efficiency
  • ηCSP is the CSP field efficiency
  • ηHX1 is the TES heat exchanger efficiency
  • ηTES is the TES efficiency
  • ηHX2 is the power block heat exchanger efficiency
  • ηPB is the power block efficiency
  • ηTCSP is the power block transformer efficiency
In Table 17, we summarize the efficiencies that influence the total efficiency calculation for each operation mode.

4. Hybrid Solar Plant Strategies

We can find two different categories within renewable power generators: dispatchable and variable [35].
Dispatchable power generator works like the traditional baseload power plants (such as coal or nuclear), and they can provide baseload power if needed, while variable power generators are not controllable due their high dependency on the resource. CSP with TES is a dispatchable power generator, and PV is a variable power generator [35,36].
Hybrid solar PV-CSP systems produce stable and distributable electricity from the solar resource, taking solar plants to the next level, matching with conventional fossil fuel-based power plants by combining the advantages of the two different technologies.
In this work, we present the operation modes that allow the carrying out of the transition between CSP and PV conventional plants towards hybrid solar plants able to procure a demand coverage or to work as a base load.
Following [37], we can differentiate between three categories of operation strategies:
  • Level 1 comprises commonly used, simple and easy operation strategies that can be defined by a small number of parameters with no dependences on the plant status.
  • Level 2 involves more complex decision-making logics that require a detailed knowledge of the plant status.
  • Level 3 includes complex strategies that require optimization processes within a simulation and most of the time include the dependency on weather and electricity price forecasts.
In this paper, we propose two Level 2 operation strategies. The status of the plant and external information such as time-dependent demand shall be required. The conditions for the transition between the operation modes would be pre-defined prior to simulations when implementing this operation strategy in a simulation tool.

4.1. Base Load Production

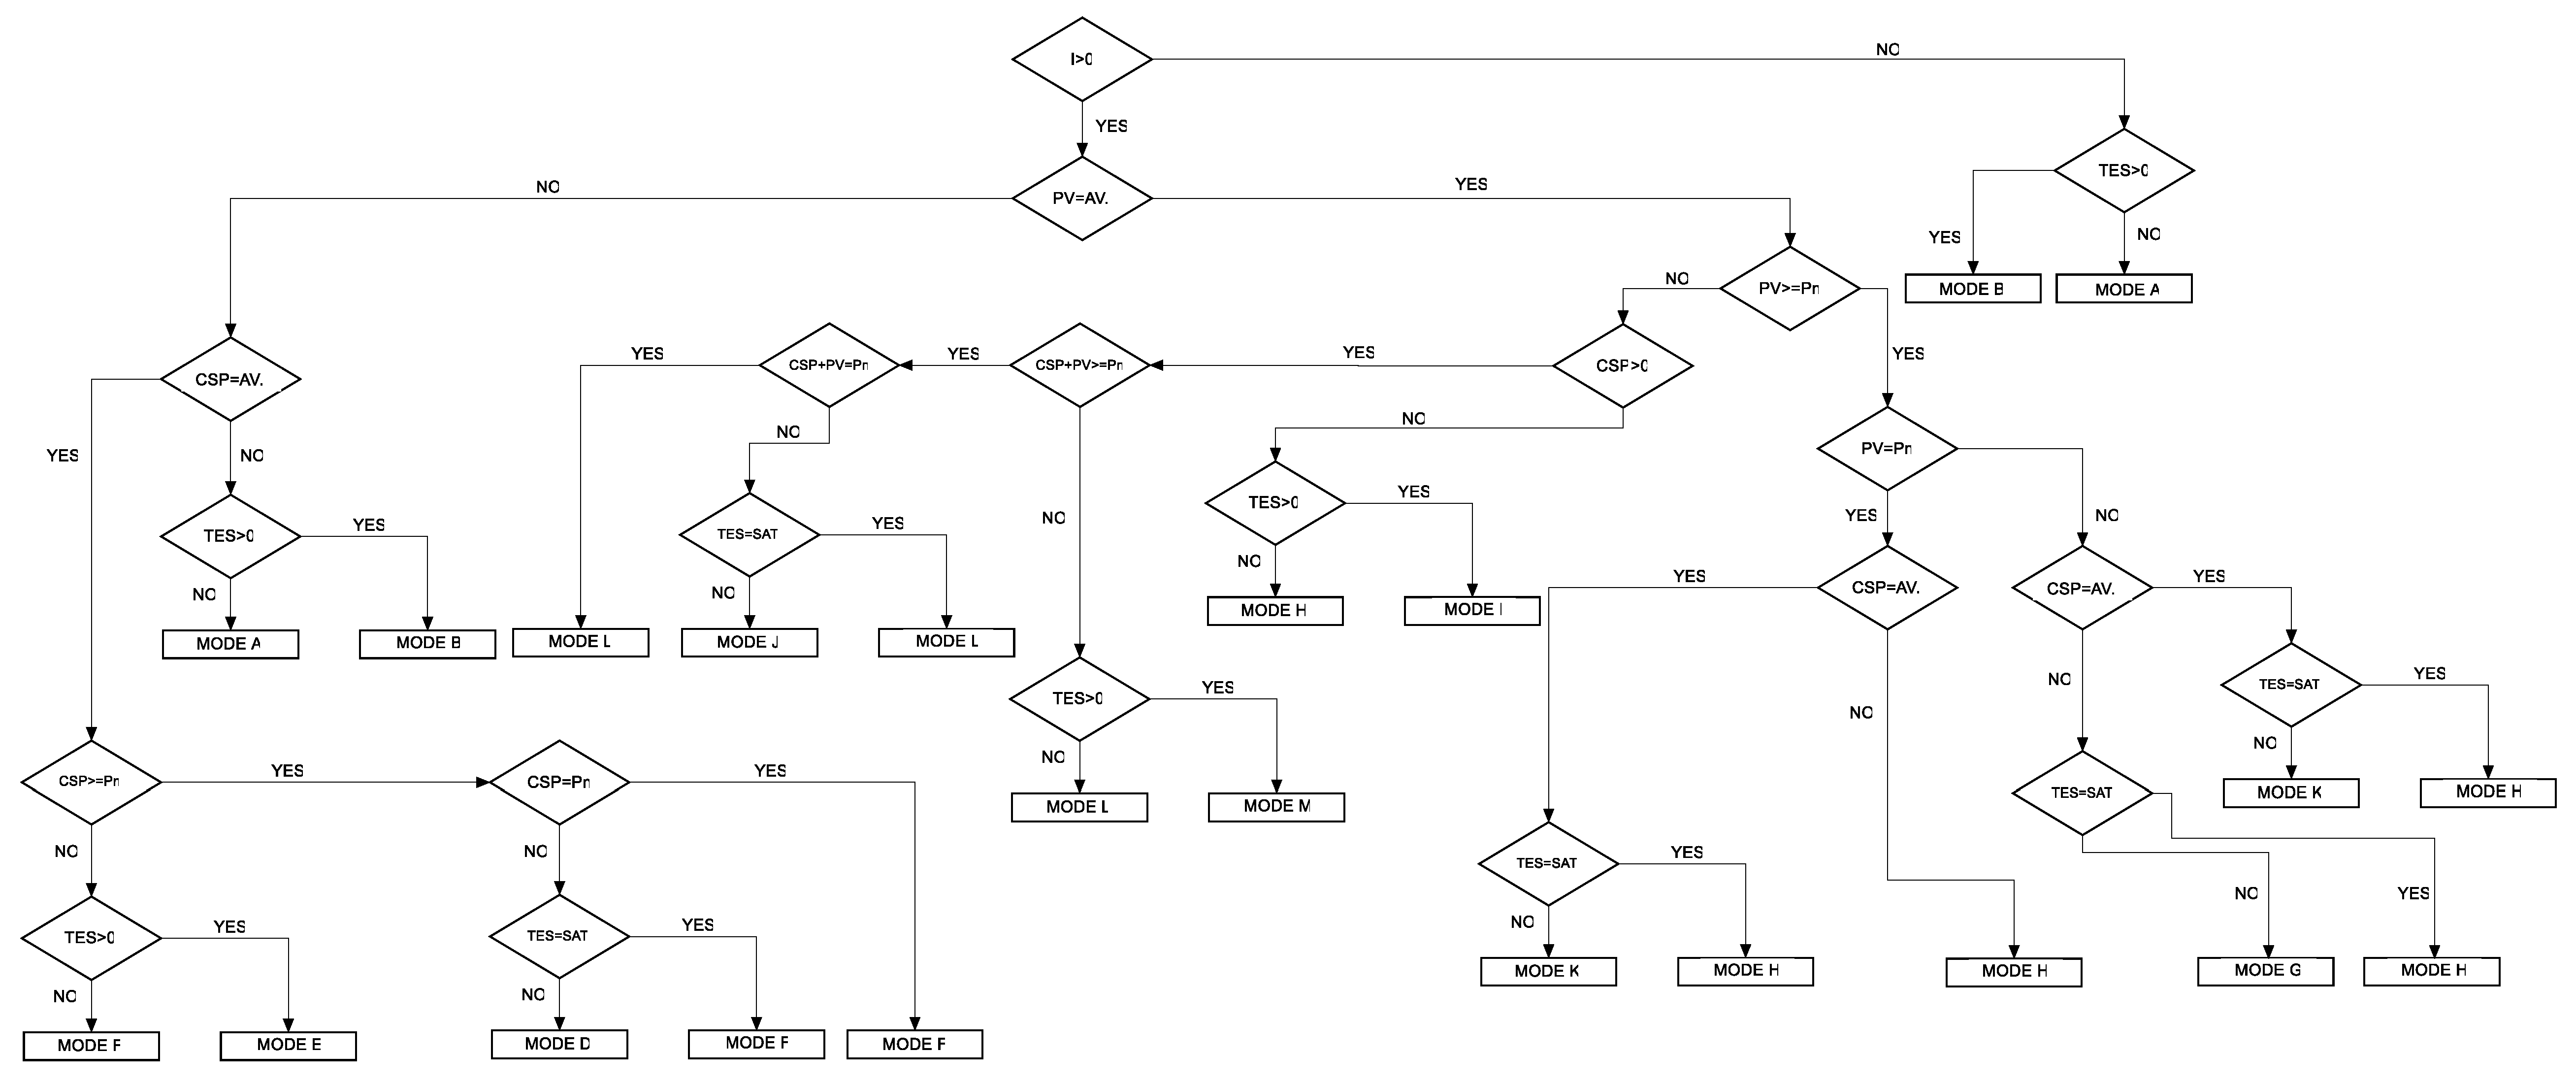
In this operation strategy, the hybrid plant operates trying to maintain a constant pre-defined nominal output power (base load). We prioritize the use of PV during the sun hours. Meanwhile the CSP supports the PV during the day and stores the surpluses into the TES to extend the production to night hours. The TES, which includes an electrical resistance, receives the energy surpluses of the PV.
In Figure 15 we can observe the flow diagram of the base load production operation strategy. The transitions between the operation modes (see Section 3) require the following variables related to the plant status:
  • Irradiance
  • PV availability and production
  • CSP availability and production
  • TES availability
To understand the flow diagram in Figure 15, we have 11 questions to decide the most suitable operation mode at any time:
  • Is solar irradiance (Global Horizontal Irradiance to PV and Direct Normal Irradiance to CSP) greater than zero? (I > 0)
  • Is the PV solar field available? (PV = AV)
  • Is the PV power produced greater than or equal to the nominal power? (PV ≥ Pn)
  • Is the PV power produced equal to the nominal power? (PV = Pn)
  • Is the CSP solar field available? (CSP = AV)
  • Is the CSP power produced greater than or equal to the nominal power? (CSP ≥ Pn)
  • Is the CSP power produced equal to the nominal power? (CSP = Pn)
  • Is the CSP and PV power produced greater than or equal to the nominal power? (CSP + PV ≥ Pn)
  • Is the PV and CSP power produced equal to the nominal power? (CSP + PV = Pn)
  • Is the energy stored in the TES greater than zero? (TES > 0)
  • Is the TES saturated? (TES = Sat)
PV and CSP solar field unavailability is caused by maintenance work, which is a periodic task in solar power plants. We use the following acronyms in Figure 15.
  • AV: Availability
  • Pn: Nominal power
  • Sat: Saturated
In the base load operation strategy, we do not ever arrive at mode C. We intend to satisfy a base load constantly achieving the maximum capacity factor. In mode C, the PV field is unavailable and TES receives the thermal energy from the CSP field. In the search for the maximum capacity factor, if the PV field is unavailable, the thermal energy from the CSP solar field will be sent to the power block in order to produce electrical energy.
The flow diagram starts by questioning the availability of the solar irradiance on the solar fields. If the answer is negative, we can only produce from the TES (mode B). If the TES has stored energy, we use it until the TES is empty. If the TES is empty and solar irradiance on the solar fields is not available, no electrical power can be produced (mode A). Once there is available solar irradiation over the solar fields, we check the availability of the PV field. If we find a negative response, we check on the CSP availability. If it is available, the plant operates as a conventional CSP plant (modes D, E and F). If both solar fields are unavailable, again, we can only produce electrical energy from the TES.
If the PV is available, we check the PV production and whether it can reach the nominal power. If true, we see if the CSP is available to store the thermal energy produced in the solar field into the TES. If not, the hybrid plant works as a conventional PV plant (mode H) and any PV energy surpluses are stored in the TES (mode G). If the CSP is available, it will store the thermal energy produced in the solar field into the TES (mode K) until it is saturated.
If the power produced in the PV field is lower than the nominal power, we check if the CSP solar field is available. If not, we produce from the PV solar field and the TES (mode I). In the case that the CSP solar field is available, we also have to ask if the combined power produced from both solar fields achieves the nominal power. In the case of a negative response, we use the available energy stored in the TES (mode M) if possible (L). If the combined power produced from both solar fields achieves the nominal power, we can send the power surpluses from the solar fields to the TES (mode L) if it is not saturated (mode J).

4.2. Demand Coverage

In this strategy, the hybrid plant operates trying to supply a known demand. The basics of the performance of the plant are similar to those in the other strategy. We prioritize the PV field production during the sun hours. CSP thermal energy produced will support the PV field production when required. The surpluses will be stored in the TES to be used as a third source of power if necessary. The PV field energy surpluses are stored in the TES in the integrated hybrid plant through an electrical resistance.
In Figure 16 we can observe the flow diagram of the demand coverage operation strategy. The transitions between the operation modes require the same variables for input as the base load production operation strategy related to the plant status.
  • Irradiance
  • PV availability and production
  • CSP availability and production
  • TES availability
The questions that come to light from Figure 16 are the following, when D represents the electrical demand:
  • Is solar irradiance (Global Horizontal Irradiance to PV and Direct Normal Irradiance to CSP) greater than zero? (I > 0)
  • Is demand greater than zero? (D > 0)
  • Is the PV power produced equal to the demand? (PV = D)
  • Is the CSP power produced equal to the demand? (CSP = D)
  • Is the PV power produced greater than the demand? (PV > D)
  • Is the CSP power produced greater than the demand? (CSP > D)
  • Is the PV power produced greater than or equal to the demand? (PV ≥ D)
  • Is the CSP power produced greater than or equal to the demand? (CSP ≥ D)
  • Is the PV solar field available? (PV = AV)
  • Is the CSP solar field available? (CSP = AV)
  • Is the CSP and PV power produced greater than or equal to the demand? (CSP + PV ≥ D)
  • Are the PV and CSP available? (CSP + PV = AV)
  • Is the energy stored in the TES greater than zero? (TES > 0)
  • Is the TES saturated? (TES = Sat)
In the demand coverage operation strategy, we intend to supply a known electrical energy demand. The capability of the plant to fulfil the demand will strongly depend on the solar fields’ sizes and the demand profile.
The first question is the availability of the solar irradiation over the fields. When there is no irradiance but an energy demand, we use the energy stored in the TES if available (mode B). If the TES is empty and solar irradiance on the solar fields is not available, the demand cannot be met through PV and CSP solar power plants (mode A).
When there is irradiance available, we check the demand. If there is no demand, we check the availability of the PV and CSP solar fields, and the energy produced in any of both solar fields is sent to the TES (modes K, G and C).
In the case that there is irradiance over the solar fields and an energy demand, we check, firstly, the availability of the PV field. If the PV field is available, we then check the CSP field status. If the CSP field is not available, the hybrid plant operates as a PV plant with a TES system. The PV energy produced is exclusively used to fulfil the demand when the demand is equal to the production (mode H). The TES is used to support the production when available (mode I) or to absorb the surpluses of the PV solar field if the demand is lower than the PV production (mode G).
In the case that the PV field is not available but there is solar irradiance over the fields, we check the CSP system availability. If there is a positive response, the hybrid plant operates as a CSP conventional plant with TES, producing directly from the solar field (mode F) and the TES (mode E) or sending the surpluses to the TES (mode D). In the case that the PV and CSP fields are unavailable, the operation modes are the same as if there was no irradiance (modes A and B).
When both systems are available, we prioritize the PV production if it is enough to cover the demand. In that case, the CSP thermal energy produced is sent to the TES together with the surpluses of the PV field if any (mode K), until the TES is saturated (mode H). When both solar fields are available but the PV production is not enough to cover the demand, we use PV, CSP and TES energy to fulfil the demand as far as possible (mode M). If there is no energy stored in the TES we produce only from the solar fields (mode L), and if there is enough energy produced to cover the demand from the solar fields with energy surpluses, we send those surpluses to the TES (mode J).

5. Summary and Conclusions

This study elaborates in detail the procedure for the development of an operation control algorithm for hybrid PT + PV integrated systems. We break down the procedure into a systematic method in which we first define the plant subsystems and their operational states. The combination of the viable states leads to the definition of the operation modes. We then propose the simplest questions to determine the transitions between the operation modes for two operation strategies, base load production and demand coverage. Hybrid solar plants with different configurations can use this systematic procedure for the definition of their strategy flow diagram.
The operation control algorithm based on the exposed strategy flow diagrams will be implemented in an open-source simulation tool for hybrid integrated solar plants. This will be used for the optimization of the relative sizes of the different subsystems that constitute the hybrid solar plants in order to explore the retrofitting possibilities for the CSP plants in operation. Results will be presented in future works.

Author Contributions

Conceptualization, M.L.; methodology, J.A.L.-Á. and E.P.-A.; supervision, M.A.S.-P. and I.L.-B. All authors have read and agreed to the published version of the manuscript.

Funding

This research was funded by Junta de Andalucía, grant number PY18-RE-0029.

Institutional Review Board Statement

Not applicable.

Informed Consent Statement

Not applicable.

Acknowledgments

This work has been carried out in the framework of the project “Exploitation of the synergies of thermosolar and photovoltaic technologies for the development of solar hybrid systems of electricity production (ASDELSOL)”, funded by the Junta de Andalucía (Spain) in the framework of the Andalusian investigation development and innovation plan (PAIDI 2020).

Conflicts of Interest

The authors declare no conflict of interest.

References

  1. IEA. World Energy Outlook 2020; International Energy Agency: Paris, France, 2020; pp. 1–461. [Google Scholar]
  2. IRENA. Renewable Capacity Statistics 2020; IRENA: Abu Dhabi, United Arab Emirates, 2020. [Google Scholar]
  3. Rashid, K. Design, Economics, and Real-Time Optimization of a Solar/Natural Gas Hybrid Power Plant. Ph.D. Thesis, The University of Utah, Salt Lake City, UT, USA, 2019. [Google Scholar]
  4. IRENA. Renewable Power Generation Costs in 2019; IRENA: Abu Dhabi, United Arab Emirates, 2019. [Google Scholar]
  5. BloombergNEF (BNEF). Available online: https://about.bnef.com/blog/scale-up-of-solar-and-wind-puts-existing-coal-gas-at-risk/#_ftnref2 (accessed on 27 November 2020).
  6. Larrañeta, M.; Moreno-Tejera, S.; Silva-Pérez, M.A.; Lillo-Bravo, I. An improved model for the synthetic generation of high temporal resolution direct normal irradiation time series. Sol. Energy 2015, 122, 517–528. [Google Scholar] [CrossRef]
  7. Pfleger, N.; Bauer, T.; Martin, C.; Eck, M.; Wörner, A. Thermal energy storage—Overview and specific insight into nitrate salts for sensible and latent heat storage. Beilstein J. Nanotechnol. 2015, 6, 1487–1497. [Google Scholar] [CrossRef] [PubMed] [Green Version]
  8. Tian, Y.; Zhao, C.Y. A review of solar collectors and thermal energy storage in solar thermal applications. Appl. Energy 2013, 104, 538–553. [Google Scholar] [CrossRef] [Green Version]
  9. Rashid, K.; Mohammadi, K.; Powell, K. Dynamic simulation and techno-economic analysis of a concentrated solar power (CSP) plant hybridized with both thermal energy storage and natural gas. J. Clean. Prod. 2020, 248, 119193. [Google Scholar] [CrossRef]
  10. Ju, X.; Xu, C.; Hu, Y.; Han, X.; Wei, G.; Du, X. A review on the development of photovoltaic/concentrated solar power (PV-CSP) hybrid systems. Sol. Energy Mater. Sol. Cells 2017, 161, 305–327. [Google Scholar] [CrossRef]
  11. Green, A.; Diep, C.; Dunn, R.; Dent, J. High capacity factor CSP-PV hybrid systems. Energy Procedia 2015, 69, 2049–2059. [Google Scholar] [CrossRef] [Green Version]
  12. Parrado, C.; Girard, A.; Simon, F.; Fuentealba, E. 2050 LCOE (Levelized Cost of Energy) projection for a hybrid PV (photovoltaic)-CSP (concentrated solar power) plant in the Atacama Desert, Chile. Energy 2016, 94, 422–430. [Google Scholar] [CrossRef]
  13. Starke, A.R.; Cardemil, J.M.; Escobar, R.A.; Colle, S. Assessing the performance of hybrid CSP + PV plants in northern Chile. Sol. Energy 2016, 138, 88–97. [Google Scholar] [CrossRef]
  14. Cerro Dominador. Available online: https://cerrodominador.com/ (accessed on 17 November 2020).
  15. Ashalin. Available online: http://www.brightsourceenergy.com/ashalim-solar-project#.X7JR1WhKjIU (accessed on 17 November 2020).
  16. Ashalin. Available online: http://www.brightsourceenergy.com/brightsource-and-alstom-win-tender-for-121-megawatt-solar-thermal-power-plant-in-israel#.X7JQzmhKjIU (accessed on 17 November 2020).
  17. “Redstone.” Solarreserve. Available online: https://en.wikipedia.org/wiki/Redstone_Solar_Thermal_Power (accessed on 17 November 2020).
  18. Noor Midelt. Available online: https://www.nsenergybusiness.com/projects/noor-midelt-solar-power-project-morocco/ (accessed on 17 November 2020).
  19. Noor Energy I. Available online: https://www.acwapower.com/en/projects/noor-energy-1/ (accessed on 17 November 2020).
  20. Menzies, B.; Hardiman, L. Lessons learned designing a 50 MW baseload CSP, PV, BESS, and Gas Hybrid. In Proceedings of the 26th SolarPACES Conference 2020, Albuquerque, NM, USA, 28 September–2 October 2020. [Google Scholar]
  21. Blair, N.; Dobos, A.P.; Freeman, J.; Neises, T.; Wagner, M. System Advisor Model, sam 2014.1. 14: General Description; NREL Rep. No. TP-6A20-61019; National Renewable Energy Laboratory: Golden, CO, USA, 2014; p. 13. [CrossRef] [Green Version]
  22. PVSyst. Available online: https://www.pvsyst.com/ (accessed on 25 November 2020).
  23. Dieckmann, S.; Dersch, J. Simulation of hybrid solar power plants. AIP Conf. Proc. 2017, 1850. [Google Scholar] [CrossRef] [Green Version]
  24. Platzer, W. PV-Enhanced solar thermal power. Energy Procedia 2014, 57, 477–486. [Google Scholar] [CrossRef]
  25. Cocco, D.; Migliari, L.; Petrollese, M. A hybrid CSP-CPV system for improving the dispatchability of solar power plants. Energy Convers. Manag. 2016, 114, 312–323. [Google Scholar] [CrossRef]
  26. Zurita, A.; Mata-Torres, C.; Valenzuela, C.; Cardemil, J.M.; Escobar, R.A. Techno-Economic analysis of a hybrid CSP + PV plant integrated with TES and BESS in Northern Chile. AIP Conf. Proc. 2018, 2033. [Google Scholar] [CrossRef]
  27. Zurita, A.; Mata-Torres, C.; Valenzuela, C.; Felbol, C.; Cardemil, J.M.; Guzmán, A.M.; Escobard, R.A. Techno-Economic evaluation of a hybrid CSP + PV plant integrated with thermal energy storage and a large-scale battery energy storage system for base generation. Sol. Energy 2018, 173, 1262–1277. [Google Scholar] [CrossRef]
  28. Zurita, A.; Mata-Torres, C.; Cardemil, J.M.; Escobar, R.A. Evaluating different operation modes of a hybrid CSP + PV + TES + BESS plant varying the dispatch priority. AIP Conf. Proc. 2019, 2126. [Google Scholar] [CrossRef]
  29. Naveenkumar, R.; Ravichandran, M.; Stalin, B.; Ghosh, A.; Karthick, A.; Aswin, L.S.R.L.; Priyanka, S.S.H.; Kumar, S.P.; Kumar, S.K. Comprehensive review on various parameters that influence the performance of parabolic trough collector. Environ. Sci. Pollut. Res. 2021. [Google Scholar] [CrossRef] [PubMed]
  30. Mahdi, Z.; Merige, P.S.; Chico, C.; Ricardo, A.; Schmitz, P.; Herrmann, U.; Boura, C.; Schmitz, M.; Gielen, H.; Gedle, Y.; et al. Modeling the thermal behavior of solar salt in electrical resistance heaters for the application in PV-CSP hybrid power plants. In Proceedings of the 26th SolarPACES Conference 2020, Albuquerque, NM, USA, 28 September–2 October 2020. [Google Scholar]
  31. Gedle, Y.; Schmitz, M.; Schmitz, P.; Herrmann, U.; Boura, C.; Mahdi, Z.; Chico, C.; Ricardo, A.; Merige, P.; Dersch, J. Analysis of an Integrated CSP-PV hybrid power plant. In Proceedings of the 26th SolarPACES Conference 2020, Albuquerque, NM, USA, 28 September–2 October 2020. [Google Scholar]
  32. Prieto, C. Retrofitting CSP Projects to Store and Integrate Variable Renewable Energy (VRE) in the Grid. Webinar, Online. 5 November 2020. Available online: https://atainsights.com/es/recording-and-presentations-retrofitting-csp-projects-to-store-and-integrate-variable-renewable-energy-vre-in-the-grid/ (accessed on 5 November 2020).
  33. Protermosolar. Available online: https://www.protermosolar.com/proyectos-termosolares/proyectos-en-el-exterior/ (accessed on 17 November 2020).
  34. Barragan, J.; Barea, J.; Lopez, J. The largest CSP project in the world: Technology, modelling and optimization. In Proceedings of the SOLARPACES 2019 International Conference on Concentrating Solar Power and Chemical Energy Systems, Daegu, Korea, 1–4 October 2019; pp. 2–3. [Google Scholar]
  35. IRENA. From Baseload to Peak: Renewables Provide a Reliable Solution; IRENA: Abu Dhabi, United Arab Emirates, 2015; p. 16. Available online: http://www.irena.org/DocumentDownloads/Publications/IRENA_Baseload_to_Peak_2015.pdf (accessed on 17 November 2020).
  36. Pfenninger, S.; Keirstead, J. Comparing concentrating solar and nuclear power as baseload providers using the example of South Africa. Energy 2015, 87, 303–314. [Google Scholar] [CrossRef]
  37. SolarPACES Guideline for Bankable STE Yield Assessment. In Proceedings of the 22nd SolarPACES Conference, Abu Dhabi, United Arab Emirates, 11–14 October 2016.
Figure 1. Overview of the hybrid solar plant configuration.
Sustainability 13 04402 g001
Figure 2. Energy flows in mode A.
Sustainability 13 04402 g002
Figure 3. Energy flows in mode B.
Sustainability 13 04402 g003
Figure 4. Energy flows in mode C.
Sustainability 13 04402 g004
Figure 5. Energy flows in mode D.
Sustainability 13 04402 g005
Figure 6. Energy flows in mode E.
Sustainability 13 04402 g006
Figure 7. Energy flows in mode F.
Sustainability 13 04402 g007
Figure 8. Energy flows in mode G.
Sustainability 13 04402 g008
Figure 9. Energy flows in mode H.
Sustainability 13 04402 g009
Figure 10. Energy flows in mode I.
Sustainability 13 04402 g010
Figure 11. Energy flows in mode J.
Sustainability 13 04402 g011
Figure 12. Energy flows in mode K.
Sustainability 13 04402 g012
Figure 13. Energy flows in mode L.
Sustainability 13 04402 g013
Figure 14. Energy flows in mode M.
Sustainability 13 04402 g014
Figure 15. Flow diagram of the base load production operation strategy.
Sustainability 13 04402 g015
Figure 16. Flow diagram of the demand coverage operation strategy.
Sustainability 13 04402 g016
Table 1. Most relevant commercial hybrid PV-CSP ongoing projects.
Project NameCountryNominal Power (MW)CSP
Nominal Power (MW)
PV
Nominal Power (MW)
TES (h)Status
Cerro Dominador [14]Chile21011010017.5Operational
Ashalim [15,16]Israel272242304.5Operational
Redstone [17]South Africa27110017112Under construction
Noor Midelt [18]Morocco8003804205Under Development
Noor Energy I [19]Dubai95070025015Under Development
Table 2. Possible subsystem states.
PV FieldCSP FieldTES
Available non-operating(A-nO)Available non-operating(A-nO)Available charging(A-C)
Available operating(A-O)Available operating(A-O)Available discharging(A-D)
Non-available(nA)Non-available(nA)Saturated(S)
Non-available(nA)
Table 3. Possible subsystem state combinations.
Combination N°PV FieldCSP FieldTES Situation
1A-nOA-nOA-CUnreal
2A-nOA-nOA-DReal
3A-nOA-nOSReal
4A-nOA-nOnAReal
5A-nOA-OA-CReal
6A-nOA-OA-DUnreal
7A-nOA-OSUnreal
8A-nOA-OnAUnreal
9A-nOnAA-CUnreal
10A-nOnAA-DReal
11A-nOnASReal
12A-nOnAnAReal
13A-OA-nOA-CReal
14A-OA-nOA-DUnreal
15A-OA-nOSReal
16A-OA-nOnAReal
17A-OA-OA-CReal
18A-OA-OA-DReal
19A-OA-OSReal
20A-OA-OnAReal
21A-OnAA-CReal
22A-OnAA-DReal
23A-OnASReal
24A-OnAnAReal
25nAA-nOA-CUnreal
26nAA-nOA-DReal
27nAA-nOSReal
28nAA-nOnAReal
29nAA-OA-CReal
30nAA-OA-DReal
31nAA-OSReal
32nAA-OnAReal
33nAnAA-CUnreal
34nAnAA-DReal
35nAnASReal
36nAnAnAReal
Table 4. Summary of operation mode A main subsystem conditions.
Operation ModeState CombinationsPV FieldCSP FieldTESPower Block
A3-4-11-12-27-28-35-36OFFOFFOFFOFF
Table 5. Summary of operation mode B main subsystem conditions.
Operation ModeState CombinationsPV FieldCSP FieldTESPower Block
B2-10-26-34OFFOFFDischargingON
Table 6. Summary of operation mode C main subsystem conditions.
Operation ModeState CombinationPV FieldCSP FieldTESPower Block
C5OFFONChargingOFF
Table 7. Summary of operation mode D main subsystem conditions.
Operation ModeState CombinationPV FieldCSP FieldTESPower Block
D29OFFONChargingON
Table 8. Summary of operation mode E main subsystem conditions.
Operation ModeState CombinationPV FieldCSP FieldTESPower Block
E30OFFONDischargingON
Table 9. Summary of operation mode F main subsystem conditions.
Operation ModeState CombinationPV FieldCSP FieldTESPower Block
F31-32OFFONOFFON
Table 10. Summary of operation mode G main subsystem conditions.
Operation ModeState CombinationPV FieldCSP FieldTESPower Block
G13-21ONOFFChargingOFF
Table 11. Summary of operation mode H main subsystem conditions.
Operation ModeState CombinationPV FieldCSP FieldTESPower Block
H15-16-23-24ONOFFOFFOFF
Table 12. Summary of operation mode I main subsystem conditions.
Operation ModeState CombinationPV FieldCSP FieldTESPower Block
I22ONOFFDischargingON
Table 13. Summary of operation mode J main subsystem conditions.
Operation ModeState CombinationPV FieldCSP FieldTESPower Block
J17ONONChargingON
Table 14. Summary of operation mode K main subsystem conditions.
Operation ModeState CombinationPV FieldCSP FieldTESPower Block
K17ONONChargingOFF
Table 15. Summary of operation mode M main subsystem conditions.
Operation ModeState CombinationPV FieldCSP FieldTESPower Block
L19-20ONONOFFON
Table 16. Summary of operation mode M main subsystem conditions.
Operation ModeState CombinationPV FieldCSP FieldTESPower Block
M18ONONDischargingON
Table 17. Efficiencies that influence the total efficiency calculation for each operation mode.
Operation ModeηPVηDC-ACηTPVηRPVηCSPηHX1ηTESηHX2ηPBηTCSP
ANONONONONONONONONONO
BNONONONONO YES YES YES YES YES
CNONONONO YES YES YES NONONO
DNONONONO YES YES YES YES YES YES
ENONONONO YES YES YES YES YES YES
FNONONONO YES NONO YES YES YES
G YES YES YES YES NONONONONONO
H YES YES YES NONONONONONONO
I YES YES YES NONO YES YES YES YES YES
J YES YES YES YES YES YES YES YES YES YES
K YES YES YES YES YES YES YES NONONO
L YES YES YES NO YES NONO YES YES YES
M YES YES YES NO YES YES YES YES YES YES
Publisher’s Note: MDPI stays neutral with regard to jurisdictional claims in published maps and institutional affiliations.

