
The Dynamics of Public Perceptions and Climate Change in Swat Valley, Khyber Pakhtunkhwa, Pakistan


1
Department of Environmental Sciences, University of Peshawar, Peshawar 25000, Pakistan
2
Department of Urban and Regional Planning, University of Peshawar, Peshawar 25000, Pakistan
3
Urban Policy and Planning Unit, Planning and Development Department, Government of Khyber Pakhtunkhwa, Peshawar 25000, Pakistan
4
Department of Civil Engineering, Adiyaman University, Adiyaman 02040, Turkey
*
Author to whom correspondence should be addressed.
Sustainability 2021, 13(8), 4464; https://0-doi-org.brum.beds.ac.uk/10.3390/su13084464
Submission received: 8 January 2021
/
Revised: 23 March 2021
/
Accepted: 1 April 2021
/
Published: 16 April 2021
Abstract
:With rising temperatures, developing countries are exposed to the horrors of climate change more than ever. The poor infrastructure and low adaptation capabilities of these nations are the prime concern of current studies. Pakistan is vulnerable to climate-induced hazards including floods, droughts, water shortages, shifts in weather patterns, loss of biodiversity, melting of glaciers, and more in the coming years. For marginal societies dependent on natural resources, adaptation becomes a challenge and the utmost priority. Within the above context, this study was designed to fill the existing research gap concerning public knowledge of climate vulnerabilities and respective adaptation strategies in the northern Hindukush–Himalayan region of Pakistan. Using the stratified sampling technique, 25 union councils (wards) were selected from the nine tehsils (sub-districts) of the study area. Using the quantitative method approach, structured questionnaires were employed to collect data from 396 respondents. The study reveals varying public perceptions about different factors contributing to the causes and impacts of climate change and the sources of information in the three zones of the study area. The primary causes of climate change are deforestation, industrial waste, anthropogenic impurities, natural causes, and the burning of fossil fuels exacerbated by increased population. Changes in temperature, erratic rainfalls, floods, droughts, receding glaciers, and extreme weather events are some of the impacts observed over the past decades. While limiting the indiscriminate use of fossil fuels combined with government-assisted rehabilitation of forests can help combat climate change, the lack of proper education and economic, social, and governance barriers are hindering the local adaptation strategies. In addition, reduce environmental pollution (air, water, soil, etc.) and plantation polluted areas with suitable plants, are the two main actions in combating climate change. This study recommends policy interventions to enhance local adaptation efforts through building capacity, equipping local environmental institutions, discouraging deforestation, and ensuring sustainable use of natural resources.
1. Introduction
The Intergovernmental Panel on Climate Change (IPCC) reports warming in the globally averaged combined land and ocean surface temperature of 0.85 °C over the period 1880 to 2012 [1]. Although Pakistan has a very low profile in the share of greenhouse gas emissions [2,3], it is affected by changing climate due to the developing economies in neighboring countries [4,5,6]. The mean annual temperature of the country has increased by roughly 0.5 °C over the last five decades, while heat waves have increased fivefold over the last three decades [5,6]. Similarly, the sea level along the coast of Karachi has risen nearly 10 cm in the last century [5]. Alarmingly, future climate forecasts predict an annual temperature rise of 3 to 5 °C for the intermediate emission scenario and 4 to 6 °C for higher emissions [5,7]. Pakistan is vulnerable to a variety of climate-induced hazards, including floods, cyclones, droughts, and heat waves, among others [2,8]. The Global Vulnerability Index (GVI) puts Pakistan among the leading countries (top 10) vulnerable to the changing climate [9]. German Watch’s Long-Term Climate Risk Index (CRI) ranked Pakistan the seventh most climate-vulnerable country, with a death toll of 10,462 in the past 20-year period. The economic loss over the same period was USD 3.8 billion, which is equivalent to 0.605% of the gross domestic product (GDP) [10]. In 2010, a catastrophic flood killed approximately 1600 people, devastated 38,600 square kilometers of territory, and caused damage worth USD 10 billion [11,12,13].
“Climate change is no longer an unfamiliar term” [14]. Climate change is understood through personal knowledge, experience, benefits, and costs by most individuals [15]. Adaptation includes being aware of the causes and effects of climate change and its impact on behavioral habits and having the disposition to change behavioral patterns in response to greenhouse gas emissions [16]. Climate adaptation behaviors can be affected by an individual’s personal experience of climate change. Regardless of whether people support climate change policies or adjust their actions in response to local weather changes, their attitudes can be influenced by several factors other than local weather [17]. Despite being unaware of the scientific knowledge, the public acknowledges climate change and environmental policies [18]; therefore, gathering information on climate perceptions can be an important part of fostering further understanding [19].
Over the last couple of years, the research community and policymakers have been increasingly focused on public perceptions of climate change due to its importance in compelling social, economic, and political actions to address diverse climatic risks. Various approaches, including qualitative and quantitative instruments, are used to gather people’s opinions [15]. Some recent studies conducted in the US show that there is a limited understanding among the public about the issue, and the climate issue is considered less important than personal and social issues [15]. A study conducted by Leiserowitz (2005) showed that some Americans do not look at climate change as an imminent threat, while some believe that climate change impacts will have moderately severe and faraway impacts on communities and nature [19]. While some of the public can be considered as alarmists who believe that any more increase in human and anthropogenic activities will result in catastrophic changes, others hold the view that human activities do not have negative impacts on the climate system, or can even have a positive impact. Public perceptions and opinions about risk can influence policies including treaties, laws, duties, and subsidies related to climate change [20]. Demographic factors such as gender, age, religion, education, nationality, and occupation impact such climate perceptions among the public [14]. Research and scientific valuation of the public’s understanding of climate change is essential to achieve sustainable development goals and prioritize the human response to climate change [21].
Governments are often tasked with implementing adaptation measures following local conditions [14]. Numerous studies have been conducted to assess the negative impacts of climate change and relative adaptation measures at the global, national, and household level [22]. There is an increasing volume of literature pointing out how people in different communities around the world are coping with the adverse effects of climate change [16,19,21,22,23,24,25,26,27]. According to the IPCC, climate adaptation consists of “adjustments in ecological, social or economic systems in response to actual or expected climatic stimuli and their effects” [28]. It can range from specific actions to systemic changes, such as farmers switching from one variety of crop to another or diversifying rural livelihoods as a hedge against climate change variability and extremes. Moreover, it can take the form of institutional reforms, such as revising ownership and user rights for land and water to create incentives for better resource management. Adaptation involves learning about risks, developing an optimal environment for the process, evaluating the response options, organizing resources, and implementing the chosen options [29]. From the livelihood perspective, the adaptation requirements for poor households are much greater than those for well-off groups [24]. People’s capacity to handle climate hazards is affected by adaptation challenges, and they are thus unable to manage the risks in order to help them optimize their well-being [25]. Effective adaptation to climate change requires both individuals and international institutions to engage at the relevant scales [30].
In this study, we try to understand the local perceptions of climate change and adaptation options in Swat District, Pakistan. As a mountainous community and a part of the Hindukush–Himalayan region, the area is severely exposed to the negative effects of climate hazards. It is subject to influences from various kinds of disturbances, natural as well as anthropogenic, including soil erosion, landslides, earthquakes, overgrazing, deforestation, and forest fires, among others [31]. Several studies have shown that the region’s climate variability could get worse in the future [32,33,34]. The temperature of the district has risen by 0.028 °C per year, while precipitation has declined by −0.73 mm per year [34]. It is part of the northern region of the country that is fed by the monsoon rainfall system, where a significant decline in monsoon rainfall has also been noted [35]. The area was severely devastated in the anomalous flooding event of 2010 that brought destruction to the whole district, with loss of human lives, badly affecting agricultural lands, tourism spots, transportation, and public property. Since most of the population relies on agriculture-based livelihoods [36], understanding climate variability and corresponding coping strategies have become more important. Research suggests that public perceptions are a vital part of exploring the degree of public support for climate change mitigation and adaptation policies [37,38]. A real understanding of climate hazards is essential for informed decision-making, associated solutions, and policy matters. Hence, the local indigenous knowledge can be utilized in contemporary and future policy frameworks. Countries like Pakistan desperately require context-specific research on the public’s knowledge of climate change in order to make appropriate decisions on mitigation and adaptation strategies. This paper aims to fill this gap by focusing on the Swat area as a case study.
2. Material and Methods
2.1. Study Area
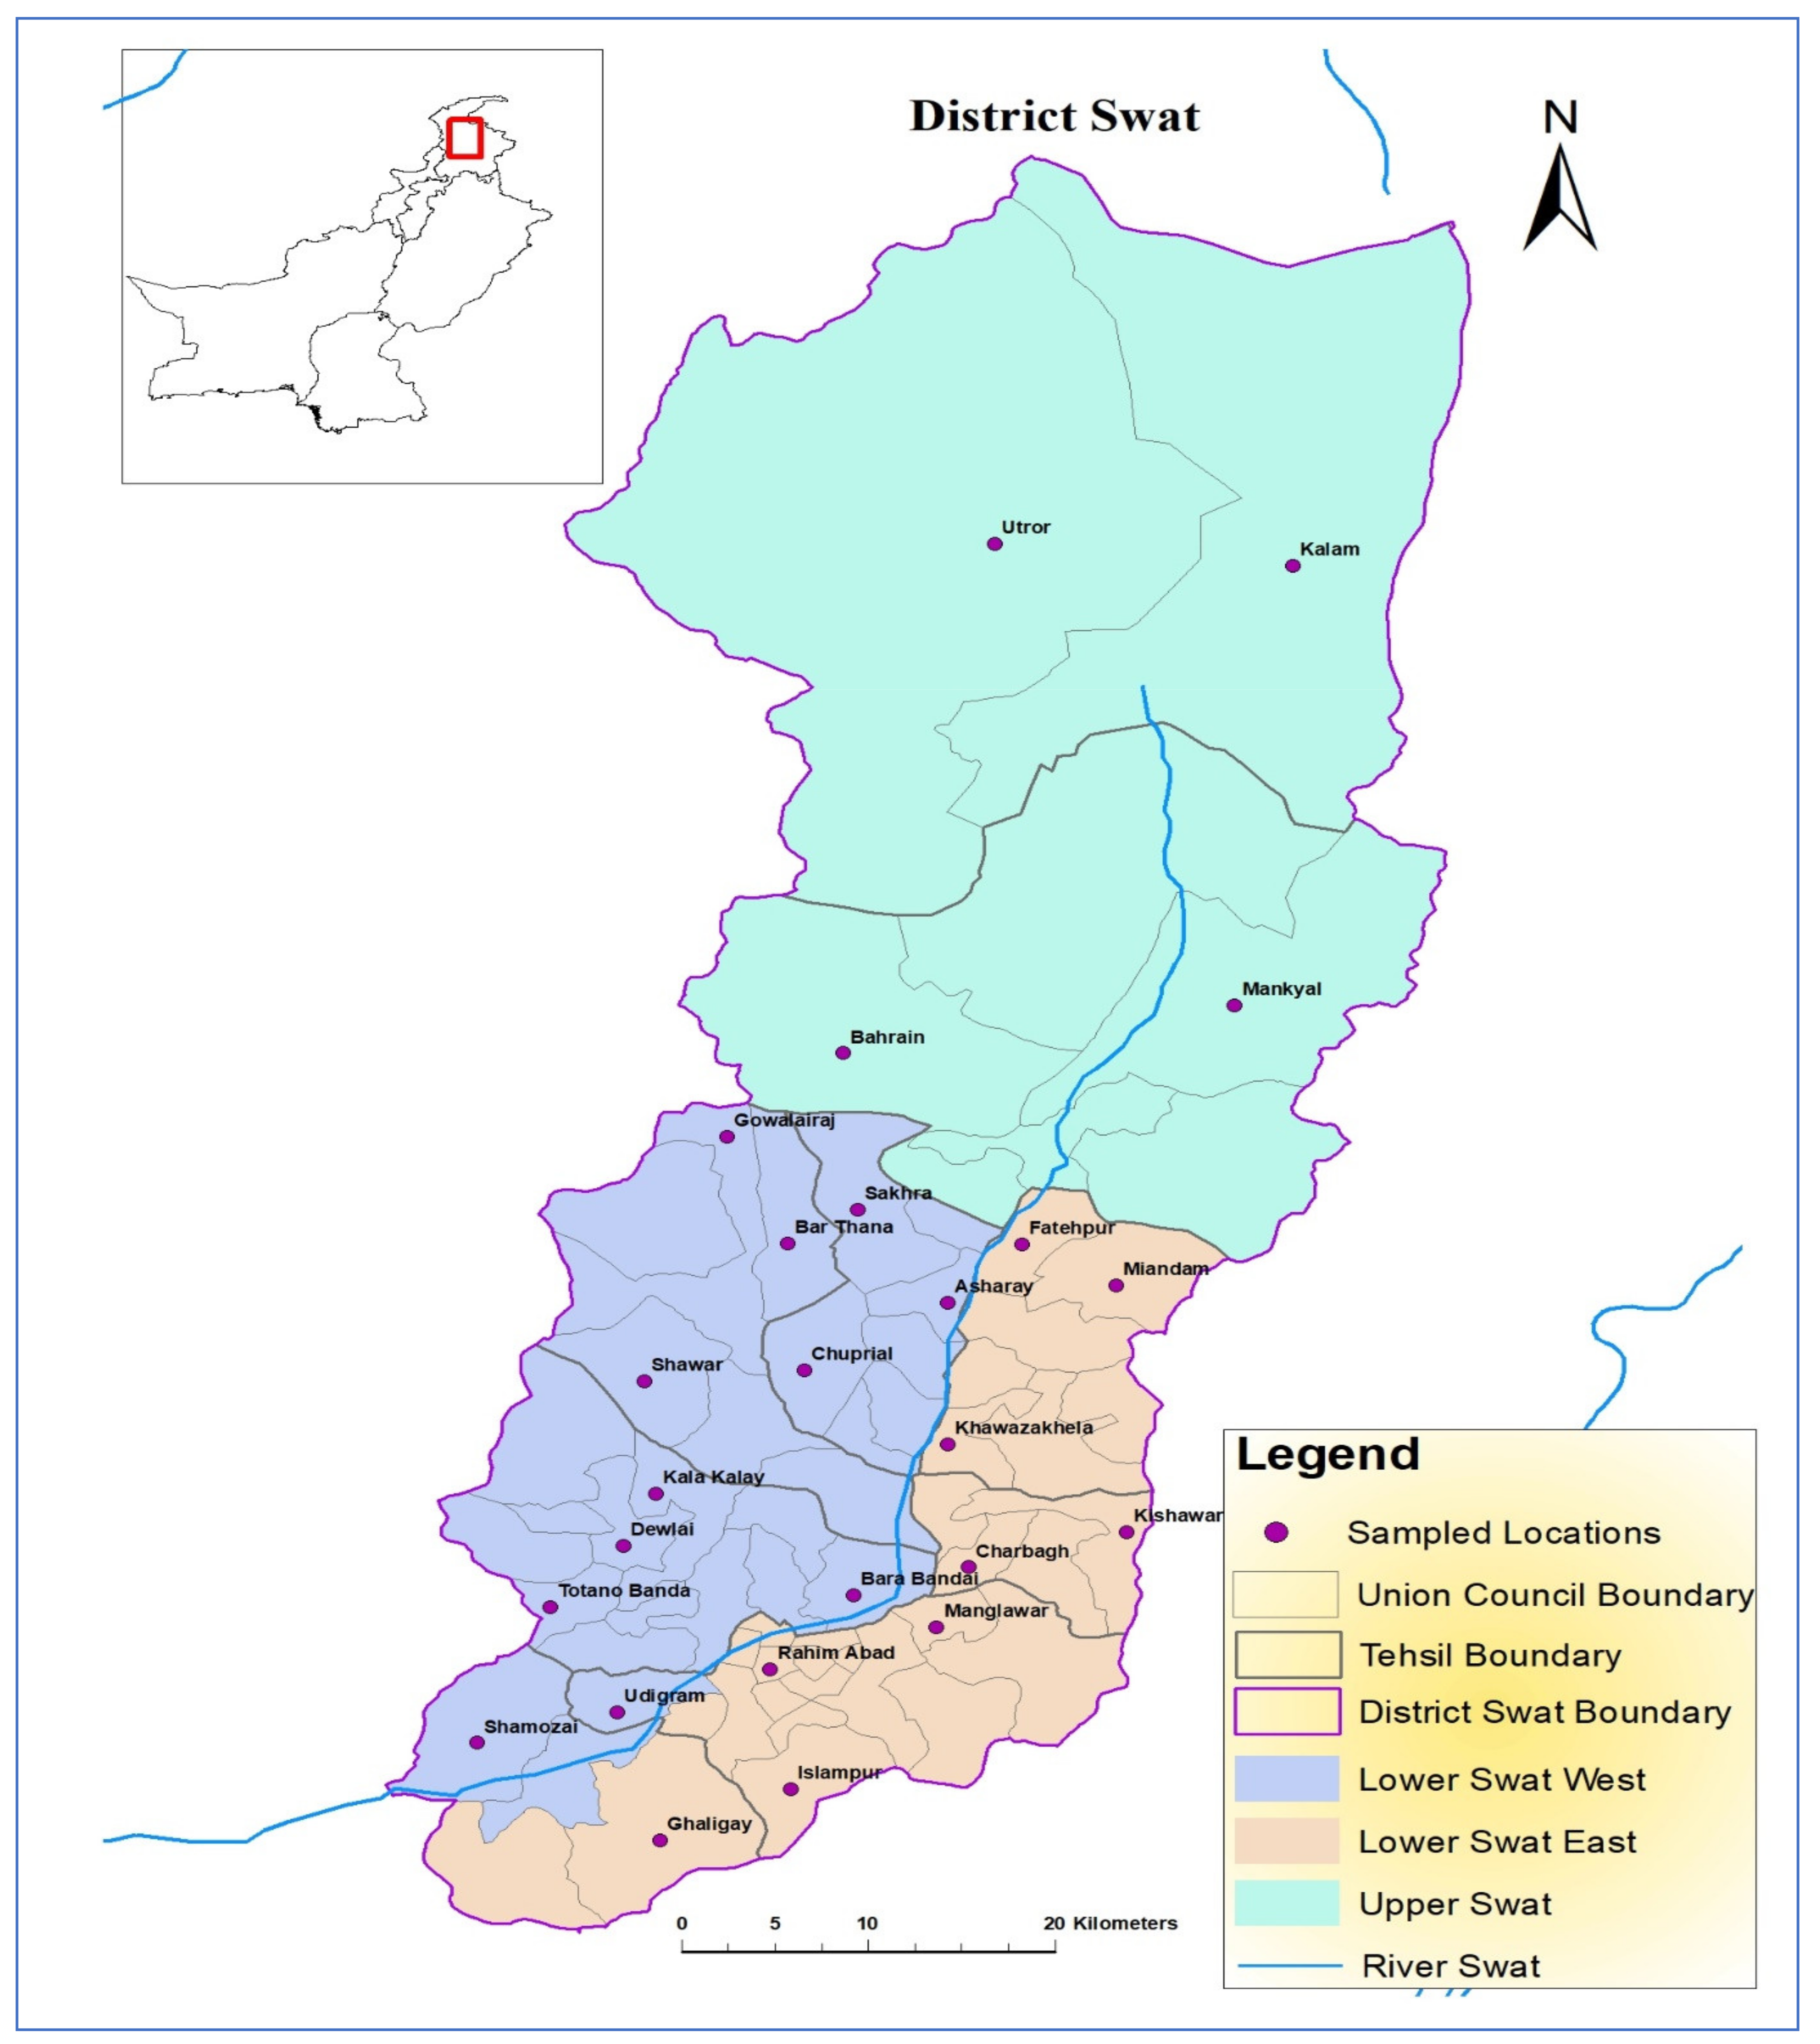
Swat District of Khyber Pakhtunkhwa province is located at 34°46′58″ N and 72°21′43″ E, bordering Chitral in the north, Dir in the west, and Gilgit-Baltistan in the northeast. It covers an area of 5337 km2 and has a population of 1.26 million [39,40]. The area lies in the temperate zone, where various factors including altitude, latitude, Indian Ocean monsoons, and western cyclonic currents control the climate. June is the hottest month and January is the coldest month in the area. The average rainfall in the study area ranges from 1000 to 1200 mm annually [41,42]. Most of the population is dependent on natural resources including agriculture, horticulture, livestock, fisheries, tourism, and forest resources [43,44]. The agriculture sector represents the major livelihood source, employing around 42% of the population in the area [36]. Wheat, maize, tomato, onion, persimmon, peach, and apricot are some of the important cash crops grown in Swat [44].
Swat is famous for its fertile soils and protected forests. The total area of the forest cover in Swat is 409,591 acres [42], representing about 20% of the district. Since the early times, Swat has been thickly forested, and it was known as the world’s top cedar forest [44]. The forest resources have a vital role in the rural livelihoods of Khyber Pakhtunkhwa province. Most of the population depends on these resources for timber, firewood, fodder, and other essentials [45].
2.2. Research Framework
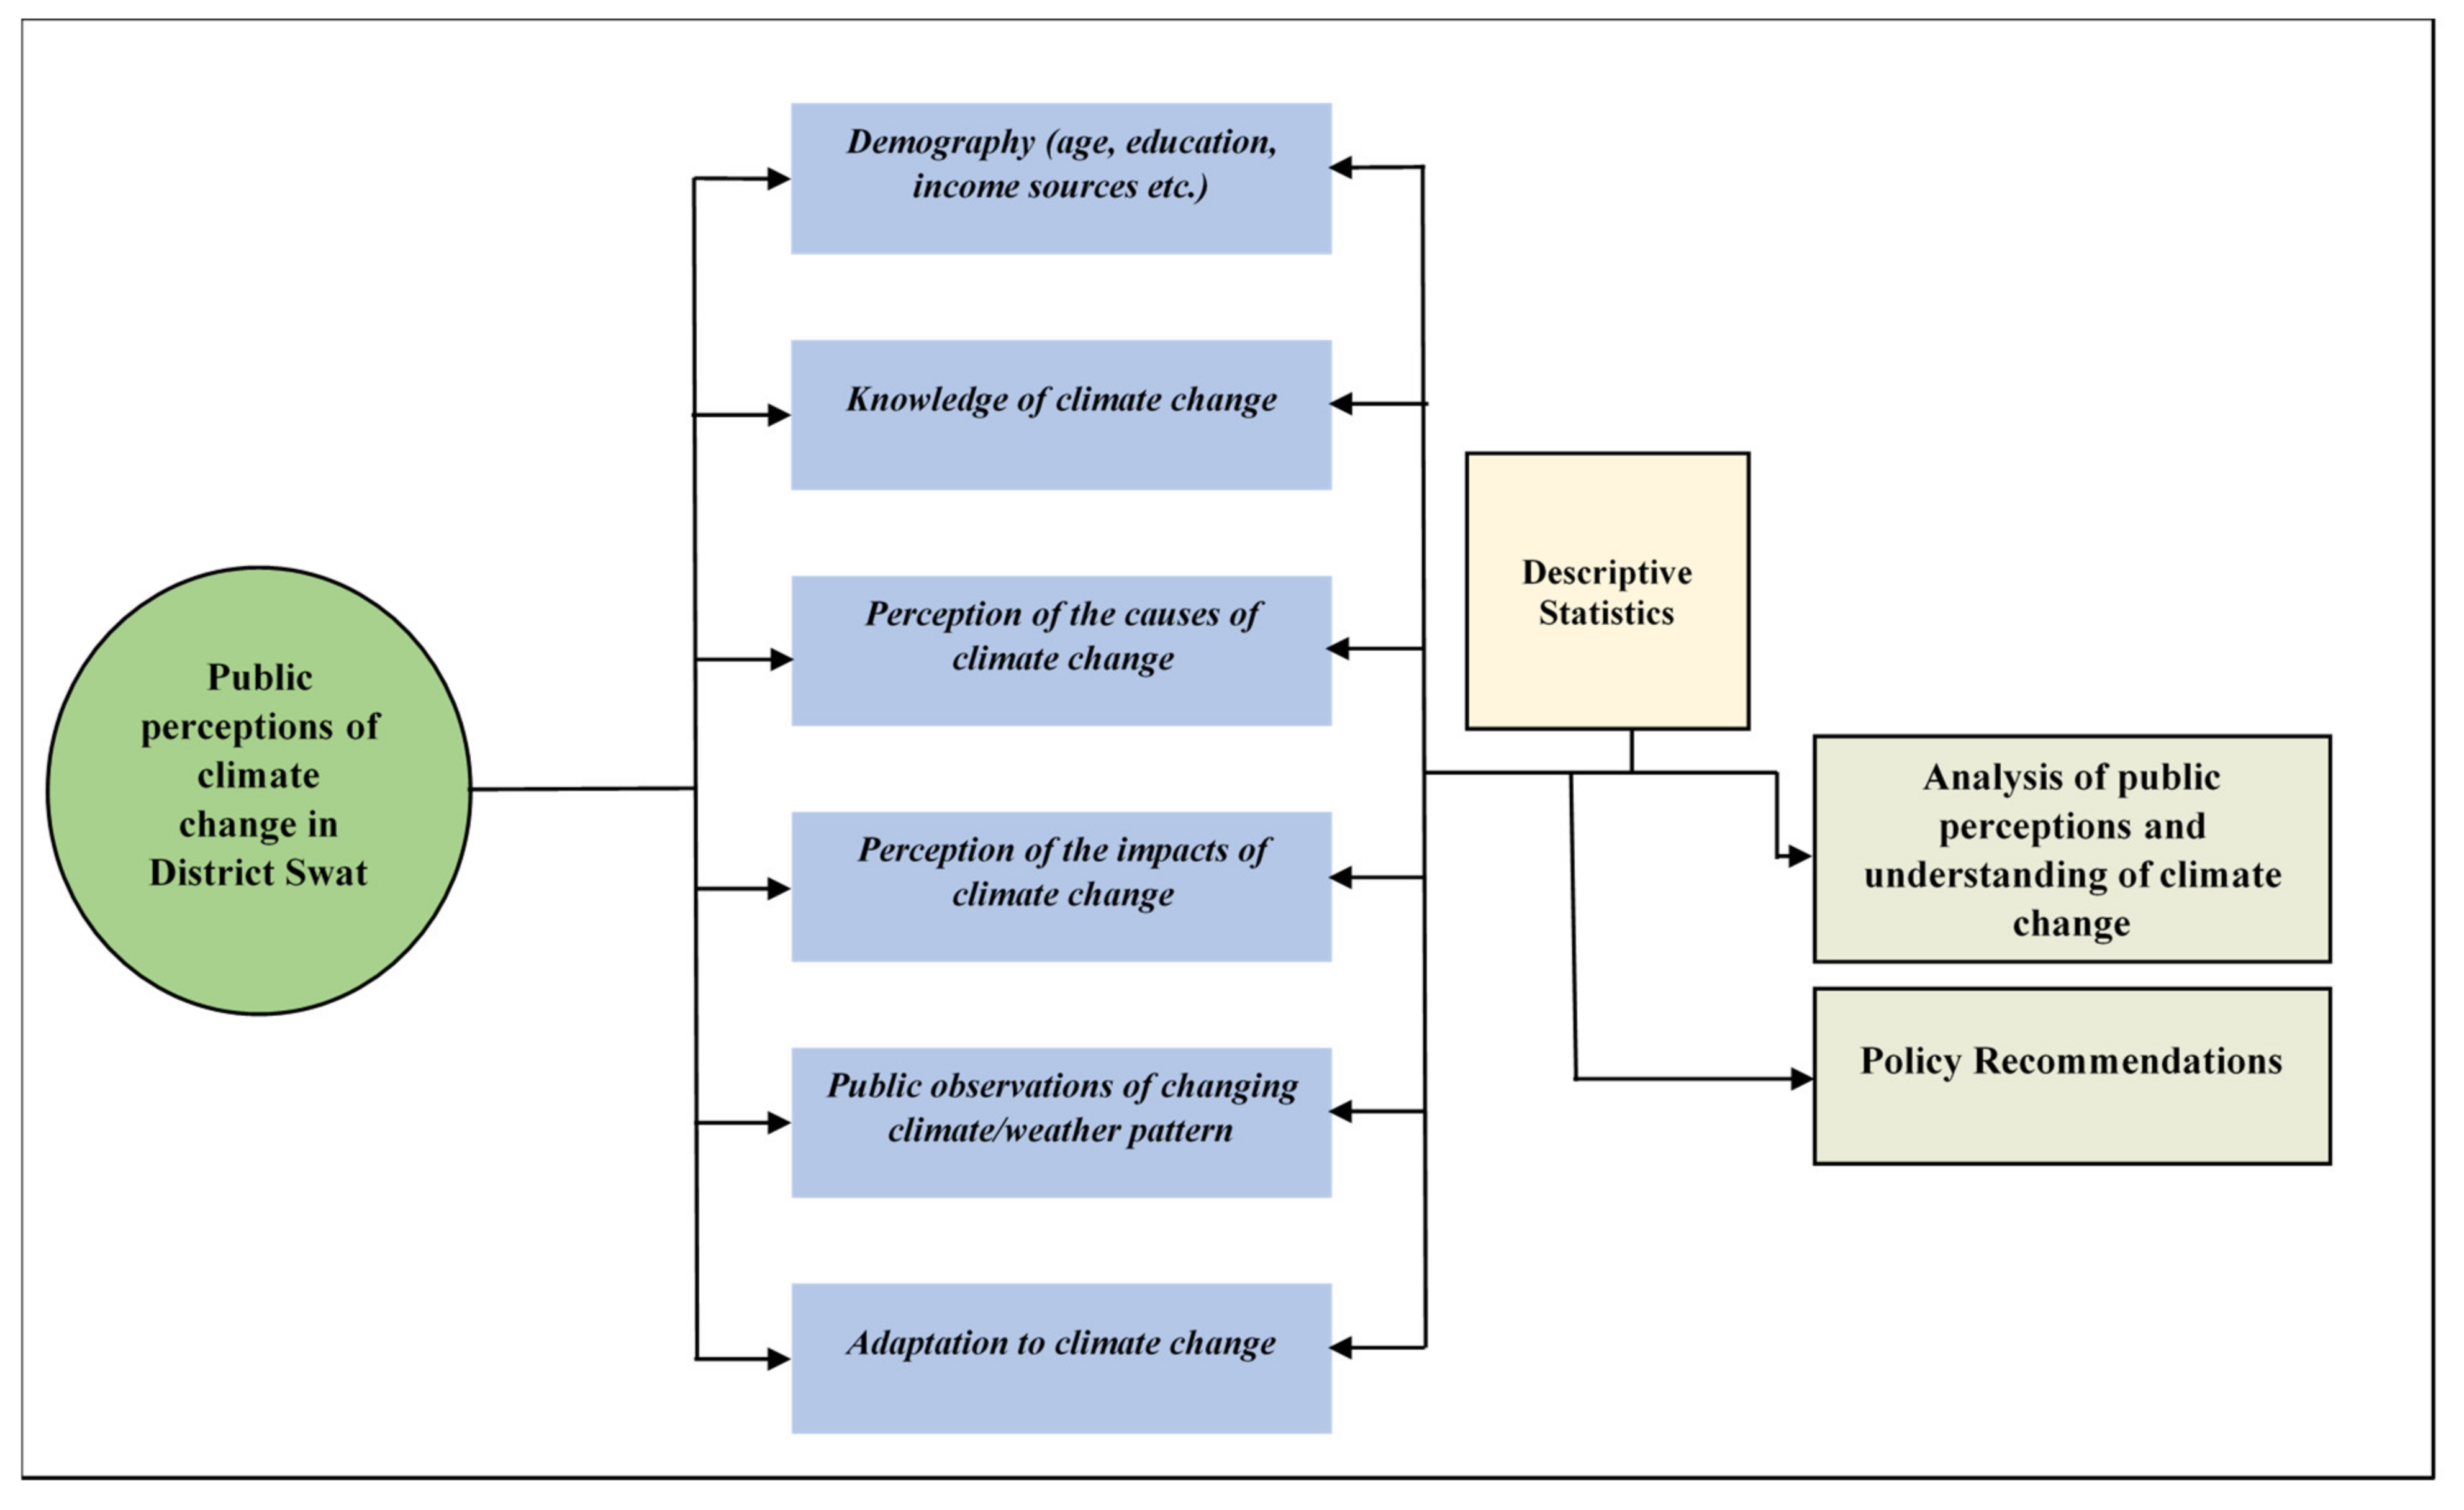
The overarching theoretical framework for this study is drawn from previous studies to explore the dynamics and understanding of public perceptions, social choice, regarding climate change in Swat [7,46,47,48]. Climate change has significant effects in terms of global, social, and states. States and people need to focus more on climate change and climate resilience so they can better adjust their demands for production, goods, and services. As economic, social, environmental, and governance concerns in the public sector increase in parallel with climate change, administrative roles and responsibilities change, and what needs to be done to adapt to changing realities must be done without delay. The aims need to be outlined in the sustainability plan to prepare local government to respond to future barriers and opportunities in an effective and coordinated manner [49]. The sustainability plan acts as a help to various city’s plans and ideally expands the triple bottom line framework into a Quadruple Bottom Line (QBL) structure. QBL serves as the overarching themes of this plan; social, economic, environmental, and governance [49]. The major determinants of climate change are demography, knowledge, perception about causes and impacts, observations, and adaptation to climate change, as given in Figure 1. The above determinants were then further divided into sub-sets of questions. Each question consisted of categorical variables with dichotomous responses (yes, no). This study hypothesizes that indigenous knowledge plays a vital role in coping with the adverse effects of climate change and formulation of adaptation policies. Indigenous knowledge holds a significant role in shaping individual beliefs linked to age, education, and socio-economic status. The collected information was analyzed through descriptive statistical tools such as the total number of responses, average values, percentages, etc. Based on survey findings, best policy recommendations are proposed to improve local adaptation efforts by enhancing environmental structures, capacity building, and sustainable use of natural resources.
2.3. Data Collection and Analysis
2.3.1. Questionnaire Survey
A questionnaire survey is a valuable tool for collecting data in communities facing climate change. Several other researchers [7,25,50] have employed questionnaires to collect meaningful data. The firsthand information collected from respondents holds great value in climate and environmental research [7]. We employed structured questionnaires to collect data from household members, farmers, the general public, and members of departments working in the study area. The questionnaire covered aspects of livelihood sources in the region, public perceptions about climate change, impacts of climate change on various sectors, and local adaptation strategies. Great care was taken in designing the questionnaire to include questions and terms that are easily understandable to respondents and can have a significant effect on the answers obtained. The original questionnaire was pre-tested on a small number of respondents in the study area, which resulted in some modifications. The questionnaire consists of both quantitative and qualitative questions. The open-ended questions can elicit detailed and personal opinions about climate change impacts and adaptation. Formal training was arranged for enumerators and respondents to familiarize them with the process and help them understand how to ask and answer the questions. Prior consent was obtained from each interviewee, achieving a 100% response rate.
2.3.2. Sample Size
The questionnaire survey was conducted in the project area using the multistage cluster sampling technique. To ensure the validity of the findings, a proper sample size was selected. Swat District consists of nice sub-districts (known as tehsils) and 65 clusters (union councils) based on population. Using random number generation, 25 clusters were selected for sampling. To get greater accuracy in our results, the sample size was selected using a 95% confidence level and 3% confidence interval. The total sample size against the total population was calculated as 396, which was then proportionally allocated to union councils (clusters) using proportional allocation sampling [51]. The sample size was calculated using the following formula:
3. Results and Discussion
3.1. Socioeconomic Characteristics
Table 2 shows the socioeconomic characteristics of the survey respondents. A total of 396 respondents were interviewed. All respondents were household heads. The average household size was reported as 11.3, with 12 as highest in LSE. Concerning age, most of the respondents in the three regions were 31 to 40 years old, with the highest percentages in US (44.7%), followed by LSE (34.1%) and LSW (33.3%). Concerning education, more than half of the respondents in all studied regions had no formal education. LSW had predominantly more illiterate respondents (58.3%) compared to the other regions. A comparatively larger fraction of participants in US had primary (31.8%) and secondary (14.4%) education, while those with intermediate or higher education were mostly in LSE (14.4%). According to the 1998 census report, the literacy rate (10 years and above) in the district is 28.75%, which corresponds with our results [39].
The socioeconomic status of the respondents showed a low profile in the area, with more than half (56%) of the respondents earning 20,000 Pakistani rupees (PKR) or less in monthly household income, on average, while only 7.86% of respondents had income exceeding PKR 40,000. Within individual regions, most of the respondents in US (75.8%) and LSE (51.5%) had low income, while in LSW more respondents (46.9%) were in the middle-income group.
3.2. Public Understanding of Climate Change
3.2.1. Recognition of Climate Change
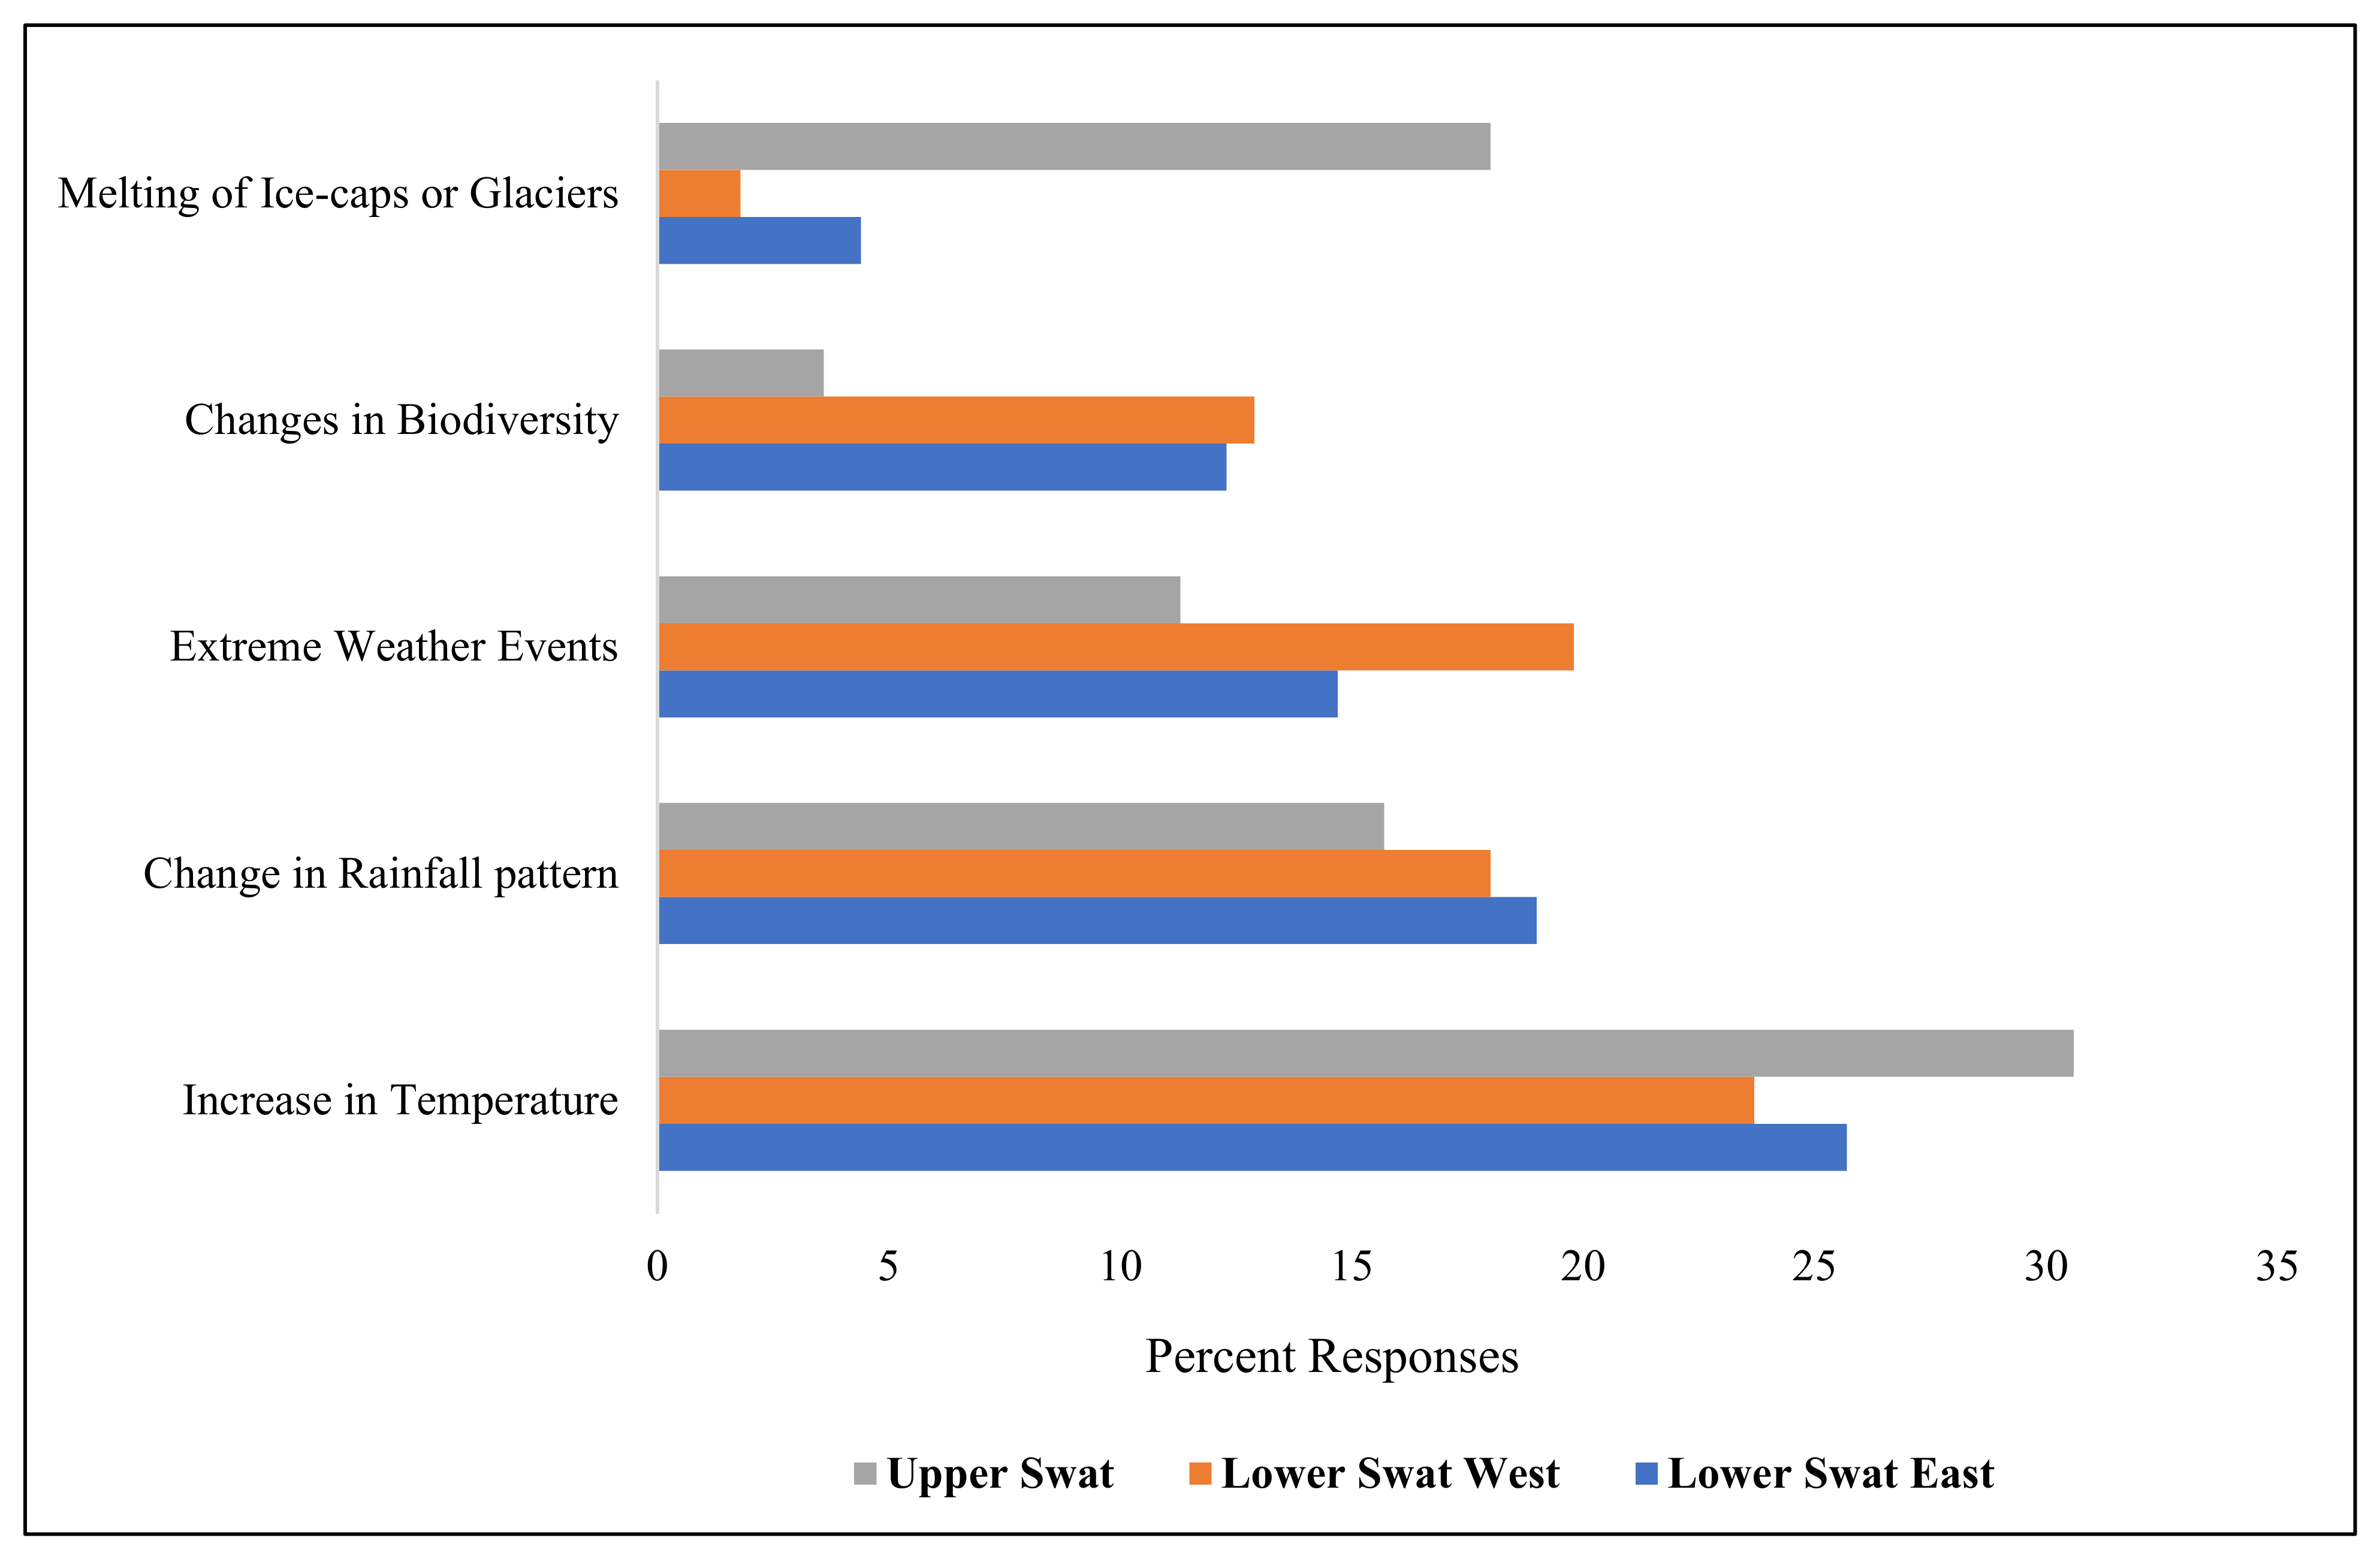
Figure 3 shows different indicators through which survey respondents were able to recognize climate change. In all the three studied zones, an increase in temperature was identified as the main indicator of climate change, as it directly affects people so and is easily observed. This coincides with the historical climatic records of the country and study area [13,34]. Likewise, changing rainfall patterns was the second reported indicator of climate change. On average 17.6% of respondents chose rainfall as an indicator of climate variability. Similar to increasing temperature, changing rainfall patterns can be easily observed from personal experience, especially in those areas where the geography and livelihoods are dependent on rainfall being distributed throughout the year [34].
More respondents in LSW reported extreme weather events compared to other zones, while changes in biodiversity were comparatively less reported in US. Extreme weather events include spells of very high temperature, torrential rains, and droughts. Under an enhanced greenhouse effect, change can occur in both mean climate parameters and the frequency of extreme meteorological events [52]. Weather and climate extremes can have serious damaging effects on human society and infrastructure as well as on ecosystems and wildlife [53]. Developing countries are vulnerable to extremes of normal climatic variability, which causes substantial economic damage, and climate change is likely to increase the frequency and magnitude of some extreme weather events and disasters [54]. Due to warmer climate and changes in the precipitation regime in this century, many plants and animals are going to be affected and may go extent [55,56]. The survey results show that as many as 34.4% of respondents chose changes in biodiversity as an indication of climate change. Melting of glaciers was mostly reported in US, because most of the glaciers there are situated in the upper region of the district. The melting of glaciers has been reported in the upper parts of Swat, such as Kalam, Utror, etc., because most of the glaciers in the district is found in these upper reaches of the study area. Respondents in these areas noted retreat in the glaciers based on their own experience.
3.2.2. Causes of Climate Change
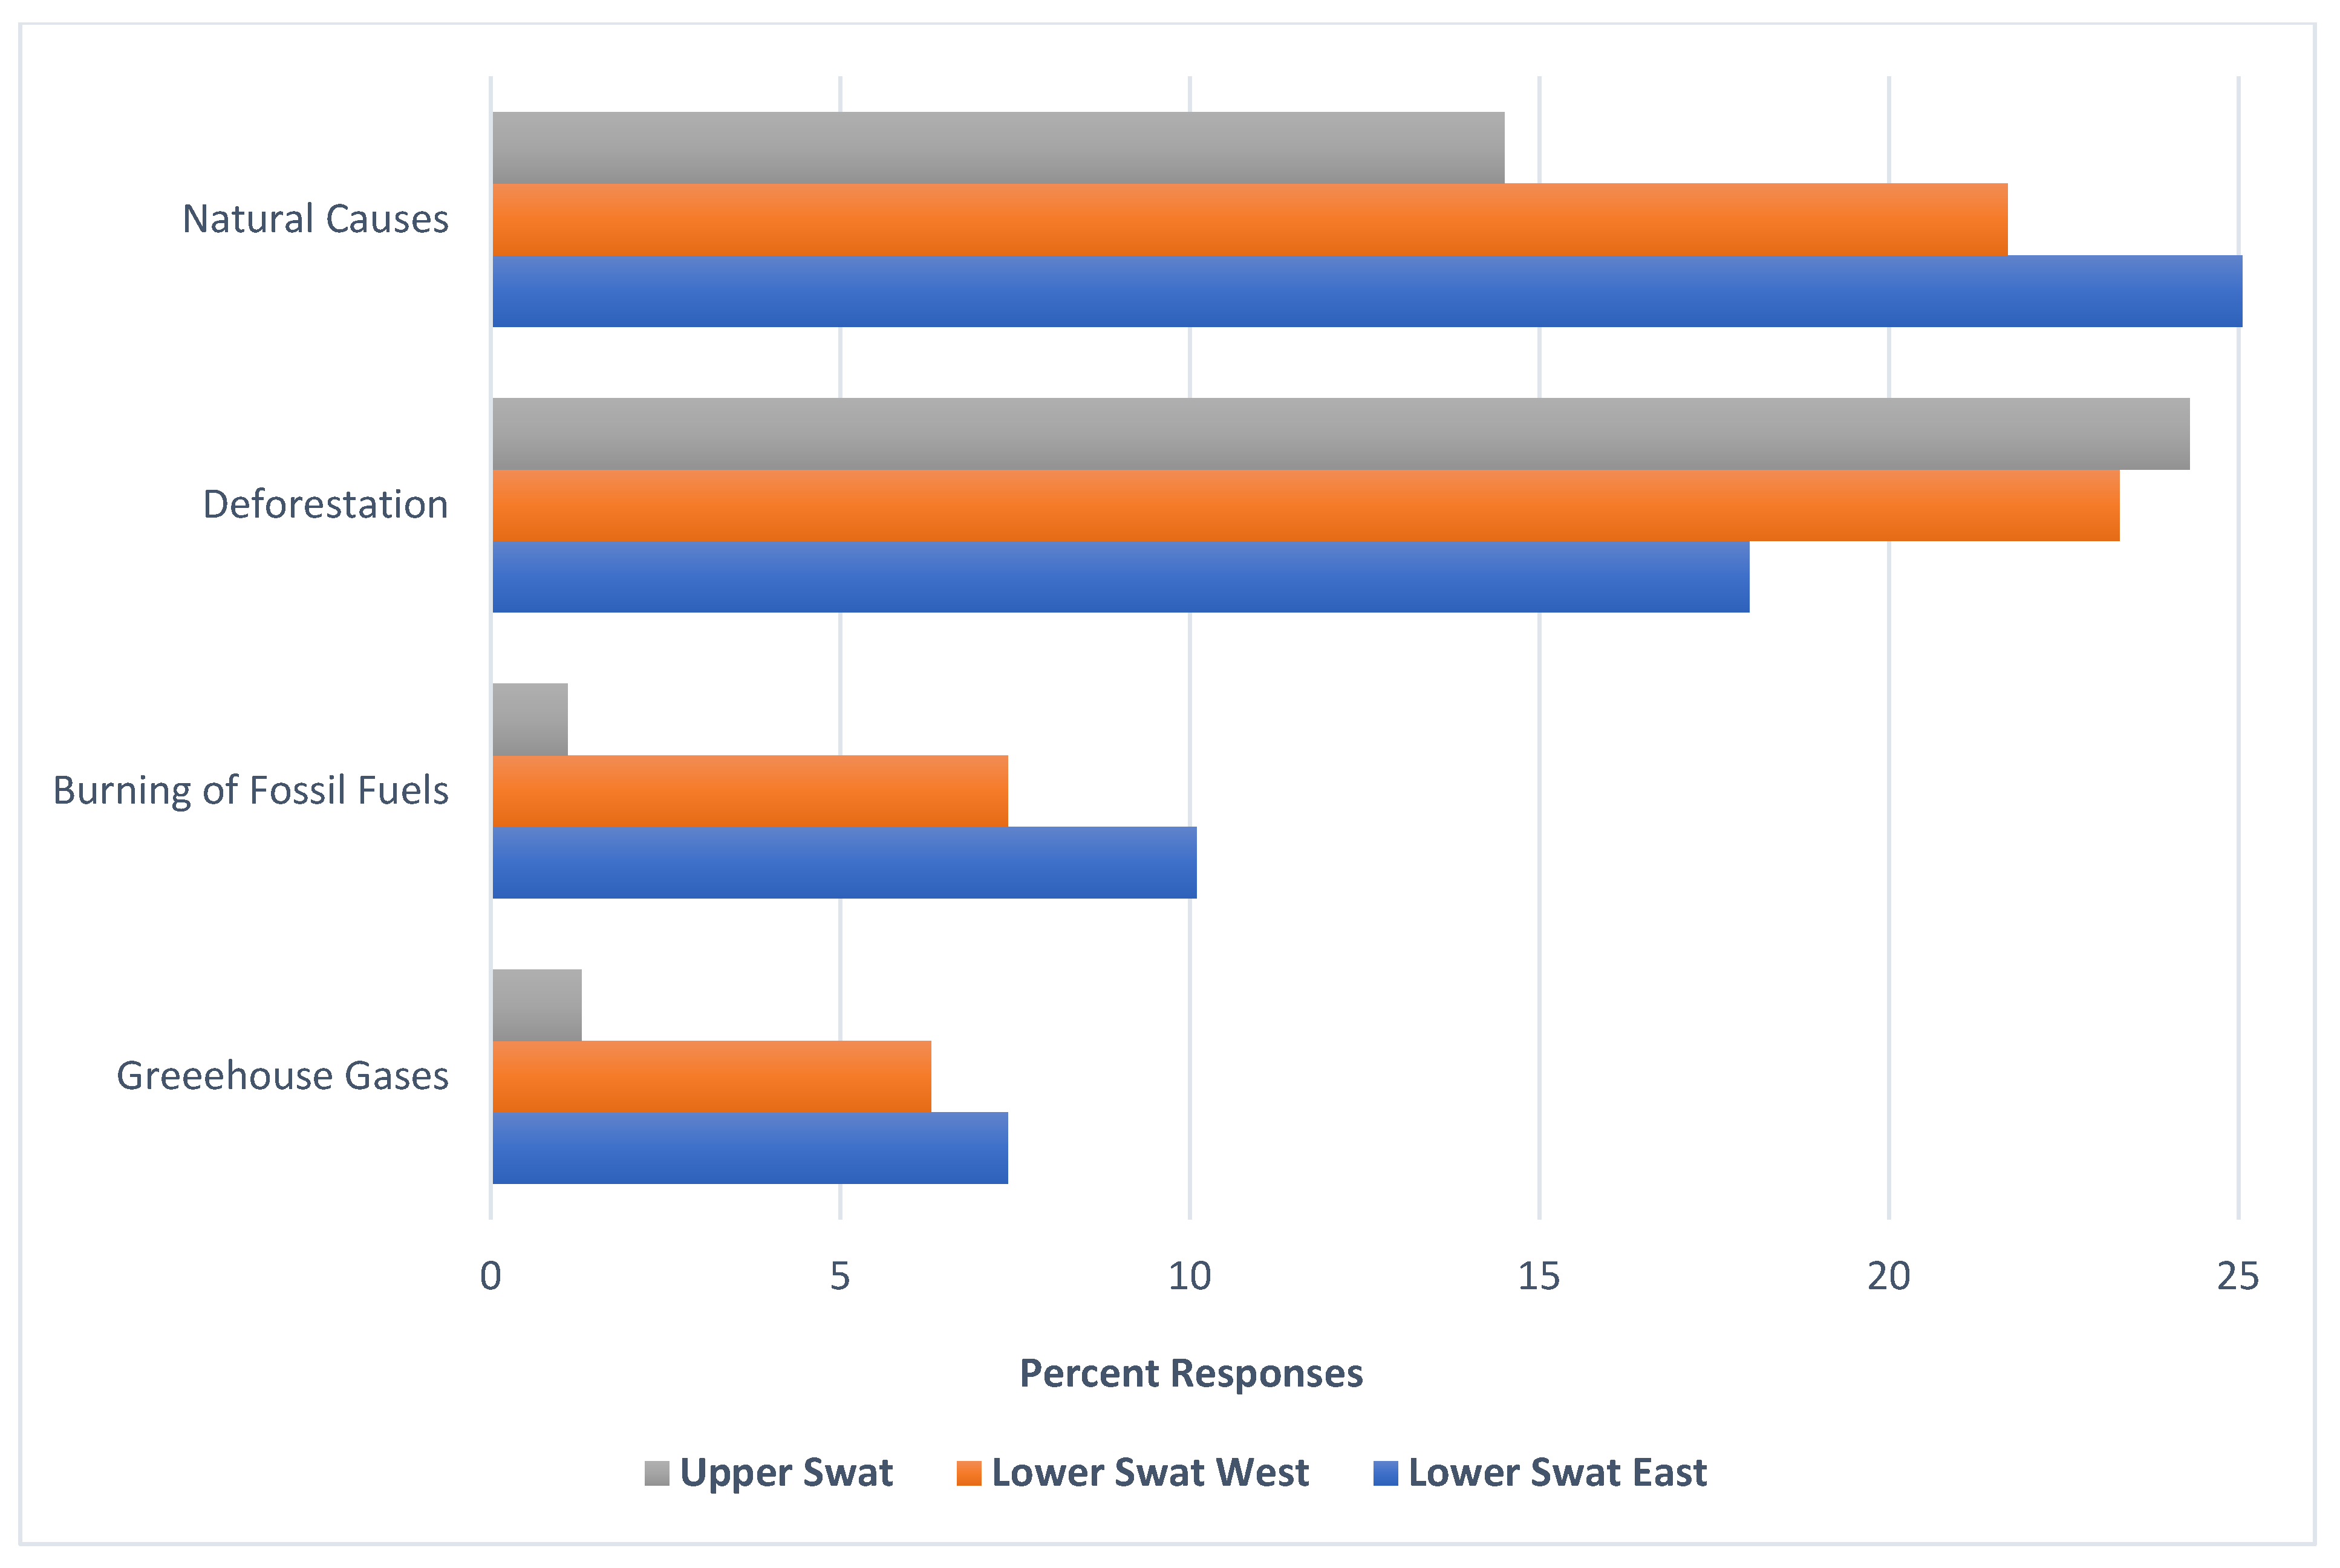
Figure 4 shows public perceptions about the causes of climate change. To avoid getting into detail about the causes of climate change, general response categories were used for the questions. Deforestation was deemed a major contributor to climate change, which indicates high deforestation in the area. Respondents from the US and LSW reported more deforestation compared to LSE. Swat District has 8.1% of the total forest cover in Khyber Pakhtunkhwa province, which is facing extreme pressure from a multitude of problems, including environmental and technological factors (i.e., adoption of mechanized agriculture to enhance productivity), convenience and proximity to local markets, overgrazing of pastures, massive use of firewood, institutional weaknesses, conflicting property rights [57], and livelihood security of the dependent rural communities [58,59]. According to Kruseman and Pellegrini (2013), in 1996 the forest cover was 5%, compared to 20–25% in 1850 [60]. Illegal logging and corruption are impairing sustainable forest management in the area. Unlike other countries where deforestation is mainly characterized by permanent clearance of forest areas and conversion to agriculture and pasture lands, the deforestation in Swat is driven primarily by logging to extract wood that threatens the coniferous forests. Corruption is taking place in every step of the process, right from the extraction of logs, transportation, and marketing [61,62].
Meanwhile, Qasim et al. (2014) reported a 36% decrease of forest in the lowlands and 69% in high elevations based on temporal analysis of forest cover between 1968 and 2007 [63]. Natural causes were second among climate change causes, noted by more respondents from LSE than other parts of the study area. Results of a similar nature have also been reported by other studies [16,64].
Apart from deforestation, a small number of responses referred to other anthropogenic causes of climate change, such as greenhouse gases and burning of fossil fuels, which can be attributed to the low literacy and awareness rate of respondents in the study area. For that reason, the survey asked about greenhouse gases as a group rather than individual gases responsible for global warming/climate change [65]. Respondents from Lower Swat reported more about the greenhouse gases and burning of fossil fuels compared to respondents from Upper Swat. Given the literacy rate in the study area, the term “greenhouse gases” was preferred over the names of individual gases (i.e., CO2, CH4, N2O, etc.), as shown by other studies [65]. Collectively, close to two-thirds (60.1%) of respondents believed that anthropogenic sources are responsible for causing climate change, which is consistent with other studies [7,66,67].
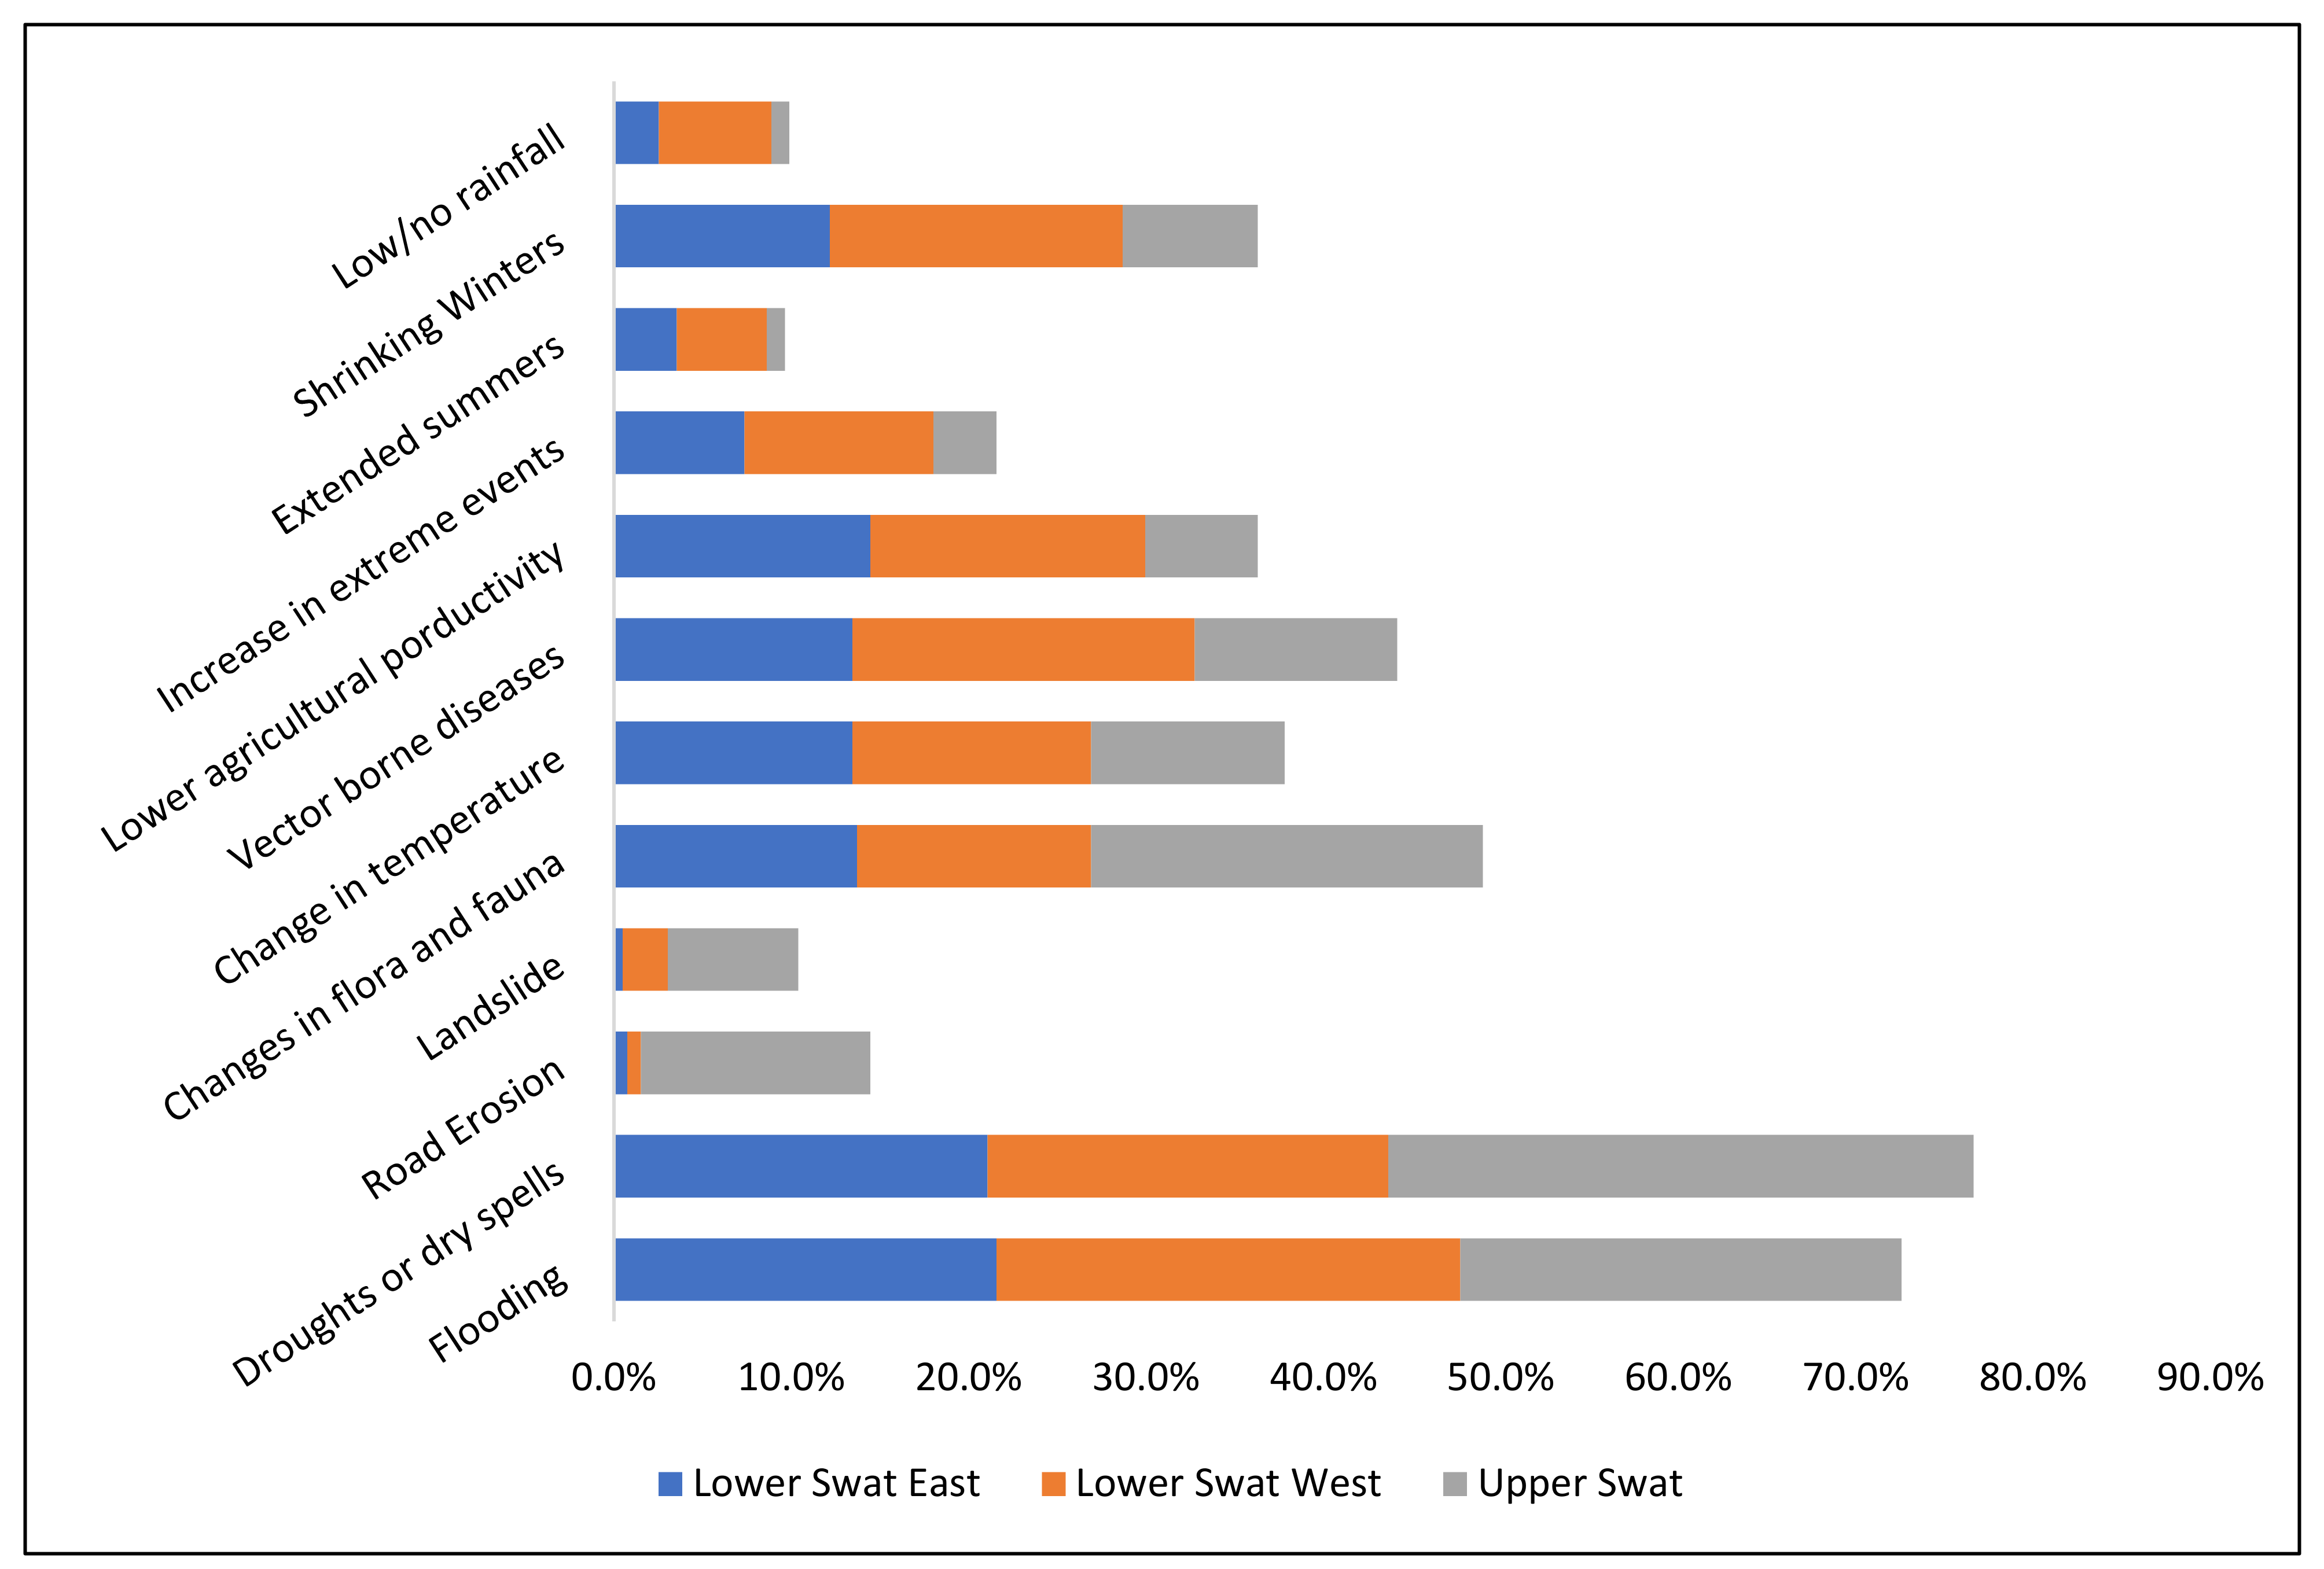
3.2.3. Climate Change Vulnerabilities
Climate change in Pakistan is expected to have serious environmental, economic, and social impacts, particularly affecting mountainous communities dependent on livelihoods based on natural resources. In our study, survey respondents perceived climate variability as a risk to the overall weather system, infrastructure, and livelihood integrity in Swat District. The main reported impacts of climate change included floods, droughts, changes in flora and fauna, temperature change, vector-borne diseases, and lower agricultural productivity (Figure 5). Flooding was reported almost equally in all zones (21.6%, n = 85; 26.1%, n = 103; and 24.9%, n = 98 in LSE, LSW, and US, respectively), while drought was reported more in US than the others (33%, n = 130). This shows the vulnerability of the Upper Swat region to the negative impacts of climate change. Likewise, landslides and road erosion were reported comparatively more in US (7.4%, n = 29 and 12.9%, n = 51, respectively), most likely due to the unprecedented floods of 2010 in the study area that devastated the whole ecosystem.
As the prime productive agricultural lands are in Lower Swat, there were more responses related to lower agricultural productivity there (15.5%, n = 61 and 14.5%, n = 57 in LSW and LSE). Temperature changes (most responses in Lower Swat; avg 13.5% for LSE and LSW), increased extreme weather events (most responses in Lower Swat West; 5.1%, n = 42), extended summers (most responses in LSW; 5.1%, n = 20), and shrinking winters (most responses in LSW; 16.5%, n = 65) all show changing weather patterns in the study area and the likely impacts of climate change.
Differences in the climate zones between Upper and Lower Swat were shown by the differences in public opinion in the two regions. Moreover, some of the impacts of climate change, such as landslides and road erosion, are more common in US due to the severe effects of the 2010 floods.
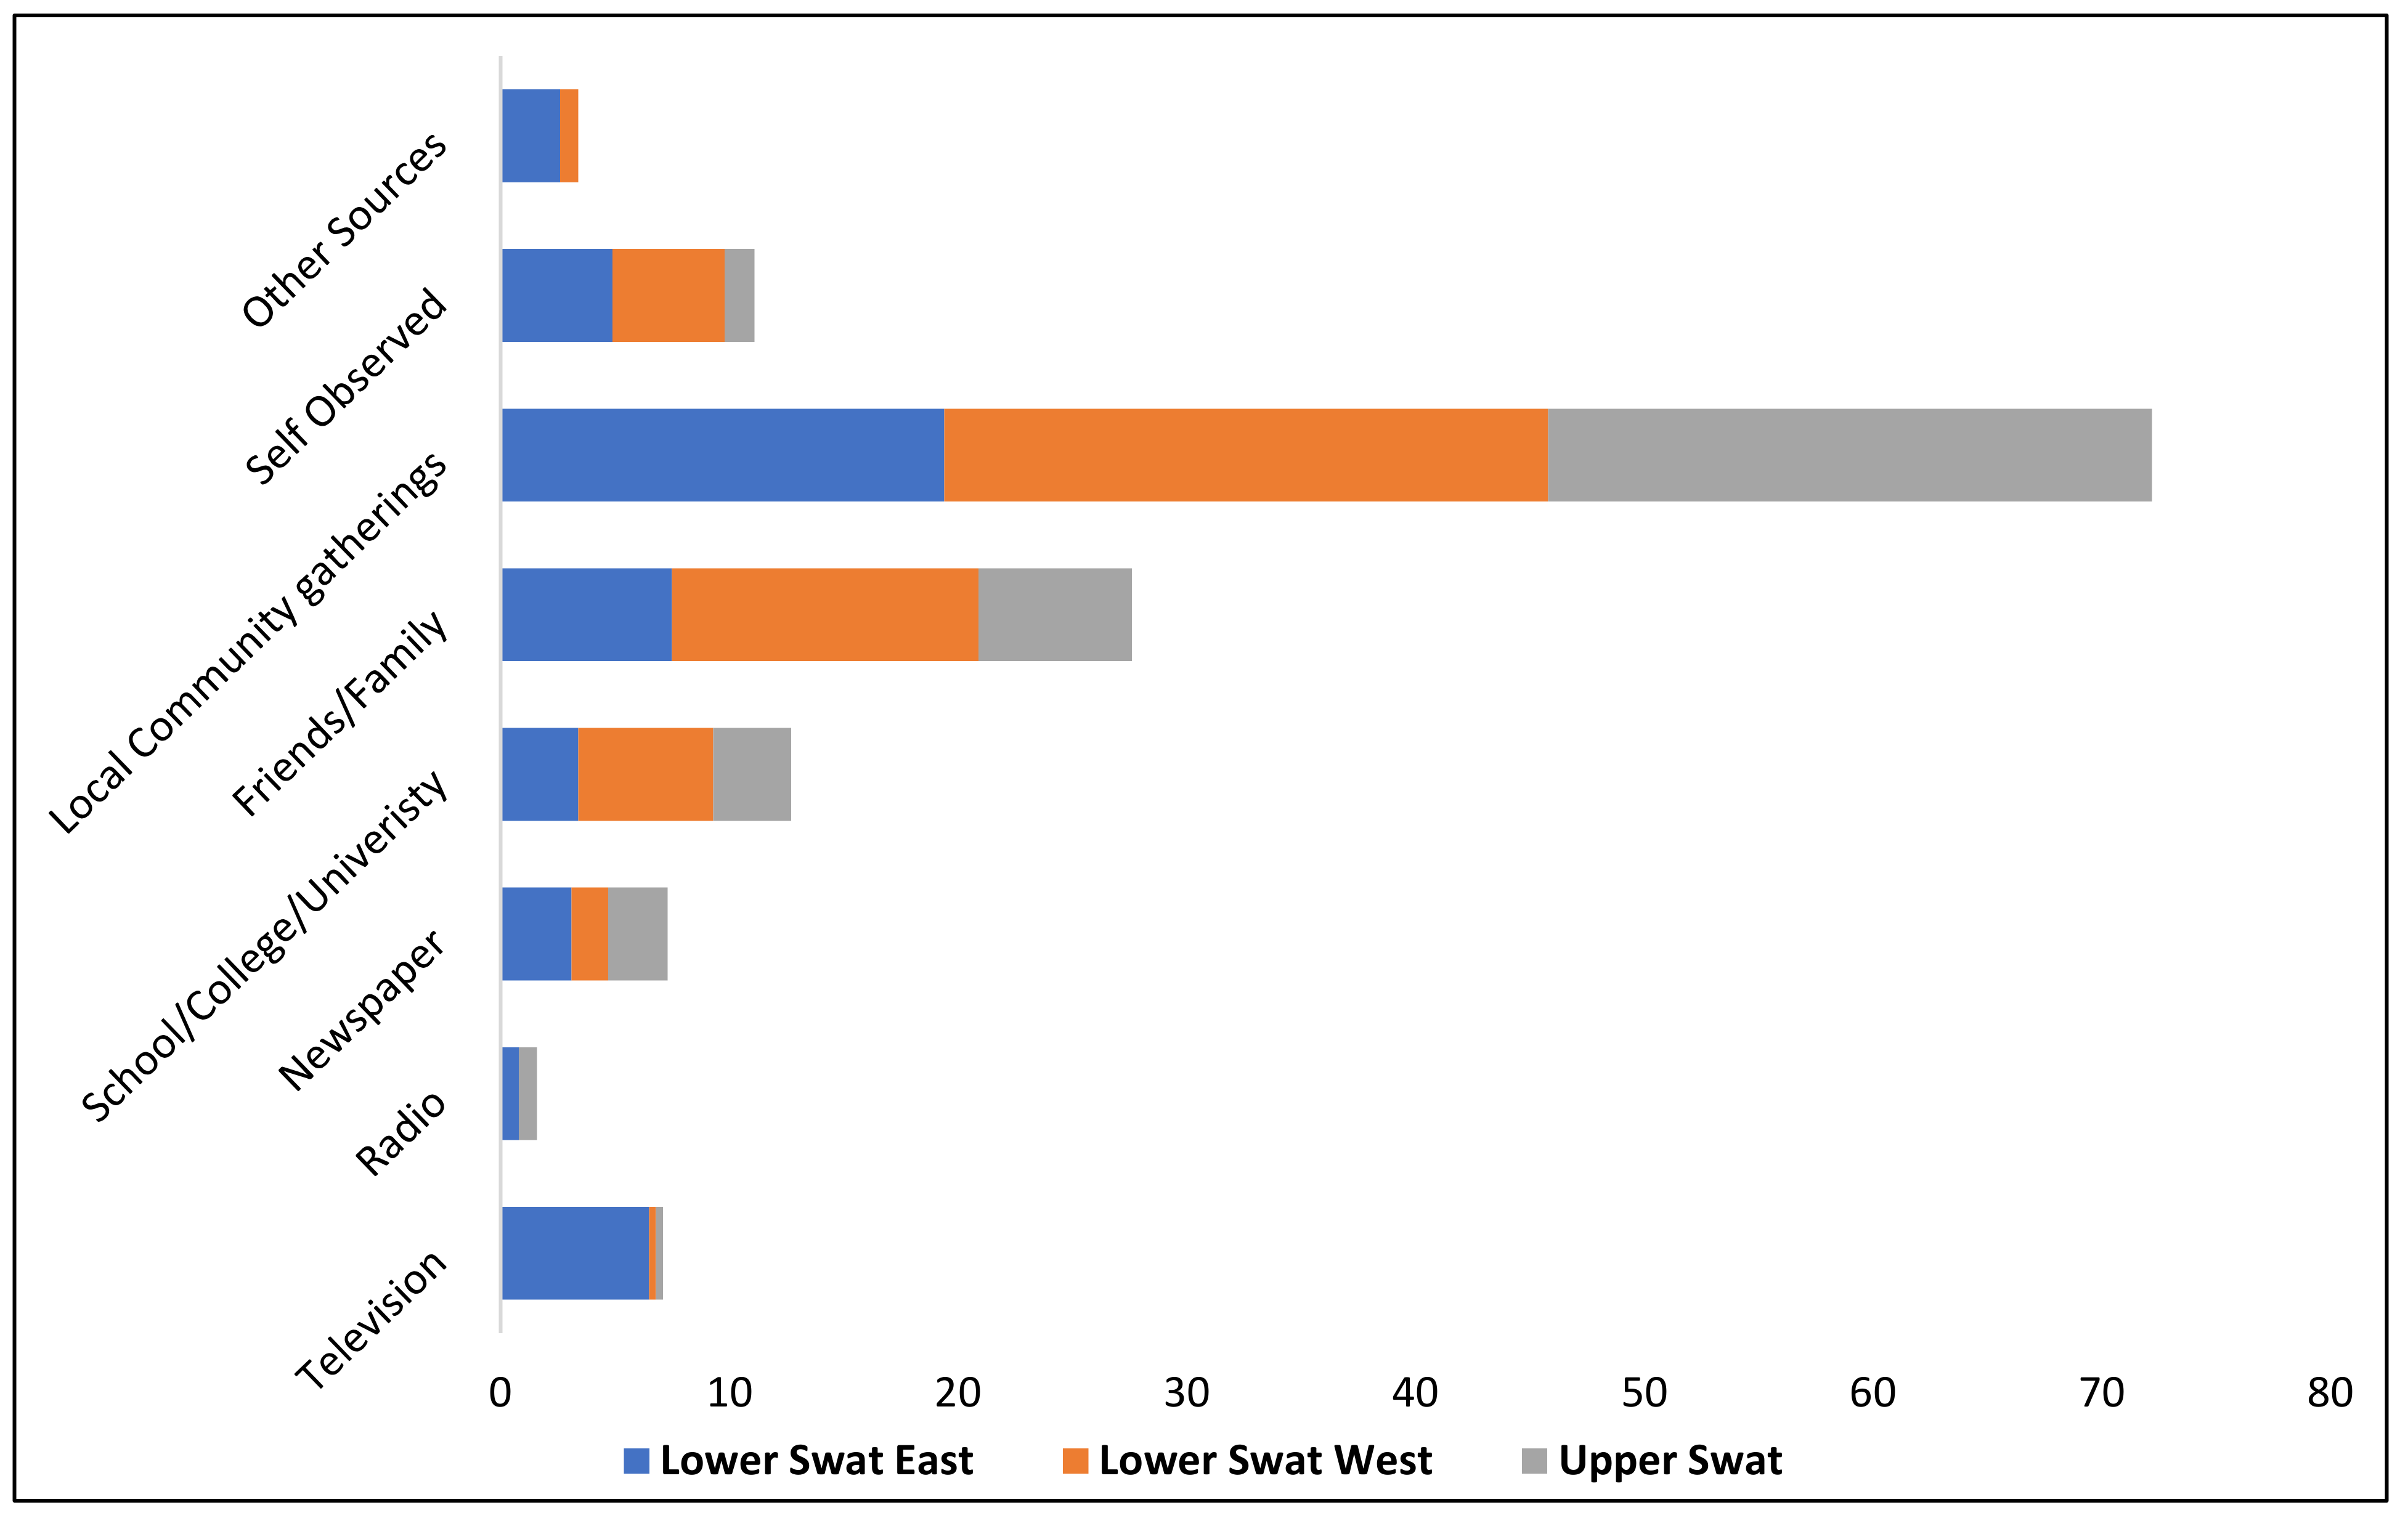
3.2.4. Climate Change Information
Figure 6 shows the respondent’s sources of information about climate change. The respondents were asked how they got their information. The most common response to this question was local community gatherings (72.2% of responses, n = 279), which implies that in Swat District, changes in the weather and climate are mainly discussed in local community gatherings. Local gatherings are held in a designated place called a hujra, where community members gather after work and on various occasions. Since most of the respondents belong to the low-income and low-literacy category, their knowledge is primarily based on secondhand information from village elders. Respondents in US and LSW gather more information from local gatherings than those in LSE. The second largest response to the question is friends/family (27.6%, n = 107). Due to the family demographics of the study area, the joint family system contributes to large household sizes, including elders. Information about various subjects is shared within the family by the elders. Climate information is imparted through friends/family more in LS than US.
The third contributor of climate information is schools, colleges, and universities (12.7%, n = 49). This did not come as a surprise due to the lower literacy rate and lower number of respondents attending educational institutions. During the reconnaissance survey, some respondents reported observing changes in weather through their own experience. The category self-observed was then used in the main survey to see how many answers this category would receive. Surprisingly, the category got the fourth largest response (12%) among the respondents. More respondents in Lower Swat reported self-observation of climate change compared to Upper Swat. Media such as television, radio, and newspapers also play a role in the dissemination of climate change information, with more responses observed for newspapers than television and radio. In our study, media played a limited role in disseminating climate change information in contrast to other scientific findings that considered media to have a greater influence [66]. Apart from that, there was less reported involvement of government departments, conservation organizations, and academia in local climate issues.
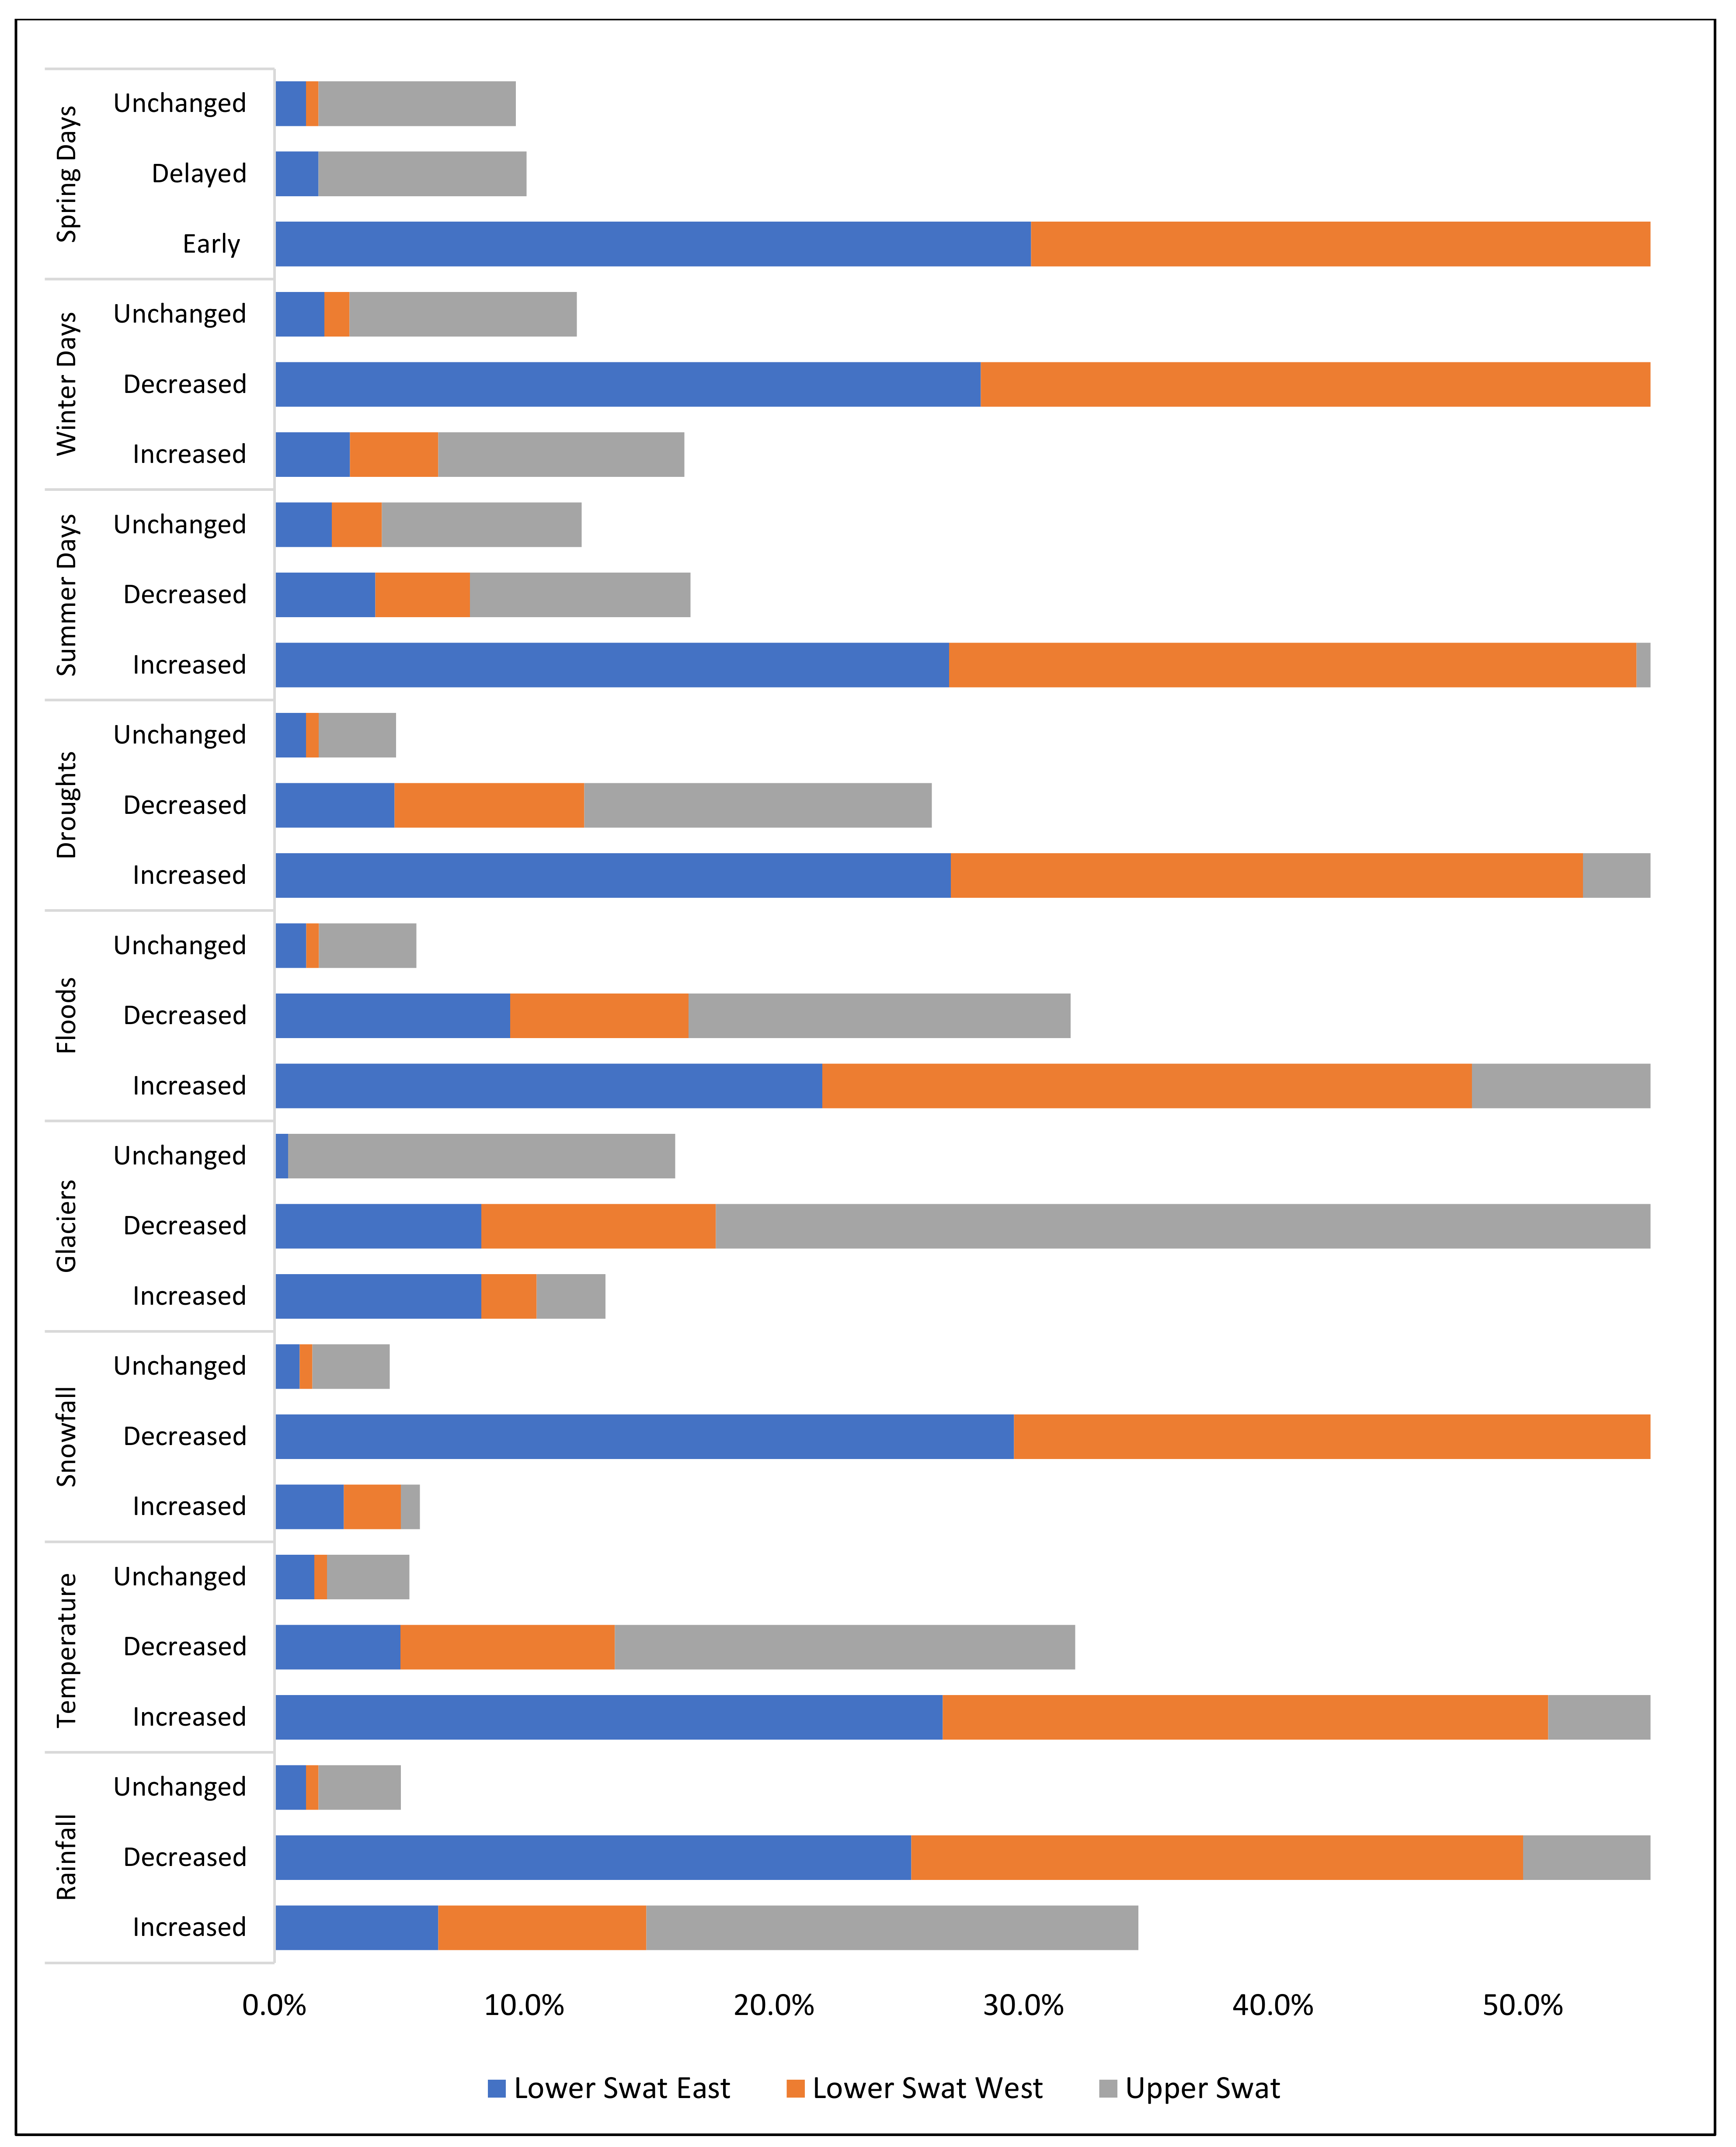
3.3. Public Observations of Climate Change
Nine indicators of climate change were used, and respondents were asked whether they increased, decreased, or were unchanged (Figure 7). More than 60% (n = 239) of the respondents believed rainfall has decreased, with a higher response in the Lower Swat region (50%, n = 198). A surprisingly higher number of respondents (19.6%, n = 78) reported observing increased rainfall in the US compared to LS. Nearly two-thirds of respondents observed an increase in temperature (62.6%, n = 248) with a higher response in LSE (26.8%, n = 106). On the contrary, 32.1% (n = 127) reported observing a decrease in temperature. Similarly, 90% (n = 354) of the respondents reported observing a decrease in snowfall and 71% (n = 128) a decrease in the size of glaciers. More responses regarding a decrease in glaciers were observed in the US (53%, n = 96), where most of the glaciers are situated. A trend of increasing extreme events such as floods and droughts was reported by survey respondents. An overall increase of floods and droughts was observed by 62.5% (n = 245) and 69% (n = 272) of respondents, with more responses in LSW regarding floods (26%, n = 102) and in LSE regarding droughts (27%, n = 107). The district has been facing extreme weather conditions for the last decade, therefore the responses regarding these indicators were obvious. Changes in weather conditions such as increased summer days, decreased winter days, and early springs received the most responses for these indicators during the survey. More responses regarding all three indicators were reported from Lower Swat.
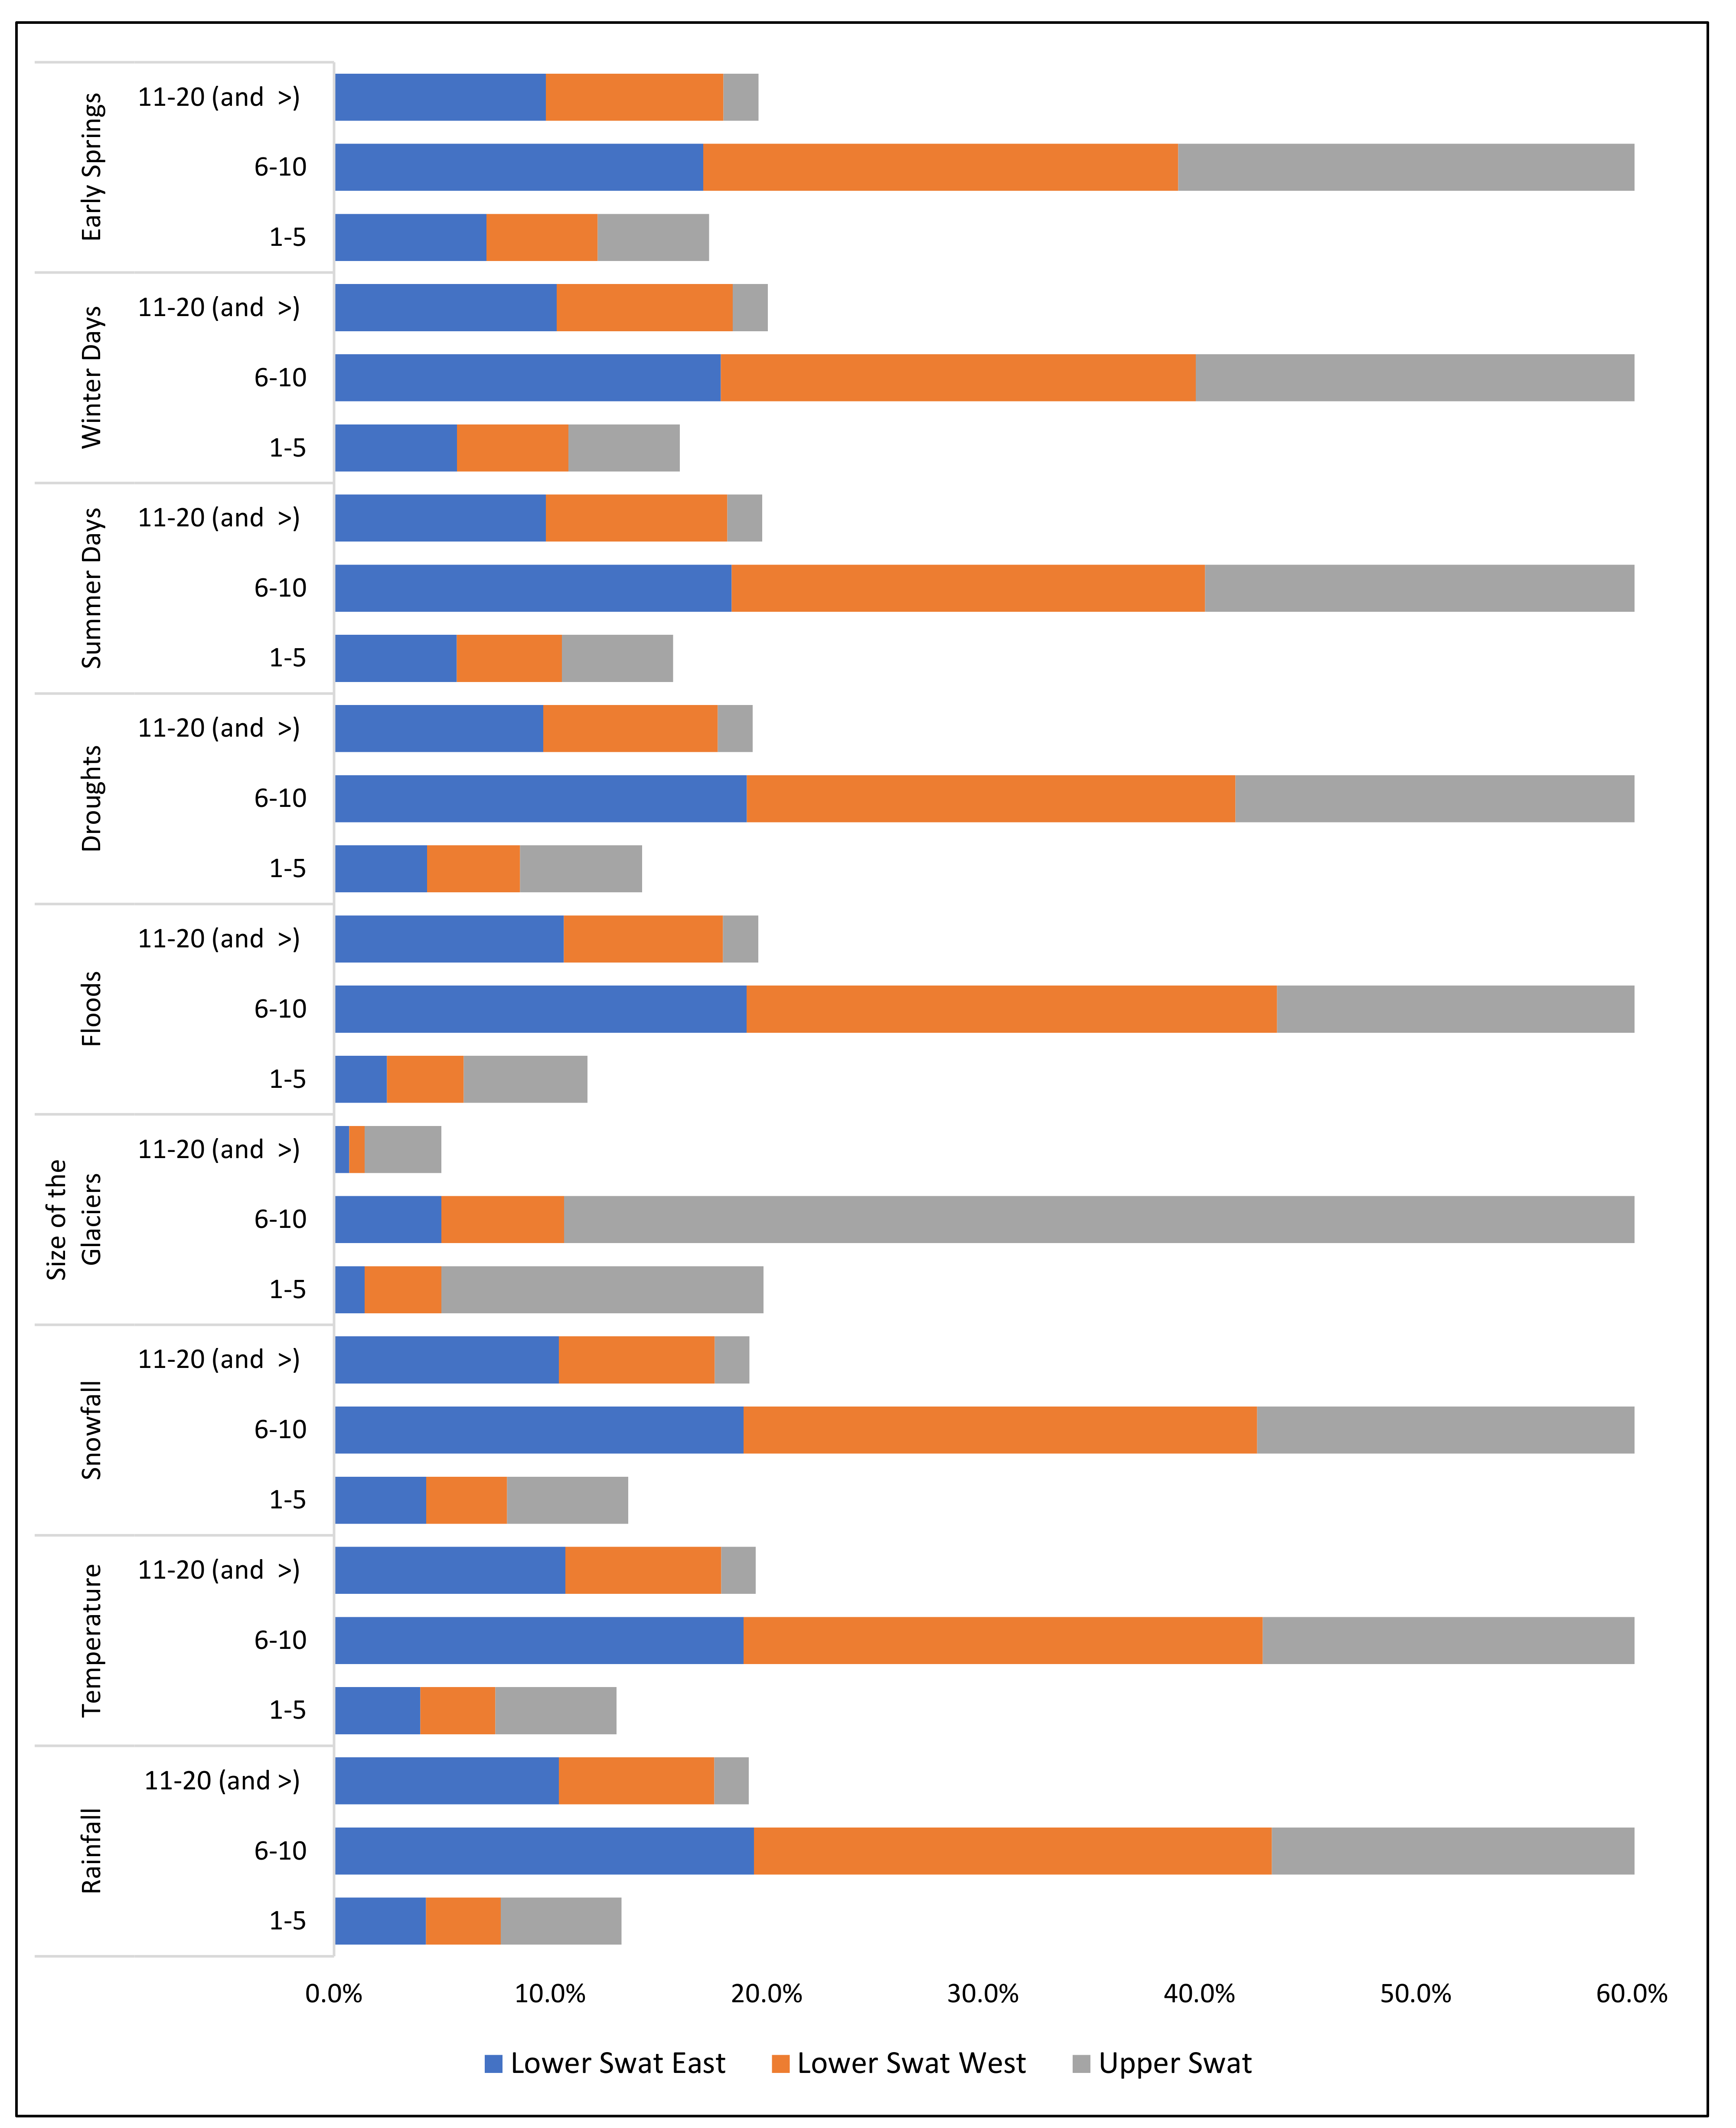
In a second question, we asked survey participants about the time period (in years) since they started to notice the changes in the indicators. Figure 8 shows the time period of climate variability in the study area. Most of the respondents started to notice changes in all of the studied indicators 6 to 10 years ago, followed by 11 to 20 years or more. Fewer respondents reported that they noticed changes in the climate indicators in the last 1 to 5 years. These results can be attributed to the age of the respondents, with older respondents having more climate observations.
Changes in the climate system are visible, and almost all respondents had a clear view of these seasonal changes. Similar results have been reported by other studies [19,68]. The above results illustrate that the perceptions and observations of climate change are affected by age, with older respondents experiencing more climate variability [7,69]. Older people are more concerned and knowledgeable about climate variability than younger people [67].
3.4. Climate Change Adaptation
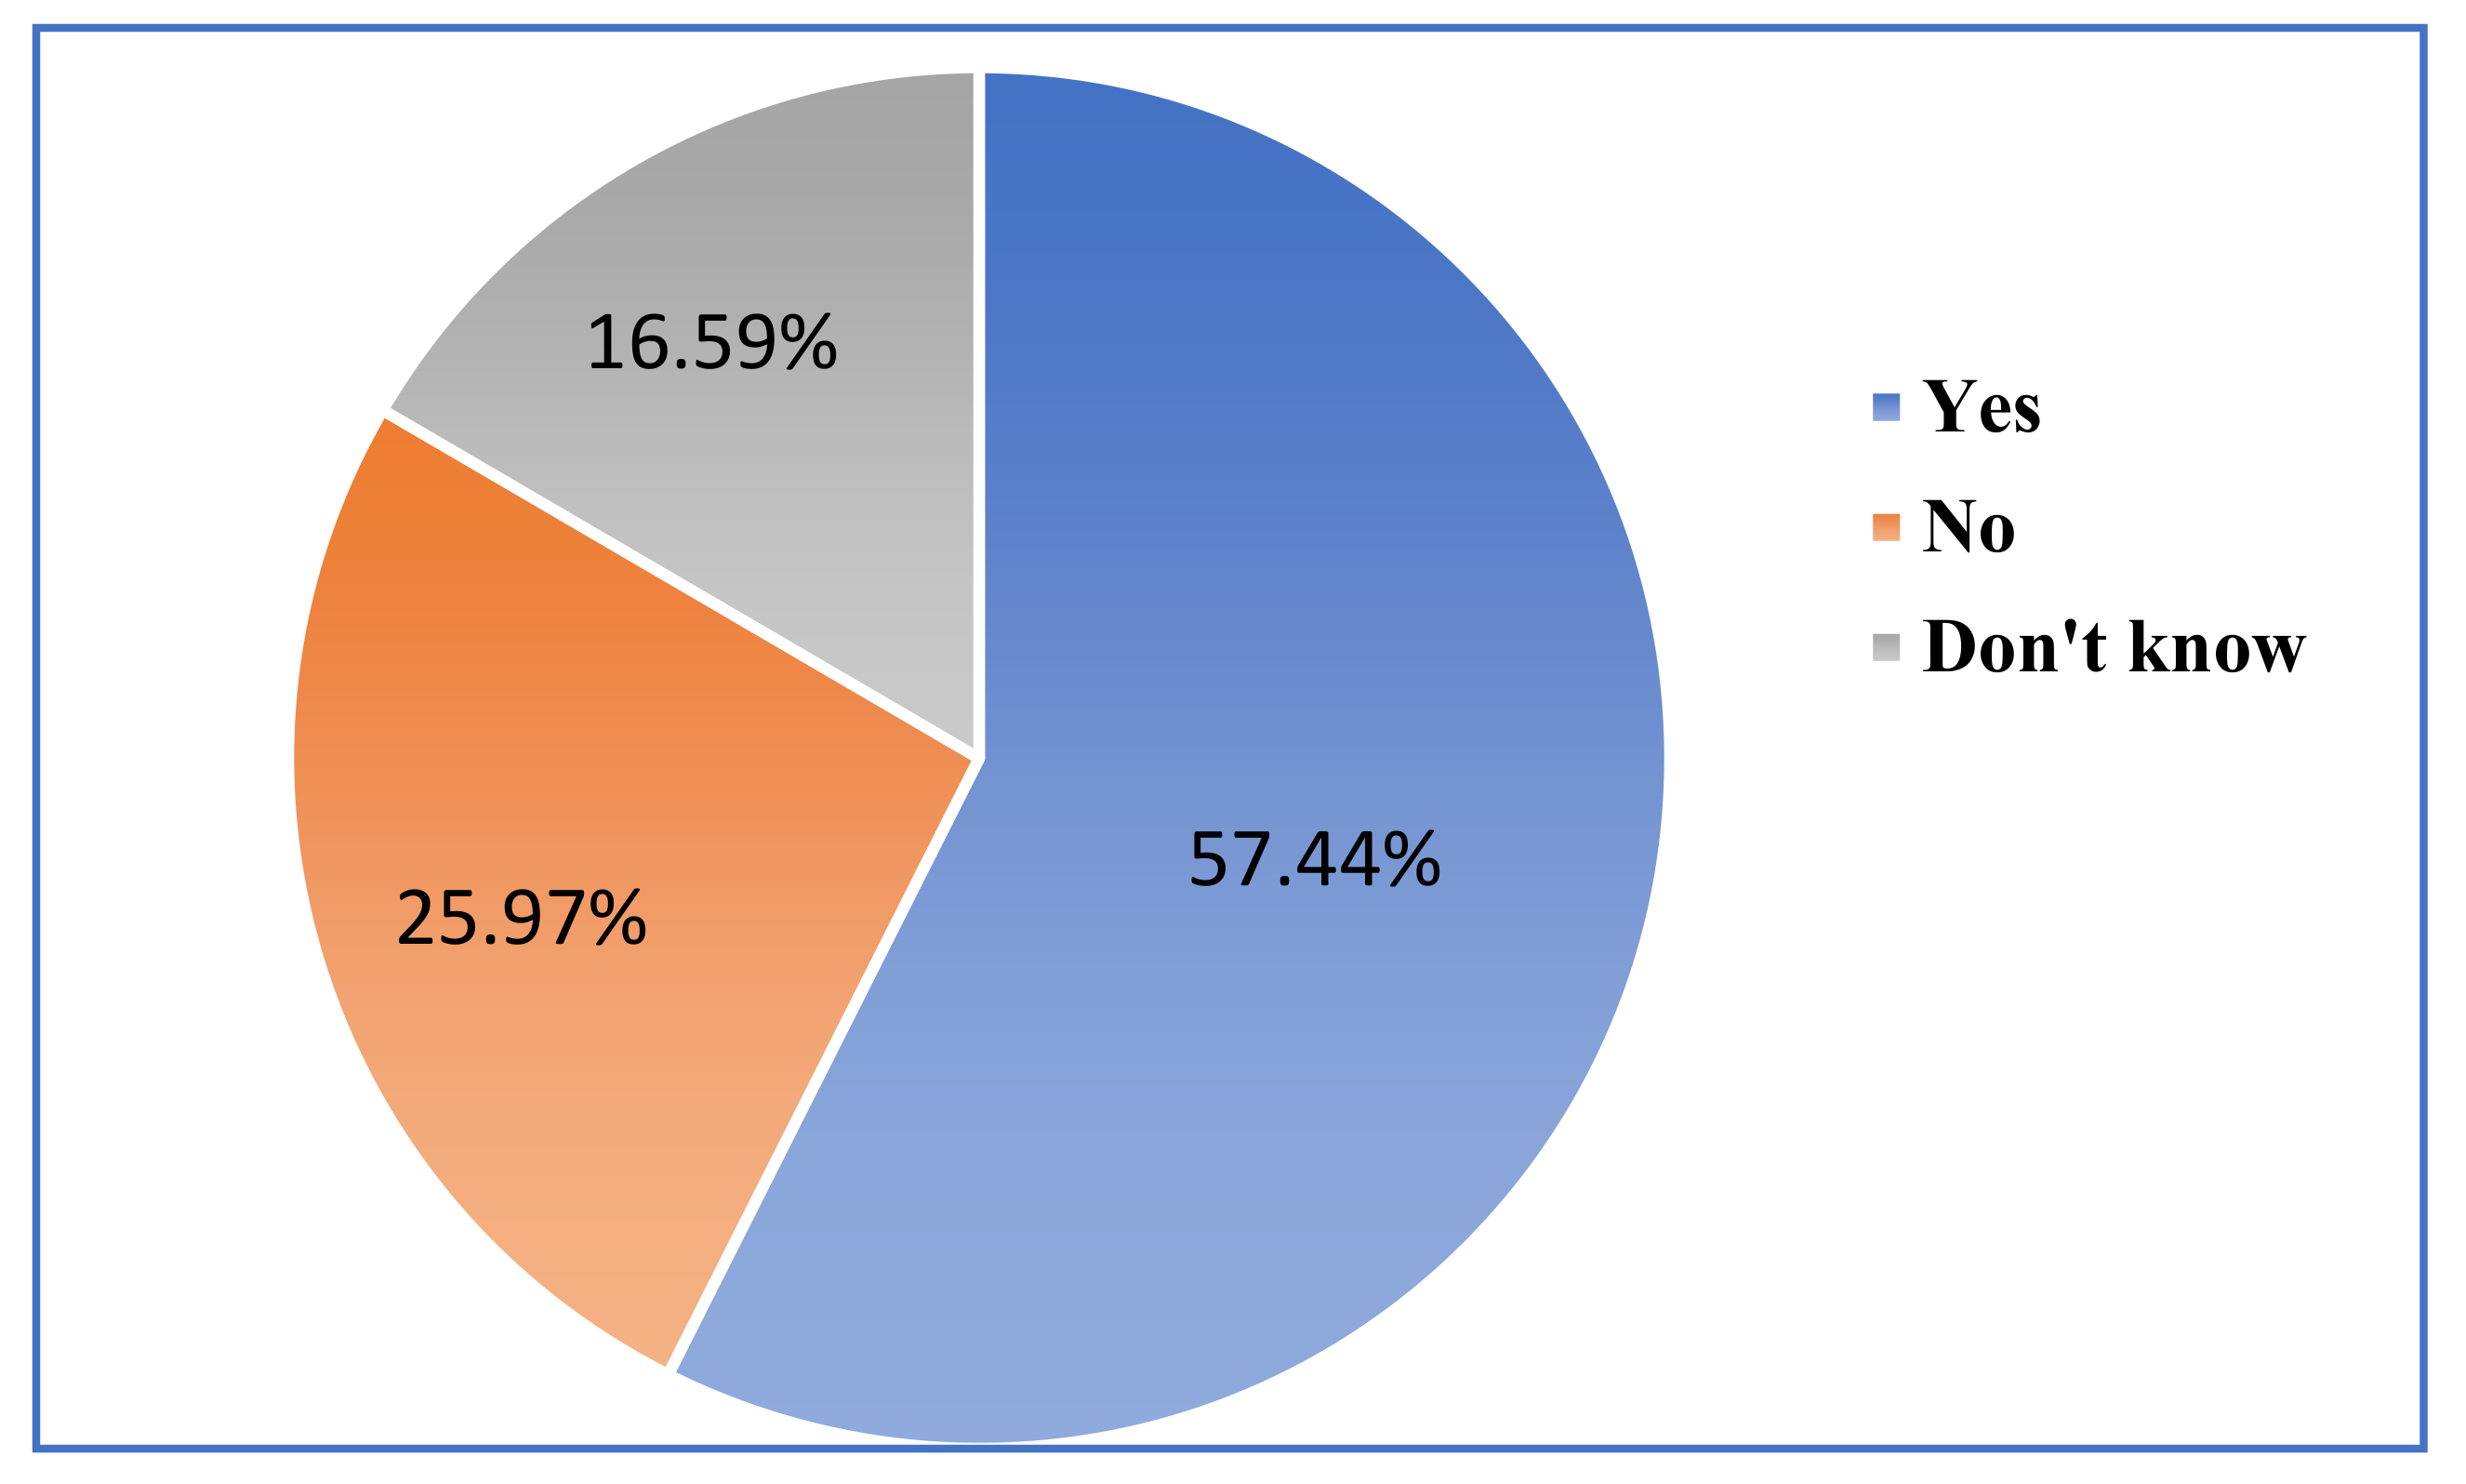
The respondents were asked whether anything can be done to tackle climate change (Figure 9). A major proportion (57.44%) of respondents in all regions said yes to the question about options to tackle climate change, while 16.59% did not know how to tackle climate change. The same question was asked by Whitmarsh (2005) [65], and two-thirds of respondents (64.3%) said yes, while a significant minority (19%) did not know about tackling climate change.
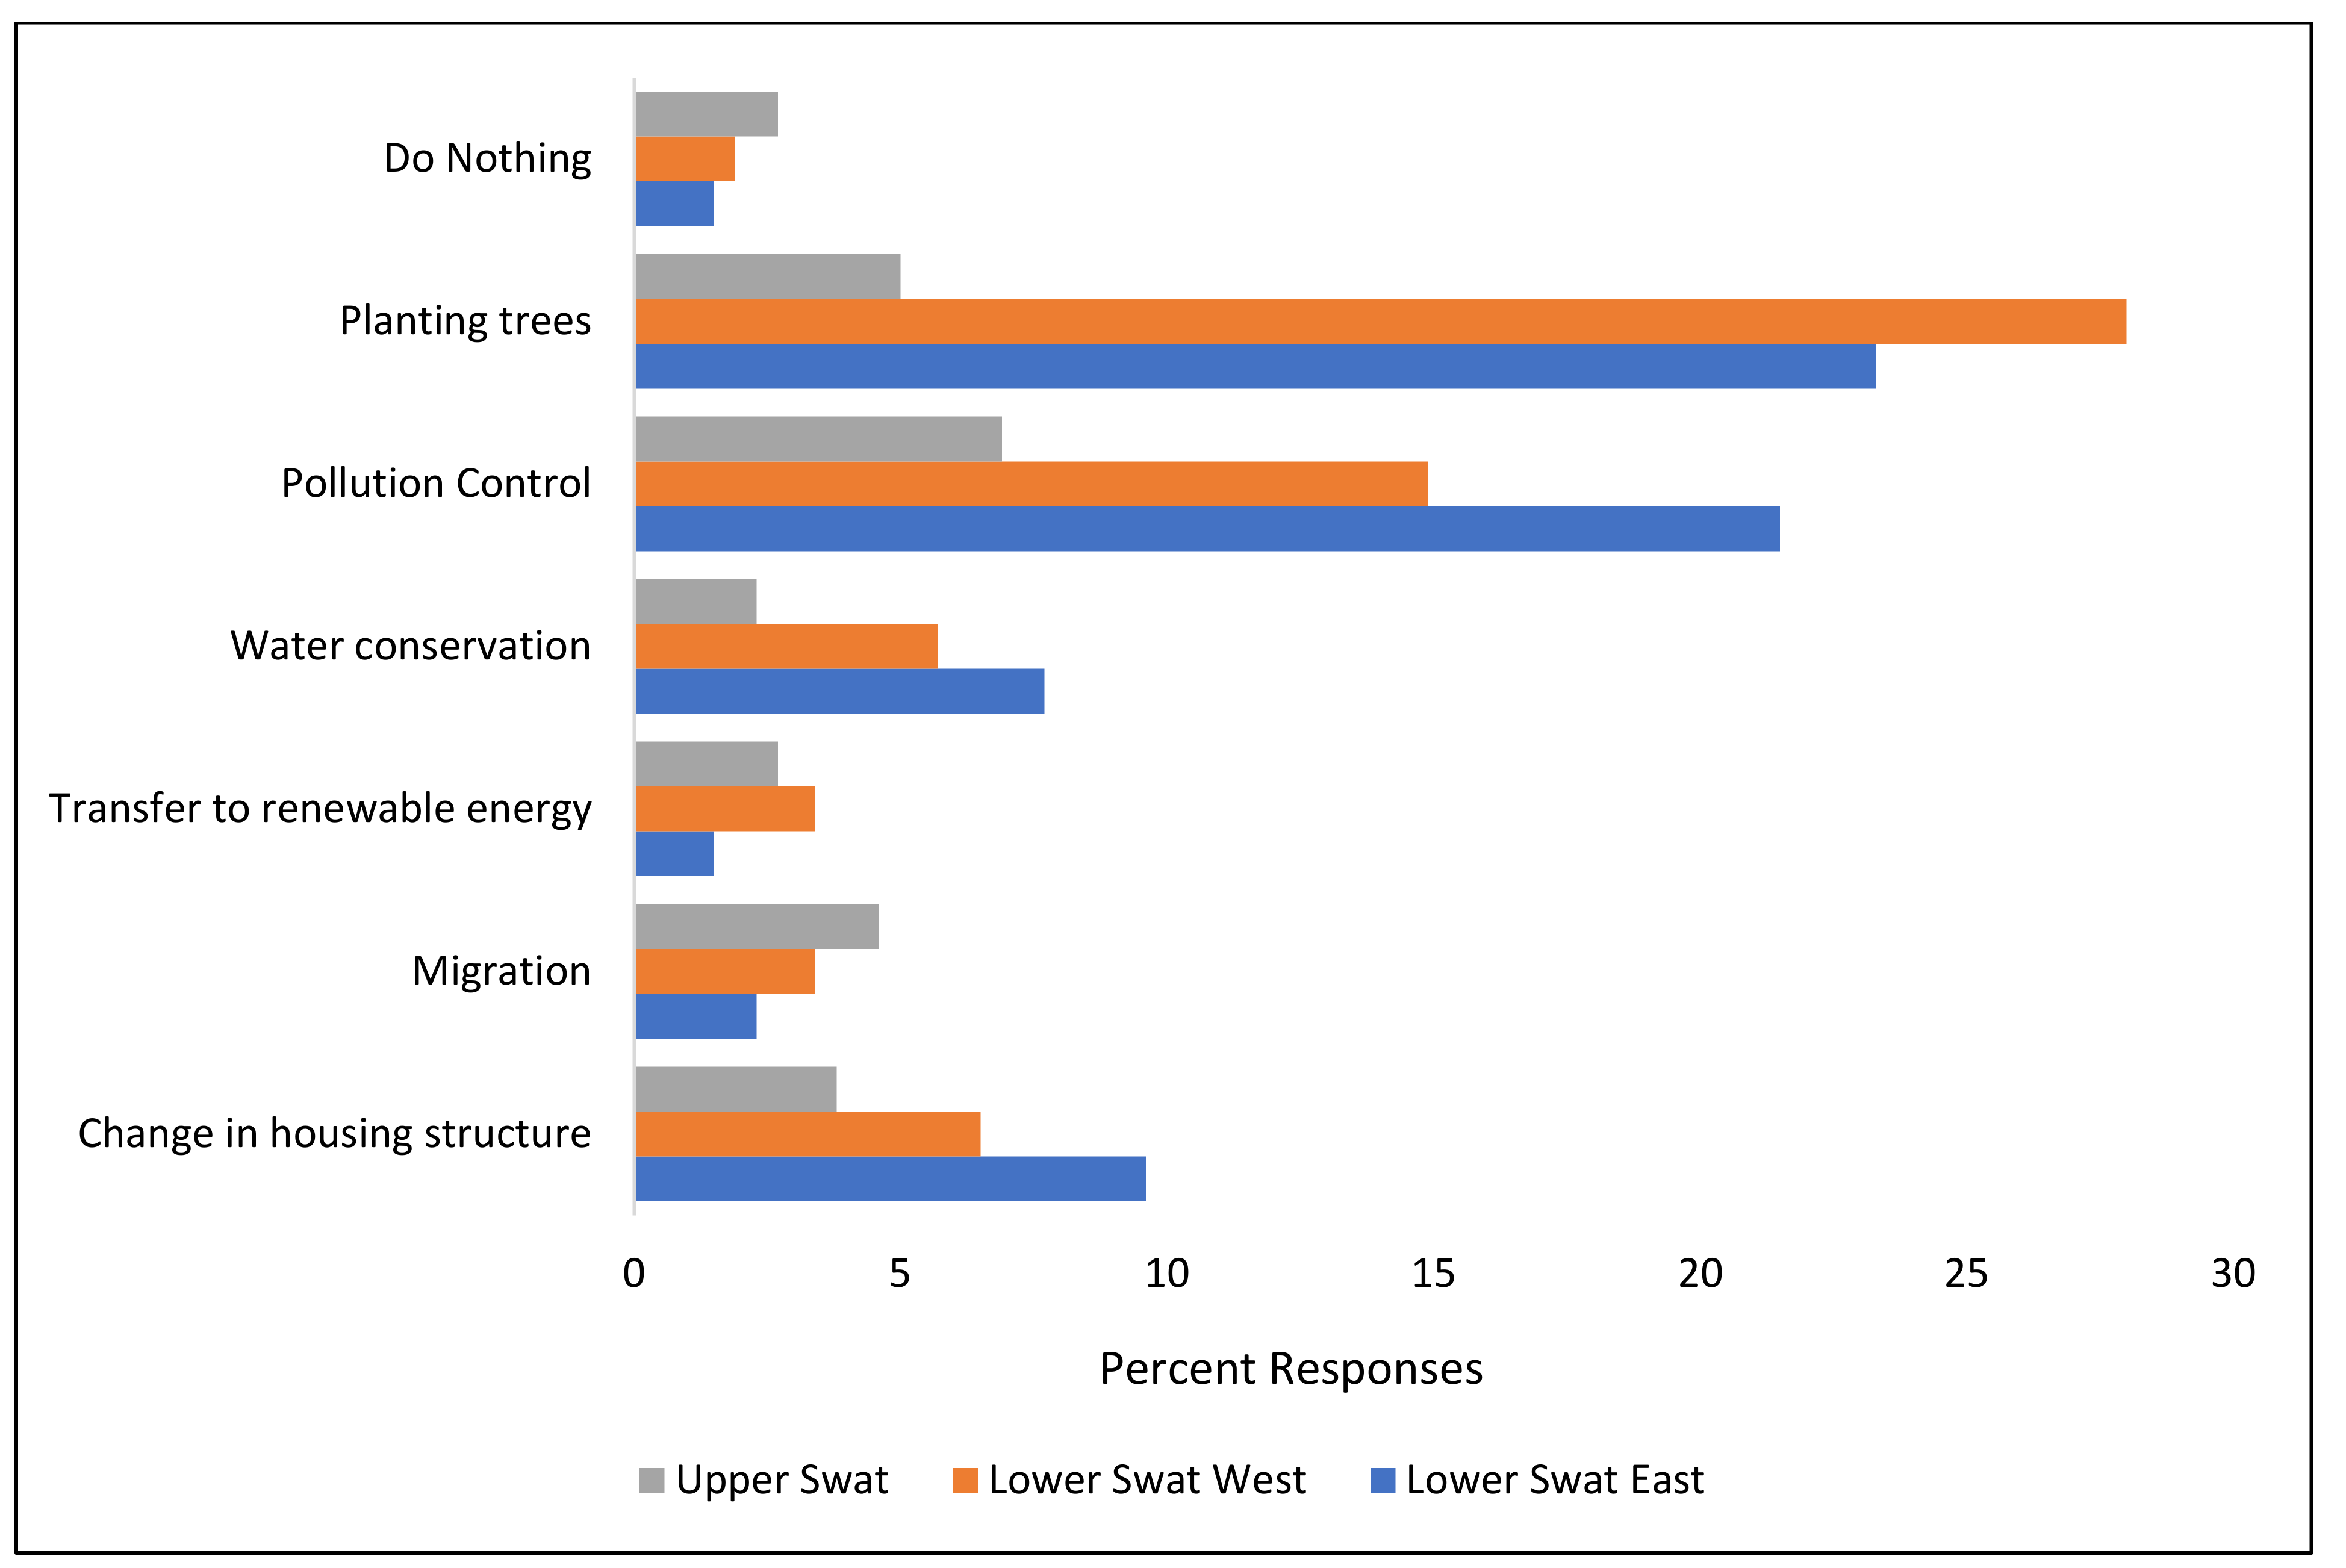
Additionally, two more questions were posed to ask the respondents about their opinions of acting against climate change (In your opinion, what can be done to tackle the problem?) and the responsibility of acting against climate change (Who in your opinion is responsible for acting against climate change?). The results of the first question are shown in Figure 10. Planting trees was the main response (55.9%, n = 146), with more responses in Lower Swat (23%, n = 60 in LSE and 28%, n = 73 in LSW) than US (5%, n = 13). Pollution control was the second most common option for respondents (43.3%, n = 113), with more responses recorded from LSE (21.5%, n = 56). Changes in the housing structure were considered as another coping strategy, with most responses reported in LSE (9.6%, n = 25), which could be attributed to the high feel of summers in this area compared to other regions. The changes in housing structure correspond to improving the thermal comforts of the inhabitants [70,71]. Based on the local housing designs, the preferred choices of the respondents were the incorporation of basements, verandas, painting the roof with a solar reflective material (such as whitewash), roof insulation, and false ceilings to cope with future climate variability. Migration (10.3%, n = 27), transfer to renewable energy (7.7%, n = 20), water conservation (15.7%, n = 41), and doing nothing (6.1%, n = 16) were the other coping categories reported by survey participants.
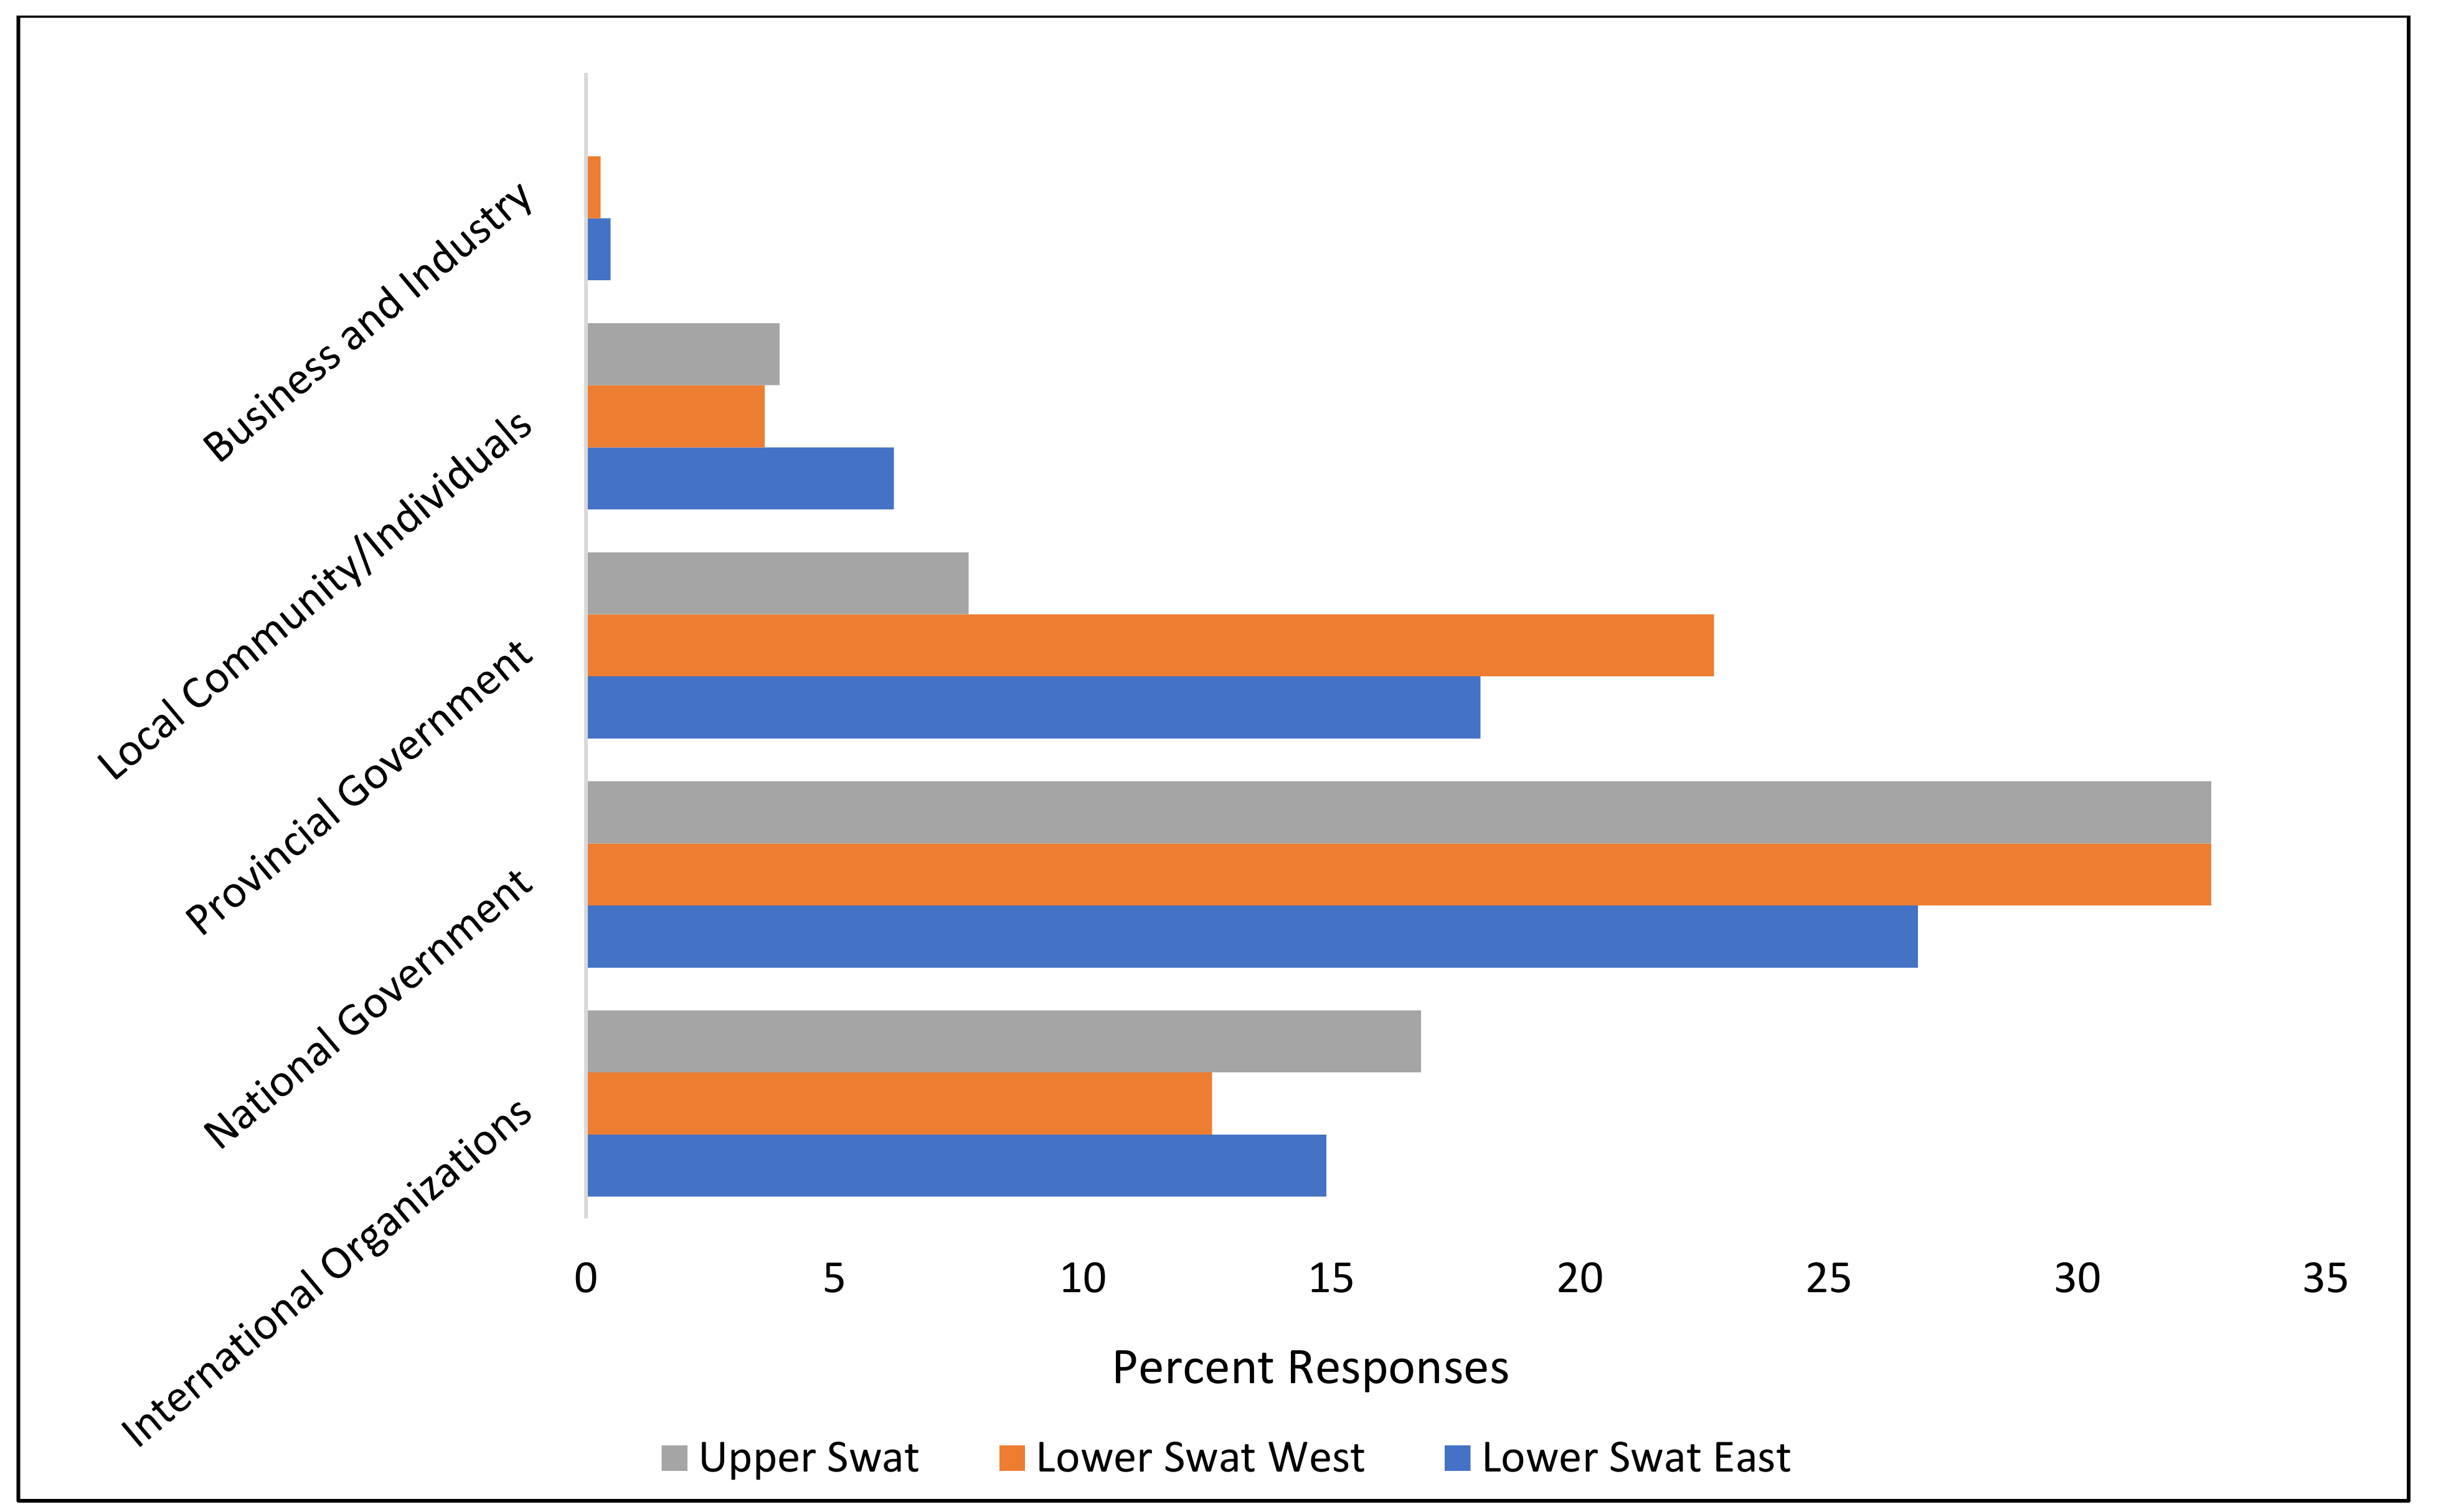
Concerning the second question, a considerably higher fraction of participants considered the national government (92.3%, n = 358) responsible for acting against climate change (Figure 11), with more responses reported in LSW (32.7%, n = 127) and US (32.7%, n = 127). The provincial government (48.4%, n = 188) was ranked second, while international/non-governmental organizations (44.3%, n = 172) were ranked third, with considerably more responses in US. A relatively low number of respondents (13.9%) had the opinion that the local community can play a role in action against climate change. It is pertinent to mention that during the catastrophic floods of 2010 in the study area, several international organizations engaged in rehabilitation efforts, which is why participants showed a strong inclination toward valuing their role in actions against climate change. These results are partially consistent with previous studies [7,72], where international organizations were reported as the preferred option [66] and national organizations were second [73], while Vignola et al. (2013) reported that government was the major responsible actor against climate change, followed by local citizens [74].
3.5. Barriers to Climate Change Adaptation
Table 3 shows the combined responses for all studied regions about barriers to climate adaptation. The question was structured as multi-response, so more than one answer was expected from the respondents.
3.5.1. Lack of Knowledge
Lack of knowledge (18.6%) and illiteracy (10.7%) were identified as the main hurdles to taking measures against climate change vulnerability. Here, lack of knowledge encompasses all information about changes in weather patterns and climate, while illiteracy represents a lack of overall education. The literacy rate of the respondents is quite low, which corresponds to little knowledge about climate change vulnerability in the study area. The interview results show that most of the respondents were aware of how the weather is changing, but unaware of the term “climate change”. They attributed climate change to the cutting of trees and vehicle pollution contributing to increased air temperature.
3.5.2. Lack of Access to Information
The second hindrance to climate adaptation efforts in the study area is the lack of access to information (17.7%). The study area lacks basic communication facilities, which can help to provide required knowledge about climate change. For instance, the interview data show that many respondents were angry about the unavailability of electricity (most of the area lacks electricity, either because of severe power outages or load shedding). For that reason, respondents expressed that they do not have access to electronic media, especially television and the Internet, so they do not have up-to-date knowledge about changes in weather patterns and other relevant information.
3.5.3. Population Growth
Population growth (16.4%) is another main hurdle to climate change adaptation efforts in Swat District. The population of Swat was 1.26 million as reported by 1998 population census and a further increase of 1.05 million with an annual growth rate of 3.24% was estimated by the 2017 census [39]. Population growth is closely correlated with the consumption of fossil fuels, deforestation, and extraction of natural resources in the research region. The interview results showed that respondents believed that during the past 30 years, the increased population has resulted in environmental damage, thus contributing to climate change. Agricultural land has been converted into residential areas, and even “encroachments” in the floodplains [75]. Moreover, increased dairy animal farming is resulting in overgrazing. These issues have contributed to increased runoff and soil erosion, decreased soil fertility, and siltation problems in the region.
3.5.4. Economic Barriers
Economic barriers have a major role among the barriers to the climate adaptation efforts in the area. A limited area is available for agriculture, as pointed out by 11.3% of respondents, which is forcing farmers to rely on sustenance agriculture. Similarly, the land tenure system is not farmer-friendly, as identified by 0.7% of respondents. Other problems include soil fertility (0.5%) and poor seeds (0.4%), which do now allow them to pay attention to climate change adaptation. Most of the district comprises mountains, rivers/streams, and built-up areas, thus leaving very little space for agricultural lands. Due to few income-generating resources, residents in the study area cannot bear the pressure from environmental or climate change. Some of the respondents indicated that they do not have access to good quality seeds from the government, resulting in lower yields, which puts pressure on their economic status.
3.5.5. Governance Barriers
Participants indicated that a lack of government oversight is negatively affecting actions against climate change. Corruption in the government system (6.2%) and a lack of government interest (2.8%) were the main reported issues. Despite tighter government restrictions on forest cutting, it is still happening due to negligence and corruption in the system. The political structure is not effective in coping with climate change, which is evident from the fact that most of the access roads and drainage systems damaged earlier in the Upper Swat region have not been rehabilitated by the government. This adds to the low accessibility of residents and exposure to health risks and food shortages in the area.
3.5.6. Social Barriers
Lack of awareness, as pointed out by 5.8% of respondents, is yet another problem to understand in order to cope with climate change. Clearly, the lack of knowledge about the causes of climate change is a huge hindrance for successful adaptation strategies. Despite the desperate situation, Pakistan is facing due to global climate change, there is a lack of understanding among children and youth about the evolving situation.
4. Conclusions and Policy Recommendations
Pakistan in general and Swat District, in particular, are very vulnerable to both manmade and natural disasters. We assessed climate-induced hazards in Swat and public beliefs about their causes and impacts using multiple climate indicators. We find enough evidence to indicate that the climate of the region is changing in a major way, which is what most of the participants indicated. That included temperature rise, changes in rainfall pattern, increase in extreme weather events, changes in biodiversity, and melting of the ice caps. The major perceived causes of climate change included deforestation, burning of fossil fuels, and natural causes. As the local community is mostly dependent on natural resources, sustainable utilization of these resources (particularly forest resources) remains a challenge. Due to population increase and low socioeconomic conditions, the demand for available forest resources has increased over the past few decades. As evident from the study, an increase in multiple adverse weather conditions has occurred over the past decades. The findings confirm that demographic attributes play a significant role in interpreting climate beliefs and perceptions of a community. These perceptions are influenced by age, education, and income levels. Thus, the elderly people are more knowledgeable/informed about the causes and effects of climate change due to their experience and long observance of the climate system of the area.
Adapting to the changing climate could save the lives and livelihoods of many peoples in this region. Evidently two adaptation strategies can offset the negative impacts of climate change: planting more trees and pollution control. The barriers to addressing vulnerabilities should be removed with certain measures. The barriers identified by the current study include a lack of knowledge, population growth, and economic, social, and governance barriers. These barriers to addressing vulnerabilities need to be overcome through various approaches. This will pave the way for sustainable development in the Hindukush Himalayan Mountains of northern Pakistan. In addition, it will also help in preparing for, responding to, and mitigating the future negative impacts of climate change and associated natural disasters in this part of the world.
This research makes the following recommendations to be made part of future provincial and local government policies:
- (a)
- The role of environmental institutions should be enhanced at the provincial level and extended to the district level. Moreover, international organizations should be encouraged to become an active part of the planning process and bring their diverse expertise in climate adaptation measures to the area.
- (b)
- Forest cover should be increased to the international standard of 25% in the whole province. The government should take steps to stop deforestation and forest damage by enforcing regulations and penalties. Moreover, steps should be taken to improve forest management and the conservation of biodiversity. The afforestation projects initiated by the provincial government such as the billion-tree afforestation project [76,77] should be implemented in true letter and spirit.
- (c)
- The government should take steps to include the topic of climate change at various levels of curricula, and to equip students as future planners for better decision-making and awareness.
- (d)
- Capacity-building sessions should be conducted by the government and non-governmental organizations through workshops, training, and symposia targeting local elders and representatives, religious leaders, and politicians to equip them with information about climate change and related hazards in their respective areas. Moreover, the sessions should be extended to those vulnerable groups whose livelihoods depend on natural resources.
- (e)
- The public should be made aware of the importance of forests, the negative effects of deforestation, and how to take care of these resources using individual and communal efforts.
- (f)
- Energy efficiency at the individual level by changes in lifestyle should be practiced. Energy-efficient homes with lower dependence on non-renewable energy should be developed as part of climate change mitigation.
Author Contributions
Conceptualization, M.S.B. and M.N.; methodology, M.S.B., M.N. and M.M.; software, M.S.B.; data curation, M.S.B., Z.K. and M.M.; writing—original draft preparation, M.S.B.; writing—review and editing, M.M., Z.K. and M.N; supervision, M.N. All authors have read and agreed to the published version of the manuscript.
Funding
This research received no external funding.
Institutional Review Board Statement
Not Applicable.
Informed Consent Statement
Informed consent was obtained from all subjects involved in the study.
Data Availability Statement
Not Applicable.
Conflicts of Interest
The authors declare no conflict of interest.
References
- Working Group I of the IPCC. Working Group I of the IPCC. Summary for policymakers. In Climate Change 2013: The Physical Science Basis. Contribution of Working Group I to the Fifth Assessment Report of the Intergovernmental Panel on Climate Change.; Stocker, T.F., Qin, D., Plattner, G.-K., Tignor, M.M.B., Allen, S.K., Boschung, J., Nauels, A., Xia, Y., Bex, V., Midgley, P.M., Eds.; Cambridge University Press: Cambridge, UK; New York, NY, USA, 2014; pp. 3–32. [Google Scholar]
- Abbas, Z. Climate change, poverty and environmental crisis in the disaster-prone areas of Pakistan: Community-based approach. Clim. Chang. Resil. 2009, 5, 1–96. [Google Scholar]
- Khan, J.A. Changing climatic patterns and their impacts with special focus on Pakistan. In Proceedings of the Symposium on Changing Environmental Pattern and its impact with Special Focus on Pakistan, Pakistan Engineering Congress, Lahore, Pakistan, July 2011; Volume 285, pp. 22–34. Available online: https://pecongress.org.pk/images/upload/books/3-Changing%20Climate%20Patterns%20and%20their%20Impacts%20with%20Special%20Foc.pdf (accessed on 5 December 2020).
- Farooqi, A.B.; Khan, A.H.; Mir, H. Climate change perspective in Pakistan. Pak. J. Met. 2005, 2, 11–21. [Google Scholar]
- Chaudhry, A.U. Higher-value organics. Pak. Gulf. Econ. 2005, 15, 35–38. [Google Scholar]
- Salma, S.; Rehman, S.; Shah, M.A.; Badshah, S. Temperature trends in different climatic zones of Pakistan. J. Sci. Tech. 2010, 34, 59–72. [Google Scholar]
- Yu, H.; Wang, B.; Zhang, Y.J.; Wang, S.; Wei, Y.M. Public perception of climate change in China: Results from the questionnaire survey. Nat. Hazards 2013, 69, 459–472. [Google Scholar] [CrossRef]
- Government of Pakistan. Planning machinery in Pakistan. In Manual for Development Projects; Planning Commission: Islamabad, Pakistan, 2010; pp. 9–15. [Google Scholar]
- Ullah, W.; Takaaki, N. Climate change vulnerability of Pakistan towards natural disasters: A review. Int. J. Environ. Prot. Policy 2016, 4, 1–7. [Google Scholar] [CrossRef] [Green Version]
- Eckstein, D.; Kunzel, V.; Schafer, L. Global Climate Risk Index 2018: Who suffers most from extreme weather events? Weather-related loss events in 2016 and 1997 to 2016. Germanwatch 2018, 1–36. Available online: https://reliefweb.int/report/haiti/global-climate-risk-index-2018-who-suffers-most-extreme-weather-events-weather-related (accessed on 5 December 2020).
- Asian Development Bank. Pakistan Floods (2010) Damage and Needs Assessment; Technical Assistance Completion Report; ADB: Islamabad, Pakistan, 2010; Available online: https://www.adb.org/projects/documents/pakistan-floods-2010-damage-and-needs-assessment (accessed on 15 December 2020).
- Rehman, A.-U.; Khan, A.N. Analysis of flood causes and associated socio-economic damages in the Hindukush region. Nat. Hazards 2011, 59, 1239–1260. [Google Scholar]
- Chaudhry, Q. Climate Change Profile of Pakistan; Asian Development Bank: Manila, Philippines, 2017. [Google Scholar]
- Deng, M.; Qin, D.; Zhang, H. Public perceptions of climate and cryosphere change in typical arid inland river areas of China: Facts, impacts and selections of adaptation measures. Quat. Int. 2012, 282, 48–57. [Google Scholar] [CrossRef]
- Lorenzoni, I.; Pidgeon, N.F. Public views on climate change: European and USA perspectives. Clim. Chang. 2006, 77, 73–95. [Google Scholar] [CrossRef]
- Niles, M.T.; Mueller, N.D. Farmer perceptions of climate change: Associations with observed temperature and precipitation trends, irrigation, and climate beliefs. Glob. Environ. Chang. 2016, 39, 133–142. [Google Scholar] [CrossRef] [Green Version]
- Spence, W.; Poortinga, C.B.; Pidgeon, N.F. Perceptions of climate change and willingness to save energy related to flood experience A. Nat. Clim. Chang. 2011, 1, 146–149. [Google Scholar] [CrossRef] [Green Version]
- Gao, J.; Li, Y.; Fu, J.; Zhu, Y.; Ding, P. Environmental impact of sustainable environment policy: A case study from Jiuzhaigou Nature Reserve, China. Int. J. Res. Environ. Stud. 2015, 2, 21–32. [Google Scholar]
- Akerlof, K.; Maibach, E.W.; Fitzgerald, D.; Cedeno, A.Y.; Neuman, A. Do people ‘’personally experience’’ global warming, and if so how, and does it matter? Glob. Environ. Chang. 2013, 23, 81–91. [Google Scholar] [CrossRef]
- Leiserowitz, A.; Maibach, E.; Roser-Renouf, C.; Smith, N. Climate Change in the American Mind: Americans’ Global Warming Beliefs and Attitudes in June 2010. Yale University and George Mason University. New Haven, CT: Yale Project on Climate Change Communication. Available online: http://environment.yale.edu/climate/files/ClimateBeliefsJune2010.pdf (accessed on 5 December 2020).
- Bord, R.J.; Fisher, A.; O’Connor, R.E. Public perceptions of global warming: United States and international perspectives. Clim. Res. 1998, 11, 75–84. [Google Scholar] [CrossRef]
- Hossain, M.N.; Chowdhury, S.; Paul, S.K. Farmer-level adaptation to climate change and agricultural drought: Empirical evidences from the Barind region of Bangladesh. Nat. Hazards 2016, 83, 1007–1026. [Google Scholar] [CrossRef]
- Enete, A.A.; Madu, I.I.; Mojekwu, J.C.; Onyekuru, A.N.; Onwubuya, E.A.; Eze, F. Indigenous Agricultural Adaptation to Climate Change: Study of Southeast Nigeria. Afr. Technol. Policy Stud. Netw. 2011, 2, 6–37. [Google Scholar]
- Gentle, P.; Maraseni, T.N. Climate change, poverty and livelihoods: Adaptation practices by rural mountain communities in Nepal. Environ. Sci. Pol. 2012, 21, 24–34. [Google Scholar] [CrossRef]
- Islam, M.M.; Sallu, S.; Hubacek, K.; Paavola, J. Limits and barriers to adaptation to climate variability and change in Bangladeshi coastal fishing communities. Mar. Policy 2016, 43, 208–216. [Google Scholar] [CrossRef]
- Maryam, A.; Khan, S.; Khan, M.A.; Khan, K.; Rabbi, F.; Ali, S. The perception of local community about the effects of climate change in Upper Swat, Khyber Pakhtunkhwa, Pakistan. J. Earth Sci. Clim. Chang. 2014, 5, 183–190. [Google Scholar] [CrossRef] [Green Version]
- Panda, A. Exploring climate change perceptions, rainfall trends and perceived barriers to adaptation in a drought affected region in India. Nat. Hazards 2016, 84, 777–796. [Google Scholar] [CrossRef]
- Smit, B.; Ian, B.; Klein, R.; Wandel, J. An anatomy of adaptation to climate change and variability. Clim. Chang. 2000, 45, 223–251. [Google Scholar] [CrossRef]
- Leary, N.; Adejuwon, J.; Bailey, W.; Barros, V.; Caffera, M.; Chinvanno, S.; Conde, C.; De Comarmond, A.; De Sherbinin, A.; Downing, T.; et al. For Whom the Bell Tolls: Vulnerabilities in a Changing Climate. A Synthesis from the AIACC Project; International Start Secretariat: Washington, DC, USA, 2006; pp. 1–31. [Google Scholar]
- Bohensky, E.L.; Kirono, D.G.C.; Butler, J.R.A.; Rochester, W.; Habibi, P.; Handayani, T.; Yanuartati, Y. Climate knowledge cultures: Stakeholder perspectives on change and adaptation in Nusa Tenggara Barat. Clim. Risk Manag. 2016, 12, 17–31. [Google Scholar] [CrossRef] [Green Version]
- Ali, K.; Khan, N.; Rahman, I.; Begum, H.A.; Jury, S.; Ahmad, H. Use of multiple Phytoecological indices and multivariate approaches in the Hinduk-ush ranges of Pakistan. South Asian J. Life Sci. 2016, 4, 40–50. [Google Scholar] [CrossRef] [Green Version]
- Khan, S.; Mahmood-ul-Hasan. Climate change impacts and adaptation to flow of Swat River and glaciers in Hindu Kush Ranges, Swat District, Pakistan (2003–2013). Int. J. Econ. Environ. Geol. 2016, 7, 24–35. [Google Scholar]
- Shah, M.; Hussain, F. Conservation assessment of plant resources of Chakesar valley, district Shangla, KPK, Pakistan. Pak. J. Bot. 2012, 44, 179–186. [Google Scholar]
- Bacha, M.S.; Nafees, M.; Adnan, S. Farmers’ perceptions about climate change vulnerabilities and their adaptation measures in District Swat. Sarhad J. Agric. 2018, 34, 311–326. [Google Scholar] [CrossRef] [Green Version]
- Safdar, F.; Khokhar, F.; Arshad, M.; Adil, I.H. Climate change indicators and spatiotemporal shift in monsoon patterns in Pakistan. Adv. Met. 2019, 2019, 8281201. [Google Scholar] [CrossRef] [Green Version]
- Government of Khyber Pakhtunkhwa. Khyber Pakhtunkhwa Wildlife and Biodiversity (Protection, Preservation, Conservation and Management) Act. 2015. Available online: http://www.pakp.gov.pk/2013/wp-content/uploads/Wildlife-Biodiversity-Protection-Preservation-Conservation-and-Management-Act-2015.pdf (accessed on 6 December 2020).
- Bord, R.J.; O’Connor, R.E.; Fisher, A. In what sense does the public need to understand global climate change? Public. Underst. Sci. 2000, 9, 205–218. [Google Scholar] [CrossRef]
- Lorenzoni, I.; Nicholson-Cole, S.; Whitmarsh, L. Barriers perceived to engaging with climate change among the UK public and their policy implications. Glob. Environ. Chang. 2007, 17, 445–459. [Google Scholar] [CrossRef]
- Government of Pakistan. District Census Report of Swat; Statistics Division, Population Census Organization: Islamabad, Pakistan, 1999.
- Bangash, S. Socio-economic conditions of post-conflict Swat: A critical appraisal. J. Peace Dev. 2012, 2, 66–79. [Google Scholar]
- Dahri, Z.H.; Ahmad, B.; Leach, J.H.; Ahmad, S. Satellite-based snow cover distribution and associated snowmelt runoff modeling in Swat River Basin of Pakistan. Proc. Pak. Acad. Sci. 2011, 48, 19–32. [Google Scholar]
- Istituto Agronomico per l’Oltremare (IAO) and Government of Khyber Pakhtunkhwa. Atlas of Natural Resources Evaluation in Swat Valley, Khyber Pakhtunkhwa, Islamic Republic of Pakistan; Agriculture, Livestock and Cooperation Department, Government of Khyber Pakhtunkhwa. 2013. Available online: https://studylib.net/doc/18778584/adp-swat-1---atlas-of-the-natural-resources-evaluation (accessed on 5 December 2020).
- Sabir, M.A. Evaluation of Surface Water Resources and Sediment Load in Indus and Swat Kohistan North Pakistan. Ph.D. Thesis, University of Peshawar, Khyber Pakhtunkhwa, Pakistan, 2002. Available online: http://prr.hec.gov.pk/jspui/handle/123456789/3687 (accessed on 5 December 2020).
- Khan, S.R.; Khan, S.R. Assessing poverty–deforestation links: Evidence from Swat, Pakistan. Ecol. Econ. 2009, 68, 2607–2618. [Google Scholar] [CrossRef]
- Sajjad, A.; Hussain, A.; Wahab, U.; Adnan, S.; Ali, S.; Ahmad, Z.; Ali, A. Application of remote sensing and GIS in forest cover change in Tehsil Barawal, District Dir, Pakistan. Am. J. Plant. Sci. 2015, 6, 1501–1508. [Google Scholar] [CrossRef] [Green Version]
- Sarah, C.; Kathrin, C.; Ann, R.; Guro, H.; Anthony, A.; Aziz, S. The case study approach. Med. Res. Method. 2011, 11, 100–105. [Google Scholar]
- Batool, H.; Ali, W.; Manzoor, R.; Mahmood, N. Women’s Perception of Climate Change and Coping Strategies in Pakistan: An Empirical Evidence. Earth Syst. Environ. 2018, 2, 609–619. [Google Scholar] [CrossRef]
- Alibašić, H. The Administrative and Ethical Considerations of Climate Resilience: The Politics and Consequences of Climate Change. Public Integr. 2020, 1, 1–10. [Google Scholar] [CrossRef]
- Alibašić, H. Sustainability and Resilience Planning for Local Governments: The Quadruple Bottom Line Strategy; Springer: Cham, Switzerland, 2018; pp. 1–116. [Google Scholar]
- Debela, N.; Mohammed, C.; Bridle, K.; Corkrey, R.; McNeil, D. Perception of climate change and its impact by smallholders in pastoral/agropastoral systems of Borana, South Ethiopia. SPR Plus 2015, 4, 236. [Google Scholar] [CrossRef] [PubMed] [Green Version]
- Sekaran, S.; Russell, G.; Foster, R.; Lucas, M.; Hankin, W. Calcium imaging reveals a network of intrinsically light-sensitive inner-retinal neurons. Curr. Biol. 2003, 13, 1290–1298. [Google Scholar] [CrossRef]
- Rosenzweig, C.; Iglesias, A.; Yang, X.B.; Epstein, P.R.; Chivian, E. Climate change and extreme weather events; Implications for food production, plant diseases, and pests. Glob. Chang. Hum. Health 2001, 2, 90–104. [Google Scholar] [CrossRef]
- Meehl, G.A.; Thomas, K.; Easterling, D.R.; Changnon, S. An introduction to trends in extreme weather and climate events: Observations, socioeconomic impacts, terrestrial ecological impacts, and model projections. Bull. Am. Met. Soc. 2000, 81, 413–420. [Google Scholar] [CrossRef] [Green Version]
- Mirza, M.M.Q. Climate change and extreme weather events: Can developing countries adapt? Clim. Policy 2003, 3, 233–248. [Google Scholar] [CrossRef]
- Araújo, M.B.; Rahbek, C. How does climate change affect biodiversity? Science 2006, 313, 1396–1397. [Google Scholar] [CrossRef] [PubMed]
- Willis, K.J.; Bhagwat, S.A. Biodiversity and climate change. Science 2009, 326, 806–807. [Google Scholar] [CrossRef]
- Qasim, M.; Hubacek, K.; Termansen, M. Underlying and proximate driving causes of land use change in district Swat, Pakistan. Land Use Pol. 2013, 34, 146–157. [Google Scholar] [CrossRef]
- Shahbaz, B.; Ali, T.; Suleri, A.Q. A critical analysis of forest policies of Pakistan: Implications for sustainable livelihoods. Mitig. Adapt. Strateg. Glob. Chang. 2007, 12, 441–453. [Google Scholar] [CrossRef]
- Shahbaz, B.; Geiser, U.; Suleri Abid, Q. Forests, livelihoods and power relations in North-West Pakistan: Introduction, insights gained and challenges ahead. In Forests, Livelihoods and Power Relations in North-West Pakistan; Sang-e-Meel Publications: Lahore, Pakistan, 2013; pp. 11–34. [Google Scholar]
- Kruseman, G.; Pellegrini, L. 11 Institutions and forest management in the Swat region of Pakistan. In Nature’s Wealth: The Economics of Ecosystem and Poverty; Cambridge University Press: New York, NY, USA, 2013; pp. 255–260. [Google Scholar]
- Khan, O.J.; Muhammad, B.; Ali, T.; Ali, M.S. Underlying factors of deforestation and its effects in Sanger Valley District Swat. J. Biodivers. Environ. Sci. 2019, 15, 14–28. [Google Scholar]
- Pellegrini, L. The rule of the jungle in Pakistan: A case study on corruption and forest management in Swat. In Corruption, Development and the Environment; Springer: Dordrecht, The Netherlands, 2011; pp. 121–147. [Google Scholar]
- Qasim, S.; Khan, A.N.; Shrestha, R.P.; Qasim, M. Risk perception of the people in the flood prone Khyber Pukhthunkhwa province of Pakistan. Int. J. Dis. Risk Red. 2014, 14, 373–378. [Google Scholar] [CrossRef]
- Haq, S.M.A.; Ahmed, K.J. Does the perception of climate change vary with the socio-demographic dimensions? A study on vulnerable populations in Bangladesh. Nat. Hazards 2017, 85, 1759–1785. [Google Scholar] [CrossRef]
- Whitmarsh, L.E. A study of public understanding of and response to climate change in the South of England. Ph.D. Thesis, University of Bath, Bath, UK, 2005. [Google Scholar]
- Whitmarsh, L. Are flood victims more concerned about climate change than other people? The role of direct experience in risk perception and behavioural response. J. Risk Res. 2008, 11, 351–374. [Google Scholar] [CrossRef]
- Kabir, M.I.; Rahman, M.B.; Smith, W.; Lusha, M.A.F.; Azim, S.; Milton, A.H. Knowledge and perception about climate change and human health: Findings from a baseline survey among vulnerable communities in Bangladesh. BMC Public Health 2016, 16, 266–270. [Google Scholar] [CrossRef] [Green Version]
- Howe, P.D.; Leiserowitz, A. Who remembers a hot summer or a cold winter? The asymmetric effect of beliefs about global warming on perceptions of local climate conditions in the US. Glob. Environ. Chang. 2013, 23, 1488–1500. [Google Scholar] [CrossRef]
- Liu, Z.; Smith, W.J.; Safi, A.S. Rancher and farmer perceptions of climate change in Nevada, USA. Clim. Chang. 2014, 122, 313–327. [Google Scholar] [CrossRef]
- Bhikhoo, N.; Hashemi, A.; Cruickshank, H. Improving thermal comfort of low-income housing in Thailand through passive design strategies. Sustainability 2017, 9, 1440. [Google Scholar] [CrossRef] [Green Version]
- Hashemi, A. Climate resilient low-income tropical housing. Energies 2016, 9, 468. [Google Scholar] [CrossRef] [Green Version]
- Wolf, J.; Moser, S.C. Individual understandings, perceptions, and engagement with climate change: Insights from in-depth studies across the world. Wiley Interdiscip. Rev. Clim. Chang. 2011, 2, 547–569. [Google Scholar] [CrossRef]
- Norton, A.; Leaman, J. The Day After Tomorrow: Public Opinion on Climate Change; Social Research Institute: London, UK, 2004. [Google Scholar]
- Vignola, R.; Klinsky, S.; Tam, J.; Mc Daniels, T. Public perception, knowledge and policy support for mitigation and adaption to climate change in Costa Rica: Comparisons with North American and European studies. Mit. Adapt. Str. Glob. Chang. 2013, 18, 303–323. [Google Scholar] [CrossRef]
- Ahmad, H.; Öztürk, M.; Ahmad, W.; Khan, S.M. Status of natural resources in the uplands of the Swat Valley Pakistan. In Climate Change Impacts on High-Altitude Ecosyst; Springer International Publishing: New York, NY, USA, 2015; pp. 49–98. [Google Scholar]
- Kamal, A.; Yingjie, M.; Ali, A. Significance of billion tree tsunami afforestation project and legal developments in forest sector of Pakistan. Int. J. Law Soc. 2019, 1, 157–165. [Google Scholar]
- Khan, N.; Shah, S.J.; Rauf, T.; Zada, M.; Yukun, C.; Harbi, J. Socioeconomic impacts of the billion trees afforestation program in Khyber Pakhtunkhwa Province, Pakistan. Forests 2019, 10, 703. [Google Scholar] [CrossRef] [Green Version]
Figure 1.
Research framework.

Figure 2.
Swat District.

Figure 3.
Public perceptions about recognizing climate change in Swat District.

Figure 4.
Public perceptions about causes of climate change in Swat District.

Figure 5.
Public perceptions about climate change vulnerability in study area.

Figure 6.
Public perceptions of sources of information about climate change in Swat District.

Figure 7.
Public observations of changes in climate indicators.

Figure 8.
Temporal changes in climate indicators as observed by study participants (reported by age group).
Figure 8.
Temporal changes in climate indicators as observed by study participants (reported by age group).

Figure 9.
Respondents’ opinions about tackling climate change.

Figure 10.
Opinions of respondents about taking actions to tackle climate change.

Figure 11.
Respondents’ opinions about the responsibility for acting against climate change.


Table 1.
Sample size for current study.
| Lower Swat East | Lower Swat West | Upper Swat | |||
|---|---|---|---|---|---|
| Cluster | Sample Size | Cluster | Sample Size | Cluster | Sample Size |
| Ghaligay | 20 | Shamozai | 11 | Bahrain | 39 |
| Islmampur | 19 | Udigram | 11 | Mankyal | 26 |
| Rahim Abad | 15 | Bara Banda | 6 | Kalam | 46 |
| Manglawar | 14 | Totanu Banda | 7 | Utror | 21 |
| Khawazakhela | 12 | Kala Kalay | 17 | ||
| Fatehpur | 10 | Deolai | 8 | ||
| Kishwara | 11 | Shawar | 13 | ||
| Charbagh | 19 | Bara Thana | 11 | ||
| Miandam | 12 | Gowalairaj | 14 | ||
| Chuprial | 15 | ||||
| Asharay | 6 | ||||
| Sakhra | 13 | ||||
| Total | 132 | 132 | 132 | ||
Table 2.
Socioeconomic characteristics of survey respondents. US, Upper Swat; LSE, Lower Swat East; LSW, Lower Swat West.
Table 2.
Socioeconomic characteristics of survey respondents. US, Upper Swat; LSE, Lower Swat East; LSW, Lower Swat West.
| Variables | Categories | US (%) | LSE (%) | LSW (%) |
|---|---|---|---|---|
| Household Size (Persons) | 11 | 12 | 11 | |
| Age | 21–30 years | 23.5 | 23.5 | 18.9 |
| 31–40 years | 44.7 | 34.1 | 33.3 | |
| 41–50 years | 25.0 | 25.0 | 24.2 | |
| 51 years and above | 6.8 | 17.4 | 23.5 | |
| Education | No formal education | 43.2 | 53 | 58.3 |
| Primary education (5 years) | 31.8 | 28.8 | 15.9 | |
| Secondary education (10 years) | 14.4 | 11.4 | 11.4 | |
| Intermediate and above (12 years or more) | 10.6 | 6.8 | 14.4 | |
| Monthly Income (PKR; 1 USD = 160 PKR) | Up to 20,000 (low) | 75.8 | 51.5 | 40.8 |
| 20,001–40,000 (medium) | 19.7 | 41.7 | 46.9 | |
| >40,000 (high) | 4.5 | 6.8 | 12.3 |
Table 3.
Main barriers to adaptation efforts against climate change in study area.
| Barriers to Adaptation | N * | Percent (%) |
|---|---|---|
| Lack of knowledge | 597 | 18.6 |
| Illiteracy | 342 | 10.7 |
| Lack of access to information | 568 | 17.7 |
| Population growth | 527 | 16.4 |
| Economic Barriers | ||
| Insufficient cultivatable land | 361 | 11.3 |
| Lack of proper technology | 235 | 7.3 |
| Lack of technical know-how | 140 | 4.4 |
| Land tenure | 24 | 0.7 |
| Low soil quality | 15 | 0.5 |
| Poor seeds | 14 | 0.4 |
| Governance Barriers | ||
| Corruption | 65 | 2.0 |
| Govt. incompetence/lack of govt. interest | 29 | 0.9 |
| Social Barriers | ||
| Lack of awareness about climate change | 187 | 5.8 |
| Other measures | 102 | 3.2 |
| Total | 3206 | 100.0 |
* Total number of responses exceeds sample size because more than one answer was permissible.
Publisher’s Note: MDPI stays neutral with regard to jurisdictional claims in published maps and institutional affiliations. |
© 2021 by the authors. Licensee MDPI, Basel, Switzerland. This article is an open access article distributed under the terms and conditions of the Creative Commons Attribution (CC BY) license (https://creativecommons.org/licenses/by/4.0/).
Share and Cite
MDPI and ACS Style
Bacha, M.S.; Muhammad, M.; Kılıç, Z.; Nafees, M. The Dynamics of Public Perceptions and Climate Change in Swat Valley, Khyber Pakhtunkhwa, Pakistan. Sustainability 2021, 13, 4464. https://0-doi-org.brum.beds.ac.uk/10.3390/su13084464
AMA Style
Bacha MS, Muhammad M, Kılıç Z, Nafees M. The Dynamics of Public Perceptions and Climate Change in Swat Valley, Khyber Pakhtunkhwa, Pakistan. Sustainability. 2021; 13(8):4464. https://0-doi-org.brum.beds.ac.uk/10.3390/su13084464
Chicago/Turabian StyleBacha, Muhammad Suleman, Muhammad Muhammad, Zeyneb Kılıç, and Muhammad Nafees. 2021. "The Dynamics of Public Perceptions and Climate Change in Swat Valley, Khyber Pakhtunkhwa, Pakistan" Sustainability 13, no. 8: 4464. https://0-doi-org.brum.beds.ac.uk/10.3390/su13084464
Note that from the first issue of 2016, this journal uses article numbers instead of page numbers. See further details here.