Article

Particulate Matter Short-Term Exposition, Mobility Trips and COVID-19 Diffusion: A Correlation Analyses for the Italian Case Study at Urban Scale

Department of Engineering, University of Campania “Luigi Vanvitelli”, 81031 Aversa, Italy
*
Author to whom correspondence should be addressed.
Sustainability 2021, 13(8), 4553; https://0-doi-org.brum.beds.ac.uk/10.3390/su13084553
Submission received: 19 March 2021 / Revised: 16 April 2021 / Accepted: 17 April 2021 / Published: 20 April 2021

Abstract

:
The conjecture discussed in this paper was that the daily number of certified cases of COVID-19 is direct correlated to the average particular matter (PM) concentrations observed several days before when the contagions occurred (short-term effect), and this correlation is higher for areas with a higher average seasonal PM concentration, as a measure of prolonged exposure to a polluted environment (long-term effect). Furthermore, the correlations between the daily COVID-19 new cases and the mobility trips and those between the daily PM concentrations and mobility trips were also investigated. Correlation analyses were performed for the application case study consisting in 13 of the main Italian cities, through the national air quality and mobility monitoring systems. Data analyses showed that the mobility restrictions performed during the lockdown produced a significant improvement in air quality with an average PM concentrations reduction of about 15%, with maximum variations ranging between 25% and 42%. Estimation results showed a positive correlation (stronger for the more highly polluted cities) between the daily COVID-19 cases and both the daily PM concentrations and mobility trips measured about three weeks before, when probably the contagion occurred. The obtained results are original, and if confirmed in other studies, it would lay the groundwork for the definition of the main context variables which influenced the COVID-19 spread. The findings highlighted in this research also supported by the evidence in the literature and allow concluding that PM concentrations and mobility habits could be considered as potential early indicators of COVID-19 circulation in outdoor environments. However, the obtained results pose significant ethical questions about the proper urban and transportation planning; the most polluted cities have not only worst welfare for their citizens but, as highlighted in this research, could lead to a likely greater spread of current and future respiratory and/or pulmonary health emergencies. The lesson to be learned by this global pandemic will help planners to better preserve the air quality of our cities in the post-COVID-19 era.

1. Introduction

The year 2020 will probably be remembered as the year of the COVID-19 pandemic. This was caused by the pathogen SARS-CoV-2, severe acute respiratory syndrome Coronavirus 2 [1] which, in December 2019, produced a cluster of pneumonia cases in the city of Wuhan in China. The World Health Organization (WHO) at the end of January 2020 declared the COVID-19 epidemic as a public health emergency and lately, in March 2020, as a global pandemic [2]. In the spring of 2020, when in Europe the first wave of the massive virus diffusion was almost stopped, a total of about 4 million of cases and 283 thousand of deaths were confirmed worldwide [3]. Despite the fact that the risk of a second wave has already been announced in June by researchers [4,5], this outbreak seems to be more aggressive than the first one. It started globally in September 2020, with different impacts on each country, manifested by both the level of infection reached and different governmental measures to limit the diffusion of the COVID-19.
While the scientific community has mainly focused during these months on health issues to defeat this virus, other main key topics discussed in the literature aim to correlate the COVID-19 new cases and/or deaths to meteorological, air quality, and mobility variables. Precisely, research papers dealing with these topics could be grouped according, for example, to “direct” or “indirect” virus transmission mechanisms [6]. The direct diffusion, which is the prevalent one, occurs during the “social interactions” from person to person and could be controlled by limiting this social distance that, during the pandemic outbreak, has been the main implemented policy to reduce the contagion. The minimum social distance of about 1.5 m [7] is considered as a useful spatial separation among people, because most of the saliva droplets, which are the transmission vector of the virus, fall down and reach the floor and/or evaporate before covering this distance. However, recent studies have observed that this distance is not fixed (progression of social distancing) and that the coronavirus spread is a function of some context variables such as uncertainty in epidemiological reporting, imported infections from outside the national boundaries, provision of personal protective equipment, and aerodynamic effects due to the movement of people or vehicles, as well as the wind intensity and direction [8,9,10]. Furthermore, this minimum distance is also influenced by whether the face masks are used or not, with a more extensive distancing up to 10 m in indoor environments without face masks or 2 m in the presence (usage) of the commonly used face masks [11].
In addition to the papers dealing with health issues, also those on the transportation field could be grouped in researches related to the direct diffusion of the virus, because all the public transport trips do not always (almost never) guarantee the minimum social distance, which contributes to the spread of the virus, and the mobility level (e.g., quantity of trips/day) is an indirect measure of social interactions (activities to be carried out) [12,13,14,15,16]. For instance, Cartenì et al. [13] observed, for the Italian case study, how new COVID-19 cases in a day are positively related to the trips occurring three weeks before, concluding that this “threshold of 21 days could be considered as a sort of positivity detection time” and “longer than the incubation time because of possible delays between contagion and detection caused, for example, by the significant percentage of tests that prove false negative to COVID-19 or by the fraction of people who, although infected, are asymptomatic and/or initially show only mild symptoms, and therefore do not resort to health care”.
In addition to the direct causes, many authors have started to investigate the context factors that indirectly influence the spread of COVID-19, including meteorological and air quality ones. These could be related to both “long-term” and “short-term” people’s exposition. With respect to meteorological parameters, several studies have observed a short-term effect due to temperature and/or relative humidity, which positively (indirectly) influence the diffusion of COVID-19 [16,17,18,19,20,21,22,23,24]. For example, a negative linear correlation between the average temperature and the number of confirmed cases was observed in many countries [18,19,20], suggesting an increase in the transmission rate for the coldest regions.
Among the main context factors which indirectly accelerate the diffusion of the COVID-19 pandemic are the air quality and the pollution (e.g., particulate matter concentrations). Overall, many studies have observed a direct correlation between long-term exposure to outdoor air pollution (e.g., high PM concentrations) with increased risk of respiratory disease [25,26,27,28]. This means that people living in areas with a higher pollution (long-term exposition) have developed a probably chronic inflammatory stimulus which may contribute to more COVID-19 cases and/or deaths [23,29,30,31,32,33].
Furthermore, air pollutants, together with specific climatic conditions, may contribute to a longer permanence of the virus in the air, favoring also a short-term effect of the coronavirus diffusion. Indeed, the air can be a vehicle through which microbial agents move around the environment before their inhalation [34]. The air is mainly composed by gases, including carbon monoxide (CO), nitrogen oxides (NOx), ozone (O3), sulfur dioxides (SO2), some gaseous forms of metals, and micro(nano)particles. Among these, PM “contains microscopic solids or liquid droplets that are so small that they can be inhaled and cause serious health problems” [35]. PM10 and PM2.5, as well as the associated microorganisms that reach the lungs (especially those with sizes smaller than 2.5 microns), can be inhaled, allowing the virus to cause infections [36]. This phenomenon can both increase the minimum safety distance between people to avoid the contagion (social distance) and allow the virus to stay suspended in the air for longer time, increasing the risk of its inhaling. On this topic, many authors have observed a positive correlation between PM short-term exposition and health problems including the COVID-19 one [28,32,36,37,38,39,40,41]. Precisely, a positive correlation between PM concentrations and the diffusion of the COVID-19 was also observed by several researchers [11,37,42], suggesting that PM allow making easier the transport of the virus at greater distances than those considered in a “direct” people-to-people transmission.
Among the main quantitative methods proposed in the literature for estimating both the characteristics and the key variables influencing the spread of the COVID-19, there are models and indices/tests. The former includes mainly multi-variable mathematical equations that allow estimating the spread of the COVID-19 as a function of some (main) independent variables. For example, this is the case of the spatially explicit model of the COVID-19 spread in Italy, proposed by [10], which explicitly links the daily numbers of newly hospitalized COVID-19 cases to mobility habits, the timing of infection seeding, mobility restrictions, and social distancing. Reference [12] proposes a multivariable linear regression model estimating the daily new COVID-19 cases at a provincial scale as a function of socio-economic (e.g., population), geographical (e.g., population density and south of the country dummy variable), and transportation (e.g., rail transport accessibility) variables. These tools have the advantage of better describing the multitude of the main variables influencing the spread of the virus and the ability to perform scenario analyses to evaluate possible epidemic trajectories (trends) under, for example, different containment policies and/or transmission rates evolution hypothesis [9]. By contrast, these models require many detailed input variables, which are not always easily available (e.g., data on social distancing, uncertainty in epidemiological reporting, and imported infections from outside the national boundaries) for the size of the application case study (e.g., regional and/or provincial scale) and for the simulation time period (e.g., day by day data). The second estimation methods (the ones applied in this research) are the test estimations; these are mainly statistical correlation indices, allowing the evaluation of whether one or more variables are correlated to the coronavirus infections. These methods do not have the ability to describe all the main causes (variables) influencing the spread of COVID-19 but are mainly used as a preliminary quantitative evaluation (e.g., before a model estimation) to assess whether some (e.g., less impacting) context variables may be correlated to the virus spread. For example, within this purpose, several researchers have estimated correlation tests between climate variables (e.g., temperature, relative humidity, and air quality) and COVID-19 cases [17,21,25].
Given the application of the correlation test method, the conjecture investigated in this paper was that urban air quality in terms of PM concentrations has impacted on the diffusion of COVID-19 with respect to two aspects: (i) a long-term effect, in the sense that people living in areas with a higher level of PM pollution have developed a probably chronic inflammatory stimulus which may have contributed to more COVID-19 cases; (ii) a short-term effect, in the sense that the daily new COVID-19 cases are directly related to the PM concentrations measured in the day in which the contagions occur (e.g., PM suspended in mid-air as a carrier for the virus), and this time-deferred correlation analysis is the main originality of this research. Precisely, the hypothesis discussed in this research is that the daily number of certified cases of coronavirus is correlated to the average PM concentrations observed several days before (short-term effect), and this is higher for the areas with a higher average seasonal (yearly) PM concentrations, as a measure of prolonged exposure to a polluted environment (long-term effect). To the authors’ knowledge, this issue (the correlation of the daily coronavirus cases with the air quality of the day in which the contagions occurs) has not been investigated elsewhere and could significantly contribute to better clarify the context variables that influence the diffusion of the virus, also helping the proper definition of the restrictive/mitigative measures for cities and people.
The application case study took place in 13 of the main Italian cities located from north to south of the country. The proposed case study is suitable for the aim of this research, because Italy was the first European country to experience mass contagion of coronavirus, starting from the first outbreak. Furthermore, by May 2020 the first wave of the diffusion of the virus had almost stopped, resulting final and consolidated monitoring data (health, air quality, and mobility) based on the estimation analysis was performed. It was possible to analyze the huge quantities of detailed contagion data (on a daily basis), air quality measures (both PM10 and PM2.5), and population trips (mobility) observed at an urban scale and for a long time period (before, during, and after the first long lockdown), in addition to the effects of specific restrictive policies adopted by the Italian Government.
To perform the aim of the research, a correlation analysis was performed to verify the hypothesis, according to which the number of certified cases of coronavirus in a day is directly correlated to the PM concentrations measured several days before. Furthermore, the correlation between daily PM concentrations and mobility trips was also investigated to confirm, as well known in the literature, that PM is mainly produced (emitted) by road vehicles at an urban scale (secondary aim of the research). Finally, the correlation between the daily COVID-19 new cases and the mobility trips performed several days before was also tested. Estimates were made through both parametric (e.g., Pearson’s r coefficient) and nonparametric (e.g., Spearman’s ρ, Kendall’s τ, Goodman and Kruskal’s γ, and Somers’ D) correlation coefficients. The estimates performed in this research should be considered as some exploratory context variables impacting the health emergency and do not aim to identify all the main variables that have influenced the COVID-19 spread, for which a multivariables model should be estimated.
The paper is organized as follows. Section 2 is Materials and Methods; Section 3 describes and argues the main results and discussion. Finally, conclusions are reported in Section 4.

2. Materials and Methods

As stated above, the aim of the paper was to verify the influence of urban PM concentrations within the diffusion of COVID-19 in Italy. To perform this aim, the following open source database were considered for the estimates:
  • the daily COVID-19 new cases sourced from the Italian Ministry of Health (2020) [43];
  • the Italian national census data from ISTAT (2020) [44];
  • the PM10 and PM2.5 concentrations measured by the Italian Regional Environmental Protection Agency (ARPA, 2020) at an urban scale [45];
  • the COVID-19 mobility observatory of the Italian Transport Ministry (2020), collecting daily trips at an urban scale [46].
Furthermore, with the aim of describing all necessary elements for the repetitive and reproducible nature of science, the following main estimation characteristics and hypothesis were performed:
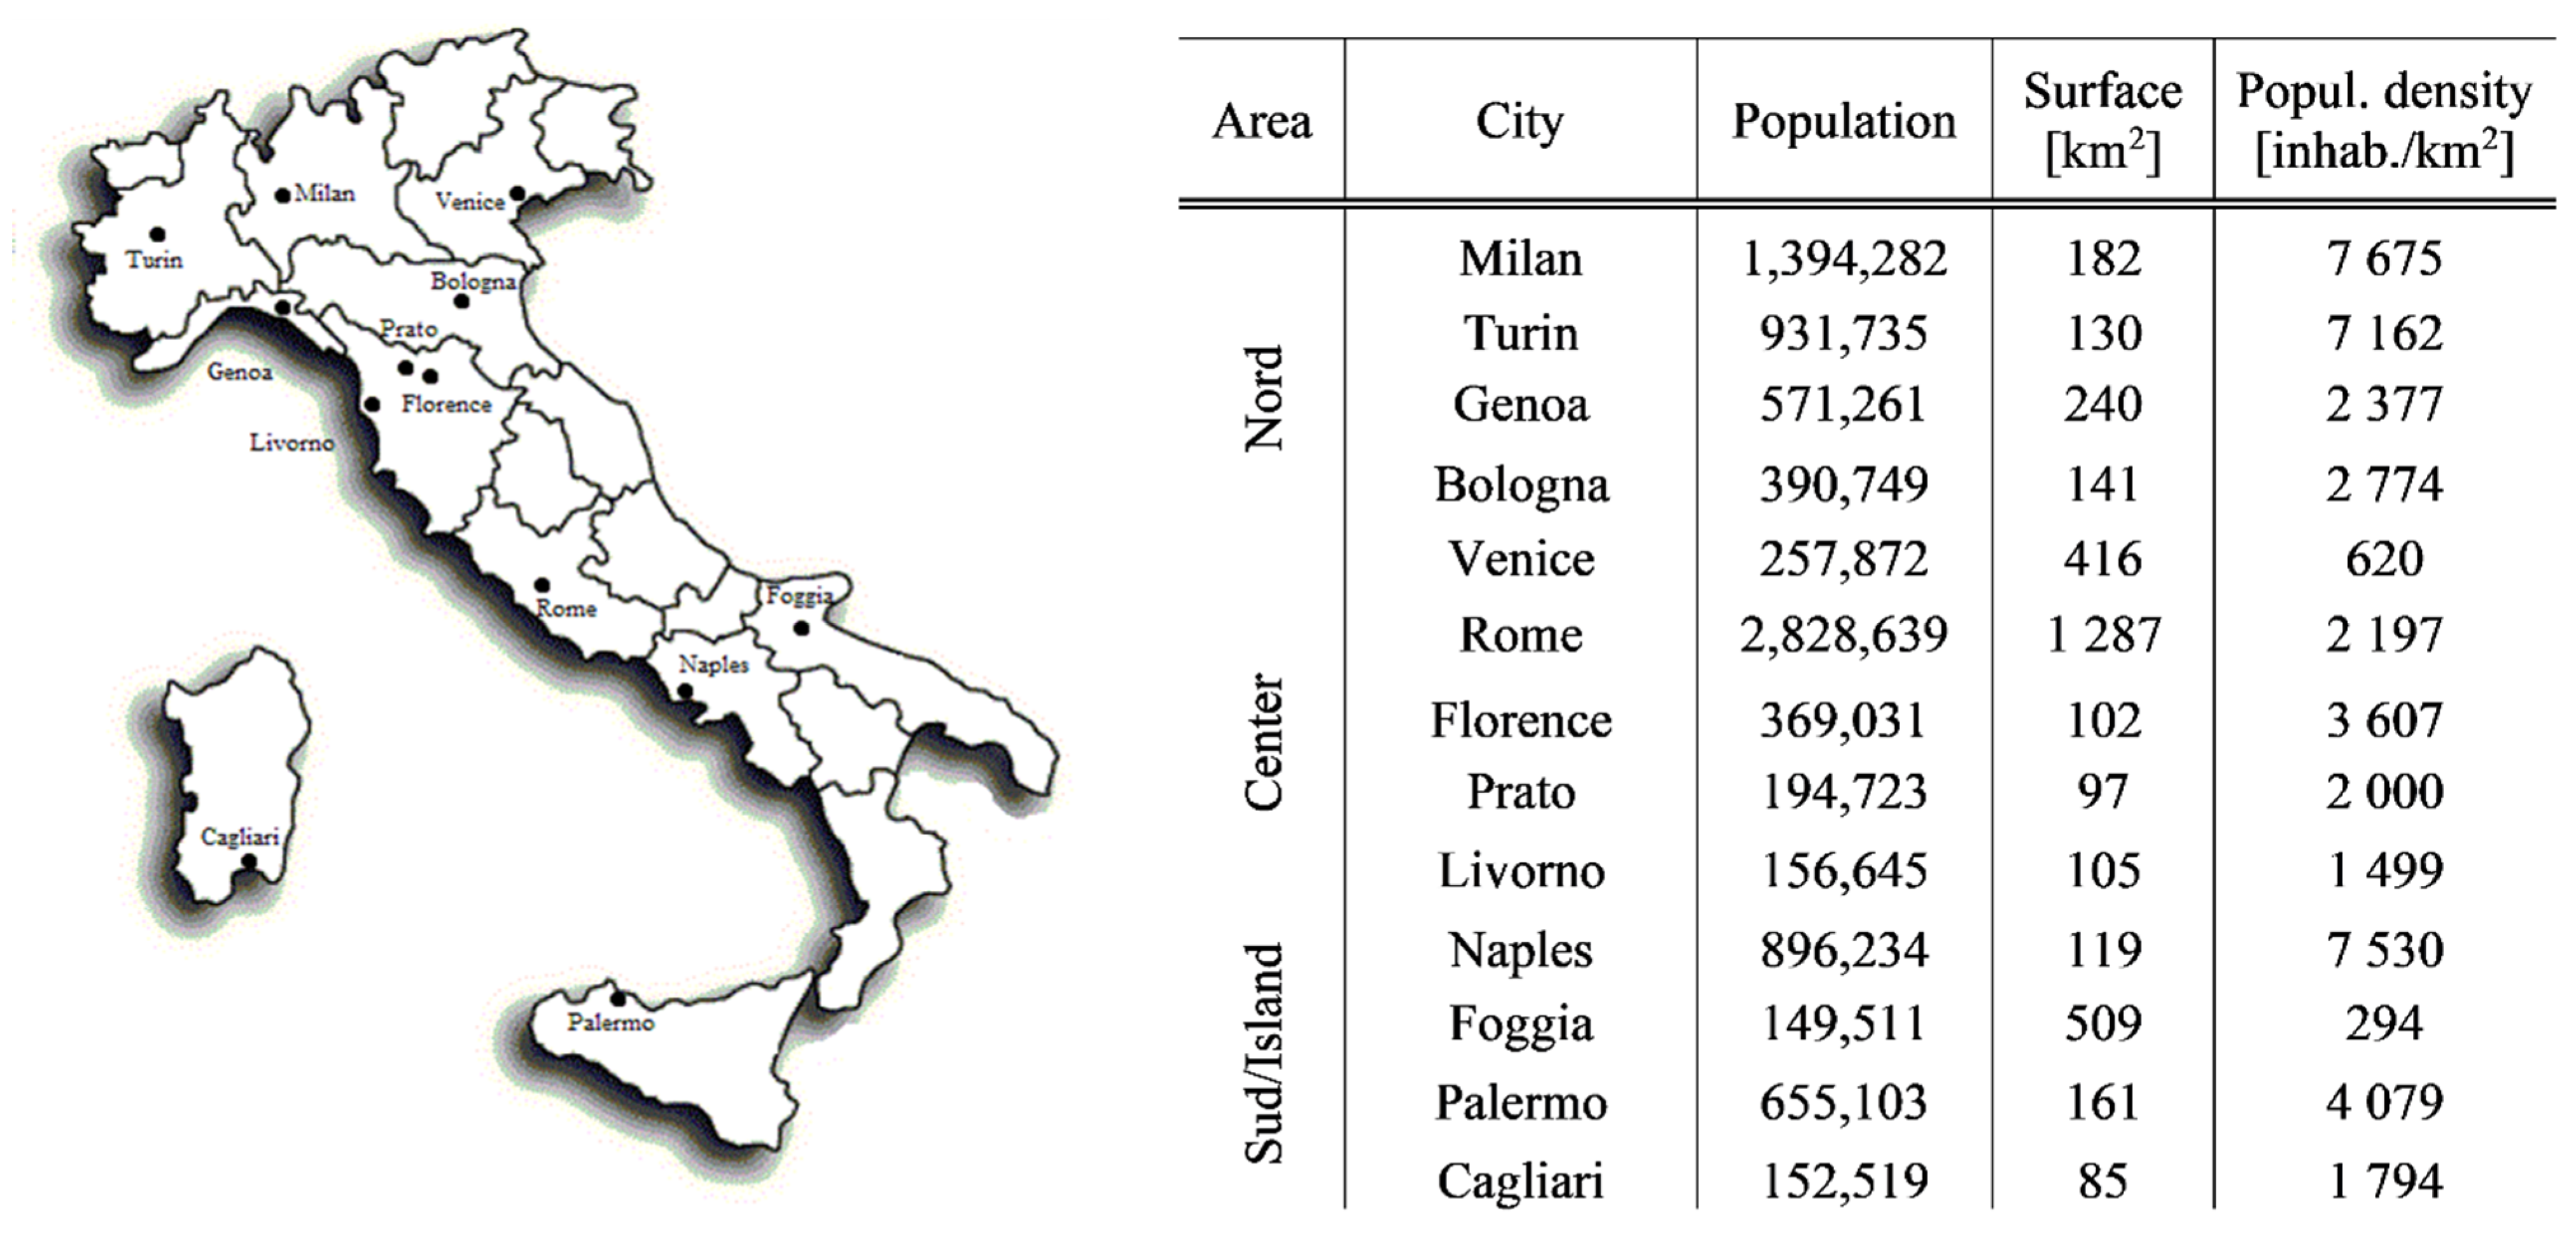
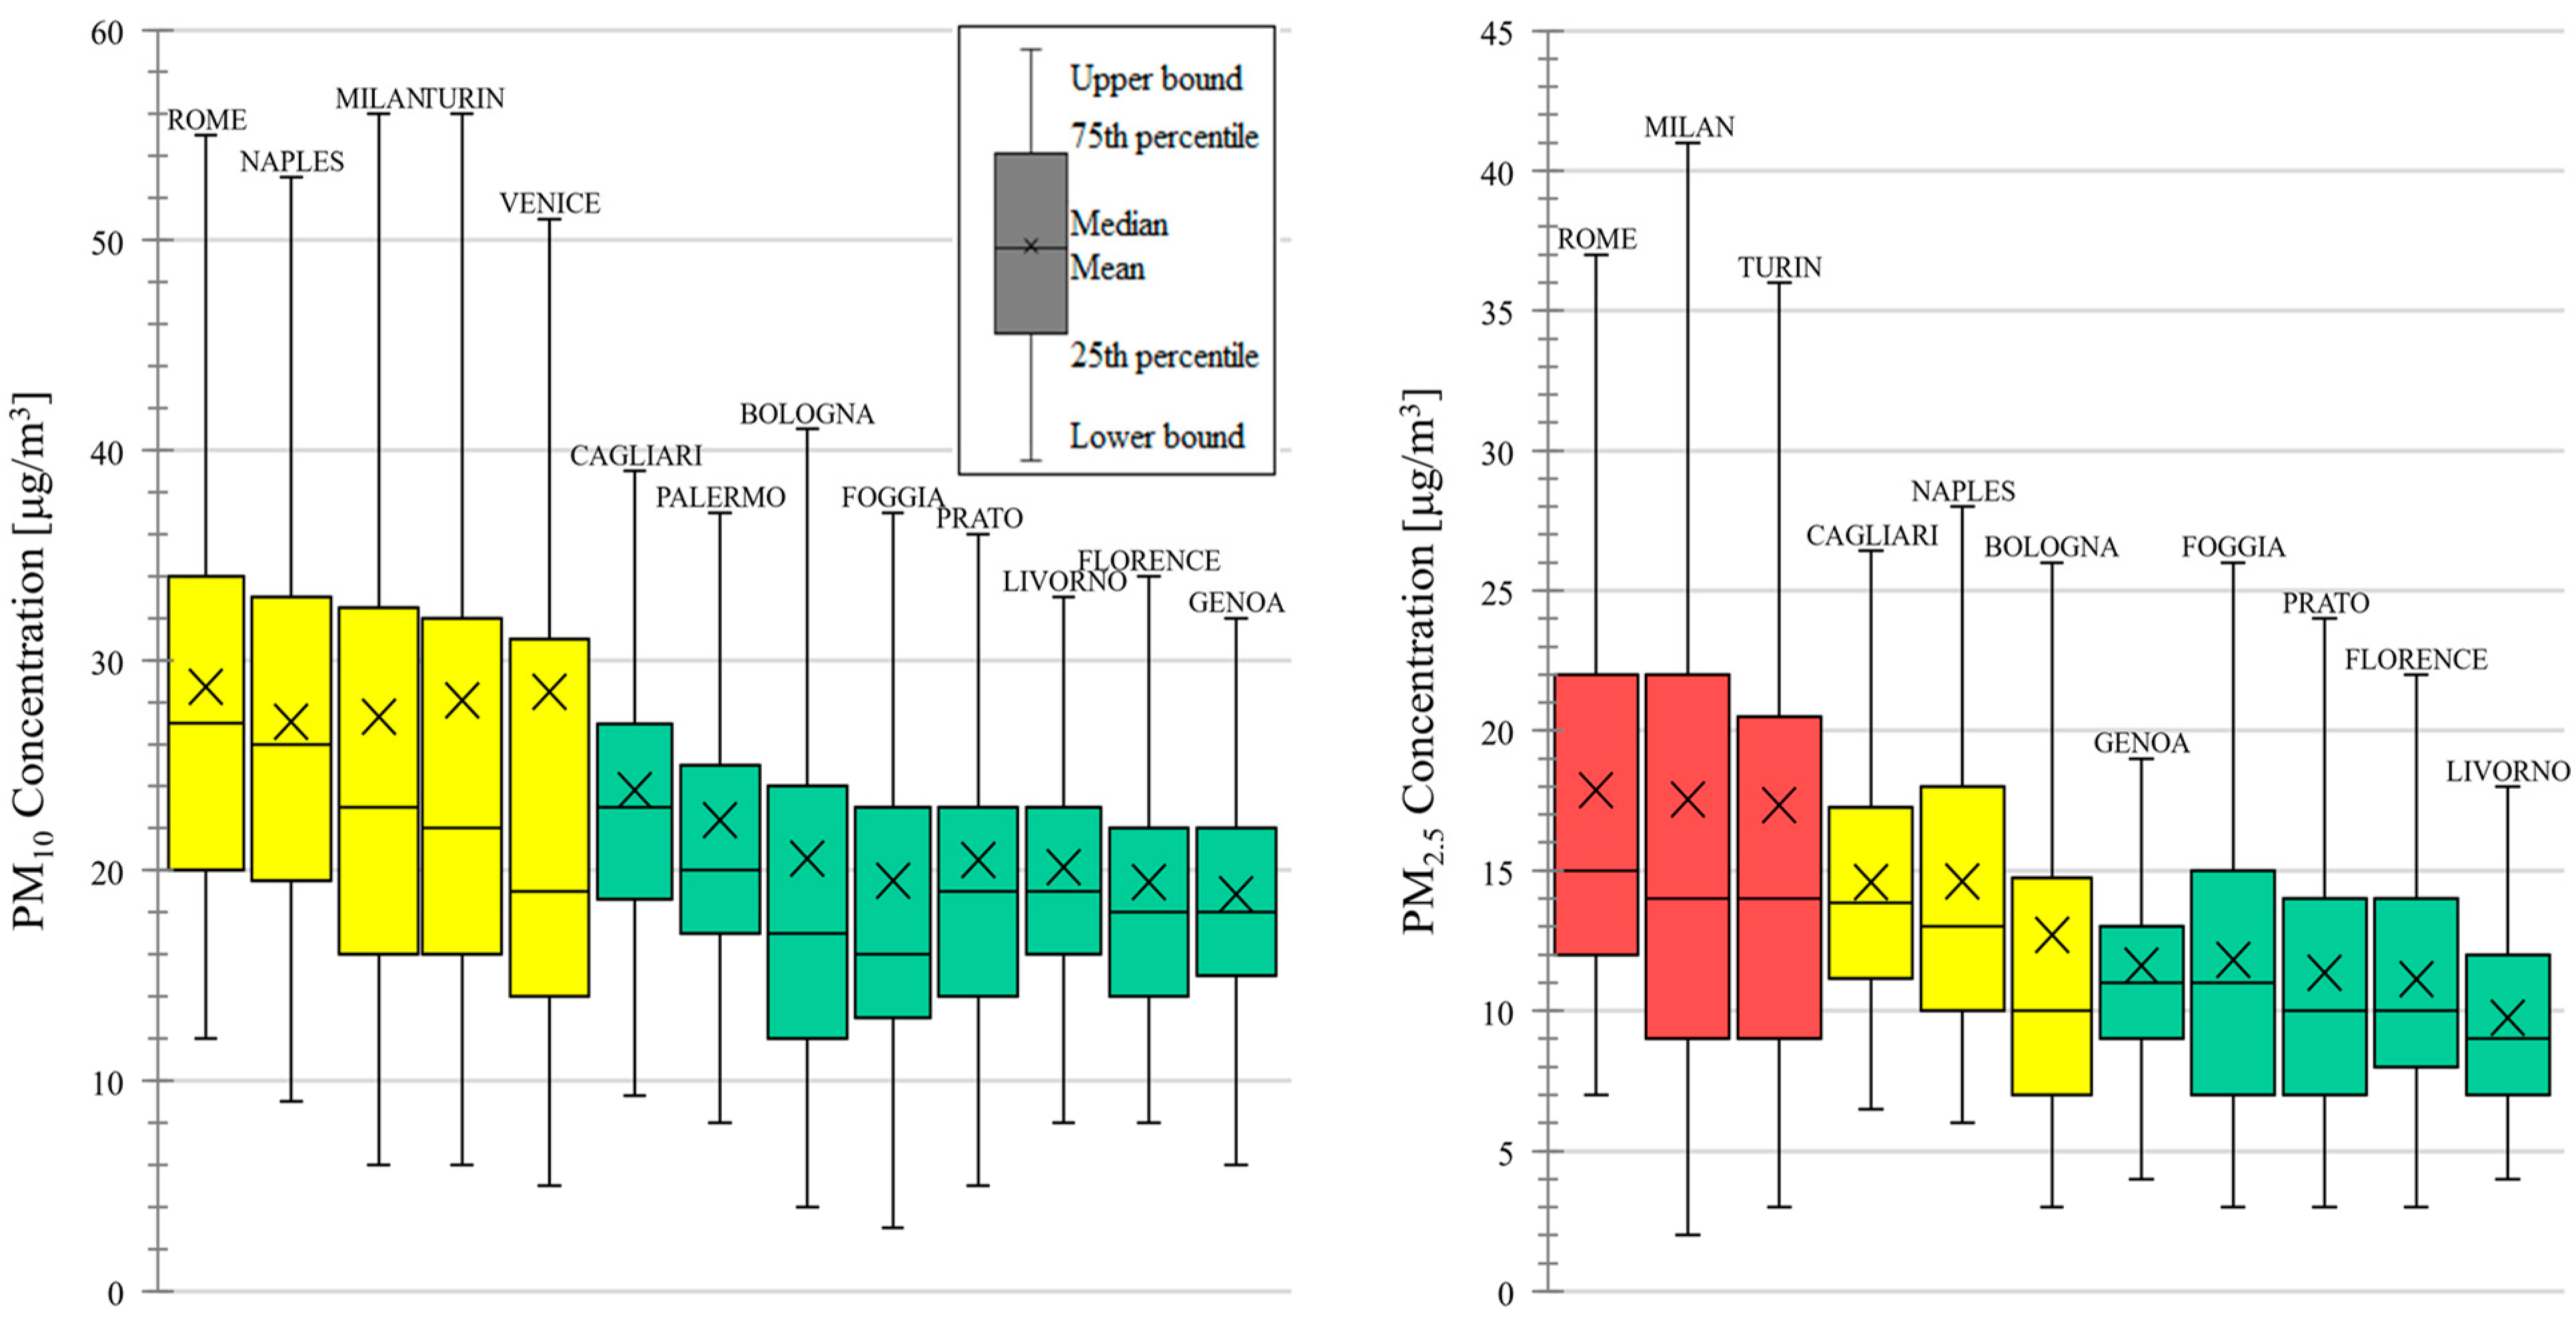
  • The territorial (zonal) aggregation level consists in 13 main Italian cities located from north to south of the country and reported in Figure 1. Both large and medium–small size cities were considered, with populations ranging from 150 thousand to 3 million inhabitants. Furthermore, the northern cities are those with higher PM concentrations (pollution), with a colder and wetter climate; the cities in the south, instead, and especially those located on the coast have a warmer climate with a lower average seasonal PM pollution (see results in Figure 2);
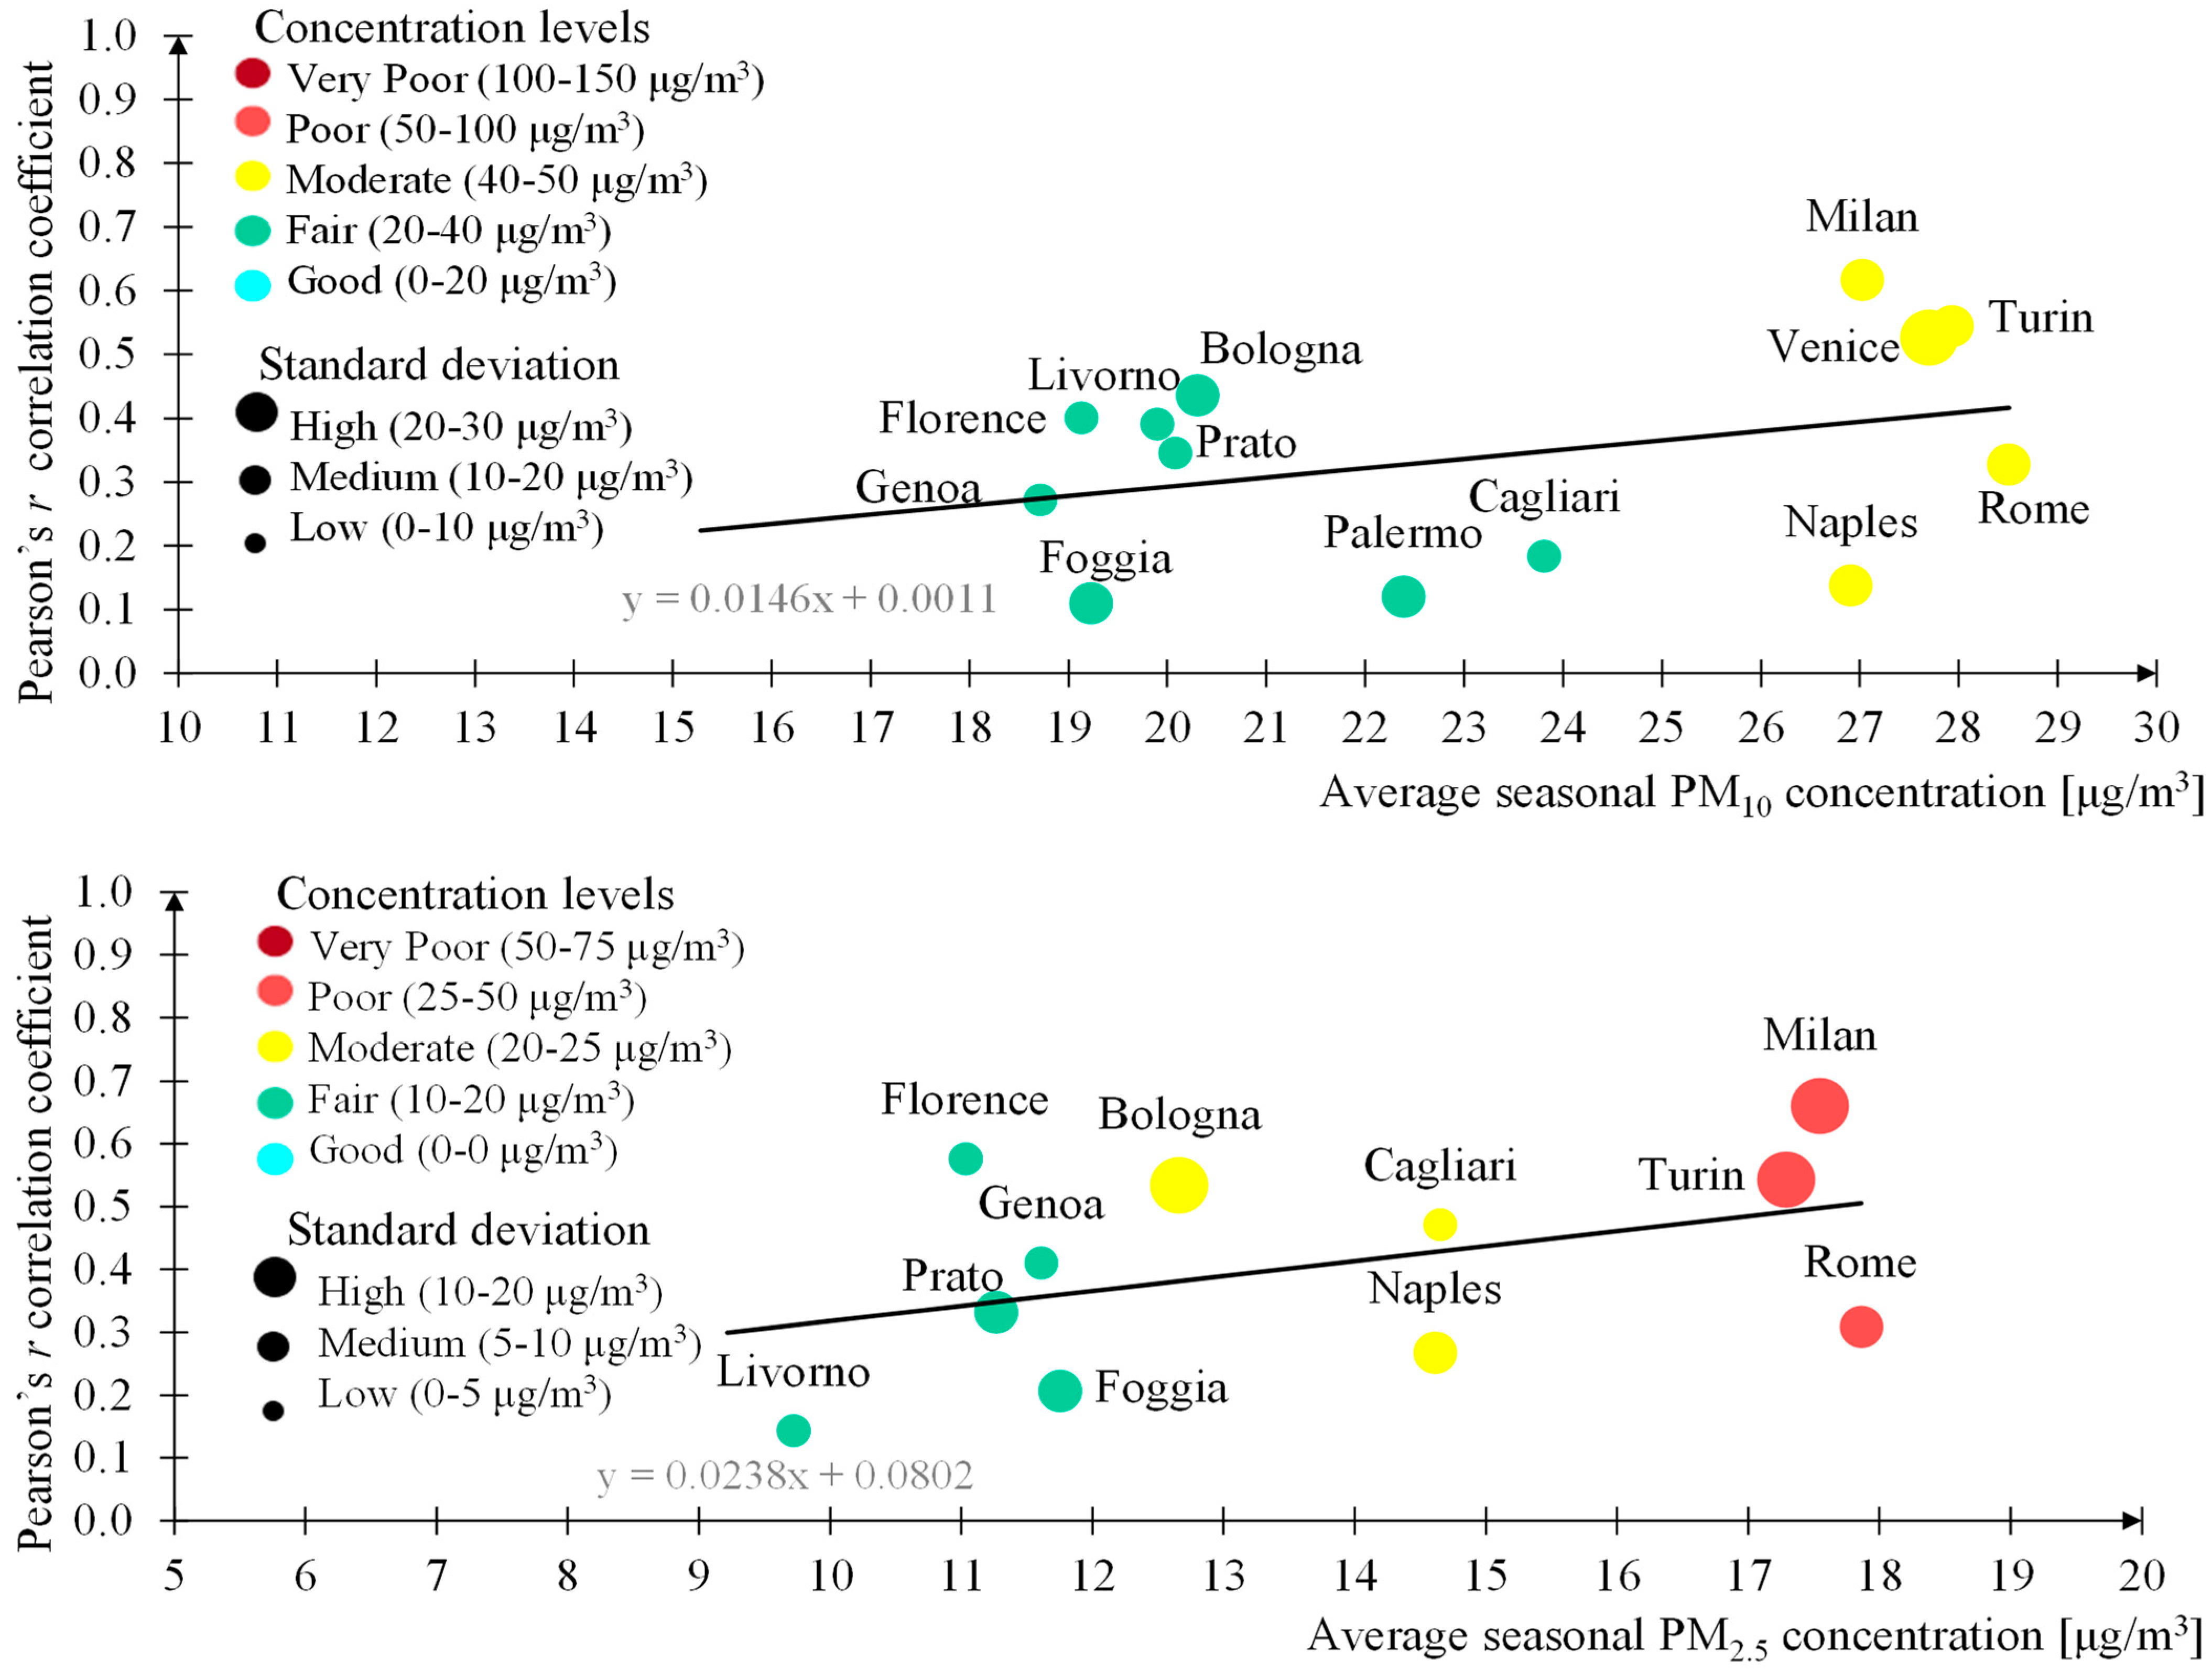
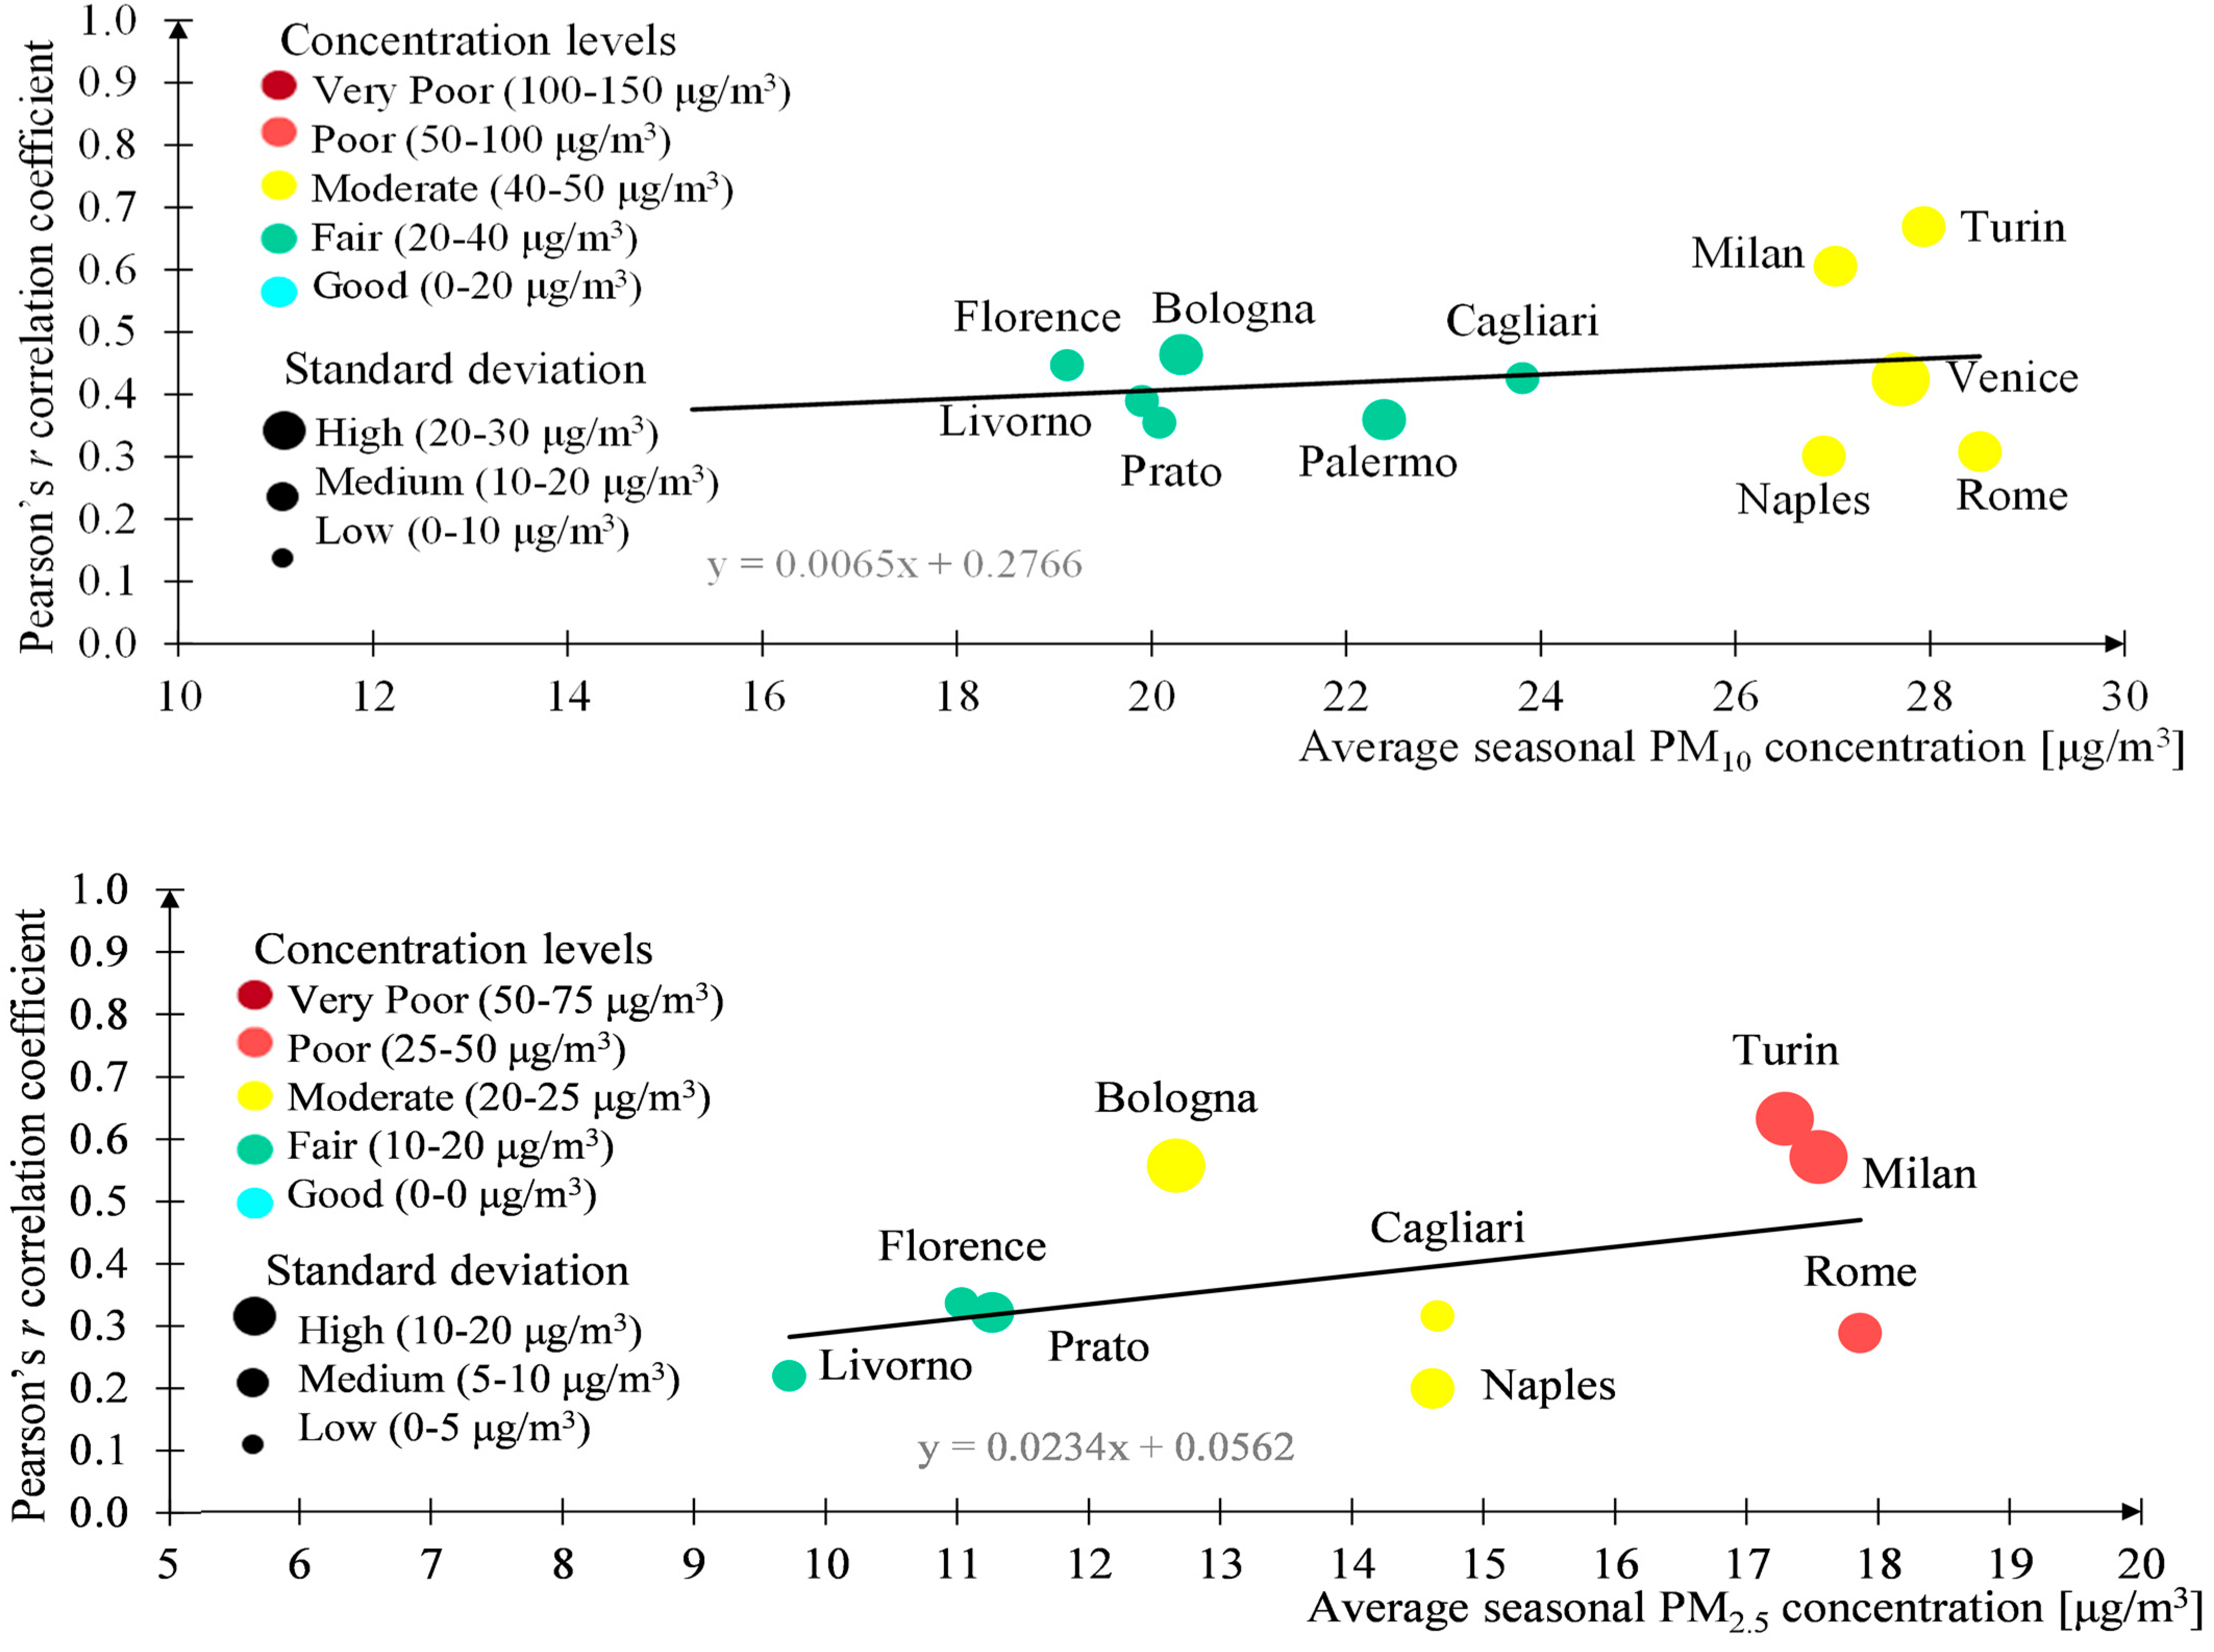
  • The analysis time period considered ranged from 1 February to 15 August 2020, which is the period of the first wave of the virus spreading in Italy, from the first case of coronavirus in the Province of Milan up to the end of its diffusion with less than five hundred daily new cases at a national level. Within this time period, a “high COVID-19 period” from 9 March to 15 June 2020 was identified, which matches with the implementation of the national lockdown (for about 70 consecutive days) and in which a higher number of daily new cases was observed during the first wave (see results in Figure 3 and Figure 4);
  • The relationship among air pollution, mobility habits and daily new COVID-19 cases was assessed, and a correlation analyses was performed. Pearson’s, Spearman’s, Kendall’s, Goodman’s, and Somers’ correlation tests were applied. Often, there are differences in the same dataset applications between the estimation of both parametric and nonparametric indices. Pearson’s r correlation coefficient produces values often greater than the nonparametric ones, and the Spearman’s ρ indices are highest among notparametric measures [47]. Therefore, when multiple correlation indices are applied to the same dataset, differences in estimation results must be expected in this sense. Furthermore, Somers’ D is one of the main nonparametric indices often used to test the cause–effect relation of two phenomena;
  • For a proper correlation analyses, the daily COVID-19 cases must be related with the PM concentrations (mobility trips) measured several days before. i.e., the day when the infection occurred. To estimate the most representative number of “days before” that influenced the daily COVD-19 cases, many thresholds were tested in terms of correlation indices estimation ranging from 0 to 40 days.

3. Results and Discussion

The estimation results relative to the average PM10 and PM2.5 concentrations measured within the main Italian cities (Figure 3 and Figure 4) and during the overall time period (1 February–15 August 2020) showed that the most polluted cities were Rome, Milan, Turin, Naples, Bologna, and Venice, with an average PM10 (PM2.5) concentration ranging between 20 (13) and 29 (18) μg/m3 (Figure 2). Within this time period, the impact of the national lockdown (about 2.5-month long) was also quantified in terms of PM concentration reduction at an urban scale. The results, reported in Table 1, showed that the lockdown mobility restrictions produced a significant improvement in air quality with average reductions of PM10 and PM2.5 concentrations of about 15%, and higher values of PM reduction were found in the cities commonly most polluted (e.g., 25% of the PM10 reduction and 27% of the PM2.5 reduction for Milan; 35% of the PM10 reduction and and 42% of the PM2.5 reduction for Turin). This result is consistent with those observed in several studies worldwide, which measured significant reductions in PM pollution during the lockdown [48,49,50,51,52,53,54,55,56,57,58]. For example, Menut et al. observed in Europe an average PM concentrations reduction ranging from 5% to 15% [53]; Kanniah et al. measured a PM reduction in Asia ranging from 23% to 32% [52]; Hashim et al. observed a PM decrease ranging from 8% to 15% [54]; while in India, Singh et al. measured, during the lockdown, PM reductions from 40% to 60% [58].
As mentioned, one of the main aims of the research was to perform a correlation analysis to verify the hypothesis, according to which the number of certified cases of coronavirus in a day is directly related with the particulate matter (PM10 and PM2.5) concentrations measured several days before. To estimate the most representative number of “days before” that influences the daily COVID-19 cases, many thresholds were tested in terms of correlation indices estimation, demonstrating that 21 days before (ranging from 18 to 26 days, function of the city considered) was on average the best time period to reproduce the data observed (see results in Table 2). This result is also qualitatively observable from Figure 5, in which it may be seen that the daily coronavirus cases shifted three weeks backward (left axis of Figure 5) and a similar trend of the daily PM concentrations was reproduced (right axis of Figure 5).
To test the applicability of the Pearson’s r parametric correlation index, the occurrence of the basic theoretical assumptions was tested for the dataset considered, concluding that the linearity between the variables was verified, while the hypothesis of the normal distribution of the phenomena, tested through the application of the q–q plot, was almost always verified. For this reason, to strengthen the validity of the research results, in addition to the Pearson’s r index, also nonparametric estimates were performed (Spearman’s ρ, Kendall’s τ(b), Goodman and Kruskal’s γ, and Somers’ D), for which all the application basic assumptions were verified.
For the correlation analyses, the length of the time period considered spans from 9 March to 15 June 2020 when the daily infection curves reached its lowest point (Figure 3 and Figure 4). Furthermore, the other time periods were also tested but not reported for brevity, because they did not produce significant differences in estimation results.
Estimations results (Figure 6 and Table 2) showed a positive correlation between PM10 (PM2.5) concentrations and daily new COVID-19 cases shifted 21 day backward. This correlation was greater for the cities with a higher average seasonal PM concentration (red and yellow dots in Figure 6), meaning that the prolonged exposure to a polluted environment (long-term effect) could impact the spread of the COVID-19 pandemic. These results are more evident, for example, in Milan and Turin with an average seasonal PM10 (PM2.5) concentrations of about 30 (18) μg/m3 (the higher of the panel), which had a positive correlation with daily COVID-19 cases ranging between 0.5 and 0.7, according to the Pearson’s and Spearman’s estimations. This long-term correlation effect, as discussed in the introduction, is consistent with different papers dealing with this topic [23,29,30,31,32,33].
Overall, no appreciable differences between the estimated PM10 indices and those estimated for PM2.5 were observed.
Finally, estimations results (Table 2) showed that, coherently with the evidence in the literature [47], Pearson’s r correlation coefficients were always greater than the others, while Spearman’s ρ values were higher among the nonparametric measures.
The second correlation analyse performed was the relationships between daily PM concentrations and mobility trips. The estimations results (Figure 7 and Table 3) showed a positive correlation between road traffic (mobility trips) and PM pollution, confirming that PM is mainly produced (emitted) by the road vehicles at an urban scale, as reported in the literature. This phenomenon is most evident for the cities structurally more polluted (red and yellow dots in Figure 7), for which high levels of PM concentrations are mainly produced by road networks with high traffic congestion. This occurs, for example, for Milan and Turin which have a positive high correlation index between road traffic and PM concentration than those less polluted cities (e.g., Pearson’s correlation values equal to 0.6–0.7).
Overall, no appreciable differences between the estimated PM10 indices and those estimated for PM2.5 were observed for this correlation analyses.
Finally, the estimations results (Table 3) showed that Pearson’s r correlation coefficients were always greater than the others, while Spearman’s ρ values were higher among the nonparametric measures.
Finally, the correlation between the daily COVID-19 new cases and the mobility trips performed several days before was also tested. As observed by Cartenì et al. [13], for a proper correlation analyses, daily COVID-19 cases must be related with mobility trips performed several days before, i.e., the day when the infection occurred. To estimate the most representative number of “days before” that influenced the daily COVD-19 cases, many thresholds were tested in terms of correlation indices estimation, revealing that mobility trips measured on average 22 days before (ranging from 21 to 24 days, function of the city considered) represented the best time period to reproduce the data observed (see results in Table 2). This threshold is also coherent with those estimated by Cartenì et al. [13] for the same country but at a national scale, where three weeks were the proper estimated threshold for a better correlation between mobility trips and COVID-19 cases.
The estimation results showed that the correlation between the daily COVID-19 new cases and the mobility trips performed 22 days before ranged between 0.3 and 0.6; furthermore, coherently with expectations, no appreciable difference between the city’s level of mobility (proxy variable of traffic congestion level and/or size of the city) and the correlation strength (see the almost horizontal interpolating line in Figure 8) was observed. Additionally, for this correlation analyses, Pearson’s r correlation coefficients were greater than the others, followed by the Spearman’s ρ indices (Table 4).
As indicated before, one of the main limits of the correlation indices is their non-ability in investigating the cause–effect relation between two phenomena (variables). To overcome this limit with the aim to verify the cause–effect relation among daily COVID-19 cases and PM concentration/mobility trips, the application of the Somers’ D nonparametric index was performed. The estimation results (Table 2, Table 3 and Table 4) showed an average Somers’ D value of about 0.2–0.3 as a function of the type of correlation and the panel of the cities, allowing observing good cause–effect results. Finally, the “consistency” of this result has been verified by comparing the results obtained in this research with those (comparable) obtained in other case studies worldwide and discussed above. All these considerations allow concluding that there is a reasonable probability that PM concentrations and mobility habits are two of the causes in the spread of COVID-19 for the case study considered.

4. Conclusions

The proposed research concerns the interactions between COVID-19 and environment, interfacing the virus transmission modes through outdoor air pollutants with the influence of PM due to the human activities and habits in promoting the diffusion of the virus. Transport system represents one of the main causes of air pollution in cities, and many studies suggested that PM could have influenced the virus outbreak, considering it as a carrier for several chemicals and biologic pollutants (including the COVID-19 virus).
The data analyses performed for the current case study showed how the mobility restrictions performed during the lockdown produced a significant increase in air quality with an average reduction of PM10 and PM2.5 concentrations of about 15%, with maximum reductions ranging between 25% and 42%. Furthermore, the correlation analyses performed allowed measuring a positive correlation (stronger for the high polluted cities) between daily COVID-19 cases and both daily PM concentrations and mobility trips measured about three weeks before, when the contagion probably occurred. A direct and contemporary correlation was also observed between PM concentrations and mobility trips, confirming the common practices according to which the PM pollution in the cities is mainly produced by the road traffic.
The findings highlighted in this research, also supported by the evidence of the literature, concluded that PM concentrations and mobility habits could be considered as potential early indicators of COVID-19 circulation in outdoor environments. Among the limits of this research, there is the lack of quantitative evaluations about the reciprocal weight that these two variables had within the spread of the virus (in addition to the other context variables representative of the phenomenon), due to the quantitative estimation method implemented.
The results obtained in this research are originals and concluded that the average urban PM concentrations have significantly impacted both long-term and short-term effects on the virus spread.
Overall, this paper poses significant ethical questions about proper urban and transportation planning; the most polluted cities have not only worst welfare for their citizens but, as highlighted in this research, could lead to a greater spread of current and future respiratory and/or pulmonary health emergencies. The lesson to be learned by this global pandemic will help planners to better preserve the air quality of our cities in the post-COVID-19 era.
To the authors’ knowledge, the finding in this research (correlate the daily cases to air quality in the day in which the contagions occurred) could contribute to better clarifying the context variables that influence the diffusion of the virus and helping the proper definition of the restrictive/mitigative measures for cities and peoples. The results obtained in this research should be considered as preliminary and not exhaustive for evaluating all the main context variables influencing the COVID-19 spread. Among the research perspectives, there will be the estimation of a multivariable model aiming to evaluate daily COVID-19 cases/deaths as a function of some of the main context variables (e.g., population, exposure, peak infectivity, infection associated with heavy symptoms, asymptomatic/mild symptom, hospitalized cases, quarantine at home, and recovered/dead individuals), where mobility and air quality measures (the ones discussed in this research) could contribute to better describing the overall pandemic phenomena. Furthermore, other research perspectives should also consider impact assessment analyses (e.g., cost–benefit vs. multicriteria [60,61,62,63]) of sustainable mobility policies, such as the electric mobility (e-mobility) and Mobility as a Service (MaaS), in the “new normal” post-coronavirus era.

Author Contributions

Conceptualization, methodology, validation, formal analysis, supervision, project administration, writing of the original draft preparation, and writing of review and editing, A.C.; methodology, investigation, and supervision, F.C.; resources, data curation, writing of the original draft preparation, writing of review and editing, supervision, and validation, L.D.F.; resources and data curation, F.P. All authors have read and agreed to the published version of the manuscript.

Funding

This research received no external funding.

Acknowledgments

The research was carried out as part of the activities of the Transportation System Laboratory of the University of Campania “Luigi Vanvitelli,” Italy. The research was also carried out within the activities of funding program VALERE: VAnviteLli pEr la RicErca; SEND research project, University of Campania “Luigi Vanvitelli”, Italy.

Conflicts of Interest

The authors declare no conflict of interest.

References

  1. Chinazzi, M.; Davis, J.T.; Ajelli, M.; Gioannini, C.; Litvinova, M.; Merler, S.; Piontti, A.P.Y.; Mu, K.; Rossi, L.; Sun, K. The Effect of travel restrictions on the spread of the 2019 novel coronavirus (COVID-19) outbreak. Science 2020, 368, 395–400. [Google Scholar] [CrossRef] [Green Version]
  2. Liu, H.; Bai, X.; Shen, H.; Pang, X.; Liang, Z.; Liu, Y. Synchronized travel restrictions across cities can be effective in COVID-19 control. medRxiv 2020. [Google Scholar] [CrossRef] [Green Version]
  3. Johns Hopkins University (JHU) COVID-19 Map. Available online: https://0-coronavirus-jhu-edu.brum.beds.ac.uk/map.html (accessed on 19 March 2021).
  4. Cacciapaglia, G.; Cot, C.; Sannino, F. Second wave COVID-19 pandemics in Europe: A temporal playbook. Sci. Rep. 2020, 10, 15514. [Google Scholar] [CrossRef] [PubMed]
  5. Wise, J. Covid-19: Risk of second wave is very real, say researchers. BMJ Br. Med. J. Online 2020, 369, m2294. [Google Scholar] [CrossRef] [PubMed]
  6. Frontera, A.; Martin, C.; Vlachos, K.; Sgubin, G. Regional air pollution persistence links to Covid19 infection zoning. J. Infect. 2020, 81, 318–356. [Google Scholar] [CrossRef] [PubMed]
  7. World Health Organization. Coronavirus Disease 2019 (COVID-19): Situation Report, 72; World Health Organization: Geneva, Switzerland, 2020. [Google Scholar]
  8. Blocken, B.; Malizia, F.; van Druenen, T.; Marchal, T. Social Distancing v2. 0: During Walking, Running and Cycling. Eindhoven University of Technology: Eindhoven, The Netherlands, 2020. [Google Scholar]
  9. Bertuzzo, E.; Mari, L.; Pasetto, D.; Miccoli, S.; Casagrandi, R.; Gatto, M.; Rinaldo, A. The geography of COVID-19 spread in Italy and implications for the relaxation of confinement measures. Nat. Commun. 2020, 11, 1–11. [Google Scholar] [CrossRef] [PubMed]
  10. Gatto, M.; Bertuzzo, E.; Mari, L.; Miccoli, S.; Carraro, L.; Casagrandi, R.; Rinaldo, A. Spread and dynamics of the COVID-19 epidemic in Italy: Effects of emergency containment measures. Proc. Natl. Acad. Sci. USA 2020, 117, 10484–10491. [Google Scholar] [CrossRef] [PubMed] [Green Version]
  11. Setti, L.; Passarini, F.; De Gennaro, G.; Barbieri, P.; Perrone, M.G.; Borelli, M.; Palmisani, J.; Di Gilio, A.; Piscitelli, P.; Miani, A. Airborne transmission route of COVID-19: Why 2 meters/6 feet of inter.-personal distance could not. be enough. Int. J. Environ. Res. Public Health 2020, 17, 2932. [Google Scholar] [CrossRef] [PubMed] [Green Version]
  12. Cartenì, A.; Di Francesco, L.; Martino, M. The role of transport accessibility within the spread of the coronavirus pandemic in Italy. Saf. Sci. 2021, 133, 104999. [Google Scholar] [CrossRef]
  13. Cartenì, A.; Di Francesco, L.; Martino, M. How mobility habits influenced the spread of the COVID-19 pandemic: Results from the Italian case study. Sci. Total Environ. 2020, 741, 140489. [Google Scholar] [CrossRef]
  14. Lee, H.; Park, S.J.; Lee, G.R.; Kim, J.E.; Lee, J.H.; Jung, Y.; Nam, E.W. The relationship between trends in COVID-19 prevalence and traffic levels in South Korea. Int. J. Infect. Dis. 2020, 96, 399–407. [Google Scholar] [CrossRef]
  15. Kraemer, M.U.; Yang, C.-H.; Gutierrez, B.; Wu, C.-H.; Klein, B.; Pigott, D.M.; Du Plessis, L.; Faria, N.R.; Li, R.; Hanage, W.P. The effect of human mobility and control measures on the COVID-19 epidemic in China. Science 2020, 368, 493–497. [Google Scholar] [CrossRef] [Green Version]
  16. Shi, P.; Dong, Y.; Yan, H.; Zhao, C.; Li, X.; Liu, W.; He, M.; Tang, S.; Xi, S. Impact of temperature on the dynamics of the COVID-19 outbreak in China. Sci. Total Environ. 2020, 728, 138890. [Google Scholar] [CrossRef]
  17. Bashir, M.F.; Ma, B.; Komal, B.; Bashir, M.A.; Tan, D.; Bashir, M. Correlation between climate indicators and COVID-19 pandemic in New York, USA. Sci. Total Environ. 2020, 728, 138835. [Google Scholar] [CrossRef]
  18. Lin, C.; Lau, A.K.; Fung, J.C.; Guo, C.; Chan, J.W.; Yeung, D.W.; Zhang, Y.; Bo, Y.; Hossain, M.S.; Zeng, Y. A mechanism-based parameterisation scheme to investigate the association between transmission rate of COVID-19 and meteorological factors on plains in China. Sci. Total Environ. 2020, 737, 140348. [Google Scholar] [CrossRef] [PubMed]
  19. Prata, D.N.; Rodrigues, W.; Bermejo, P.H. Temperature significantly changes COVID-19 transmission in (sub) tropical cities of brazil. Sci. Total Environ. 2020, 729, 138862. [Google Scholar] [CrossRef] [PubMed]
  20. Qi, H.; Xiao, S.; Shi, R.; Ward, M.P.; Chen, Y.; Tu, W.; Su, Q.; Wang, W.; Wang, X.; Zhang, Z. COVID-19 transmission in mainland china is associated with temperature and humidity: A time-series analysis. Sci. Total Environ. 2020, 728, 138778. [Google Scholar] [CrossRef] [PubMed]
  21. Rashed, E.A.; Kodera, S.; Gomez-Tames, J.; Hirata, A. influence of absolute humidity, temperature and population density on COVID-19 spread and decay durations: Multi-prefecture study in Japan. Int. J. Environ. Res. Public. Health 2020, 17, 5354. [Google Scholar] [CrossRef] [PubMed]
  22. Tosepu, R.; Gunawan, J.; Effendy, D.S.; Lestari, H.; Bahar, H.; Asfian, P. Correlation between weather and Covid-19 pandemic in Jakarta, Indonesia. Sci. Total Environ. 2020, 725, 138436. [Google Scholar] [CrossRef]
  23. Wu, Y.; Jing, W.; Liu, J.; Ma, Q.; Yuan, J.; Wang, Y.; Du, M.; Liu, M. Effects of temperature and humidity on the daily new cases and new deaths of COVID-19 in 166 countries. Sci. Total Environ. 2020, 729, 139051. [Google Scholar] [CrossRef]
  24. Xie, J.; Zhu, Y. Association between ambient temperature and COVID-19 infection in 122 cities from China. Sci. Total Environ. 2020, 724, 138201. [Google Scholar] [CrossRef] [PubMed]
  25. Atkinson, R.W.; Carey, I.M.; Kent, A.J.; Van Staa, T.P.; Anderson, H.R.; Cook, D.G. Long-term exposure to outdoor air pollution and the incidence of chronic obstructive pulmonary disease in a national english cohort. Occup. Environ. Med. 2015, 72, 42–48. [Google Scholar] [CrossRef] [PubMed] [Green Version]
  26. Cao, J.; Yang, C.; Li, J.; Chen, R.; Chen, B.; Gu, D.; Kan, H. Association between long-term exposure to outdoor air pollution and mortality in China: A cohort study. J. Hazard. Mater. 2011, 186, 1594–1600. [Google Scholar] [CrossRef]
  27. Yang, W.-S.; Zhao, H.; Wang, X.; Deng, Q.; Fan, W.-Y.; Wang, L. An evidence-based assessment for the association between long-term exposure to outdoor air pollution and the risk of lung cancer. Eur. J. Cancer Prev. 2016, 25, 163–172. [Google Scholar] [CrossRef] [PubMed]
  28. Cascetta, E.; Henke, I.; Di Francesco, L. The effects of air pollution, sea exposure and altitude on COVID-19 hospitalization rates in Italy. Int. J. Environ. Res. Public. Health 2021, 18, 452. [Google Scholar] [CrossRef]
  29. Cole, M.A.; Ozgen, C.; Strobl, E. Air pollution exposure and Covid-19 in dutch municipalities. Environ. Resour. Econ. 2020, 76, 581–610. [Google Scholar] [CrossRef]
  30. Pansini, R.; Fornacca, D. Initial evidence of higher morbidity and mortality due to SARS-CoV-2 in regions with lower air quality. MedRxiv 2020. [Google Scholar] [CrossRef]
  31. Pluchino, A.; Inturri, G.; Rapisarda, A.; Biondo, A.E.; Moli, R.L.; Zappala, C.; Giuffrida, N.; Russo, G.; Latora, V. A novel methodology for epidemic risk assessment: The case of COVID-19 outbreak in Italy. Sci. Rep. 2020. [Google Scholar] [CrossRef]
  32. Wu, X.; Nethery, R.C.; Sabath, M.B.; Braun, D.; Dominici, F. Air pollution and COVID-19 mortality in the United States: Strengths and limitations of an ecological regression analysis. Sci. Adv. 2020, 6, eabd4049. [Google Scholar] [CrossRef]
  33. Yao, Y.; Pan, J.; Wang, W.; Liu, Z.; Kan, H.; Qiu, Y.; Meng, X.; Wang, W. Association of particulate matter pollution and case fatality rate of COVID-19 in 49 Chinese cities. Sci. Total Environ. 2020, 741, 140396. [Google Scholar] [CrossRef]
  34. Zhou, F.; Yu, T.; Du, R.; Fan, G.; Liu, Y.; Liu, Z.; Xiang, J.; Wang, Y.; Song, B.; Gu, X. Clinical course and risk factors for mortality of adult inpatients with COVID-19 in Wuhan, China: A retrospective cohort study. Lancet 2020, 395, 1054–1062. [Google Scholar] [CrossRef]
  35. USEPA. Particulate Matter (PM) Basics. Available online: https://www.epa.gov/pm-pollution/particulate-matter-pm-basics (accessed on 19 March 2021).
  36. Comunian, S.; Dongo, D.; Milani, C.; Palestini, P. Air pollution and Covid-19: The role of particulate matter in the spread and increase of Covid-19′s morbidity and mortality. Int. J. Environ. Res. Public. Health 2020, 17, 4487. [Google Scholar] [CrossRef] [PubMed]
  37. Carugno, M.; Dentali, F.; Mathieu, G.; Fontanella, A.; Mariani, J.; Bordini, L.; Milani, G.P.; Consonni, D.; Bonzini, M.; Bollati, V. PM10 exposure is associated with increased hospitalizations for respiratory syncytial virus bronchiolitis among infants in Lombardy, Italy. Environ. Res. 2018, 166, 452–457. [Google Scholar] [CrossRef] [PubMed]
  38. Fattorini, D.; Regoli, F. Role of the chronic air pollution levels in the Covid-19 outbreak risk in Italy. Environ. Pollut. 2020, 264, 114732. [Google Scholar] [CrossRef] [PubMed]
  39. Zoran, M.A.; Savastru, R.S.; Savastru, D.M.; Tautan, M.N. Assessing the relationship between surface levels of PM2. 5 and PM10 particulate matter impact on COVID-19 in Milan, Italy. Sci. Total Environ. 2020, 738, 139825. [Google Scholar] [CrossRef]
  40. Setti, L.; Passarini, F.; De Gennaro, G.; Barbieri, P.; Licen, S.; Perrone, M.G.; Piazzalunga, A.; Borelli, M.; Palmisani, J.; Di Gilio, A. potential role of particulate matter in the spreading of COVID-19 in northern Italy: First observational study based on initial epidemic diffusion. BMJ Open 2020, 10, e039338. [Google Scholar] [CrossRef]
  41. Setti, L.; Passarini, F.; De Gennaro, G.; Barbieri, P.; Perrone, M.G.; Piazzalunga, A.; Borelli, M.; Palmisani, J.; Di Gilio, A.; Piscitelli, P. The potential role of particulate matter in the spreading of COVID-19 in northern Italy: First evidence-based research hypotheses. MedRxiv 2020. [Google Scholar] [CrossRef]
  42. Bontempi, E. First data analysis about possible COVID-19 virus airborne diffusion due to air particulate matter (PM): The case of Lombardy (Italy). Environ. Res. 2020, 186, 109639. [Google Scholar] [CrossRef] [PubMed]
  43. Italian Ministry of Health Daily Reports on COVID-19 Positive Cases. Available online: http://www.salute.gov.it/portale/home.html (accessed on 19 March 2021).
  44. ISTAT I Dati Sui Confini Amministrativi Aggiornati al 1° Gennaio 2021. Available online: https://www.istat.it/it/archivio/222527 (accessed on 19 March 2021).
  45. ARPA—Agenzia Regionale per la Protezione Ambientale. Available online: https://www.arpae.it/it (accessed on 19 March 2021).
  46. Italian Transport Ministry Strategic and Infrastructures Development Office: COVID-19 Mobility Observatory. Available online: https://www.mit.gov.it/ (accessed on 19 March 2021).
  47. Masyn, K.; Nathan, P.; Little, T. The Oxford handbook of quantitative methods. Little TD Ed. Stat. Anal. 2013, 2, 551–611. [Google Scholar]
  48. Bogomolova, A.; Balk, I.; Polkovnikova, N.; Ivaschenko, N. The impact of the COVID-19 related lockdowns on air quality. In Proceedings of the IOP Conference Series: Earth and Environmental Science, Helsinki, Finland, 22–24 May 2020; IOP Publishing: Bristol, UK, 2020; Volumn 534, p. 012010. [Google Scholar]
  49. Broomandi, P.; Karaca, F.; Nikfal, A.; Jahanbakhshi, A.; Tamjidi, M.; Kim, J.R. Impact of COVID-19 event on the air quality in Iran. Aerosol Air Qual. Res. 2020, 20, 1793–1804. [Google Scholar] [CrossRef]
  50. Dantas, G.; Siciliano, B.; França, B.B.; da Silva, C.M.; Arbilla, G. The impact of COVID-19 partial lockdown on the air quality of the city of Rio de Janeiro, Brazil. Sci. Total Environ. 2020, 729, 139085. [Google Scholar] [CrossRef]
  51. Filonchyk, M.; Hurynovich, V.; Yan, H. Impact of Covid-19 lockdown on air quality in the poland, eastern Europe. Environ. Res. 2020, 110454. [Google Scholar] [CrossRef]
  52. Kanniah, K.D.; Zaman, N.A.F.K.; Kaskaoutis, D.G.; Latif, M.T. COVID-19′s Impact on the atmospheric environment in the southeast Asia region. Sci. Total Environ. 2020, 736, 139658. [Google Scholar] [CrossRef] [PubMed]
  53. Menut, L.; Bessagnet, B.; Siour, G.; Mailler, S.; Pennel, R.; Cholakian, A. Impact of lockdown measures to combat Covid-19 on air quality over western Europe. Sci. Total Environ. 2020, 741, 140426. [Google Scholar] [CrossRef] [PubMed]
  54. Hashim, B.M.; Al-Naseri, S.K.; Al-Maliki, A.; Al-Ansari, N. Impact of COVID-19 lockdown on NO2, O3, PM2. 5 and PM10 concentrations and assessing air quality changes in Baghdad, Iraq. Sci. Total Environ. 2021, 754, 141978. [Google Scholar] [CrossRef]
  55. Navinya, C.; Patidar, G.; Phuleria, H.C. Examining Effects of the COVID-19 national lockdown on ambient air quality across urban India. Aerosol Air Qual. Res. 2020, 20, 1759–1771. [Google Scholar] [CrossRef]
  56. Pei, Z.; Han, G.; Ma, X.; Su, H.; Gong, W. Response of Major Air pollutants to COVID-19 lockdowns in China. Sci. Total Environ. 2020, 743, 140879. [Google Scholar] [CrossRef] [PubMed]
  57. Rahman, M.S.; Azad, M.A.K.; Hasanuzzaman, M.; Salam, R.; Islam, A.R.M.T.; Rahman, M.M.; Hoque, M.M.M. How air quality and COVID-19 transmission change under different lockdown scenarios? A case from Dhaka city, Bangladesh. Sci. Total Environ. 2021, 762, 143161. [Google Scholar] [CrossRef] [PubMed]
  58. Singh, V.; Singh, S.; Biswal, A.; Kesarkar, A.P.; Mor, S.; Ravindra, K. Diurnal and temporal changes in air pollution during COVID-19 strict lockdown over different regions of India. Environ. Pollut. 2020, 266, 115368. [Google Scholar] [CrossRef]
  59. Italian Civil Protection Protezione Civile Italia-Home. Available online: https://www.protezionecivileitalia.it/ (accessed on 19 March 2021).
  60. Cartenì, A. A cost-benefit analysis based on the carbon footprint derived from plug-in hybrid electric buses for urban public transport services. WSEAS Trans. Environ. Dev. 2018, 14, 125–135. [Google Scholar]
  61. Carteni, A.; Henke, I. External costs estimation in a cost-benefit analysis: The new formia-gaeta tourist railway line in Italy. In Proceedings of the 2017 IEEE International Conference on Environment and Electrical Engineering and 2017 IEEE Industrial and Commercial Power Systems Europe (EEEIC/I&CPS Europe), Milan, Italy, 6–9 June 2017; IEEE: Piscataway, NJ, USA, 2017; pp. 1–6. [Google Scholar]
  62. Henke, I.; Cartenì, A.; Francesco, L.D. A sustainable evaluation Processes for investments in the transport sector: A combined multi-criteria and cost–benefit analysis for a new highway in Italy. Sustainability 2020, 12, 9854. [Google Scholar] [CrossRef]
  63. Cartenì, A.; Henke, I.; Molitierno, C.; Di Francesco, L. Strong sustainability in public transport policies: An e-mobility bus fleet application in sorrento peninsula (Italy). Sustainability 2020, 12, 7033. [Google Scholar] [CrossRef]
Figure 1. The Italian cities considered in the application case study (source: processing starting from [44]).
Sustainability 13 04553 g001
Figure 2. Results of PM10 and PM2.5 measures within the main Italian cities from 1 February to 15 August 2020 (source: processing starting from [45]).
Sustainability 13 04553 g002
Figure 3. Results of the PM10 and PM2.5 measures and the daily new COVID-19 cases within the main Italian cities from 1 February to 15 August 2020 (source: processing starting from [45,59]).
Sustainability 13 04553 g003
Figure 4. Results of the PM10 and PM2.5 measures and the daily new COVID-19 cases within the main Italian cities from 1 February to 15 August 2020 (source: processing starting from [45,59]).
Sustainability 13 04553 g004
Figure 5. Example of estimation results: daily PM10 concentrations, observed COVID-19 cases/day, and COVID-19 cases/day shifted 21 days backward (Venice, Italy).
Sustainability 13 04553 g005
Figure 6. Example of estimation results: Pearson’s r correlation coefficient estimation results between PM10 (PM2.5) concentrations and daily new COVID-19 cases shifted on average 21 days backward.
Sustainability 13 04553 g006
Figure 7. Example of estimation results: Pearson’s r correlation coefficient estimation results between average daily traffic and PM10 (PM2.5) concentrations.
Sustainability 13 04553 g007
Figure 8. Example of estimation result: Pearson’s r correlation coefficient between average daily traffic and daily new cases of COVID-19 shifted on average 22 day forward in Italian cities.
Sustainability 13 04553 g008
Table 1. Average PM10 and PM2.5 concentrations measured within the main Italian cities (source: [45]).
Area of ItalyCityHigh COVID-19 Period
(9 March 2020–15 June 2020)
Non-High COVID-19 Period
(1 February 2020–8 March 2020
and 16 June 2020–15 August 2020)
Percentage Variation
PM10
(μg/m3)
PM2.5
(μg/m3)
PM10
(μg/m3)
PM2.5
(μg/m3)
PM10
(%)
PM2.5
(%)
NordMilan23153120–25%–27%
Turin22133422–35%–42%
Genoa18112012–8%–12%
Bologna18112314–24%–24%
Venice24n.a.32n.a.–25%n.a.
CenterRome27183018–9%1%
Florence17102112–18%–13%
Prato19102212–14%–14%
Livorno1892210–17%–6%
Sud/IslandNaples25142915–16%–6%
Foggia2012181211%–1%
Palermo21n.a.24n.a.–13%n.a.
Cagliari22142615–15%–10%
Table 2. Estimation results: correlation coefficient between PM10 (PM2.5) concentrations (μg/m3) and daily new COVID-19 cases shifted 21 days backward.
Macro AreaCityOptimal Traslation Threshold (Days)Pearson’s rSpearman’s ρKendall’s τ(b)Goodman’s γSomers’ D
PM10PM2.5PM10PM2.5PM10PM2.5PM10PM2.5PM10PM2.5
NordMilan250.620.660.580.610.360.380.390.420.390.42
Turin240.540.540.460.510.310.340.350.390.350.39
Genoa180.270.410.210.210.120.130.130.150.130.15
Bologna190.440.530.490.540.310.310.340.380.340.38
Venice240.53n.a.0.56n.a.0.34n.a.0.42n.a.0.42n.a.
CenterRome190.330.310.380.340.240.190.280.250.280.25
Florence210.400.580.410.530.230.300.300.390.300.39
Prato190.350.330.360.400.200.160.260.200.260.20
Livorno190.390.140.300.160.190.100.200.120.200.12
Sud/IslandNaples230.140.270.210.300.140.150.150.220.150.22
Foggia180.110.210.200.310.130.130.130.220.130.22
Palermo260.12n.a.0.20n.a.0.13n.a.0.17n.a.0.17n.a.
Cagliari220.180.470.290.580.180.280.190.330.190.33
Table 3. Estimation results: correlation coefficient between average daily road traffic and PM10 (PM2.5) concentrations (μg/m3).
Macro AreaCityPearson’s rSpearman’s ρKendall’s τbGoodman’s γSomers’ D
PM10PM2.5PM10PM2.5PM10PM2.5PM10PM2.5PM10PM2.5
NordMilan0.610.580.370.330.240.220.250.220.250.22
Turin0.670.640.440.430.280.280.290.280.290.28
Bologna0.460.560.230.280.140.140.150.150.150.15
Venice0.42n.a.0.24n.a.0.13n.a.0.13n.a.0.13n.a.
CenterRome0.310.290.190.250.150.110.130.110.130.11
Florence0.450.340.440.320.310.100.320.110.320.11
Prato0.350.320.300.230.190.130.210.130.210.13
Livorno0.390.220.310.200.200.110.230.100.230.10
Sud/IslandNaples0.300.200.280.180.180.100.190.100.190.10
Palermo0.36n.a.0.52n.a.0.35n.a.0.36n.a.0.36n.a.
Cagliari0.430.320.350.210.290.130.240.150.240.15
Table 4. Estimation results: correlation coefficient between average daily road traffic and daily new COVID-19 cases.
Macro AreaCityOptimal Traslation Threshold (Days)Pearson’s rSpearman’s ρKendall’s τ(b)Goodman’s γSomers’ D
NordMilan220.530.220.140.140.14
Turin220.220.160.120.120.12
Bologna230.560.350.240.250.25
Venice220.340.210.150.110.11
CenterRome220.560.300.190.220.22
Florence240.270.170.120.120.12
Prato230.510.290.230.210.21
Livorno230.520.230.230.230.23
Sud/IslandNaples230.430.290.170.170.17
Palermo240.550.350.310.260.26
Cagliari210.310.150.160.150.15
Publisher’s Note: MDPI stays neutral with regard to jurisdictional claims in published maps and institutional affiliations.

