Article

A Higher Step Count Is Associated with the Better Evaluation of Physical Education Lessons in Adolescents

1
Faculty of Physical Culture, Palacký University Olomouc, 77111 Olomouc, Czech Republic
2
Institute of Sport Science, The Jerzy Kukuczka Academy of Physical Education, 40-065 Katowice, Poland
*
Author to whom correspondence should be addressed.
Sustainability 2021, 13(8), 4569; https://0-doi-org.brum.beds.ac.uk/10.3390/su13084569
Submission received: 15 March 2021 / Revised: 16 April 2021 / Accepted: 19 April 2021 / Published: 20 April 2021

Abstract

:
The current study aimed to determine: (a) the step counts of boys and girls in habitual physical education (PE) lessons during school teaching practice, (b) the association between the physical load and the evaluation of PE lessons in boys and girls, and (c) the differences in the meeting of the recommendations for PA in PE lessons between Czech and Polish boys and girls. A total of 4092 adolescents from 74 Czech and 58 Polish secondary schools participated in the study. The step counts were monitored using pedometers, while the attitudes towards PE were assessed using a PE lesson evaluation questionnaire. On average, the Czech boys reached 2476 steps (Polish boys reached 2148 steps) and the Czech girls reached 1766 steps (Polish girls reached 1946 steps) in their PE lessons. A higher step count in PE lessons was associated with higher odds of a positive evaluation of PE lessons in boys (OR = 1.35, 95% CI = 1.123–1.626, p = 0.001) and girls (OR = 1.72, 95% CI = 1.449–2.032, p < 0.001). This study provides evidence that a higher step count in PE is associated with a positive evaluation of PE lessons in boys and girls. The findings are important to support the restoration habits on a regular PA in the post-pandemic time.

1. Introduction

From an institutional point of view, schools are responsible for developing efficient strategies for public health risk prevention [1,2], promoting physical activity (PA) [3,4,5], and disseminating physical literacy to children and adolescents [6,7,8,9].
Thus, educators strive to make physical education (PE) an academic subject with a primary role in supporting PA [10] and a fundamental role in the health of children and adolescents [11]. The educators also aim to increase the number of weekly PE lessons because, on average, students receive less than 70 PE lessons per year in Europe [12]. Six PE lessons per week might decrease the risk of cardiovascular diseases and support its prevention in later life stages [2]. There is evidence that PE contributes to increased moderate-to-vigorous physical activity (MVPA) in children [13] and adolescents [4], and that it leads to decreased overweightness and obesity in children and adolescents [14,15]. The research suggests that there are numerous opportunities to increase students’ PA during PE in secondary schools [16] and to enforce evidence-based strategies to improve PE [17,18].
Mooses et al. [19] found that daily MVPA increased by 12.8 min on days with (vs. without) PE. In a meta-analysis of intervention studies that focused on elementary and secondary schools, Lonsdale et al. [20] confirmed that PE contributed to a 24% increase in MVPA/day compared to school days without PE. Using pedometers, Gralla and Alderman [21] found that boys reached 11,404 steps/day (8301 steps/day for girls) on days with PE, but only 9175 steps/day (7238 steps/day for girls) on days without PE. According to another meta-analysis, secondary school students spent 35.9% (28.3–43.6%) of their PE time being active in MVPA [4]. Furthermore, Smith, Lounsbery and McKenzie [22] observed that MVPA intensity accounted for 54% of the secondary school PE time, which equaled a mean duration of 27.7 min (65% of the planned time), and that PE contributed to meeting 25% of the daily PA recommendation. Measurement by telemetry showed that 11–14-year-old adolescents spent 34.3 ± 21.8% (17.5 ± 12.9 min) of their PE time on MVPA [23].
The importance of an increased number of PE lessons per week and increased participation in PE has risen due to a reported decline in adolescents’ vigorous PA (VPA) [24,25]. Results from the Czech Republic and Poland have confirmed the effect of an increased number of PE lessons per week on increased VPA on school days [26].
The number of weekly PE lessons and students’ participation in these lessons has remained constant in the USA and other countries [12,16]. Concurrently, advocacy for PE is difficult when it competes against other attractive types of PA in public open spaces [27] or against mobile apps that combine gaming with PA, such as Pokémon GO [28]. Furthermore, schools focus on narrowly understood education, emphasizing students’ knowledge and academic achievement [3]. Evidence-based facts regarding the benefits of PE for increasing PA in adolescents have not been adequately reflected in educational reform. Another important finding is that the high school PE participation of adolescents did not prevent the decline of PA from adolescence to young adulthood [29].
The rising importance of PE is in contrast with the trend of the evaluation of PE lessons by secondary school adolescents in the Czech Republic and Poland. A significant decrease in PE evaluation by boys and girls has been observed [30]. It is known that students who self-evaluate their fitness level and sport performance higher assess PE more positively than their less-active peers [30]. During PE with popular content (dancing, aerobics and ball games), higher physical intensity is associated with a more positive evaluation of PE by girls, while less popular content (track and field, and gymnastics) leads to a worse PE evaluation [31]. In order to gain a positive PE evaluation and to prepare adolescents for participation in PA across their lifetime, Subramaniam and Silverman [32] suggest that students in higher grades need to focus on active and meaningful engagement, and a positive learning environment in PE.
At least 60 min of PA each day is the globally accepted recommendation for children and adolescents, and it is assumed that PE represents a substantial contributor to meeting this recommendation [33,34]. It is especially important for PE that a part of the 60 or more minutes of daily PA suggested for children and adolescents should include muscle-strengthening PA and bone-strengthening PA for at least 3 days out of the week. Finally, the recommendation of ≥60 min/day of MVPA would ideally correspond to 11,500–14,000 steps/day [35].
The Society of Health and Physical Educators [36] and other national associations recommend at least 225 min of PA per week for middle and high school students. Furthermore, adolescents should spend at least 50% of their PE time in MVPA [37]. Most studies have noted failures in meeting this recommendation [4]. Scruggs [11] suggests 61.3 steps/min in PE if PA accounts for 30% of the PE time, and 83.9 steps/min in the case of PA accounting for 50% of the PE time. For most locomotor-oriented PE lessons, at least 2000 steps/45 min of PE is recommended [38]. However, the questions are: Do we know the level of PA in PE represented by step counts per lesson? How do secondary school boys and girls evaluate PE with a higher step count? The associations between the physical load in PE lessons and adolescents’ attitudes towards PE lessons with different physical loads have not been sufficiently investigated.
The aim of this study was to determine (a) the step counts of boys and girls in habitual physical education (PE) lessons during school teaching practice, (b) the association between the physical load and the evaluation of PE lessons in boys and girls, and (c) the differences in the meeting of the recommendations for PA in PE lessons between Czech and Polish boys and girls.

2. Materials and Methods

2.1. Study Design and Participants

The present cross-sectional research, which respected the implications of the socio-ecological model for education [39] and Hellison’s teaching personal and social responsibility model in out-of-school contexts [40], was implemented annually during students’ teaching practices. The main requirement of the research was to maintain the habitual education and not to interfere with school programs or educational processes in the context of the teaching practices.
This research was conducted in 2016 and 2017 in 74 schools in the Czech Republic and 58 schools in the Silesian Region of Poland. The research included all types of secondary schools in which students’ teaching practices were carried out. The selection of schools in both countries included the main types of secondary schools (general, vocational, apprentice) from various urban/rural areas. A total of 4092 Czech and Polish adolescents participated (Table 1). In both years, all of the students who participated in PE lessons were included in the research. The step counts from PE were monitored using pedometers, while the adolescents’ attitudes towards PE were investigated using a questionnaire [30]. All of the PE lessons were led by student teachers (those in their fifth year of their master’s degree). Co-educational PE lessons were held only in 6.8% of the schools in both countries. The monitored PE lessons were taught by both male teachers (47.3%) and female teachers (52.7%).
In the analysis of the results, the boys and girls from both countries were split into two groups according to the level of PA attained during the PE lessons (the median of the number of steps, which was separate for each gender). Similarly, the participants were divided by their evaluation of the PE lessons as more positive vs. less positive (the median score of the PE evaluation, which was separate for each gender). The main reasons for the gender segregation were that girls are more positive in PE lesson evaluation than boys, and the predominance of single-sex PE lessons [30].

2.2. Procedure

The student teachers monitored PA in one PE lesson in a class/group of students that was selected by the supervising PE teacher in line with the organizational circumstances (taking into account especially the length of breaks both before and after lessons, and the availability of school gyms). The student teachers led these PE lessons independently. First, the participants attached a pedometer to their right hip and checked that the device was reset to ‘0’ steps. No checking of steps during PE lessons or direct motivation for specific step count goals were in place. Then, in the final part of the lesson, the participants completed the questionnaire for the evaluation of PE lessons [30,41] and wrote down their step count from the PE lesson (questionnaire completion took 3–5 min on average).

2.3. Measurements

Yamax Digiwalker SW-700 pedometers (Yamax Corporation, Tokyo, Japan) were used to assess the level of PA in the PE lessons. These pedometers are suitable for monitoring shorter PA bouts, such as PE lessons [42]. The pedometer-derived step count data were not adjusted in any way, but extremely low (<500 steps) and high (>6000 steps) values were excluded [43]. Thus, 195 participants were excluded from the analysis. The pedometers were calibrated prior to each block of data collection with a permissible deviation of 5%. During the PE lesson teachers checked the correct position of the pedometer on the students’ right hip. The PE lessons were scheduled as 45-min lessons in both countries; all of the data are therefore presented as PE lessons/≈45 min.
The PE evaluation questionnaire was used to assess the PE lessons in both countries [30,41]. The questionnaire was anonymous (coded by the pedometer identification number) but included questions about the participants’ sociodemographic and anthropometric characteristics, and their PA-related attitudes (e.g., school, grade, gender, weight, height, self-rated level of fitness and sport performance, and a question asking if PE was the student’s favorite subject). The participants subjectively assessed their current level of fitness in the question: “Indicate, in your opinion, the level of your sports physical performance in relation to other classmates (upper half of the class—lower half of the class)”. The questionnaire included 24 dichotomous questions covering the cognitive, emotional, health, social, relational, and creative domains. The stability coefficient of the questionnaire was rtt = 0.82 at the question level and rtt = 0.92 at the dimension level; the validity coefficient rxy = 0.42 and the internal consistency coefficient equaled 0.63 [30]. The PE lessons questionnaire was standardized, and has been used in research, teacher training and school practice for two decades [see annex 41]. The biggest advantage of the questionnaire is the anonymous subjective evaluation of PE lessons by students (expression of immediate feelings) at the end of their lessons. The main purpose of using the questionnaire was to find out whether the higher physical load in PE lessons will or will not indicate the negative evaluation of PE lessons. The teachers recorded their gender, the gender of their students, and the type of PE lessons according to their content and predominant focus.

2.4. Data Analysis

The data were analyzed using SPSS version 25 (IBM SPSS, Inc., Armonk, NY, USA) and Statistica version 13 (StatSoft, Prague, Czech Republic). Descriptive statistics were used to characterize the samples. The group differences in the PE lesson assessment were evaluated using cross tables with Pearson’s χ2 and Kruskal–Wallis ANOVA. In order to analyze the group differences in the step counts of the PE lessons, one-way ANOVAs and Scheffe’s post hoc test were applied. In order to evaluate the association between the individual step counts and the evaluation of the PE lessons, the Spearman rank order correlations coefficient was used. The odds of a more positive evaluation of PE lessons were estimated using binary logistic regression analyses. Practical significance was estimated using ηp2 and r effect size coefficients (listed as small 0.01 ≤ ηp2 < 0.06, medium 0.06 ≤ ηp2 < 0.14, and large ηp2 ≥ 0.14 and 0.1 ≤ r < 0.2 small; 0.2 ≤ r < 0.6 medium; and r ≥ 0.6 large effect size). Statistical significance was set at p ≤ 0.05.

3. Results

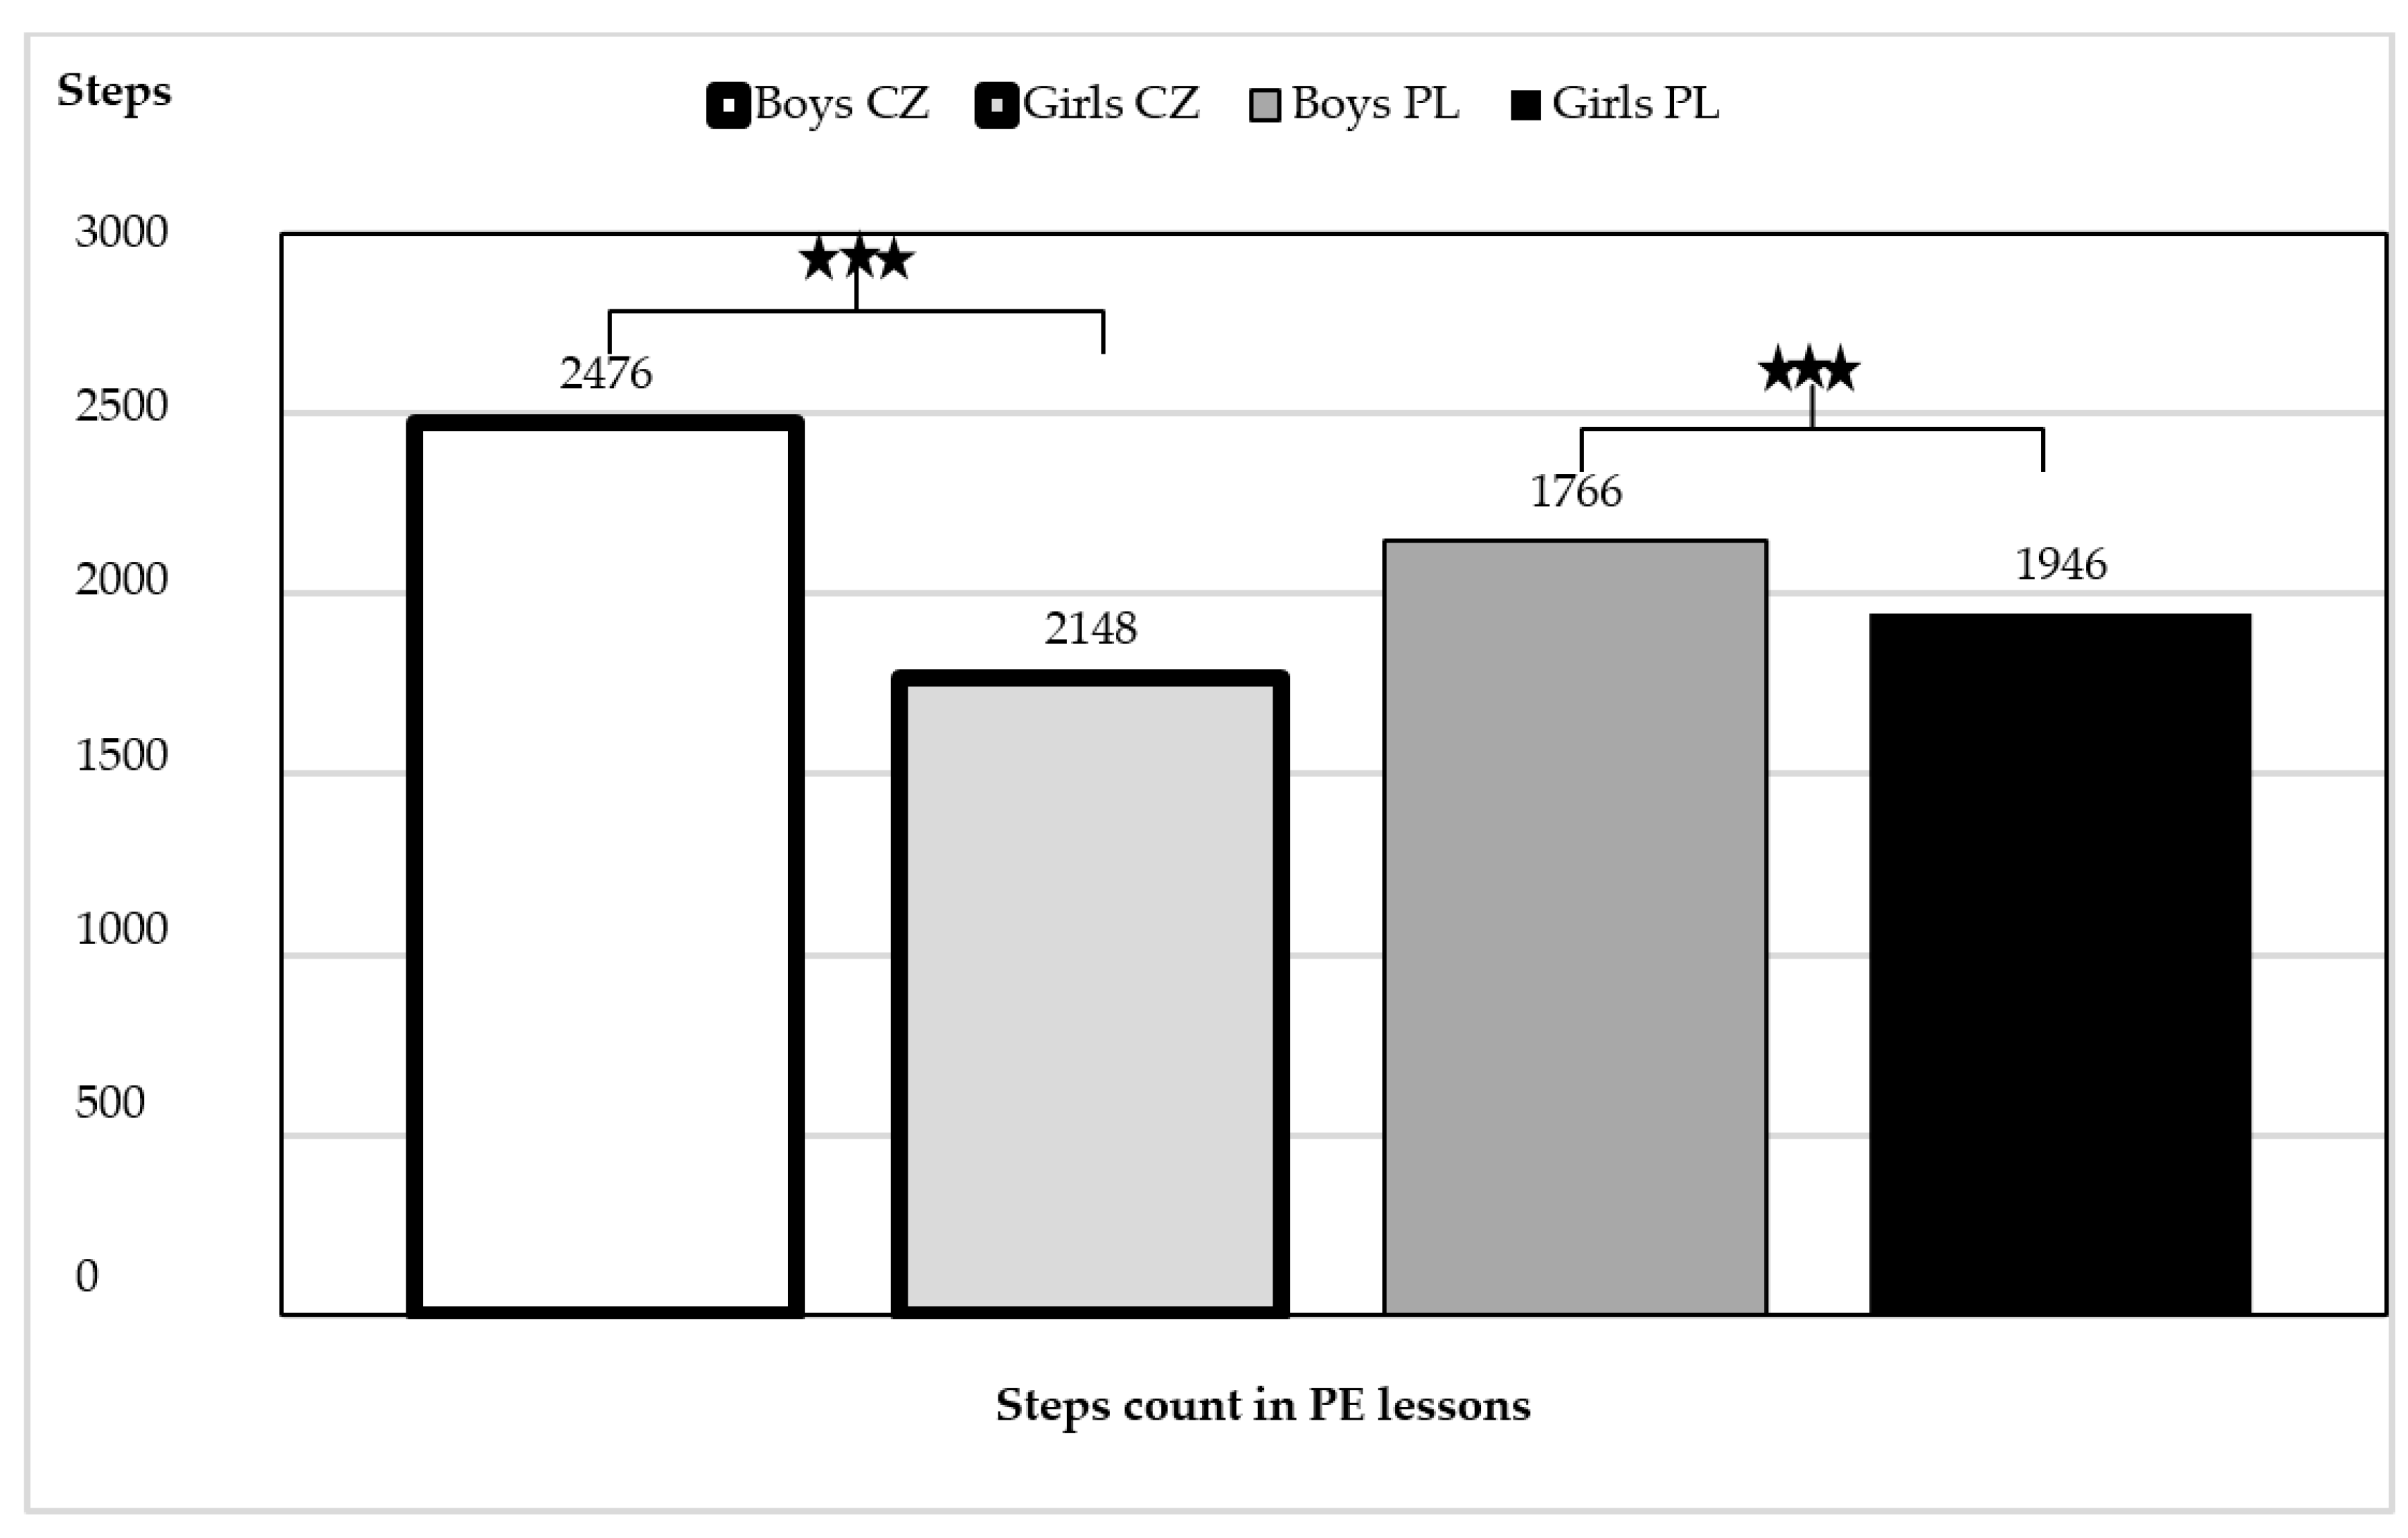
3.1. Average Steps Count in PE Lessons

The average step count in the PE lessons confirmed that both the Czech (p < 0.001) and Polish (p < 0.001) boys reached a higher volume of PA during the PE lessons than did the girls (F(3, 4008) = 154.49, p < 0.001, ηp2 = 0.102) (Figure 1). The Czech boys showed a significantly higher step count than that of the Polish boys (p < 0.001); however, the Polish girls outperformed the Czech girls (p < 0.001).
Concerning the PE content, game-focused PE lessons prevailed, and these lessons resulted in the highest step count (Czech boys, 2591; Polish boys, 2180; Czech girls, 1876; Polish girls, 2030 steps/PE lesson). When soccer—the most popular and preferred game among boys—was played, the boys reported a mean of 2819 steps/PE lesson. When volleyball—the girls’ most popular and preferred game—was scheduled, the girls reached 2181 steps/PE lesson on average.
Overall, a higher step count was observed in both boys and girls during lessons led by male student teachers (boys = 2325 vs. girls = 1941 steps/PE lessons) compared to both lessons led by female student teachers (boys = 2291 vs. girls = 1799) and steps/PE lessons (F(3, 4008) = 11.98, p < 0.001, ηp2 = 0.003).

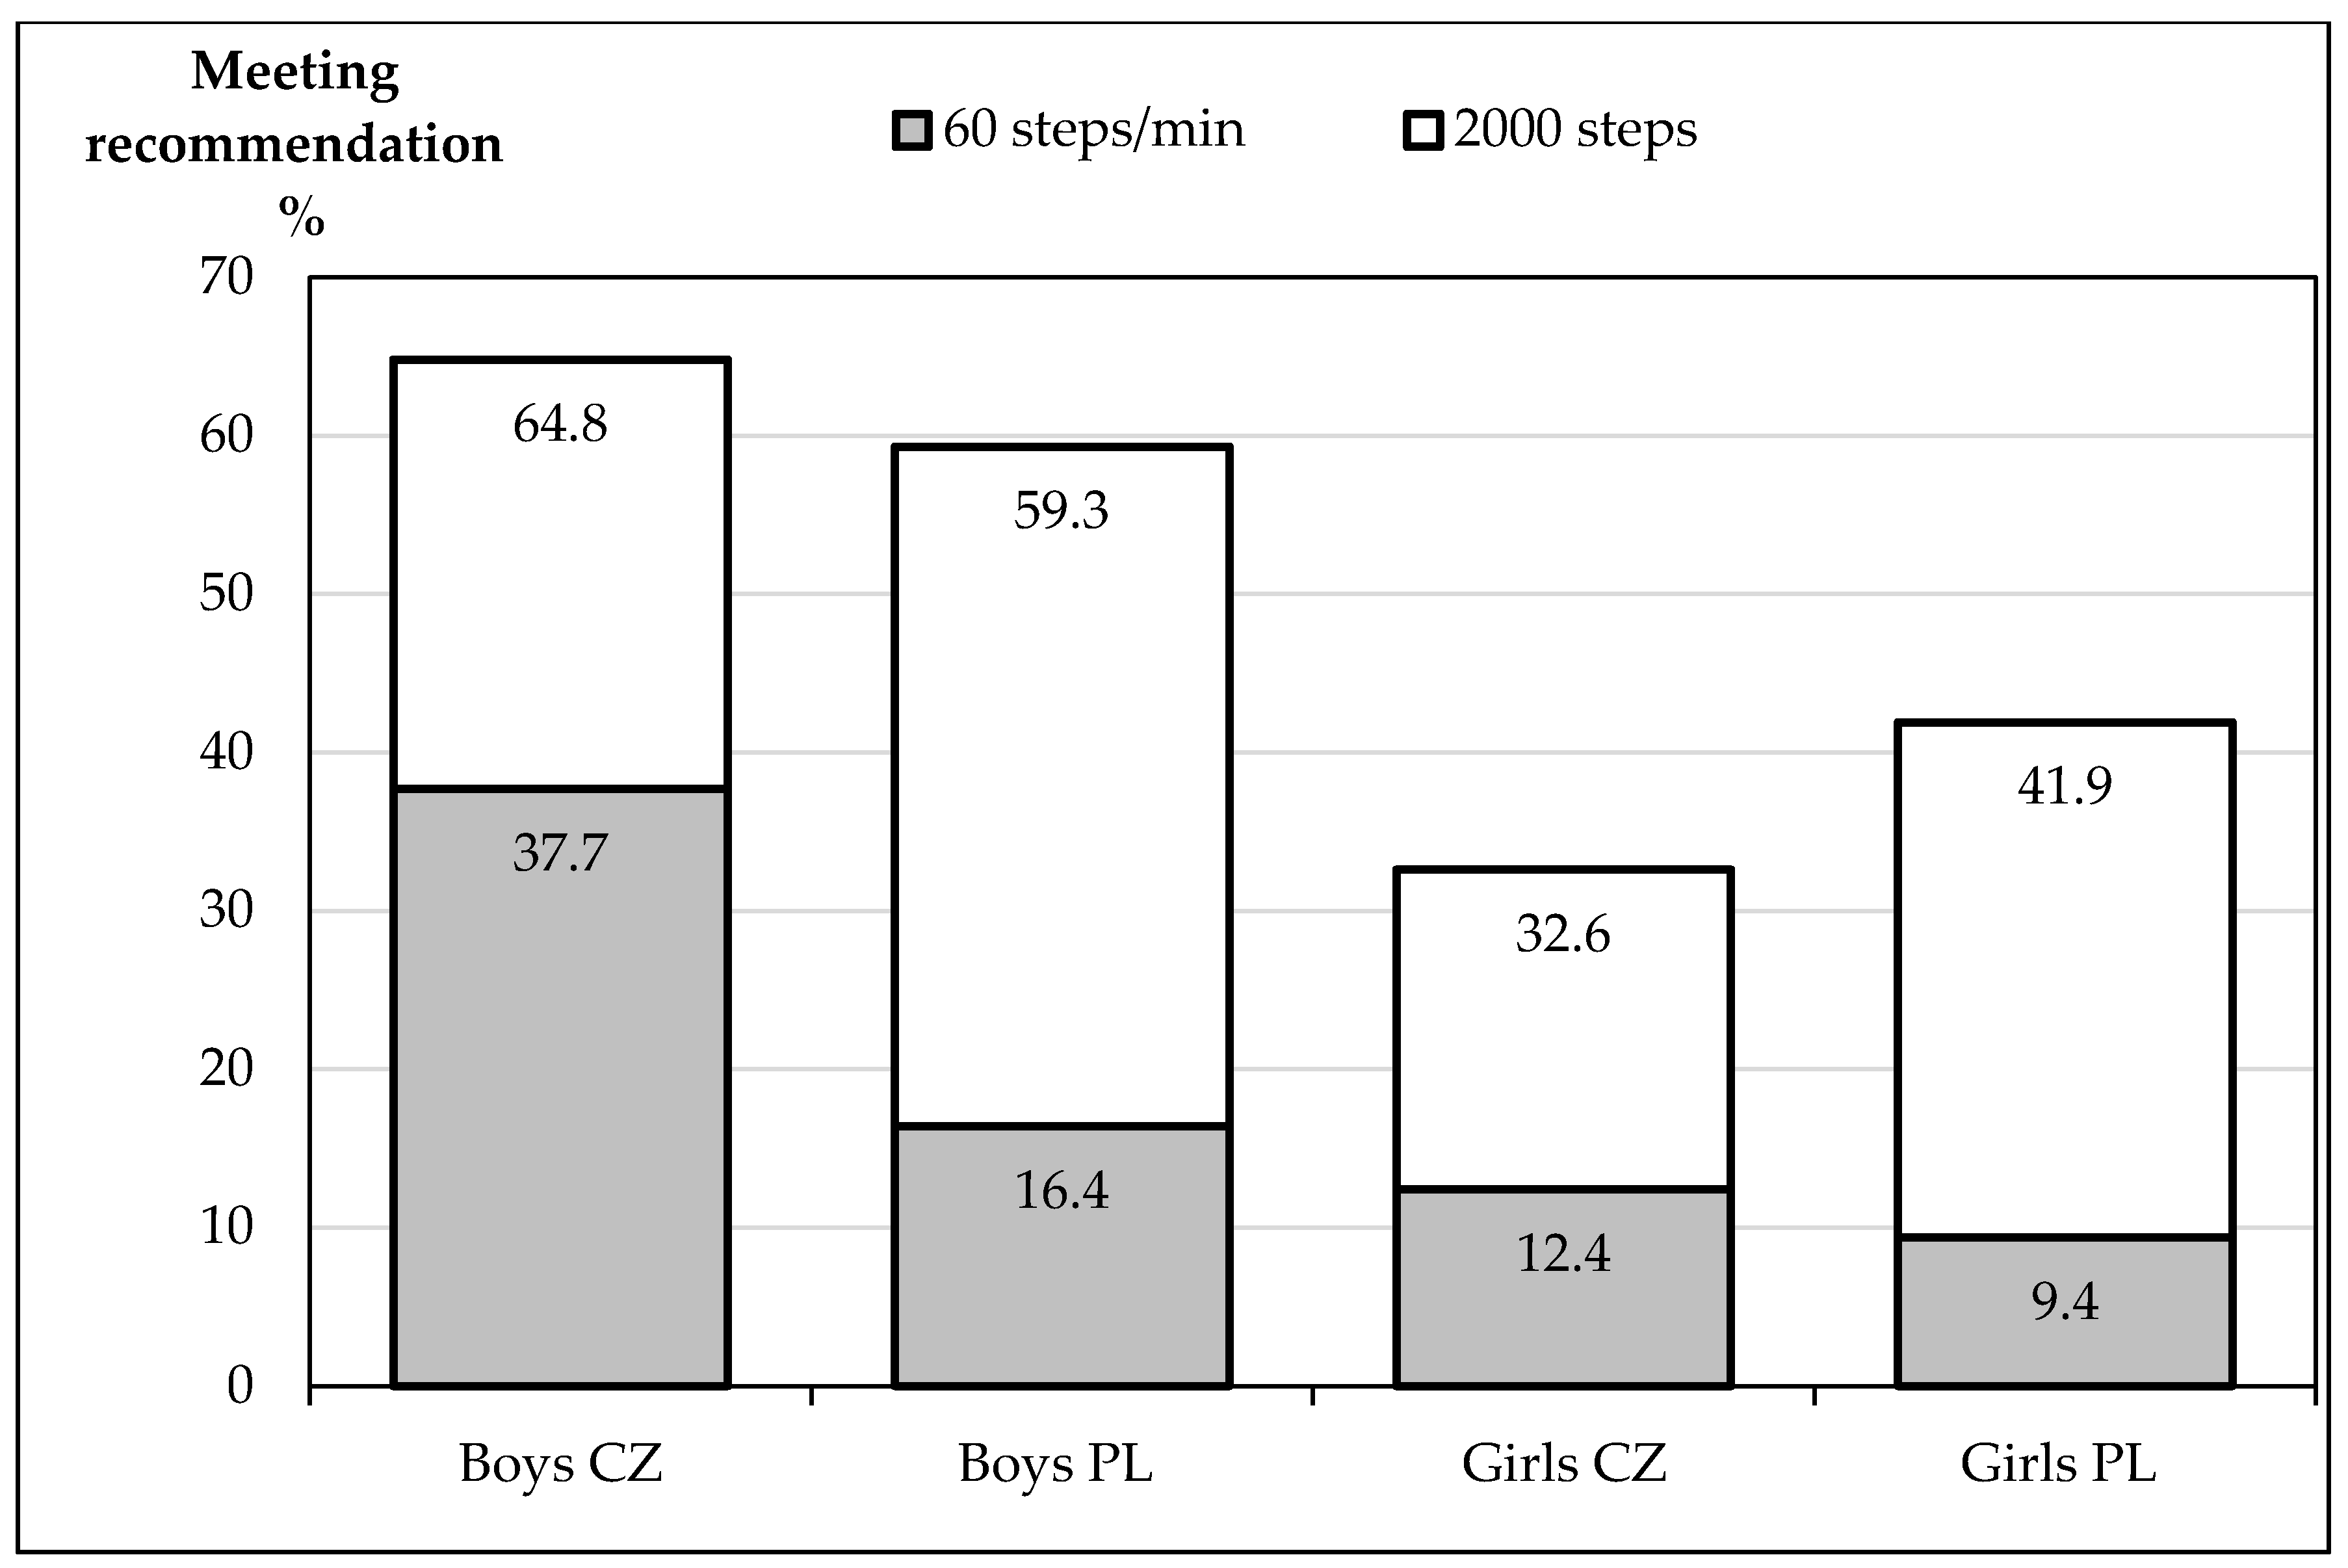
3.2. Achievement of the Recommended 2000 Steps and 60 Steps/Min in PE Lessons

The recommended 2000 steps/PE lesson was most often achieved by Czech boys (64.8%), and least often by Czech girls (32.6%) (Figure 2). Additionally, the recommendation of 60 steps/min was most often achieved by Czech boys (37.7), and least often by Polish girls (9.4%). The differences in the achievement of 2000 steps among Czech and Polish boys and girls were significantly in favor of Czech boys (χ2 = 5.93, p = 0.015; r = 0.052) and Polish girls (χ2 = 20.82, p < 0.001; r = 0.095), while the differences in the achievement of 60/steps/min were in favor of Czech boys (χ2 = 107.18, p < 0.001; r = 0.240) and Czech girls (χ2 = 5.32, p = 0.021; r = 0.047).

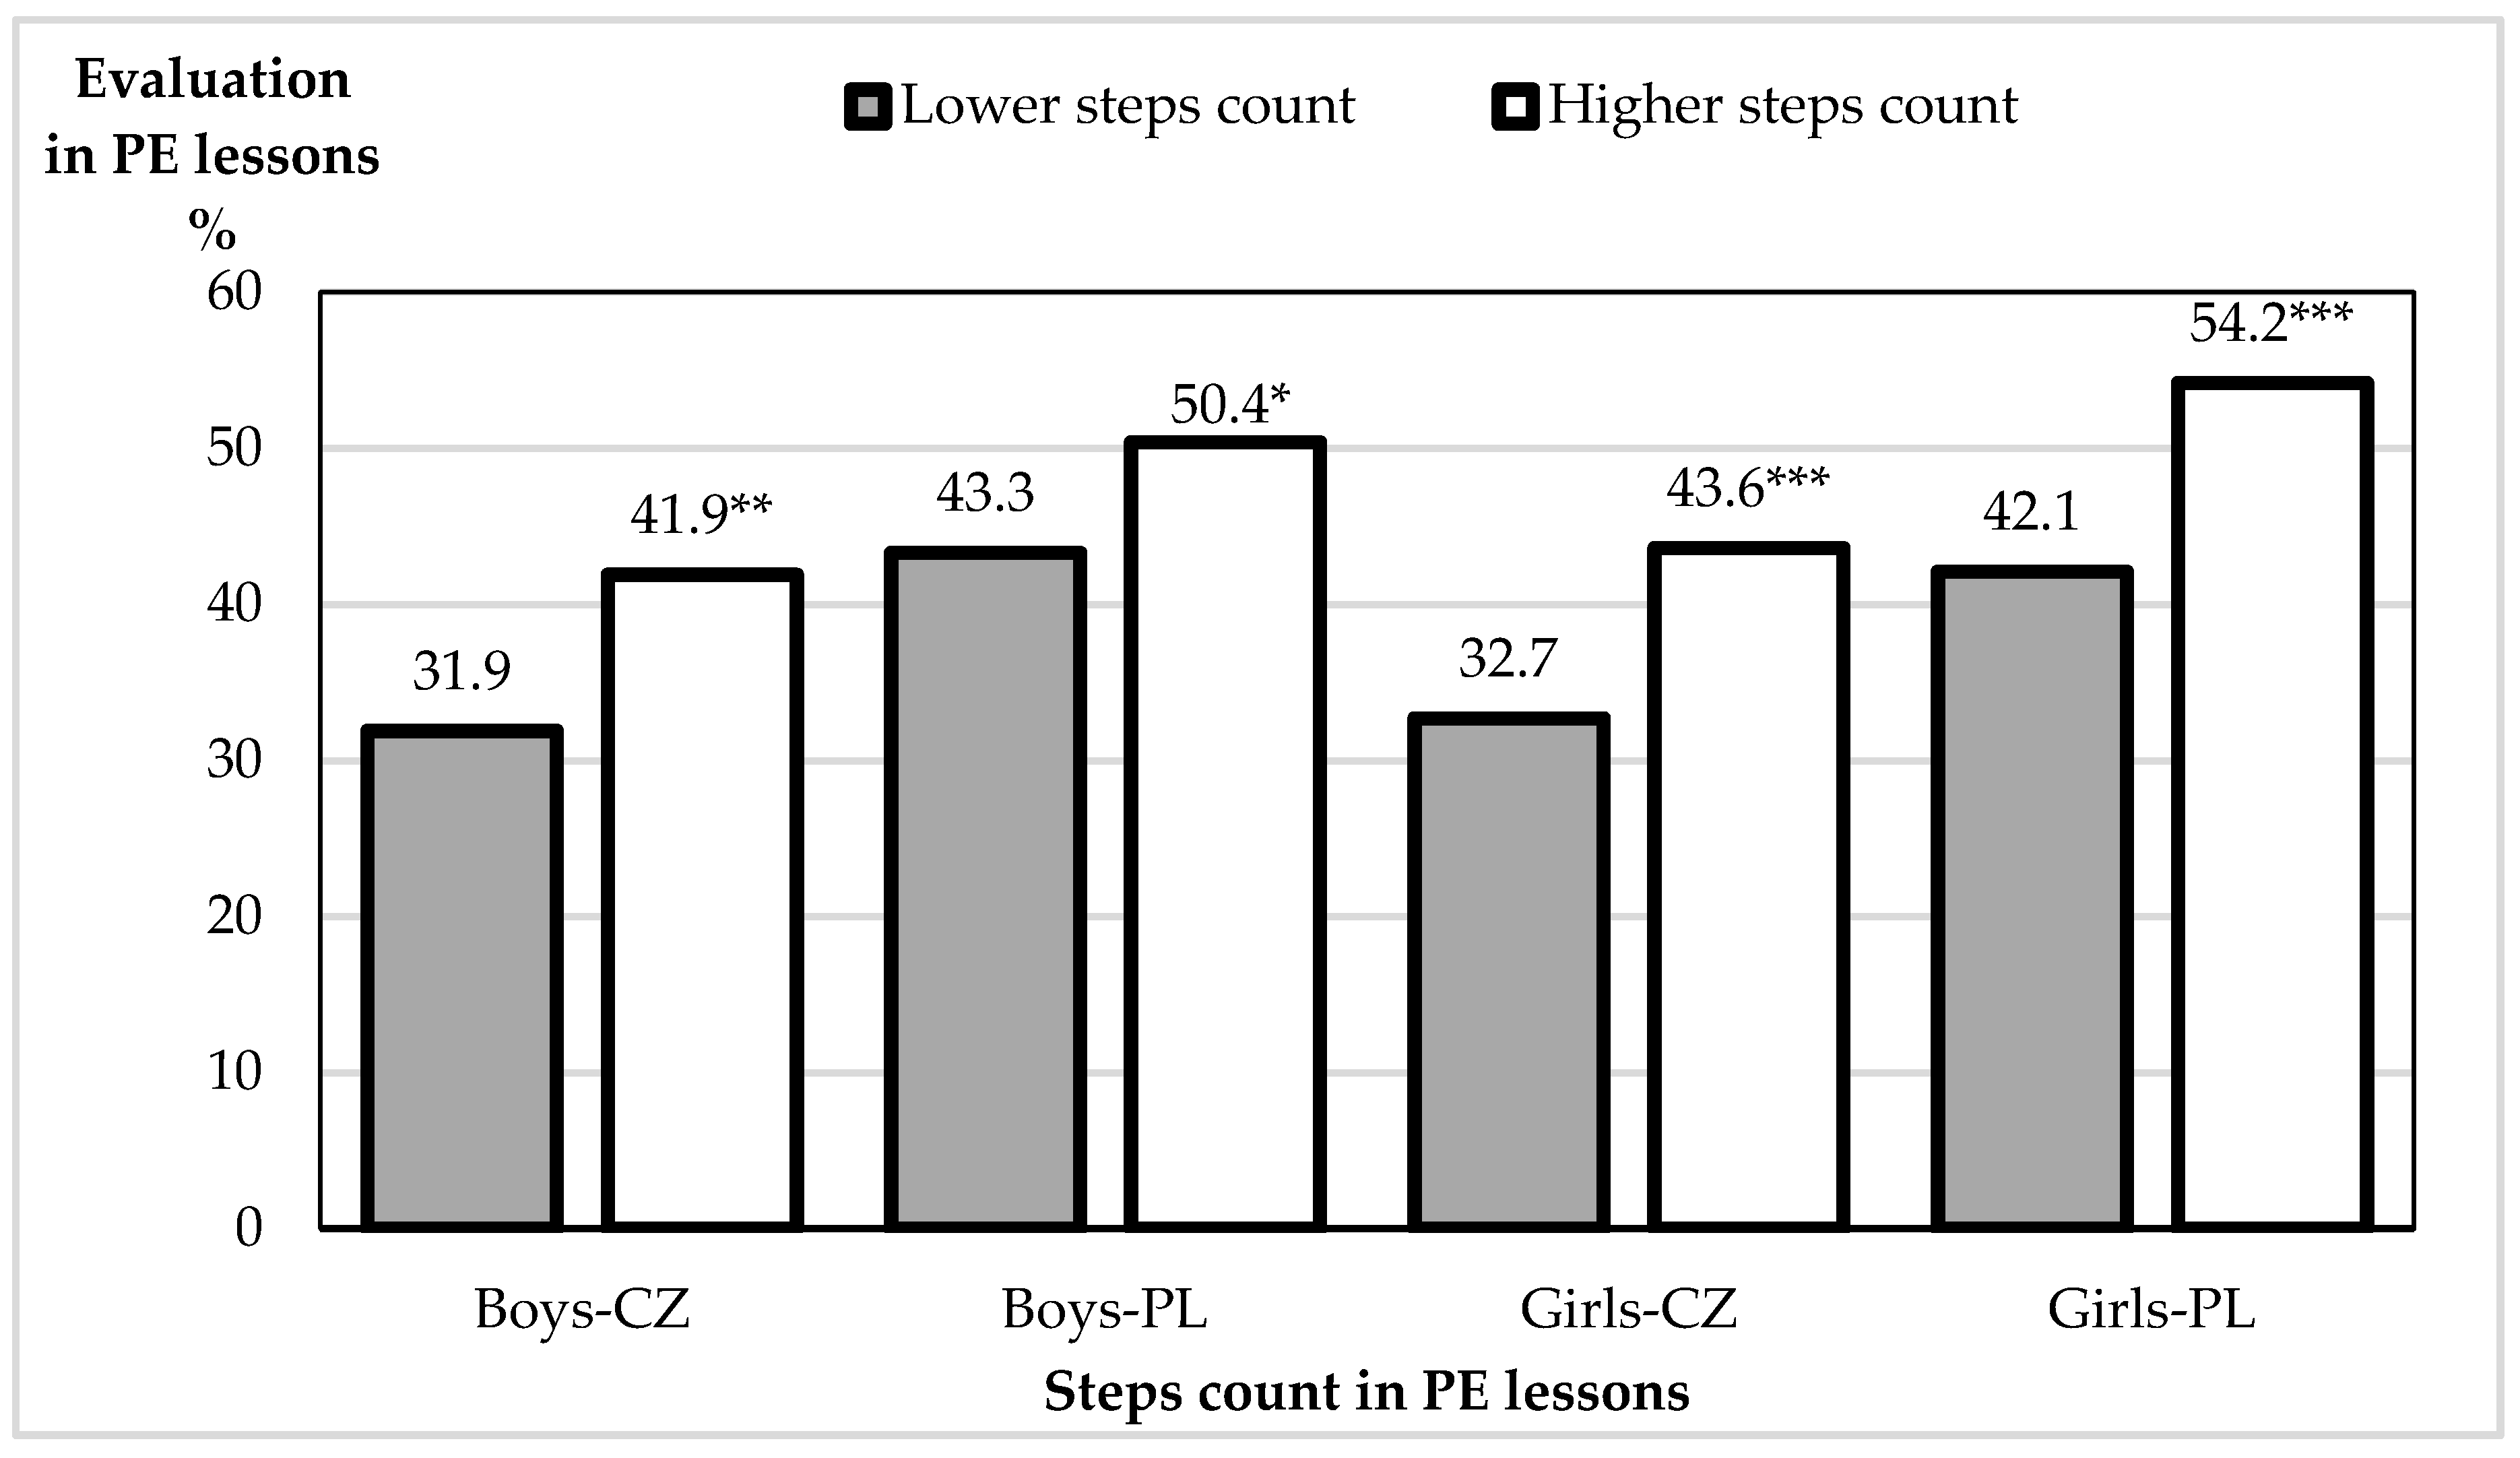
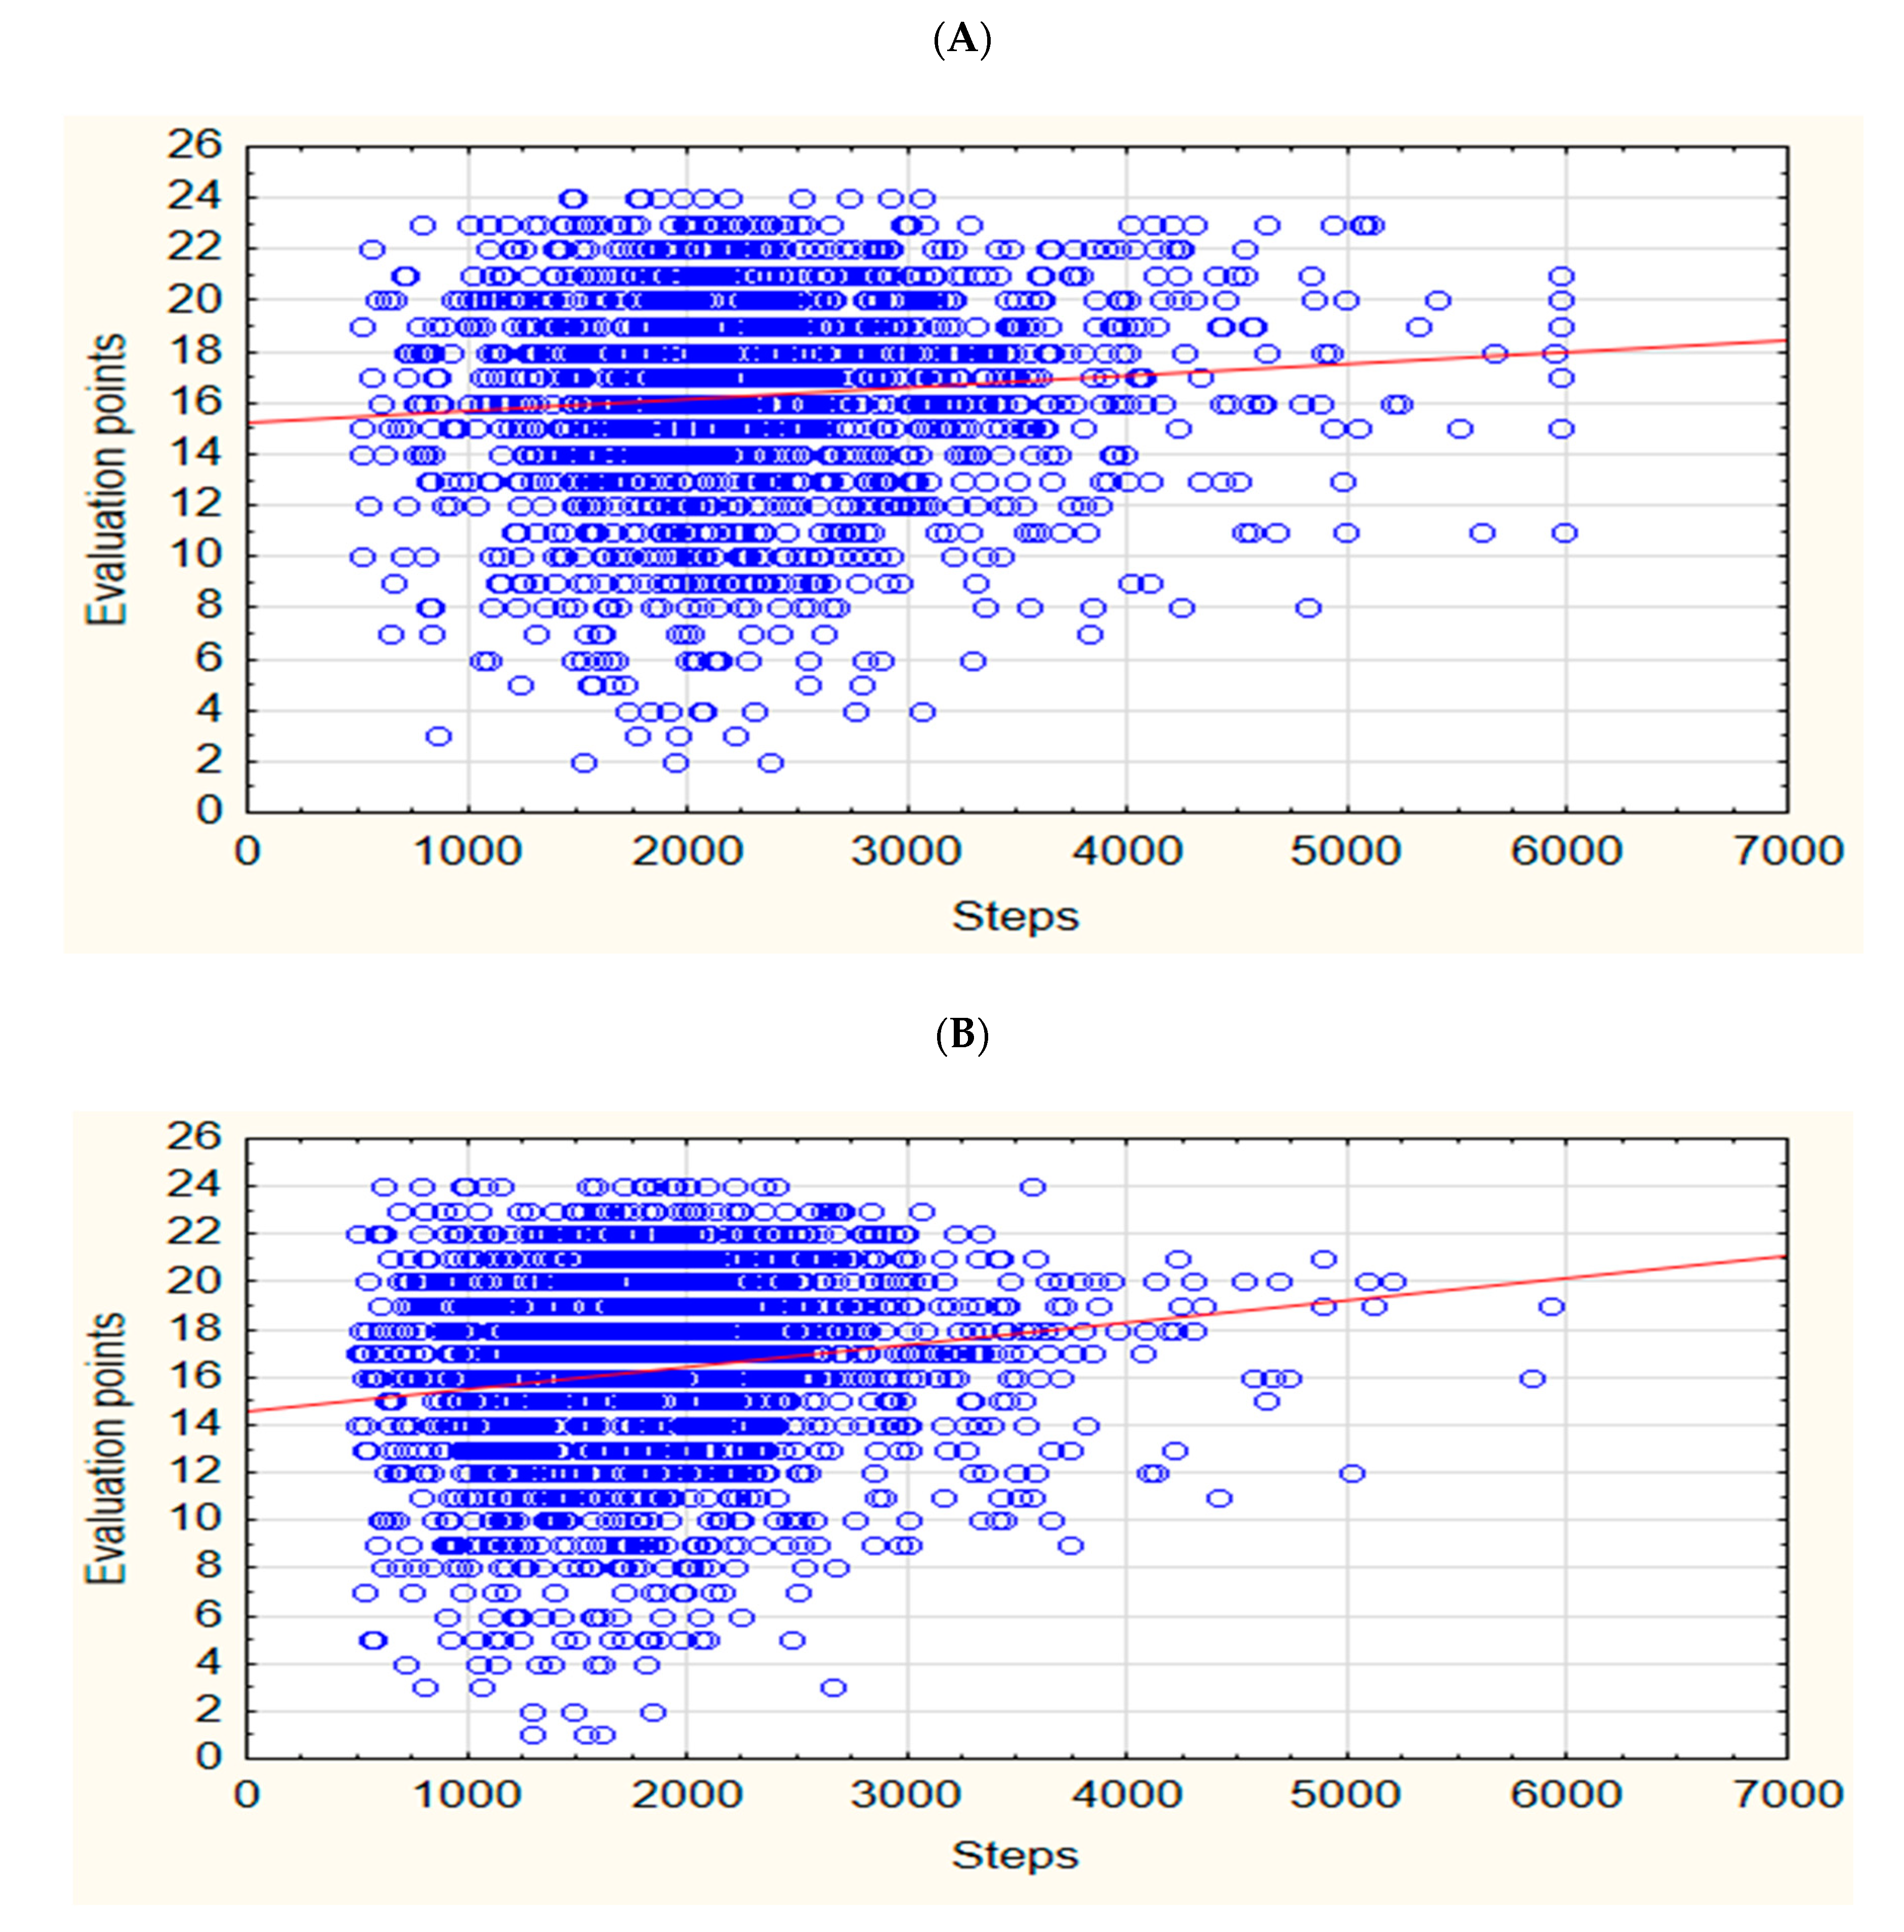
3.3. The Association between Different Evaluations of PE and a Higher/Lower Step Count in PE Lessons

Czech (χ2 = 9.63, p = 0.002; r = 0.099) and Polish (χ2 = 4.62, p = 0.032; r = 0.066) boys, and Czech (χ2 = 14.21, p < 0.001; r = 0.110) and Polish (χ2 = 15.35, p < 0.001; r = 0.119) girls who showed a higher step count in their PE lessons reported a more positive assessment of PE than did their peers with a lower step count (Figure 3).
Furthermore, the association between the individual step count and the PE lesson evaluation confirmed the association group, but on a very low level of statistical significance in both boys (rs = 0.087) and girls (rs = 0.181) (Figure 4).
The Czech and Polish boys with a higher steps count reported a significantly better evaluation of PE in the emotional (p < 0.001) and relational (p = 0.017) dimensions, while girls with a higher step count reported a significantly better evaluation of PE in the cognitive (p < 0.001), emotional (p < 0.001), social (p = 0.034) and relational (p < 0.001) dimensions. The question “In the course of the lesson, did you feel PA satisfaction?” was answered positively by 87.5% of the boys (90.3% of girls) with a higher step count, and by 81.2% of the boys (83.7% of girls) with a lower step count. A total of 80.5% of the boys (87.0% of girls) with a higher step count (76.1% of boys, 80.6% of girls with a lower step count) would like to take the same or a similar lesson next time. A more positive evaluation of PE by both genders was significantly associated with a higher level of PA in the PE lessons, lower age, a higher fitness level, PE popularity, being Polish, and the non-game-oriented type of PE lessons (Table 2).
A higher step count in PE lessons (Model 1) increased the odds of a better evaluation of PE among both boys and girls. The variables entered in Model 2—the popularity of PE and the type of PE lesson—together with age, body mass index, fitness level and country, did not substantially weaken the association (Table 3).
A key finding was that the link between a more positive evaluation of PE lessons and a higher step count was valid for both boys (40.3% vs. 26.7%; p < 0.001) and girls (46.4% vs. 31.8%; p < 0.001) who did not consider PE to be their favorite school subject, and for both boys (50.2% vs. 40.5%; p < 0.003) and girls (57.4% vs. 41.3%; p < 0.001) who self-reported lower fitness and sport performance levels.

4. Discussion

Our finding that boys had a higher step count/PE lesson than did girls is consistent with the findings of previous studies [16,22,44]. The main reasons that the boys in our sample were more physically active in PELs compared to the girls are that—in both countries—single-sex PELs prevail, the PEL content is primarily focused on ball games, and fitness-oriented PA is preferred by boys [45]. It was also demonstrated that the girls preferred individual sports and volleyball as a team sport [46]. Girls often prefer volleyball for its lower physical intensity, but the girls in our sample reached 2081 steps on average in volleyball-focused lessons (the boys achieved 2230 steps). The observed average step counts in the PE lessons were lower than the values presented by Hodges, Wicke and Flores-Marti [47], and Marmeleira, Aldeias and Graça [48].
The finding that a higher step count in PE lessons, as expressed by step counts, is associated with a more positive evaluation of PE among both boys and girls is a serious one. Overall, girls and boys rated PE similarly, which corresponds to the secular trend in the evaluation of PE lessons witnessed between 2000 and 2011 [30]. Similarly, positive attitudes towards PE among secondary-school–aged boys and girls were reported by Zeng, Hipscher and Leung [49]. In contrast, Marmeleira, Aldeias and Graça [48], and Mašanović [50] observed a less positive attitude towards PE in girls than in boys. However, a direct comparison of adolescents’ evaluations of PE is problematic due to methodological differences.
Research on the association between PE evaluation and the level of the step count in PE is crucial because the proportion of vigorous PA in adolescents’ overall weekly PA has decreased [25,44]. McKenzie et al. [16] highlighted the low proportion of vigorous PA in PE (14% of PE time). Similarly, Smith, Monnat and Lounsbery [5] reported that 17% of PE time was spent in VPA. Increasing the step count in PE lessons in shorter time intervals can significantly increase VPA in PE lessons, and can thus promote it to obtain stable well-being benefits [51]. There is a declining trend in the positive evaluation of PELs in the Czech Republic, especially among girls [30]. The positive evaluation of PE lessons by adolescents is also important because secondary school students are increasingly involved in the development of comprehensive school PA programs, educational strategies, and school-based lifestyles. Feelings of satisfaction obtained from higher levels of PA and increased individual responsibility for PA in PE lessons may promote PA outside of school, as suggested by Merino-Barrero et al. [52]. They may also support the students’ knowledge of PA and fitness, which are associated with decreased sedentary behavior [53].
Most adolescents in Europe and Central Europe do not meet the PA and daily step count recommendations [54,55,56,57]; this assertion is supported by the fact that only 35 of 131 European studies report that youth meet the daily PA recommendations [58]. PE lessons do not adequately fulfil the educational, motivational, emotional, and physical needs of children and adolescents, thus supporting the critique by Hills, Dengel and Lubans [3]. Overall, the step count/PE lesson in our sample accounted for 21.0% and 16.3% of the daily recommended 11,000 steps for boys and girls, respectively, which is lower than the results of Smith, Lounsbery and McKenzie [22].
Adolescents usually fail to meet the recommendation of having PE lessons consist of at least 50% MVPA [4]. Observing the achievement of this recommendation is beneficial but difficult to perform. Furthermore, it is not motivating for less-engaged students. Scruggs [42] attempted to simplify the control of the PA level in PE lessons; his indicators are based on steps/min in PE lessons (optimum of 83.6 for boys and 79.8 for girls), and they show better applicability in practice. The current results and our existing experience with the practical application of PA recommendations resulted in a recommendation of 2000 steps/PE lesson in the Central European region [38,54].
Despite the gender differences in the step count/PE lesson, the authors do not endorse discrimination in the form of recommendations based on gender, as recommended by da Silva et al. [59]. It is crucial to respect the specific features of the development of adolescent girls, and to support PA focused on the development of the bone system, i.e., PE aimed at osteoporosis prevention [60], which usually yields higher step counts.
Given the tradition of school PE, organized sports, and trends in PA preferences, the recommendation of at least 2000 steps is appropriate for most PE lesson types in Central European countries. This applies especially to all types of PE lessons of a locomotor (bipedal) nature. This recommendation is also consistent with school PA recommendations [38,54]. Regarding the trends in sedentary behavior in adolescents [61,62], the failure to reach 2000 steps/PE lesson (locomotion-based) should not be justified by any well-intentioned teaching aims of PE. Most PE teaching aims need to be achieved through PA. A simplified understanding of the number of steps (or similar PA recommendations) merely as a PE aim is unacceptable from a didactic perspective. A higher proportion of students achieving 2000 steps while in school can be supported by using modern technologies and wearables in PE lessons, by adhering to school PA programs, and by promoting positive lifestyle changes among adolescents. Monitoring PA in PE lessons may increase the decision-making and responsibility of students in PE lessons, as recommended by García-González et al. [63] for volleyball teaching. Participation in PA can promote an awareness of feelings of satisfaction in higher PA, and can promote autonomy, competence, the relatedness to others in PA, which are important psychosocial factors supporting the health of adolescents [64]. It can also encourage the use of wearables for the monitoring of PA in students’ daily life, clarify possible negative motivational effects of wearables [65], and support the adoption of physical literacy [66]. In this context, it is of great importance to educate adolescents, as they are critical consumers of healthy lifestyle technology [67].
Future research should focus on the verification of the benefit of using wearables in PE lessons with regard to the improvement of physical and health literacy in adolescents, and the achievement of PA recommendations during the main segment of the school day.

5. Strengths and Limitations

The strength of this study lies in its focus on step counts and the evaluation of PE in a habitual school environment in two countries with different educational systems. The authors suppose that the evidence presented in this study reflects, with a high degree of probability, the actual PE situation in Czech and Polish schools, and probably also in Central and Eastern European schools. Additionally, the immediate anonymous evaluation of PE lessons by the participants is a rare research approach, although it has been successfully used in students’ teaching practices.
Although the purpose of the pedometers was to collect data on PE step counts, PA monitoring could have affected the actual selection and presentation of the PE content. A limit of the study is also the tolerance of the time deviations (±5 min) from the fixed time of 45 min per PE lesson. Moreover, the predominance of single-sex PE lessons makes it difficult to generalize the results.

6. Conclusions

The findings of this study confirmed that both the Czech and Polish boys reached a higher level of PA during the PE lessons than did the girls. Overall, a higher step count was observed in both boys and girls during lessons led by male student teachers compared to both lessons led by female student teachers and steps/PE lessons.
This study shows that a higher step count is associated with a better evaluation of PE lessons among Czech and Polish adolescents. The association between a more positive evaluation of PE lessons and a higher number of steps/PE lesson was valid for both boys and girls who did not consider PE to be their favorite school subject, and who reported themselves as having lower fitness and sport performance levels. On average, the boys and girls from both countries reached 2311 and 1852 steps/PE lesson, respectively. The recommendation of 2000 steps was achieved by 62% of boys and 37% of girls. It is possible to increase the physical load of girls in PE lessons without negatively affecting the girls’ association with PA in an effort to reduce the differences in boys’ and girls’ PA in PE lessons. The use of wearables to monitor step counts in PE lessons and a simplified estimate of PA volume and intensity in PE lessons informs the habitual school environment, and can be stimulating for physical literacy adoption. The results of the study should serve as support for the restoration of habits of regular PA in the post-pandemic time. Monitoring PA in PE lessons, and their immediate evaluation, form an essential background for PA promotion strategies as part of comprehensive school PA programs, and provide interesting information to school administration officials and teachers of health-related subjects.

Author Contributions

Conceptualization, Z.S. and K.S.; methodology, K.F. and D.G.; investigation, Z.S., K.S. and D.G.; writing–original draft preparation, K.F. and J.M. All authors have read and agreed to the published version of the manuscript.

Funding

This research was funded by the Czech Science Foundation under Grant No. 13-32935S: “The objectification of comprehensive monitoring of school mental and physical strain in adolescents in the context of physical and mental condition”.

Institutional Review Board Statement

The study was conducted according to the guidelines of the Declaration of Helsinki, and approved by the Institutional Ethics Committee of the Faculty of Physical Culture, Palacký university Olomouc (protocol code 24/2012).

Informed Consent Statement

Informed consent was obtained from all subjects involved in the study.

Data Availability Statement

The data from this study are available on request by contacting the corresponding author.

Conflicts of Interest

The authors declare no conflict of interest.

References

  1. American Heart Association. Increasing and Improving Physical Education and Physical Activity in Schools: Benefits for Children’s Health and Educational Outcomes. 2015. Available online: https://www.heart.org/idc/groups/heart-public/@wcm/@adv/documents/downloadable/ucm_473782.pdf (accessed on 10 January 2021).
  2. Klakk, H.; Andersen, L.B.; Heidemann, M.; Møller, N.C.; Wedderkopp, N. Six physical education lessons a week can reduce cardiovascular risk in school children aged 6–13 years: A longitudinal study. Scand. J. Public Health 2014, 42, 128–136. [Google Scholar] [CrossRef] [Green Version]
  3. Hills, A.P.; Dengel, D.R.; Lubans, D.R. Supporting public health priorities: Recommendations for physical education and physical activity promotion in schools. Prog. Cardiovasc. Dis. 2015, 57, 368–374. [Google Scholar] [CrossRef] [Green Version]
  4. Hollis, J.L.; Sutherland, R.; Williams, A.J.; Campbell, E.; Nathan, N.; Wolfenden, L.; Morgan, P.J.; Lubans, D.R.; Gillham, K.; Wiggers, J. A systematic review and meta-analysis of moderate-to-vigorous physical activity levels in secondary school physical education lessons. Int. J. Behav. Nutr. Phys. Act. 2017, 14, 52. [Google Scholar] [CrossRef] [PubMed]
  5. Smith, N.J.; Monnat, S.M.; Lounsbery, M.A.F. Physical activity in physical education: Are longer lessons better? J. Sch. Health 2015, 85, 141–148. [Google Scholar] [CrossRef] [PubMed] [Green Version]
  6. Francis, C.E.; Longmuir, P.E.; Boyer, C.; Andersen, L.B.; Barnes, J.D.; Boiarskaia, E.; Cairney, J.; Faigenbaum, A.D.; Faulkner, G.; Hands, B.P.; et al. The Canadian assessment of physical literacy: Development of a model of children’s capacity for a healthy, active lifestyle through a delphi process. J. Phys. Act. Health 2016, 13, 214–222. [Google Scholar] [CrossRef] [PubMed]
  7. Liu, J.; Xiang, P.; Lee, J.; Li, W. Developing physically literacy in K-12 physical education through achievement goal theory. J. Teach. Phys. Educ. 2017, 36, 292–302. [Google Scholar] [CrossRef]
  8. Lundvall, S. Physical literacy in the field of physical education—A challenge and a possibility. J. Sport Health Sci. 2015, 4, 113–118. [Google Scholar] [CrossRef] [Green Version]
  9. Young, L.; O’Connor, J.; Alfrey, L. Physical literacy: A concept analysis. Sport Educ. Soc. 2019, 25, 946–959. [Google Scholar] [CrossRef]
  10. Institute of Medicine. Educating the Student Body: Taking Physical Activity and Physical Education to School; Kohl, H.W., III, Cook, H.D., Eds.; The National Academies Press: Washington, DC, USA, 2013. [Google Scholar]
  11. Scruggs, P.W. Quantifying physical activity in physical education via pedometry: A further analysis of steps/min guidelines. J. Phys. Act. Health 2013, 10, 734–741. [Google Scholar] [CrossRef] [PubMed]
  12. European Parliamentary Research Service. Physical Education in EU Schools. 2016. Available online: http://www.europarl.europa.eu/thinktank/en/document.html?reference=EPRS_BRI(2016)593559 (accessed on 18 January 2021).
  13. Fröberg, A.; Raustorp, A.; Pagels, P.; Larsson, C.; Boldemann, C. Levels of physical activity during physical education lessons in Sweden. Acta Paediatr. 2017, 106, 135–141. [Google Scholar] [CrossRef]
  14. Hollis, J.L.; Sutherland, R.; Campbell, L.; Morgan, P.J.; Lubans, D.R.; Nathan, N.; Wolfenden, L.; Okely, A.D.; Davies, L.; Williams, A.; et al. Effects of a ‘school-based’ physical activity intervention on adiposity in adolescents from economically disadvantaged communities: Secondary outcomes of the ‘Physical Activity 4 Everyone’ RCT. Int. J. Obes. 2016, 40, 1486–1493. [Google Scholar] [CrossRef] [PubMed] [Green Version]
  15. Martínez-López, E.J.; Grao-Cruces, A.; Moral-García, J.E.; Pantoja-Vallejo, A. Intervention for Spanish overweight teenagers in physical education lessons. J. Sports Sci. Med. 2012, 11, 312–321. [Google Scholar] [PubMed]
  16. McKenzie, T.L.; Marshall, S.J.; Sallis, J.F.; Conway, T.L. Student activity levels, lesson context, and teacher behavior during middle school physical education. Res. Q. Exerc. Sport 2000, 71, 249–259. [Google Scholar] [CrossRef]
  17. Centers for Disease Control and Prevention. Secular Changes in Physical Education Attendance among U.S. High School Students. YRBS 1991–2013; Centers for Disease Control and Prevention: Columbia, SC, USA, 2016. [Google Scholar]
  18. Clennin, M.N.; Demissie, Z.; Michael, S.L.; Wright, C.; Silverman, S.; Chriqui, J.; Pate, R.R. Secular changes in physical education attendance among U.S. high school students, 1991–2015. Res. Q. Exerc. Sport 2018, 89, 403–410. [Google Scholar] [CrossRef]
  19. Mooses, K.; Pihu, M.; Riso, E.-M.; Hannus, A.; Kaasik, P.; Kull, M. Physical education increases daily moderate to vigorous physical activity and reduces sedentary time. J. Sch. Health 2017, 87, 602–607. [Google Scholar] [CrossRef] [PubMed]
  20. Lonsdale, C.; Rosenkranz, R.R.; Peralta, L.R.; Bennie, A.; Fahey, P.; Lubans, D.R. A systematic review and meta-analysis of interventions designed to increase moderate-to-vigorous physical activity in school physical education lessons. Prev. Med. 2013, 56, 152–161. [Google Scholar] [CrossRef] [PubMed]
  21. Gralla, M.H.; Alderman, B.L. Effects of physical education on cognition and total daily activity. Res. Q. Exerc. Sport 2013, 84, A72. [Google Scholar] [CrossRef]
  22. Smith, N.J.; Lounsbery, M.A.F.; McKenzie, T.L. Physical activity in high school physical education: Impact of lesson context and class gender composition. J. Phys. Act. Health 2014, 11, 127–135. [Google Scholar] [CrossRef]
  23. Fairclough, S.; Stratton, G. ‘Physical education makes you fit and healthy’. Physical education’s contribution to young people’s physical activity levels. Health Educ. Res. 2005, 20, 14–23. [Google Scholar] [CrossRef] [PubMed] [Green Version]
  24. Armstrong, N. Young people are fit and active—Fact or fiction? J. Sport Health Sci. 2012, 1, 131–140. [Google Scholar] [CrossRef] [Green Version]
  25. Corder, K.; Sharp, S.J.; Atkin, A.J.; Andersen, L.B.; Cardon, G.; Page, A.; Davey, R.; Grøntved, A.; Hallal, P.C.; Janz, K.F.; et al. Age-related patterns of vigorous-intensity physical activity in youth: The International Children’s Accelerometry Database. Prev. Med. Rep. 2016, 4, 17–22. [Google Scholar] [CrossRef] [PubMed] [Green Version]
  26. Groffik, D.; Mitáš, J.; Jakubec, L.; Svozil, Z.; Frömel, K. Adolescents’ physical activity in education systems varying in the number of weekly physical education lessons. Res. Q. Exerc. Sport 2020, 91, 551–561. [Google Scholar] [CrossRef] [PubMed]
  27. Van Hecke, L.; Verhoeven, H.; Clarys, P.; Van Dyck, D.; Van de Weghe, N.; Baert, T.; Deforche, B.; Van Cauwenberg, J. Factors related with public open space use among adolescents: A study using GPS and accelerometers. Int. J. Health Geogr. 2018, 17, 3. [Google Scholar] [CrossRef] [PubMed]
  28. Althoff, T.; White, R.W.; Horvitz, E. Influence of Pokémon Go on physical activity: Study and implications. J. Med. Internet Res. 2016, 18, e315. [Google Scholar] [CrossRef] [PubMed]
  29. Palakshappa, D.; Virudachalam, S.; Oreskovic, N.M.; Goodman, E. Adolescent physical education class participation as a predictor for adult physical activity. Child. Obes. 2015, 11, 616–623. [Google Scholar] [CrossRef] [Green Version]
  30. Frömel, K.; Vašíčková, J.; Svozil, Z.; Chmelík, F.; Skalik, K.; Groffik, D. Secular trends in pupils’ assessments of physical education lessons in regard to their self-perception of physical fitness across the educational systems of Czech Republic and Poland. Eur. Phys. Educ. Rev. 2014, 20, 145–164. [Google Scholar] [CrossRef]
  31. Sigmund, E.; Sigmundová, D.; Frömel, K.; Vašíčková, J. Preferred contents in physical education lessons—Positively evaluated means for the achievement of a higher intensity of physical activity by girls. Acta Univ. Palacki. Olomuc. Gymn. 2010, 40, 7–10. [Google Scholar]
  32. Subramaniam, P.R.; Silverman, S. Middle school students’ attitudes toward physical education. Teach. Teach. Educ. 2007, 23, 602–611. [Google Scholar] [CrossRef]
  33. European Commission. EU Physical Activity Guidelines: Recommended Policy Actions in Support of Health-Enhancing Physical Activity; Education and Culture DG: Brussels, Belgium, 2008. [Google Scholar]
  34. U.S. Department of Health and Human Services. Physical Activity Guidelines for Americans, 2nd ed.; U.S. Department of Health and Human Services: Washington, DC, USA, 2018.
  35. Adams, M.A.; Johnson, W.D.; Tudor-Locke, C. Steps/day translation of the moderate-to-vigorous physical activity guideline for children and adolescents. Int. J. Behav. Nutr. Phys. Act. 2013, 10, 49. [Google Scholar] [CrossRef] [PubMed] [Green Version]
  36. SHAPE of the Nation. Status of Physical Education in the USA. 2016. Available online: https://www.shapeamerica.org/uploads/pdfs/son/Shape-of-the-Nation-2016_web.pdf (accessed on 25 January 2021).
  37. Pate, R.R.; Davis, M.G.; Robinson, T.N.; Stone, E.J.; McKenzie, T.L.; Young, J.C. Promoting physical activity in children and youth. Circulation 2006, 114, 1214–1224. [Google Scholar] [CrossRef] [Green Version]
  38. Frömel, K.; Groffik, D.; Mitáš, J.; Madarasová Gecková, A.; Csányi, T. Physical activity recommendations for segments of school days in adolescents: Support for health behavior in secondary schools. Front. Public Health 2020, 8, 527442. [Google Scholar] [CrossRef] [PubMed]
  39. Pate, R.R.; Dowda, M. Raising an active and healthy generation: A comprehensive public health initiative. Exerc. Sport Sci. Rev. 2019, 47, 3–14. [Google Scholar] [CrossRef]
  40. Martinek, T.; Hemphill, M.A. The evolution of Hellison’s teaching personal and social responsibility model in out-of-school contexts. J. Teach. Phys. Educ. 2020, 39, 331–336. [Google Scholar] [CrossRef]
  41. Frömel, K.; Stratton, G.; Vasendova, J.; Pangrazi, R.P. Dance as a fitness activity. The impact of teaching style and dance form. JOPERD 2002, 73, 26–30. [Google Scholar] [CrossRef]
  42. Scruggs, P.W. Pedometer steps/min in physical education: Does the pedometer matter? J. Sci. Med. Sport 2013, 16, 36–39. [Google Scholar] [CrossRef]
  43. Frömel, K.; Vašíčková, J.; Skalik, K.; Svozil, Z.; Groffik, D.; Mitáš, J. Physical activity recommendations in the context of new calls for change in physical education. Int. J. Environ. Res. Public Health 2021, 18, 1177. [Google Scholar] [CrossRef]
  44. Katzmarzyk, P.T.; Lee, I.-M.; Martin, C.K.; Blair, S.N. Epidemiology of physical activity and exercise training in the United States. Prog. Cardiovasc. Dis. 2017, 60, 3–10. [Google Scholar] [CrossRef] [PubMed]
  45. Kudlacek, M.; Fromel, K.; Groffik, D. Associations between adolescents’ preference for fitness activities and achieving the recommended weekly level of physical activity. J. Exerc. Sci. Fit. 2020, 18, 31–39. [Google Scholar] [CrossRef] [PubMed]
  46. Křen, F.; Kudláček, M.; Wasowicz, W.; Groffik, D.; Frömel, K. Gender differences in preferences of individual and team sports in Polish adolescents. Acta Univ. Palacki. Olomuc. Gymn. 2012, 42, 43–52. [Google Scholar] [CrossRef] [Green Version]
  47. Hodges, M.; Wicke, J.; Flores-Marti, I. Tactical games model and its effects on student physical activity and gameplay performance in secondary physical education. Phys. Educat. 2018, 75, 99–115. [Google Scholar] [CrossRef]
  48. Marmeleira, J.F.F.; Aldeias, N.M.C.; Graça, P.M.d.S.M.d. Physical activity levels in Portuguese high school physical education. Eur. Phys. Educ. Rev. 2012, 18, 191–204. [Google Scholar] [CrossRef]
  49. Zeng, H.Z.; Hipscher, M.; Leung, R.W. Attitudes of high school students toward physical education and their sport activity preferences. J. Soc. Sci. 2011, 7, 529–537. [Google Scholar] [CrossRef]
  50. Mašanović, B. Gender and age differences in attitudes of Serbian pupils toward physical education lessons and their preferences regarding lesson organisation. Croat. J. Educ. 2019, 21, 213–231. [Google Scholar] [CrossRef]
  51. Kaczmarek, L.D.; Behnke, M.; Enko, J.; Hoffman, A.; Kiciński, M.; Paruszewski, J.; Szabat, M.; Dombrowski, S.U. Would you be happier if you moved more? Physical activity focusing illusion. Curr. Psychol. 2019. [Google Scholar] [CrossRef] [Green Version]
  52. Merino-Barrero, J.A.; Valero-Valenzuela, A.; Pedreño, N.B.; Fernandez-Río, J. Impact of a sustained TPSR program on students’ responsibility, motivation, sportsmanship, and intention to be physically active. J. Teach. Phys. Educ. 2020, 39, 247–255. [Google Scholar] [CrossRef]
  53. Liu, Y.; Chen, S. Students’ knowledge and behaviors for active living: A cross-sectional survey study. J. Teach. Phys. Educ. 2020, 39, 206–215. [Google Scholar] [CrossRef]
  54. Frömel, K.; Svozil, Z.; Chmelík, F.; Jakubec, L.; Groffik, D. The role of physical education lessons and recesses in school lifestyle of adolescents. J. Sch. Health 2016, 86, 143–151. [Google Scholar] [CrossRef] [Green Version]
  55. Gába, A.; Rubín, L.; Badura, P.; Roubalová, E.; Sigmund, E.; Kudláček, M.; Sigmundová, D.; Dygrýn, J.; Hamrik, Z. Results from the Czech republic’s 2018 report card on physical activity for children and youth. J. Phys. Act. Health 2018, 15, S338–S340. [Google Scholar] [CrossRef] [Green Version]
  56. Sigmundová, D.; El Ansari, W.; Sigmund, E.; Frömel, K. Secular trends: A ten-year comparison of the amount and type of physical activity and inactivity of random samples of adolescents in the Czech Republic. BMC Public Health 2011, 11, 731. [Google Scholar] [CrossRef] [Green Version]
  57. World Health Organization Regional Office for Europe. Physical Activity Factsheets for the 28 European Union Member States of the WHO European Region. 2018. Available online: https://www.euro.who.int/en/health-topics/disease-prevention/physical-activity/publications/2018/factsheets-on-health-enhancing-physical-activity-in-the-28-eu-member-states-of-the-who-european-region (accessed on 20 January 2020).
  58. Guinhouya, B.C.; Samouda, H.; de Beaufort, C. Level of physical activity among children and adolescents in Europe: A review of physical activity assessed objectively by accelerometry. Public Health 2013, 127, 301–311. [Google Scholar] [CrossRef]
  59. Da Silva, M.P.; Fontana, F.E.; Callahan, E.; Mazzardo, O.; De Campos, W. Step-count guidelines for children and adolescents: A systematic review. J. Phys. Act. Health 2015, 12, 1184–1191. [Google Scholar] [CrossRef] [PubMed]
  60. Janz, K.F.; Thomas, D.Q.; Ford, M.A.; Williams, S.M. Top 10 research questions related to physical activity and bone health in children and adolescents. Res. Q. Exerc. Sport 2015, 86, 5–12. [Google Scholar] [CrossRef]
  61. Gába, A.; Rubín, L.; Sigmund, E.; Badura, P.; Dygrýn, J.; Kudláček, M.; Sigmundová, D.; Materova, E.; Hamrik, Z.; Jakubec, A.; et al. Executive summary of the Czech Republic’s 2018 Report Card on Physical Activity for Children and Youth. Acta Gymn. 2019, 49, 92–102. [Google Scholar] [CrossRef]
  62. Yang, L.; Cao, C.; Kantor, E.D.; Nguyen, L.H.; Zheng, X.; Park, Y.; Giovannucci, E.L.; Matthews, C.E.; Colditz, G.A.; Cao, Y. Trends in sedentary behavior among the US population, 2001–2016. JAMA 2019, 321, 1587–1597. [Google Scholar] [CrossRef]
  63. García-González, L.; Abós, Á.; Diloy-Peña, S.; Gil-Arias, A.; Sevil-Serrano, J. Can a hybrid sport education/teaching games for understanding volleyball unit be more effective in less motivated students? An examination into a set of motivation-related variables. Sustainability 2020, 12, 6170. [Google Scholar] [CrossRef]
  64. Doré, I.; Sylvester, B.; Sabiston, C.; Sylvestre, M.-P.; O’Loughlin, J.; Brunet, J.; Bélanger, M. Mechanisms underpinning the association between physical activity and mental health in adolescence: A 6-year study. Int. J. Behav. Nutr. Phys Act. 2020, 17, 9. [Google Scholar] [CrossRef] [Green Version]
  65. Kerner, C.; Goodyear, V.A. The motivational impact of wearable healthy lifestyle technologies: A self-determination perspective on Fitbits with adolescents. Am. J. Health Educ. 2017, 48, 287–297. [Google Scholar] [CrossRef] [Green Version]
  66. Marttinen, R.; Landi, D.; Fredrick, R.N., III; Silverman, S. Wearable digital technology in PE: Advantages, barriers, and teachers’ ideologies. J. Teach. Phys. Educ. 2020, 39, 227–235. [Google Scholar] [CrossRef]
  67. Goodyear, V.A.; Kerner, C.; Quennerstedt, M. Young people’s uses of wearable healthy lifestyle technologies; surveillance, self-surveillance and resistance. Sport Educ. Soc. 2017, 24, 212–225. [Google Scholar] [CrossRef] [Green Version]
Figure 1. Comparison of the step count/PE lesson (45 min) among Czech (CZ) and Polish (PL) boys and girls; statistical significance of the differences: *** p < 0.001.
Sustainability 13 04569 g001
Figure 2. Meeting the recommendation of 2000 steps and 60 steps/minute in the PE lessons (45 min) of Czech (CZ) and Polish (PL) boys and girls.
Sustainability 13 04569 g002
Figure 3. The association between the evaluation of PE lessons (worse and better by median scoring) and the step count in the PE lessons (lower and higher by median steps count) in Czech (CZ) and Polish (PL) boys and girls; statistical significance of the differences: * p < 0.05; ** p < 0.01; *** p < 0.001.
Sustainability 13 04569 g003
Figure 4. The association between the individual evaluation of PE lessons and the step count in PE lessons in boys (A) and girls (B).
Sustainability 13 04569 g004
Table 1. Sample characteristics.
CharacteristicnAge (years)
M (SD)
Weight (kg)
M (SD)
Height (cm)
M (SD)
Body Mass Index (kg/m2)
M (SD)
Boys CZ92516.45 (1.34)69.20 (11.65)177.71 (8.51)21.84 (2.90)
Boys PL93316.16 (1.02)68.89 (12.23)176.95 (8.21)21.90 (3.06)
Girls CZ116716.39 (1.22)56.40 (7.92)166.53 (6.78)20.31 (2.38)
Girls PL106716.08 (0.93)56.15 (8.53)165.77 (6.12)20.41 (2.74)
Note: M = mean; SD = standard deviation; PL = Poland; CZ = Czech Republic.
Table 2. The association of PE lesson evaluation and PA level in PE, and other moderators.
VariablesPE Lessons Evaluation
BoysGirls
Lower
n (%)
Higher
n (%)
χ2prLower
n (%)
Higher
n (%)
χ2pr
Number steps in PE lessons
Lower573
(61.7)
356
(38.3)
10.220.0010.073711
(63.6)
407
(36.4)
39.40<0.0010.132 *
Higher505
(54.4)
424
(45.6)
563
(50.5)
553
(49.5)
Age (years)
<17614
(55.1)
500
(44.9)
9.620.0020.070740
(55.3)
599
(44.7)
4.240.0400.044
≥17464
(62.4)
280
(37.6)
534
(59.7)
361
(40.3)
Body mass index
<25.0928
(57.4)
690
(42.6)
2.270.1320.0331206
(57.0)
911
(43.0)
0.060.8060.000
≥25.0150
(62.5)
90
(37.5)
68
(58.1)
49
(48.91)
Fitness level
Higher749
(54.9)
616
(45.1)
20.92<0.0010.104 *742
(53.2)
654
(46.8)
22.81<0.0010.099
Lower329
(66.7)
164
(33.3)
532
(63.5)
306
(36.5)
Popularity of PE
Yes617
(49.0)
641
(51.0)
128.78<0.0010.263 *569
(45.3)
688
(54.7)
162.24<0.0010.243 **
No461
(76.8)
139
(23.2)
705
(72.2)
272
(27.8)
Country
Czech Rep.578
(62.5)
347
(37.5)
15.09<0.0010.090732
(62.7)
435
(37.3)
32.36<0.0010.120 *
Poland500
(53.6)
433
(46.4)
542
(50.8)
525
(49.2)
Type of PE lessons
Games650
(62.6)
388
(37.4)
20.44<0.0010.104 *709
(62.9)
419
(37.1)
31.57<0.0010.118 *
Other428
(52.2)
392
(47.8)
565
(51.1)
541
(48.9)
Note: χ2 = Pearson’s chi-square; p = statistical significance; r = coefficient effect size; BMI = body mass index; * small effect size; ** medium effect size.
Table 3. Odds ratios of the positive evaluation of PE lessons, stratified by gender.
VariablesBoysGirls
Model 1Model 2Model 1Model 2
OR
(95% CI)
pOR
(95% CI)
pOR
(95% CI)
pOR
(95% CI)
p
Steps/PE lessons
Lower steps ref.
Higher steps1.351
(1.123–1.626)
0.0011.272
(1.032–1.569)
0.0241.716
(1.449–2.032)
<0.0011.636
(1.361–1.959)
<0.001
Age (years)
≥17 ref.
<17 0.987
(0.801–1.216)
0.901 0.892
(0.739–1.076)
0.231
Body mass index
≥25 kg/m2 ref.
<25 kg/m2 0.812
(0.601–1.096)
0.173 0.998
(0.670–1.486)
0.991
Fitness level
Higher ref.
Lower
0.973
(0.758–1.249)
0.830 0.991
(0.814–1.208)
0.931
Popularity of PE
No ref.
Yes
3.158
(2.464–4.048)
<0.001 2.830
(2.298–3.485)
<0.001
Country
Poland ref
Czech Rep. 0.913
(0.739–1.128)
0.399 1.002
(0.825–1.217)
0.980
Type of PELs
Games ref.
Other 1.351
(1.081–1.689)
0.008 1.345
(1.111–1.627)
<0.001
Notes: OR = odds ratio; CI = confidence interval. Model 1 = lower and higher numbers of steps in PE lessons; Model 2 = adjusted for age, body mass index, fitness, the popularity of PE, countries, and the type of PE lessons.
Publisher’s Note: MDPI stays neutral with regard to jurisdictional claims in published maps and institutional affiliations.

