Article

The Impact of Cross-Border R&D Sourcing on the Innovation Quality of MNCs, from the Perspective of Business Model Innovation

1
International Business School, Yunnan University of Finance and Economics, Kunming 650032, China
2
School of Management, Zhejiang University of Technology, Hangzhou 310014, China
*
Author to whom correspondence should be addressed.
Sustainability 2021, 13(8), 4579; https://0-doi-org.brum.beds.ac.uk/10.3390/su13084579
Submission received: 31 March 2021 / Revised: 13 April 2021 / Accepted: 16 April 2021 / Published: 20 April 2021
(This article belongs to the Special Issue Sustainable Cross-Border Business Models)

Abstract

:
In the literature on business model innovation (BMI) in multinational corporations (MNCs), the influence of cross-border R&D (Research and development) sourcing on innovation performance has been widely discussed; however, from a BMI perspective, apart from innovation performance, the innovation quality is also important. In addition, absorptive capacity and institutional distance are important indicators of MNCs’ innovation quality, although there have been few studies of the moderating effects on the relationship between R&D sourcing and innovation quality. Based on this research gap, starting from the perspective of BMI and by constructing a research framework that includes R&D intensity, R&D diversity, and innovation quality, this paper takes China’s high-tech MNCs as the research object to obtain a sustainable innovative business model. Further, absorptive capacity and institutional distance serve as moderating variables to study the moderating role of the relationship between R&D sourcing and the innovation quality of MNCs. This paper presents the following research findings. During the process of cross-border BMI, R&D intensity has a significant, inverted U-shaped relationship with innovation quality; R&D diversity has a significant negative linear relationship with innovation quality; and absorptive capacity and institutional distance each have a moderating effect on the above relationships.

1. Introduction

With the acceleration of global economic integration, to achieve business model innovation (BMI), a growing number of multinational corporations (MNCs) are internationalizing their R&D (Research and development) activities. As important subjects of foreign direct investment (FDI), instead of being satisfied with domestic production and R&D, MNCs have looked toward the global market, maximized the use of advanced technological resources from other countries, and progressively realized R&D sourcing through effective resource allocation and development to realize BMI [1]. According to the Word Investment Report 2020, the uncertainty of FDI has been exacerbated because of COVID-19, geopolitics, and persistent trade tensions. Predictably, global FDI flows were expected to fall 40% from the previous year to a record low in 2020. In 2020, the expected profits of the world’s 5000 largest multinationals were cut by an average of 40%, with a particularly sharp drop in outward foreign direct investment (OFDI) flows to emerging economies. Thus, it is evident that the OFDI of MNCs from emerging economies has become a tendency [2]. The “spring-board theory”, which was proposed by Luo and Tung, explains that firms from emerging economies choose FDI to gain profits from global competition and to overcome the “disadvantages of latecomers” [3]. Therefore, MNCs consider R&D in foreign countries as an important resource to enhance their innovation capabilities, realize technological catch-up, and further achieve BMI by arranging and utilizing global resources [4].
In the field of innovation, BMI is an emerging research topic that has broadened the range of innovation phenomena [5,6]. For high-tech firms, innovation is an important way to maintain sustainable development and enhance competitiveness. To transform R&D results, firms must further realize BMI, which plays a crucial role in this process [6]. This is especially the case for MNCs in emerging economies, which must usually imitate advanced business models first and then assimilate them with existing business models. In addition, compared to those in developed countries, the innovation incentive system of MNCs in emerging economies is not perfect, which leads to high R&D inputs; therefore, those firms gradually embark on cross-border R&D sourcing [7]. Thus, when a firm conducts R&D sourcing, the acquired technology only has potential commercial value. However, when a firm adopts a BMI strategy and commercializes the technology, it will obtain ample commercial returns, which will further affect its innovation motivation. Therefore, BMI is inextricably linked to R&D sourcing and innovation, and it is necessary to study the relationship between the two factors from the perspective of BMI.
With the increasing complexity of technological innovation, BMI is an important strategy for the sustainable development of MNCs. Only by formulating unique BMI strategies can MNCs gain competitive advantages, improve innovation performance, and stand out in fierce market environments [8,9]. However, at present, the innovation performance of MNCs in emerging economies has been significantly improved, while the overall innovation quality is unsatisfactory and the innovation effect is not yet ideal; thus, there is a large gap between them and comparable firms in innovative countries. For instance, according to the World Intellectual Property Indicators Report 2019 released by the World Intellectual Property Organization (WIPO), the number of patent applications handled by China’s State Intellectual Property Office reached 1.54 million in 2018, accounting for 46.4% of the global total and ranking first in the world. However, according to the Global Innovation Index Report 2019, China’s innovation index has been on the rise for four consecutive years; however, the innovation ranking is only at 14th in the world. This indicates that although MNCs lead in the number of patent applications, their innovation abilities and qualities are still not sufficient. In addition, the overall international competitiveness of China’s MNCs is not strong, and impetuses for R&D inputs, innovation outputs and BMI are inadequate. At present, China’s MNCs are shifting from focusing only on innovation quantity to considering both innovation quantity and quality to achieve sustainable development [10]. Therefore, with the advance of China’s “Go global” strategy, the research on the factors affecting the innovation quality of MNCs is the key to BMI.
From the perspective of BMI, cross-border R&D sourcing significantly influences the improvement of innovation abilities. Arvanitis and Hollenstein regarded technology exploration and business model innovation as the most important motivations for Chinese MNC R&D sourcing to promote innovative firm performance [11,12]. Nieto and Rodriguez analyzed the positive impacts on MNCs’ innovation performance from the perspective of R&D outsourcing [1]. Meanwhile, MNCs can benefit from geographical and specialized superiority in R&D sourcing, thereby improving innovation quality, and further realizing BMI. However, some scholars have drawn conclusions about the negative correlation and nonlinear relationship between R&D sourcing and innovation quality [13,14]. Lahiri analyzed the nonlinear relationship between R&D sourcing and innovation performance from the perspective of knowledge sharing [15]. Feinberg and Gupta studied the inhibiting effects of R&D sourcing on MNCs’ innovation performance from the perspective of resource allocation and found that the diseconomies of scale obtained by excessive resource allocation will affect MNCs’ innovation performance [16]. With the cross-border R&D of MNCs rising every year, the depth and geographical diversification of R&D continue to strengthen and expand, and the relationship between R&D sourcing and innovation quality must be further studied if MNCs want to achieve successful BMI.
At present, the research on cross-border R&D sourcing and MNC innovation mainly focuses on firms in developed countries, while research on firms from emerging economies is rare. However, there are significant differences in cross-border R&D activities between those two areas of focus [12]. Currently, there are few studies on the factors influencing innovation quality, and there are even fewer studies on the influence of the R&D sourcing of emerging economies on innovation quality from the perspective of BMI. Therefore, this paper takes Chinese MNCs as the research object, investigates the impacts on the innovation quality of cross-border R&D sourcing, and employs panel data from 2013 to 2018 as the sample for empirical analysis. This paper mainly attempts to answer the following two key questions.: (1) from the perspective of BMI, do different dimensions of R&D sourcing affect the innovation quality of MNCs?; and (2) do absorptive capacity and institutional distance affect the relationship between cross-border R&D sourcing and innovation quality?
The framework for the remaining part of this paper is as follows. The Section 2 presents the theoretical basis and research hypothesis. Based on a review of the previous literature, we analyze the relationship between the different dimensions of R&D sourcing and innovation quality from the perspective of business model innovation, as well as the moderating effect of absorptive capacity and institutional distance on the above relationship, and then propose theoretical models and hypotheses. The Section 3 includes the study’s research design and analysis of sample selection, data sources, variable selection, and regression model establishment. The Section 4 provides empirical analysis using the Poisson panel model, which mainly includes statistical tests, empirical results analysis and robustness tests. The last part presents conclusions and insights, including analysis of the research findings, theoretical contributions, management implications, limitations, and prospects for future research.

2. Literature Review and Hypotheses Development

2.1. Innovation Quality

According to the literature on BMI, innovation quality is one of the most important factors that affect the business model innovation of MNCs [17]. Based on the theory of quality management and innovation management, innovation quality is proposed. The early research on innovation and quality remained at a superficial level. Haner first proposed the concept of innovation quality and distinguished it from quality innovation [18]. Quality innovation aims to improve quality and performance within an existing scope, while innovation quality is a dynamic characteristic, with a range of fields of innovation performance constituting innovation quality. Based on the existing research, this paper defines innovation quality as the sum of the performance in each innovation field during the business process of a firm including the measurement of innovation performance and new products and services. Compared with innovation performance, innovation quality can measure a firm’s actual and potential innovation ability and comprehensively consider the entire process of innovation, which is the key to BMI [19]. Innovation quality includes all of the measurement standards related to new products or services, which fully reflects innovation output and ability [15,20]. A study proposed by Wu on the innovation strategy and organizational innovation of 1000 large-scale firms in Taiwan revealed that innovation quality is an influencing factor of innovation performance [9], which means that high innovation quality results in high innovation performance. A firm must take quality into account when it innovates a new business model, factoring in aspects including the quality, service, process, and management of products. Moreover, an innovation strategy and organizational innovation will improve innovation quality and further promote BMI.

2.2. Cross-Border R&D Sourcing and Innovation Quality of MNCs

During the process of business model innovation, MNCs’ cross-border R&D sourcing plays a vital role for innovation quality. R&D sourcing is an important strategy for firms conducting R&D activities at home and abroad, which can provide access to specialized knowledge [21]. Cross-border R&D sourcing can return to the investment and development path theory of MNCs proposed by Dunning, which analyzed the determinants of MNCs to invest abroad under the framework of the “Ownership-Internalization-Location “(OIL) paradigm. According to R&D sourcing strategies, emerging economy MNCs achieve cross-border R&D sourcing, transnational expansion, and BMI by establishing competitive advantages through foreign R&D activities. Current studies focus on the reversed influence of foreign investments on MNCs’ R&D behaviors. Through cross-border mergers, acquisition, establishment of international R&D institutions, and technology alliances, MNCs can obtain innovation resources from throughout the world, which can facilitate the absorption of the proprietary knowledge of other countries and expand the market scale [22]. From the perspective of emerging economy MNCs’ BMI, by categorizing the research on the classification of cross-border R&D sourcing, it can be divided into R&D intensity and diversity [13,15,22].

2.2.1. R&D Intensity and Innovation Quality

R&D intensity refers to the degree of MNC research and development internationalization [23], which is also understood as the “depth” of MNCs’ overseas R&D. Currently, most scholars discuss the relationship between innovation ability and cross-border R&D intensity from the perspective of innovation performance [9]. Almeida and Phene draw the conclusion of a strong positive correlation between R&D intensity and MNCs’ innovation performance by counting the patent output of overseas subsidiaries in various countries [24]. Muenjohn et al. proposed that MNCs can further affect their innovation performance by changing the input of R&D intensity [25]. Li and Lu believe that the greater the cross-border R&D intensity, the greater the costs will exceed the benefits [23], which will have negative effects on innovation performance. Other scholars believe that there may be a nonlinear relationship between cross-border R&D intensity and innovation performance [26]. In order to achieve BMI, the cross-border R&D of MNCs is a dynamic process. With the continuous deepening of R&D, R&D activities will gradually improve. Generally, the innovation benefits and costs of MNCs are constantly changing. Compared with a simple linear relationship, this paper tends to assume that there is a nonlinear relationship between R&D intensity and innovation quality.
In the early stage of R&D sourcing, when MNCs set up overseas R&D laboratories, the benefits of R&D sourcing may exceed the costs, which will effectively improve innovation quality. There are two reasons for this result. The first is the knowledge spillover effect and improvement of learning ability. When a firm researches and develops in a host country, it cannot effectively acquire and absorb external knowledge due to tacit and sticky knowledge, and the efficiency of knowledge spillover is low. With the deepening of R&D sourcing, R&D intensity will be accompanied by the improvement of MNC learning, utilization, and development of knowledge ability. At the same time, MNCs can acquire more heterogeneous innovation resources and business model information from learning and imitation [26]. The second reason is the level of institutional development in the host country. Given that most MNCs select developed countries as their destinations to conduct overseas R&D, they can reduce transaction and search costs by making use of slack regulatory systems, economic policies, high-quality public services and advanced intellectual property laws [27], overcome information asymmetry and protect innovation outputs [4]. Therefore, in the early stage of R&D sourcing activities, from the perspective of BMI, the improvement of R&D intensity has a positive impact on MNC innovation quality.
In the later stage of R&D sourcing, MNCs’ R&D activities will be hindered because the cost of R&D sourcing may outweigh the benefits, which will not effectively strengthen innovation quality. The specific reasons for this phenomenon are twofold. The first is the lack of internationalization experience. With the deepening of R&D sourcing, due to the lack of experience in internationalization, MNCs are prone to making mistakes in decision-making when facing uncertain international markets, and relevant coordination and communication problems may also arise [28]. In addition, the lack of internationalization experience will hinder business operations, which will lead to an increase in related expenses and innovation burden, and MNCs will be adversely affected by stagnant interests and rising costs [13]. The second reason is overseas responsibility. With the deepening of R&D sourcing, MNCs face not only greater overseas responsibilities but also environmental uncertainty risks in the innovation process. Consequently, MNCs cannot effectively utilize relevant institutions in unfamiliar markets to protect intellectual property rights, which increases risks of knowledge and technology leakage [3,29,30]. Therefore, in the later stage of R&D sourcing, from the perspective of BMI, MNCs may have limited positive impacts on innovation quality because the costs outweigh the benefits.
Based on the above, this paper proposes the following hypothesis:
Hypothesis 1a (H1a).
There is an inverted U-shaped relationship between the R&D intensity and innovation quality of MNCs. As R&D intensity increases, innovation quality increases. When R&D intensity reaches a certain level, innovation quality will begin to decline.

2.2.2. R&D Diversity and Innovation Quality

R&D diversity refers to the geographical distribution of R&D activities, which refers to the “width” of MNCs’ overseas R&D [26]. During the process of R&D sourcing, to obtain global knowledge, MNCs must conduct geographically dispersed R&D activities, which not only help them avoid the disadvantages generated by “collective thinking” but also reduce unnecessary restricted exploration by personnel [14]. MNCs from emerging economies can make use of foreign embedded knowledge and establish R&D institutions in various places to learn local knowledge and technology [13]. Building R&D institutions in different places generates diversified geographical distributions that can be concentrated or dispersed, which will lead to differences in costs and benefits. Accordingly, this paper assumes that there is a nonlinear relationship between R&D diversity and innovation quality. The reasons for this phenomenon are as follows:
Differences among countries. MNCs establish R&D institutions in different countries at the early stages of R&D sourcing; however, firms may fail to effectively protect intellectual property rights due to the different systems in various countries, and the leakage of knowledge and technology will expose MNCs to risks [28]. Moreover, the untimely communication caused by geographical decentralization will lead to increased coordination costs [31]. However, as the geographical distribution of R&D sourcing gradually spreads, MNCs will acquire and integrate diversified heterogeneous resources by establishing R&D institutions in different countries, which can to some extent promote the improvement of MNCs’ innovation ability [15].
Improvement of internationalization experiences. In the early stages of R&D sourcing, given that it is difficult to quickly adapt to an unfamiliar environment, rising exploration and transfer costs inhibit the improvement of innovation quality. Especially for MNCs from emerging economies, which are constrained by the “disadvantages of latecomers”, rising costs will generate more negative effects. However, related expenses and the “disadvantages of latecomers” will decrease gradually and be offset as the internationalization experience improves.
Economies of scale and synergies. The coordination and integration of R&D networks are conducive to MNCs achieving economies of scale in different locations and reducing innovation costs. In addition, when coordinating R&D institutions, MNCs may pursue a consistent integration strategy to encourage departments to gain competitive advantages on a global scale. Mutual cooperation and coordination among departments will reduce work duplication, improve efficiency, and promote innovation quality [13].
Establishment of knowledge sharing networks. From the perspective of knowledge spillover, Lahiri proposed that the more extensive the R&D sourcing, the easier it will be to promote cooperation to achieve innovation and benefit from knowledge spillover [15]. When R&D activities are geographically concentrated, innovation quality does not change much. However, when R&D activities are geographically diversified, MNCs may have multiple knowledge channels and realize knowledge sharing within the global R&D network [32], which will promote innovation quality.
Based on the above, this paper proposes the following hypothesis:
Hypothesis 1b (H1b).
There is a U-shaped relationship between the R&D diversity and innovation quality of MNCs. With the expansion of R&D sourcing, innovation quality declines. When R&D diversity reaches a certain level, innovation quality begins to increase.

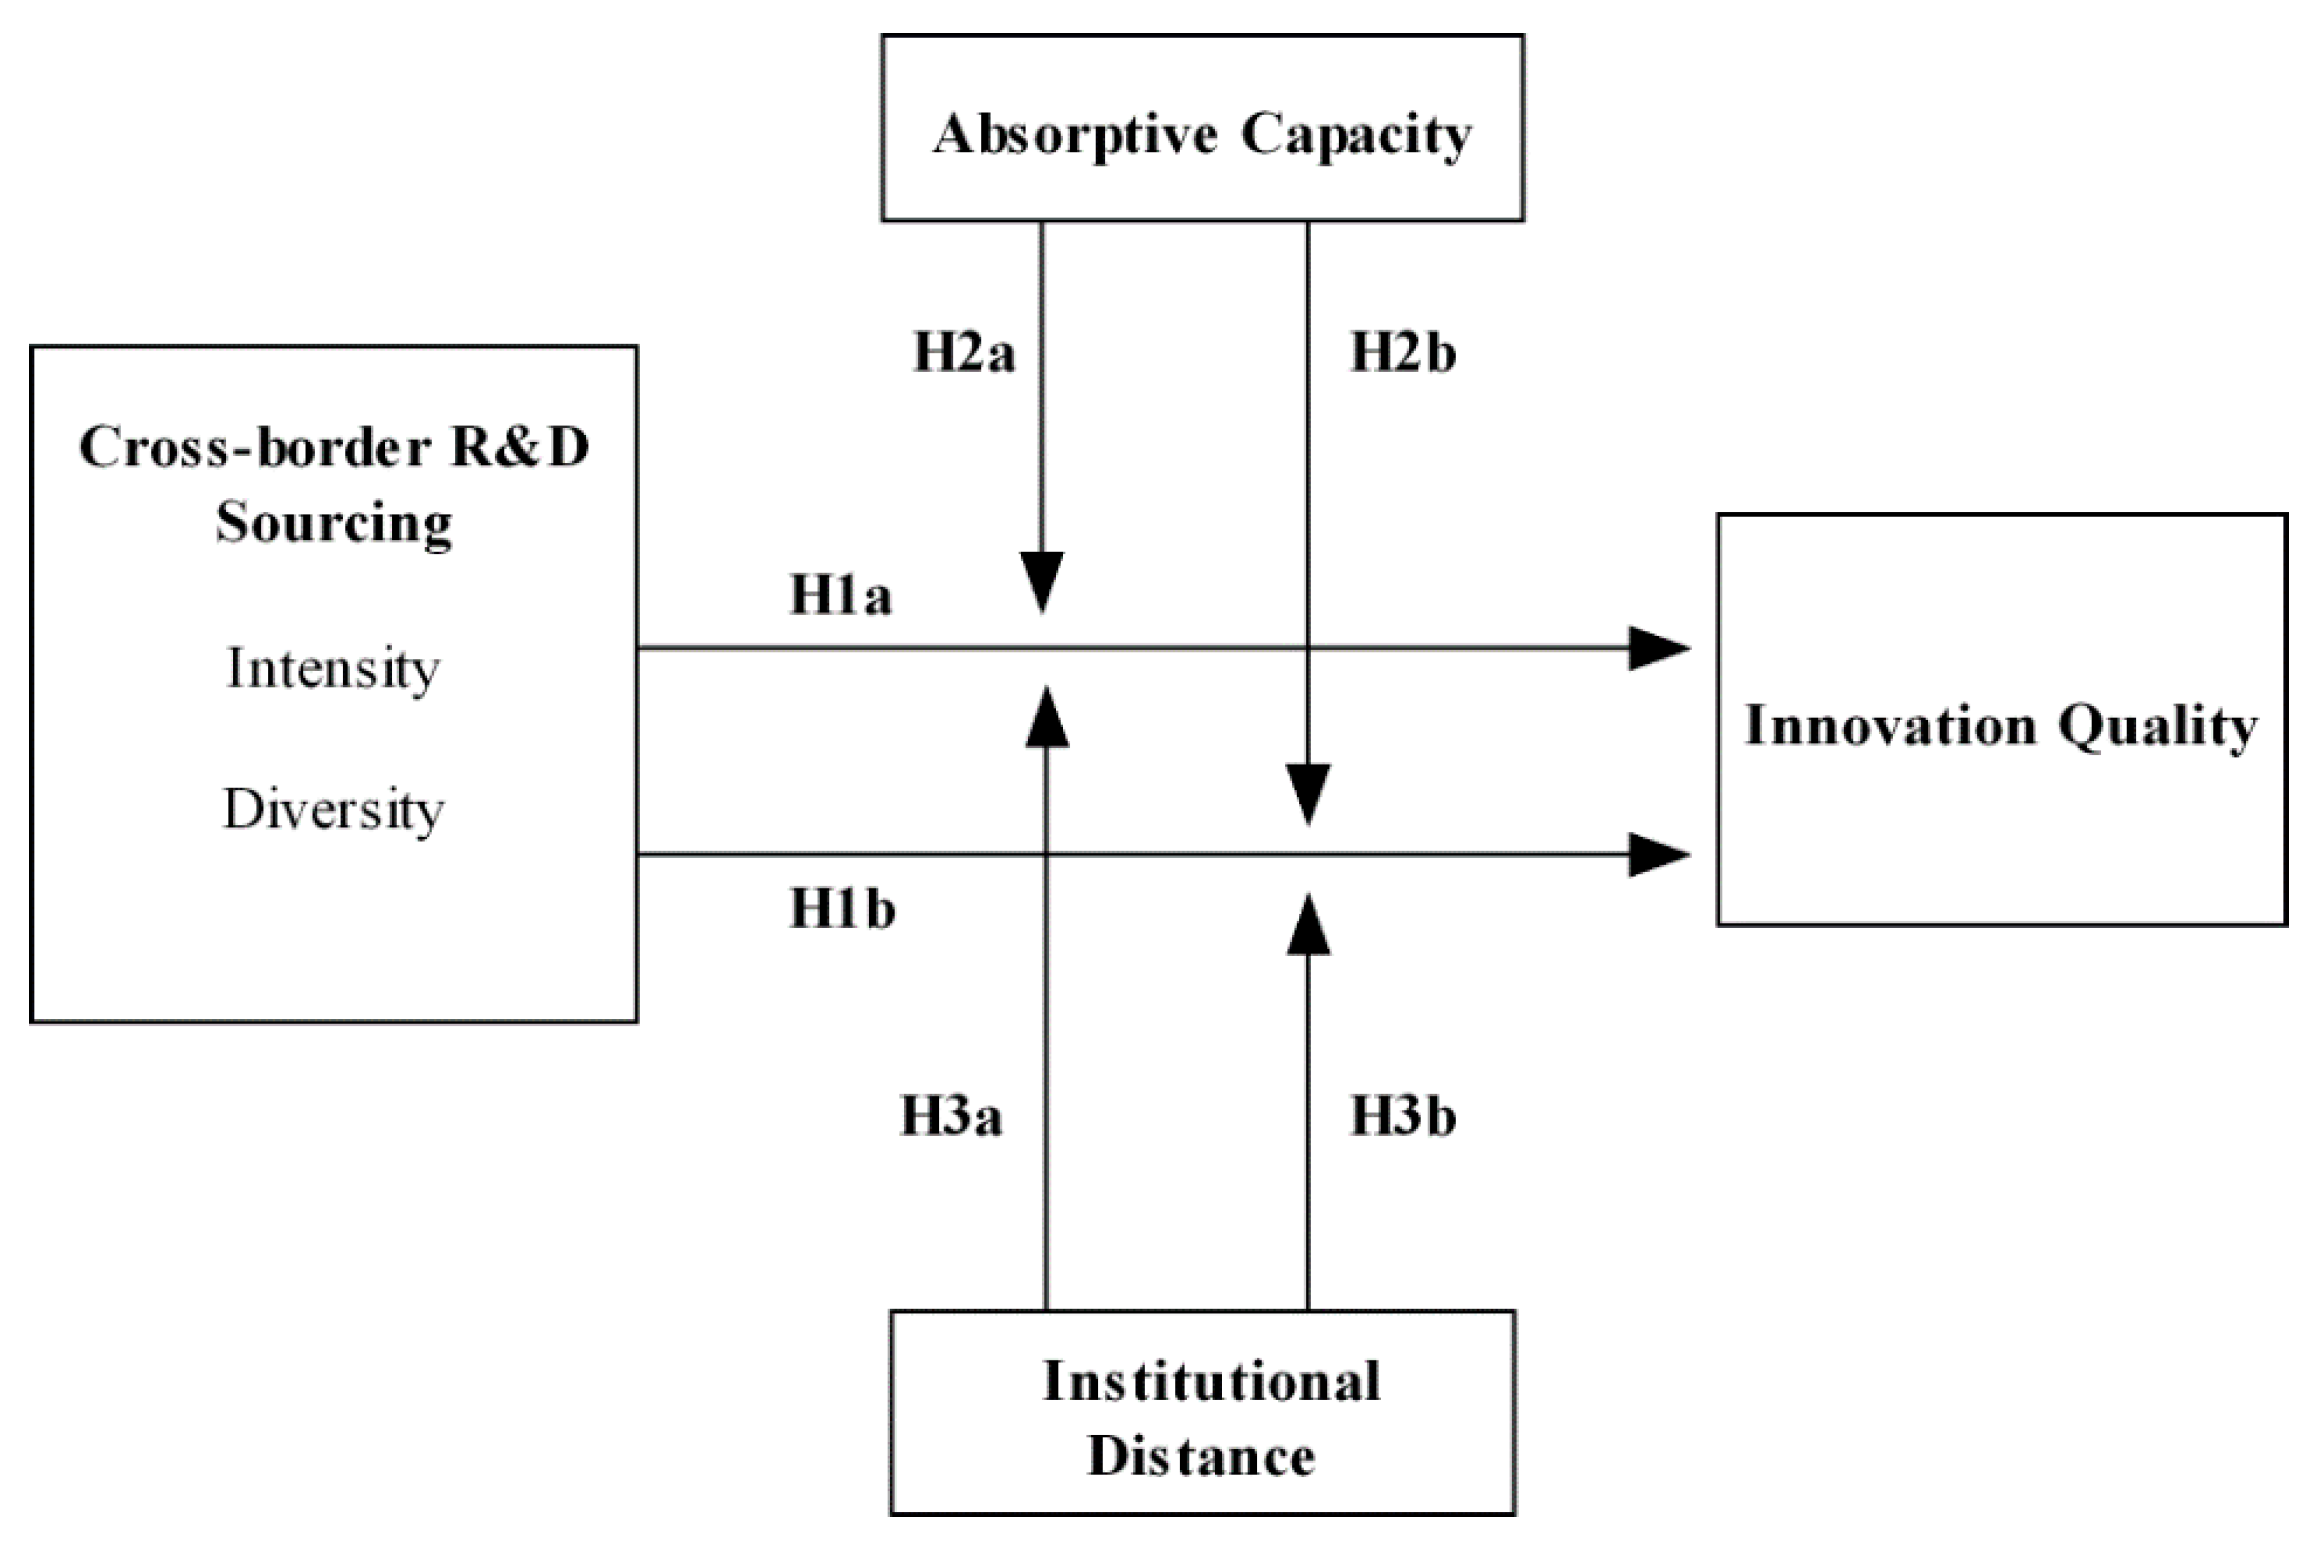
2.3. Moderating Effect

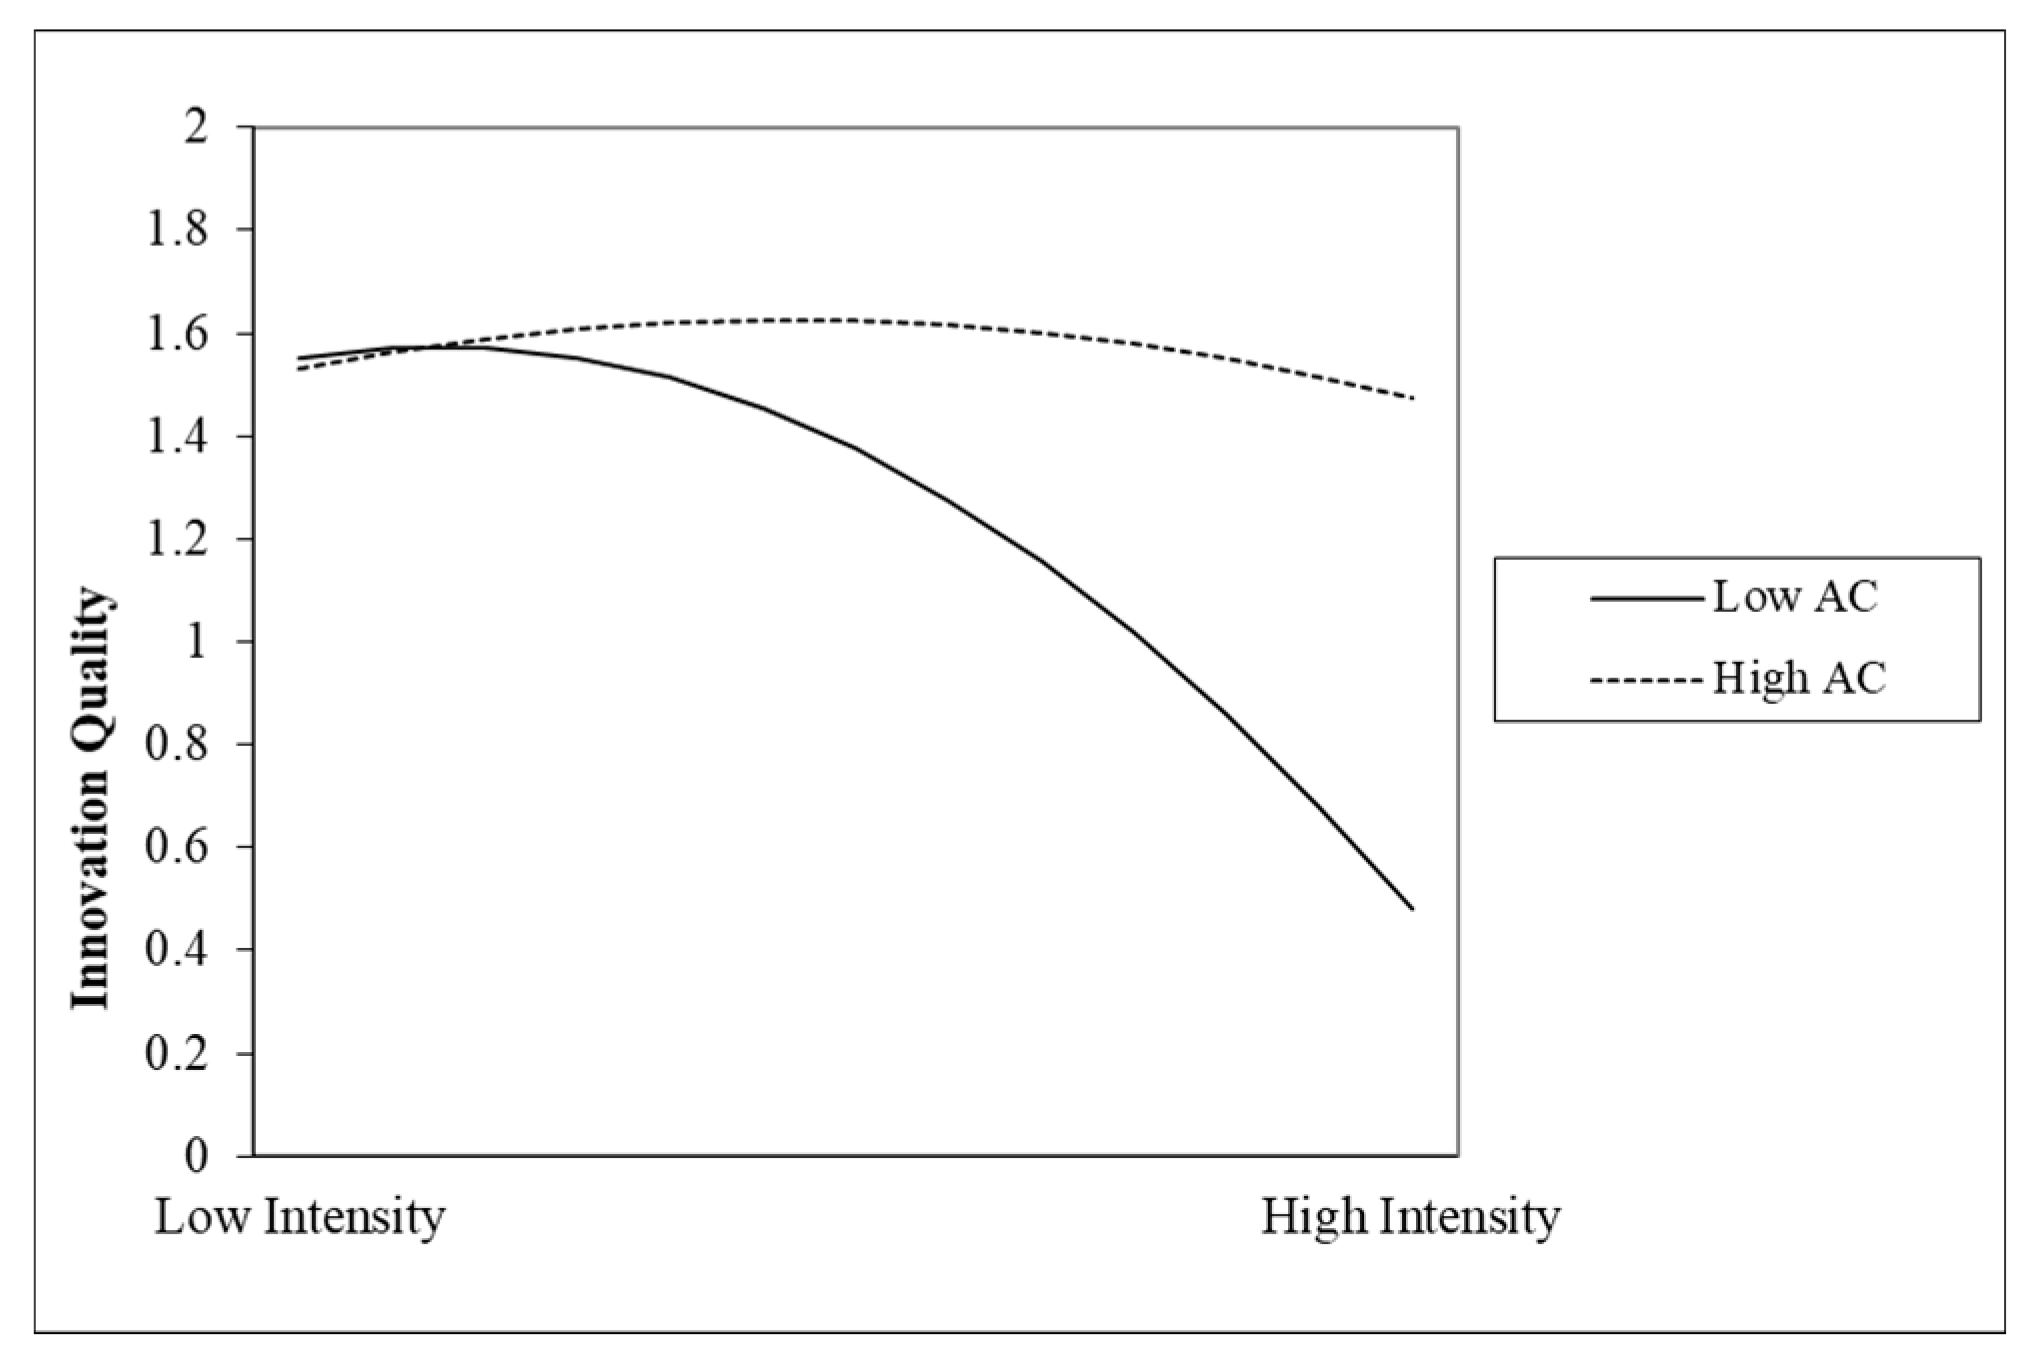
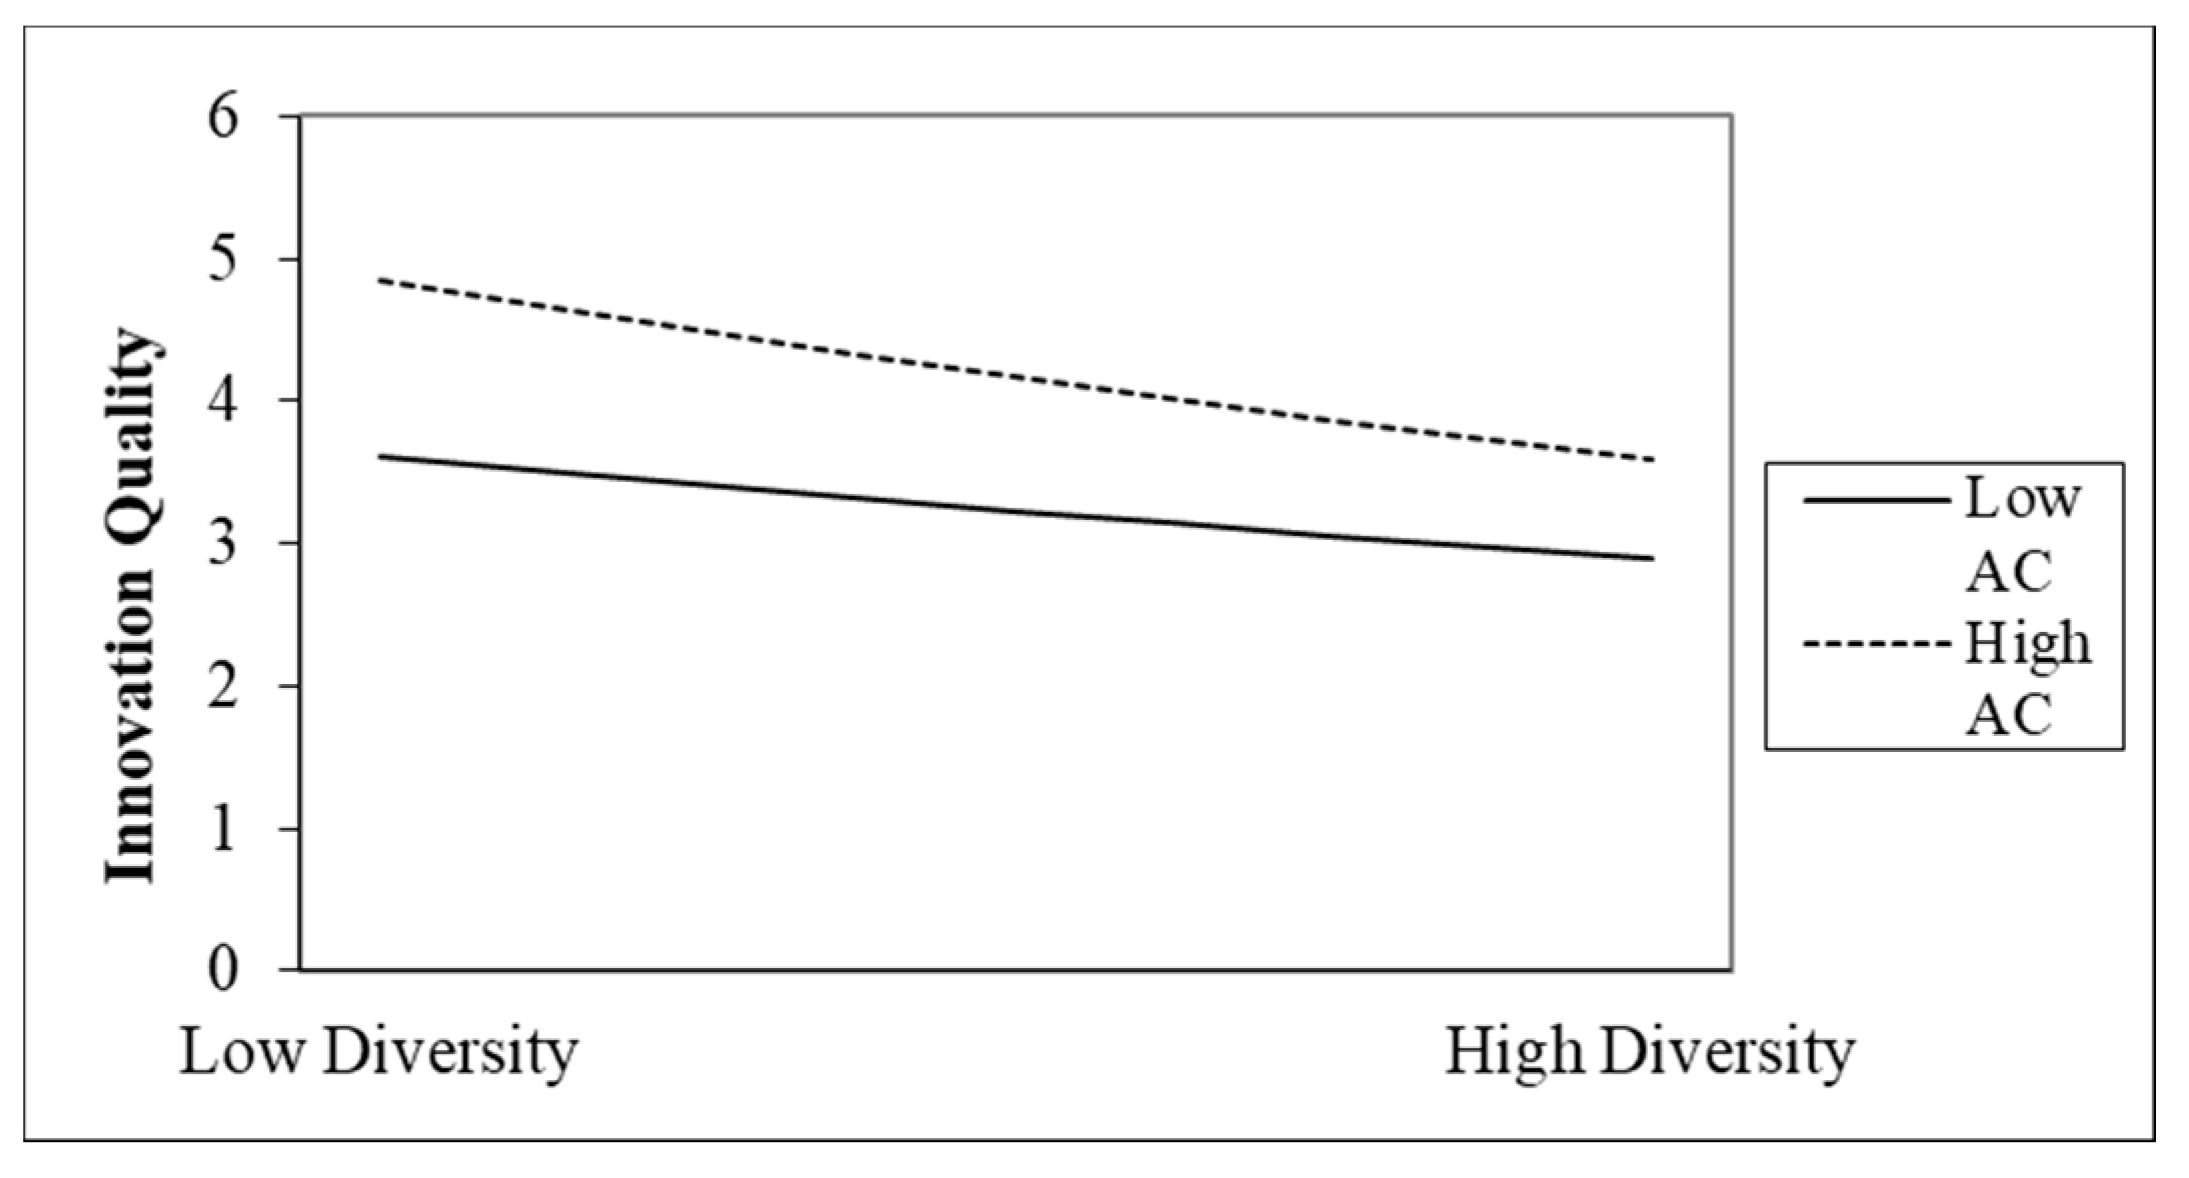
2.3.1. The Moderating Effect of Absorptive Capacity

When faced with the rapidly changing external environment, internally oriented knowledge relying on its own resources can no longer meet the demand for innovation, and it is necessary for MNCs to seek externally-oriented knowledge to stimulate innovation and realize the expansion of internal knowledge [33,34]. Therefore, such interaction between internal and external knowledge becomes particularly important [34,35]. As noted by Cohen and Levinthal, at the microlevel, the concept of absorptive capacity can be defined as a firm’s ability to identify new external information and apply the absorbed information to business operations, thereby enhancing its innovation ability and innovating its business model [36]. Absorptive capacity is related to the firm’s previous level of knowledge and is widely used in innovation practice. Zahra and George divided absorptive capacity into four stages: acquisition, absorption, transformation, and application [37]. These four abilities are interdependent and affect each other. By dividing the dimensions of absorptive capacity, we can obtain a more intuitive understanding of its impact on innovation. When MNCs have high absorptive capacity, they can often obtain greater benefits from external knowledge and achieve improvement in innovation quality [38]. Wu et al. believe that when MNCs conduct R&D activities in the host country, the advanced system of the host country will promote innovation performance [4]. For MNCs with strong absorptive capacity, the impact will be more significant. Based on this perspective, this paper assumes that absorptive ability is dynamic and can promote the improvement of innovation ability by absorbing external knowledge and integrating internal resources. Therefore, due to the complexity of absorptive capacity, it often affects innovation in an indirect way; thus, it is more suitable to employ it as a moderating variable to study its influence on the R&D sourcing and innovation quality of MNCs.
High-tech firms with strong absorptive capacity can more effectively transform knowledge into innovation. The stronger the absorptive capacity, the higher the innovation quality will be. First, absorptive capacity can improve innovation efficiency. In the process of R&D, the technology and information obtained from the outside must be processed to solve the problems specifically encountered in the R&D and to apply the knowledge to commercial operations through innovation. Absorptive capacity will accelerate the transformation process and further improve innovation quality through the improvement of innovation efficiency [38]. Second, firms with stronger absorptive capacity can obtain better environmental adaptability, more geographically distributed R&D activities and higher benefits. Especially for firms from emerging economies, market differences between countries will have a negative impact on MNCs’ innovation. Only when MNCs reach a certain level of absorptive capacity can they positively mitigate the impact of the host country system on innovation quality [4]. Finally, absorptive capacity can enhance firms’ capabilities of developing new products. Combined with internal knowledge, external knowledge must be transformed into new products or services such that innovation can be realized. As a result, there is a close relationship between absorptive capacity and the capability to develop new products. MNCs with strong development capabilities constantly combine external and internal knowledge to transform them into new products, thereby improving innovation quality [39].
Based on the above analysis, this paper proposes the following hypotheses:
Hypothesis 2a (H2a).
Absorptive capacity positively moderates the relationship between R&D intensity and innovation quality.
Hypothesis 2b (H2b).
Absorptive capacity positively moderates the relationship between R&D diversity and innovation quality.

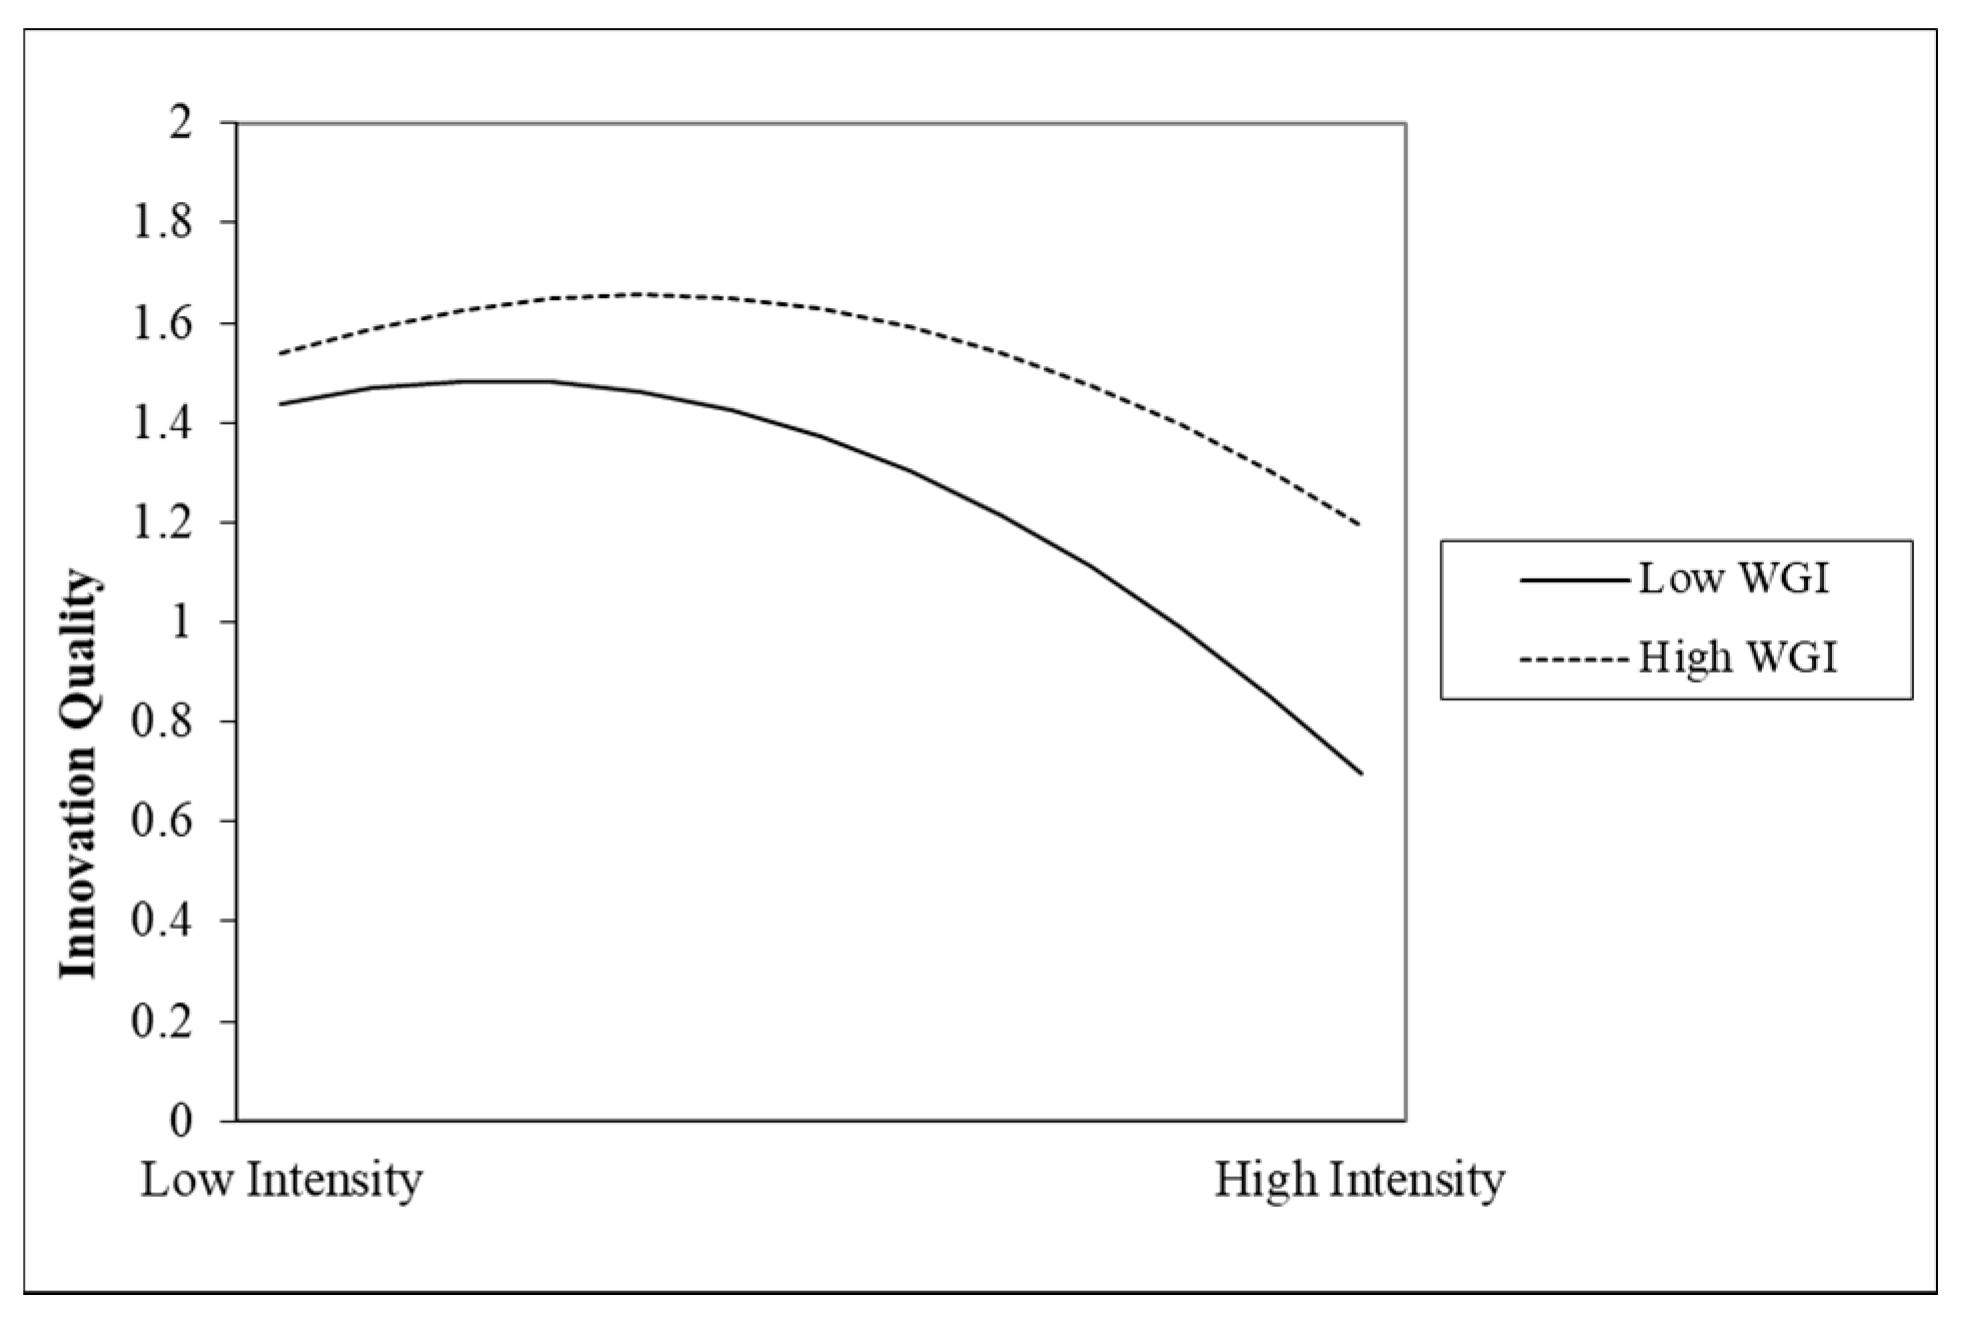
2.3.2. The Moderating Effect of Institutional Distance

Institutional distance is another important factor that affects the innovation quality of MNCs; it is the degree of differences in the regulatory, cognitive, and institutional factors between the host country and the home country [40]. Due to historical, cultural, and other factors, institutional environments around the world are different and form the institutional distances between countries, which leads to the impact of cross-border investment risks on subsequent R&D performance [33,41,42]. Institutional distance has an impact on MNCs because the institutional environments of different countries will influence cross-border operations [43]. A sound system in developed countries can reduce the uncertainty of R&D and reduce transaction and search costs [27]. By expanding into developed countries, MNCs from emerging economies can benefit from advanced systems in developed countries (such as political stability, government efficiency, regulatory quality, legal system level, and degree of corruption control), thereby extending their innovation networks and improving innovation quality. However, when MNCs conduct R&D in host countries with a low level of institutional development, their innovation may be hindered by inefficient markets and expensive market transaction costs [4]. Therefore, in this paper we use institutional distance as a moderating variable to study the relationship between R&D sourcing and the innovation quality of MNCs.
When a firm conducts R&D in a host country with institutional differences from its home country, such institutional distance may facilitate the relationship between R&D intensity and innovation quality. First, with the deepening of R&D, the increase of R&D intensity will gradually offset the negative impact created by institutional distance, and MNCs will obtain richer experiences and more access to local new technologies, and the information asymmetry between the parent firm and subsidiaries will be gradually alleviated. Second, compared with the early stages of R&D sourcing, MNCs will spend less time, capital, and coordination costs on R&D in countries with more advanced systems, which can offset the “disadvantage of outsiders” and reduce innovation costs [2]. Finally, in a sound institutional environment, the local average consumption demand will be higher than that in home countries with an unsound institutional environment, and a sound institutional environment promotes the improvement of firm product quality to meet consumers’ high-level requirements and realize innovation quality and business model improvement [23].
As the geographical diversity of cross-border R&D gradually expands, institutional distance may negatively moderate the relationship between R&D diversity and innovation quality. First, within a multinational corporation, the relationship between a parent firm and its subsidiary is actually a principal-agent relationship. Given that they are in different countries, supervision is difficult and information asymmetry does exist; thus, the institutional distance will lead to a mismatch between the parent firm’s proprietary knowledge and local needs, making it difficult for subsidiaries to effectively obtain the information that the parent firm wants to transmit and to achieve the conversion of competitive advantages [44]. Therefore, MNCs’ operating costs and communication costs with host countries will rise, and the expected earnings will decrease with the expansion of institutional distance. Additionally, the innovation ability will decline without sufficient financial support [45]. Second, the negative impact of institutional distance mainly comes from the fact that firms must spend a certain amount of money to become familiar with the host country’s market, acquire relevant information, and generate additional costs. Finally, for MNCs with wide geographic diversity in R&D, the greater the average institutional distance between different host countries and home countries, the greater the “disadvantage of the outsider” and uncertainty risk, which leads to the reduction of innovation capabilities [14].
Based on the above analysis, we propose the following hypotheses:
Hypothesis 3a (H3a).
Institutional distance positively moderates the relationship between R&D intensity and innovation quality.
Hypothesis 3b (H3b).
Institutional distance negatively moderates the relationship between R&D diversity and innovation quality.
The research framework is shown in Figure 1.

3. Method

3.1. Data

Luo and Tung define MNCs from emerging markets as international firms from developing countries with outward foreign direct investment activities that involve R&D activities in one or more countries [3]. Therefore, this paper excludes import and export firms from emerging markets (because they do not engage in FDI activities), and it excludes firms that mainly invest in tax havens. Referring to the “China High-tech Company Directory”, we select information on chemical manufacturing, pharmaceutical manufacturing, automotive and aerospace manufacturing, computer and other electronic equipment manufacturing, information transmission, software and information technology services, and scientific research and technical service industries as the analysis object. The data were selected from Chinese high-tech firms with multinational businesses. The above industries were chosen because of their knowledge-intensive characteristics. In this paper, 765 multinational high-tech firms were obtained by manually collecting the financial statements of A-share listed high-tech firms as well as the CSMAR database. To ensure the rigorousness and normality of the samples, 765 MNCs were screened: (a) MNCs with an “ST” logo were excluded; (b) MNCs with an unclear business scope of overseas subsidiaries or incomplete data disclosure of R&D activities were excluded; and (c) MNC samples with abnormal or missing financial data were excluded. After screening, 199 high-tech MNCs with cross-border R&D activities were selected as the research samples, and the relevant data of these MNCs were selected for a total of 6 years from 2013 to 2018.

3.2. Measures

3.2.1. Dependent Variable

The current research on the measurement of innovation quality is mainly divided into three types: measurement of R&D, patents, and new products [46]. Patents are an objective indicator to measure innovation quality, which can directly reflect the results of a firm’s innovation activities. In addition, based on the availability of data, this paper selects patents as the measurement of innovation quality [47]. In the method of measuring patents, some studies use the IPC classification number of patents and divide patents into two types, “narrow” and “wide”, to measure innovation quality [48]. Moreover, some studies measure the quantity of patent applications, registration, and authorization [49,50]. Furthermore, some studies measure innovation quality by using the ratio of the number of patent granted or citations to the number of patent applications [10,15]. From the perspective of innovation, a patent authorization measures not only the scale of firm innovation but also innovation quality such that authorized patents are more representative than unauthorized patents. Based on this phenomenon, this paper measures the innovation quality of MNCs by using the number of patents granted. The relevant patent data were collected from the National Intellectual Property Office and CSMAR (China Stock Market and Accounting Research) Database.

3.2.2. Independent Variable

Some scholars measure cross-border R&D sourcing by establishing “whether the firm conducts cross-border R&D activities” as a dummy variable [51]; however, this method is not sufficiently accurate to deeply reveal the mechanism between cross-border R&D sourcing and innovation quality. Medcof et al. asserted that the distribution of overseas R&D subsidiaries can better reflect the R&D situation [52]. Meanwhile, due to the imperfect information disclosure of listed MNCs in China, this paper follows Li and Lu in measuring the R&D intensity by the total number of overseas R&D subsidiaries each year [23]. Measurements of R&D diversity are generally based on the geographic diversity of R&D activities. In this paper, R&D diversity is measured by calculating the Blau coefficient [26,53].
D = 1 i = 1 2 P i 2
R&D subsidiary positions are divided by the economic development level of the host country. P i = 1 is the proportion of R&D subsidiaries invested in developed countries, and P i = 2 is the proportion of R&D subsidiaries invested in developing countries. The R&D information is collected from the “Directory of Overseas Investment Firms (Institutions)” and the annual report of MNCs.

3.2.3. Moderating Variable

Scholars mainly use questionnaires for the measurement of absorptive capacity, which is not a rigorous method. R&D investment will enhance the ability to acquire external knowledge and shorten the period of transforming external information. Therefore, this paper uses the ratio of R&D investment to total sales to measure absorptive capacity [54,55]. The Global Governance Index published by the World Bank collects the research results of national institutions specifically for MNCs, and it shows the score of the legal system (rule of law), which can better reflect the administrative and political system [56,57]. Therefore, institutional distance is measured by the difference between the rule of law score in each host country’s Global Governance Index (WGI) and China’s score. If the number of host countries in a given year is greater than 1, the difference between the average legal score of all host countries and China is used to measure institutional distance. The data of the moderating variables are collected from the CSMAR (China Stock Market and Accounting Research) database and the World Bank database.

3.2.4. Control Variable

In this paper, firm size, firm age, firm internationalization experience, firm profitability, and the mode of subsidiary entry into the host country were selected as control variables.
(a) Firm Size (Size). Firm scale will affect innovation quality. Firms of different scales show different organizational characteristics and resource allocation. Larger firms have more innovation resources, which can inhibit or enhance innovation [45]. Therefore, the natural logarithm of total assets is used to measure the scale of the MNCs. The data are collected from the CSMAR database.
(b) Firm Age (Age). To a certain extent, the age of a firm is related to its innovation level and management ability. Older firms often have innovation experiences that other firms do not have; however, younger firms also have unique creativity [15]. In this paper, firm age is measured by the natural logarithm of the time from the establishment of the firm to the observed year, and the data are collected from the CSMAR database.
(c) Internationalization Experience (Experience). Internationalization experience has a significant impact on innovation performance and innovation ability [58]. The more internationalization experience there is, the more conducive it will be to innovation. Therefore, this paper uses the time from international expansion of the firm to the observed year to measure the internationalization experience, and the data come from the CSMAR database.
(d) Firm Profitability (ROA). Firms with strong profitability are often willing to invest more resources in innovation while those with weak profitability lack resources to invest in innovation activities [59]. Therefore, profitability will have an impact on innovation quality. This paper measures profitability by dividing net profit by the average balance of total assets. The data are collected from the CSMAR database.
(e) Subsidiary’s Entry Mode (Entry Mode). For Chinese firms entering the international market, the choice of the mode of entry for overseas subsidiaries is very important because it not only affects the survival of overseas subsidiaries but also affects their development [60]. Whether the subsidiary enters the international market through mergers, acquisitions or other modes will influence overseas R&D behavior. For example, when a subsidiary enters the host country through an acquisition, it can make use of the existing resources of the acquired firm, which is more conducive to innovation. In this paper, the entry mode of the subsidiary is set as a dummy variable, and the cross-border merger and acquisition are recorded as 1, while other investment modes are recorded as 0. The data are collected from the CSMAR database.
Table 1 summarizes variable definitions and measures.

3.3. Model

According to the characteristics of the dependent variable, the number of patents used to measure the innovation quality of MNCs should follow a Poisson distribution [61]. Therefore, this paper will adopt the Poisson panel model to analyze the influence of the two dimensions of cross-border R&D sourcing on innovation quality, taking innovation quality as the dependent variable and R&D intensity and diversity as independent variables. Meanwhile, it will test the moderating effect of absorptive capacity and institutional distance on the above relationships. To test H1a and H1b, the following regression Equation (1) is established:
I Q = c + α 1 I n t e n s i t y i , t + α 2 I n t e n s i t y i , t 2 + β 1 D i v e r s i t y i , t + β 2 D i v e r s i t y i , t 2 + η 1 5 i j c o n t r o l s i , t + ε i , t
To test the inverted U-shaped relationship between R&D intensity and innovation quality, first, the coefficient α 1 should be significant, and the quadratic coefficient α 2 should be significantly negative. Second, the slope at both ends of the inverted U-shaped curve must be steep enough within the sample data range. When the R&D intensity is minimized, α 1 + 2 α 2 I n t e n s i t y m i n is significantly positive. When the R&D intensity is maximized, α 1 + 2 α 2 I n t e n s i t y m a x is significantly negative. Finally, the inflection point of the inverted U-shaped curve must be within the range of the sample data. For the U-shaped curve test of the R&D diversity, the slope test in the second step should be changed as follows: β 1 + 2 β 2 D i v e r s i t y m i n is significantly negative when the R&D diversity is the minimum; β 1 + 2 β 2 D i v e r s i t y m a x is significantly positive when the R&D diversity is the maximum.
To verify H3 and H4, we add the interaction terms of absorptive capacity and institutional distance on the basis of Equation (1) and establish Equations (2)–(5):
I Q = c + α 1 I n t e n s i t y i , t + α 2 I n t e n s i t y i , t 2 + α 3 I n t e n s i t y i , t A C i , t + α 4 I n t e n s i t y i , t 2 A C i , t + φ A C i , t + η 1 5 i j c o n t r o l s i , t + ε i , t
I Q = c + β 1 D i v e r s i t y i , t + β 2 D i v e r s i t y i , t 2 + β 3 D i v e r s i t y i , t A C i , t + β 4 D i v e r s i t y i , t 2 A C i , t + φ A C i , t + η 1 5 i j c o n t r o l s i , t + ε i , t
I Q = c + α 1 I n t e n s i t y i , t + α 2 I n t e n s i t y i , t 2 + α 5 I n t e n s i t y i , t W G I i , t + α 6 I n t e n s i t y i , t 2 W G I i , t + ρ W G I i , t + η 1 5 i j c o n t r o l s i , t + ε i , t
I Q = c + β 1 D i v e r s i t y i , t + β 2 D i v e r s i t y i , t 2 + β 5 D i v e r s i t y i , t * W G I i , t + β 6 D i v e r s i t y i , t 2 W G I i , t + ρ W G I i , t + η 1 5 i j c o n t r o l s i , t + ε i , t
In Equations (1)–(5), in addition to the variables described in Table 1, c represents the intercept term, α , β , φ , ρ , and η are the regression coefficients of the independent variables, moderating variables, and control variables, respectively. i j c o n t r o l s i , t is the set of control variables not shown in the model, and ε is the random disturbance term.

4. Empirical Analysis

4.1. Descriptive Statistics and Correlation Analysis

In this study, descriptive statistical analysis was conducted on all variables. Table 2 lists the mean, standard deviation, minimum, and maximum of the selected variables. According to the statistics, there is a large gap between the minimum and maximum innovation quality, which indicates that there is a large difference between MNCs in innovation quality. From the perspective of two dimensions of cross-border R&D sourcing, the average R&D intensity is higher than the R&D diversity, indicating that most MNCs have higher R&D intensity and more concentrated R&D diversity. In addition, the variance inflation factor (VIF) of all variables is less than 5, and the average VIF value is 1.16; thus, there is no multicollinearity between the variables.
To eliminate the influence of extreme outliers and variable range on regression, all variables were analyzed after standardization. The results are shown in Table 3. R&D intensity is significantly negatively correlated with innovation quality, while R&D diversity is significantly positively correlated with innovation quality. Firm size is significantly positively correlated with innovation quality, absorptive capacity is significantly negatively correlated with innovation quality, firm internationalization experience is significantly positively correlated with innovation quality, institutional distance is significantly negatively correlated with innovation quality, and the correlation coefficient between every two variables is less than 0.5, indicating that there is no serious collinearity problem. The above analysis results must be further analyzed and verified in the panel Poisson fixed effect regression model.

4.2. Analysis of Regression Results

In this paper, we use panel Poisson fixed effect regression for estimation, and the regression results of the model are shown in Table 4. In model 1, only control variables were added, and the results showed that firm size and profitability have a significant positive impact on innovation quality ( η 1 = 0.513, p < 0.01; η 3 = 0.039, p < 0.01). Firm age, internationalization experience and entry mode have a significant negative influence on innovation quality ( η 2 = −0.244, p < 0.01; η 4 = −0.187, p < 0.01; η 5 = −0.112, p < 0.01), which indicates that when the MNC is large in scale, strong in profitability, young in age, small in internationalization experience, and enters by nonmerger mode, innovation quality is easy to improve.
Model 2 adds the first-order term of R&D intensity on the basis of Model 1, and Model 3 adds a quadratic term of R&D intensity on the basis of Model 2. The regression results of Model 2 and Model 3 show that the coefficient of R&D intensity is significant. According to Model 3, the first-order term coefficient and the quadratic term coefficient of R&D intensity are −0.240 and −0.128, respectively, both of which are significant at the 1% level. Second, the slope of the curve α 1 + 2 α 2 I n t e n s i t y m i n = 0.122 > 0 when the R&D intensity is minimized (−1.415). When the R&D intensity is maximized (1.143), the slope α 1 + 2 α 2 I n t e n s i t y m a x = −0.533 < 0, and the sample boundary signs are opposite. The inflection point of the curve was −0.938, which was located within the sample interval. With the increase in R&D intensity, the innovation quality of MNCs presents a trend of first increasing and then decreasing; that is, there is an inverted U-shaped relationship between R&D intensity and innovation quality, and H1a is verified.
Model 4 adds the first-order term of R&D diversity on the basis of Model 1, and Model 5 adds the quadratic term of R&D diversity on the basis of Model 4. The regression results of Model 4 and Model 5 show that the coefficients of R&D diversity are significant. According to Model 5, the first-order term coefficient of R&D diversity is −0.139 and significant at 1%, while the quadratic term coefficient of R&D diversity is 0.016 and significant at 10%. Second, when the R&D diversity is minimized (−0.644), the slope is β 1 + 2 β 2 D i v e r s i t y m i n = −0.160 < 0. When R&D diversity reaches the maximum (1.780), the curve of the slope is β 1 + 2 β 2 D i v e r s i t y m a x = −0.082 < 0, and the sample boundary has the opposite symbols. Although the R&D diversity first-order and quadratic coefficients are both significant, the boundary symbols are the same. Therefore, it can be concluded that R&D diversity has a negative linear relationship with innovation quality, and H1b is not verified. The reason may be that the MNCs’ R&D sourcing degree is not enough, and the expansion of its activities makes it difficult for MNCs to cope with the expansion of geography and the improvement of BMI and innovation ability at the same time. Therefore, with the gradual increase in geographic diversity in R&D sourcing, innovation quality gradually declines. With the gradual improvement of MNCs’ internationalization experience and adaptability, the negative linear relationship between R&D diversity and innovation quality has reached an inflection point, and innovation quality will rebound.

4.3. The Analysis of Moderating Effect

In Model 6 of Table 5, to add the R&D intensity of first-order and quadratic interaction with absorptive capacity, according to the results, the coefficient α 3 is 0.169, which is significant at the 1% level, proving that absorptive capacity can positively moderate the relationship between R&D intensity and innovation quality. Second, the coefficient α 4 is 0.052, which is significant at the 1% level. Therefore, the inverted U-shaped relationship between R&D intensity and innovation quality is still tenable after adding absorptive capacity.
As shown in Figure 2, before the inflection point, the steepness of the two curves is similar, indicating that when the degree of R&D sourcing is reduced, different absorptive capacities have little difference in the improvement speed of innovation quality. In addition, before the inflection point, the curve of high absorptive capacity is lower than that of low absorptive capacity, indicating that when the R&D intensity is low, the innovation quality level of MNCs with low absorptive capacity is relatively high. With the enhancement of absorptive capacity, the inflection point gradually moves to the right, indicating that absorptive capacity positively moderates the relationship between R&D intensity and innovation quality. After the inflection point, the innovation quality curve begins to decline; however, the curve with high absorptive capacity is higher than that with low absorptive capacity, indicating that with the improvement of R&D intensity, the innovation quality level is higher under the condition of high absorptive capacity. Therefore, H2a is verified.
In Model 7 of Table 5, to add interactions of R&D intensity and institutional distance, the results showed that coefficient α 5 is 0.066, which is significant at the 1% level, proving that institutional distance positively moderates the relationship between R&D intensity and innovation quality. Second, coefficient α 6 is 0.010, which is significant at the 10% level. Therefore, the inverted U-shaped relationship between R&D intensity and innovation quality is still tenable after adding institutional distance. Figure 3 shows that under the moderating effect of different institutional distances, the influence of R&D intensity on innovation quality changes; the curve of high institutional distance is higher than that of low institutional distance, and the inflection point shifts to the right, indicating that institutional distance positively moderates the relationship between R&D intensity and innovation quality.
In Model 8 of Table 5, the interaction term between absorptive capacity and R&D diversity is added. The results show that β 3 is −0.020, which is significant at the level of 5%, indicating that the negative effect of R&D diversity on innovation quality increases with increasing absorptive capacity. In Model 9 of Table 5, the interaction term between institutional distance and R&D diversity is added. The results show that β 5 is 0.015, which is significant at the 1% level, indicating that the negative effect of R&D diversity on innovation quality decreases with increasing institutional distance. The moderating effects of absorptive capacity and institutional distance on the relationship between R&D diversity and innovation quality are shown in Figure 4 and Figure 5.

4.4. Robustness Test

To ensure the robustness of the above regression results, the measurement method of the dependent variable was changed, and the number of patent applications was taken as the dependent variable to test the robustness of the model. The robust results are shown in Table 6, and the conclusions are basically consistent with the previous results.
In Model 1, the first-order and quadratic terms of R&D intensity and diversity are added. The results showed that the first-order term coefficient of R&D intensity was −0.231 and the quadratic term coefficient was −0.184, both of which were significant at the 1% level. Second, the slope of the curve α 1 + 2 α 2 I n t e n s i t y m i n = 0.28972 > 0 when the R&D intensity is minimized (−1.415). The curve slope α 1 + 2 α 2 I n t e n s i t y m a x = −0.6516 < 0 when the R&D intensity is ma maximized (1.143). The inflection point of the curve is −0.627, which is located within the sample range. With the increase in R&D intensity, the innovation quality of MNCs presents a trend of first increasing and then decreasing; that is, the relationship between R&D intensity and innovation quality presents an inverted U-shaped relationship. The first-order coefficient of R&D diversity is −0.142, which is a negatively linear relationship with innovation quality.
In Model 2, the interaction terms of absorptive capacity, institutional distance, and R&D intensity were added on the basis of Model 1. Among them, the interaction term coefficient between the first-order term of R&D intensity and absorptive capacity is 0.097, and the interaction term coefficient between the quadratic term of R&D intensity and absorptive capacity is −0.040, both of which are significant at the 1% level. The interaction term coefficient between the first-order term of R&D intensity and institutional distance is 0.061, and the interaction term coefficient between the quadratic term and absorptive capacity is −0.011, both of which are significant at the 1% level. After adding absorptive capacity and institutional distance, the relationship between R&D intensity and innovation quality is still represented by an inverted U-shape.
In Model 3, the interaction terms of absorptive capacity, institutional distance and R&D diversity were added on the basis of Model 2. The interaction coefficient between the first-order term of R&D diversity and absorptive capacity is −0.301, which is significant at the 1% level. The interaction term coefficient between the first-order term of R&D diversity and institutional distance is 0.138, which is significant at the 1% level, indicating that the negative effect of R&D diversity on innovation quality increases with increasing absorptive capacity but decreases with increasing institutional distance. The above conclusions are basically consistent with the previous regression results, and the symbols of each variable are the same as the empirical results above, which proves that the conclusion is robust.

5. Conclusion and Future Research

5.1. Conclusions

Based on the perspective of BMI, this paper describes our analyses of the relationship between R&D sourcing and the innovation quality of multinational corporations and introduces absorptive capacity and institutional distance as the moderating variables to conduct double tests. At the same time, the data of Chinese A-share listed high-tech firms from 2013 to 2018 were collected as samples for empirical analysis, and the main conclusions are as follows.
First, various dimensions of R&D sourcing have different effects on innovation quality. There is a significant inverted U-shaped relationship between R&D intensity and innovation quality and a significant negative linear relationship between R&D diversity and innovation quality. In the early stage of R&D sourcing, new rules, large overseas responsibilities, and the lack of internationalization experience may result in MNCs being weak in innovation; thus, it is difficult for them to realize BMI. With the deepening of R&D activities, the learning ability and adaptability of MNCs are gradually improved, and they benefit from the developed institution of the host country; therefore, innovation quality and business models will be gradually improved. However, because the degree of R&D sourcing of Chinese MNCs has not yet reached the maturity stage, as the geographic diversification of R&D activities increases, MNCs may not be able to deal simultaneously with geographic expansion and improvement of innovation ability, which will lead to a decrease in the innovation quality and fail to innovate the business model.
Second, absorptive capacity has a significant positive moderating effect on the inverted U-shaped relationship between R&D intensity and innovation quality, which means that the negative linear relationship between R&D diversity and innovation quality increases with increasing absorptive capacity. In R&D activities, MNCs integrate external and internal knowledge for their own use. In other words, the enhancement of absorptive capacity will help firms transform external knowledge into new products, promote the improvement of innovation quality, and realize BMI.
Third, institutional distance has a significant positive moderating effect on the inverted U-shaped relationship between R&D intensity and innovation quality, which means that the negative linear relationship between R&D diversity and innovation quality decreases with increasing institutional distance. With the deepening of R&D, the negative impact brought by institutional distance will be gradually offset by the enhancement of R&D intensity to gain greater impetus for innovation. However, for MNCs that establish R&D institutions in various countries, an increase in institutional distance will greatly increase their costs and risks, leading to a decline in innovation quality and failure to realize BMI.

5.2. Theoretical Contributions

First, in the context of BMI, the complex relationship between R&D intensity and diversity is embedded in it, which has certain theoretical value for further expanding the R&D sourcing strategy and firm internationalization strategy theory. Most of the previous studies have focused on the linear relationship between R&D sourcing and innovation quality and less on the influence of the nonlinear relationship between them. In addition, in this paper we divide R&D sourcing into R&D intensity and diversity and compares it across time periods (early and late). It concludes that R&D intensity exceeding a certain inflection point will lower innovation quality and that R&D diversity negatively affects innovation quality. The results enrich and develop the study of innovation quality and cross-border R&D sourcing theory.
Second, this paper enriches and deepens the contextual role and contingency view of cross-border R&D sourcing strategies. In this paper, institutional distance and absorptive capacity are embedded in the theoretical framework of R&D sourcing and innovation quality, which further complements and improves knowledge management and institutional theory. At the national level, this paper proposes that institutional distance promotes the relationship between R&D intensity and innovation quality, inhibits the relationship between R&D diversity and innovation quality, and reveals the duality of institutional distance affecting MNCs. In addition, absorptive capacity is also the key to the internal system construction of MNCs, which positively moderates the relationship between R&D sourcing and innovation quality.
Third, in the context of China and other transition economies, in this paper we highlight the strategic significance of R&D sourcing motivation and innovation achievement transformation. In the past, the research has mainly focused on MNCs in developed countries. However, the motivations of MNCs in developed countries are quite different. To overcome the disadvantages of latecomers, developing countries often choose cross-border R&D to achieve technological catch-up. As the largest emerging economy, China has the highest number of patent applications in the world; however, this does not mean that patent quality has reached the same level [62]. In contrast, according to the 2019 Global Innovation Index Report, the value of innovation by Chinese MNCs is relatively low and narrow in scope. Therefore, taking Chinese MNCs as the sample, this paper studies the relationship between R&D sourcing and innovation quality, further improves the theory of R&D sourcing and BMI, and provides a benchmark for other emerging economies.

5.3. Management Implications for Multinational Corporations

First, in the early stages of R&D sourcing, MNCs should prevent “information asymmetry” from affecting the improvement of innovation quality and BMI. With the deepening of R&D, it is necessary to prevent path-dependent risks while obtaining more diverse information. MNC managers should grasp the rhythm of R&D sourcing and pay attention to the synchronous improvement of R&D quality while rapidly increasing the R&D scale to realize sustainable BMI [63]. Therefore, managers must reasonably allocate the geographical dispersion of R&D activities and R&D investment to achieve innovation quality improvement and BMI.
Second, compared to traditional firms, the characteristics of high-tech firms determine their dependence on innovation ability. Scientific and technological talent is the core competitiveness of MNCs. Therefore, MNCs should rationally allocate capital and personnel input in the process of R&D sourcing and constantly attract high-tech talent. Managers of MNCs should actively adjust their business strategies and strengthen system management. By improving absorptive capacity, MNCs can enhance their development ability and environmental adaptability, accelerate the conversion of external knowledge into their own use, promote the integration of internal and external knowledge, and improve innovation quality and BMI.
Third, Chinese MNCs that are going globally should learn from foreign investment experience, conduct cluster analysis on host countries with similar institutional environments, and formulate similar external R&D strategies to lower development costs. MNC managers should develop differentiated operation and R&D strategies on the basis of different countries and systems and pay attention to the utilization of the local R&D environment and resources in host countries. At the same time, safe and practical site selection proposals should be provided for the development of MNCs, and suitable investment places should be found globally to establish R&D institutions and enhance technological innovation capacity. When selecting the site of R&D institutions, countries with superior business systems should be given priority, and countries with relatively unsound systems should be avoided to reduce the disadvantages of latecomers and the risks of outsiders.

5.4. Limitations and Directions for Future Research

This paper has the following limitations and problems to be verified. First, R&D sourcing is divided into R&D intensity and diversity. However, with the gradual maturity of MNCs, there should be more indicators with different dimensions to measure cross-border R&D sourcing to expand relevant research results. Second, only 199 MNCs with R&D business were selected as the research objects, and the sample size is small. Moreover, the selected data are from 2013 to 2018, which must be updated. Future research should select more samples and update the time periods of the data. Third, this paper relies too much on MNCs’ annual reports of secondary data and lacks directly-obtained data; therefore, some conclusions require empirical knowledge and fail to gain more direct evidence to support the results. Future research can obtain primary data through direct communication with firms or interviews with experts, making the results more robust. Fourth, in order to study the difference between emerging economies and developed countries, this article conducts research based on the Chinese context. In the future, other countries could be selected as research objects for further research, such as the United States and Europe, and which could make the results more practical.

Author Contributions

Funding acquisition, P.T.; writing, Y.D., H.L.; visualization, Z.D. All authors have read and agreed to the published version of the manuscript.

Funding

Natural Science Foundation of Zhejiang province, LY20G020017 funded this research.

Institutional Review Board Statement

Not applicable.

Informed Consent Statement

Not applicable.

Data Availability Statement

Not applicable.

Acknowledgments

The authors thank the funders whole-heartedly for funding our research.

Conflicts of Interest

The authors declare no conflict of interest.

References

  1. Nieto, M.J.; Rodriguez, A. Offshoring of R and D: Looking abroad to improve innovation performance. J. Int. Bus. Stud. 2011, 42, 345. [Google Scholar]
  2. Ramamurti, R.; Singh, J.V. Emerging Multinationals in Emerging Markets; Cambridge University Press: Cambridge, UK, 2009. [Google Scholar]
  3. Luo, Y.; Tung, R.L. International expansion of emerging market enterprises: A springboard perspective. J. Int. Bus. Stud. 2007, 38, 481–498. [Google Scholar]
  4. Wu, J.; Wang, C.; Hong, J.; Piperopoulos, P.; Zhuo, S. Internationalization and innovation performance of emerging market enterprises: The role of host-country institutional development. J. World Bus. 2016, 51, 251–263. [Google Scholar] [CrossRef]
  5. Teece, D.J. Business models, business strategy and innovation. Long Range Plan. 2010, 43, 172–194. [Google Scholar]
  6. Chin, T.; Wang, S.; Rowley, C. Polychronic knowledge creation in cross-border business models: A sea-like heuristic metaphor. J. Knowl. Manag 2020. [Google Scholar] [CrossRef]
  7. Guo, H.; Zhao, J.; Tang, J. The role of top managers’ human and social capital in business model innovation. Chin. Manag. Stud. 2013, 7, 447–469. [Google Scholar]
  8. Chin, T.; Shi, Y.; Rowley, C.; Meng, J. Confucian business model canvas in the Asia Pacific: A Yin-Yang harmony cognition to value creation and innovation. Asia Pac. Bus. Rev. 2020. [Google Scholar] [CrossRef]
  9. Wu, S.; Lin, C. The influence of innovation strategy and organizational innovation on innovation quality and performance. Int. J. Organ. Innov. 2011, 3, 45. [Google Scholar]
  10. Yu, L.; Li, H.; Wang, Z.; Duan, Y. Technology imports and self-innovation in the context of innovation quality. Int. J. Prod. Econ. 2019, 214, 44–52. [Google Scholar]
  11. Arvanitis, S.; Hollenstein, H. How do different drivers of R&D investment in foreign locations affect domestic firm performance? An analysis based on Swiss panel micro data. Ind. Corp. Chang. 2011, 20, 605–640. [Google Scholar]
  12. Di Minin, A.; Zhang, J.; Gammeltoft, P. Chinese foreign direct investment in R&D in Europe: A new model of R&D internationalization? Eur. Manag. J. 2012, 30, 189–203. [Google Scholar]
  13. Chen, C.; Huang, Y.; Lin, B. How firms innovate through R&D internationalization? An S-curve hypothesis. Res. Policy 2012, 41, 1544–1554. [Google Scholar]
  14. Singh, J. Distributed R&D, cross-regional knowledge integration and quality of innovative output. Res. Policy 2008, 37, 77–96. [Google Scholar]
  15. Lahiri, N. Geographic Distribution of R&D Activity: How Does it Affect Innovation Quality? Acad. Manag. J. 2010, 53, 1194–1209. [Google Scholar]
  16. Feinberg, S.E.; Gupta, A.K. Knowledge spillovers and the assignment of R&D responsibilities to foreign subsidiaries. Strateg. Manag. J. 2004, 25, 823–845. [Google Scholar]
  17. Duan, Y.; Huang, L.; Cheng, H.; Yang, L.; Ren, T. The moderating effect of cultural distance on the cross-border knowledge management and innovation quality of multinational corporations. J. Knowl. Manag. 2020, 25, 85–116. [Google Scholar] [CrossRef]
  18. Haner, U. Innovation quality—A conceptual framework. Int. J. Prod. Econ. 2002, 80, 31–37. [Google Scholar] [CrossRef]
  19. Lanjouw, J.O.; Schankerman, M. Patent Quality and Research Productivity: Measuring Innovation with Multiple Indicators. Econ. J. 2004, 114, 441–465. [Google Scholar] [CrossRef]
  20. Duan, Y.; Liu, S.; Cheng, H.; Chin, T.; Luo, X. The moderating effect of absorptive capacity on transnational knowledge spillover and the innovation quality of high-tech industries in host countries: Evidence from the Chinese manufacturing industry. Int. J. Prod. Econ. 2021, 233, 108019. [Google Scholar] [CrossRef]
  21. Ozturk, E. The impact of R&D sourcing strategies on basic and developmental R&D in emerging economies. Eur. J. Innov. Manag. 2018, 21, 522–542. [Google Scholar]
  22. Archibugi, D.; Coco, A. International partnerships for knowledge in business and academia. Technovation 2004, 24, 517–528. [Google Scholar] [CrossRef]
  23. Li, M.; Lu, C. R&D internationalization and Innovation performance of enterprises—Moderating Effect based on institutional Distance. Econ. Manag. 2019, 41, 39–55. (In Chinese) [Google Scholar]
  24. Almeida, P.; Phene, A. Subsidiaries and knowledge creation: The influence of the MNC and host country on innovation. Strateg. Manag. J. 2004, 25, 847–864. [Google Scholar] [CrossRef]
  25. Muenjohn, N.; Ishikawa, J.; Muenjohn, P.; Memon, M.A.; Ting, H. The effect of innovation and leadership on performance in China and Vietnam. Asia Pac. Bus. Rev. 2021, 27, 101–110. [Google Scholar] [CrossRef]
  26. Hsu, C.; Lien, Y.; Chen, H. R&D internationalization and innovation performance. Int. Bus. Rev. 2015, 24, 187–195. [Google Scholar]
  27. North, D.C. Institutions, Institutional Change and Economic Performance; Cambridge University Press: Cambridge, UK, 1990. [Google Scholar]
  28. Sanna-Randaccio, F.; Veugelers, R. Multinational knowledge spillovers with decentralised R&D: A game-theoretic approach. J. Int. Bus. Stud. 2007, 38, 47–63. [Google Scholar]
  29. Zaheer, S. Overcoming the Liability of Foreignness. Acad. Manag. J. 1995, 38, 341–363. [Google Scholar]
  30. Chin, T.; Jawahar, I.M.; Li, G. Development and Validation of a Career Sustainability Scale. J. Career Dev. 2021. [Google Scholar] [CrossRef]
  31. Asakawa, K. Organizational tension in international R&D management: The case of Japanese firms. Res. Policy 2001, 30, 735–757. [Google Scholar]
  32. Venaik, S.; Midgley, D.F.; Devinney, T.M. Dual Paths to Performance: The Impact of Global Pressures on MNC Subsidiary Conduct and Performance. J. Int. Bus. Stud. 2005, 36, 655–675. [Google Scholar] [CrossRef]
  33. Chin, T. Harmony and organizational citizenship behavior in Chinese organizations. Int. J. Hum. Resour. Manag. 2015, 26, 1110–1129. [Google Scholar] [CrossRef]
  34. Matusik, S.F.; Heeley, M.B. Absorptive capacity in the software industry: Identifying dimensions that affect knowledge and knowledge creation activities. J. Manag. 2005, 31, 549–572. [Google Scholar] [CrossRef]
  35. Gebauer, H.; Worch, H.; Truffer, B. Absorptive capacity, learning processes and combinative capabilities as determinants of strategic innovation. Eur. Manag. J. 2012, 30, 57–73. [Google Scholar] [CrossRef]
  36. Cohen, W.M.; Levinthal, D.A. Absorptive Capacity: A New Perspective on Learning and Innovation. Admin. Sci. Quart. 1990, 35, 128–152. [Google Scholar] [CrossRef]
  37. Zahra, S.A.; George, G. Absorptive Capacity: A Review, Reconceptualization, and Extension. Acad. Manag. Rev. 2002, 27, 185. [Google Scholar] [CrossRef] [Green Version]
  38. Fosfuri, A.; Tribó, J.A. Exploring the antecedents of potential absorptive capacity and its impact on innovation performance. Omega 2008, 36, 173–187. [Google Scholar] [CrossRef] [Green Version]
  39. Alavi, M.; Tiwana, A. Knowledge integration in virtual teams: The potential role of KMS. J. Am. Soc. Inf. Sci. Technol. 2002, 53, 1029–1037. [Google Scholar] [CrossRef]
  40. Kostova, T.; Beugelsdijk, S.; Scott, W.R.; Kunst, V.E.; Chua, C.H.; van Essen, M. The construct of institutional distance through the lens of different institutional perspectives: Review, analysis, and recommendations. J. Int. Bus. Stud. 2020, 51, 467–497. [Google Scholar] [CrossRef]
  41. Mudambi, R.; Navarra, P. Institutions and internation business: A theoretical overview. Int. Bus. Rev. 2002, 11, 635–646. [Google Scholar] [CrossRef]
  42. Sun, Y.; Wen, K. Country Relational Distance, Organizational Power and R&D Managers: Understanding Environmental Challenges for Foreign R&D in China. Asia Pac. Bus. Rev. 2007, 13, 425–449. [Google Scholar]
  43. Xu, D.; Shenkar, O. Note: Institutional distance and the multinational enterprise. Acad. Manag. Rev. 2002, 27, 608–618. [Google Scholar] [CrossRef]
  44. Jensen, R.; Szulanski, G. Stickiness and the adaptation of organizational practices in cross-border knowledge transfers. J. Int. Bus. Stud. 2004, 35, 508–523. [Google Scholar] [CrossRef]
  45. Hurtado-Torres, N.E.; Aragón-Correa, J.A.; Ortiz-de-Mandojana, N. How does R&D internationalization in multinational firms affect their innovative performance? The moderating role of international collaboration in the energy industry. Int. Bus. Rev. 2018, 27, 514–527. [Google Scholar]
  46. Tseng, C.Y.; Wu, L.Y. Innovation quality in the automobile industry: Measurement indicators and performance implications. Int. J. Technol. Manag. 2007, 37, 162. [Google Scholar] [CrossRef]
  47. Evangelista, R.; Iammarino, S.; Mastrostefano, V.; Silvani, A. Measuring the regional dimension of innovation. Lessons from the Italian Innovation Survey. Technovation 2001, 21, 733–745. [Google Scholar] [CrossRef]
  48. Lerner, J. The importance of patent scope: An empirical analysis. RAND J. Econ. 1994, 319–333. [Google Scholar] [CrossRef]
  49. Hagedoorn, J.; Cloodt, M. Measuring innovative performance: Is there an advantage in using multiple indicators? Res. Policy 2003, 32, 1365–1379. [Google Scholar] [CrossRef] [Green Version]
  50. Yueh, L. Patent laws and innovation in China. Int. Rev. Law Econ. 2009, 29, 304–313. [Google Scholar] [CrossRef] [Green Version]
  51. Penner Hahn, J.; Shaver, J.M. Does international research and development increase patent output? An analysis of Japanese pharmaceutical firms. Strateg. Manag. J. 2005, 26, 121–140. [Google Scholar] [CrossRef]
  52. Medcof, J.W. Subsidiary Technology Upgrading and International Technology Transfer, with Reference to China. Asia Pac. Bus. Rev. 2007, 13, 451–469. [Google Scholar] [CrossRef]
  53. Blau, P.M. Inequality and Heterogeneity: A Primitive Theory of Social Structure; Free Press: New York, NY, USA, 1977; Volume 7. [Google Scholar]
  54. Duan, Y.; Wang, W.; Zhou, W. The multiple mediation effect of absorptive capacity on the organizational slack and innovation performance of high-tech manufacturing firms: Evidence from Chinese firms. Int. J. Prod. Econ. 2020, 229, 107754. [Google Scholar] [CrossRef]
  55. Duchek, S. Capturing absorptive capacity: A critical review and future prospects. Schmalenbach Bus. Rev. 2013, 65, 312–329. [Google Scholar] [CrossRef]
  56. Kaufmann, D.; Kraay, A.; Mastruzzi, M. The Worldwide Governance Indicators: Methodology and Analytical Issues1. Hague J. Rule Law 2011, 3, 220–246. [Google Scholar] [CrossRef]
  57. Pan, C.; Wei, W.X.; Muralidharan, E.; Liao, J.; Andreosso-O Callaghan, B. Does China’s Outward Direct Investment Improve the Institutional Quality of the Belt and Road Countries? Sustainability 2020, 12, 415. [Google Scholar] [CrossRef] [Green Version]
  58. Thakur Wernz, P.; Samant, S. Relationship between international experience and innovation performance: The importance of organizational learning for EMNE s. Glob. Strat. J. 2019, 9, 378–404. [Google Scholar] [CrossRef]
  59. Liu, P.; Li, H. Does bank competition spur firm innovation? J. Appl. Econ. 2020, 23, 519–538. [Google Scholar] [CrossRef]
  60. Delios, A.; Beamish, P.W. Ownership strategy of Japanese firms: Transactional, institutional, and experience influences. Strateg. Manag. J. 1999, 20, 915–933. [Google Scholar] [CrossRef]
  61. Cameron, A.C.; Trivedi, P.K. Microeconometrics: Methods and Applications; Cambridge University Press: Cambridge, UK, 2005. [Google Scholar]
  62. Immelt, J.R.; Govindarajan, V.; Trimble, C. How GE is disrupting itself. Harv. Bus. Rev. 2009, 87, 56–65. [Google Scholar]
  63. Zhang, Y.; Khan, U.; Lee, S.; Salik, M. The influence of management innovation and technological innovation on organization performance. A mediating role of sustainability. Sustainability 2019, 11, 495. [Google Scholar] [CrossRef] [Green Version]
Figure 1. Research framework.
Sustainability 13 04579 g001
Figure 2. Moderating effect of absorptive capacity on the relationship between R&D intensity and innovation quality.
Sustainability 13 04579 g002
Figure 3. Moderating effect of institutional distance on the relationship between R&D intensity and innovation quality.
Sustainability 13 04579 g003
Figure 4. Moderating effect of absorptive capacity on the relationship between R&D diversity and innovation quality.
Sustainability 13 04579 g004
Figure 5. Moderating effect of institutional distance on the relationship between R&D diversity and innovation quality.
Sustainability 13 04579 g005
Table 1. Variables and measurements.
VariableVariable NameVariable Measurement
Dependent variableInnovation quality (IQ)Number of patents granted per year
Independent variableR&D intensity (Intensity)Total number of oversea R&D subsidiaries each year
R&D diversity (Diversity)the Blau index
Moderating variablesAbsorptive capacity (AC)R&D investment/total sales
Institutional distance (WGI)WGI score (rule of law) difference between the host country and China
Control variablesFirm size (Size)Logarithm of total assets
Firm age (Age)Logarithm of the time from the establishment of the firm to the observed year
Internationalization experience (Experience)The time from the international expansion of the firm to the observed year
Firm profitability (ROA)Net profit/average balance of total assets
Entry mode (EM)Dummy variable, cross-border merger or acquisition is recorded as 1, and other investment modes are recorded as 0
Table 2. Descriptive statistics of variable.
VariableMeanSDMinMaxVIF
IQ122.809323.5570.0003875.000
Intensity0.5530.3910.0001.0001.12
Diversity0.1330.2060.0000.5001.13
AC8.0667.8070.00072.7501.09
WGI45.64111.505−15.62561.0581.07
Size22.4011.23719.55527.3861.45
Age2.7070.3601.3863.4661.18
ROA0.0470.099−2.0080.8631.02
Experience4.8044.325−2.00019.0001.37
Table 3. Correlation coefficient matrix of variables.
IQIntensityDiversityWGIACLnSizeLnAgeROAExperienceEM
IQ1
Intensity−0.098 ***1
Diversity0.187 ***0.229 ***1
WGI−0.125 ***−0.0080.0011
AC−0.140 ***0.108 ***0.04800.114 ***1
LnSize0.566 ***−0.099 ***0.178 ***−0.182 ***−0.187 ***1
LnAge0.04200.089 ***−0.005−0.169 ***−0.157 ***0.252 ***1
ROA−0.0010.043−0.020.03800.023−0.013−0.0131
Experience0.220 ***0.129 ***0.153 ***−0.083 ***−0.0090.461 ***0.327 ***−0.078 ***1
EM−0.017−0.061 **0.103 ***0.048 *−0.056 *0.049 *−0.055 *−0.090 ***0.0081
Note: *, ** and *** indicate that they pass the test at the levels of 10%, 5%, and 1%, respectively.
Table 4. Relationships between principal variables.
(1)(2)(3)(4)(5)
IQIQIQIQIQ
Size0.513 ***0.532 ***0.515 ***0.526 ***0.527 ***
(0.016)(0.016)(0.016)(0.017)(0.017)
Age−0.244 ***−0.209 ***−0.203 ***−0.257 ***−0.260 ***
(0.026)(0.026)(0.026)(0.027)(0.027)
ROA0.039 ***0.040 ***0.048 ***0.064 ***0.063 ***
(0.005)(0.005)(0.005)(0.006)(0.006)
Experience−0.187 ***−0.224 ***−0.238 ***−0.161 ***−0.157 ***
(0.022)(0.022)(0.022)(0.023)(0.023)
EM−0.112 ***−0.108 ***−0.107 ***−0.125 ***−0.126 ***
(0.008)(0.008)(0.008)(0.008)(0.008)
Intensity −0.204 ***−0.240 ***
(0.007)(0.008)
Intensity2 −0.128 ***
(0.008)
Diversity −0.121 ***−0.139 ***
(0.006)(0.012)
Diversity2 0.016 *
(0.009)
N 11151115111510801080
Log   likihood −14,408.168−14,024.808−13,890.498−13,901.04−13,899.522
Wald   chi 2
Prob > chi 2
1363.250
0.0000
2102.180
0.0000
2352.460
0.0000
1686.580
0.0000
1691.240
0.0000
Note: * and *** indicate that they pass the test at the levels of 10% and 1%, respectively.
Table 5. Moderating effect results.
(6)(7)(8)(9)
IQIQIQIQ
Size0.525 ***0.499 ***0.541 ***0.507 ***
(0.016)(0.016)(−0.017)(−0.017)
Age−0.171 ***−0.000−0.274 ***−0.106 ***
(0.026)(0.028)(−0.027)(−0.029)
ROA0.050 ***0.046 ***0.068 ***0.059 ***
(0.005)(0.005)(−0.007)(−0.006)
Experience−0.278 ***−0.324 ***−0.170 ***−0.181 ***
(0.022)(0.025)(−0.023)(−0.026)
EM−0.107 ***−0.118 ***−0.136 ***−0.129 ***
(0.008)(0.008)(−0.008)(0.008)
AC0.125 *** 0.128 ***
(0.017) (−0.017)
WGI 0.127 *** 0.123 ***
(0.012) (0.011)
Intensity−0.188 ***−0.181 ***
(0.008)(0.008)
Intensity2 −0.107 ***−0.126 ***
(0.008)(0.008)
Diversity −0.131 ***−0.084 ***
(−0.014)(−0.013)
Intensity*AC0.169 ***
(0.010)
Intensity2* AC0.052 ***
(0.010)
Intensity* WGI 0.066 ***
(0.005)
Intensity2* WGI 0.010 *
(0.005)
Diversity* AC −0.020 **
(−0.010)
Diversity*WGI 0.015 ***
(−0.006)
N 1115111410801079
Log   likihood −13,722.775−13,599.700−13,870.600−13,685.000
Wald   chi 2 2656.2202359.2101730.3101574.600
Prob > chi 2 0.00000.00000.00000.0000
Note: *, ** and *** indicate that they pass the test at the levels of 10%, 5%, and 1%, respectively.
Table 6. Robustness test results.
(1)(2)(3)
IQIQIQ
Size0.680 ***0.734 ***0.635 ***
(0.013)(0.013)(0.014)
Age−0.285 ***−0.097 ***−0.280 ***
(0.021)(0.023)(0.024)
ROA0.081 ***0.056 ***0.072 ***
(0.006)(0.005)(0.005)
Experience0.161 ***0.210 ***0.565 ***
(0.018)(0.020)(0.021)
EM0.004−0.044 ***−0.030 ***
(0.005)(0.006)(0.006)
Intensity−0.231 ***−0.178 ***
(0.007)(0.007)
Intensity2−0.184 ***−0.159 ***
(0.007)(0.007)
Diversity−0.142 *** −0.146 ***
(0.004) (0.004)
WGI 0.487 ***0.503 ***
(0.010)(0.009)
AC 0.326 ***0.240 ***
(0.012)(0.012)
Intensity* WGI 0.061 ***
(0.005)
Intensity2* WGI −0.011 **
(0.005)
Intensity*AC 0.097 ***
(0.007)
Intensity2* AC −0.040 ***
(0.007)
Diversity*AC −0.301 ***
(0.007)
Diversity*WGI 0.138 ***
(0.004)
N 108711191086
Log   likihood −24,448.249−23,159.910−21,698.493
Wald   chi 2 9140.41511,686.95113,752.731
Prob > chi 2 0.0000.0000.000
Note: ** and *** indicate that they pass the test at the levels of 5%, and 1%, respectively.
Publisher’s Note: MDPI stays neutral with regard to jurisdictional claims in published maps and institutional affiliations.

