
Neighbourhood Modelling for Urban Sustainability Assessment


1
Institute of Materials Technology (ITM), Universitat Politecnica de Valencia, Camino de Vera s/n, 46022 Valencia, Spain
2
Dpto de Construcciones Arquitectónicas, Universitat Politecnica de Valencia, 46022 Valencia, Spain
*
Author to whom correspondence should be addressed.
Sustainability 2021, 13(9), 4654; https://0-doi-org.brum.beds.ac.uk/10.3390/su13094654
Submission received: 6 April 2021
/
Revised: 19 April 2021
/
Accepted: 20 April 2021
/
Published: 22 April 2021
(This article belongs to the Collection Indicators, Assessment Tools, and Rating Systems for Mainstreaming Sustainability in Urban Planning and Development)
Abstract
:Climate change is becoming a dominant concern for advanced countries. The Paris Agreement sets out a global framework whose implementation relates to all human activities and is commonly guided by the United Nations Sustainable Development Goals (UN SDGs), which set the scene for sustainable development performance configuring all climate action related policies. Fast control of CO2 emissions necessarily involves cities since they are responsible for 70 percent of greenhouse gas emissions. SDG 11 (Sustainable cities and communities) is clearly involved in the deployment of SDG 13 (Climate Action). European Sustainability policies are financially guided by the European Green Deal for a climate neutral urban environment. In turn, a common framework for urban policy impact assessment must be based on architectural design tools, such as building certification, and common data repositories for standard digital building models. Many Neighbourhood Sustainability Assessment (NSA) tools have been developed but the growing availability of open data repositories for cities, together with big-data sources (provided through Internet of Things repositories), allow accurate neighbourhood simulations, or in other words, digital twins of neighbourhoods. These digital twins are excellent tools for policy impact assessment. After a careful analysis of current scientific literature, this paper provides a generic approach for a simple neighbourhood model developed from building physical parameters which meets relevant assessment requirements, while simultaneously being updated (and tested) against real open data repositories, and how this assessment is related to building certification tools. The proposal is validated by real data on energy consumption and on its application to the Benicalap neighbourhood in Valencia (Spain).
1. Introduction
Regeneration is a continuous process through the city life which should be considered the basis for evaluating the sustainability of urban environments [1]. The guiding principles might defer from urban expansion to reallocation of social habits, services, and processes and above all land economic value. Cities are living organisms whose metabolism is controlled by processes, costs and urban policy. In order to face the ever-increasing problems raised by cities, including social disintegration, economic recession, environmental pollution, and urban function deterioration, studies on urban renewal have received significant attention worldwide [2,3].
Most advanced countries are developing their urban agendas based on Sustainable Development Goal 11 of the United Nations but applying the term sustainability is a complex task due to its multi layered nature [4]. When considering a city in its integrity urban policy might appear as meaningless due to unsustainable components [5]. A more suitable approach is found when the city is split into parts. Neighbourhoods, logical pieces of the urban puzzle, are best suited for addressing sustainable urban development [6]. At the same time, neighbourhoods match the typical development project scale and facilitate the social codesign.
The development of monitoring tools and the corresponding assessment methods are a priority concern both for academia and politicians. The biggest challenge lies in managing the flows of information and knowledge between the various levels of indicator systems which must be based on common practice and existing repositories. The construction market has responded by developing a myriad of certification tools, most of them centred on carbon footprint evaluation, and widely used in environmental product declarations. Dominant labels like the British “Building Research Establishment Environmental Assessment Method” (BREEAM for short) and the North-American “Leadership in Energy and Environmental Design” (LEED) are tracking building life cycle through energy (Life Cycle Analysis or LCA) and cost (Life Cycle Costing, or LCC) which require a detailed track of the building through a digital model as proposed in the Building Integrated Modeling (BIM) approach [7]. However, other LCA-based tools available Eco-Quantum (Netherlands), EcoEffect (Sweden), ENVEST 2 (the first UK developed by the Building Research Establishment), the Building for Environmental and Economic Sustainability (BEES) software developed by the National Institute for Standards and Technology (NIST, US), ATHENA (from the Athena Sustainable Materials Institute) and LCA House (Finland), rely on reference databases for their evaluation [6]. After a detailed bibliographical comparison of contextual and methodological procedures for building certification tools [8,9], the building footprint has been proven as the leading criteria obtained through an LCA procedure (and its derivative LCC). All methodologies consider the building as the basic element, evaluating its carbon footprint starting with its embedded part (materials and systems), their use (energy demand) and final end-of-life contribution. Different approaches are based on proprietary, measured or statistical data, rendering substantive differences for alternative application scenarios. Although a full BIM deployment would solve most problems, it is already far from becoming a dominant reality [10]. Tools implementing generic approaches based on widespread equivalent data repositories, are sought in order to support sustainable policy design from performance evidence.
This paper proposes an adaptive model framework implemented at neighbourhood scale for a performance-based comparison, regarding LCA, of urban regeneration alternatives based on construction strategies focused on energy performance of buildings in a given environment. Furthermore, the proposed framework identifies strategies and specific building solutions to a given building infrastructure. From LCA results the proposed framework is then evaluated as input to building certification schemes (LEED and BREEAM), comparing the output to be expected from each solution.
The research results, and conclusions of this paper, are based on a digital model developed from an assessment of existing buildings and their current performance. Although other sustainable dimensions, such as green infrastructure, are considered results affecting urban redevelopment (including possible citizen participatory schemes), they can only be addressed by building new models based on envisioned urban implementations. Including other sustainability layers to the model can follow the proposed methodology only when their impact is related to CO2 footprint evaluation (directly or indirectly).
The research evidence check is based on the comparison of simulated results against historical data from the Benicalap neighbourhood in Valencia (Spain). The findings can be exported easily to most cities (starting from a specific building typology and solutions analysis) for facilitating decision-makers the identification of key areas for sustainable construction.
The selected ‘case-study’ neighbourhood is part of the Tabula/Episcope European building research database [11] facilitating detailed information for European cities which can be easily matched for other world regions. The associated model presented can be easily exported for assessing sustainable construction strategies for urban renewal at neighbourhood level and are the basis for a future research proposal.
2. Background Literature Review
LCA, when applied to buildings, can accurately estimate the corresponding carbon footprint once the main energy-related properties of materials, and their use, have been identified [12]. Although construction is always evolving over the course of time, the evaluation of all relevant energy parameters for buildings have been performed by several instances [11,13] through an informed analysis of the building stock through the perspective of time. Evolution of building typologies is due to the introduction of new materials and construction techniques, as well as through economical and raw materials fluctuations. In addition, architectonical innovations, social changes and cultural trends present repetitive solutions (or typologies) in homogeneous areas, easily recognizable in given periods, that can be categorized for their use as standard references.
Starting from the comparative results from several energy simulations a reference database for individual building typologies was obtained [12] and tested against monitored data [13]. It can be concluded that the energy performance of a given building can be estimated additively from the individual envelope elements. Obviously, key determining factors such as element geometry and its exposure to climate conditions have to be included [13].
Building energy performance also depends on the existing infrastructure for climate control (Heating, Ventilation and Air Conditioned, or HVAC systems) and the distribution system, as well as local conditions derived from green, blue and grey city infrastructures [14].
In conclusion, LCA analysis of buildings under the procedure described above meets the ISO standard [15]. This principle can also facilitate SDG-based sustainability assessment by the matching carbon footprint, embedded energy, and city infrastructure indicators to SDG key performance indicators [16], delivering a building key performance indicators portfolio that can be applied at neighbourhood level. This approach facilitates the implementation of sustainable policy assessment in any city.
From a more generic point of view, sustainability deals with eco-efficiency and cost-efficiency, which result from a holistic building performance analysis. However, the enhanced added value for the assessment would require also economic and social impacts which would hinder not only agile evaluations but also efficiency and the existence of a common reference base. To ensure the feasibility and applicability of the sustainability assessment the simplified approach renders better results [16]. The consistent analysis performed on the current scientific literature on urban sustainability assessment demonstrates that some research gaps still exist [17], although the accuracy obtained from the simplified carbon footprint approach is enough and efficient.
It is unavoidable to point out that one of the most important elements determining the effectiveness of sustainable policies is residents’ perception and their participation in the co-design of their residential neighbourhoods [18]. However, this point can only be implemented by an adequate communication from city authorities on the relevance of the projected policy together with a well-balanced participation strategy [18].
During the last decade, an intensive debate has appeared over two distinctive interpretations of LCA [9]. The first uses LCA results to determine the relative weight of different initiatives. This type of LCA is referred to as retrospective. The second interpretation project the future result through a simulation of the results of policy implementation. This second interpretation, called prospective LCA, considers only a subset of desirable results, and the analysis is biased by the specific way of fulfilling an objective. Both can be used and considered together through relevant statistical approaches such as Data Envelopment Analysis (DEA) [19].
Different alternatives have been proposed to embed LCA in building codes, BIM software and different performance indexes. Using LCA results as a sustainability assessment reference requires a clear understanding of the methodology by stakeholders who are far from identifying the real benefits through their own observation. For this reason, LCA can only be considered as an initial step for checking results and comparing efficiency.
The LCA evaluation corresponds basically to ISO requirements. However, this model is a first step towards LEED and BREEAM certifications. Although these standards apply very different methodologies, they use a similar approach to the energy performance section. LEED allows additionally for building-level energy metering and ongoing commissioning and implementation analysis, while BREEAM evaluates pollution prevention, environmental policies and sustainable procurement [20].
3. Materials and Methods
3.1. Reference
The reference data used for developing the proposed neighbourhood model require prior existence of cadastral information in an adequate graphical format. All relevant cities in the world have at least an orthophoto database for taxation purposes. However, one of the constituent parts of cadastral information systems are graphical data (vectorial format) on parcel boundaries also including data on ownership and different building-related information. This information should be loaded to a GIS software platform for editing, leaving only the shape, construction date and height information for each building.
Building regulations history for the city under study are kept in city repositories and must be accessed for developing the required building typologies and their implementation through a consistent database of all building solutions required for envelope surfaces and structural elements. Information for each building has to be completed after checking the corresponding building typology according to the construction date and applicable regulations.
In order to complete the neighbourhood model, each building has a record to be completed with the number of floors, window surfaces and roof structure after identifying each building through Google Maps [21] and using Street View [22] for visual evaluation.
Each building is then modelled in 3D from the previously detailed record and with the construction information developed according to the corresponding building typology and basic geometry added together with information on building solutions corresponding to the building typology. The authors have developed a database for building solutions including materials required and labour per reference unit. Building solutions are linked to building elements and each material record records physical properties required for the building design and analysis. There are also open-source databases [23], as well as commercial solutions [24].
Additional references for energy requirements come from an evaluation of climate needs through the open-source software from ETH Zürich City Energy Analyst [25], using open-source weather data [26] or alternative commercial databases [27]. The Episcope project [11] also details HVAC solutions for climate control related to building typologies.
The last reference input for building the proposed model comes from open data repositories (for Europe [28] and the world [29]), which incorporate required inputs for traffic, green, grey and blue infrastructures. After the LCA evaluation is performed, only the methodological alternative parts for LEED and BREEAM remain in order to evaluate these certifications.
3.2. Methods and Proposed Research
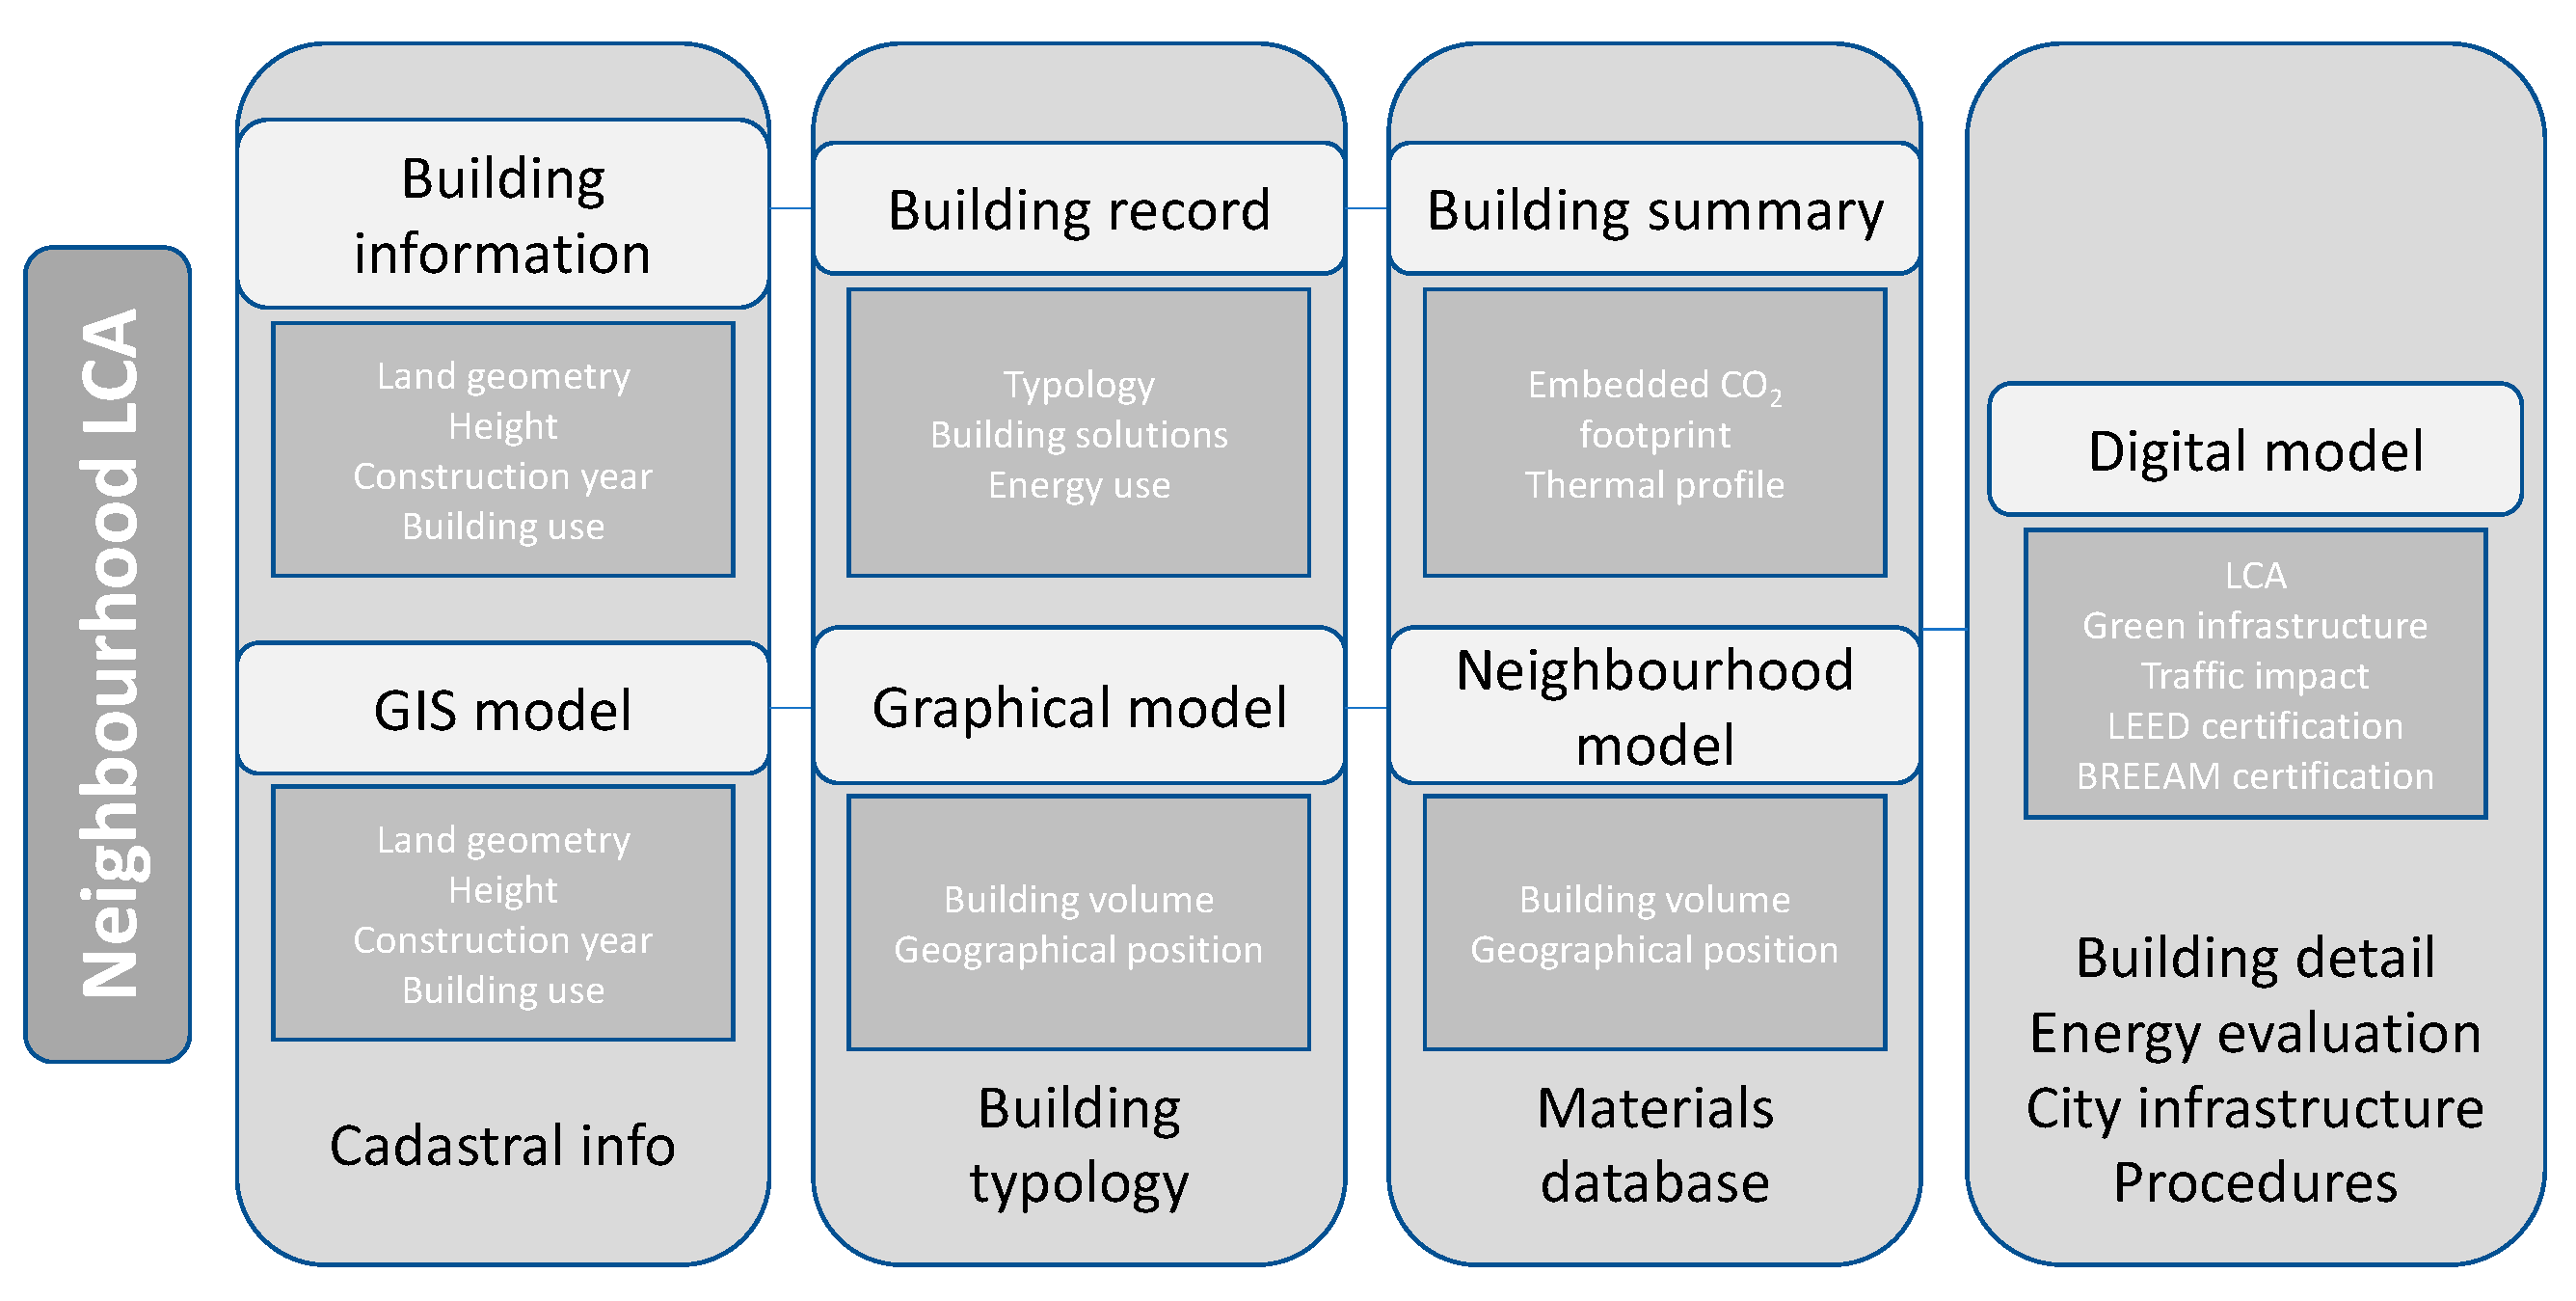
This paper focuses on the contextualization and development of a procedure for preparing a digital model of a neighbourhood according to Figure 1. The research will be implemented on a peripheral neighbourhood of Valencia (Spain) called Benicalap.
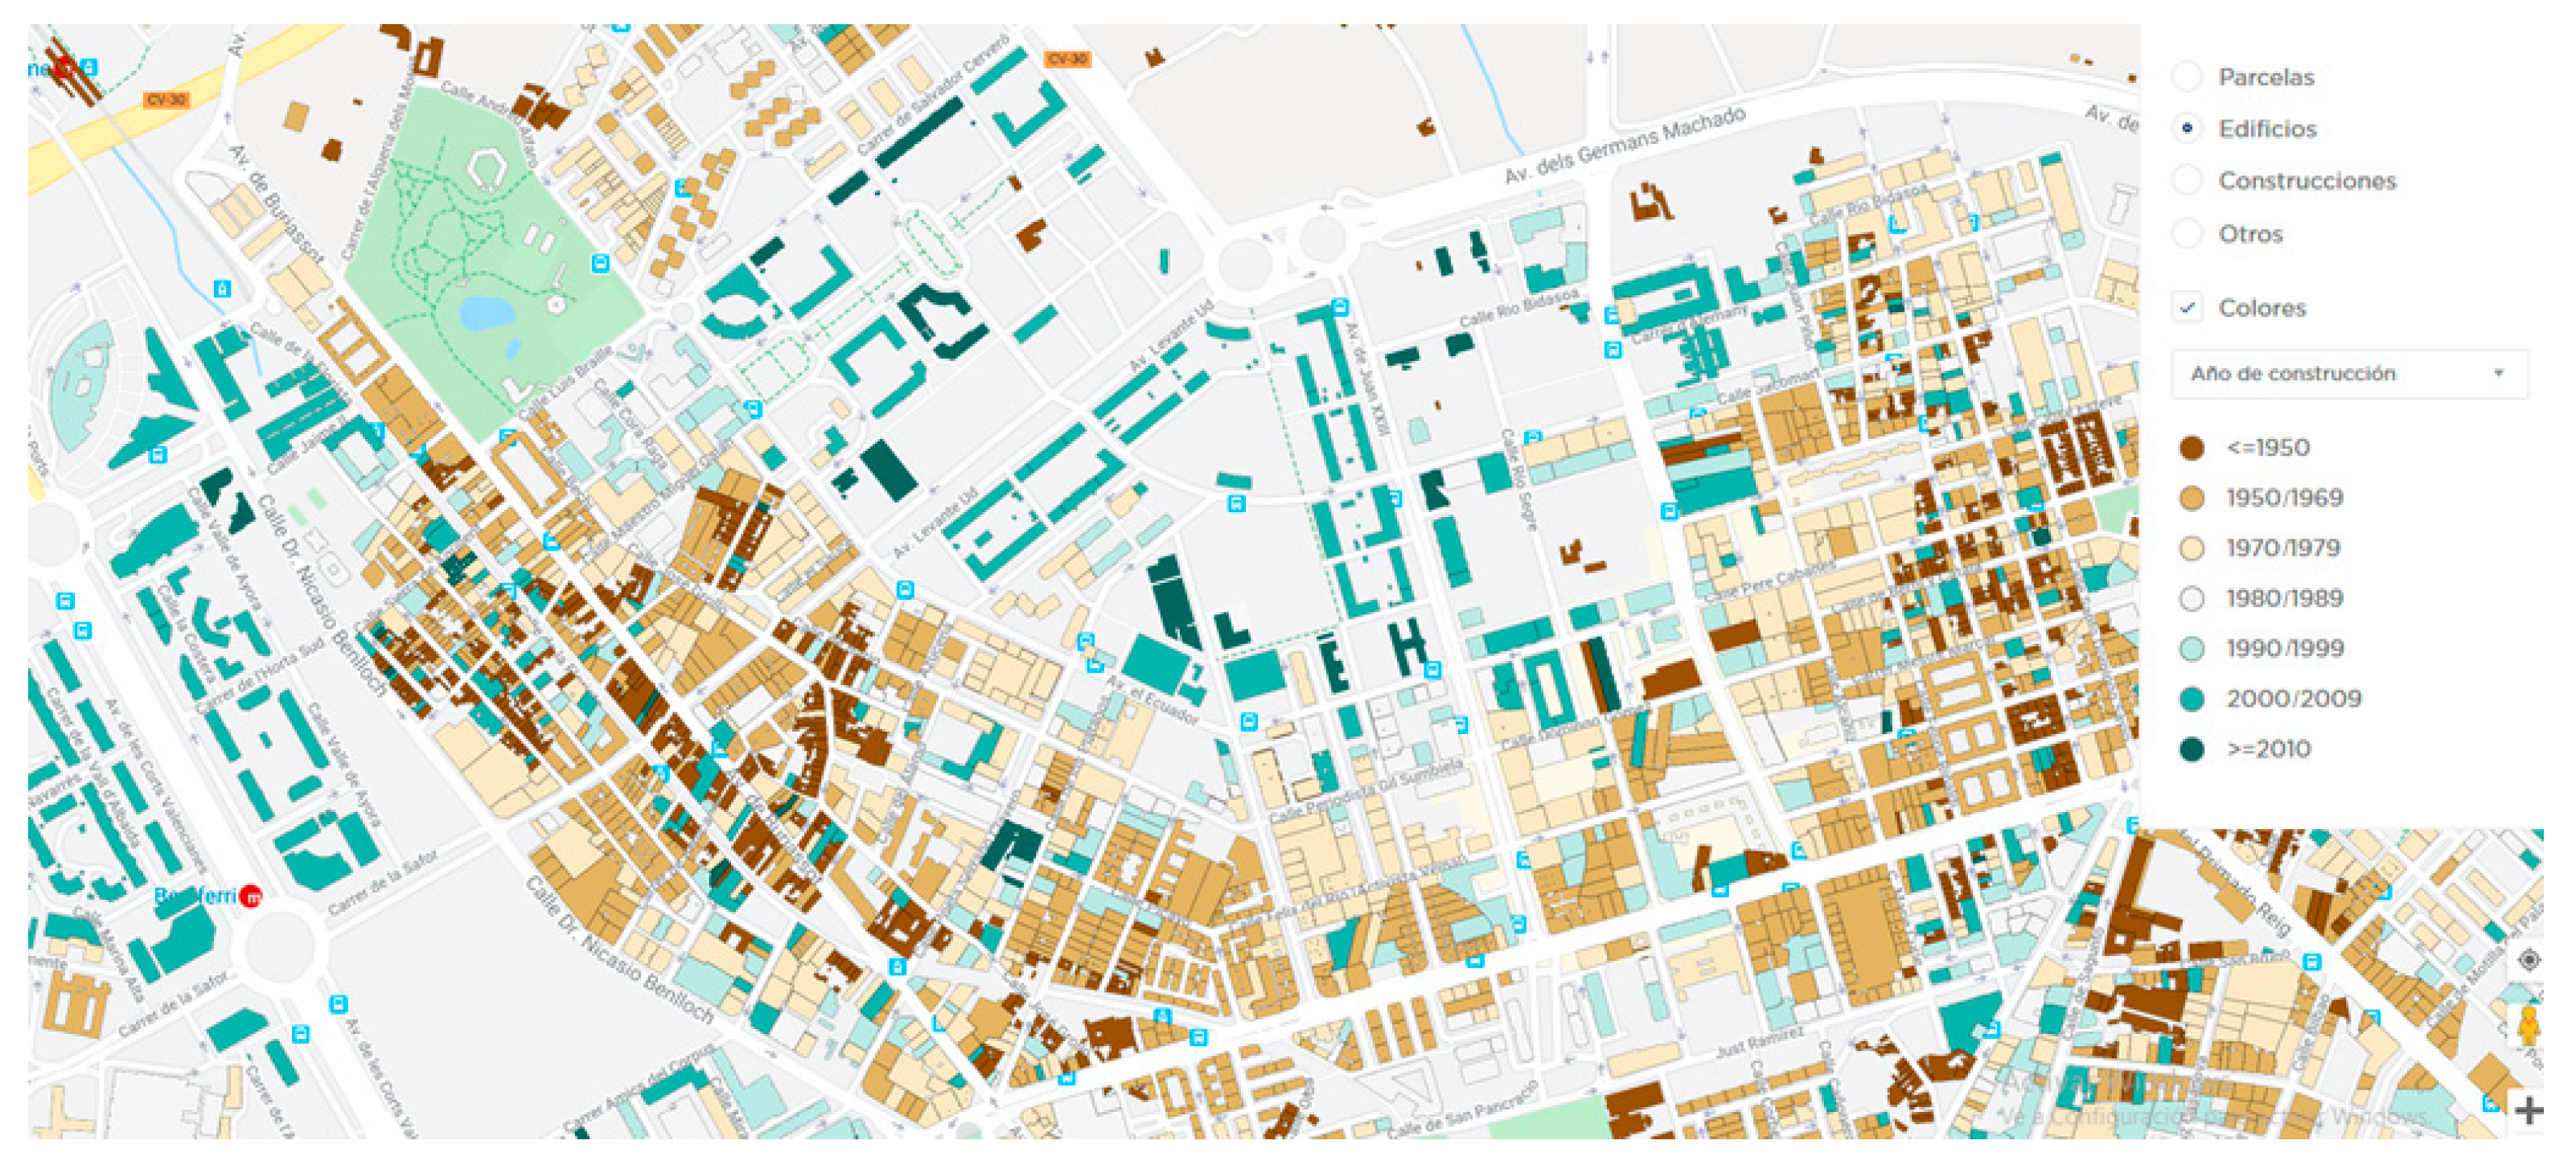
The information needed to perform the life cycle analysis (LCA) begins with the selection of cadastral data from the Spanish national registry [30]. Following the INSPIRE EU data exchange directive, the information is imported into ArcGIS Desktop 10.5.x, together with streets and green infrastructure layers from the Valencia city open data platform [31]. Each cadastral reference is cleaned and checked for construction date and height, developing the GIS model in Figure 2.
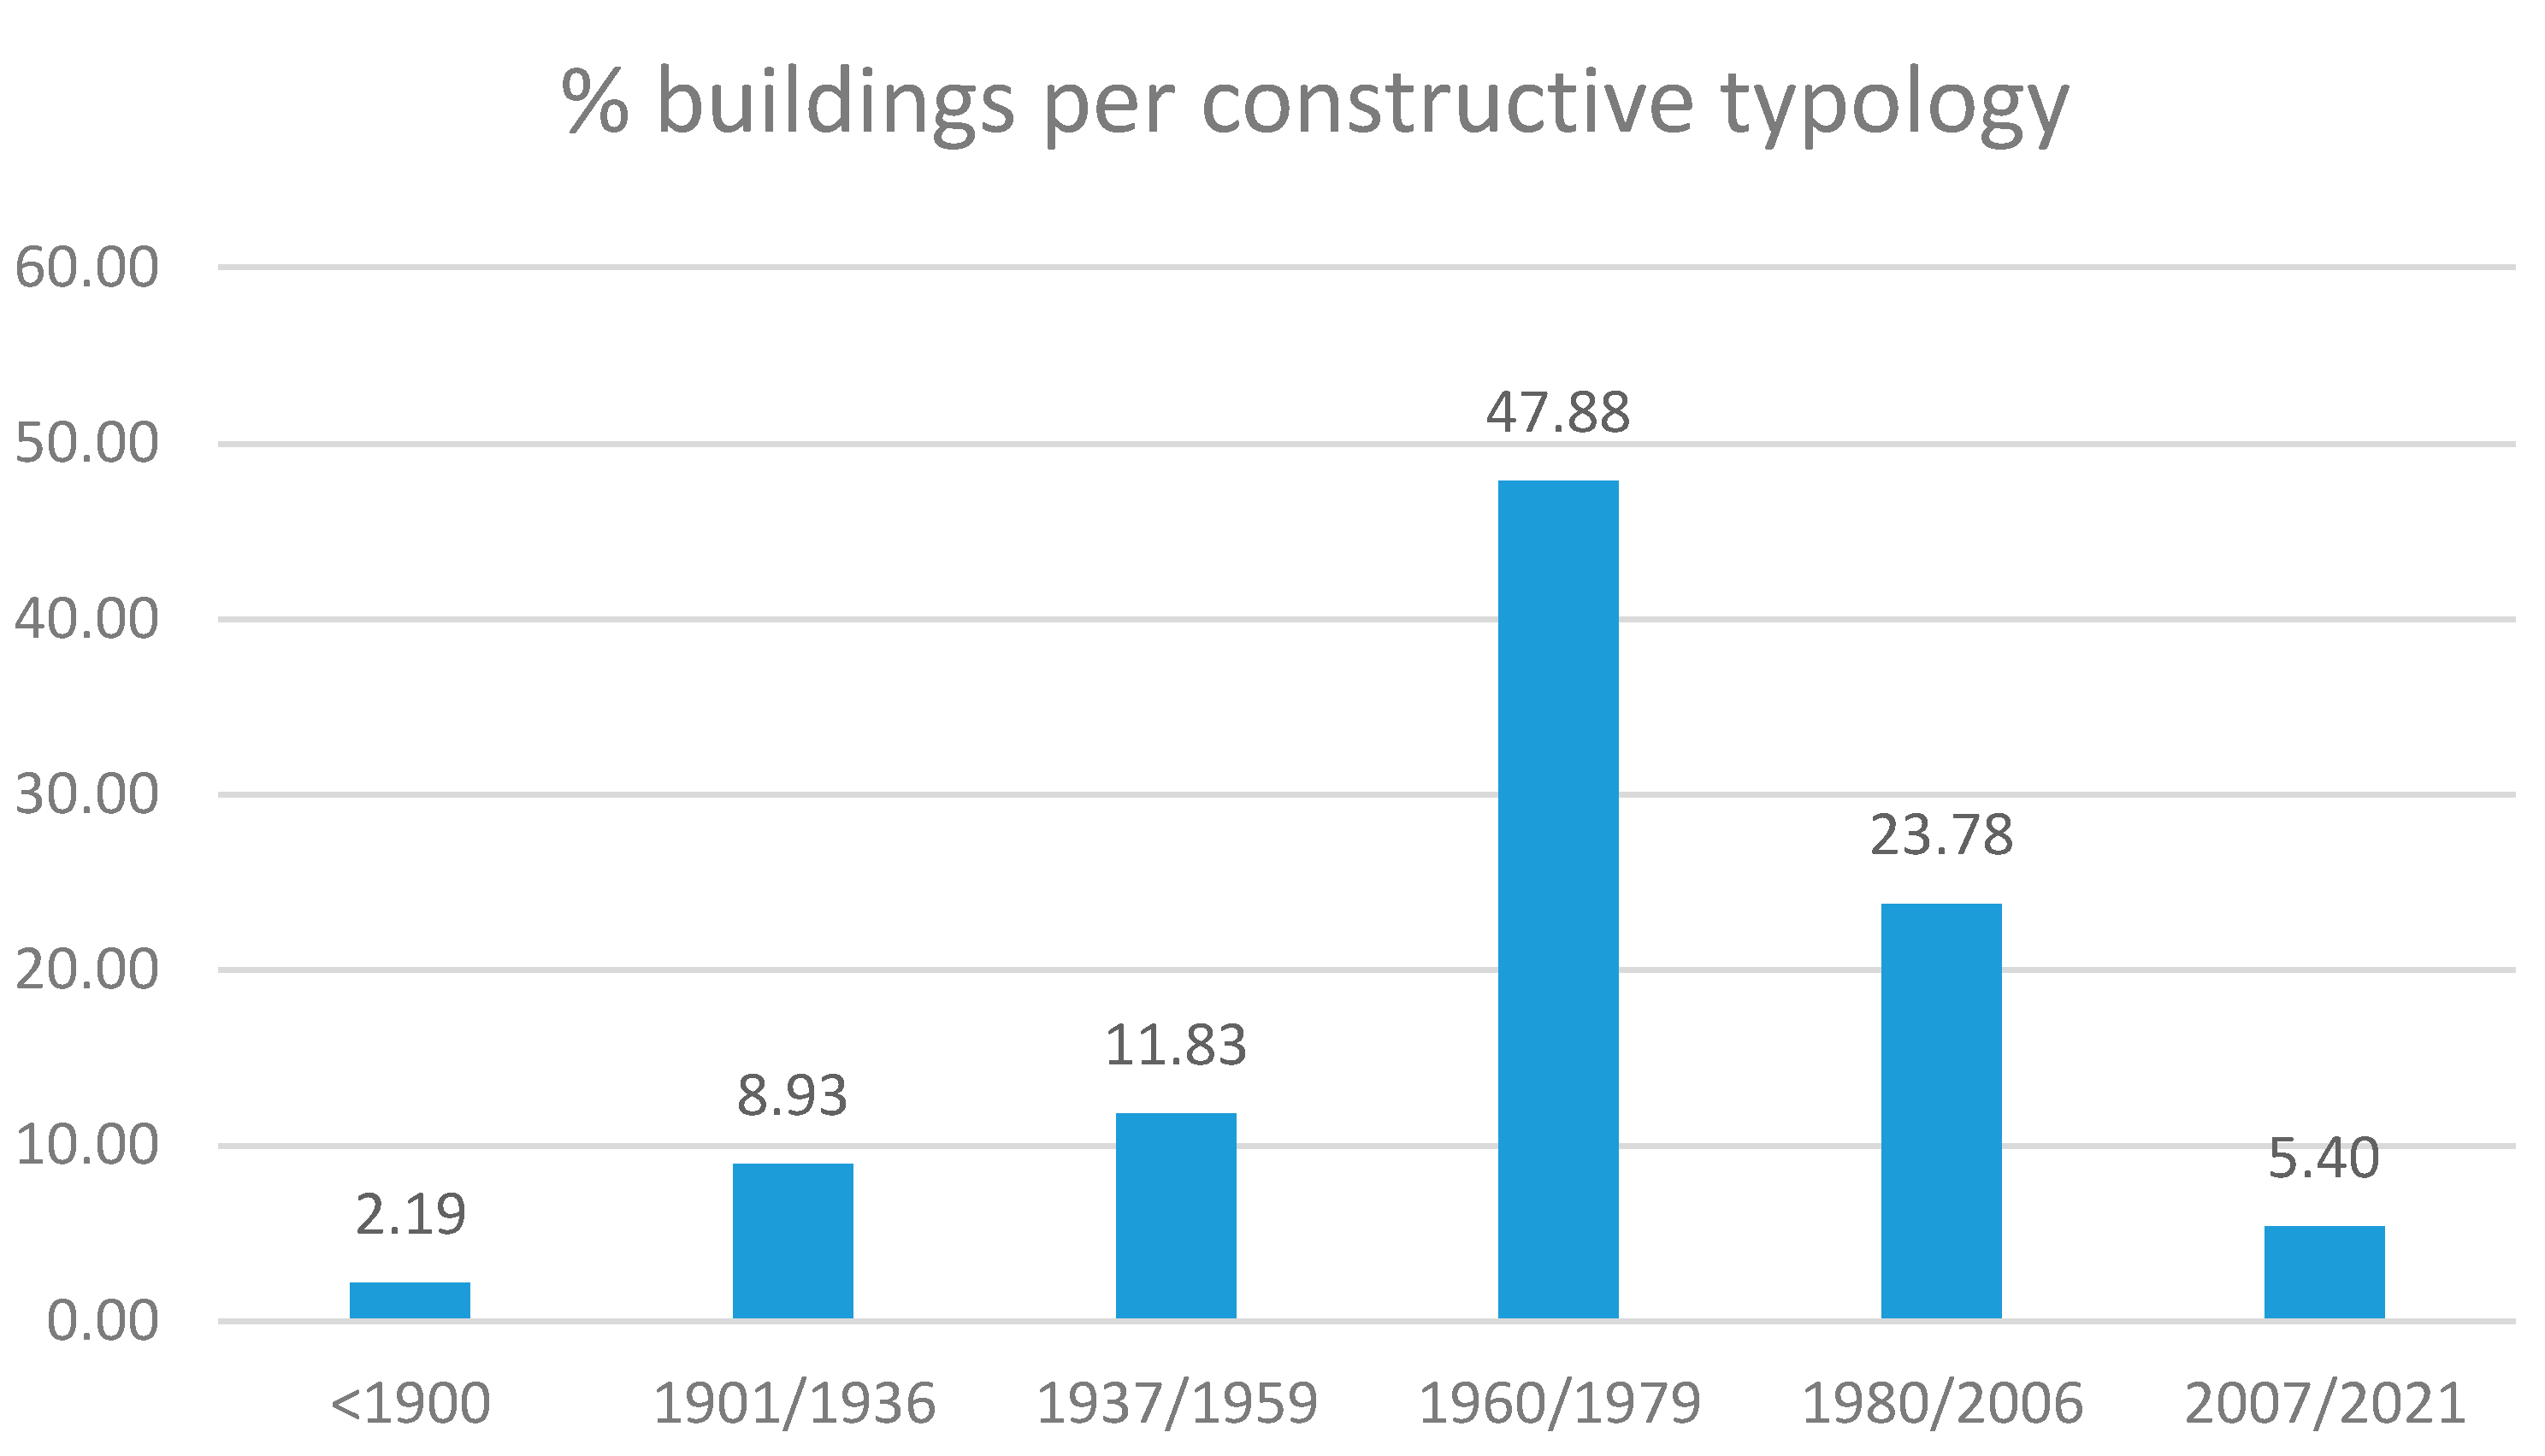
An iterative procedure follows for checking each building’s construction date, building standards applicable and corresponding typology with constructive solutions. For easier development, the neighbourhood is segmented onto separate development years and each building is evaluated for materials carbon footprint, envelope surfaces and climate systems applicable (see Figure 3), followed by a simple summary of typologies and percentage of the 1556 buildings in the neighbourhood.
In order to build the digital neighbourhood model building typologies are identified through the Tabula/Episcope [11] web-tool considering building size and use together with the building date. The web-tool is structured according to existing Spanish standards in the given period and using that information we obtain a detail of relevant building solutions for each of the main subsystems (foundation, structure, façade, roof, installations and walls) from the construction database developed by our institute. The database is designed to obtain a summary of all materials (with relevant properties for heat conductivity, and CO2 footprint once the surface and floors are introduced into the selected building solutions. This is repeated for all buildings and computed for all the buildings of each building typology (corresponding to periods) in the neighbourhood and includes visible refurbishments to buildings. Results are presented oh Figure 4.
3.3. Research Procedure
The City Energy Analyst (CEA) [25] is chosen for the energy requirements calculations and to obtain the CO2 footprint for the usage phase. CEA calculates the energy requirements for the buildings which is then calculated effectively based on the climate systems (and typical use) per building typology. The industrial buildings in the neighbourhood are left apart and their energy requirements is a direct input taken from city data.
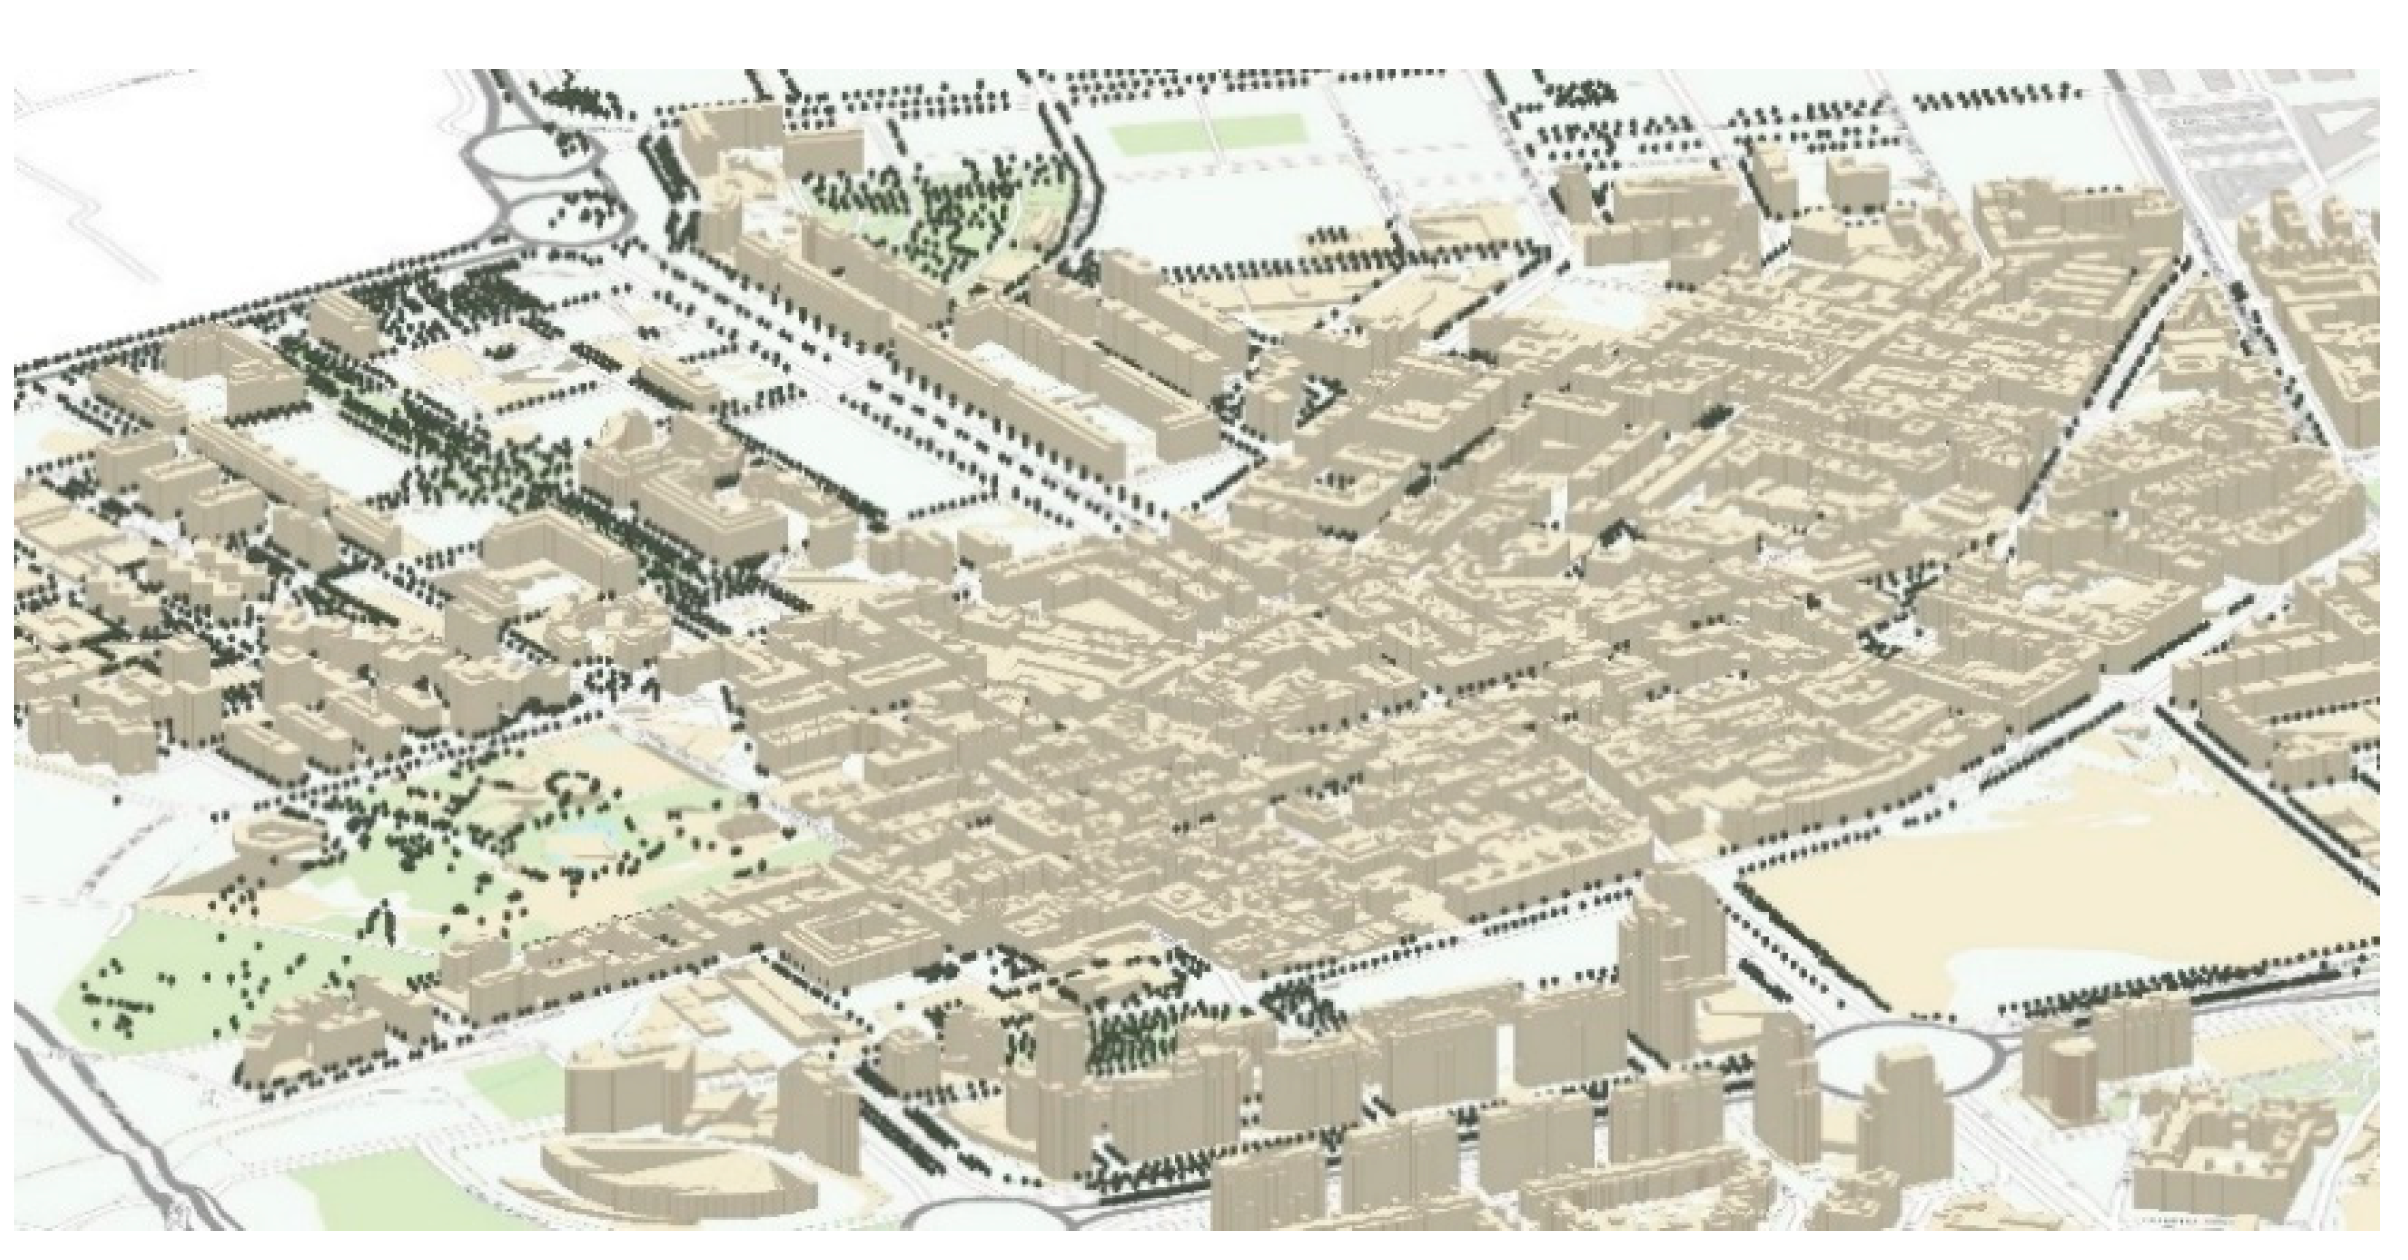
With the energy simulation results the CO2 footprint of the usage phase is obtained and combined with the embedded CO2 footprint from the construction phase. Results take into account the expected influence of green infrastructure and traffic on the street average temperature [31,32] which consistently introduces 2-degree milder temperatures (colder in summer, warmer in winter) for streets, or parks, with trees but car traffic does not have a clear influence. Energy consumption intensity per building is then calculated in the integrated digital model and the results are presented graphically in Figure 5.
Energy usage for climate systems in different buildings is calculated for a thermal load in a typical year (2019 in our case) using as comfort temperature 18 °C in winter and 22 °C during summer. Data for 2020 were avoided due to unpredictable changes to the weather data series due to COVID fluctuations.
Additional information is obtained from the Valencia city open-data portal [31] and stored in the digital model for LEED and BREEAM evaluations.
4. Results
The LCA evaluation is compared to the measured consumption data obtained from the electric utility company (Iberdrola). Data were obtained from the simulation and compared to real consumption for the same period (2019). As can be seen in Table 1, the average error is smaller than 10%. As identified by prior research [33], Building Energy Simulation is used extensively in the design stage of building construction and has the limitation of past weather files which do not correspond exactly to the conditions met by all buildings even in a small area. This together with statistical variations from standard construction typologies provide deviations ranging from 9% to 27% from measured results. The actual average deviation obtained is clearly within these limits and provides a reasonable accuracy for a digital model which is simple to implement (2 weeks) and has no relevant calculation requirements.
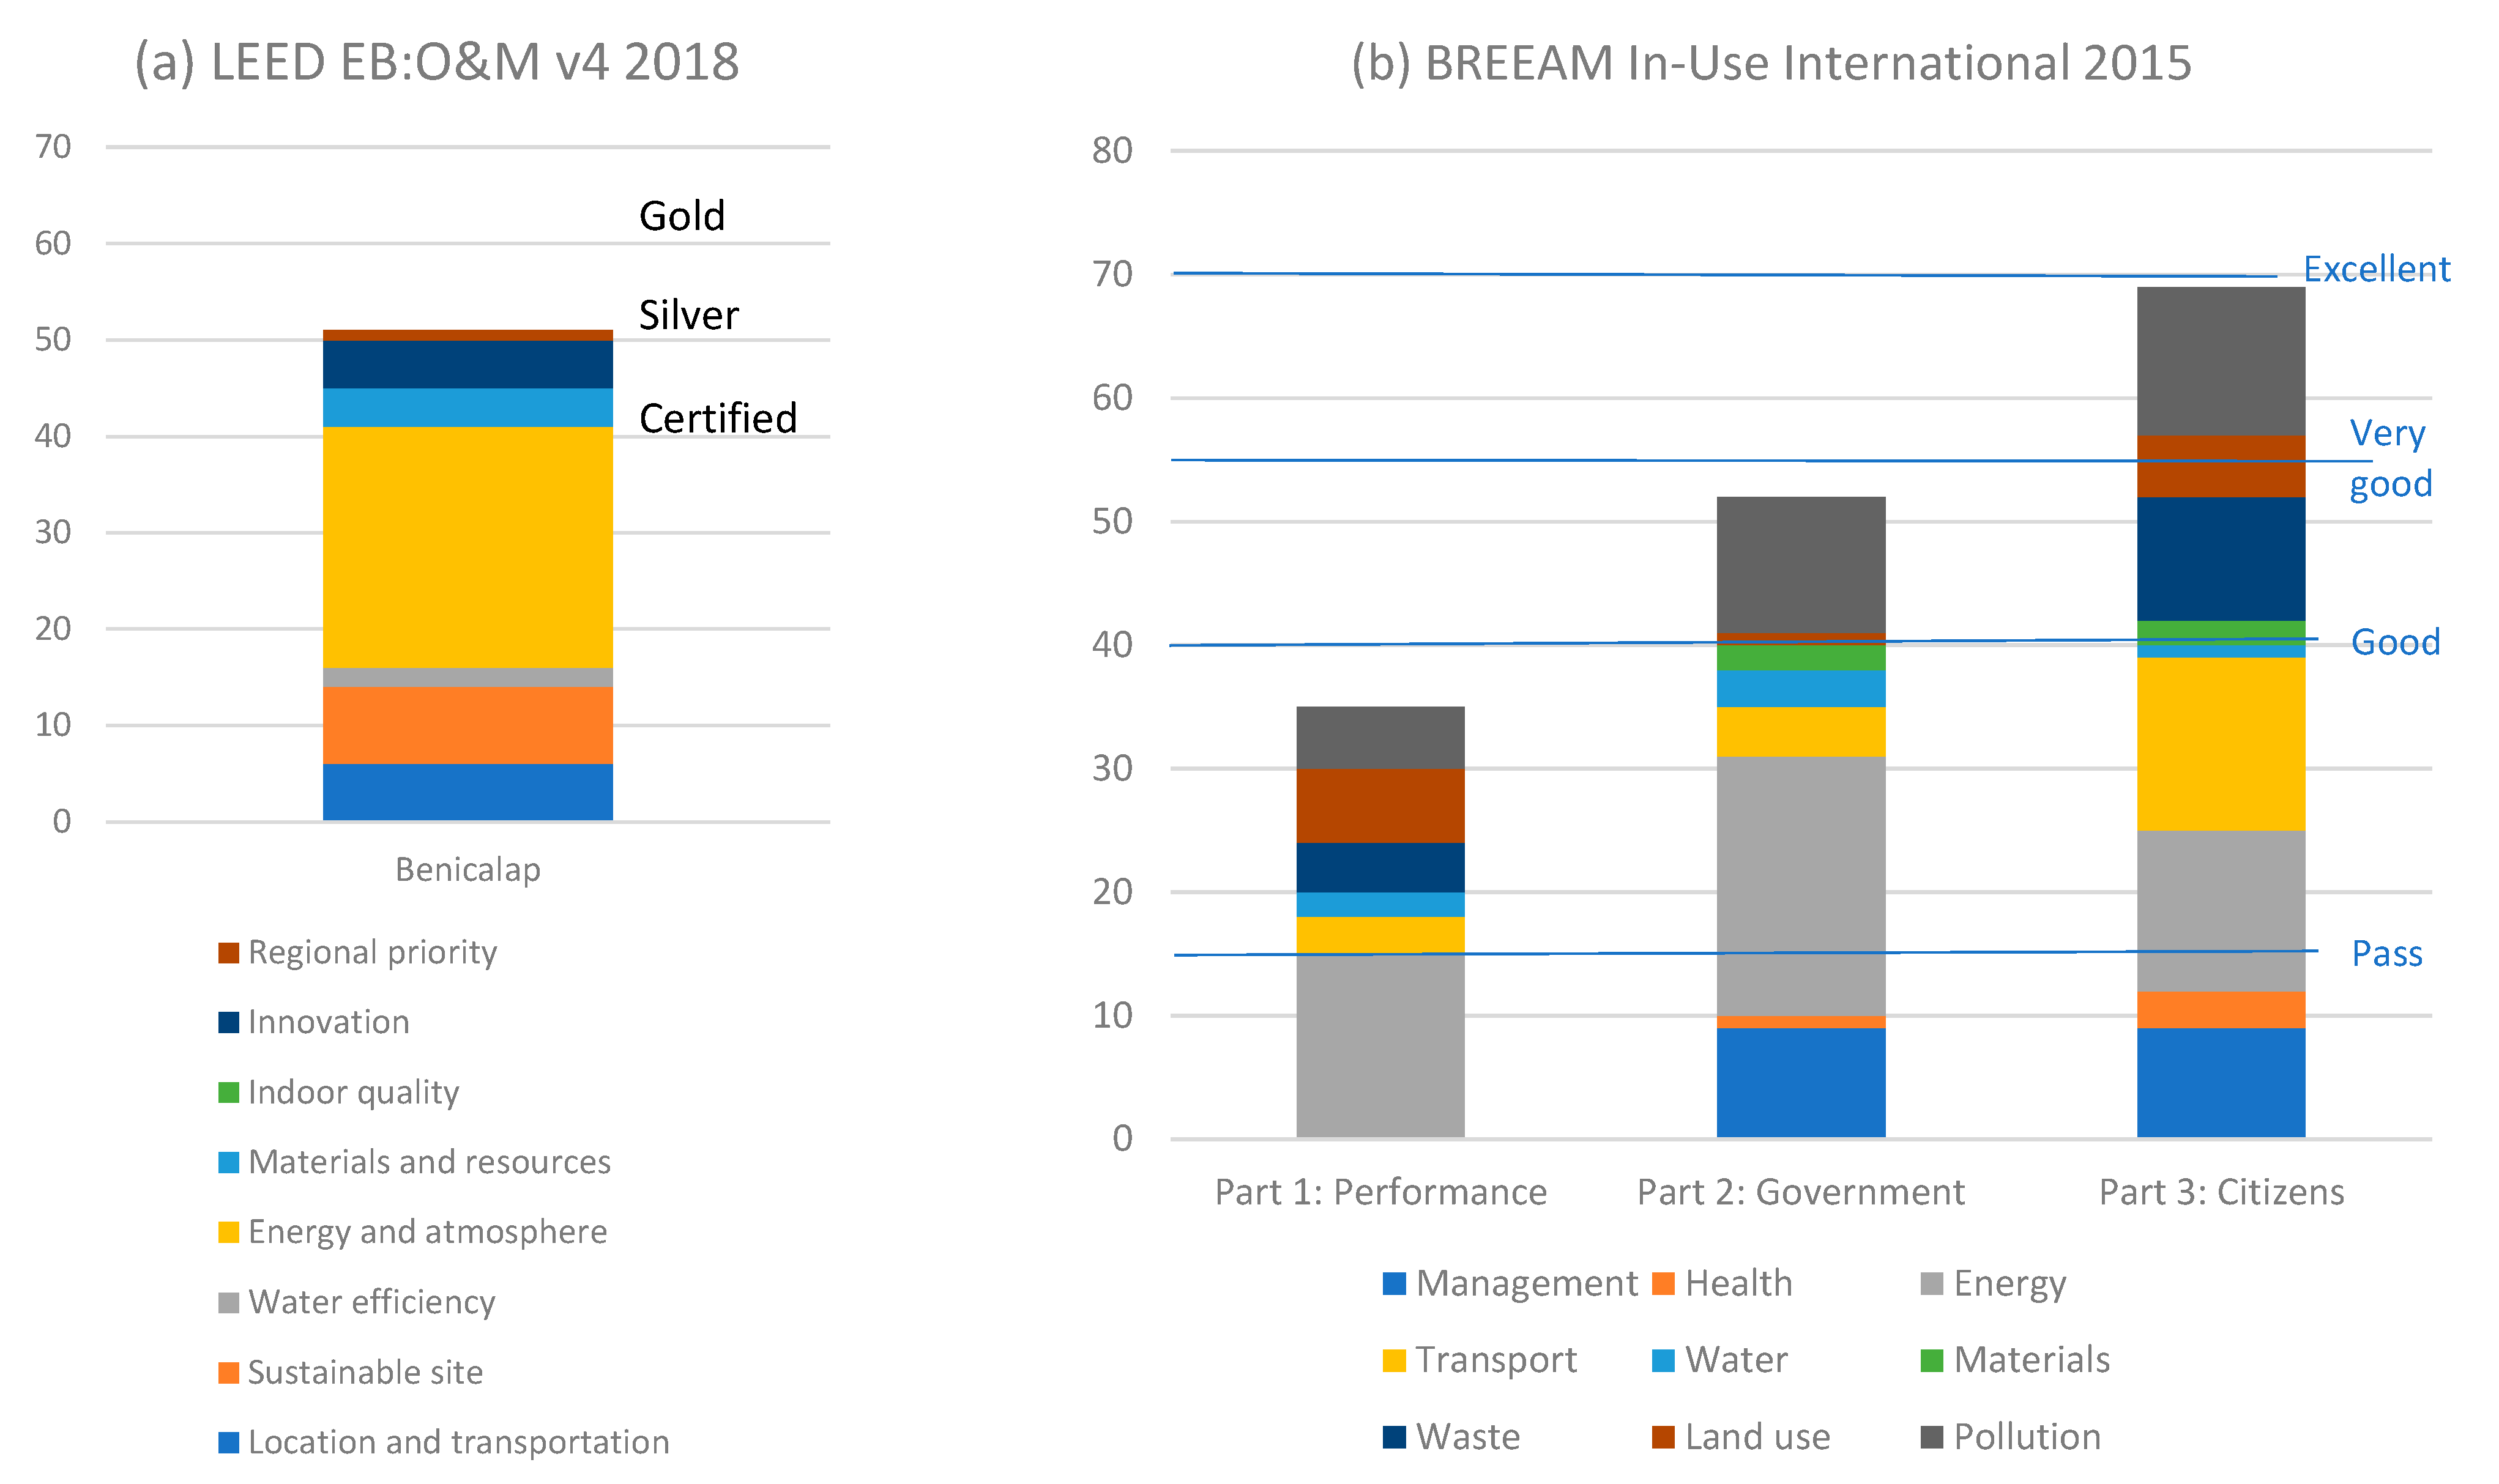
After developing the LCA evaluation, the detailed report provides all necessary input for the ISO 14040:2006 certification. These results are also compared with the input required for the LEED EB:O&M v4 2018 certification standard and BREEAM In-Use International 2015 certification.
The ISO 14,040 standard is based on the technical verification of the given certified results. As such, any recommendations or alternate possibilities are not considered for the comparison. The process then performs an evaluation of the indicators that can be certified through ISO 14040:2006 and incorporates their value into the corresponding category in the LEED and BREEAM certification schemes.
5. Discussion
The methodology presented in this paper has demonstrated a resource-efficient procedure for developing an accurate digital twin of a neighbourhood for evaluating its LCA measured through the carbon footprint. Although the database with all the detail of building solutions matched to building typologies and subsystems requires prior detailed knowledge on materials and techniques per country and period, the work can be matched to commercial budgeting tools.
Although certification is not the final aim, the actual processes fulfilled have several advantages for the cities. The certification is a warranty that the results obtained are a comparative benchmark among neighbourhoods in the same city, and with other cities. When applying the digital model to a neighbourhood it is possible to simulate the performance after applying a given sustainability policy.
Another relevant limitation is the lack of a specific energy simulation module considering the material properties of proposed building refurbishments.
Alternative applications of the always growing data repositories can expand the use of the digital data model to more sustainability dimensions, once the relevant key performance indicators have been checked and validated.
6. Conclusions
Once the results obtained for Benicalap in Valencia are expanded to alternative neighbourhoods in other cities, in as many continents as possible, the procedure will be fine-tuned and validated for its use as a reference.
Simulation techniques of energy use not only for climate control but for other private and industrial applications are much needed in order to obtain more accurate results.
Statistical approaches using big-data monitoring results will definitely allow a smaller dependence on unevaluated variables.
For cities (and companies), developing a digital model for their neighbourhoods (or buildings) to measure the LCA of the desired objective is a very efficient way to start sustainability assessment. There might be also other marketing objectives linked to certification. Although the certification obviously adds an external verification (which adds a marketing dimension) it may not be reasonable to target many standards simultaneously to address a wider market.
The approach based on cadastral information allows the inclusion of future BIM projects which would facilitate the development of a complete and accurate digital model incorporating the history of the building and its maintenance. However, this future evolution will take very long to be considered at the neighbourhood level. Therefore, a refined evolution of the proposed methodology would allow a simple and solidly-based decision making support for sustainable urban development.
Obviously, the main indicator of performance is ISO 14040:2006 and should be the first objective. Having attained a fair control of the basic processes for sustainability assessment, it might be relevant to cover more of the topics related to a LEED or BREEAM assessment. The expanded approach would be easily attainable and, when the dimensions tested for performance justify the additional work, the process could be self-guided.
Author Contributions
J.O.-M. prepared the research background and analysed the experimental results. M.I.-L. developed the methodological approach and corresponding experimental work, and R.C.-M. post-processed the information obtained to facilitate its analysis. All authors have read and agreed to the published version of the manuscript.
Funding
This research was co-funded by the European Commission through the H2020 project “Green Cities for Climate and Water Resilience, Sustainable Economic Growth, Healthy Citizens and Environments (GROW GREEN)” Grant Agreement: 730283.
Institutional Review Board Statement
Not applicable.
Informed Consent Statement
Not applicable.
Data Availability Statement
The data presented in this study are available on request from the corresponding author. The data are not publicly available at this moment since it will be published on a doctoral thesis soon.
Conflicts of Interest
The authors declare no conflict of interest.
References
- Peng, Y.; Lai, Y.; Li, X.; Zhang, X. An alternative model for measuring the sustainability of urban regeneration: The way forward. J. Clean. Prod. 2015, 109, 76–83. [Google Scholar] [CrossRef]
- Salat, S. Cities and Forms, on Sustainable Urbanism; CSTB Urban Morphology Laboratory, Hermann Editeurs: Paris, France, 2011; Chapter 3; pp. 241–256. [Google Scholar]
- Mavi, R.K.; Gengatharen, D.; Mavi, N.K.; Hughes, R.; Campbell, A.; Yates, R. Sustainability in Construction Projects: A Systematic Literature Review. Sustainability 2021, 13, 1932. [Google Scholar] [CrossRef]
- Kim, R.; Lim, M.-K.; Roh, S.; Park, W.-J. Analysis of the Characteristics of Environmental Impacts According to the Cut-Off Criteria Applicable to the Streamlined Life Cycle Assessment (S-LCA) of Apartment Buildings in South Korea. Sustainability 2021, 13, 2898. [Google Scholar] [CrossRef]
- Sharifi, A.; Murayama, A. A critical review of seven selected neighborhood sustainability assessment tools. Environ. Impact Assess. Rev. 2013, 38, 73–87. [Google Scholar] [CrossRef]
- Bragança, L.; Mateus, R.; Koukkari, H. Building Sustainability Assessment. Sustainability 2010, 2, 2010–2023. [Google Scholar] [CrossRef] [Green Version]
- Bruce-Hyrkäs, T.; Pasanen, P.; Castro, R. Overview of Whole Building Life-Cycle Assessment for Green Building Certification and Ecodesign through Industry Surveys and Interviews. Procedia CIRP 2018, 69, 178–183. [Google Scholar] [CrossRef]
- Li, Y.; Chen, X.; Wang, X.; Xu, Y.; Chen, P.-H. A review of studies on green building assessment methods by comparative analysis. Energy Build. 2017, 146, 152–159. [Google Scholar] [CrossRef]
- Forsberg, A.; von Malmborg, F. Tools for environmental assessment of the built environment. Build. Environ. 2004, 39, 223–228. [Google Scholar] [CrossRef]
- Obrecht, T.P.; Röck, M.; Hoxha, E.; Passer, A. BIM and LCA Integration: A Systematic Literature Review. Sustainability 2020, 12, 5534. [Google Scholar] [CrossRef]
- TABULA. Webtool on EU Building Typologies. Available online: https://episcope.eu/building-typology/tabula-webtool/ (accessed on 4 April 2021).
- Zangheri, P.; Armani, R.; Pietrobon, M.; Pagliano, L. Identification of cost-optimal and NZEB refurbishment levels for representative climates and building typologies across Europe. Energy Effic. 2018, 11, 337–369. [Google Scholar] [CrossRef] [Green Version]
- EU Building Stock Observatory Datasets. Available online: https://data.europa.eu/euodp/en/data/dataset/building-stock-observatory (accessed on 4 April 2021).
- Li, J.; Wang, Y.; Ni, Z.; Chen, S.; Xia, B. An integrated strategy to improve the microclimate regulation of green-blue-grey infrastructures in specific urban forms. J. Clean. Prod. 2020, 271, 122555. [Google Scholar] [CrossRef]
- Guinee, J.B. Handbook on Life Cycle Assessment Operational Guide to the ISO Standards; Kluwer Academic Publishers: Amsterdam, The Netherlands, 2002. [Google Scholar]
- Wang, H.; Chen, W. Gaps between pre-2020 climate policies with NDC goals and long-term mitigation targets: Analyses on major regions. Energy Procedia 2019, 158, 3664–3669. [Google Scholar] [CrossRef]
- Piasecki, M. Practical Implementation of the Indoor Environmental Quality Model for the Assessment of Nearly Zero Energy Single-Family Building. Buildings 2019, 9, 214. [Google Scholar] [CrossRef] [Green Version]
- Dogruyol, K.; Aziz, Z.; Arayici, Y. Eye of Sustainable Planning: A Conceptual Heritage-Led Urban Regeneration Planning Framework. Sustainability 2018, 10, 1343. [Google Scholar] [CrossRef] [Green Version]
- Calzada-Infante, L.; López-Narbona, A.M.; Núñez-Elvira, A.; Orozco-Messana, J. Assessing the Efficiency of Sustainable Cities Using an Empirical Approach. Sustainability 2020, 12, 2618. [Google Scholar] [CrossRef] [Green Version]
- Brem, A.; Óg Cusack, D.; Adrita, M.M.; O’Sullivan, D.T.J.; Bruton, K. How do companies certified to ISO 50001 and ISO 14001 perform in LEED and BREEAM assessments? Energy Effic. 2020, 13, 751–766. [Google Scholar] [CrossRef]
- Google Earth. Available online: https://www.google.com/intl/es-419/earth/ (accessed on 5 April 2021).
- Street View. Available online: https://www.instantstreetview.com/ (accessed on 5 April 2021).
- Hammond, G.P.; Jones, I.C. Embodied energy and carbon in construction materials. Proc. Inst. Civ. Eng. Energy 2008, 161, 87–98. [Google Scholar] [CrossRef] [Green Version]
- IVE Construction Materials Database. Available online: https://www.five.es/tienda-ive/base-de-datos-de-construccion-2020/ (accessed on 5 April 2021).
- City Energy Analyst. Available online: https://cityenergyanalyst.com/ (accessed on 5 April 2021).
- Open Data Weather Sources for EnergyPlus. Available online: https://energyplus.net/weather/sources (accessed on 5 April 2021).
- World Weather Data from Meteomatics. Available online: https://www.meteomatics.com/en/ (accessed on 5 April 2021).
- Open Data Portal for Europe. Available online: https://www.europeandataportal.eu/en (accessed on 5 April 2021).
- World Council on City Data. Available online: https://www.dataforcities.org/ (accessed on 5 April 2021).
- Spanish Cadastral Info Repository. Available online: https://www.sedecatastro.gob.es/Accesos/SECAccDescargaDatos.aspx (accessed on 5 April 2021).
- Valencia City Open-Data Portal. Available online: https://www.valencia.es/dadesobertes/en/data/ (accessed on 5 April 2021).
- Cheela, V.; John, M.; Biswas, W.; Sarker, P. Combating Urban Heat Island Effect—A Review of Reflective Pavements and Tree Shading Strategies. Buildings 2021, 11, 93. [Google Scholar] [CrossRef]
- Siu, C.Y.; Liao, Z. Is building energy simulation based on TMY representative: A comparative simulation study on doe reference buildings in Toronto with typical year and historical year type weather files. Energy Build. 2020, 211, 109760. [Google Scholar] [CrossRef]
Figure 1.
Procedure followed for developing the Neighbourhood digital model.

Figure 2.
Benicalap GIS model.

Figure 3.
Benicalap building typologies.

Figure 4.
Benicalap building typologies distribution.

Figure 5.
Graphical presentation of the neighbourhood CO2 footprint per building.

Figure 6.
Evaluations for Benicalap neighbourhood from ISO 14040:2006 values under: (a) LEED EB:O&M v4 2018; and (b) BREEAM In-Use International 2015.
Figure 6.
Evaluations for Benicalap neighbourhood from ISO 14040:2006 values under: (a) LEED EB:O&M v4 2018; and (b) BREEAM In-Use International 2015.


Table 1.
Carbon footprints after LCA on Benicalap neighbourhood.
| Building Typology. (Year Interval) | CO2 Footprint (tnCO2/Year) | Measured CO2 Footprint (tnCO2/Year) | Number of Buildings | Error (%) | |
|---|---|---|---|---|---|
| Embedded | Usage | ||||
| <1900 | 0.09 | 1.82 | 1.45 | 34 | 26 |
| 1901–1936 | 0.42 | 4.72 | 4.97 | 139 | 5 |
| 1937–1959 | 0.63 | 6.37 | 7.02 | 184 | 33 |
| 1960–1979 | 1.20 | 9.85 | 10.94 | 745 | 10 |
| 1980–2006 | 0.64 | 2.77 | 3.06 | 370 | 9 |
| 2007–2021 | 0.82 | 2.07 | 2.82 | 84 | 27 |
| TOTAL | 3.80 | 27.60 | 30.26 | 1556 | 9 |
Publisher’s Note: MDPI stays neutral with regard to jurisdictional claims in published maps and institutional affiliations. |
© 2021 by the authors. Licensee MDPI, Basel, Switzerland. This article is an open access article distributed under the terms and conditions of the Creative Commons Attribution (CC BY) license (https://creativecommons.org/licenses/by/4.0/).
Share and Cite
MDPI and ACS Style
Orozco-Messana, J.; Iborra-Lucas, M.; Calabuig-Moreno, R. Neighbourhood Modelling for Urban Sustainability Assessment. Sustainability 2021, 13, 4654. https://0-doi-org.brum.beds.ac.uk/10.3390/su13094654
AMA Style
Orozco-Messana J, Iborra-Lucas M, Calabuig-Moreno R. Neighbourhood Modelling for Urban Sustainability Assessment. Sustainability. 2021; 13(9):4654. https://0-doi-org.brum.beds.ac.uk/10.3390/su13094654
Chicago/Turabian StyleOrozco-Messana, Javier, Milagro Iborra-Lucas, and Raimon Calabuig-Moreno. 2021. "Neighbourhood Modelling for Urban Sustainability Assessment" Sustainability 13, no. 9: 4654. https://0-doi-org.brum.beds.ac.uk/10.3390/su13094654
Note that from the first issue of 2016, this journal uses article numbers instead of page numbers. See further details here.