
Crop Yield and Physicochemical Properties of Wheat Grains as Affected by Tillage Systems


1
Department of Biosystems Engineering, Lorestan University, KhorramAbad 6815144316, Iran
2
Department of Seed and Plant Improvement Research, Lorestan Jihad Agricultural Organization, KhorramAbad 6816914116, Iran
*
Author to whom correspondence should be addressed.
Sustainability 2021, 13(9), 4781; https://0-doi-org.brum.beds.ac.uk/10.3390/su13094781
Submission received: 19 March 2021
/
Revised: 21 April 2021
/
Accepted: 21 April 2021
/
Published: 24 April 2021
Abstract
:In this study, we aimed to determine the effects of tillage systems (TS) on wheat grain yield, yield components, and physicochemical properties under rain-fed conditions over 2 years (2018–2019) in the Kuhdasht region in southwestern Iran. The tillage treatments were a combination of conventional tillage (CT), reduced tillage (RT), and no tillage (NT) systems based on randomized complete blocks with three replications. Wheat grain yields and yield components, physical properties (geometrical dimensions, sphericity, thousand-grain mass (TGM), water absorption (WA), volume (V), and density), chemical composition (protein content (PC), water content (WC), fiber content (FC), ash content (AC)), surface color parameters (L*, a*, and b*), and correlations among measured parameters were assessed. The results showed that wheat grain yield and yield components were significantly affected by TS (p < 0.01). The wheat grain yield was higher under CT (2.72 t ha−1), with a significant difference between RT (1.76 t ha−1) and NT (1.20 t ha−1). The highest TGM (49.19 g) was achieved under CT, followed by RT (43.41 g), with the lowest (39.17 g) in the NT system. TS had significant effects on certain physical properties of wheat grains (p < 0.01). Wheat grain, size, shape, and mass values were higher under CT than RT and NT systems in all experimental years. CT resulted in the highest WA, while the lowest resulted from NT. TS had no significant influence on the density of the grains. TS had significant effects on PC, AC, and WC values of grains at the 1% probability level and on FC at the 5% level. Higher PC values were obtained under the CT system (13.07%, against 11.90% and 10.67% for RT and NT, respectively) in all growing seasons. Additionally, the AC was significantly lower in the sample grains under RT (2.38%) and NT (2.43%) than in those from CT (2.56). The FC was higher under NT (15.73%) than RT (13.73) and CT (13.71%). The grain WC was significantly higher under NT (7.57%) than RT (6.79%) and CT (7.0%). The TS significantly affected the surface color parameters of grains, while the L* (lightness) and b* (yellowness) values of grains under CT were higher than in RT and NT.
1. Introduction
Wheat is one of the most important cereal products, which has a significant effect on human nutrition. Wheat has been cultivated for more than 10,000 years as a primary human food and it has had a significant impact on human social, demographic, and cultural development [1]. In addition to rice, bread made from wheat grains is a leading human food. As with other grains, wheat grains are a major source of energy, carbohydrates (such as starch), protein, minerals, vitamins, and fiber. The protein content of wheat grains varies between 8 and 20%, depending on the type and class [1]. Wheat grain quality parameters heavily depend on growth conditions, soil fertility, fertilizer application, water ability, genotype, grain transport, and storage situations [2,3,4,5]. Some of the essential quality factors of grains such as wheat include the grain structure, grain cover, resistance to breakage (mechanical damage), and grain composition, which are affected by the rates of inorganic fertilizers [6,7]. Additionally, the yield and quality parameters of grains are affected by agronomic practices, such as tillage systems [8,9,10,11,12,13,14]. Grain size is one of the most important yield components for cereals such as wheat. The grain protein content is the main factor in terms of wheat quality [15]. Some studies have shown little correlation between wheat grain protein and soil tillage systems [16,17,18], while others have found positive effects and reported that CT systems tend to produce higher protein contents than other systems [19,20,21,22].
Color is an important factor in the food industry. The surface color of wheat grain is an important attribute in the sorting and marketing of the grains [23,24]. The color of wheat grains is the key to the milling and baking industry, which determines the color of the whole wheat products [24]. In the literature, several studies on the color measurement of wheat grains are available, in which the researchers reported that the color and appearance of the final product made from wheat grains, such as bread and tortillas, are influenced by the color of the wheat grains [25,26,27].
Soil tillage is one of the most important processes in the production of agricultural products. More than half of the total energy required for cereal production is consumed during soil tillage [15]. On the other hand, soil tillage is also an important factor affecting soil structure properties and crop yield [28,29,30]. Wheat production in Iran is based on the CT system, which includes the use of a moldboard plow and seed bed peroration using a disk harrow. The CT system is characterized by high energy consumption and has the most destructive effects on soil properties [31]; therefore, there is an ongoing effort to replace the CT system with conservation systems such as RT or NT systems. However, this effort may be limited by certain problems such as environmental conditions and economic factors [32,33]. As stated by many researchers, in the conventional tillage and conservation tillage systems, the yield and quality parameters of crops are functions of the interactions of many parameters, which are difficult to predict [34,35,36]. Generally, from the review of the results of research studies conducted in this paper, it can be stated that when reducing the levels of tillage from the conventional system to conservation tillage systems (RT or NT systems) in cereals, there is a decrease in crop yield [37]. The soil tillage system also affects the quality parameters of grains, such as the physical dimensions and chemical composition [34,38,39]. Lopez-Bellodo et al. [19] stated that higher protein content for wheat grains was obtained for the CT system than in the NT system. Wozniak et al. [40] reported that the herbicide tillage system (use of Roundup 360 SL herbicide to control weeds) reduced the volume weight and increased ash content in the wheat grains as compared to CT and RT systems. In addition to the cases mentioned above, the tillage system influences weed infestations. Many investigations show that the NT system increased the weed infestation of crops [41].
The effects of several tillage systems on the yield, yield components, and physicochemical attributes of wheat grains are required to achieve more stable wheat production. According to the needs mentioned above, the purpose of this study was to investigate the effects of tillage systems, namely conventional tillage (CT), reduced tillage (RT), and no tillage (NT) systems, on wheat grain yield, yield components, physical properties (grains geometrical dimensions, arithmetic mean diameter, geometric mean diameter, equivalent mean diameter, sphericity, 1000-grain mass, volume, water absorption capacity, and density), chemical composition (protein content, fiber content, ash content, and water content), and surface color parameters (whiteness, redness, and yellowness) of wheat grains over 2 experiment years.
2. Materials and Methods
2.1. Site Description
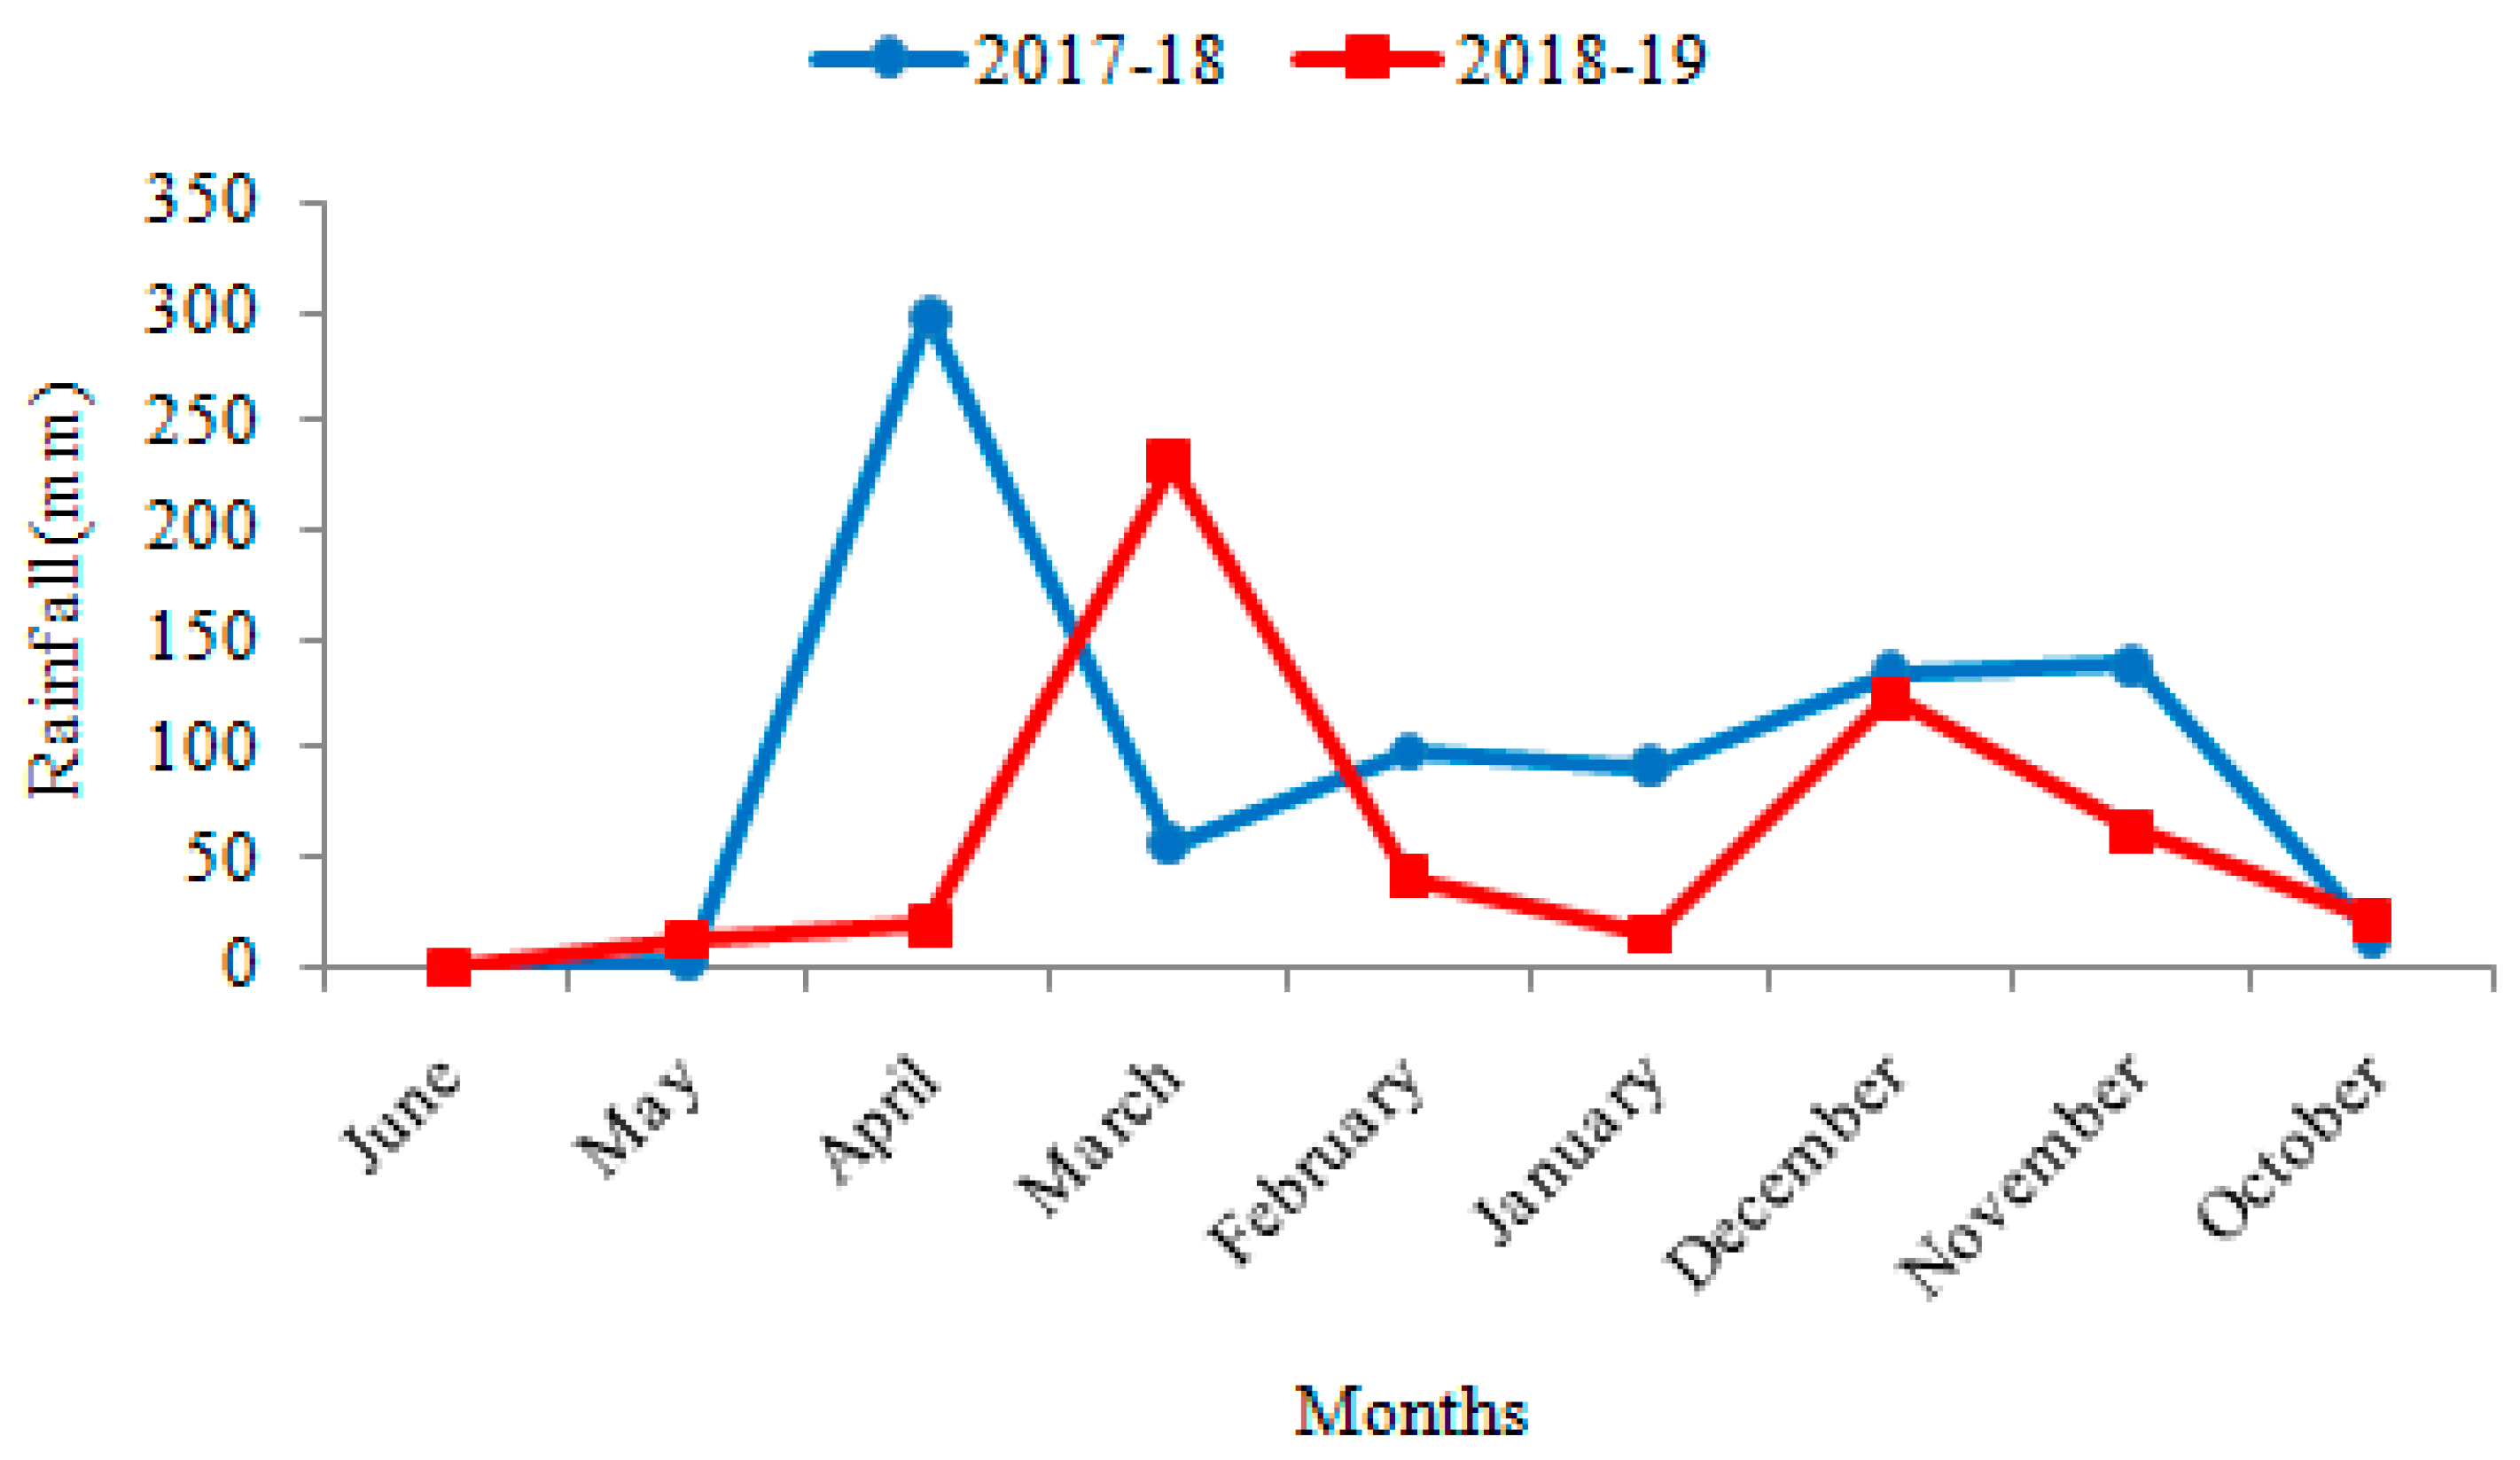
Field experiments were conducted during 2017–2018 and 2018–2019 growing seasons in the Kohdasht region in the southwest of Iran (33°34′, 47°36′ E), at an elevation of 1195 m above sea level, with a mean annual precipitin of 450 mm, average yearly temperature of 16 °C, and with a semi-arid climate. The monthly rainfall during the experimental years is shown in Figure 1. The sum of annual rainfall during the growing season in 2017–2018 was 835 mm, which was much higher (about 2 times) than the long-term rainfall (450 mm). Additionally, the sum of annual rainfall during the 2018–2019 growing season was 526 mm, which was more than the long-term rainfall data (450 mm).
2.2. Experimental Procedure
The cropping system used in this experiment was dry land continuous cultivation in three tillage systems. Trials were established using a randomized complete block design over 2 years, with three tillage treatments and three replications. The tillage treatments were a combination of three systems: (1) conventional tillage (CT), (2) reduced tillage (RT), and (3) no-tillage (NT) in the autumn. Conventional tillage (CT) included using a moldboard plow (depth close to 25 cm) + disk harrow (depth close to 10 cm) + seed drilling using a conventional seed driller. Reduced tillage (RT) included using field cultivation (depth close to 10 cm) after harvest of the previous crop (chickpea) + seed drilling using a direct drilling machine. No-tillage (NT) included using a direct drilling machine after harvest of the previous crop (chickpea), without any prior tillage.
Wheat seeds of Aftab, a popular winter bread wheat variety in Iran, which is suitable for dry land cultivation, were chosen for use in this research and planted at a rate of 160 kg ha−1 (the rate for rain-fed conditions). The row spacing (11 rows in each plot) was 0.2 m. Individual tillage plots were 15 m in length and 30 m in width (450 m2 plot size), which were divided into three sub-blocks. The wheat cultivar and planting dates were chosen based on the best recommendations for farmers in the area of the study. Crop management exercises (except tillage methods) were diverse among locations depending on the requirements based on soil test results. Fertilizers were applied at the planting date (100 kg ha−1 P2O5 and 75 kg ha−1 N). Herbicides were used for weed control by application of 20 g ha−1 of glyphosate and 0.8 L ha−1 of clodinafop–propargyl in spring.
2.3. Soil Sampling
Soil samples from four locations were collected from each main plot at 0–30 cm soil depth after harvest of the previous crop (chickpea) to determine the properties of the studied field soil [42]. Soil bulk density was determined by taking soil samples at 0–10 and 11–20 cm soil depths using a standard core sampler (4 cm long and 8 cm in diameter) and oven-dried at 105 °C for 48 h, then the bulk density was calculated by dividing the sample dry weight to the sample’s total volume [43]. Soil-available P was determined by extracting samples with 0.5 mol L−1 NaHCO3 and by determining P calorimetrically [44]. Soil-available K was measured using the 1 mol L−1 ammonium acetate extraction–flame photometry method [45]. Table 1 shows the properties of the studied field soil.
2.4. Crop Sampling
After physiological maturity, all plants in the central area of plots were cut above soil using a hand sickle. The edges (0.5 m) of the plots were cut and discarded before harvest. The plant samples were air-dried, threshed, and cleaned in an air screen cleaner to obtain grain yield and yield component values. The grain yield per hectare, number of plants per unit area (m2), plant height, spike length, number of grains per spike, spike mass, and thousand-grain mass were measured and examined. The number of plants per unit area of plots was determined using a wooden frame with 50 × 350 cm over three replications. Plant height and spike length values were measured using a ruler. The spike mass was measured using a digital scale with an accuracy of 0.01 g. The thousand-grain mass (TGM) of each grain sample treatment was measured by counting 1000 grains and weighing them in an electronic balance with a precision of 0.001 g.
The quality properties of the grains are affected by the moisture content [46]. Harvested grain samples were stored for six months (at 4 °C and a humidity of about 60%) to standard and equalize their moisture content and determine the effects of the tillage system on the water content (WC) (stored moisture for six months) of grains [47,48], then their quality properties were measured. To investigate the effects of the year of study and tillage systems on the physical properties of wheat grains, including grain size, 100 grains randomly selected from each sample and their three linear dimensions (namely length (L), width (W), and thickness (T)) were measured using a digital micrometer over three replications, with an accuracy of 0.01 mm. The arithmetic mean diameter (Da), geometric mean diameter (Dg), equivalent mean diameter (DP), and sphericity (φ), respectively, of the grain samples were computed using the following relationships [49]:
To measure the density of tested samples, firstly 100 grains of each treatment were weighed, then their volume (V) was measured using the liquid displacement method (toluene). The density of the grains was computed by dividing the mass of the sample by the actual volume. To measure the water absorption (WA) capacity of grain samples, 50 whole grains of each sample were weighed and soaked in 100 mL of distilled water in a cylindrical container covered with foil, which were left at room temperature (22 °C) for 24 h. The grains were then dried using absorbent paper and weighed. The water absorption capacity of each sample was computed as (weight after soaking − weight before soaking)/50.
The chemical compositions of whole wheat grains, including the protein content (PC), fiber content (FC) (natural detergent fiber (NDF)), ash content (AC) and water content (WC) (stored moisture for six months), were computed using near-infrared reflectance (NIR) technique using a Perten DA 7250 NIR analyzer instrument (Perten-Instruments, Ab, Huddinge, Sweden) [5].
For surface color parameter measurements, glass dishes containing wheat grain samples were placed under 4 LED lamps (12 W, 230 V, AC, and 50 Hz). The images of whole grain surfaces were captured using a 24.5 megapixel digital color camera (Nikon digital SLR camera D53000). The camera was positioned 20 cm vertically above the grain sample surface before capturing pictures with no flash or zoom. The color properties of captured images were analyzed using Image J software version 1.32 g. Finally, for quantization of the grain surface color, L*, a*, and b* coordinates of the CIE color scale were calculated from RGB values from digital images of the grains using a ColorMine color converter (http://colormine.org, (accessed on 20 December 2020)
In the color space of the CIE L*a*b* scale, L* values indicate lightness, with a score of 100 being white and 0 being black (dark). The values of a* indicate red to green colors, for which positive values of a* demonstrate redness and negative values demonstrate greenness. The b* values illustrate yellow-blue colors, with positive values representing yellowness and negative values representing blueness [50,51,52,53,54].
2.5. Data Analysis
Analysis of variance (ANOVA) was performed to determine the effects of different treatments (year of study and tillage system on wheat grain yield and properties. All statistical analyses were carried out using SPSS software version 19 (SPSS Institute Inc., Chicago, IL, USA). The levels of significance were shown as * p < 0.05 and ** p < 0.01 using Duncan’s multiple range tests.
3. Results and Discussions
3.1. Wheat Grain Yield and Yield Components
Wheat grain yield and yield components were significantly affected by tillage systems (p < 0.01). There were no significant effects for the year of research or the interaction between the year and tillage system on the wheat grain yield or yield components (p > 0.05) (Table 2). This may be due to the similar average rainfall observed in both experimental years, which exceeded the long-term rainfall data (450 mm) (Figure 1).
Table 2 shows the results of the analysis of variance (F-Values) and the comparison of means for the wheat grain yield and yield components in different tillage systems. Conservation tillage systems (especially the NT system) were shown to reduce the wheat grain yield and yield components (Table 2). The results of many studies have demonstrated that better wheat grain yield and quality parameters have been achieved in CT system in moderately humid soils, in NT system in dry soils, or in the years with low rainfall [19,21]. The wheat grain yield was higher under CT with a significant difference between RT and NT (Table 2). The poor grain yield under NT may be related to the higher soil bulk density and lower soil moisture in root zones under NT [55]. It seems that the reasons for the decrease in wheat grain yield due to the decrease in tillage operations are the decrease in the number of plants per m2, decrease in the number of grains per spike, and also the increase in weeds. Similar results were reported for the reduction of wheat grain yield due to the reduction of tillage operations [35]. In contrast, some researchers [56,57,58] have reported increases in wheat grain yield under the NT system.
With the reduction of tillage operations, the number of plants per m2 decreased. NT produced the minimum number of plants per m2, while the maximum number of plants per m2 was observed under CT conditions and the intermediate number was observed under RT (Table 2). Wheat plant height and spike length values were significantly greater under CT than RT or NT. The CT system produced the maximum spike mass, while the minimum spike mass observed under NT and the intermediate amount was observed under RT. The number of grains per spike also decreased with decreasing tillage levels. The highest number of grains per spike was related to the conventional tillage system, with no significant difference with RT, while the lowest number was related to NT. Zamani et al. [59] reported a higher number of grains per spike for wheat grain under the CT system.
Wheat thousand-grain mass (TGM) was significantly influenced by the tillage system (F = 503.65). The sowing of wheat seeds in the CT and RT systems produced grains with higher mass values than wheat grown in the NT system. Wheat thousand-grain mass values reduced by about 20% as the level of tillage reduced from CT to the NT system. The highest mean thousand-grain mass value was achieved in the CT system, while the value was lower in the RT and the lowest in the NT system (Table 2). The lower TGM values under RT and NT systems may have been related to soil surface compaction, less rainwater penetration into the soil, and water stress at the grain filling stage, as both treatments received lower moisture than in CT. Similar results have been reported regarding reduced TGM values with decreasing tillage level by Wozniak et al. [40] and Wozniak [37] for wheat, by Wozniak and Soroka [35] for triticale, and by Wozniak and Gaweda [33] for pea plants. Wozniak et al. [40] reported a significant difference of TGM for wheat grains in tillage treatments with mean values of 42.3 g, 41.5 g, and 40.4 g for CT, RT, and NT systems, respectively. Tabatabaeefar et al. [60] reported TGM mean values of 38.81 g for wheat grains under the CT system and 38.2 g under NT treatments.
3.2. Wheat Grain Physical Properties
The results of the study illustrated that the physical properties of wheat grains hinged on the tillage system. The year of research and the interaction between the year and tillage system had no significant effect on the wheat grains’ physical properties (p > 0.05). This may be due to the similarly high annual rainfall levels in both experimental years, which were greater than the long-term rainfall data (450 mm) (Figure 1).
Table 3 shows the results of the analysis of variance (F-Values) and mean comparison (average for 2 experimental years) for the physical properties of wheat grains in different tillage systems. The tillage systems appeared to have significant effects (p < 0.01) on all physical properties of wheat grains except grain density. Conservation tillage systems (especially the NT system) were shown to reduce the physical properties of wheat grains (Table 3).
Wheat grains dimensions include length (L), width (W), thickness (T) and following them arithmetic mean diameter (Da), geometric mean diameter (Dg), and equivalent mean diameter (DP) of the grains were significantly affected by tillage system (p < 0.01) (Table 2). Wheat grains in the CT system had the highest L value, while grains in the NT had the lowest. The maximum grain width was related to the RT system, while the lowest value was for the NT system. The highest and lowest grain thickness (T) values were 2.90 and 2.63 mm, which were obtained in the RT and NT systems, respectively. Wheat grains in the CT system had the lowest arithmetic mean diameter (Da) mean value, while grains in the NT system had the highest. The geometric mean (Dg) of grains was lower with no tillage than with reduced and conventional tillage treatments. Wheat grains in the RT system had the highest equivalent mean diameter (DP) value and grains in the NT system had the lowest. Additionally, the maximum equivalent mean diameter (DP) of the grains was related to the RT system and the lowest value was for the NT. Wheat grain sphericity (φ) was significantly affected by the tillage system (p < 0.01) (Table 3). Wheat grains in the RT system had the highest sphericity value (0.60%) and grains in the CT and NT systems had the lowest values (0.58%). According to the above results, which are shown in Table 3, almost all of the maximum values for the physical dimensions of wheat grains were for the CT and RT systems and the lowest values were for the NT, showing that the RT system provides better results in terms of impacts on the physical dimensions of wheat compared to other systems. The results are exciting, however unfortunately no research report on the effects of tillage systems on the physical dimensions of wheat grain can be found in the literature to compare with the results obtained in this research. Taner et al. [15] reported the highest particle size index value for wheat grains with the RT system and the lowest with the NT system. Javadi et al. [61] recommended RT for wheat production in Iran.
Wheat grain volume (V) was significantly affected by the tillage system (p < 0.01) (Table 3). Wheat grains in the CT system had the highest volume and grains in the NT system had the lowest. Additionally, with the reduction of the tillage level from CT to the NT system, the water absorption capacity of wheat grains was decreased by about 23% (from 0.023 g to 0.018 g). This reduction in the water absorption capacity may be explained by the decrease of the grains’ geometric dimensions and volume by reducing the tillage level from the CT to the NT system. The density of wheat grains was approximately the same (about 1.3 g mm−3) for all tillage systems used in the present study.
3.3. Wheat Grain Chemical Compositions
Different chemical compositions of wheat grains were measured and compared in different tillage systems over 2 experimental years, including the protein content, fiber content, ash content, and water content. Table 4 shows the results of the analysis of variance (p-Values) and comparison means for the chemical compositions of wheat grains in different tillage systems. From the data in Table 4, it is evident that all of the measured chemical compositions of wheat grains were significantly influenced by the tillage systems.
As seen from the data in Table 4, the experiment year, tillage system, and the interaction between the year and tillage system had significant influences on the wheat grains’ protein content at the 1% probability level (p < 0.01). The F value of the analysis of variance demonstrated that wheat grains’ protein content was determined to a great extent by the tillage system (F = 259.267), more so than the experimental year (F = 64.067) (Table 4). The protein content was significantly higher in the sample grains harvested from the plots under the CT system than from RT and NT systems. According to the data in Table 4, the mean values for the protein content were 13.07, 11.90, and 10.67% for grains from the CT, RT, and NT systems, respectively, which were statically different from each other based on Duncan’s multiple range tests (Table 4). The protein content value for the CT system met the industry standard (PC ≥ 12.5%) [21]. These observations are in agreement with other studies that have reported significant decreases in protein content in grains under conservation tillage systems such as RT and NT [11,21,22,38,62,63]. Lopez-Bellido et al. [19,20] reported higher protein content under CT than NT. Additionally, Pringas and Koch [64] reported that the protein content and sedimentation value decreased significantly without tillage compared to the tillage-based system.
As seen from the data in Table 4, the year and interaction between the year and tillage system had no significant influence on the wheat grains’ fiber content (p > 0.05); however, the tillage system had a significant effect on this property of at the 5% probability level (p < 0.05) (Table 4). From the data in Table 4, it is evident that the fiber content of wheat grains increased significantly from 13.71 to 15.73% by decreasing the tillage level from the CT system to the NT system. The mean values of the fiber content of wheat grains were found to be 13.71, 13.73, and 15.73% for the CT, RT, and NT systems, respectively. Moreover, based on Duncan’s multiple range tests, the mean value of the fiber content of grains in the NT system was statically different (higher) from the fiber contents of grains in the CT and RT systems. Wozniak and Makarski [38] reported that tillage systems affected the chemical compositions of wheat grain, such as the fiber content. Additionally, Wozniak [11] reported that the fiber content of spring triticale grains was higher for NT than for RT and CT systems.
The effects of the experimental year, tillage system, and the interaction between the year and tillage system on the ash content of harvested wheat grans were significant at the 1% probability level (p < 0.01) (Table 4). The ash content of grains was significantly lower in the sample grains harvested from the plots under RT and NT systems than from the CT system. According to the data in Table 4, the mean values for the ash content were 2.56, 2.38, and 2.43% for grains in the CT, RT, and NT systems, respectively, while the ash contents of the grains in the RT and NT systems were statically different (lower) than that of the CT system based on Duncan’s multiply range tests (Table 4). A similar result was reported by Wozniak (2016), who reported that the ash content of spring triticale grains was higher for CT than for RT and NT systems.In contrast, Kraska [65] and Wozniak and Makarski [38] reported higher ash content in wheat grains cultivated in a plowless system rather than in the conventional system.
The effect of the tillage system on the water content (stored water in grains over six months) of wheat grains was significant at the 1% probability level (F = 43.86). However, the effects of the experimental year and the interaction between the year and tillage system on the water content of harvested wheat grins were not significant. The results of the mean comparison in Table 4 indicate that by reducing the level of soil tillage from CT to NT, the average values of the water content of grains significantly increase from 7.0% to 7.57%. The mean values of the water content of grains were 7.0, 6.79, and 7.57% for CT, RT, and NT tillage systems, respectively. Moreover, based on Duncan’s multiple range tests, the mean value of the water content of grains in the NT system was statically different (higher) than in the CT and RT systems. No statistical difference was found for the water content of grains in the CT and RT systems (Table 4). No reported research result was found in the published literature for the effects of tillage systems on the water content of wheat grains for comparison with the results of this research.
The protein and ash contents of grains and the interactions between the tillage systems and the years of study are shown in Table 5. The protein and ash contents of grains were higher in the CT and RT systems compared to the NT system in both experimental years (Table 5). Additionally, higher protein and ash contents were achieved in the first year (2018) of the study than in the second year (2019). This may be due to higher rainfall in the 2018 growing season.
3.4. Wheat Grain surface Color Properties
The results of the data analysis (ANOVA) indicated that the tillage system significantly influenced all of the surface color parameters of wheat grains, including L* (whiteness), a* (redness), and b* (yellowness), at the 1% portability level. The experimental year and the interaction between the year and tillage system had no significant influence on the wheat grain’s surface color parameters (p > 0.05) (Table 6). The impact of the tillage system on the b* (F = 825.48) color value of wheat grains was more than for the L* (F = 32.49) and a* (F = 25.30) parameters within the range of variables studied (Table 6).
From the mean comparison results for surface color parameters of wheat grains under the different tillage systems presented in Table 6, it is evident that the whiteness (L*) of the grains increased when increasing the level of tillage, thus changing the surface color of the grains toward a whiter (lighter) hue. These results show that the tillage system selection, which has considerable effects on the physicochemical properties of grains, also has significant effects on other grain’s quality properties, such as the surface color. As the level of tillage increased from the NT to CT system, the mean values of the L* (whiteness) in wheat grains increased significantly from 59.33 to 60.15. No study was found in the literature for comparison of the effects of tillage system selection on the color parameters of wheat grains in this study.
From the data in Table 6, it is evident that the mean a* (redness) values of wheat grains ranged from 4.62 (in CT system) to 5.12 (in NT system). The mean a* values of the tested grains for CT, RT, and NT systems were 4.62, 4.76 and 5.12, respectively, while the mean value of a* in the NT system was statically different (higher) than in CT and RT systems (Table 6). This result shows that as the level of tillage decreased from the CT to NT system, the redness color parameter of the wheat grain surfaces increased.
For the b* (yellowness) surface color scale of the wheat grains, the result showed that as the level of soil tillage decreased from the CT to NT system, the yellowness color parameter of the wheat grains decreased. From the data in Table 5, it is evident that the mean values of the b* ranged from 39.60 (in the NT system) to 44.65 (in the CT system). The mean values of the b* surface color scale of the tested grains were 44.65, 41.00, and 39.60 for CT, RT, and NT systems, respectively, which were statically different from each other based on Duncan’s multiple range tests (Table 6).
No studies in the published literature reported results for the relationships between wheat grain surface color parameters and tillage variants and their effects on the surface color parameters of wheat grain for comparison with the results obtained in this study; however, several researchers have reported the relationship between the color of wheat grains and other agronomic factors, such as the relationships between the pre-harvest sprouting and wheat grain color [66] and between the genotype–environment interaction effect for grain color in hard white spring wheat [67]. McCaig et al. [68] reported a significant wheat kernel color change associated with field weathering. Lukow et al. [69] reported a significant effect of the environment on the wheat grain color. Horvath and Veha [70] investigated the dependence of wheat grain color characteristics on the grain size. Tanska et al. [71] investigated wheat grain color in relation to the cultivation regime.
3.5. Correlation Matrix
The Pearson correlation coefficients between the quality parameters of the wheat grains under the different experimental conditions (two experimental years and three tillage systems) are shown in Table 7. From the data in Table 7, it is clear that wheat grain yield and yield components are significantly and positively correlated. Additionally, the grain yield and yield components of wheat have significant and positive correlations with all of the physical dimensions of wheat grains except sphericity and density. Wheat grain yield and yield components have significant and positive correlations with the protein content; however, they have significant and negative correlations with fiber and water contents. Grain yield and thousand-grain mass components have significant and positive correlations with the ash content; however, the correlations of other yield components with ash content were not significant. Wheat grain yield and yield components have significant and negative correlations with all of the grain surface color properties (Table 7). The physical dimensions of wheat grains except sphericity and density have significant and positive correlations together. Additionally, the physical dimensions of wheat grains have significant and positive correlations with the chemical composition, including protein and ash contents, but have significant and negative correlations with fiber and water contents. The wheat grain surface parameters, including whiteness (L*), redness (a*), and yellowness (b*), can be seen to have significant and negative correlations with the physical dimensions. Additionally, the surface color parameters of grains have significant and negative correlations with the chemical composition, including protein and ash contents; however, they have significant and positive correlations with fiber and water contents.
4. Conclusions
The results of this study demonstrated that the physicochemical properties of wheat grain depended on the tillage system. The no tillage (NT) system was shown to reduce the physicochemical properties of grains. Lower grain size and shape were shown with NT versus RT and CT systems. Additionally, lower grain protein and ash contents and higher fiber and water contents were obtained from the NT system. Grains from the CT system had higher whiteness and yellowness, while those from the NT system had higher red surface coloring. In conclusion, the RT system produced wheat grains with similar or slightly lower-quality properties to the CT system, so this system could be presented as an even-handed replacement for conventional tillage in areas with similar environmental conditions to the climate and site conditions in this study.
Author Contributions
M.Y. conducted the field experiments. F.S. collected and analyzed the crop data and wrote the manuscript. K.H. designed the research, financially supported the experiments, and collected and analyzed the soil data. All authors have read and agreed to the published version of the manuscript.
Funding
This research received no external funding.
Institutional Review Board Statement
Not applicable.
Informed Consent Statement
Not applicable.
Data Availability Statement
Not applicable.
Acknowledgments
The authors also thank the Department of Biosystems Engineering, Faculty of Agriculture, Lorestan University, for all support, including financial and academic support.
Conflicts of Interest
The authors declare no conflict of interest.
References
- Popovic, O. Protein Content and Gluten Quality of Norwegian Grown Wheat Influenced by Fertilization. Master’s Thesis, Norwegian University of Life Sciences, Ås, Norway, 2015. [Google Scholar]
- Uhlen, A.K.; Hafskjold, R.; Kalhovd, A.H.; Sahlström, S.; Longva, Å.; Magnus, E.M. Effects of cultivar and temperature during grain filling on wheat protein content, composition, and dough mixing properties. Cereal Chem. 1998, 75, 460–465. [Google Scholar] [CrossRef]
- Carson, G.R.; Edwards, N.M. Criteria of wheat and flour quality. In Wheat: Chemistry and Technology, 4th ed.; AACC International: St. Paul, MN, USA, 2009; pp. 97–118. [Google Scholar]
- Šíp, V.; Vavera, R.; Chrpová, J.; Kusá, H.; Růžek, P. Winter wheat yield and quality related to tillage practice, input level and environmental conditions. Soil Tillage Res. 2013, 1, 77–85. [Google Scholar] [CrossRef]
- Shahbazi, F.; Nematollahi, A. Influences of phosphorus and foliar iron fertilization rate on the quality parameters of whole wheat grain. Food Sci. Nutr. 2019, 7, 442–448. [Google Scholar] [CrossRef] [PubMed]
- Shahbazi, F.; Sharafi, R.; Moomevandi, S.J.; Daneshvar, M. Mechanical damage to wheat seeds as affected by phosphorus and iron fertilisation rate. Qual. Assur. Saf. Crops Foods 2014, 7, 385–391. [Google Scholar] [CrossRef]
- Shahbazi, F.; Sharafi, R.; Moomevandi, S.J.; Daneshvar, M. Influence of foliar iron fertilization rate on the breakage susceptibility of wheat seeds. J. Plant Nutr. 2015, 6, 2204–2216. [Google Scholar] [CrossRef]
- Peigné, J.; Messmer, M.; Aveline, A.; Berner, A.; Mäder, P.; Carcea, M.; Narducci, V.; Samson, M.F.; Thomsen, I.K.; Celette, F.; et al. Wheat yield and quality as influenced by reduced tillage in organic farming. Org. Agric. 2014, 4, 1–3. [Google Scholar] [CrossRef] [Green Version]
- Gursoy, S.; Sessiz, A.; Malhi, S.S. Short-term effects of tillage and residue management following cotton on grain yield and quality of wheat. Field Crops Res. 2010, 1, 260–268. [Google Scholar] [CrossRef]
- Lestingi, A.; Bovera, F.; De Giorgio, D.; Ventrella, D.; Tateo, A. Effects of tillage and nitrogen fertilisation on triticale grain yield, chemical composition and nutritive value. J. Sci. Food Agric. 2010, 90, 2440–2446. [Google Scholar] [CrossRef]
- Woźniak, A. Yield and chemical composition of spring triticale grain depending on cropping and tillage systems. Int. J. Plant Prod. 2016, 10, 45–52. [Google Scholar]
- Ruiz, M.; Zambrana, E.; Fite, R.; Sole, A.; Tenorio, J.L.; Benavente, E. Yield and quality performance of traditional and improved bread and durum wheat varieties under two conservation tillage systems. Sustainability 2019, 11, 4522. [Google Scholar] [CrossRef] [Green Version]
- Le Campion, A.; Oury, F.X.; Heumez, E.; Rolland, B. Conventional versus organic farming systems: Dissecting comparisons to improve cereal organic breeding strategies. Org. Agric. 2020, 10, 63–74. [Google Scholar] [CrossRef] [Green Version]
- Garakishi, H.K. Evaluation of wheat varieties in response to low and moderate input farming systems. Res. Crops 2020, 21, 26–30. [Google Scholar]
- Taner, A.; Arisoy, R.Z.; Kaya, Y.; Gültekin, I.; Partigöç, F. The effects of various tillage systems on grain yield, quality parameters and energy indices in winter wheat production under the rainfed conditions. Fresenius Environ. Bull. 2015, 1, 1463–1473. [Google Scholar]
- Baenziger, P.S.; Clements, R.L.; McIntosh, M.S.; Yamazaki, W.T.; Starling, T.M.; Sammons, D.J.; Johnson, J.W. Effect of Cultivar, Environment, and Their Interaction and Stability Analyses on Milling and Baking Quality of Soft Red Winter Wheat 1. Crop Sci. 1985, 25, 5–8. [Google Scholar] [CrossRef]
- Carr, P.M.; Horsley, R.D.; Poland, W.W. Tillage and seeding rate effects on wheat cultivars: I. Grain production. Crop Sci. 2003, 43, 202–209. [Google Scholar] [CrossRef]
- Rieger, S.; Richner, W.; Streit, B.; Frossard, E.; Liedgens, M. Growth, yield, and yield components of winter wheat and the effects of tillage intensity, preceding crops, and N fertilisation. Eur. J. Agron. 2008, 28, 405–411. [Google Scholar] [CrossRef]
- López-Bellido, L.; Fuentes, M.; Castillo, J.E.; López-Garrido, F.J. Effects of tillage, crop rotation and nitrogen fertilization on wheat-grain quality grown under rainfed Mediterranean conditions. Field Crops Res. 1998, 1, 265–276. [Google Scholar] [CrossRef]
- López-Bellido, L.; López-Bellido, R.J.; Castillo, J.E.; López-Bellido, F.J. Effects of long-term tillage, crop rotation and nitrogen fertilization on bread-making quality of hard red spring wheat. Field Crops Res. 2001, 72, 197–210. [Google Scholar] [CrossRef]
- De Vita, P.; Di Paolo, E.; Fecondo, G.; Di Fonzo, N.; Pisante, M. No-tillage and conventional tillage effects on durum wheat yield, grain quality and soil moisture content in southern Italy. Soil Tillage Res. 2007, 1, 69–78. [Google Scholar] [CrossRef]
- Shi, Y.; Yu, Z.; Man, J.; Ma, S.; Gao, Z.; Zhang, Y. Tillage practices affect dry matter accumulation and grain yield in winter wheat in the North China Plain. Soil Tillage Res. 2016, 1, 73–81. [Google Scholar] [CrossRef]
- Wu, J.; Carver, B.F.; Goad, C.L. Kernel color variability of hard white and hard red winter wheat. Crop Sci. 1999, 39, 634–638. [Google Scholar]
- Jiang, H.; Martin, J.; Okot-Kotber, M.; Seib, P.A. Color of whole-wheat foods prepared from a bright-white hard winter wheat and the phenolic acids in its coarse bran. J. Food Sci. 2011, 76, 846–852. [Google Scholar] [CrossRef]
- Li, Y.Z.; Posner, E.S. Determination of wheat milling potential and its influence on flour quality deterioration rate. Cereal Chem. 1989, 1, 365–368. [Google Scholar]
- Seib, P.A.; Liang, X.; Guan, F.; Liang, Y.T.; Yang, H.C. Comparison of Asian noodles from some hard white and hard red wheat flours. Cereal Chem. 2000, 77, 816–822. [Google Scholar] [CrossRef]
- Hatcher, D.W.; Lukow, O.M.; Dexter, J.E. Influence of environment on Canadian hard white spring wheat noodle quality. Cereal Foods World 2006, 1, 184–190. [Google Scholar] [CrossRef]
- Ozpinar, S.; Cay, A. Effect of different tillage systems on the quality and crop productivity of a clay–loam soil in semi-arid north-western Turkey. Soil Tillage Res. 2006, 88, 95–106. [Google Scholar] [CrossRef]
- Niu, Y.; Zhang, R.; Luo, Z.; Li, L.; Cai, L.; Li, G.; Xie, J. Contributions of long-term tillage systems on crop production and soil properties in the semi-arid Loess Plateau of China. J. Sci. Food Agric. 2016, 96, 2650–2659. [Google Scholar] [CrossRef]
- He, J.; Du, L.; Zhai, C.; Guan, Y.; Wang, J.; Zhang, Z.; Wu, S.; Ogundeji, O.A.; Gu, S. Physicochemical properties and stoichiometry of Mollisols in responses to tillage and fertilizer management. Arch. Agron. Soil Sci. 2020, 13, 1–2. [Google Scholar] [CrossRef]
- Cociu, A.I.; Alionte, E. The effect of different tillage systems on grain yield and its quality of winter wheat, maize and soybean under different weather conditions. Rom. Agric. Res. 2017, 1, 59–67. [Google Scholar]
- Rusu, T. Energy efficiency and soil conservation in conventional, minimum tillage and no-tillage. Int. Soil Water Conserv. Res. 2014, 2, 42–49. [Google Scholar] [CrossRef] [Green Version]
- Woźniak, A.; Gawęda, D. Tillage management effects on pea yield and chemical composition of pea seeds. Acta Sci. Pol. Hortorum Cultus 2019, 18, 151–160. [Google Scholar] [CrossRef]
- Morris, N.L.; Miller, P.C.; Orson, J.H.; Froud-Williams, R.J. The adoption of non-inversion tillage systems in the United Kingdom and the agronomic impact on soil, crops and the environment—A review. Soil Tillage Res. 2010, 108, 1–5. [Google Scholar] [CrossRef]
- Wozniak, A.; Soroka, M.; Stepniowska, A. Chemical composition of pea (Pisum sativum L.) seeds depending on tillage systems. J. Elem. 2014, 19, 15–25. [Google Scholar] [CrossRef]
- Romaneckas, K.; Avizienyte, D.; Adamaviciene, A.; Buragiene, S.; Kriauciuniene, Z.; Sarauskis, E. The impact of five long-term contrasting tillage systems on maize productivity parameters. Agric. Food Sci. 2020, 29, 6–17. [Google Scholar] [CrossRef]
- Woźniak, A. Effect of Cereal Monoculture and Tillage Systems on Grain Yield and Weed Infestation of Winter Durum Wheat. Int. J. Plant Prod. 2020, 14, 1–8. [Google Scholar] [CrossRef] [Green Version]
- Wozniak, A.; Makarski, B. Content of minerals in grain of spring wheat cv. Koksa depending on cultivation conditions. J. Elem. 2012, 17, 15–26. [Google Scholar] [CrossRef]
- Wozniak, A. The effect of tillage systems on yield and quality of durum wheat cultivars. Turk. J. Agric. For. 2013, 37, 133–138. [Google Scholar]
- Wozniak, A.; Wesołowski, M.; Soroka, M. Effect of long-term reduced tillage on grain yield, grain quality and weed infestation of spring wheat. J. Agric. Sci. Technol. 2015, 17, 899–908. [Google Scholar]
- Mohler, C.L.; Frisch, J.C.; McCulloch, C.E. Vertical movement of weed seed surrogates by tillage implements and natural processes. Soil Tillage Res. 2006, 86, 110–122. [Google Scholar] [CrossRef]
- Bremner, J.M.; Mulvaney, C.S. Nitrogen-total. In Methods of Soil Analysis, Part 2, 2nd ed.; Page, A.L., Miller, R.H., Keeney, D.R., Eds.; Soil Science Society of America and American Society of Agronomy: Madison, WI, USA, 1982; Volume 9, pp. 539–579. [Google Scholar]
- Blake, G.R.; Hartge, K.H. Bulk density. In Methods of Soil Analysis, Part 1 Physical and Mineralogical Methods, 2nd ed.; Klute, A., Ed.; Soil Science Society of America and American Society of Agronomy: Madison, WI, USA, 1986; Volume 9, pp. 363–382. [Google Scholar]
- Olsen, S.R. Estimation of Available Phosphorus in Soils by Extraction with Sodium Bicarbonate; US Department of Agriculture: Tumwater, WA, USA, 1954.
- Jackson, M.L. Soil Chemical Analysis-Advanced Course, 2nd ed.; UW-Madison Libraries Parallel Press: Madison, WI, USA, 1969. [Google Scholar]
- Jayas, D.S.; Singh, C.B. Grain quality evaluation by computer vision. In Computer Vision Technology in the Food and Beverage Industries; Woodhead Publishing: Cambridge, UK, 2012; pp. 400–421. [Google Scholar]
- Chakraverty, A.; Mujumdar, A.S.; Ramaswamy, H.S. (Eds.) Handbook of Postharvest Technology: Cereals, Fruits, Vegetables, Tea, and Spices; CRC Press: Boca Raton, FL, USA, 2003. [Google Scholar]
- Shahbazi, F. A study on the seed susceptibility of wheat (Triticum aestivum L.) cultivars to impact damage. J. Agric. Sci. Technol. 2012, 14, 505–512. [Google Scholar]
- Mohsenin, N.N. Physical Properties of Plant and Animal Materials; Gordon and Breach Science Publishers: New York, NY, USA, 1986. [Google Scholar]
- Peterson, C.J.; Shelton, D.R.; Martin, T.J.; Sears, R.G.; Williams, E.; Graybosch, R.A. Grain color stability and classification of hard white wheat in the US. Euphytica 2001, 119, 101–107. [Google Scholar] [CrossRef]
- Horrobin, D.J.; Landman, K.A.; Ryder, L. Interior and surface colour development during wheat grain steaming. J. Food. Eng. 2003, 57, 33–43. [Google Scholar]
- Tańska, M.; Rotkiewicz, D.; Kozirok, W.; Konopka, I. Measurement of the geometrical features and surface color of rapeseeds using digital image analysis. Food Res. Int. 2005, 38, 741–750. [Google Scholar]
- Leon, K.; Mery, D.; Pedreschi, F.; Leon, J. Color measurement in L* a* b* units from RGB digital images. Food Res. Int. 2006, 39, 1084–1091. [Google Scholar] [CrossRef]
- Afshari-Jouybari, H.; Farahnaky, A. Evaluation of Photoshop software potential for food colorimetry. J. Food Eng. 2011, 106, 170–175. [Google Scholar] [CrossRef]
- Khorami, S.S.; Kazemeini, S.A.; Afzalinia, S.; Gathala, M.K. Changes in soil properties and productivity under different tillage practices and wheat genotypes: A short-term study in Iran. Sustainability 2018, 10, 3273. [Google Scholar] [CrossRef] [Green Version]
- Gathala, M.K.; Jat, M.L.; Saharawat, Y.S.; Sharma, S.K.; Yadvinder, S.; Ladha, J.K. Physical and Chemical Properties of a Sandy Loam Soil Under Irrigated Rice-Wheat Sequence in the Indo-Gangetic Plains of South Asia. J. Ecosyst. Ecogr. 2017, 7, 1–12. [Google Scholar]
- Hassan, F.U.; Ahmad, M.; Ahmad, N.; Abbasi, K.M. Effects of subsoil compaction on yield and yield attributes of wheat in the sub-humid region of Pakistan. Soil Tillage Res. 2007, 96, 361–366. [Google Scholar] [CrossRef]
- Jat, M.L.; Gathala, M.K.; Ladha, J.K.; Saharawat, Y.S.; Jat, A.S.; Kumar, V.; Sharma, S.K.; Kumar, V.; Gupta, R. Evaluation of precision land leveling and double zero-till systems in the rice–wheat rotation: Water use, productivity, profitability and soil physical properties. Soil Tillage Res. 2009, 105, 112–121. [Google Scholar] [CrossRef]
- Salek Zamani, A.; Annabi Milani, A.; Zabolastani, M. Effect of different tillage methods on grain yield and its components in wheat cv. Alvand under East Azarbayjan conditions. Iran. J. Crop Sci. 2007, 9, 90–98. (In Persian) [Google Scholar]
- Tabatabaeefar, A.; Emamzadeh, H.; Varnamkhasti, M.G.; Rahimizadeh, R.; Karimi, M. Comparison of energy of tillage systems in wheat production. Energy 2009, 34, 41–45. [Google Scholar] [CrossRef]
- Javadi, A.; Rahmati, M.H.; Tabatabaeefar, A. Sustainable tillage methods for irrigated wheat production in different regions of Iran. Soil Tillage Res. 2009, 104, 143–149. [Google Scholar] [CrossRef]
- Troccoli, A.; Borrelli, G.M.; De Vita, P.; Fares, C.; Di Fonzo, N. Mini review: Durum wheat quality: A multidisciplinary concept. J. Cereal Sci. 2000, 32, 99–113. [Google Scholar] [CrossRef]
- Colecchia, S.A.; De Vita, P.; Rinaldi, M. Effects of tillage systems in durum wheat under rainfed Mediterranean conditions. Cereal Res. Commun. 2015, 43, 704–716. [Google Scholar] [CrossRef] [Green Version]
- Pringas, C.; Koch, H.J. Effects of long term minimum tillage on yield and quality of winter wheat as affected by previous crop–results from 9 years of on-farm research. Pflanzenbauwissenschaften 2004, 8, 24–33. [Google Scholar]
- Kraska, P. Content of some elements in grain of spring wheat cv. Zebra depending on soil tillage systems and catch crops. J. Elem. 2011, 16, 23–30. [Google Scholar] [CrossRef]
- Groos, C.; Gay, G.; Perretant, M.R.; Gervais, L.; Bernard, M.; Dedryver, F.; Charmet, G. Study of the relationship between pre-harvest sprouting and grain color by quantitative trait loci analysis in a white× red grain bread-wheat cross. Theor. Appl. Genet. 2002, 104, 39–47. [Google Scholar] [CrossRef]
- Matus-Cádiz, M.A.; Hucl, P.; Perron, C.E.; Tyler, R.T. Genotype× environment interaction for grain color in hard white spring wheat. Crop. Sci. 2003, 43, 219–226. [Google Scholar] [CrossRef]
- McCaig, T.N.; Gan, Y.T.; Clarke, P.; Clarke, J.M.; DePauw, R.M. Kernel colour changes associated with field weathering of spring wheat. Can. J. Plant. Sci. 2006, 86, 371–377. [Google Scholar] [CrossRef] [Green Version]
- Lukow, O.M.; Adams, K.; Suchy, J.; DePauw, R.M.; Humphreys, G. The effect of the environment on the grain colour and quality of commercially grown Canada hard white spring wheat, Triticum aestivum L. ‘Snowbird’. Can. J. Plant. Sci. 2013, 93, 1–11. [Google Scholar] [CrossRef]
- Horváth, Z.H.; Véha, A. Colour characteristics of winter wheat grits of different grain size. Acta Univ. Sapientiae. 2015, 8, 70–77. [Google Scholar] [CrossRef] [Green Version]
- Tańska, M.; Buczek, J.; Jarecki, W.; Wasilewska, A.; Konopka, I. Grain morphology, texture and colour-related compounds of bread wheat cultivars in relation to cultivation regimes and growing location. Zemdirbyste 2018, 105, 105–112. [Google Scholar] [CrossRef]
Figure 1.
Monthly rainfall during the experimental years.


Table 1.
Properties of the studied field soil.
| Soil Texture | Soil Particles (%) | pH | EC (ds m−1) | Organic Carbon (g kg−1) | Available P (ppm) | Available K (ppm) | Bulk Density (Mg m−3) | ||
|---|---|---|---|---|---|---|---|---|---|
| Clay | Silt | Sand | |||||||
| Loam | 25.6 | 38.4 | 36 | 7.4 | 0.41 | 7.12 | 9.04 | 286.59 | 1.32 |
Table 2.
Analysis of variance and mean comparison for wheat grain yield and yield components as affected by tillage systems.
Table 2.
Analysis of variance and mean comparison for wheat grain yield and yield components as affected by tillage systems.
| Tillage System | Wheat Grain Yield and Yield Components | ||||||
|---|---|---|---|---|---|---|---|
| Grain Yield (kg ha−1) | Plant Number (N m−2) | Plant Height (cm) | Spike Length (cm) | Spike Mass (g) | Grain Per Spike (N) | TGM (g) | |
| CT | 2.72 a | 360 a | 65.32 a | 9.14 a | 3.71 a | 32 a | 49.19 a |
| RT | 1.76 b | 348 a | 58.33 b | 8.17 b | 3.21 b | 30 a | 43.41 b |
| NT | 1.20 c | 332 c | 54.33 c | 6.89 c | 2.62 c | 24 b | 39.17 c |
| Mean | 1893.33 | 349.68 | 59.33 | 8.07 | 3.18 | 28.89 | 43.92 |
| CV | 0. 34 | 0.035 | 0.09 | 0.14 | 0.17 | 0.14 | 0.097 |
| F-values | |||||||
| Y | NS | NS | NS | NS | NS | NS | NS |
| TS | 7255.4 ** | 104.47 ** | 18.60 ** | 13.98 ** | 17.26 ** | 24.74 ** | 503.65 ** |
| Y × TS | NS | NS | NS | NS | NS | NS | NS |
CT = Conventional Tillage; RT = Reduced Tillage; NT = No Tillage; CV = Coefficient of Variance. NS—Not Significant; **—p < 0.01. a–c—Mean values with the same letter are not significantly different (p < 0.05).
Table 3.
Analysis of variance and mean comparison for the physical properties of wheat grain as affected by tillage systems.
Table 3.
Analysis of variance and mean comparison for the physical properties of wheat grain as affected by tillage systems.
| Tillage System | Wheat Grain Physical Properties | |||||||||
|---|---|---|---|---|---|---|---|---|---|---|
| L (mm) | W (mm) | T (mm) | Da (mm) | Dg (mm) | Dp (mm) | Φ (%) | V (mm3) | WA (g) | Density (g mm−3) | |
| CT | 6.80 a | 3.18 b | 2.88 a | 4.29 a | 3.97 a | 3.97 a | 0.58 b | 38.00 a | 0.023 a | 1.30 a |
| RT | 6.65 b | 3.31 a | 2.90 a | 4.28 a | 3.99 a | 3.99 a | 0.60 a | 33.33 b | 0.020 b | 1.30 a |
| NT | 6.30 c | 2.95 c | 2.63 b | 3.90 b | 3.65 b | 3.66 b | 0.58 b | 30.00 c | 0.018 c | 1.31 a |
| Mean | 6.65 | 3.15 | 2.80 | 4.18 | 3.87 | 3.38 | 0.59 | 33.78 | 0.02 | 1.3 |
| CV | 0.034 | 0.053 | 0.048 | 0.038 | 0.042 | 0.041 | 0.02 | 1.101 | 0.11 | 0.019 |
| F-values | ||||||||||
| Y | NS | NS | NS | NS | NS | NS | NS | NS | NS | NS |
| TS | 65.35 ** | 30.50 ** | 52.05 ** | 178.08 ** | 168.34 ** | 156.63 ** | 14.70 ** | 218.0 ** | 340.65 ** | 0.24 ns |
| Y × TS | NS | NS | NS | NS | NS | NS | NS | NS | NS | NS |
L = Length; W = Width; T = Thickness; Da—Arithmetic Mean Diameter; Dg = Geometric Mean Diameter; DP = Equivalent Mean Diameter; Φ = Sphericity; V = Volume; WA = Water Absorption. CT = Conventional Tillage; RT = Reduced Tillage; NT = No Tillage; CV = Coefficient of Variance. NS—Not Significant; **—p < 0.01. a–c—Mean values with the same letter are not significantly different (p < 0.05).
Table 4.
Analysis of variance and mean comparison for wheat grain chemical composition as affected by tillage systems.
Table 4.
Analysis of variance and mean comparison for wheat grain chemical composition as affected by tillage systems.
| Tillage System | Wheat Grains Physical Properties | |||
|---|---|---|---|---|
| Protein Content (%) | Fiber Content (%) | Ash Content (%) | Water Content (%) | |
| CT | 13.07 a | 13.07 b | 2.56 a | 7.00 b |
| RT | 11.90 b | 13.71 b | 2.38 b | 6.97 b |
| NT | 10.67 c | 15.07 a | 2.42 b | 7.57 a |
| Mean | 11.88 | 14.17 | 2.46 | 6.18 |
| CV | 0.093 | 0.066 | 0.053 | 0.048 |
| F-values | ||||
| Y | 64.067 ** | NS | 40.961 ** | NS |
| TS | 259.267 ** | 5.824 * | 39.09 ** | 43.857 ** |
| Y × TS | 16.67 ** | NS | 38.595 | NS |
CT = Conventional Tillage; RT = Reduced Tillage; NT = No Tillage; CV = Coefficient of Variance. NS—Not Significant; *—p < 0.05; **—p < 0.01. a–c—Mean values with the same letter are not significantly different (p < 0.05).
Table 5.
Protein and ash contents of wheat grains in the interactions between tillage systems and the year of study.
Table 5.
Protein and ash contents of wheat grains in the interactions between tillage systems and the year of study.
| Protein Content | Ash Content | |||||
|---|---|---|---|---|---|---|
| 2017–2018 | 2018–2019 | Mean | 2017–2018 | 2018–2019 | Mean | |
| CT | 13.60 a | 12.53 a | 13.07 | 2.60 a | 2.52 a | 2.56 |
| RT | 12.40 b | 11.40 c | 11.90 | 2.40 b | 2.38 b | 2.38 |
| NT | 10.67 d | 10.65 d | 10.67 | 2.26 c | 2.20 c | 2.42 |
| Mean | 12.22 | 11.52 | - | 2.42 | 2.36 | - |
CT = Conventional Tillage; RT = Reduced Tillage; NT = No Tillage. a–c—Mean values with the same letter are not significantly different (p < 0.05)
Table 6.
Analysis of variance and mean comparison for wheat grain surface color as affected by tillage systems.
Table 6.
Analysis of variance and mean comparison for wheat grain surface color as affected by tillage systems.
| Tillage System | Wheat Grain surface Color Properties | ||
|---|---|---|---|
| L* | a* | b* | |
| CT | 60.15 a | 4.62 b | 44.65 a |
| RT | 59.73 b | 4.76 b | 41.00 b |
| NT | 59.33 c | 5.12 a | 39.60 c |
| Mean | 59.74 | 4.83 | 41.75 |
| CV | 0.006 | 0.05 | 0.05 |
| F-values | |||
| Y | NS | NS | NS |
| TS | 32.489 ** | 25.30 ** | 825.48 ** |
| Y × TS | NS | NS | NS |
CT = Conventional Tillage; RT = Reduced Tillage; NT = No Tillage; CV = Coefficient of Variance. NS—Not Significant; **—p < 0.01. a–c—Mean values with the same letter are not significantly different (p < 0.05).
Table 7.
Pearson correlation coefficients between measured quality parameters of wheat grains.
| Correlation Coefficients | |||||||||||||||||||||||
|---|---|---|---|---|---|---|---|---|---|---|---|---|---|---|---|---|---|---|---|---|---|---|---|
| GY | PN | PH | SL | SM | GPS | TGM | L | W | T | Da | Dg | Dp | Φ | V | WA | Density | PC | FC | AC | WC | L* | a* | |
| PN | 0.953 ** | ||||||||||||||||||||||
| PH | 0.877 ** | 0.876 ** | |||||||||||||||||||||
| SL | 0.821 ** | 0.852 ** | 0.886 ** | ||||||||||||||||||||
| SM | 0.836 ** | 0.780 ** | 0.627 ** | 0.613 ** | |||||||||||||||||||
| GPS | 0.834 ** | 0.853 ** | 0.544 * | 0.561 * | 0.878 ** | ||||||||||||||||||
| TGM | 0.993 ** | 0.959 ** | 0.896 ** | 0.845 ** | 0.854 ** | 0.826 ** | |||||||||||||||||
| L | 0.887 ** | 0.893 ** | 0.754 ** | 0.839 ** | 0.840 ** | 0.829 ** | 0.911 ** | ||||||||||||||||
| W | 0.479 * | 0.675 ** | 0.504 * | 0.590 ** | 0.402 | 0.573 * | 0.522 * | 0.692 ** | |||||||||||||||
| T | 0.697 ** | 0.810 ** | 0.598 ** | 0.670 ** | 0.746 ** | 0.832 ** | 0.729 ** | 0.826 ** | 0.797 ** | ||||||||||||||
| Da | 0.776 ** | 0.877 ** | 0.695 ** | 0.783 ** | 0.737 ** | 0.815 ** | 0.809 ** | 0.933 ** | 0.888 ** | 0.935 ** | |||||||||||||
| Dg | 0.716 ** | 0.846 ** | 0.652 ** | 0.741 ** | 0.685 ** | 0.791 ** | 0.752 ** | 0.885 ** | 0.921 ** | 0.951 ** | 0.993 ** | ||||||||||||
| Dp | 0.718 ** | 0.847 ** | 0.657 ** | 0.745 ** | 0.680 ** | 0.787 ** | 0.755 ** | 0.886 ** | 0.927 ** | 0.942 ** | 0.993 ** | 0.999 ** | |||||||||||
| Φ | 0.005 ns | 0.266 ns | 0.046 ns | 0.087 ns | 0.034 ns | 0.303 ns | 0.040 ns | 0.195 | 0.783 ** | 0.597 ** | 0.525 * | 0.618 ** | 0.615 ** | ||||||||||
| V | 0.985 ** | 0.944 ** | 0.892 ** | 0.850 ** | 0.806 ** | 0.796 ** | 0.983 ** | 0.893 ** | 0.499 * | 0.718 ** | 0.790 ** | 0.734 ** | 0.736 ** | 0.019 ns | |||||||||
| WA | 0992 ** | 0.944 ** | 0.898 ** | 0.836 ** | 0.844 ** | 0.812 ** | 0.988 ** | 0.873 ** | 0.454 ns | 0.701 ** | 0.761 ** | 0.703 ** | 0.703 ** | −0.007 ns | 0.98 ** | ||||||||
| Density | −0.190 ns | −0.163 ns | −0.176 ns | −0.212 ns | 0.083 ns | −0.071 ns | −0.139 ns | −0.138 | −0.073 ns | −0.159 ns | −0.134 ns | −0.134 ns | −0.131 ns | 0.013 ns | −0.32 | −0.16ns | |||||||
| PC | 0.896 ** | 0.876 ** | 0.776 ** | 0.755 ** | 0.800 ** | 0.795 ** | 0.898 ** | 0.853 ** | 0.483 * | 0.686 ** | 0.755 ** | 0.700 ** | 0.705 ** | 0.037 ns | 0.9 ** | 0.88 ** | −0.233 ns | ||||||
| FC | −0.545 * | −0.586 * | −0.337 ns | −0.358 ns | −0.516 * | −0.704 ** | −0.532 * | −0.577 * | −0.580 * | −0.547 * | −0.626 ** | −0.614 ** | −0.621 ** | −0.352 ns | −0.54 * | −0.49 * | 0.245 ns | −0.52 * | |||||
| AC | 0.506 * | 0.414 ns | 0.432 ns | 0.327 ns | 0.358 ns | 0.328 ns | 0.493 * | 0.328 ns | 0.042 ns | 0.172 ns | 0.219 ns | 0.176 ns | 0.182 ns | −0.135 ns | 0.47 ns | 0.50 * | 0.039 ns | 0.38 ns | −0.12 ns | ||||
| WC | −0.704 ** | −0.811 ** | −0.589 * | −0.649 ** | −0.753 ** | −0.831 ** | −0.731 ** | −0.835 ** | −0.838 ** | −0.873 ** | −0.921 ** | −0.920 ** | −0.922 ** | −0.530 * | −0.69 ** | −0.67 ** | 0.046 ns | −0.72 ** | 0.71 ** | −0.127 ns | |||
| L* | −0.908 ** | −0.886 ** | −0.793 ** | −0.806 ** | −0.673 ** | −0.747 ** | −0.895 ** | −0.860 ** | −0.615 ** | −0.633 ** | −0.794 ** | −0.741 ** | −0.753 ** | −0.106 | −0.91 ** | −0.87 ** | 0.285 ns | −0.82 ** | 0.65 ** | −0.419 ns | 0.75 ** | ||
| a* | −0.829 ** | −0.869 ** | −0.652 ** | −0.707 ** | −0.886 ** | −0.881 ** | −0.861 ** | −0.901 ** | −0.603 ** | −0.839 ** | −0.857 ** | −0.827 ** | −0.821 ** | −0.256 | −0.81 ** | −0.82 ** | −0.050 ns | −0.814 ** | 0.46 | −0.307 ns | 0.79 ** | 0.70 ** | |
| b* | −0.919 ** | −0.970 ** | −0.814 ** | −0.827 ** | −0.808 ** | −0.886 ** | −0.933 ** | −0.938 ** | −0.756 ** | −0.882 ** | −0.944 ** | −0.918 ** | −0.920 ** | −0.349 | −0.92 ** | −0.90 ** | 0.203 ns | −0.88 ** | 0.66 ** | −0.333 ns | 0.89 ** | 0.89 ** | 0.89 ** |
Note: **: Correlation is significant at the 0.01 level; *: Correlation is significant at the 0.05 level; ns = not significant. GY = Grain Yield; PN = Plan Number; PH = Plant Height; SL = Spike Length; SM = Spike Mass; GPS = Grain Per Spike; TGM = Thousand-grains Mass; L = Length; W = Width; T = Thickness; Da—Arithmetic Mean Diameter; Dg = Geometric Mean Diameter; DP = Equivalent Mean Diameter; Φ = Sphericity; V = Volume; WA = Water Absorption; PC = Protein Content; FC = Fiber Content; AC = Ash Content; WC = Water Content.
Publisher’s Note: MDPI stays neutral with regard to jurisdictional claims in published maps and institutional affiliations. |
© 2021 by the authors. Licensee MDPI, Basel, Switzerland. This article is an open access article distributed under the terms and conditions of the Creative Commons Attribution (CC BY) license (https://creativecommons.org/licenses/by/4.0/).
Share and Cite
MDPI and ACS Style
Yousefian, M.; Shahbazi, F.; Hamidian, K. Crop Yield and Physicochemical Properties of Wheat Grains as Affected by Tillage Systems. Sustainability 2021, 13, 4781. https://0-doi-org.brum.beds.ac.uk/10.3390/su13094781
AMA Style
Yousefian M, Shahbazi F, Hamidian K. Crop Yield and Physicochemical Properties of Wheat Grains as Affected by Tillage Systems. Sustainability. 2021; 13(9):4781. https://0-doi-org.brum.beds.ac.uk/10.3390/su13094781
Chicago/Turabian StyleYousefian, Majid, Feizollah Shahbazi, and Kianoosh Hamidian. 2021. "Crop Yield and Physicochemical Properties of Wheat Grains as Affected by Tillage Systems" Sustainability 13, no. 9: 4781. https://0-doi-org.brum.beds.ac.uk/10.3390/su13094781
Note that from the first issue of 2016, this journal uses article numbers instead of page numbers. See further details here.