
WASH Financial and Social Investment Dynamics in a Conflict-Arid District of Jariban in Somalia


Institute of Rural Development, University of Venda, Thohoyandou 0950, South Africa
*
Author to whom correspondence should be addressed.
Sustainability 2021, 13(9), 4836; https://0-doi-org.brum.beds.ac.uk/10.3390/su13094836
Submission received: 31 December 2020
/
Revised: 4 February 2021
/
Accepted: 5 February 2021
/
Published: 26 April 2021
(This article belongs to the Section Sustainability in Geographic Science)
Abstract
:The paper investigated the social and financial resources’ interface in WASH programmes for vulnerable communities. Nineteen villages were randomly selected from the Jariban district in Somalia using the random number generator based on the village list. Data was collected in a sequential methodology that started with transect walks to observe and record the WASH infrastructure. Thirty-eight focus group discussions and desktop reviews triangulated transact walk recordings. The findings indicate minimum to zero investments towards WASH infrastructure in Jariban from the state government, with more dependency on the donor community. The study revealed that resources for the construction of latrines and water sources come from the following sources, NGOs (54.3%), diaspora community (34.5%) and community contributions (11.2%). The findings revealed a backlog in the WASH infrastructure, resulting in low access to water supply and sanitation services. The results demonstrate limited resource allocation by both the government and community, affecting the WASH infrastructure’s sustainability and further development. Due to the backlog in investments, particularly on improved latrines, it is concluded that their usage is low and a hindrance to having access to sanitation, hygiene and water as per the SDG goals, of leaving no one behind. While investment towards WASH in Jariban demonstrates multiple potential sources, there is a need to strengthen domestic resource mobilisation and explore governments’ role and capacity to secure WASH infrastructure investments. It is also recommended to explore how to tax the remittances to fund WASH infrastructure development and the private sector’s role in WASH infrastructure investment.
1. Introduction
The 2030 agenda for sustainable development emphasised the need for private and public institutions and the local communities to partner for improving water, sanitation and hygiene (WASH) service processes [1]. Sustainable Development Goal (SDG) 6B stresses the need to support and strengthen local communities’ involvement in improving water and sanitation management. The strategy by which SDG 6 can be achieved are spelt out in SDG17 and include financing and capacity building [1].
When national governance structures are weak, gaining buy-ins from beneficiary communities and other interest groups is incredibly important. Somalia remains fragmented and cannot deliver WASH services due to the failed state system and limited policy guidelines. The downfall of the Siad Barre regime in 1990 resulted in a statistical vacuum [2], as the Central Bank stopped operations. The collapse of the Central Bank operations and associated statistics government departments in 1991 inherently resulted in systematic lack of investment data, thereby compromising the financial design and implementation of policies and programmes related to WASH [3,4]. Non-governmental organisations (NGOs) and donors came in to fill the humanitarian space, support state-building efforts and deliver WASH services. However, the focus is financial, with less emphasis on social investments. The donors and other stakeholders’ focus more on humanitarian interventions than sustainable WASH investments that take cognisance of the social infrastructure investment [5].
1.1. Literature Review
1.1.1. The Participation of Local Communities
This section examined people’s social dynamics and interaction in rural communities to attract and sustain investment. Phillips and Pittman [6] argued that it is essential to invest in what people believe in enhancing WASH sustainability. According to [7], billions of foreign aid reconstruction in Iraq and Afghanistan typically channelled towards infrastructure through third-party contractors has fostered resentment toward Western countries. This is because the participation and contribution of the beneficiary communities have not been prioritised. Nwanze [8] also argues that sustainable development requires communities’ involvement in funding local projects designed by the community. Beneficiaries have a right to express their opinions and have their priorities captured in an accurate, inclusive and community participatory manner [8]. This would encourage community residents to support local rebuilding and economic development efforts.
Polarity can accrue where one social group feels impartiality from available benefits, where either the poor gain or the powerful lose. Gailing and Leibenaht [9] argued that elites prefer actions that directly tackle physical weakness, but poverty and powerlessness are underlying. Development partners do not stay forever; they leave when projects lapse or when conflicts ensue, and disasters happen [10]. Likewise, it is the locals who seek coping mechanisms to survive. Locals, having managed using local resources and indigenous knowledge, possess the drive and better understanding of their context [8]. Many NGOs desire such a rapid change so that they are accountable to donors. However, the community may have invisible priorities [11,12]. Gender-sensitive programming has become an essential component of rural development [13,14]. Greeney et al. [14] came up with several recommendations on how gender issues can be articulated in fragile environments. These include the need to build equality and strengthen women’s voice in change processes. The planning methodology with community participation has been used to turn around the U.S. [15]. In the quest for economic development, stakeholders and social groups would gather opinions and strategise how business development could be articulated [16]. As communities deliberated on how they wanted economic growth to happen, the role of local leadership was hailed from the onset, to ensure that there was buy-in of the entire process [15]. The private and public sector contributions within the community were also set [17]. The women could be emancipated and empowered by joining microfinance initiatives in their areas [18].
1.1.2. Development Funding from the Public and Private Sectors
Funds for Intergovernmental Organisations are donated as either earmarked or pooled. Donors can earmark funds to programs that align with their interests [18]. The OECD confirmed in 2014 that 70% of funds to UN agencies were earmarked funds [19,20]. This meant that the UN could only use the funds to undertake activities of interest to what the donors wanted [21], not necessarily what the receiving governments and NGOs wanted. On the other hand, pooled funds are a mechanism where theme-specific funds are generated to address an agreed crisis [18], such as the hunger in the horn of Africa. The advantage of pooled funds is that there is a collective consensus of what the funds are meant for, and the recipients provide baseline data for the need. Government policies and investment practices should facilitate investment from domestic and international investors.
Enhanced policy frameworks guide the operations of public and private partners in financial development terms [22]. The government’s role in WASH investment has been shown in the Philippines, where the government is working on the Unified Financing Framework (UFF) [23]. It is a holistic approach meant to increase utility governance operations and capacity building. The Philippines’ water revolving fund is co-financing arrangements between the government and private banks to improve WASH services access and is training banks on WASH projects appraisal [24]. In Nigeria, the Europe Aid WASH programme enhanced civil society organisations’ role in planning, budgeting, monitoring and evaluating WASH projects in 3 states. To date, it has facilitated the increase in sanitation infrastructure.
The public and private sectors should work together, and the private sector should work under public control [25]. Public–Private Partnership (PPP) is a way of increasing the private sector’s role in WASH financial investments as they provide a means for consumer feedback and cost recovery [25]. Private sector investment in the developing world is 35% of the market than 80% in the developed world [19]. Market-based approaches are ways of generating livelihood options to the marginalised so that they have opportunities to engage in markets [26]. Market-based approaches can improve the access and quality of service delivery for the marginalised and vulnerable communities and have of late been used to sustain water supply systems in fragile contexts. In Organization for Economic Co-operation and Development (OECD) countries, water supply has been privatised for centuries thus service delivery has enhanced over the years, such as in Paris (1982), Mexico (1855) and England since 1903 [27]. In most countries, there has been a shift from nationalised to privatised water supply systems. Despite its success in Europe, privatisation is despised because it reduces competition in the operations of water management services [28]. The private sector is also afraid of taking the risk of investing in needy communities [29].
1.1.3. Role of Microfinance in Local Development
The are several challenges in attracting and sustaining WASH investments to the poor [25]. Poor communities lack the business skills to approach investors or government officials for service investments. Microfinance could be undertaken to help the poorest who live on less than USD$2 [22,30] a day to sustain WASH infrastructure investment [31]. Microfinance markets (MFMs) can be divided into formal, semi-formal and informal categories [32]. Formal refers to regulated financial institutions, while semi-formal refers to microfinance institutions (MFIs) and programs organised by NGOs and the government. Informal microfinance refers to private transactions with traders, dealers, relatives and friends [22]. Microfinance schemes usually involve partners from the private sector, governments, NGOs and other actors. They are essential where people are not bankable or have no access to formal services [32]. Even the most efficient financial system, supported by a robust contractual and information infrastructure, faces limitations. Not all would-be borrowers are creditworthy, and there are numerous examples of national welfares that have been damaged by overly relaxed credit policies [19]. There also lies a great risk to investment in developing countries, and the local community risk can be averted using local and international insurance systems. [33] further notes that PPPs and investors were not investing in WASH due to the high risk of losing investment [31]. Insurance services encourage investments on the side of both PPPs and the vulnerable. Developing countries can use the global reinsurance market, catastrophe bonds and contingent credit to finance disasters [25,34].
Gatto [31] argues that microfinance only generates positive short-term outcomes but can be an institutional barrier to sustainable local economic and social development. This is because microfinance’s success depends on interlinkage with other stakeholders International Financial Institutions (IFIs), governmental development agencies and multilateral funding bodies such as USAID, special transnational non-state non-profit organisations, philanthropic funds, wealthy private individuals, banks and other for-profit financial institutions and specialised investment funds. Besides the well-coordinated stakeholders, microfinance can only sustain water supply if there are coordinated policy interventions, financial institutions and investment strategies, as was the case in most Asian countries.
1.1.4. Importance of Investment Data to Rural Development
Some investors are also not prepared to work in some developing countries due to limited data on investment and evidence to show that the communities are willing to improve their status quo in terms of WASH service delivery [35]. WASH sector should have attractive infographics to attract additional private and public financing to the sector. The lack of systematic information on investment is one reason why there has been limited empirical research on attracting and sustaining resources in WASH development. Building investment data sets that benchmark the current status quo would help focus policymaker attention and track and evaluate reform efforts to broaden access. Therefore, the paper’s objective was to investigate the social and financial resources’ interface in WASH programmes for marginalised communities within fragile context. The idea was to identify building blocks that can be used to inform a strategy for improved and sustainable WASH service provision in any conflict zone utilising the case of Jariban.
2. Methods
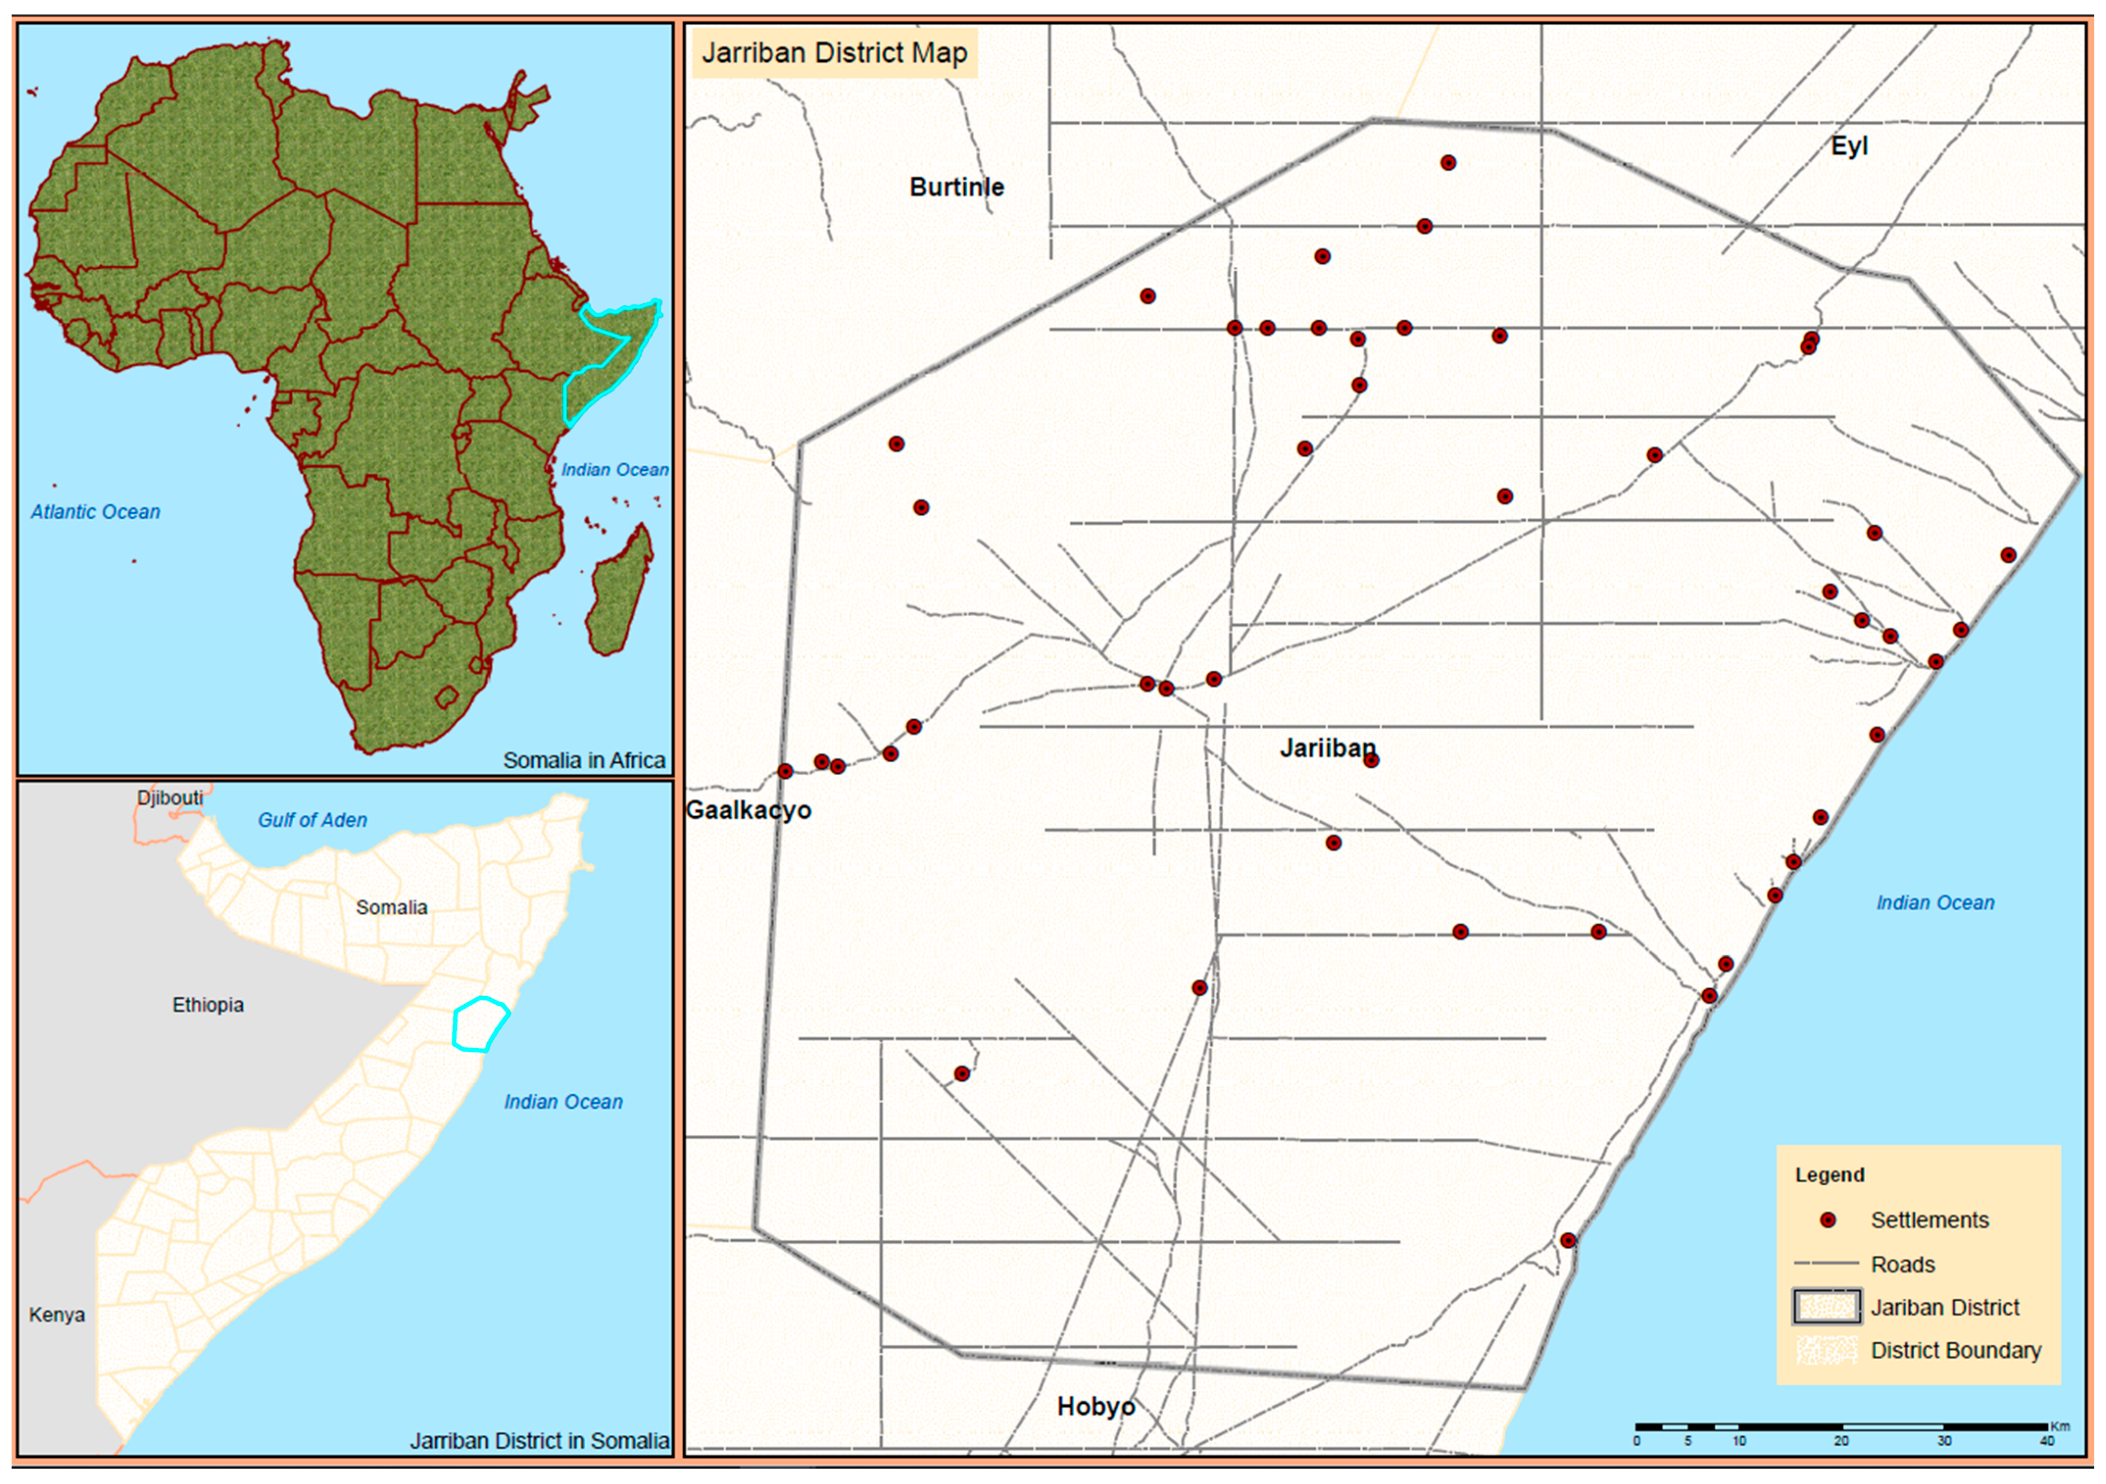
The University of Venda approved the ethical clearance for the research under project number SARDF/20/IRD/02/0704. The study was undertaken in the Jariban district of Puntland State in Somalia. The location of Jariban district is shown in Figure 1. Jariban district was purposively selected as it is ranked highest on the WASH severity index among the districts in Puntland state. The WASH need in Somalia is defined by the WASH cluster severity index comprising five levels: Minimal, stress, Severe, extreme and catastrophic. Jariban district is in severity index five and ranked seventh of the 99 districts in federal Somalia [36]. Villages were randomly selected from Jariban district using the random number generator based on the village list.
Data was collected in sequential participatory methodologies that started with transect walks in the 19 villages to observe and record the available WASH infrastructure. During the transect walk, notes were taken to record the stock and density of the WASH infrastructure. The result of the transect walks was a list of the existing latrines and water sources. All the latrines and water points were recorded, but only the functional ones were dwelt on for stock.
Data from the transect walks was used to develop a Focus Group Discussion (FGD) tool for communities. Thirty-eight FGDs and desktop reviews triangulated and validated the transact walk recordings. The FGDs were facilitated to get data on the communities’ contribution and what they perceive could be funding sources for the WASH projects’ sustainability. Each FGD sessions had 8–10 primary participants selected from women, men, boys, and girls to avoid violating socio-cultural and gender values for the Somali communities. Three hundred and sixty-one people participated in the FGDs. For each FGD, the participants were asked to identify a scribe who wrote their points, which they then presented to the research team to explain their views. The scores from the FGDs were ranked, and subsequently, descriptive statistics were conducted.
Population data for the village was based on the 2019 village registers. The UNOPS standards were used to estimate the cost needed for WASH infrastructure, and figures were compared to similar geographic areas of eastern Ethiopia, northern Kenya and Somalia [37]. Each village has a village register, which is updated by the village secretary once a year. The village registers are the most current and reliable sources of population data for Somalia. They are used by UN agencies, national and international organisations when planning service and other humanitarian assistance. Scenario planning was conducted to estimate WAH infrastructure needs for the coming five years. The village registers’ population was assumed to increase at a growth rate of 3% a year.
Desktop reviews were conducted to analyse both social and financial investment dynamics in Somalia. Reports from United Nations agencies, the WASH Cluster, the World Bank and International non-governmental organisations was gathered and analysed. The village registers were accessed from village heads and secretaries. UNOPS documents provided cost estimates for the WASH infrastructure. Other secondary data sources such as Sphere guidelines [38] provided the basis for water infrastructure and sanitation facilities cost estimates. Some of the costing assumptions are shown in Table 1.
3. Results
3.1. Projected Population for the Years 2020–2024
Based on village registers, the population of the 19 villages for 2019 was collated, as shown in Table 2. The village populations varied from 0.7% (Caracaso) to 25% (Balibusile) resulting in WASH needs difference as was confirmed by the transect and FGDs. The villages with existing boreholes, Balupusile, Seemade, Dhinowda and Salax, attracted more people and had the highest population at base year (2019). The villages that did not have boreholes such as Malaasle, Qualaanqal, Caracaso, Ilfoocshe and Booc, correspondingly did not have big populations by 2019.
3.2. Water Supply and Sanitation Infrastructure Needs for the Year 2019
The transect walk noted available water supply and sanitation infrastructure for the year 2019 (base year) as presented in Table 3. Balipusile, Seemade and Salax had the highest number of latrines and boreholes. The FGD noted that Balipusile and Seemade villages were both established in 1960, while Salax was set up in 1969. The FGD also confirmed that several NGOs had built latrines in Labilamane, Seemade, Balipusile and Salax. The youngest community was Ilfoocshe, which was established in 2002, and had the least number of latrines and no boreholes.
3.3. Projected Toilet Numbers over the Five Years
Table 4 shows the projected toilet numbers over the five years, which was then used to estimate the financial projection. Through scenario planning, the study found out that the 2019 backlog would be cleared in 2020 and 2021. In 2020, the latrines for the projected additional population would be provided to ensure enough latrines and boreholes. As a result, the required latrines for 2020 and 2021 would be higher than the subsequent years. Other things being equal and based on the projected 3% population growth, 6789, latrines would be needed between 2020 and 2024 for the whole study area. The villages with the highest populations like Salax, Balipusile, Seemade, Dhinowda and Galxagar would require very high numbers of latrines in 2020 and 2021 to clear the 2019 backlog.
3.4. Projected Boreholes over the Five Years
Data from the transect walks reveal that 74% of the villages in the study area needed boreholes. Transect walk in villages that already had boreholes showed that once a borehole is drilled, it would be connected to a pipe system to access water points. The five villages; Balipusile, Buubi, Seemade, Ceelbardale and Salax which had existing boreholes, wanted the pipeline networks to be extended. If each village would have a borehole, it will have enough water human and livestock watering. In Balibusile village, where there was an existing borehole, hundreds of humans and livestock were observed in the transect walk watering.
Information from the transect walks indicated that communities resorted to open ponds where the boreholes did not exist. This was prevalent in Malaasle, Qalaanqal, Qalaanqal, Ceelbardarle, Seemade, Booc, Mareer, Kulub, Iifoosche, Galxagar, Dhobocantug, Labilamane, Mayle, Carroscasso and Hayaanle villages. In the transect walks, donkeys were seen drinking from the same ponds where people were fetching water for domestic use. This shows that the need for boreholes to supply water for both humans and animals is dire. For example, the transect walk in Balibusile noted a deep borehole where there is a pipeline system connecting the water-to-water points, schools, and health centres within the village. The borehole water is also trucked to villages without boreholes through the support of donors and NGOs. The FGDs and transect walks showed that the villages without boreholes did not have running water at both schools and health centres. The boreholes required in the study area are shown in Table 5.
3.5. Consolidated WASH Infrastructure Cost Estimates from 2020–2024
Based on the number of latrines and boreholes in 2019, the study projected to cater for the WASH needs for the additional population basing on the estimated growth rate. The scenario plan was first to clear the backlog for 2019 in 2020 and 2021, and then ensure that between 2022 and 2024, there are enough latrines and boreholes to service the study area population. The study also projected that from 2022 to 2024, the cost of latrines would mainly result from additional latrines, given that the population is projected to increase yearly. The consolidated WASH infrastructure cost estimates for the years 2020 to 2024 are shown in Table 6.
Based on 2019 WASH infrastructure requirements, toilets and water supply infrastructure estimates were established for the subsequent years 2020 to 2024, as shown in Table 6. As the population would increase year after year, the number of latrines needed would also increase. Water and sanitation infrastructure provision will cost an average of USD1 594 610 (range of USD6 153 731 to USD116 852) per year from 2020 to 2024 for the 19 districts of Jariban. The estimated total amount needed for water supply was USD3.898.920 as compared to USD4.074.130 for sanitation. Considering that there is no backlog as was the case between 2022 and 2024, the cost of sanitation infrastructure is, on average, 4% higher than that of water supply.
Ensuring that all households have sanitation facilities takes time as the construction of toilets is a household responsibility, while water is a community responsibility. For that reason, it would take more time to ensure that households have toilets. Between 2020 and 2024, Balibusle, Seemade and Dhinowda villages will need USD1.027.279, USD528.629 and USD620.791. The considerable cost of sanitation corresponds to the populations of 34.243, 17.621, and 20.693, respectively.
The investment for the year 2020, represents 77% of the required USD 7.973.051. The subsequent years 2021–2024 would require a further injection of 16, 3, 2 and 2%, respectively. A cumulative financial cost of USD 7.973.050 is needed between 2020 and 2024. Only 26% of the villages had a water supply system.
3.6. Community Perceptions on Potable Water Supply and Sanitation Infrastructure Funding Sources
Thirty-eight FGD provided understanding about the sources of funds for the WASH infrastructure that was observed during the transect walks and the type of contributions that the community can afford to WASH infrastructure development. The agreed source of funds and community contributions were tallied, and the frequencies were calculated and ranked, as shown in Table 7. The sources of funding in descending order are NGOs (54.3%), people in the diaspora (34.3%) and the households (11.4%).
3.6.1. Non-Governmental Organisations Funding
Fifty-four percent of the 38 FGD noted that NGO funded WASH infrastructure in their villages. Funding from NGOs was ranked highest. The dominance of the financing from NGO has sustainability constraints as the funding cycles are not long term and lapse at the end of projects. The FGDs showed that each village desired at least one mechanised water system (powered by solar) to source water from deep boreholes. The transect walks had shown that they were seven boreholes in five of the studied villages. NGOs had provided the funds for drilling and developing the boreholes. The boreholes had been handed over to Puntland State Agency for Water and Energy. The same NGOs had provided funds to mechanise the water supply systems. During the transect walks in Balipusile and Buubi villages, which already had water supply systems in 2019, the boreholes were between 450 and 500 m deep as read from the inscriptions.
Desktop reviews further noted that there is currently no government-defined financing plan covering the whole WASH sector. There was no government financial scheme to make WASH services affordable to disadvantaged groups except through humanitarian aid [39]. The major WASH donors in Somalia are UKaid, USAID, European Union, JICA, Humanitarian aid and Civil protection, Central Emergency Response Funds (CERF), German Federal Ministry for Economic Cooperation and Development (BMZ) and Norwegian Ministry of Foreign Affairs [40,41].
3.6.2. Diaspora Funding
The second highest source of WASH infrastructure funding is the diaspora community (34.29%). Remittances from the diaspora are sent through mobile and banking platforms. During the transect walks, the community noted that people in the diaspora mostly financed the berkads (unprotected underground wells). The FGDs confirmed that people in the diaspora fund the construction of the communal or households berkads. There were, however, concerns from the discussions that the water harvested from the underground wells (berkads) was not safe for drinking and was used mostly to water small livestock like goats and sheep. The same berkads were used as reservoirs when trucks brought water. Other donations from overseas were sent through religious or village leaders for the development of community WASH infrastructures. It came out from the FGD that the diaspora community could also fund mechanised water system to complement the efforts being made by the NGOs.
3.6.3. Household (Social) Funding
Households (11.43%) were identified as the third source of WASH infrastructure funds. The FGD noted that the households could source the funds from livestock since they were pastoral communities. The households also get funds from remittances in the diaspora. The FGD identified the types of contributions that households could provide to the development of WASH infrastructure, as shown in Table 7.
The ranking in Table 7 shows that the community were mostly keen on supplying sand (37.6%) and stones (37.6%) to construction work for WASH infrastructure. During the transect walks, many stones and sand were seen, given that the study area is arid. The other contribution from the community is labour to dig trenches and pits (19.8%). The contribution was lower than sand and stones because the ground is hard and rocky. In 5% of the FGD, it came out that few builders had skills to help with construction.
To determine the contribution of communities towards latrine construction, the FGD identified the materials that the household could contribute. People with construction knowledge (masons) within the FGD also helped quantify the materials needed for latrine construction. The number of materials, as well as cost, was verified with UNOPS costing guidelines. Then, the FGD identified what they could contribute to the proportion of community contribution was established. Table 8 shows what the community and other funders can contribute towards the construction of a latrine. The community contributions to latrine construction were calculated as a proportion of the total cost of a latrine. The social investment includes locally available materials, which were translated into monetary terms. It also involved labour provided by the community members in the form of food for work to build community infrastructure. The community can then contribute USD150 of the USD600 needed to construct a ventilated improved latrine in Puntland. The community contribution was found to be 25% of the total cost of latrine construction. As shown in Table 8 the community members contribute stones, sand, and non-skilled labour like digging of latrine pits and masonry work. The community contributing to the development of WASH infrastructure was to ensure that they control the infrastructure, as most organisations would only work in their communities for up to a year.
4. Discussions and Conclusions
The respondents ranked that NGO provides the most significant share of WASH infrastructure funding. It can be concluded that there is a dependency on the donor community. NGO funding is usually earmarked and undertakes activities that gratify the donors’ interests at the expense of recipient interests. Depending on NGO, funding is not sustainable as donors’ interests in Somalia may not necessarily be WASH. This is in line with an earlier study that the global focus of investment in WASH programmes is targeted at constructing infrastructure (capital expenditure) with little attention directed to the social side [42]. The finding confirms earlier findings that lack of social investment is associated with inadequate WASH service coverage [41,43]. The investment in social infrastructures such as community buy-in and local materials’ contribution is a central pillar/building-block for the sustainability of rural water services, especially in conflict zones. Suppose NGOs keep investing in WASH programmes more than people from the community, the projects’ ownership can be compromised, especially when the projects do not align with community needs. While resources could be generated from formal microfinance schemes [30], there are no functional government policies to support the operations in Somalia [44]. The central bank in Somalia seized operations in 1991 [45,46]; hence, there is a need for a beneficial mutual linkage between commercial banks and MFIs where commercial banks wholesale finance and the borrowing NGOs retail to clients.
While investment towards WASH in the study area align to SDG17.3 of sourcing funds from multiple sources, there is a need to strengthen domestic resource mobilisation as specified by SDG 17.1. Diaspora remittances could fund WASH infrastructure in Somalia. An earlier study confirmed that Somalia diasporans remit many funds that can support WASH infrastructure. Somalia’s diaspora community is estimated to have sent more than $1.3 billion home in 2014 [47], nearly twice the level of development aid ($642 million) and five times the level of humanitarian assistance of $253 million [47]. The community members could use the funds from the diaspora to develop water supply and sanitation facilities. Informal microfinance schemes [22] could incentivise water service providers and keep them in business. The informal microfinance schemes funds could raise funds to pay for land on which the boreholes are situated. The government could establish semi-formal microfinance schemes such as NGO-MFIs [22,31] in Somalia. They have advantages over public agencies because they can reach the poor and work with them in remote areas. They can also facilitate mobilisation and build the capacity of water utilities [22].
Earlier research confirms that when communities contribute to their development, it gives them a sense of psychological and spiritual control and ownership of the community assets [42]. Earlier studies have shown that despite the capacity in communities to raise funds, they cannot attend unpredictable breakdowns due to technology differences and weak supply chains [48]. As such, there is a need to build a robust insurance scheme for the WASH service provides. For instance, in Bangladesh, investors in ‘water houses’ see insurance as an incentive to improve the facilities [32].
It is concluded that limited community contribution (social and financial) by the local community derail the sustainability of WASH infrastructure. The African Development Bank [49] argued that when infrastructure, such as latrines and dams, is associated with donors, it adversely impacts Operation and Maintenance (O&M). This lack of investment in the beneficiaries’ involvement can inhibit WASH services’ sustainability due to weak interaction between the WASH responsible authorities, government and donor agents on one hand and grassroots communities [50]. Associated with that are weak accountability systems, which leave communities as passive recipients of WASH services [7]. The communities are passive recipients to donors since they lack the skills to approach private investors and government line ministries to seek financial support. Simultaneously, they cannot access banks’ loans because formal institutions require collateral.
The backlog in WASH infrastructure indicates low access to water supply and sanitation services in the study area and is consistent with general sub-Saharan Africa, as was confirmed by [51]. An earlier study by Hutton further shows that low WASH services retards efforts towards economic development [52] and the nutritional status of children [53]. The low access to WASH infrastructure partially explains why Somalia has the sixth-highest infant mortality rate in the world [36,54]. While studies in East Africa have shown that diarrhoea cases diminish when water access is high, Somalia still experiences two epidemiological peaks of diarrheal each year [55]. A study by [56] has also shown that households that share latrines, as is the case in Somalia has a higher risk of spreading diarrheal diseases. Where boreholes exist, the rate of development is also high. A recent study of the Mumbai Metropolitan Region in India has shown that despite the considerable population densities, the growth rate for peri-urban villages like Bhiwandi has been high [57]. Somalia has experienced seven successive years of drought [36], and this has created a high demand for livestock watering, as has been previously noted by [5]. Low WASH funding in Somalia could be attributed to poor economics and weak political will, as stated by the [58] and the little attention is given to varying water demand characterisation across seasons [58]).
Given the low number of improved latrines, it is concluded that latrine use is down in fragile contexts. This is in line with [59] who confirmed that women are unlikely to use a latrine at a neighbour’s house as they fear psychological and sexual abuse. Given that most of the study area’s latrines are pit latrines, women’s protection is compromised if they use the neighbour’s latrine. The finding resonates with an earlier study, which finds out that insufficient latrines are a war consequence for the women who are non-combatants in the Syrian conflict [60]. The war situation resulted in few latrines not segregated between man and woman, making gender abuse inevitable [60].
5. Recommendations and Further Research
Private business can also provide innovative technologies for water treatment, harvesting and abstraction. Private companies can also offer smart water kiosks that enable users to be allocated daily, weekly and monthly water rations by water management committees. The water ATMs improve accountability and ring-fence funds generated for operation and maintenance. To reduce the NGOs’ funding contributions, the diaspora community who are locals working outside the country could be encouraged to remit more funds channelled to WASH resource development. The private sector, such as banks, could be encouraged to provide community cooperative loans for water and sanitation projects. The government could also tax diaspora remittances to fund WASH projects as the remittances can be invested in other sectors. Encouraging locals to use locally available materials like stones for latrine construction could reduce infrastructure costs.
Existing water sources can be rehabilitated to reduce operational costs. For example, the deep boreholes can be solarised so that the community can reduce the cost of buying diesel-pumping water. It is also recommended that communities and investors adopt the life cycle approach. This refers to the breakdown of a water system costs throughout the expected life span and identifying when pump mechanics would conduct operation and maintenance and its costs. The investors would need to know all relative expenses to be aware of when and how to prepare for high or lower returns to the investments they would have made to WASH infrastructure. To further reduce construction costs, the community members can receive vocational training on essential skills like masonry, pump mechanics, household water treatment and safe storage.
The study only examined financial and social investment at the community level; further research could explore governments’ role and capacity to secure investments for WASH infrastructure. There is also a need to explore how to tax the remittances to fund WASH infrastructure development and the private sector’s role in WASH infrastructure investment.
Author Contributions
Conceptualisation, W.M.; methodology, W.M.; software, W.M.; validation, J.Z. and M.M.; formal analysis, W.M.; investigation, W.M.; resources, W.M.; data curation, W.M.; writing—original draft preparation, W.M.; writing—review and editing, W.M.; visualisation, W.M.; supervision, J.Z. and M.M.; project administration, J.Z. and M.M. All authors have read and agreed to the published version of the manuscript.
Funding
This research received no external funding.
Institutional Review Board Statement
University of Venda approved the ethical clearance for the research under project number SARDF/20/IRD/02/0704.
Informed Consent Statement
Informed consent was obtained from all subjects involved in the study.
Acknowledgments
The research could not have been possible without the help of the research assistants; Sadia Hassan Hussein, Abdirahshid Elmi, Mohamed Jama Osman and Laila Abdiwali Muse, I am indebted to you for the translations and the support throughout the data collection and analysis. To the Puntland State Ministry of Planning, Economic Development and International Cooperation, thank you for the approval to conduct the study in Puntland State. I want to thank my employer World Vision International for an opportunity to work in fragile contexts.
Conflicts of Interest
The authors declare no conflict of interest.
References
- UN. Sustainable Development Goals-Knowledge Platform. 2020. Available online: https://sustainabledevelopment.un.org/sdgs (accessed on 3 January 2015).
- DuBois, M.; Harvey, P.; Taylor, G. Rapid Real-Time Review, Dfid Somalia Drought Response; Department for International Development: Mogadishu, Somalia, 2018. [Google Scholar]
- Mogadishu: An Economy without a State. Webersik, Christian. Third World Q. 2006, 27, 1463–1480. [CrossRef]
- Hesse, B.J. Where Somalia Works. Contemp. Afr. Stud. 2010, 28, 247–259. [Google Scholar] [CrossRef]
- Elliott, M. Addressing How Multiple Household Water Sources and Uses Build Water Resilience and Support Sustainable Development. Clean Water 2019, 2, 6. [Google Scholar] [CrossRef] [Green Version]
- Phillips, R.; Pittman, R.H. An Introduction to Community Development, 2nd ed.; Routledge: New York, NY, USA, 2015. [Google Scholar]
- Ben-Meir, J. Creating a New Era of Islamic-Western Relations by Supporting Community Development. Int. J. Social. Soc. Policy 2004, 24, 25–41. [Google Scholar] [CrossRef]
- Nwanze Kanayo, F. A Bucket of Water, Reflections on Sustainable Rural Development; Practical Action Publishing Ltd.: Warwickshire, UK, 2017. [Google Scholar]
- Gailing, L.; Leibenaht, M. The Social Construction of Landscapes: Two Theoretical Lenses and their Empirical Applications. Landsc. Res. 2015, 40, 123–138. [Google Scholar] [CrossRef]
- Singh, K.; Shishoda, A. Rural Development: Principles, Policies and Management, 4th ed.; Sage Publications Pvt Ltd.: Hoboken, NJ, USA, 2016. [Google Scholar]
- Collinson, S.; Elhawary, S. Humanitarian Space: A Review of Trends and Issues; Humanitarian Policy Group: London, UK, 2015. [Google Scholar]
- Abdulkadir, A.F. The Effects of Indigenous Patriarchal Systems on Women Participation in Public Decision Making in Conflict Settings: The Case of Somalia. Rethink. Transit. Gend. Justice 2018, 257–272. [Google Scholar] [CrossRef]
- Bond, P. Water rights, commons and advocacy narratives. South African Journal on Human Rights 2013, 29, 125–143. [Google Scholar] [CrossRef]
- Greeney, Y.; Chanis, B.; Bulos, G.; Cardone, R. Empowering Woman in the Wash Sector. J. Gend. Water 2017, 5, 25–31. [Google Scholar]
- Bryson, J.M. Strategic Planning for Public and Nonprofit Organisations: A Guide to Strengthening and Sustaining Organisational Achievement, 2nd ed.; Jossey-Bass: Minnesota, MI, USA, 1995. [Google Scholar]
- Haverkampf, K.; Loden, C.C. Community Resource Teams: A Collaborative, Multidisciplinary Team Approach to Community Problem Solving in Wisconsin. Commun. Dev. 2010, 41, 192–208. [Google Scholar] [CrossRef]
- Ayres, J. Take Charge: Economic Development in Small Communities; North Central Regional Centre for Rural Development: Ames, IA, USA, 1990. [Google Scholar]
- Gatto, A.; Polselli, N.; Bloom, G. Empowering gender equality through rural development: Rural markets and micro-finance in Kyrgyzstan. In L’Europa e la Comunità Internazionale Difronte alle Sfide dello Sviluppo; Giannini: London, UK, 2016; pp. 65–89. [Google Scholar]
- Graham, E.R. Follow the money: How trends in financing are changing governance at international organisations. Glob. Policy 2017, 8, 15–25. [Google Scholar] [CrossRef] [Green Version]
- UNESCO. Water a shared responsibility. In UNESCO and Berghahn Books; Report 2; UNESCO: New York, NY, USA, 2006. [Google Scholar]
- Tortora, P.; Steeensen, S. Making Earmarked Funding More Effective: Current Practices and a Way Forward; OECD: Paris, France, 2014. [Google Scholar]
- OECD. The High-Level Fora on Aid Effectiveness: A History. 2011. Available online: https://www.oecd.org/dac/effectiveness/thehighlevelforaonaideffectivenessahistory.htm (accessed on 17 July 2019).
- Mukhlesar, R. Channeling commercial funds to NGO-MFI’s: A case study of Banks-NGO linkage program of Somali Bank. Brac University: Dhakar, Bengal, 2004. [Google Scholar]
- USAID. Philippines: Financing Reform Addresses Funding Gaps in Water, Sanitation, and Hygiene. Unified Financing Framework for Water Supply and Sanitation (2018–2020). USAID center for Water Security, Sanitation, and Hygiene. 2020. Available online: https://www.globalwaters.org/usaid-annual-report/philippines-financing-reform-addresses-funding-gaps-water-sanitation-and (accessed on 23 January 2021).
- DAI. Philippines—Water Revolving Fund Support Program (PWRF). US Agency for International Development. 2005. Available online: https://www.dai.com/our-work/projects/philippines-water-revolving-fund-support-program-pwrf (accessed on 22 January 2021).
- Johannessen, A.; Rosemarin, A.; Thomalla, F.; Swartling, A.G.; Stenström, T.A.; Vulturius, G. Strategies for building resilience to hazards in WASH systems: The role of PPPs. Int. J. Disaster Risk Reduct. 2014, 10, 102–115. [Google Scholar] [CrossRef] [Green Version]
- IDS. A Typology of Market-Based Approaches to Include the Most Marginalised; Coady Institute, Alison Mathie & Yogesh Ghore, The Rockefeller Foundation: New York, NY, USA, 2016. [Google Scholar]
- OECD. Enabling SMEs to Scale Up. OECD: Mexico City, Mexico, 2018. [Google Scholar]
- Araral, E. The failure of water utilities privatisation: Synthesis of evidence, analysis and implications. Policy society 2008, 27, 221–228. [Google Scholar] [CrossRef]
- Baker, M. Translation and Conflict: A Narrative Account, 2nd ed.; Routledge: London, UK, 2018. [Google Scholar]
- Gatto, A. Historical roots of microcredit and usury: The role of Monti di Pietà in Italy and in the kingdom of Naples in XV–XX centuries. J. Int. Dev. 2018, 30, 911–914. [Google Scholar] [CrossRef]
- Zeug, H. Analysis: Potential of Microinsurance to Sustain Water and Services; Water for All: New York, NY, USA, 2011. [Google Scholar]
- Beck, T.; Demirgue, A.; Honohan, P. Access to Financial Services: Measurement, Impact, and Policies. World Bank Res. Obs. 2009, 24, 119–145. [Google Scholar] [CrossRef]
- Rispa, W.; Odingo, T. Public-Private Partnership in Emergencies: Case of Dollow Water Management Company, Gedo Region Somalia. In Proceedings of the Nakuru: 41st WEDC International Conference, Nakuru, Kenya, 9–13 July 2018. [Google Scholar]
- World Bank. Thai Flood 2011 Overview: Rapid Assessment for Resilient Recovery and Reconstruction Planning; World Bank: Washington, DC, USA, 2011. [Google Scholar]
- Baker, J.L.; McClain, K. Private Sector Initiatives in Slum Upgrading; The World Bank Group: Washington, DC, USA, 2009. [Google Scholar]
- OCHA. Humanitarian Needs Overview; UNOCHA: Mogadishu, Somalia, 2019. [Google Scholar]
- UNOPS. Unicef Designs; UNOPS Kenya Operation Centre: Nairobi, Kenya, 2008. [Google Scholar]
- Sphere Association. The Sphere Handbook: Humanitarian Charter & Minimum Standards in Humanitarian Response, 4th ed.; CHS Alliance: Geneva, Switzerland, 2018. [Google Scholar]
- World Bank Group. Somalia Economic Update Edition 1: Transition Amidst Risk with a Special Focus on Intergovernmental Fiscal Relation; World Bank: New York, NY, USA, 2015. [Google Scholar]
- UNICEF. Somalia Humanitarian Situation Report 5. 2020. Available online: https://reliefweb.int/report/somalia/unicef-somalia-humanitarian-situation-report-no-5-may-2020 (accessed on 19 May 2020).
- Gomez, M.; Perdiguero, J.; Sanz, A. Socioeconomic factors affecting water access in rural areas of low and middle-income countries. Water 2019, 11, 202. [Google Scholar] [CrossRef] [Green Version]
- Kham, S.; Mandal, H.B.; Siddique, M.N. Safe water access, motivation and community participation at arsenic affected rural area of Jessore, Bangladesh: Insights and realism. J. Sci. Technol. Environ. 2016, 4, 260–269. [Google Scholar]
- Mvulirwenande, S.; Wehn, U.; Alaerts, G. Policy Factors Explaining the Failure of Delegated Management in Water Supply: Evidence from Ghana. Water Int. 2019, 44, 14–30. [Google Scholar] [CrossRef]
- Menkhaus, K. Governance without Government in Somalia: Spoilers, State Building and the Politics of Coping. Int. Secur. 2012, 31, 76–106. [Google Scholar] [CrossRef]
- Clarke, W.; Herbst, J. Somalia and the Future of Humanitarian Intervention. JSTOR 1994, 75, 70–85. [Google Scholar]
- Clarke, W.; Herbst, J. Somalia and the Future of Humanitarian of Humanitarian Interventions. In Walter Clarke and Jeffrey Herbst. Learning from Somalia: The Lessons of Armed Humanitarian Intervention; Westview: Oxford, UK, 1997; pp. 239–254. [Google Scholar]
- Benson, J.; Sorensen, L.C.; Wise, A.E.; Heger, L. Somali Diaspora Investment Survey Report; One Earth Future: Mogadishu, Somalia, 2015. [Google Scholar]
- Hope, R.; Thomson, P.; Koehler, J.; Foster, T. Rethinking the Economics of Rural Water in Africa. Oxf. Rev. Econ. Policy 2020, 36, 171–190. [Google Scholar] [CrossRef] [Green Version]
- African Development Bank. Water Infrastructure Development for Resilience in Somaliland: Group Appraisal Report. 30 June 2016. Available online: https://www.afdb.org/fileadmin/uploads/afdb/Documents/Project-and-Operations/Somalia_-_Somaliland_Water_Project_-_Approved.pdf (accessed on 13 March 2018).
- Money, A. Hybrid and Blended Finance; World Water Council: Marseille, France, 2018. [Google Scholar]
- Adams, E.A.; Boateng, G.O.; Amoyaw, J.A. Socioeconomic and Demographic Predictors of Potable Water and Sanitation in Ghana. Soc. Indic. Res. 2015, 126, 673–687. [Google Scholar] [CrossRef]
- Hutton, G.; Haller, L.; Batram, A. Global Cost-Benefit Analysis of Water Supply and Sanitation Interventions. J. Water Health 2007, 5, 481–502. [Google Scholar] [CrossRef] [PubMed] [Green Version]
- Checkley, W.; Buckley, G.; Gilman, R.H.; Assis, A.M.; Guerrant, R.L.; Morris, S.S.; Mølbak, K.; Valentiner-Branth, P.; Lanata, C.F.; Black, R.E.; et al. Multicountry Analysis of the Effects of Diarrhoea in Childhood Stunting. Int. J. Epidemiol. 2008, 37, 816–830. [Google Scholar] [CrossRef] [Green Version]
- Danzhen, Y.; Lucia, H. Levels and Trends in Child Mortality; UN Inter-agency Group for Child Mortality Estimation: Nairobi, Kenya, 2015. [Google Scholar]
- WHO. World Health Organisation. 2018. Available online: https://www.who.int/csr/don/29-march-2018-cholera-somalia/en/ (accessed on 13 January 2019).
- Esrey, S.A.; Potash, J.B.; Roberts, L.; Shiff, C. Effects of Improved Water Supply and Sanitation on Ascariasis, Diarrhoeal, Drancunculias, Hookworm Infection, Schistosomiasis and Trancoma. Bull. World Health Organ. 1991, 69, 609–621. [Google Scholar] [PubMed]
- Kandpal, R.; Izuru, S. An Evaluation of the Relative Urbanisation in Peri-urban Villages Affected by Industrialisation: The Case Study of Bhiwandi in the Mumbai Metropolitan Region, India. Spat. Inf. Res. 2019, 27, 137–149. [Google Scholar] [CrossRef]
- World Bank. The Demand for Water in Rural Areas: Determinants and Policy Implications. World Bank Res. Obs. 1993, 8, 47–70. [Google Scholar] [CrossRef]
- Asaf, Y. Syrian Women and the Refugee Crisis: Surviving the Conflict, Building Peace, and Taking New Gender Roles. Soc. Sci. 2017, 6, 110. [Google Scholar] [CrossRef] [Green Version]
Figure 1.
Location of Jariban District.


Table 1.
Infrastructure cost assumptions.
| Calculation Standard | Source |
|---|---|
| Single improved and ventilated toilet to serve a maximum of 20 people | Sphere 2018 |
| Cost of constructing an improved ventilated latrine being USD600 | UNOPS, 2008 |
| Water supply system; Mechanized borehole piped system (solar/grid power or generator) being USD200.000 | UNOPS, 2008 |
| A borehole can be sustained between 10 and 20 years with essential maintenance | UNOPS, 2008 |
Table 2.
Expected population for the period 2020–2024.
| Village Name | 2019 Population | Projected Population Based on 3% Growth Rate from the Base Year | ||||
|---|---|---|---|---|---|---|
| 2020 | 2021 | 2022 | 2023 | 2024 | ||
| Malaasle | 2424 | 2497 | 2572 | 2649 | 2728 | 2810 |
| Qalaanqal | 1600 | 1648 | 1697 | 1748 | 1801 | 1855 |
| Raydable | 2072 | 2134 | 2198 | 2264 | 2332 | 2402 |
| Salax | 9352 | 9633 | 9922 | 10,219 | 10,526 | 10,842 |
| Balibusle | 29,538 | 30,424 | 31,337 | 32,277 | 33,245 | 34,243 |
| Buubi | 2975 | 3064 | 3156 | 3251 | 3348 | 3449 |
| Ceelbardaale | 2200 | 2266 | 2334 | 2404 | 2476 | 2550 |
| Seemade | 15,200 | 15,656 | 16,126 | 16,609 | 17,108 | 17,621 |
| Booc | 3040 | 3131 | 3225 | 3322 | 3422 | 3524 |
| Mareer | 4060 | 4182 | 4307 | 4436 | 4570 | 4707 |
| Kulub | 2625 | 2704 | 2785 | 2868 | 2954 | 3043 |
| Dhinowda | 17,850 | 18,386 | 18,937 | 19,505 | 20,090 | 20,693 |
| Ilfoocshe | 3710 | 3821 | 3936 | 4054 | 4176 | 4301 |
| Galxagar | 6660 | 6860 | 7066 | 7278 | 7496 | 7721 |
| Dhobocantug | 3900 | 4017 | 4138 | 4262 | 4389 | 4521 |
| Labilamane | 3000 | 3090 | 3183 | 3278 | 3377 | 3478 |
| Mayle | 4240 | 4367 | 4498 | 4633 | 4772 | 4915 |
| Caracaso | 840 | 865 | 891 | 918 | 945 | 974 |
| Hayaanle | 1860 | 1916 | 1973 | 2032 | 2093 | 2156 |
| Total | 117,146 | 120,660 | 124,280 | 128,009 | 131,849 | 135,804 |
Table 3.
Latrines and water sources 2019 stock based on transect walk.
| Village Name | Available Latrines | Available Boreholes |
|---|---|---|
| Malaasle | 34 | 0 |
| Qalaanqal | 15 | 0 |
| Raydable | 42 | 0 |
| Salax | 291 | 1 |
| Balibusle | 800 | 3 |
| Buubi | 80 | 1 |
| Ceelbardaale | 1 | 1 |
| Seemade | 267 | 1 |
| Booc | 6 | 0 |
| Mareer | 12 | 0 |
| Kulub | 35 | 0 |
| Dhinowda | 20 | 0 |
| Ilfoocshe | 1 | 0 |
| Galxagar | 28 | 0 |
| Dhobocantug | 30 | 0 |
| Labilamane | 120 | 0 |
| Mayle | 70 | 0 |
| Caracaso | 8 | 0 |
| Hayaanle | 15 | 0 |
Table 4.
Required latrines for the period 2020–2024.
| Village Name | 2020 | 2021 | 2022 | 2023 | 2024 |
|---|---|---|---|---|---|
| Malaasle | 91 | 38 | 4 | 4 | 4 |
| Qalaanqal | 67 | 17 | 3 | 3 | 3 |
| Raydable | 65 | 45 | 3 | 3 | 3 |
| Salax | 191 | 305 | 15 | 15 | 16 |
| Balibusle | 721 | 846 | 47 | 48 | 50 |
| Buubi | 73 | 85 | 5 | 5 | 5 |
| Ceelbardaale | 112 | 4 | 4 | 4 | 4 |
| Seemade | 516 | 290 | 24 | 25 | 26 |
| Booc | 151 | 11 | 5 | 5 | 5 |
| Mareer | 197 | 18 | 6 | 7 | 7 |
| Kulub | 100 | 39 | 4 | 4 | 4 |
| Dhinowda | 899 | 48 | 28 | 29 | 30 |
| Ilfoocshe | 190 | 7 | 6 | 6 | 6 |
| Galxagar | 315 | 38 | 11 | 11 | 11 |
| Dhobocantug | 171 | 36 | 6 | 6 | 7 |
| Labilamane | 35 | 125 | 5 | 5 | 5 |
| Mayle | 148 | 77 | 7 | 7 | 7 |
| Caracaso | 35 | 9 | 1 | 1 | 1 |
| Hayaanle | 81 | 18 | 3 | 3 | 3 |
| Total | 4158 | 2056 | 187 | 191 | 197 |
Table 5.
Required boreholes for the period 2020–2024.
| Village Name | Available Boreholes | Required Boreholes |
|---|---|---|
| Malaasle | 0 | 1 |
| Qalaanqal | 0 | 1 |
| Raydable | 0 | 1 |
| Salax | 1 | 0 |
| Balibusle | 3 | 0 |
| Buubi | 1 | 0 |
| Ceelbardaale | 1 | 0 |
| Seemade | 1 | 0 |
| Booc | 0 | 1 |
| Mareer | 0 | 1 |
| Kulub | 0 | 1 |
| Dhinowda | 0 | 1 |
| Ilfoocshe | 0 | 1 |
| Galxagar | 0 | 1 |
| Dhobocantug | 0 | 1 |
| Labilamane | 0 | 1 |
| Mayle | 0 | 1 |
| Caracaso | 0 | 1 |
| Hayaanle | 0 | 1 |
Table 6.
Consolidated WASH infrastructure costs estimate for the period 2020–2024.
| Village Name | 2020 (USD $) | 2021 (USD $) | 2022 (USD $) | 2023 (USD $) | 2024 (USD $) |
|---|---|---|---|---|---|
| Malaasle | 254,502 | 25,147 | 4814 | 4884 | 4955 |
| Qalaanqal | 240,440 | 12,983 | 4028 | 4074 | 4121 |
| Raydable | 238825 | 29,621 | 4478 | 4538 | 4599 |
| Salax | 146,485 | 188,269 | 13,929 | 14,197 | 14,473 |
| Balibusle | 736,966 | 512,382 | 33,203 | 36,549 | 37,421 |
| Buubi | 243,928 | 53,258 | 5341 | 5426 | 5514 |
| Ceelbardaale | 267,380 | 5139 | 4601 | 4664 | 4729 |
| Seemade | 509,480 | 179,290 | 17,013 | 19,949 | 20,397 |
| Booc | 290,336 | 8918 | 5403 | 5490 | 5579 |
| Mareer | 318,254 | 13,464 | 6377 | 6493 | 6613 |
| Kulub | 260,113 | 25,933 | 5006 | 5082 | 5159 |
| Dhinowda | 662,135 | 36,047 | 22,043 | 25,055 | 25,581 |
| Ilfoocshe | 314,039 | 6539 | 6042 | 6149 | 6258 |
| Galxagar | 388,994 | 25,474 | 8859 | 9050 | 9246 |
| Dhobocantug | 302,510 | 24,115 | 6224 | 6335 | 6451 |
| Labilamane | 220,700 | 77,281 | 5364 | 5450 | 5539 |
| Mayle | 289,016 | 48,430 | 6548 | 6670 | 6795 |
| Caracaso | 221,156 | 8079 | 3302 | 3326 | 3351 |
| Hayaanle | 248,474 | 13,224 | 4276 | 4329 | 4384 |
| Totals | 6,153,731 | 1,293,594 | 166,852 | 177,708 | 181,164 |
Table 7.
Key themes on the source of funds and community contributions from Focus Group Discussions.
Table 7.
Key themes on the source of funds and community contributions from Focus Group Discussions.
| Village Code | The Perceived Main Sources of Funding for WASH | Expected Community Contribution to WASH Projects | |||||
|---|---|---|---|---|---|---|---|
| NGO | Diaspora | Household | Stones | Sand | Pit digging | Masonry | |
| Me1 | √ | √ | √ | √ | |||
| Mel2 | √ | √ | √ | √ | |||
| Ql1 | √ | √ | √ | √ | √ | √ | |
| Ql2 | √ | √ | √ | √ | √ | ||
| Re1 | √ | √ | √ | √ | |||
| Re2 | √ | √ | √ | √ | |||
| Sx1 | √ | √ | √ | √ | √ | √ | |
| Sx2 | √ | √ | √ | √ | √ | √ | |
| Be1 | √ | √ | √ | √ | √ | √ | √ |
| Be2 | √ | √ | √ | √ | √ | √ | |
| Bi1 | √ | √ | √ | √ | √ | ||
| Bi2 | √ | √ | √ | √ | √ | √ | |
| Ce1 | √ | √ | √ | √ | |||
| Ce1 | √ | √ | √ | √ | |||
| Se1 | √ | √ | √ | √ | |||
| Se2 | √ | √ | √ | ||||
| Bc1 | √ | √ | √ | √ | √ | √ | |
| Bc2 | √ | √ | √ | √ | √ | √ | |
| Mr1 | √ | √ | √ | √ | √ | ||
| Mr2 | √ | √ | √ | √ | √ | ||
| Kb1 | √ | √ | √ | ||||
| Kb2 | √ | √ | √ | ||||
| Da1 | √ | √ | √ | √ | √ | √ | |
| Da2 | √ | √ | √ | √ | √ | ||
| Ie1 | √ | √ | √ | ||||
| Ie2 | √ | √ | √ | √ | |||
| Gr1 | √ | √ | √ | √ | √ | ||
| Gr2 | √ | √ | √ | √ | √ | ||
| Dg1 | √ | √ | √ | ||||
| Dg2 | √ | √ | √ | √ | |||
| Le1 | √ | √ | √ | √ | √ | ||
| Le2 | √ | √ | √ | √ | √ | ||
| Me1 | √ | √ | √ | ||||
| Me2 | √ | √ | √ | ||||
| Co1 | √ | √ | √ | √ | √ | ||
| Co2 | √ | √ | √ | √ | √ | ||
| He1 | √ | √ | √ | ||||
| He2 | √ | √ | √ | ||||
| Total | 38 | 24 | 08 | 38 | 38 | 20 | 07 |
Table 8.
Community versus external contributions to latrine constructions based on UNOPS infrastructure costings.
Table 8.
Community versus external contributions to latrine constructions based on UNOPS infrastructure costings.
| Community Contributions | Cost (USD) | NGOs Contributions | Cost (USD) |
|---|---|---|---|
| Clearing of 9 m2 of land | 9 | Slab construction | 114 |
| Excavation of 9 m2 | 70 | Hollow block and footrest | 171 |
| Foundation excavation | 23 | Lintel | 29 |
| Masonry stone | 15 | Vent pipes and mesh wire | 30 |
| Sand | 27 | Toilet seat, plastering and floors | 60 |
| Hardcore filling | 6 | Roofing and timber | 46 |
| Total | 150 | 450 |
Publisher’s Note: MDPI stays neutral with regard to jurisdictional claims in published maps and institutional affiliations. |
© 2021 by the authors. Licensee MDPI, Basel, Switzerland. This article is an open access article distributed under the terms and conditions of the Creative Commons Attribution (CC BY) license (http://creativecommons.org/licenses/by/4.0/).
Share and Cite
MDPI and ACS Style
Mafuta, W.; Zuwarimwe, J.; Mwale, M. WASH Financial and Social Investment Dynamics in a Conflict-Arid District of Jariban in Somalia. Sustainability 2021, 13, 4836. https://0-doi-org.brum.beds.ac.uk/10.3390/su13094836
AMA Style
Mafuta W, Zuwarimwe J, Mwale M. WASH Financial and Social Investment Dynamics in a Conflict-Arid District of Jariban in Somalia. Sustainability. 2021; 13(9):4836. https://0-doi-org.brum.beds.ac.uk/10.3390/su13094836
Chicago/Turabian StyleMafuta, Wonder, Jethro Zuwarimwe, and Marizvikuru Mwale. 2021. "WASH Financial and Social Investment Dynamics in a Conflict-Arid District of Jariban in Somalia" Sustainability 13, no. 9: 4836. https://0-doi-org.brum.beds.ac.uk/10.3390/su13094836
Note that from the first issue of 2016, this journal uses article numbers instead of page numbers. See further details here.