
Local and Application-Specific Geodemographics for Data-Led Urban Decision Making


1
School of Geography, University of Leeds, Leeds LS2 9JT, UK
2
Leeds Institute for Data Analytics, University of Leeds, Leeds LS2 9LU, UK
*
Author to whom correspondence should be addressed.
Sustainability 2021, 13(9), 4873; https://0-doi-org.brum.beds.ac.uk/10.3390/su13094873
Submission received: 31 March 2021
/
Revised: 20 April 2021
/
Accepted: 20 April 2021
/
Published: 26 April 2021
(This article belongs to the Special Issue Advanced Modelling Tools to Support Urban and Regional Planning)
Abstract
:This work seeks to introduce improvements to the traditional variable selection procedures employed in the development of geodemographic classifications. It presents a proposal for shifting from a traditional approach for generating general-purpose one-size-fits-all geodemographic classifications to application-specific classifications. This proposal addresses the recent scepticism towards the utility of general-purpose applications by employing supervised machine learning techniques in order to identify contextually relevant input variables from which to develop geodemographic classifications with increased discriminatory power. A framework introducing such techniques in the variable selection phase of geodemographic classification development is presented via a practical use-case that is focused on generating a geodemographic classification with an increased capacity for discriminating the propensity for Library use in the UK city of Leeds. Two local classifications are generated for the city, one a general-purpose classification, and the other, an application-specific classification incorporating supervised Feature Selection methods in the selection of input variables. The discriminatory power of each classification is evaluated and compared, with the result successfully demonstrating the capacity for the application-specific approach to generate a more contextually relevant result, and thus underpins increasingly targeted public policy decision making, particularly in the context of urban planning.
1. Introduction
The composition of urban societies can have a direct impact on the growth and evolution of cities. Therefore, it follows that an ability to identify and describe societal compositions within urban environments is crucial in effectively modelling, predicting and managing such an evolution. Naturally, this ability is of significant interest and potential benefit to the public sector. Like many local authorities, Leeds City Council (LCC) have been seeking data-led strategies to derive a clear and holistic understanding of the resident population in their city with which to inform and develop intelligent responses to to social, environmental, and economic challenges facing the city [1].
Though geographically small relative to other large cities in the UK, Leeds, located in the North of England, has a growing population of over 790,000 residents. The population is ethnically diverse, with around 20% of residents identifying as an ethnic minority [2], and it hosts a large population of current students, recent graduates, and alumni of its five universities. Its physical boundary encompasses a varied geography, comprising a multicultural city-centre in addition to suburban and exurban districts, including a rural fringe of market towns. The city has also experienced considerable urban restructuring, which has affected the composition of the underlying residential structure, as reflected in reports of a recent increased popularity of city-centre living [3].
The socio-economic sustainability of UK cities, and the lived experiences of their resident populations, are both closely linked to public policy and planning decisions. Being stretched by increasing demand and decreasing budgets, and the continued evolution of the local population and infrastructure, LCC require quantitative modelling techniques that are capable of providing local and bespoke insights to generate improved decision making practices, namely in the development of policy and targeted strategies for the allocation of public sector resources and services. As such, LCC have turned to geodemographic classifications, a popular and convenient way of summarising small area populations, in order to support more targeted data-led decision making, urban planning, and policy development. Geodemographic classifications offer a taxonomy with which to profile local populations and to geographically predict social phenomena based on observed outcomes in similarly classified areas. In their application, a relationship is inferred between the input characteristics of the classification upon which the groupings are based and the outcome for which they are being used to predict. However, because classifications are traditionally developed application agnostic, there is no such guarantee in every application. There is no reason why geodemographic classifications which are derived from input variables which have been selected without a specific purpose should generate universally meaningful clusters, or are necessarily discriminative in a way that can differentiate the population to reflect the spatial patterns of any given phenomena [4,5]. Thus, further benefits might be gained from developing and adopting more relevant and appropriately derived classifications, generated with an increased consideration for the context of their subsequent use [6].
Therefore, this research focuses on developing a new framework for developing application-specific classifications by introducing supervised machine learning into the selection of input variables upon which the classification is developed. Such an approach offers a more contextual consideration of candidate input variables and, in doing so, identifies variables with an increased relevance with respect to a specific application. As a practical demonstration, a use case is presented here that generates an application specific classification grouping the population of Leeds more targetedly, based on propensity for library use, generating a much needed metric to support informed decision making in this domain. This work is drawn as an example case study from a larger piece of work focusing on the development of bespoke local and application specific geodemographics [7].
Libraries are a specific planning priority for LCC. Whilst they are recognised as a vital community resource offering a range of important services [8], they have been at increasing risk of closure as local government budgets decrease. This threat has led to unsuccessful petitions to ringfence UK government funding to protect library services, and a re-emphasis on the responsibility of local government to make intelligent spending decisions with regards to public libraries, based on local requirements [9]. In addition, further budget strains that were introduced by the Coronovirus pandemic have put all Leeds public libraries at imminent risk of closure [10]. Despite its importance, a fragmentation within the sector leading to poor national data availability has limited intelligence relating to the community value and the use of libraries with which to support such intelligent decision making processes regarding the provision of public library services [11], substantially hampering evidence based decision making and provision planning capabilities at this crucial time. Moreover, Roumpani et al. ’s [11] research particularly points to understanding the differentiation of library use by different societal groups as a key priority area.
Being uninhibited by the national level data issues, the LCC hold local level library use data that are used here in the selection of relevant population attribute variables to develop a classification that more capably captures the spatial patterns in propensity for library use across the city. In doing so, the research that is presented here proposes possible alterations to the traditional framework for developing geodemographics to enable such a shift towards application-led classifications, led my a more objective methodology for selecting relevant input variables, specifically, by adopting supervised Feature Selection techniques, to produce more meaningful classifications for better informing public sector decisions. The next section outlines the traditional approach to developing classifications and the appetite for more bespoke development, followed in the subsequent sections by a proposed methodology for practically implementing an application focused shift in classification development and a demonstration of the proposed process in the context of the library case study.
2. Background
2.1. The Role of Geodemographic Classifications in Targeted Local Public Sector Urban Planning
To capture the complex social dimensions which define the holistic character of an area, it is necessary to consider a multivariate analysis of the dimensions of the population [12]. Geodemographic classifications present a tangible method for modelling complex urban systems, detecting a geographically defined social identity by pinpointing the distinguishing characteristics of the resident populations within small-area geographies and conveniently summarising the complexity. In practice, small-area geographies are ordered into distinct and exhaustive category groups, typically through scientific clustering methods evaluating prominent shared area characteristics and attributes [13,14]. The resulting classifications offer a single, surrogate social measure for each small-area geography, facilitating a broader understanding of underlying socio-spatial patterns and offering a lens through which to identify structures within the population and generate insights with which to inform urban planning decisions [15,16].
This potential for using geodemographic classifications to derive insight, and the versatility of the approach, have promoted its employment in a broad range of applications across academia and the public and private sectors, alike. In particular, recent public service reform and new local agendas, combined with pressure on local government to deliver demonstrable returns on their investments [17], have boosted the use of geodemographics in the public sector, generating a "renaissance” in applied social research [4,18]. Efforts to adopt best practice demonstrated in the commercial sector, and reap benefits from the intelligence offered [19], have propagated a fresh growth in interest in academic study and the public sector [20,21]. Consequently, geodemographics are now positioned as a key component in insight generation [22], particularly with regards to informing planning decisions in health, crime, and education [23].
Applications of geodemographic classifications have become particularly essential in local government activity, including within LCC, as increasing devolution raises expectations for more autonomous decision making. Employing what Longley [24] describes as a "localism agenda” is difficult without a solid understanding of the population, including insights into the unique social structures present within each city. Treating the public as consumers of public services [20], local government analysts have adopted methodology supported by geodemographic classifications, traditionally used to predict consumer behaviour, to instead highlight the composition of demand for public sector services and resources, and derive insights with which to inform local government policy development [4,25]. Such "social marketing initiatives” [26] have helped local policy-makers to gauge social attitudes, and more intelligently develop strategies for service delivery and target the allocation of public sector services and resources [24].
2.2. Limitations of Traditional Practices in Geodemographic Classification Development
Applications of geodemographic classifications typically adopt one of two main approaches. The first takes the classification of each area as a base profile for that area, to which ancillary data are appended to develop a richer profile based on a broader set of characteristics [27]. This is often used to develop and map rich profiles of populations which show spatial patterns and public phenomena, for example, developing profiles of health behaviours and associated outcomes to provide intelligence in decision making processes. The second uses the classification as a metric in subsequent analysis that is aimed at illustrating and understanding the propensities for different social phenomena across geographies and to identify areas of the greatest need [23], for example, in spatial analysis of crime [19,28], poor health outcomes or disease risk [29,30,31,32], public transport use [33], road traffic collisions [34], participation in Higher Education and educational attainment [23,27], fire safety [35], and the use of public sector services [23,36].
Traditionally, geodemographic classifications are derived at a national extent as general-purpose, standalone descriptors of small-area geographies [37]. In the UK, this means assigning all small-area geographies within, however these are defined, to one of a finite set of nationally derived application agnostic labels. Although this is the well-established practice, recommendations for shifting towards locally focused classifications that are generated with a specific purpose in mind are increasingly gaining momentum. In relation to the geographic extent, several academics have suggested that the national extent, at which classifications have been traditionally derived, could fail to identify, or may even mask, local nuance and population patterns that are uniquely present in particular regions [13,14]. This could result in a loss of critical, locally relevant information, particularly in small-area geographies that diverge from the national picture, and impose restrictions on the ability to derive the level of local context which is required for successful targeted application in the public sector. Particularly, this is noted as being a potentially more acute problem in large cities with distinct make-up [14,26], such as Leeds, and as such, recommendations to explore the development of more local, place-specific classifications which are designed to more appropriately reflect locally specific phenomena are growing [14,18,22]. In addition, whilst place-specific alternatives have the potential to offer more nuanced local classifications, the more granular and focused extent simultaneously introduces the possibility of including more novel and bespoke local data into such classification development, particularly data that are only available at the local level and, as such, have been excluded from inclusion in the national-level classifications, which have necessitated consistent data across the extent.
In relation to the purpose of the classification development, there is a lively debate in the literature regarding the appropriateness and relevance of general-purpose classifications [38], and their ability to discern social patterns with the necessary nuance to underpin important policy decision and action [39]. All the applications of general-purpose classifications, as described above, are predicated by an assumption that a relationship exists between the classification outputs and the phenomena about which they are employed to derive insights. However, there is no reason why geodemographic classifications that are derived from input variables that have been selected without a specific purpose should be universally meaningful in all applications, or are necessarily discriminative in a way that can differentiate the population to reflect the spatial patterns of any given social behaviour or phenomena [4,5] or be relevant in determining any insights about the behaviour or phenomena [40]. As such, there is debate as to whether it makes sense that general-purpose classifications are transferable to all situations, and will offer meaningful insights in each circumstance [41]. To this end, Longley [20] mused whether some classifications might be more reliable in some domains, and in evaluating particular behaviours over others. However, he noted that the limited investigations that are available in the literature restrict the definitive drawing of such a conclusion. Moreover, if the classification is nevertheless used in such a way, the potential for generating misleading insights could be introduced. Consequently, suggestions that generic classifications may not be universally applicable have led to an increasing trend over the past two decades for the development of domain-specific classifications, from both the commercial suppliers and academia [37,41].
3. Proposed Alternatives to the Traditional Geodemographic Classification Development Framework
The development of a good classification will always be dependent on the initial set of candidate variables being useful and meaningful in the first place. In the current academic examples, general-purpose and domain specific classification development procedures are typically differentiated by the focus of their input data, with the latter undergoing a more context specific selection process. However, there exists no objective method for the selection of the input variables in classification development, whether general-purpose or domain-specific. Instead, the empirical selection processes adopted rely on expert knowledge, experience, available data, or simply gut instinct [42]. Such a subjective approach to variable selection risks misrepresentation, bias, or the generation of unsuitable groupings that are based on noisy or irrelevant variables. For example, the clustering algorithms that underpin the development of the classifications will identify the ‘best’ groupings of the small-area geographies based on a mathematical optimisation process; however, the areas could have been grouped differently based on different input variables [37,43]. Therefore, it is critical that input variables are selected for their ability to generate relevant and meaningful groups, which has led to renewed exploration of variable selection procedures [44]. Yet, despite this, no examples in either the academic or the commercial literature have been found which suggest that any methods are employed at this stage for evaluating the contextual relevance or appropriateness of the input variables chosen. The stakes that are associated with analysis in the public sector, which could have real-world consequences in the lives of the population, require confidence in decisions made and actions taken [18,24], thus confidence in the metrics employed in public sector policy and development of targeted planning strategies is desirable at the outset.
In the present era of using Machine Learning (ML) methods for drawing insights from "big data”, the research presented here seeks inspiration from other fields beyond geodemographic classification development. In other predictive methods, the outcome of interest often acts as the starting point, data permitting, and insights are learned from observations of the outcome to underpin the subsequent prediction. This paper proposes a similar approach to generate application-specific geodemographic classifications, an extension of the existing concept of domain-specific classifications. This approach considers a single application for which a classification might typically be used to assist in making predictions that are related to the propensity of a particular outcome and uses observations of the outcome to intelligently inform a variable selection procedure, the product of which is used to generate a classification with an improved ability to differentiate the population with relation to the outcome of interest, thus contextualising the classification and increasing its relevance in its subsequent application. The end objective is to develop a classification with increased spatial intelligence that is related to an observable outcome. This proposal flips the role of geodemographic applications from a ‘one-size-fits-all’ approach applied as a solution to all problems, to take a problem centred approach in the development of a problem-focused solution. Taking an observable outcome as a dependent input, the selection of variables can be made by prioritising variables that have the strongest associations with the observable outcome. This presents an opportunity to incorporate domain knowledge and generate a final variable set which is extremely application specific [45]. The approach is theoretically similar to the current practice; however, instead of the existing reliance on domain knowledge to support a subjective selection, the manual selection process is replaced by an application of supervised ML in the form of a Feature Selection (FS) technique.
In the presented case study, the method used adopts principles fundamental to FS applications in prediction analysis, seeking to identify contextually relevant variables by prioritising variables with the greatest relationship to library use, whilst simultaneously reducing redundancy [45,46]. This supervised ML technique is explored for its potential to select a variable subset with the capacity to derive contextually discriminant clusters in a subsequent k-means analysis [45,47], thus generating geodemographic classifications which more intentionally differentiates the population when compared to general-purpose classifications and, thus, benefits from improved predictive power, in this case, in relation to understanding the propensity for library use. Whilst this example is focused on library use, this case study acts as a practical demonstration of the potential of such a methodology, which could be widely applied to any number of other application cases in urban planning and beyond.
In this case study, attribute variables for the population of Leeds are selected based on their relationship with library usage and are subsequently input into a k-means clustering algorithm to develop a local, Leeds-specific geodemographic classification that aimed for planning library provision in the city. This example illustrates a practical use-case for the proposed approach in a real-world urban planning context, demonstrating its potential to derive improved insights beyond the capacity of a general-purpose classification. No examples of supervised ML methods being used in the selection of input variables for geodemographic classifications have been identified in the literature, especially with respect to local-level application specific classifications.
4. Data and Methods
Two place-specific geodemographic classifications for Leeds have been derived and compared for their ability to differentiate the population of Leeds based on library use. The first is a general-purpose classification, and the second has been derived based on the Machine Learning variable selection techniques that were discussed in the previous section. Both aggregate and classify the Leeds population at the Output Area (OA) level, the smallest geography at which the aggregate data from the census are released [48].
The first classification is a locally-bespoke adaptation of the 2011 Output Area Classification (OAC), the nationally derived, freely available, census-based geodemographic classification generated by Gale et al. [49]. Replicating the development of the London Specific alternative of the 2011 OAC, as presented in [14], the generation of this first classification directly adopts the data, methodology, and assumptions of the 2011 OAC, on this occasion, exclusively for the 2543 OAs of Leeds. The second classification adopts much of the same methodology; however, it incorporates the FS techniques discussed in the previous section in the variable selection phase of the process. These will henceforth be referred to as Leeds-Specific Output Area Classification (LSOAC) and Feature Selection driven Leeds-Specific Output Area Classification (FSLSOAC), respectively.
4.1. Generating the “LSOAC”
In the construction of the 2011 OAC, 60 input census variables were selected from a candidate set of 167 variables, consistently drawn from across the censuses of England and Wales, Scotland, and Northern Ireland. A subjective application of Pearson correlation analysis and sensitivity testing were employed in the variable selection process. The former was adopted to remove collinear variables and, thus, reduce the potential for over-inflating the importance of such variables, and the latter, to maximise for discriminatory potential and parsimony whilst ensuring a selection broad enough to constitute a fully descriptive general-purpose classification representing demographic, housing and socio-economic attributes [37]. Some highly correlated variables and some with limited or even negative impact in the sensitivity testing were retained, however, at the developers discretion, based on a judgement of their contextual importance. Several composite variables were constructed by combining variables with common denominators, for example, producing age-bands from single age variables, in order to reduce the potential for misleading weighting of these variables and enhance the share of variables with individually low counts [50]. The variables were then converted to percentages to reflect the proportion of the population represented by each attribute in each OA. A population density ratio was calculated, and a Standardised Illness Ratio (SIR) was derived, taking the census count representing Limiting Long-Term Illness (LLTI) in each OA and adjusting for age variation in the population. Finally, the resulting 60 variables were subsequently transformed using an Inverse Hyperbolic Sine (IHS) and range standardised on a scale of 0–1, to normalise the data to a consistent scale, and to account for the impact of varying degrees of skew and outliers found in the data that might affect the quality of the classification, if left unaddressed [51]. A more detailed overview of the entire process, and the rationale behind each decision made, including in the choice of specific transformation processes, which were carefully selected based on tests involving a series of potential alternatives, is outlined in both [49,50]. Table 1 summarises a summary of the final 60 variables resulting from this process.
In adopting these variables to generate the LSOAC, the SIR was re-adjusted to the age variation of the new base population of Leeds, since the original was calculated based on the 2011 OAC base population, the UK, and each variable was re-normalised and re-standardised, based on the same techniques, in order to adjust for the new extent. A k-means clustering process was then applied to the final variable set to generate the classification, again, in line with the k-means application carried out in the development of the 2011 OAC. This process split the data into k homogeneous groups with maximal heterogeneity between the groups, in doing so, identifying structures within the data and generating the output classification groups. Several comprehensive explanations of the process are offered in the literature, including a detailed summary presented in [17]. Three hierarchical cluster applications were carried out in the construction of the 2011 OAC to generate eight Supergroups, 26 Groups, and 76 Subgroups [49]. Because of the limited number of OAs in Leeds, the clustering process was terminated at the Supergroup level here to maintain meaning in the results, which might be eroded with a reduction in group sizes further down the hierarchical process [14]. A solution with eight cluster groups was derived, based on a scree plot analysis. All other parameters of the 2011 OAC clustering methodology were maintained, including an optimisation process selecting the best solution of 10,000 runs as the final result, based on the lowest Total Within Sum of Squares (TWSS) performance as a measure of the best overall closeness, or ‘fit’, of the clusters [14]. Thus, the resulting LSOAC classification presented a benchmark general-purpose classification for the city.
4.2. Generating the “FSLSOAC”
The FSLSOAC adopts the census data preparation and k-means classification processes outlined in the development of the LSOAC above (adopted from the 2011 OAC); however, it incorporates the FS techniques discussed in the previous section in the variable selection phase in place of the Pearson correlation analysis and the sensitivity testing. In order to complete the FS, a set of predictor variables were initially derived from the census data, and a dependent observable outcome variable was derived from library loans data supplied by LCC.
Beginning with the same 167 candidate variables, again filtered for the OAs in the Leeds Local Authority boundary, the predictor variables were derived maintaining as much consistency with the data preparation techniques, detailed above, as possible. Composite variables were once again derived from variables sharing a denominator, as per the process and guidance outlined in [50]. All variables were converted to percentages, except for the variables representing “Density (number of persons per hectare)” and LLTI, from which a population density ratio and an SIR adjusted for the age variation in Leeds were again generated, respectively. A final three non-count variables representing “Area (in hectares)”, "Mean age”, and “Median age”, were removed for a combination of inappropriate unit measurements and redundancy. An IHS normalisation and range standardisation on a 0–1 scale were then applied to the resulting 131 variables, consistent with the transformation procedures in the 2011 OAC and applied to the input variables of the LSOAC, above, generating a final set of 131 predictor variables.
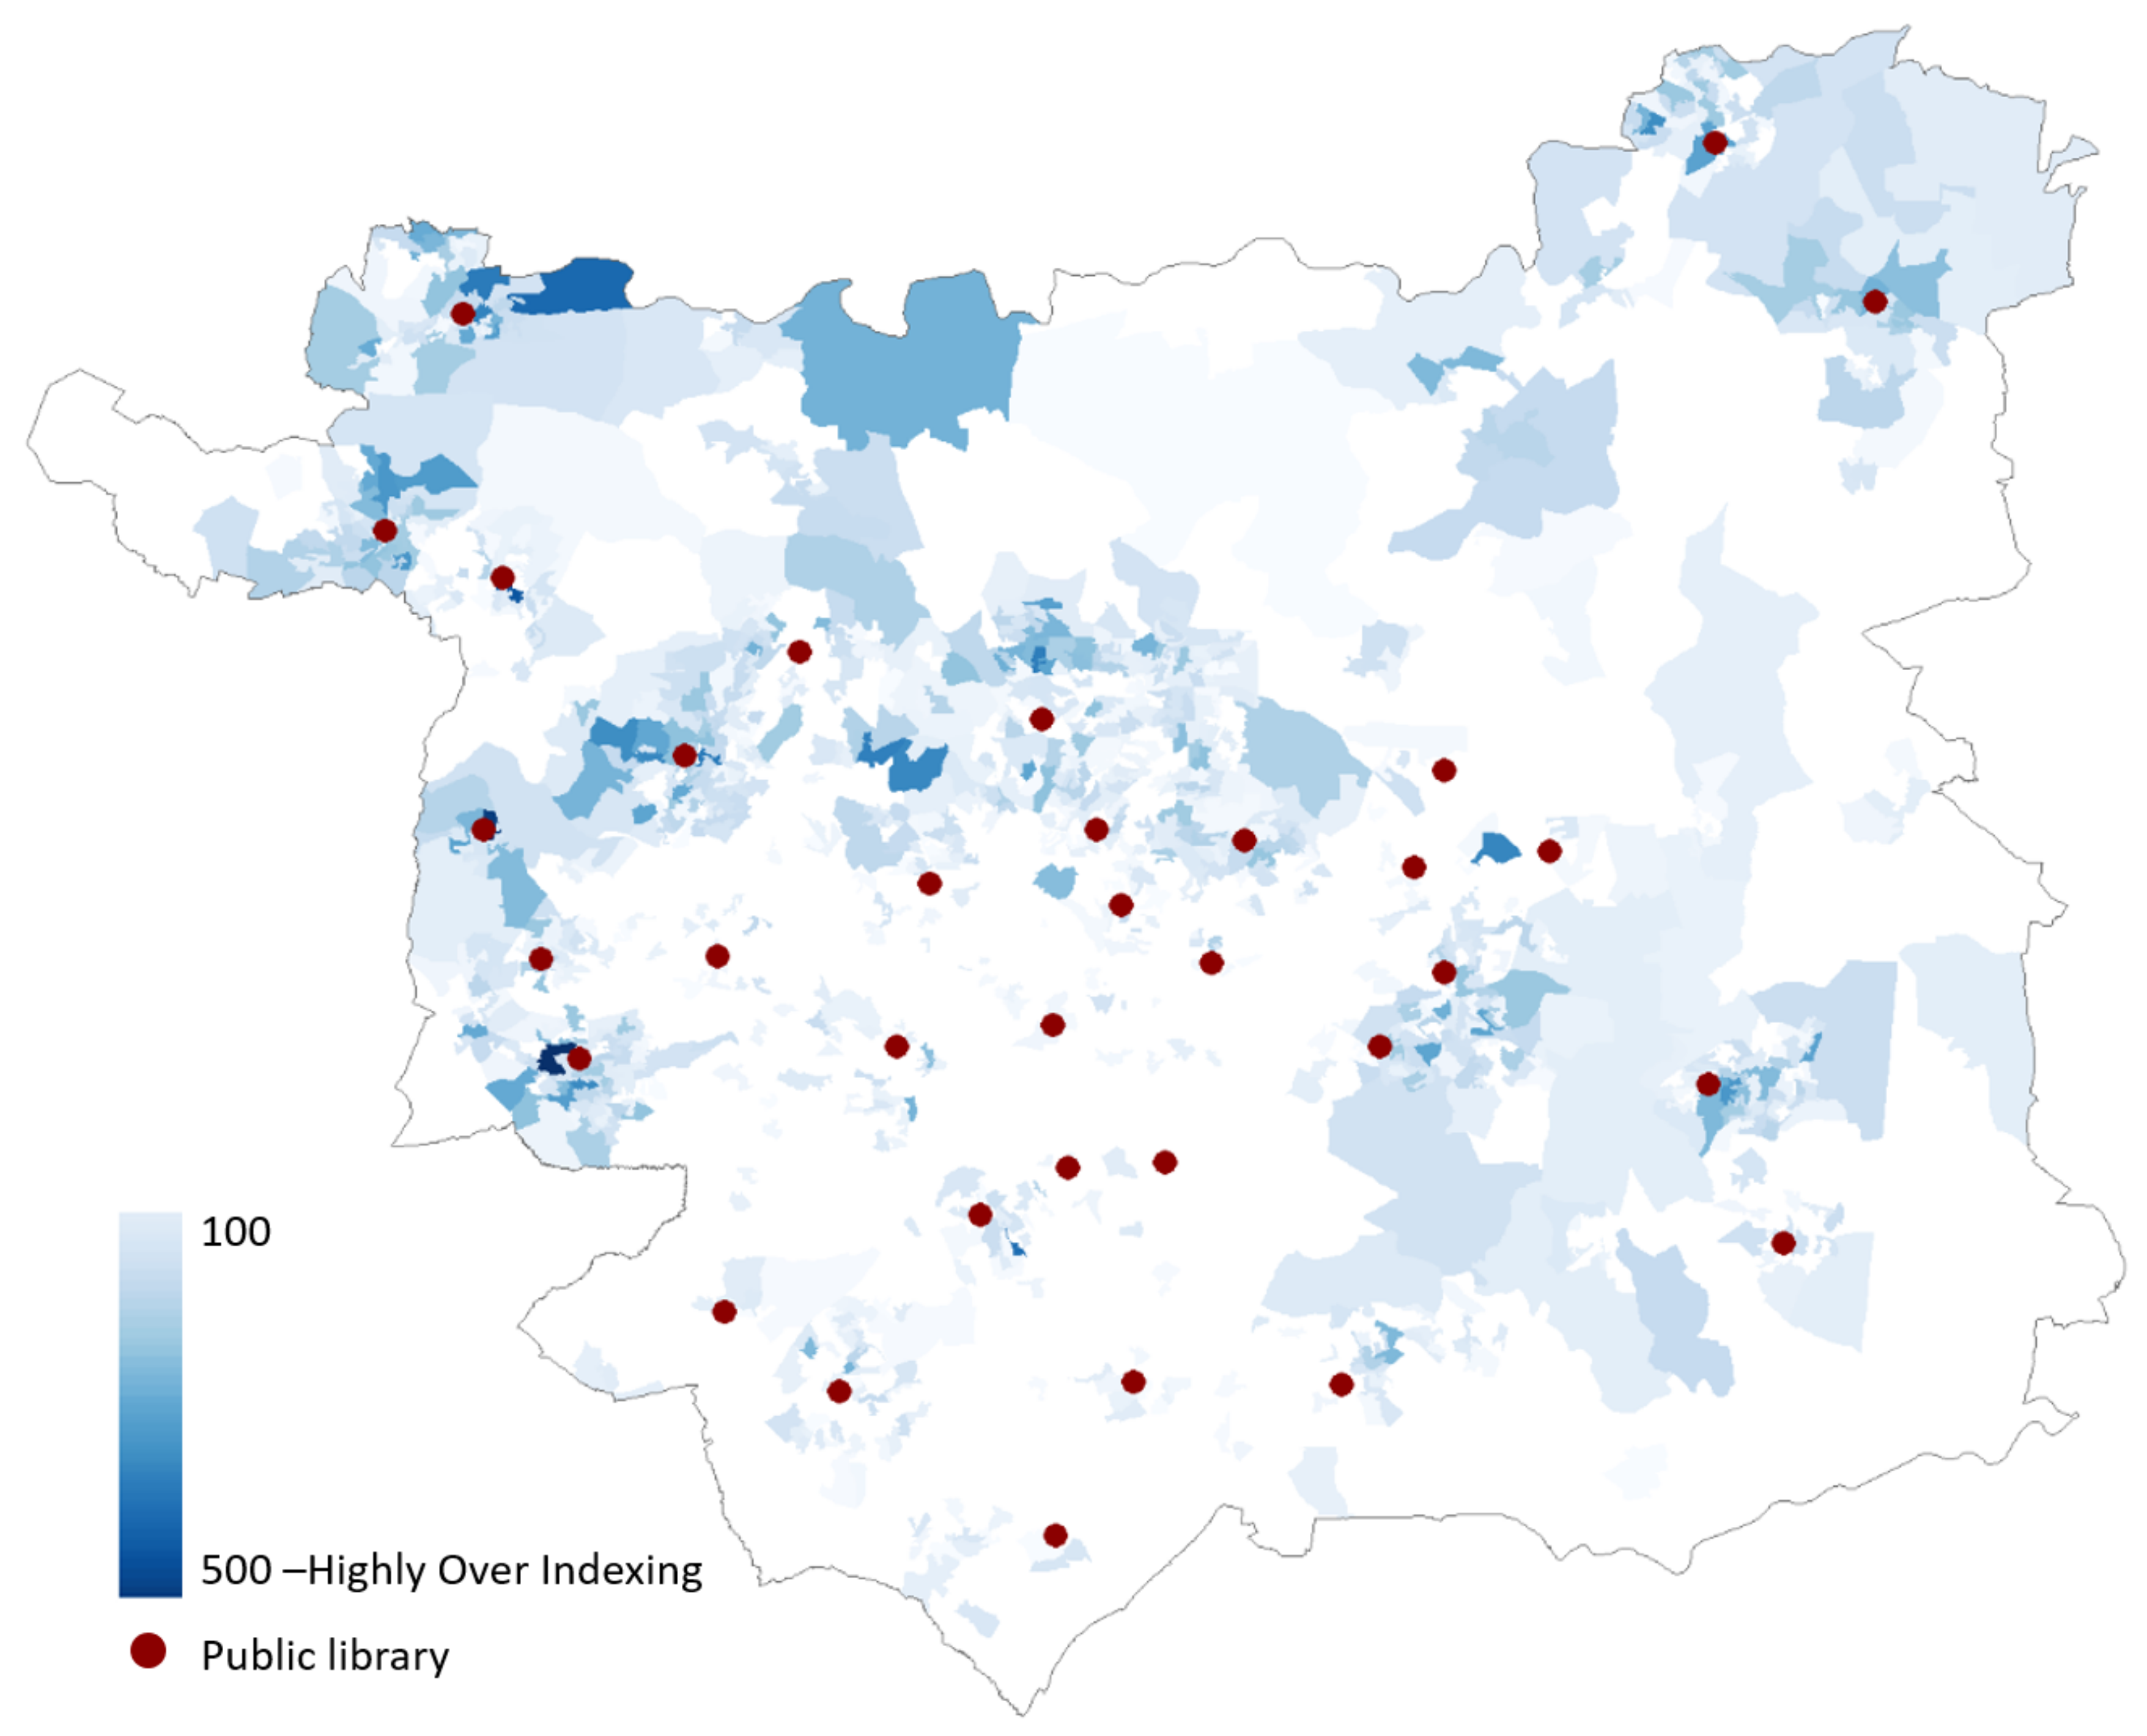
The LCC library loans dataset contained a record of 696,117 library book loans from 257,489 visits from across the 33 public libraries in Leeds, collected between January 2017 and February 2018, inclusive. From this, a dependent variable representing library use was extracted for each OA for inclusion in the FS methodology, based on library loans. Initially, each record in the dataset related to a single book loan, including a timestamp of the transaction, and an OA that is associated with the library user. Distinct transactions were deduced by grouping timestamps and user OAs. Despite the inability to recognise transactions occurring at different times within the same visit as the same visit, or being able to capture visits not resulting in book loans by this, or any other approach, this was judged to be the most reliable measure of library visits based on the data available from LCC’s in-house library management database. From this, a ratio of distinct visits per household was subsequently calculated for each OA based on the "household count” variable for each OA in the 2011 census records, which was adopted as the dependent library use indicator. Figure 1 illustrates the spatial distribution of these visits, as per the OA of the library user, where the ratio generated has been standardised to 100 to demonstrate the OAs which are "over-indexing” (have an index of 100 or higher) and thus account for higher than average library use. Although some relationship seemingly exists between library location and library use, the patterns displayed in Figure 1 suggest that the distance to the nearest library us not the only driver of library use, thus supporting the use of FS techniques based on the library use ratio as the dependent observable outcome, to seek to identify relationships between population attributes and library use.
An application of FS was then made using both the 131 candidate predictor variables and the dependent library use variable to identify the subset of attributes from within the candidate set with the greatest combined relationship to library use, and which were thus highlighted as the best predictors of the propensity for library use resulting in a book loan in a given OA. Thus, this process presented a contextually driven, alternative variable selection process. Popular backwards elimination wrapper method Recursive Feature Elimination (RFE) was adopted as the FS method, being based on a Random Forest regression. Random Forest is a popular ensemble decision tree method with an in-built mechanism for measuring and determining the "importance” of each input variable based on its contribution to the decision tree.
When used for prediction, the target of wrapper methods is to identify a variable set which maximises the accuracy of a final model used to predict the dependent variable, the observable outcome of interest. Such applications have been shown to improve predictor performance beyond the capabilities of simpler methods, such as correlation methods [47,52], as adopted in the development of the LSOAC, above, and the incumbent favoured method of variable selection in geodemographic classification development more widely. Here, its intended target was to similarly maximise the relevance of the variables selected, with relation to the observable outcome [46], offering the potential for selecting a more contextually relevant variable set for input into the development of the FSLSOAC, in order to generate a classification which more meaningfully differentiated the population based on such a propensity for library use. Gregorutti et al. [47] broadly summarise the process in four main steps, which are iteratively performed until a solution is reached, (1) train the Random Forest; (2) compute the importance of the predictor variables; (3) eliminate the least important variables; and, (4) Repeat steps 1–3 until there remain no further variables to remove. Since it is a backwards elimination method, the process begins by including all variables, evaluating the importance of each of the candidate predictor variables with respect to the observed outcome of interest, the dependent variable, and removing the least important on each run through until an optimal subset is identified. Whilst several alternative FS methods could have been adopted, RFE capably handles correlated variables, particularly when compared to a standard RF approach [47]. Since the correlations present among the candidate predictor variables were not addressed prior to input, an RFE was judged to be an appropriate choice.
Table 2 outlines the FS process performed. The predictor data was randomly split into training and test data subsets based on a standard ratio of 2:1. The important predictor variables are first identified in the training set, iteratively re-sampling further subsets from the training data using a 10-fold cross-validation to mitigate against the risks of overfitting to the training data. Tests of 46 subsets were run in each re-sample, of sizes 2, 3, 4, 5, 6, 7, 8, 9, 10, 11, 12, 13, 14, 15, 16, 17, 18, 19, 20, 21, 22, 23, 24, 25, 30, 35, 40, 45, 50, 55, 60, 65, 70, 75, 80, 85, 90, 95, 100, 105, 110, 115, 120, 125, 130, and 131, demonstrating complete enumeration of the smaller subsets and groups of five for the larger ones, based on a likelihood of the importance added by each new variable being greater with smaller numbers of subsets, so warranting a more granular evaluation. In order to further reduce the risk of error and increase the robustness of the analysis, this process was repeated five times with the mean result taken as final. This analysis was performed using the rfFuncs function in the caret package in R, the statistical computing language, which supports the execution of RFE with the custom parameters detailed.
The census variables identified in the subset of important predictor variables via the RFE were then used as inputs into the k-means algorithm to derive the final FSLSOAC classification. Again, eight classification groups were identified for consistency with the LSOAC and to enable comparison between the two classifications. All other parameters were also maintained.
5. Results
5.1. RFE Result
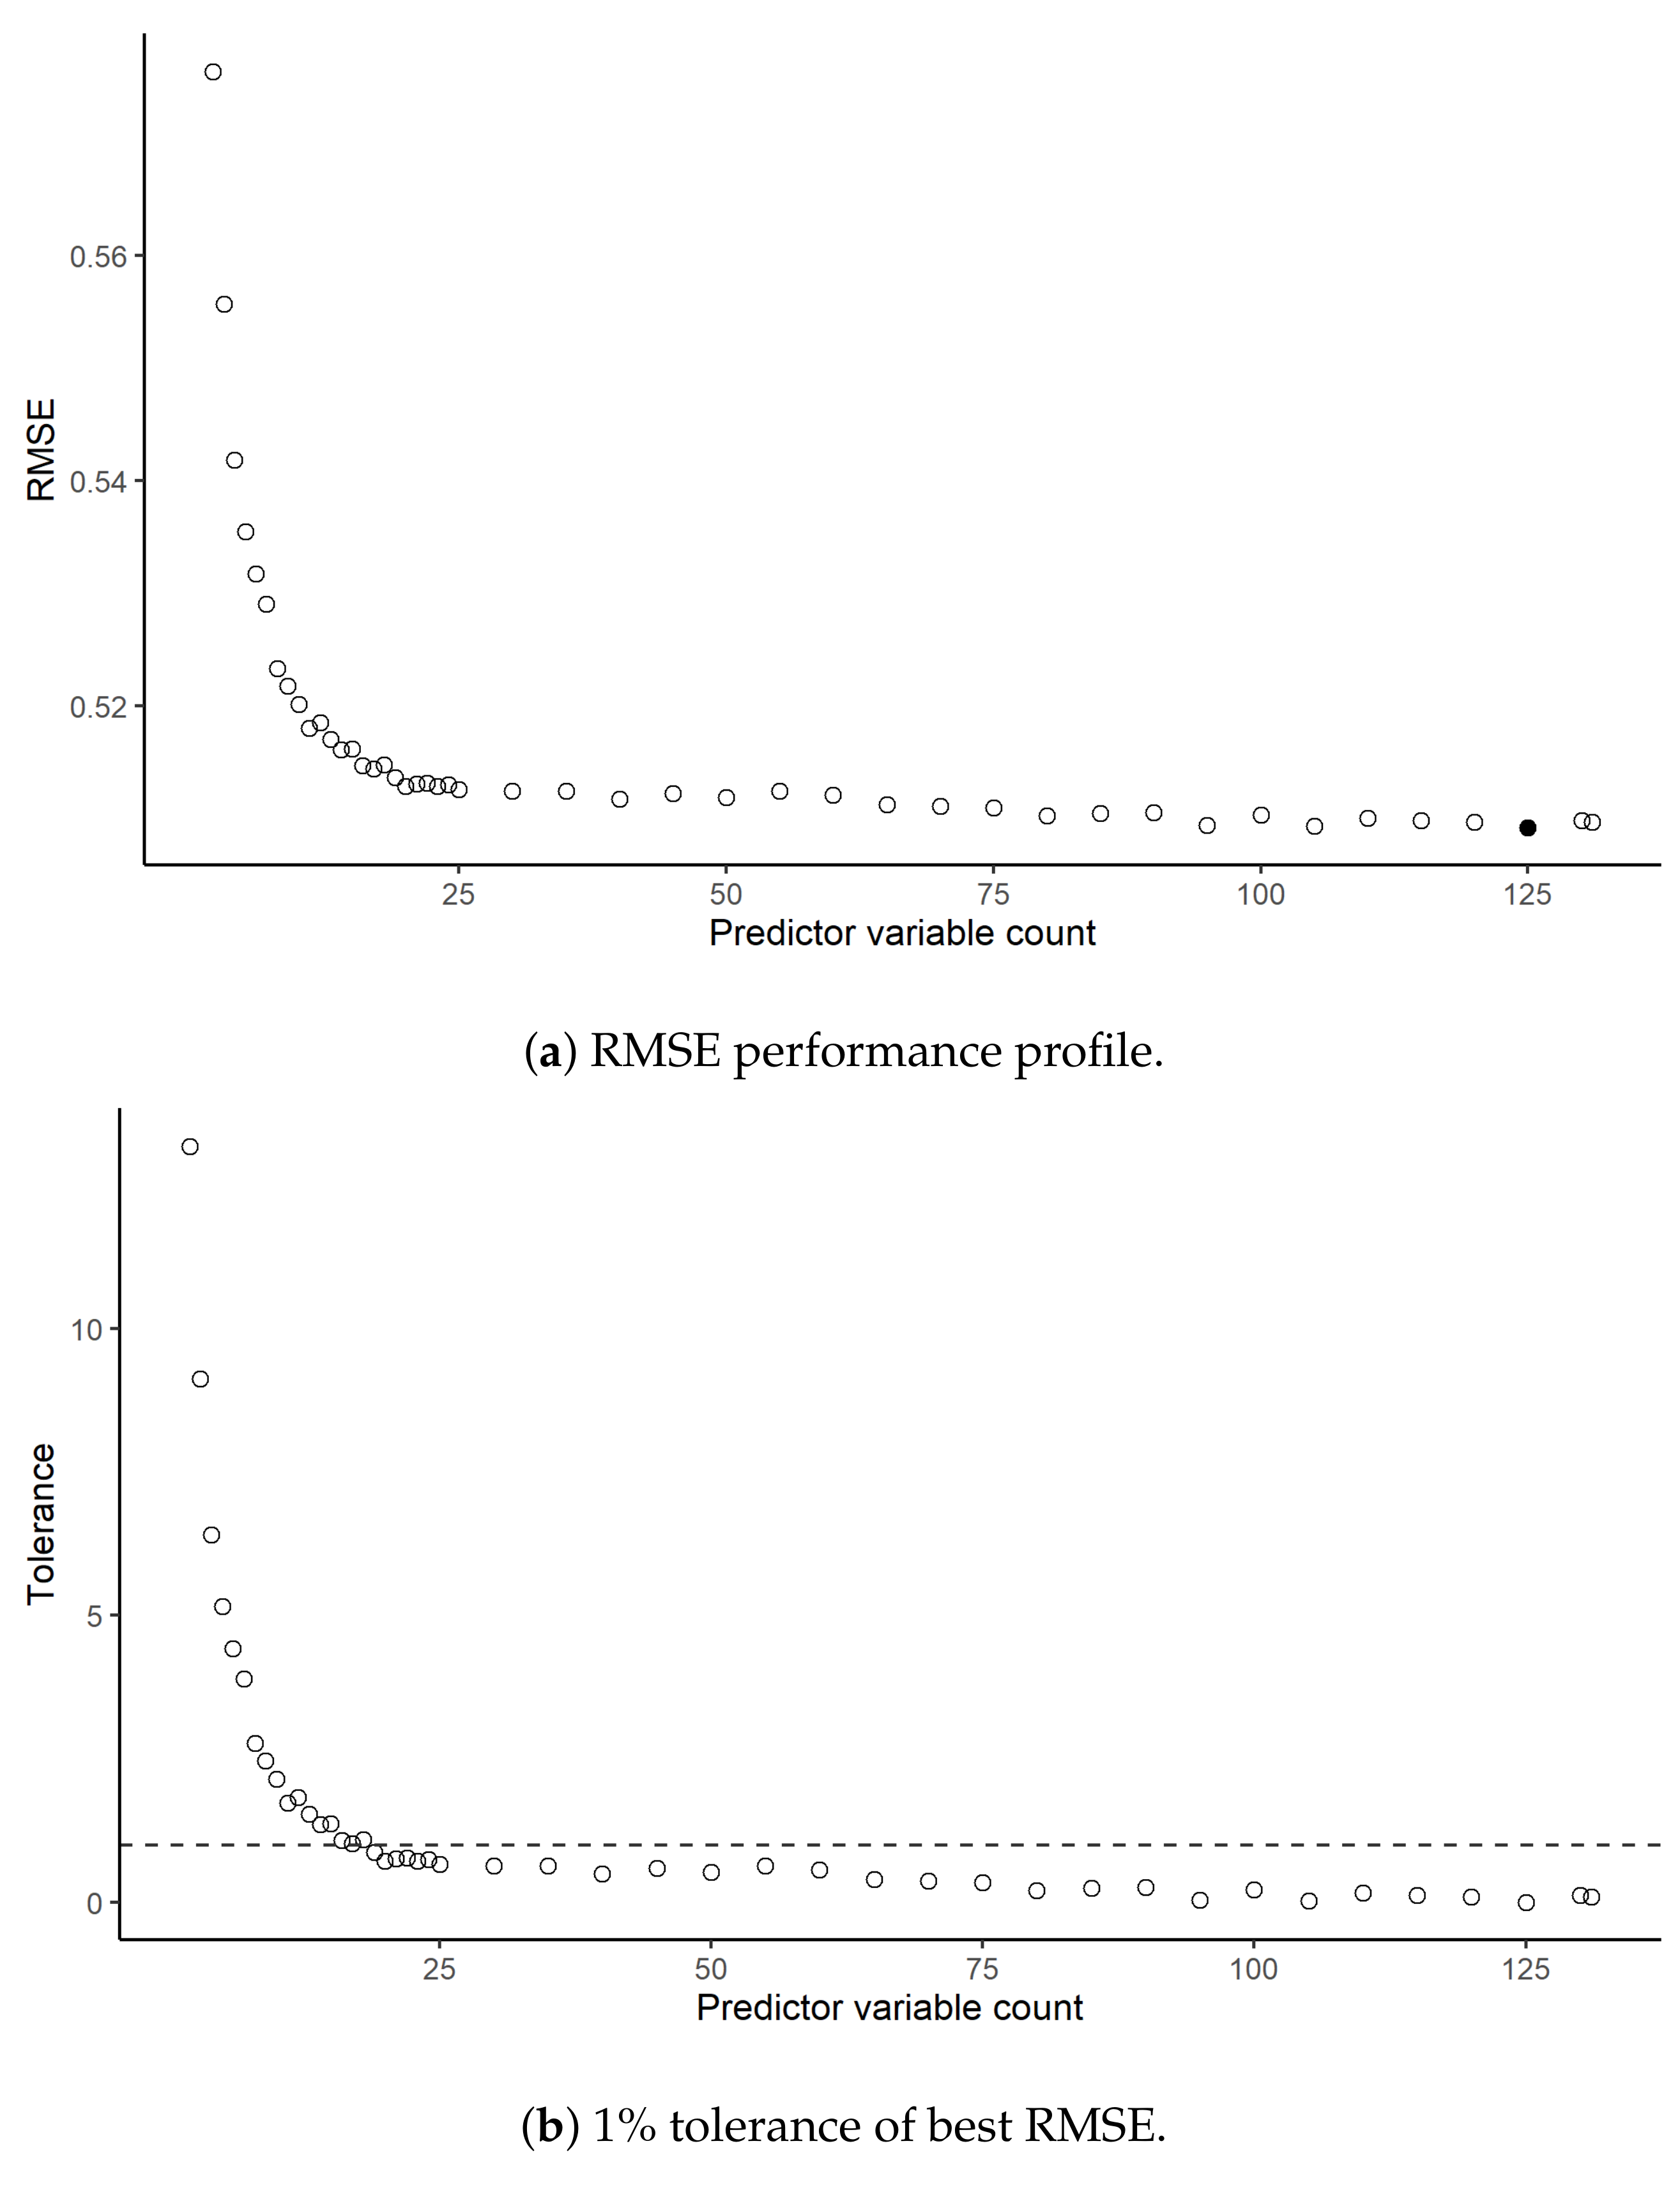
Figure 2a illustrates the performance profile of the predictor variable subset sizes tested, based on the Root Mean Square Error (RMSE) as a measure of performance. The plot indicates a best result based on 125 predictor variables. However, the long, flat tail of the plot also indicates that many smaller subsets may produce very similar results, a common characteristic of RF analysis [53]. In pursuit of parsimony, to benefit from a reduced number of predictor variables whilst sacrificing minimal performance, a 1% reduction on the best performance is tolerated. This 1% tolerance reduces the minimal acceptable predictor variable number to 19, as illustrated in Figure 2b. These are listed in Table 3 in the order of decreasing importance. This is a substantial reduction in variables for a minimal loss, which suggested that few of these variables have much of an impact on library visits and are thus adding noise into the model.
5.2. Comparison of the LSOAC with the FSLSOAC
The performance of the new classifications can be evaluated in several ways. The objective of this research is to identify whether the adoption of supervised ML methods, namely FS techniques, in the variable selection phase of developing a locally and application specific geodemographic classification can result in an output which is more relevant to the application. Therefore, a successful output is considered to be one that has generated groups with more internal homogeneity, with respect to the library use. Likewise, increased heterogeneity between the classification groups, with respect to library use, is also considered a success.
The mean differences in the library use ratio for each OA compared to the local classification group mean, for each group, is calculated as a measure of dissimilarity for both classifications, thus providing a measure of within-cluster homogeneity. A lower dissimilarity measure represents greater within-cluster homogeneity. Similarly, the Gini coefficient weighted by the split of OAs in each classification group is adopted as a measure of between-cluster heterogeneity for each of the classifications. The Gini coefficient is a common metric employed in the comparison and validation of heterogeneity in geodemographic classifications, both in academia and in the commercial Geodemographics Industry [54,55]. A higher Gini coefficient represents greater between-cluster heterogeneity [54]. In geodemographics, validating the results of clustering algorithms is more complicated and nuanced than in some statistical procedures, and it is not possible to take advantage of some typical validation techniques, such as an analysis of statistical significance or importance measures [4]. However, the statistically founded metrics that are presented in Table 4 offer standard measures that can be used to evaluate the superiority of one classification over another. In this instance, this evaluation is based on the premise that the classification with greater within-cluster homogeneity and between-cluster heterogeneity, in relation to the propensity for library use, demonstrates an increased ability to group the OAs with a greater relevance to their propensity for library use. Thus, such a classification would necessarily be more applicable in the development of library-focused policy or planning decisions.
The results of both metrics, as shown in Table 4, indicate that the FS has performed successfully in generating a classification which has both an increased within-cluster homogeneity and between-cluster heterogeneity, with respect to library use, reflected in the reduced dissimilarity measure and increased Gini coefficient, respectively. The use of FS methods in the variable selection phase of the FSLSOAC development has derived subsequent classification groups, which differentiate with a higher degree of relevance to library use and, thus, presents a more meaningful and, thus, more applicable, result in this context, as intended.
5.3. Analysis of the Clusters
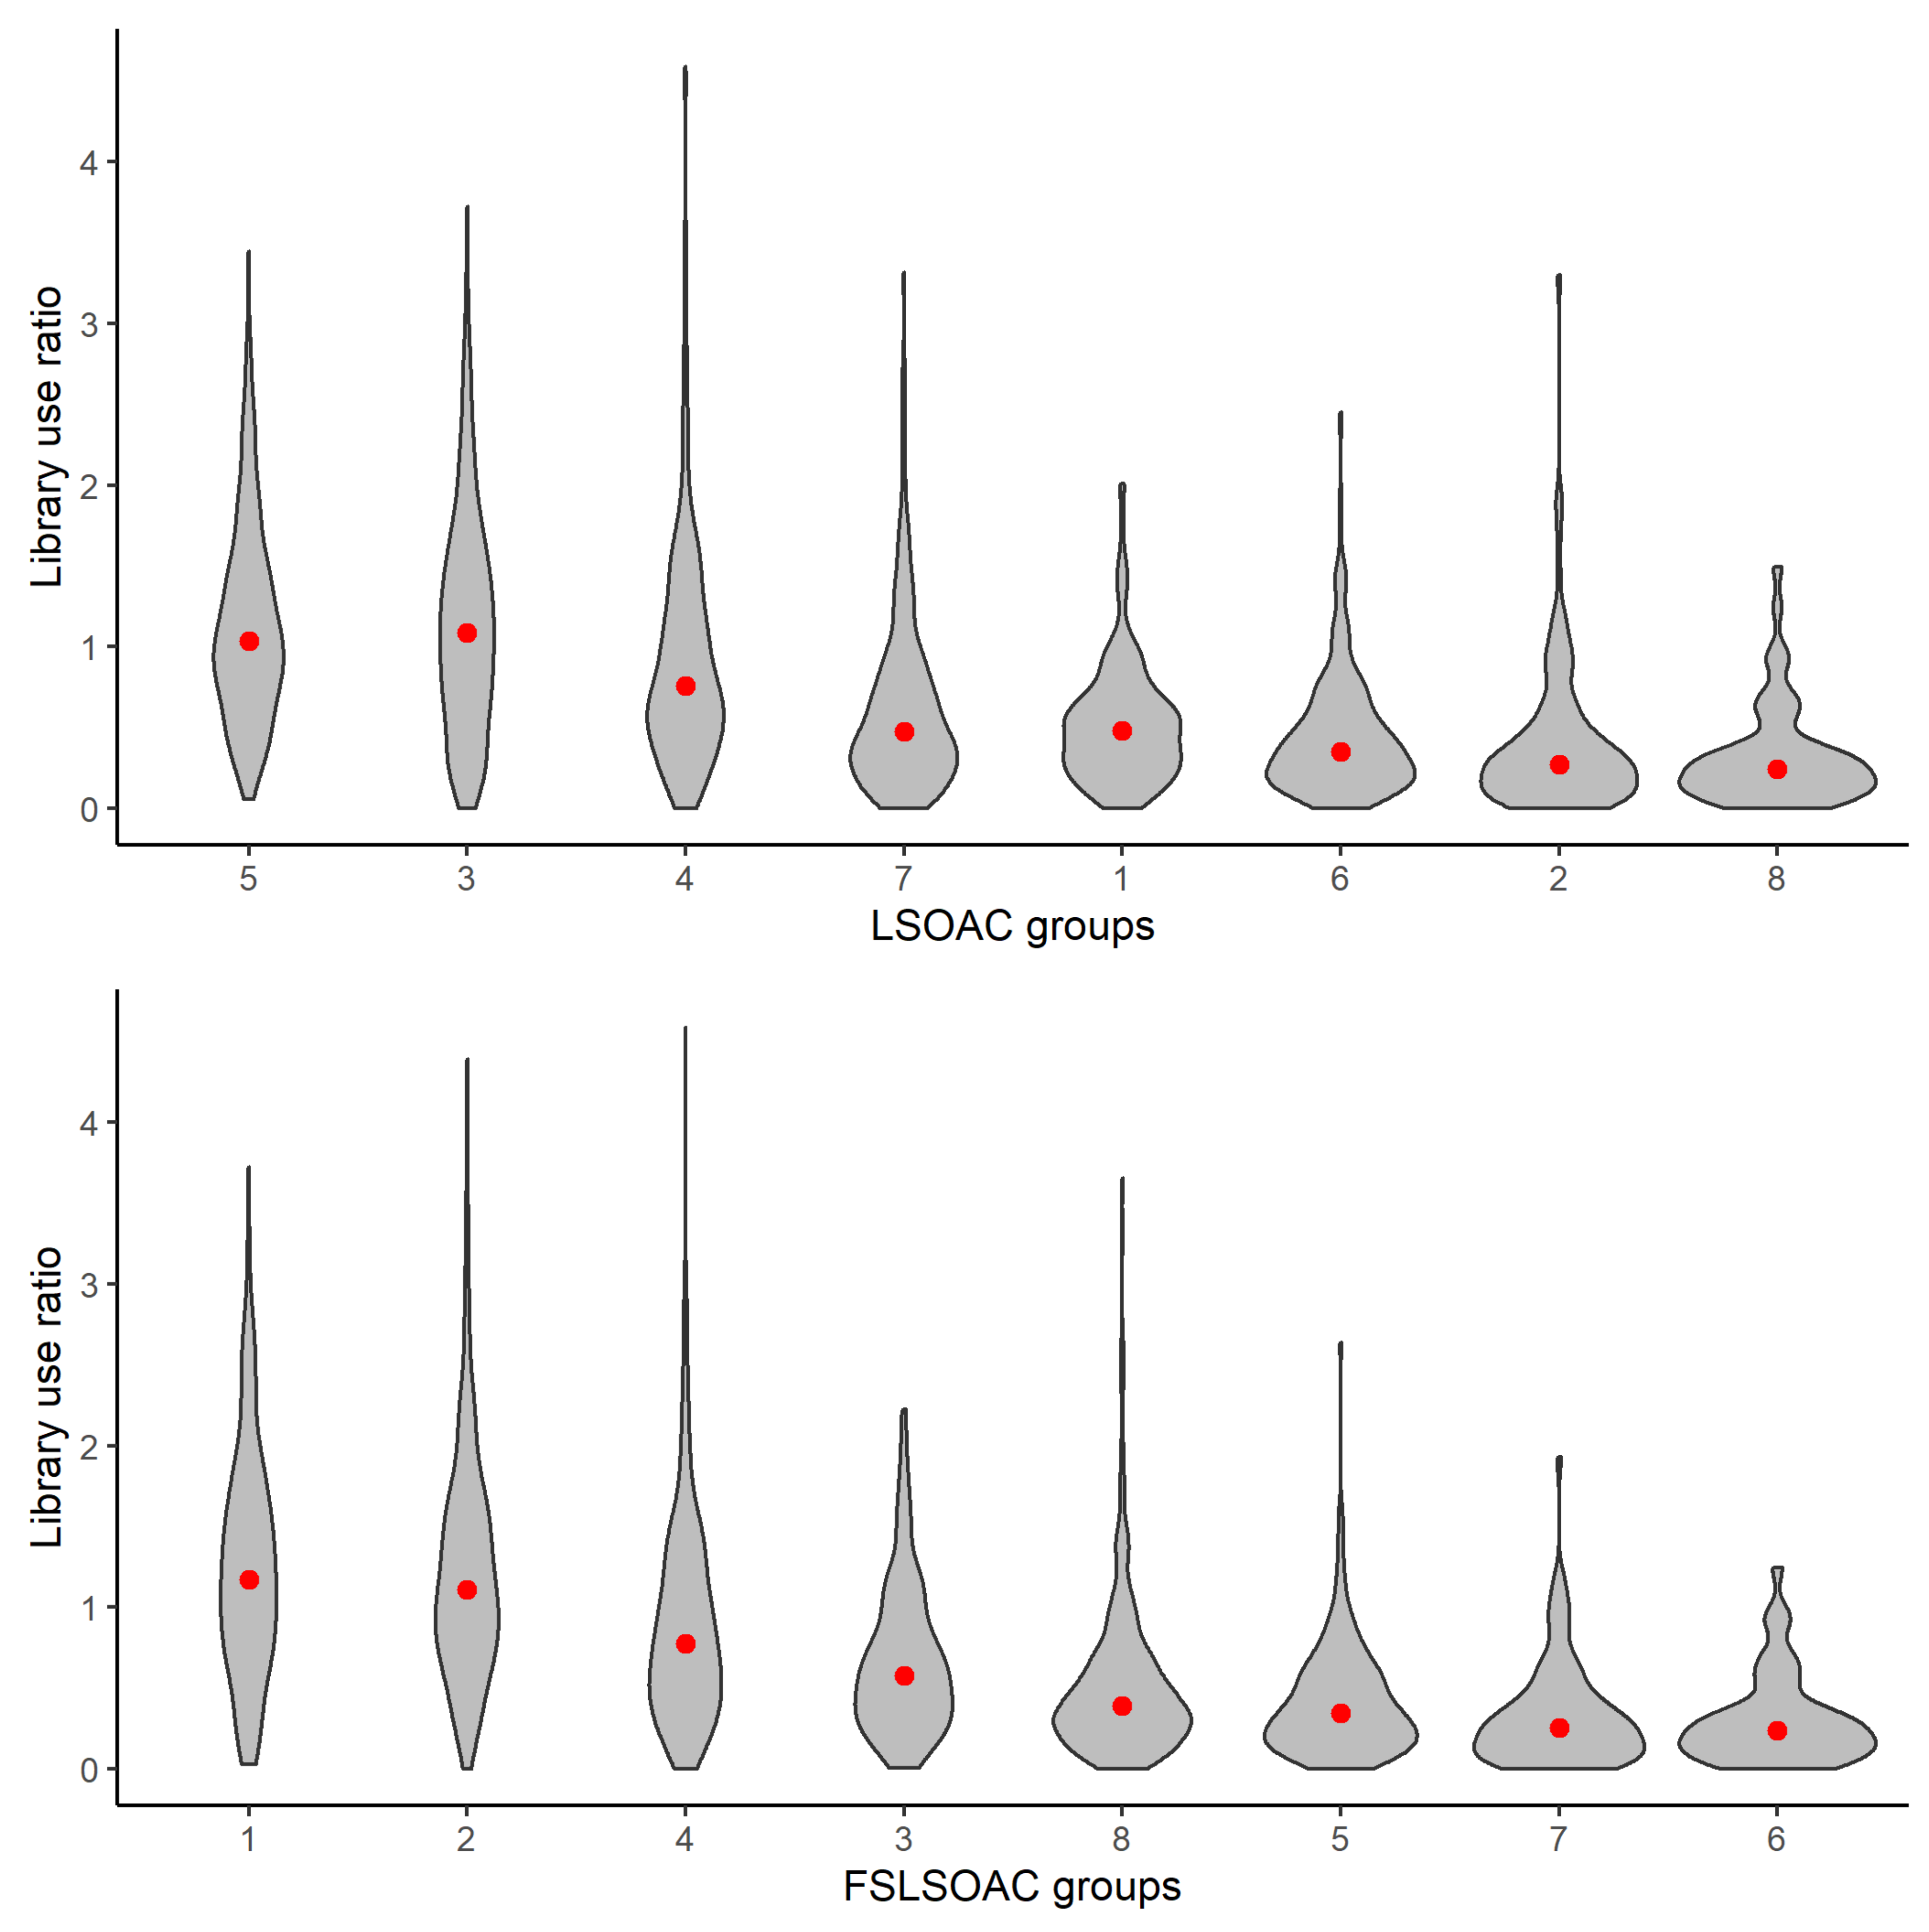
Figure 3 show the distribution of library use for each of the cluster groups in both classifications. The clusters are ordered left to right from the highest to the lowest mean library use, where the red dots signify the cluster mean. Although there is an overall similarity between the two plots, the FSLSOAC demonstrates a more distinctive split in the distribution of library use across the clusters. The clusters with the lowest mean library use in the FSLSOAC (clusters 5, 7, and 8) are more bottom-heavy, with a distribution weighted lower in comparison with the three clusters with the lowest mean library use in the LSOAC (clusters 6, 2, and 8). This result indicates that the clusters that are derived by the FSLSOAC better define low library use. Likewise, the distribution of the FSLSOAC clusters with the highest mean library use (clusters 1, 2, and 4) weight more towards higher library use than their counterparts in the LSOAC (clusters 5, 3, and 4). There are still OAs in the clusters that identify higher library use which also exhibit low library use. This is to be expected in a real-world setting, since the population within all similar OAs will not always behave the same. Moreover, these OAs with a high propensity of library use, but who are exhibiting low use, are useful to identify and understand in terms of policy development. Overall, these plots are encouraging and they demonstrate the potential of the methodology.
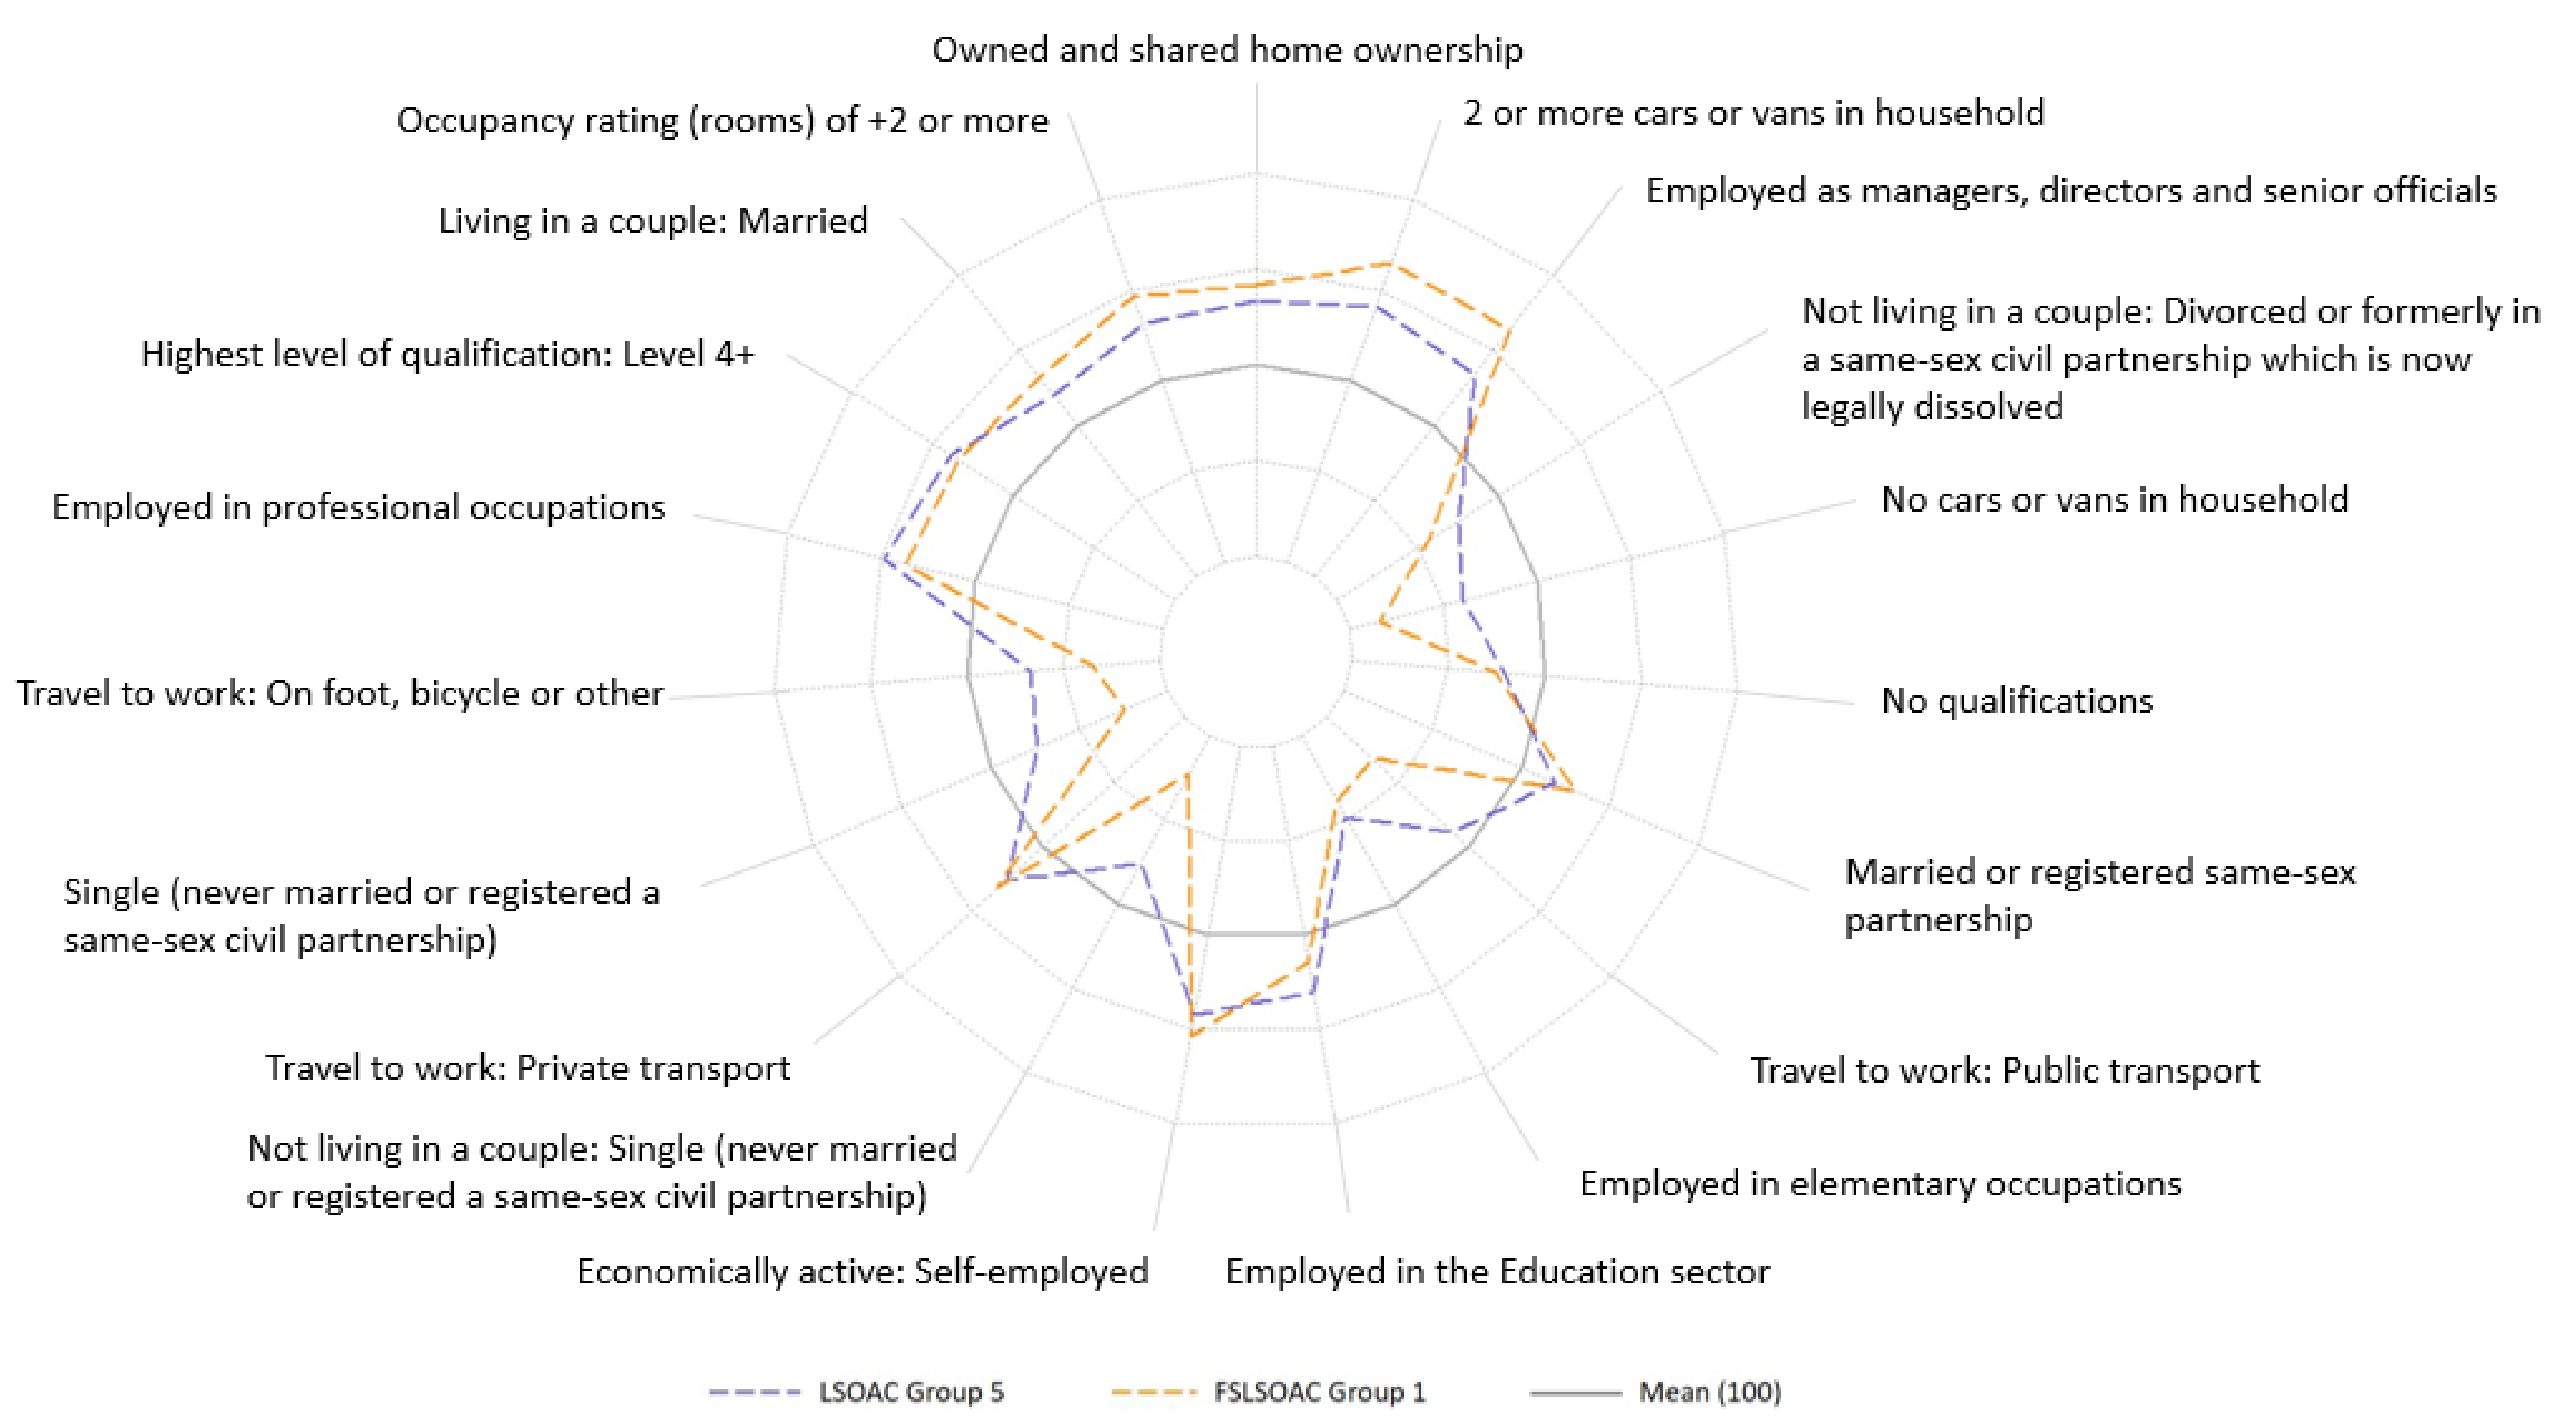
Figure 4 depicts the index of each of the 19 attribute variables used to derive the FSLSOAC, standardised to 100, for the "high library use” cluster in each of the classifications, i.e. the groups with the highest mean library use (labelled based on their rank in Table 3). These are the variables that best predict the propensity for library use, as identified by the FS process. Whilst the profile of the OAs in each group demonstrate very similar patterns with relation to these attribute variables, the result of the FSLSOAC cluster is much more exaggerated. The index in the FSLSOAC cluster is further from the mean in almost all of the variables, which indicated that the FSLSOAC has been more discriminant in identifying OAs that exhibit attributes associated with library use (both positively and negatively) in the "high library use” cluster, again demonstrating an improved performance.
6. Discussion
The objective of this research was to demonstrate an application of FS methods for improved input variable selection in the development of a geodemographic classification, presenting a method for deriving a more discriminative result, in this case with respect to understanding the propensity for library use. As re-iterated throughout, the identification of the best geodemographic solution was not an objective, nor was the generation of a ‘final’ classification output. The primary intention was in the practical demonstration of the theory and its potential. As such, simplicity in this initial demonstration has been prioritised throughout. Consequently, many decisions have been taken here that could be reconsidered in future research to further improve the outcome. For example, improvements could be made in the data used. Library visits for any purpose which did not result in book loans were not included in the analysis. The data also focused on a specific snapshot in time, and the ratio of visits per household that was calculated led to small counts in some OAs, both of which could have impacted the analysis and result. Moreover, the candidate independent input variables, again, were sourced solely from the census, as per Gale et al.’s [49] methodology. More consideration could have been made in their initial selection. Whilst the method proved to be successful in filtering out unnecessary or irrelevant variables presenting "noise”, there might be alternative, non-census data that could have a closer relationship to library use and, thus, should have been included but were missed. Examples might also include indicators that are descriptive of the libraries rather than the population, for example, the distance to the closest library, or even attractions at the library, by distance. Roumpani et al. ’s [11] paper indicates an uptake in library use by parents where children’s “story time” is available, for instance.
In terms of the methodology itself, this case study has employed RFE with Random Forest, since it is recommended for variables that exhibit non-normality. However, there is therefore scope to conduct tests of the impacts or potential improvements afforded by other FS methods. These improvements could affect the process or the result. For example, RFE, as employed here, is computationally expensive and it can take some time to execute, it is thus not necessarily suited to a high number of variables [45,52]. Therefore, an alternative approach might be preferred in practice.
Despite these caveats, the indicative use-case presented still demonstrates a positive result. The hypothesis that an employment of a supervised ML element in the variable selection could facilitate a more targeted, and contextually relevant classification appears to have been verified in this case. As mentioned, the FS seemed to handle the arbitrarily selected input variable set well, filtering the "noisy” variables, and identifying those that led to a solution that generated groups better able to discern library use, as hoped. In application, the results derived from this case study provide a more relevant idea of who and where the population more inclined to use libraries are. It is also still possible to use the resulting classification in a traditional way, appending ancillary data on to the result, to gain an even richer picture of the library users and non-users more accurately than a similar approach applied to general-purpose classification outputs. This will be able to better support the development of more informed planning strategies, or even marketing initiatives targeted at households identified as having a high propensity for library use, but not yet exhibiting such behaviour.
Alternatively, the results could also support more targeted sourcing of variables that are seemingly closely related to library use. In both instances, an iterative use of FA could cut wasted time and facilitate the developer in a more targeted approach to candidate data identification. When opening development up to a world of potential data, it is increasingly necessary to find a way of cutting through the noise and identifying the data and variables of value. Additionally, in terms of application specific classifications, involving problem owners and their expertise in the development phase, if possible, would eliminate the reliance on developers to be experts in the variable selection process. From a public sector planning perspective, the proposed template also offers an opportunity for development of more ’on-the-fly’ classifications, particularly in-house, potentially utilising more timely and locally bespoke Local Authority and open data. Moreover, more fluid classification development could also instigate a shift away from the convention of naming the classifications and deriving fixed pen portraits of areas, and the challenges and constraints present in such a practice, widely discussed across the academic literature [26,49].
7. Conclusions and Recommendations
The hypothesis proposed in this research challenges the established methodology of classification development to ask whether there is alternative way of considering the development of more targeted geodemographic application-specific classifications, and whether such an approach would generate more relevant and meaningful results in practice. The case study presented, which focuses on deriving classifications that better discern library use, seemingly verifies this hypothesis. The results are encouraging, exhibiting demonstrable evidence that the use of supervised FS methodologies for variable selection can lead to an enhanced relevance in the classification derived. Overall, the application specific approach seems to provide a necessary, updated alternative to the existing classification approaches.
The next steps would be to consider how these approaches would be received and adopted more widely in practice. In doing so, this might involve an evaluation of the tangible benefits which could be achieved. These benefits require consideration, in practice, against the additional work that is required to routinely shift from general-purpose to application-specific classifications. This should consider both how, and by how much, the methodology that is presented in this paper might better underpin more targeted and intelligent urban decision making, particularly within a local authority setting, to support sustainable socio-economic public policy and planning decisions.
Author Contributions
This work was completed as part of A.O.’s PhD research, which was supervised and supported by M.M., A.N. and M.B. Under the supervision and guidance of M.M., A.N. and M.B., A.O. developed the theoretical framework, performed the analysis and wrote the original paper. All authors have read and agreed to the published version of the manuscript.
Funding
The research reported in this paper was supported by an ESRC funded White Rose Doctoral Training Centre Collaborative Postgraduate Studentship, supported by TransUnion and Leeds City Council. Grant Number: ES/J500215/1.
Data Availability Statement
No new data were created in this study. Data sharing is not applicable to this article.
Conflicts of Interest
The authors declare no conflict of interest.
References
- Carroll, N.; Crawford, A. Unlocking the Potential of Civic Collaboration: A Review of Research-Policy Engagement between the University of Leeds and Leeds City Council 2020. Available online: https://lssi.leeds.ac.uk/partnerships/review-of-collaborative-working/ (accessed on 18 November 2020).
- Leeds Observatory. Population of Leeds, 2020. Available online: https://observatory.leeds.gov.uk/population/ (accessed on 22 June 2020).
- Swinney, P.; Carter, A. The UK’s Rapid Return to City Centre Living 2018. Available online: https://www.bbc.co.uk/news/uk-44482291 (accessed on 22 June 2020).
- Harris, R.; Sleight, P.; Webber, R. Geodemographics, Gis and Neighbourhood Targeting; John Wiley & Sons: Chichester, UK, 2005. [Google Scholar]
- Longley, P.A. Some challenges to geodemographic analysis and their wider implications for the practice of GIScience. Comput. Environ. Urban 2007, 31, 617–622. [Google Scholar] [CrossRef]
- Brunsdon, C.; Longley, P.; Singleton, A.D.; Ashby, D. Predicting participation in higher education: A comparative evaluation of the performance of geodemographic classifications. J. R. Stat. Soc. Ser. A (Stat. Soc.) 2011, 174, 17–30. [Google Scholar] [CrossRef]
- Otley, A. Forthcoming. Generating a Leeds Specific Open Geodemographic Classification. Ph.D. Thesis, University of Leeds, Leeds, UK, 2021. [Google Scholar]
- Department for Digital, Culture, Media and Sport. Libraries Deliver: Ambition for Public Libraries in England 2016 to 2021; 2018. Available online: https://www.gov.uk/government/publications/libraries-deliver-ambition-for-public-libraries-in-england-2016-to-2021/libraries-deliver-ambition-for-public-libraries-in-england-2016-to-2021 (accessed on 27 January 2021).
- UK Government and Parliament. Petition: Protect Library Services by Ringfencing Government Funding for Libraries. 2018. Available online: https://petition.parliament.uk/archived/petitions/228742 (accessed on 27 January 2021).
- Drury, C. All libraries, museums and galleries in Leeds at risk of closure as local councils count cost of coronavirus. Independent 2020. Available online: https://www.independent.co.uk/news/uk/home-news/leeds-council-libraries-museums-galleries-close-coronavirus-a9572746.html (accessed on 27 January 2021).
- Roumpani, F.; Maricevic, M.; Wilson, A. Data-driven modelling of public library infrastructure and usage in the United Kingdom. In Future Directions in Digital Information; Baker, D., Ellis, L., Eds.; Chandos Publishing: Cambridge, UK, 2020; pp. 285–308. [Google Scholar]
- Beaumont, J.R.; Inglis, K. Geodemographics in practice: Developments in Britain and Europe. Environ. Plan. A 1989, 21, 587–604. [Google Scholar] [CrossRef]
- Alexiou, A. Putting ‘Geo’ into Geodemographics: Evaluating the Performance of National Classification Systems within Regional Contexts. Ph.D. Thesis, University of Liverpool, Liverpool, UK, 2017. [Google Scholar]
- Singleton, A.D.; Longley, P. The internal structure of Greater London: A comparison of national and regional geodemographic models. Geo Geogr. Environ. 2015, 2, 69–87. [Google Scholar] [CrossRef]
- Parker, S.; Uprichard, E.; Burrows, R. Class places and place classes geodemographics and the spatialization of class. Inf. Commun. Soc. 2007, 10, 902–921. [Google Scholar] [CrossRef]
- Vickers, D.; Rees, P. Creating the UK National Statistics 2001 output area classification. J. R. Stat. Soc. Ser. A (Stat. Soc.) 2007, 170, 379–403. [Google Scholar] [CrossRef]
- Alexiou, A.; Singleton, A.D. Geodemographic analysis. In Geocomputation: A Practical Primer; SAGE: London, UK, 2015; pp. 137–151. [Google Scholar]
- Singleton, A.D. Cities and Context: The Codification of Small Areas through Geodemographic Classification. In Code and the City; Kitchin, R., Perng, S.Y., Eds.; Routledge: London, UK, 2016; pp. 215–235. [Google Scholar]
- Williamson, T.; Ashby, D.I.; Webber, R. Classifying neighbourhoods for reassurance policing. Polic. Soc. 2006, 16, 189–218. [Google Scholar] [CrossRef]
- Longley, P. Geographical information systems: A renaissance of geodemographics for public service delivery. Prog. Hum. Geogr. 2005, 29, 57–63. [Google Scholar] [CrossRef]
- Singleton, A.D.; Spielman, S.E. The Past, Present and Future of Geodemographic Research in the United States and United Kingdom. Prof. Geogr. 2014, 66, 558–567. [Google Scholar] [CrossRef] [Green Version]
- Local Government Association. Developing a Customer Classification Tool: Guidance Document for Local Authorities. 2013. Available online: https://www.local.gov.uk/sites/default/files/documents/hull-city-council-develop-4b8.pdf (accessed on 11 January 2021).
- Batey, P.; Brown, P. The spatial targeting of urban policy initiatives: A geodemographic assessment tool. Environ. Plan. 2007, 39, 2774–2793. [Google Scholar] [CrossRef] [Green Version]
- Longley, P.A. Geodemographics and the practices of geographic information science. Int. J. Geogr. Inf. Sci. 2012, 26, 2227–2237. [Google Scholar] [CrossRef]
- Burrows, R.; Gane, N. Geodemographics, Software and Class. Sociology 2006, 40, 793–812. [Google Scholar] [CrossRef]
- Brunsdon, C.; Charlton, M.; Rigby, J.E. An Open Source Geodemographic Classification of Small Areas in the Republic of Ireland. Appl. Spat. Anal. Policy 2018, 11, 183–204. [Google Scholar] [CrossRef]
- Singleton, A.D. The geodemographics of educational progression and their implications for widening participation in higher education. Environ. Plan. A 2010, 42, 2560–2580. [Google Scholar] [CrossRef]
- Ashby, D.I.; Longley, P.A. Geocomputation, geodemographics and resource allocation for local policing. Trans. GIS 2005, 9, 53–72. [Google Scholar] [CrossRef]
- Moon, G.; Twigg, L.; Jones, K.; Aitken, G.; Taylor, J. The utility of geodemographic indicators in small area estimates of limiting long-term illness. Soc. Sci. Med. 2019, 227, 47–55. [Google Scholar] [CrossRef]
- Powell, J.; Tapp, A.; Orme, J.; Farr, M. Primary care professionals and social marketing of health in neighbourhoods: A case study approach to identify, target and communicate with ‘at risk’ populations. Prim. Health Care Res. Dev. 2007, 8, 22–35. [Google Scholar] [CrossRef] [Green Version]
- Farr, M.; Evans, A. Identifying ‘unknown diabetics’ using geodemographics and social marketing. J. Direct Data Digit. Mark. Pract. 2005, 7, 47–58. [Google Scholar] [CrossRef] [Green Version]
- Aveyard, P.; Manaseki, S.; Chambers, J. The relationship between mean birth weight and poverty using the Townsend deprivation score and the Super Profile classification system. Public Health 2002, 116, 308–314. [Google Scholar] [CrossRef]
- Liu, Y.; Cheng, T. Understanding public transit patterns with open geodemographics to facilitate public transport planning. Transp. Transp. Sci. 2018, 16, 76–103. [Google Scholar] [CrossRef] [Green Version]
- Anderson, T.K. Using geodemographics to measure and explain social and environment differences in road traffic accident risk. Environ. Plan. A 2010, 42, 2186–2200. [Google Scholar] [CrossRef]
- Corcoran, J.; Higgs, G.; Anderson, T. Examining the use of a geodemographic classification in an exploratory analysis of variations in fire incidence in South Wales, UK. Fire Saf. J. 2013, 62, 37–48. [Google Scholar] [CrossRef]
- Samarasundera, E.; Martin, D.; Saxena, S.; Majeed, A. Socio-demographic data sources for monitoring locality health profiles and geographical planning of primary health care in the UK. Prim. Health Care Res. Dev. 2010, 11, 287–300. [Google Scholar] [CrossRef] [Green Version]
- Voas, D.; Williamson, P. The diversity of diversity: A critique of geodemographic classification. Area. 2001, 33, 63–76. [Google Scholar] [CrossRef]
- Longley, P.A.; Singleton, A.D. Classification through consultation: Public views of the geography of the e-society. Int. J. Geogr. Inf. Sci. 2009, 23, 737–763. [Google Scholar] [CrossRef]
- Harris, R.; Johnston, R.; Burgess, S. Neighborhoods, ethnicity and school choice: Developing a statistical framework for geodemographic analysis. Popul. Res. Policy Rev. 2007, 26, 553–579. [Google Scholar] [CrossRef]
- Maugis, C.; Celeux, G.; Martin-Magniette, M.L. Variable selection for clustering with Gaussian mixture models. Biometrics 2009, 65, 701–709. [Google Scholar] [CrossRef] [Green Version]
- Singleton, A.D.; Longley, P.A. Creating open source geodemographics: Refining a national classification of census output areas for applications in higher education. Pap. Reg. Sci. 2009, 88, 643–666. [Google Scholar] [CrossRef]
- Singleton, A.D.; Longley, P.A. Geodemographics, visualisation, and social networks in applied geography. Appl. Geogr. 2009, 29, 289–298. [Google Scholar] [CrossRef]
- Vickers, D.; Rees, P. Ground-truthing geodemographics. Appl. Spat. Anal. Policy 2011, 4, 3–21. [Google Scholar] [CrossRef]
- Liu, Y.; Singleton, A.D.; Arribas-Bel, D. A Principal Component Analysis (PCA)-based framework for automated variable selection in geodemographic classification. Geo-Spat. Inf. Sci. 2019, 22, 251–264. [Google Scholar] [CrossRef] [Green Version]
- Guyon, I.; Elisseeff, A. An introduction to variable and feature selection. J. Mach. Learn. Res. 2003, 3, 1157–1182. [Google Scholar]
- Kohavi, R.; John, G.H. Wrappers for feature subset selection. Artif. Intell. 1997, 97, 273–324. [Google Scholar] [CrossRef] [Green Version]
- Gregorutti, B.; Michel, B.; Saint-Pierre, P. Correlation and variable importance in random forests. Stat. Comput. 2016, 27, 659–678. [Google Scholar] [CrossRef] [Green Version]
- ONS. Output Areas: Introduction to Output Areas—The Building Block of Census Geography, 2016. Available online: https://www.ons.gov.uk/census/2001censusandearlier/dataandproducts/outputgeography/outputareas (accessed on 28 July 2020).
- Gale, C.G.; Singleton, A.D.; Bates, A.G.; Longley, P.A. Creating the 2011 area classification for output areas (2011 OAC). J. Spat. Inf. Sci. 2016, 2016, 1–27. [Google Scholar] [CrossRef]
- Gale, C.G. Creating an Open Geodemographic Classification Using the UK Census of the Population. Ph.D. Thesis, UCL (University College London), London, UK, 2014. [Google Scholar]
- Vickers, D.; Rees, P.; Birkin, M. Creating the National Classification of Census Output Areas: Data, Methods and Results. Working Paper; School of Geography, University of Leeds: Leeds, UK, 2005. [Google Scholar]
- Karegowda, A.G.; Jayaram, M.; Manjunath, A. Feature subset selection problem using wrapper approach in supervised learning. Int. J. Comput. Appl. 2010, 1, 13–17. [Google Scholar] [CrossRef]
- Kuhn, M. The Caret Package:20 Recursive Feature Elimination. 2019. Available online: http://topepo.github.io/caret/recursive-feature-elimination.html (accessed on 4 January 2021).
- Petersen, J.; Gibin, M.; Longley, P.; Mateos, P.; Atkinson, P.; Ashby, D. Geodemographics as a tool for targeting neighbourhoods in public health campaigns. J. Geogr. Syst. 2010, 13, 173–192. [Google Scholar] [CrossRef]
- CACI. ACORN Technical Guide, 2019. Available online: https://www.caci.co.uk/sites/default/files/resources/Acorn_technical_guide.pdf (accessed on 21 January 2021).
Figure 1.
Spatial distribution of Leeds OAs with higher than average library use, and locations of public libraries in the city.
Figure 1.
Spatial distribution of Leeds OAs with higher than average library use, and locations of public libraries in the city.

Figure 2.
Performance profile of the predictor variable subset sizes.

Figure 3.
Mean and distribution of library use in each classification group in the LSOAC and FSLSOAC.
Figure 3.
Mean and distribution of library use in each classification group in the LSOAC and FSLSOAC.

Figure 4.
Index of census attributes for the groups with the highest mean library use in the LSOAC and FSLSOAC.
Figure 4.
Index of census attributes for the groups with the highest mean library use in the LSOAC and FSLSOAC.


Table 1.
Summary of the 60 input variables adopted in the development of the 2011 OAC [49] and the LSOAC.
Table 1.
Summary of the 60 input variables adopted in the development of the 2011 OAC [49] and the LSOAC.
| Domain | Variables |
|---|---|
| Demographic | Age bands; Marital status; Ethnic groups; Country of birth (UK or Ireland/new EU/old EU); Level of spoken English. |
| Household composition | Population density; Communal living; Dependent children; Full-time students; Occupancy rating. |
| House type | Property type. |
| Housing tenure | Property rentals; Home ownership. |
| Socio-economic | Standardised Illness Ratio (SIR); Unpaid care; Highest qualification level; School children/full time students; Car ownership; Method of transport to work; Unemployment; Hours of employment; Indutry of employment. |
Table 2.
Steps in the RFE process.
| Step Number | Step Description |
|---|---|
| 1 | Generate the training data sample. |
| 2 | Train the Random Forest. |
| 3 | Compute the importance of the predictor variables. |
| 4 | Set subset size. |
| 5 | Eliminate the least important variables up to subset size. |
| 6 | Repeat steps 4–5 for all subset sizes. |
| 7 | Repeat steps 1–6 for each re-sampling iteration. |
| 8 | Calculate the performance profile of the outputs. |
| 9 | Determine the appropriate number of predictors. |
| 10 | Identify the final list of important predictors. |
Table 3.
Candidate variables identified as important in the RFE, ranked by importance (descending).
| Rank | Variable Domain | Variable Description |
|---|---|---|
| 1 | Housing tenure | Owned and Shared Ownership. |
| 2 | Household composition | Occupancy rating (rooms) of +2 or more. |
| 3 | Household composition | Living in a couple: Married. |
| 4 | Socio-economic | Highest level of qualification: Level 4 qualifications and above. |
| 5 | Socio-economic | Employed in professional occupations. |
| 6 | Socio-economic | Travel to work: On foot, Bicycle or Other. |
| 7 | Demographic | Single (never married or never registered a same-sex civil partnership). |
| 8 | Socio-economic | Travel to work: Private Transport. |
| 9 | Household composition | Not living in a couple: Single (never married or never registered a same-sex civil partnership). |
| 10 | Socio-economic | Economically active: Self-employed. |
| 11 | Socio-economic | Employed in the Education sector. |
| 12 | Socio-economic | Employed in elementary occupations. |
| 13 | Socio-economic | Travel to work: Public Transport. |
| 14 | Demographic | Married or in a registered same-sex civil partnership. |
| 15 | Socio-economic | No qualifications. |
| 16 | Socio-economic | No cars or vans in household. |
| 17 | Household composition | Not living in a couple: Divorced or formerly in a same-sex civil partnership which is now legally dissolved. |
| 18 | Socio-economic | Employed as managers, directors and senior officials. |
| 19 | Socio-economic | 2 or more cars or vans in household. |
Table 4.
Comparison of within-cluster homogeneity (Dissimilarity) and between-cluster heterogeneity (Gini coefficient) of the LSOAC and the FSLSOAC.
Table 4.
Comparison of within-cluster homogeneity (Dissimilarity) and between-cluster heterogeneity (Gini coefficient) of the LSOAC and the FSLSOAC.
| LSOAC | FSLSOAC | |
|---|---|---|
| Dissimilarity | 3.00 | 2.92 |
| Gini coefficient | 0.206 | 0.232 |
Publisher’s Note: MDPI stays neutral with regard to jurisdictional claims in published maps and institutional affiliations. |
© 2021 by the authors. Licensee MDPI, Basel, Switzerland. This article is an open access article distributed under the terms and conditions of the Creative Commons Attribution (CC BY) license (https://creativecommons.org/licenses/by/4.0/).
Share and Cite
MDPI and ACS Style
Otley, A.; Morris, M.; Newing, A.; Birkin, M. Local and Application-Specific Geodemographics for Data-Led Urban Decision Making. Sustainability 2021, 13, 4873. https://0-doi-org.brum.beds.ac.uk/10.3390/su13094873
AMA Style
Otley A, Morris M, Newing A, Birkin M. Local and Application-Specific Geodemographics for Data-Led Urban Decision Making. Sustainability. 2021; 13(9):4873. https://0-doi-org.brum.beds.ac.uk/10.3390/su13094873
Chicago/Turabian StyleOtley, Amanda, Michelle Morris, Andy Newing, and Mark Birkin. 2021. "Local and Application-Specific Geodemographics for Data-Led Urban Decision Making" Sustainability 13, no. 9: 4873. https://0-doi-org.brum.beds.ac.uk/10.3390/su13094873
Note that from the first issue of 2016, this journal uses article numbers instead of page numbers. See further details here.