1. Introduction
We made recommendations on adjustments to the city development plans, some of which were accepted. However, relations with the municipal administration have been a bit tense due to the poor results they obtained in our citizen perception surveys. This made them very upset.
(Quote by the representative of an indicator initiative in Colombia; informant CO#3).
To improve a city’s liveability and democratic governance, a strategy with much appeal in this digital, data-driven age involves tracking numbers on issues that many citizens and elected officials care about [
1]: How is our city or neighbourhood doing (and comparing to others) with regard to, say, air quality standards, quality-of-life, municipal expenditure, and crime rates? Organizations dedicated to compiling and publicly reporting on local wellbeing or sustainability indicators at regular intervals have been called “urban observatories” or “community indicators”; in line with other studies [
2], we label them “community indicator initiatives” in this article. Pioneers such as
Sustainable Seattle were founded in the 1990s [
3] and hundreds of other local projects were active at the turn of the millennium [
4].
In Bogotá in 1998, the Colombian capital’s chamber of commerce, a reputed foundation, media firm, and university jointly created
Bogotá Cómo Vamos (“Bogota, how are we doing” in Spanish). This organization’s core mandate is to publicly report on the city’s quality-of-life and sustainability on the basis of relevant indicator data obtained from official sources and supplemented with their citizen perception surveys. Inspired by this Colombian model, dozens of similar initiatives subsequently appeared across Latin America [
5,
6]. Many chose equivalent names (
Lima Cómo Vamos,
Rio Como Vamos, etc.) or variants often combining city names and plural first-person pronouns—in Brazil,
Nossa São Paulo. (“Our São Paulo” in Portuguese) was created in 2007 and emulated by namesake initiatives in Argentina such as
Nuestra Buenos Aires. To exchange experiences and coordinate joint activities, they collectively created the
Latin American Network of Just and Sustainable Cities in 2011 that comprised, in its heyday, some 60 like-minded initiatives from 10 countries [
7].
Across Latin America, “community indicators” evidently proliferated in the previous decade, fuelled by substantial investments in time and money by civil society volunteers, private foundations, universities, journalists, and entrepreneurs. In several cities, international donors, such as the Inter-American Development Bank (IDB), co-financed the creation of a “civil society monitoring system” [
8]. A quick internet search for key actors reveals that
Bogotá Cómo Vamos (cf.
www.bogotacomovamos.org (accessed on 1 April 2021)) and Colombian sister organizations continue to be active, just as
Nossa São Paulo (
www.nossasaopaulo.org.br (accessed on 1 April 2021)) and fellow initiatives in Brazil. However,
Rio Como Vamos and
Nuestra Buenos Aires no longer exist, the Latin American network became inactive in 2016, and in some countries, none of the original community indicator initiatives survived.
The rise (and fall) of community indicators in different countries triggers two fundamental questions: What do they achieve? Which contextual factors influence their achievements and survival? Various academic studies address the first question and point to several positive impacts, including gains in public awareness and sustainability-oriented decision-making [
4]. In the literature on sustainability indicators at large (thus including their application at a national level, in industries, etc.), scholars have also identified the possibility of misuse (e.g., disinformation campaigns) but non-use appears to be the more prevalent risk [
9]. Indeed, failure to achieve long-term usage seems to be a common ailment. According to a recent review by Wray, Stevens, and Holden [
10] (p. 10), "not unlike the story in other realms of voluntary and community work, efforts in community indicators have been plagued by the short lifespan of many initiatives. All too often, the cycle is one of a burst of investment of, enthusiasm, dedication, skill, and resources, a hard slog to establish an initial reputation and reporting system, some small triumphs of media, community, and perhaps even political attention, followed by a series of disappointments in efforts to repeat, accelerate, or institutionalize the work, and ultimately by the decline or disappearance of the initiative”.
In that view, fizzling out over time seems to be the normal fate of indicator projects; moreover, unrealistic expectations on the side of practitioners appear to be more important than either the local or national context or the specific choices each initiative makes about its activities and organizational set-up. With regards to internal governance, some researchers offer specific recommendations. Extrapolating from a case study in Australia, Davern et al. [
11] (p. 571) posit that “all indicator systems should include these best practice principles in their development and operation”, which include the prescription to “include a balanced mix of government, business and community representation”. The last point is remarkable since, in Latin America, virtually all initiatives operate at an arm’s length from governments and have governance arrangements that explicitly exclude elected officials.
Therefore, it is fair to state that there are both theoretical and empirical reasons to map and evaluate community indicator initiatives in Latin America. Theoretically, various assumptions about the effectiveness and “best practice” of community indicators can be put to test, in particular, with regards to prescriptions about organizational governance. As this article shows, community indicator initiatives differ widely in the number of stakeholders involved, their degree of cooperation with media firms, reliance on volunteers, indicator choices, dissemination methods, and other characteristics. Empirically, the Global South is under-researched, and a more representative selection of case studies is repeatedly called for by scholars of sustainability indicators [
12]. Latin American initiatives operate in diverse environments, ranging from smaller towns to the world’s largest cities, in countries showing differences in terms of public service levels, political violence, and access to information laws. This provides unique opportunities to open the “black box of contextual drivers” [
13]. Responding to calls in the literature for comparative, longitudinal approaches, this study, therefore, sought to answer the following research question:
Which Design and Context Factors Are Associated with the Influence and Long-Term Viability of Community Indicator Initiatives in Latin American Cities?
Three research sub-questions help structure this article: How do city-level community indicator initiatives function in different Latin American countries? What do they perceive as their objectives, barriers, and achievements? Which contextual factors, in combination with organizational strategies, are associated with their success and failure?
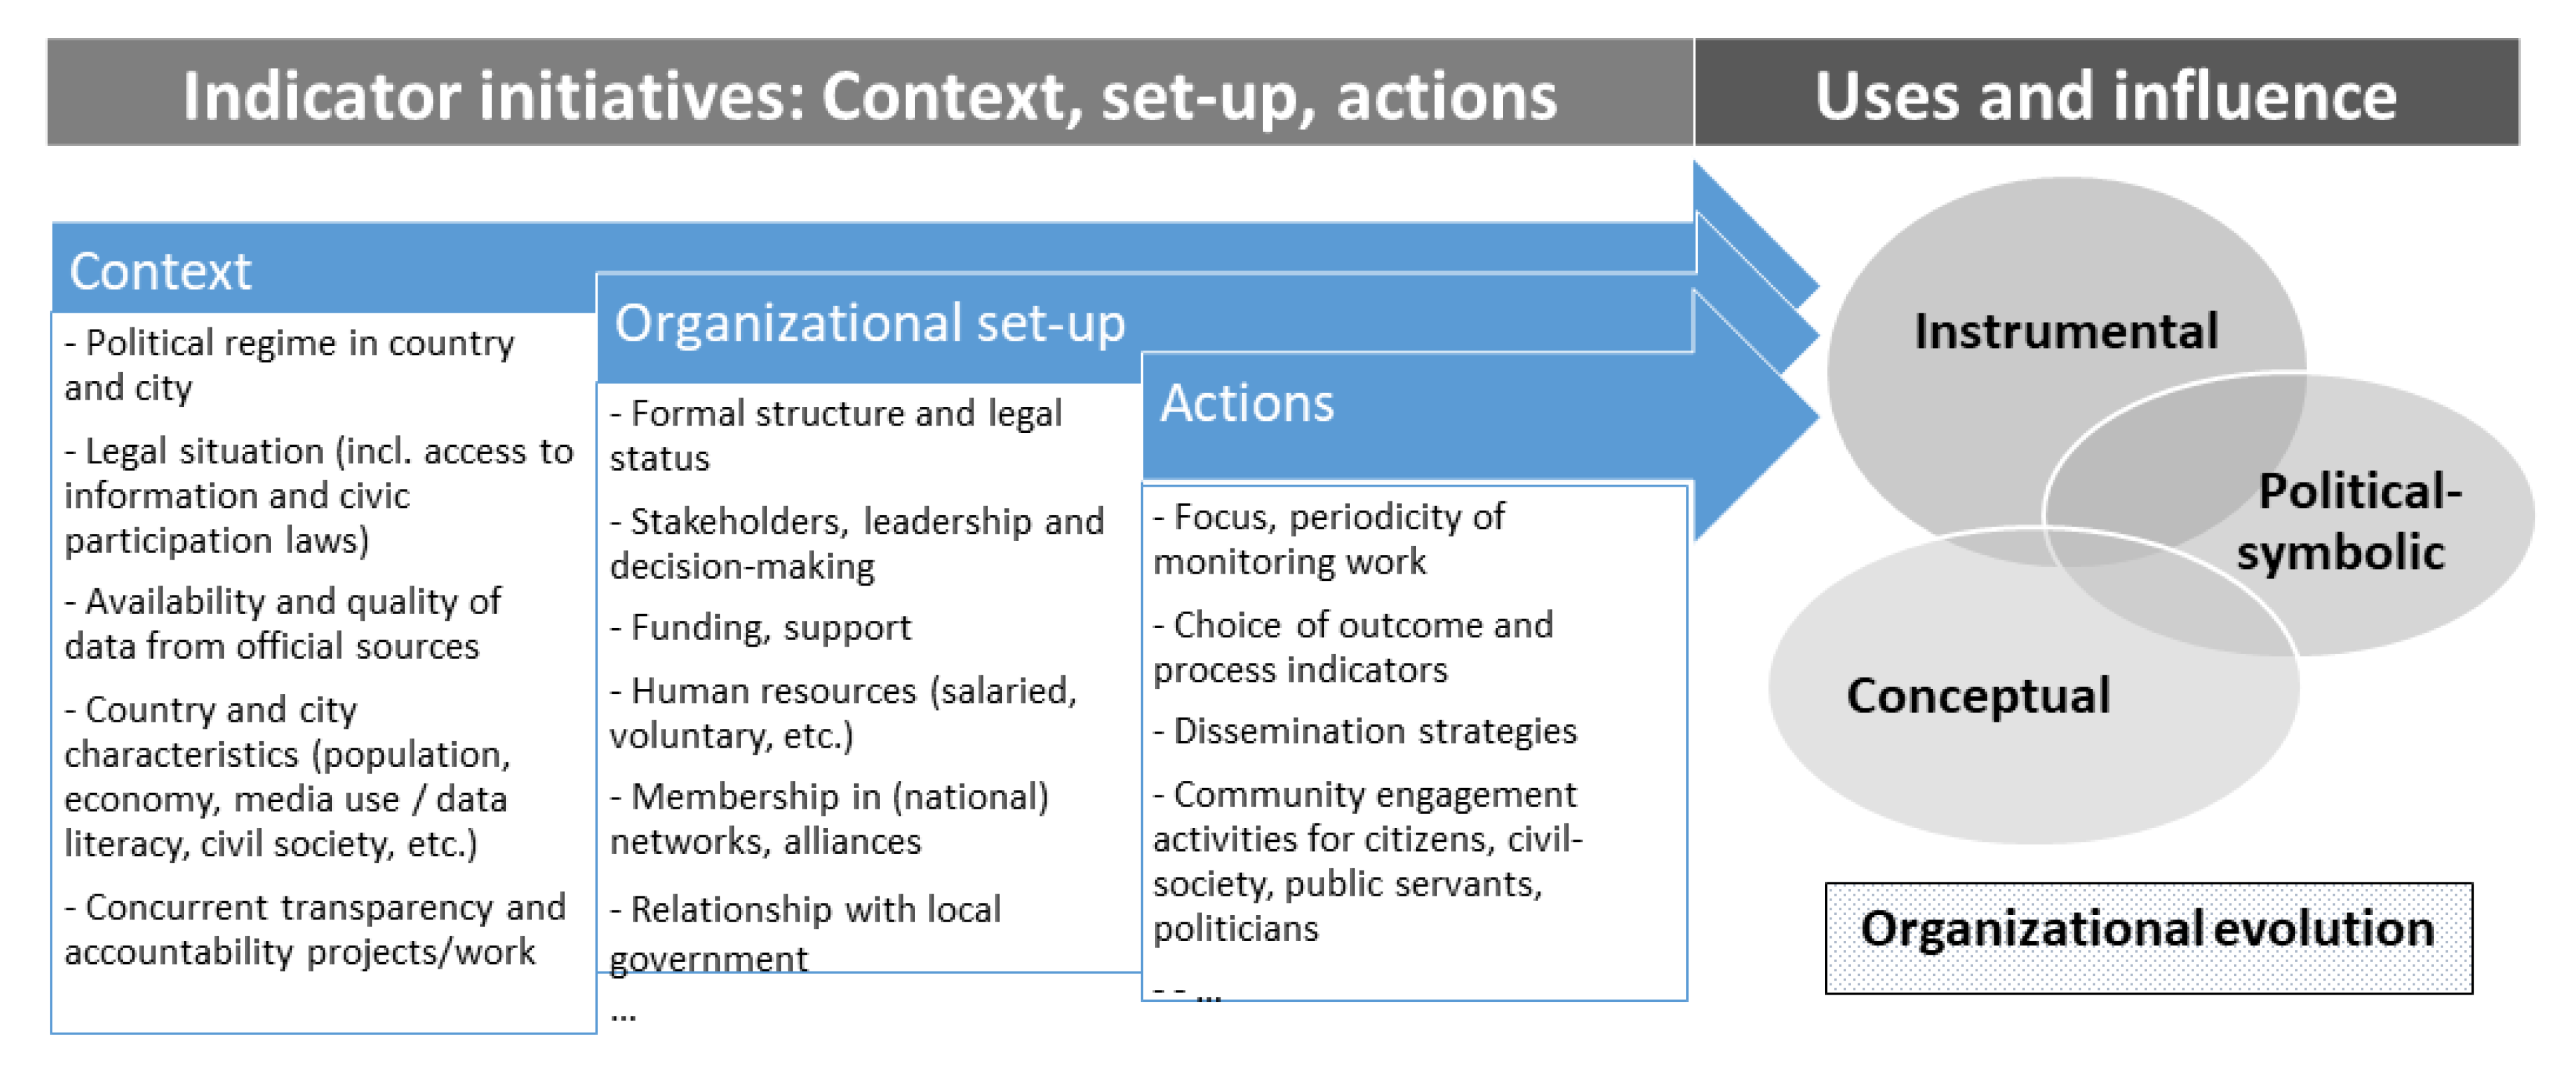
Through our theoretical and empirical contributions, we aim to strengthen the global body of knowledge on indicator initiatives and to provide insights to practitioners; the latter include civil society activists, donors, and decision-makers involved in the design of national transparency and accountability policies. We further expect that the research frameworks elaborated for this study, including the typology of context and design factors as well as effects, will inform future studies. Our approach and objectives are summarised in
Figure 1.
This article is organized as follows. The next section contains an overview of essential literature on community indicators, with a view to guiding the elaboration of the conceptual model applied in this study. This is followed by a section describing the research population and methods and one presenting key results. The final section contains a discussion and conclusion. Further details and raw data are available as
Supplementary Materials.
2. Community Indicators in the Context of Transparency and Accountability Initiatives
Community indicators function at the intersection of three issues of high standing on the global policy agenda and SDG framework [
14]—namely, urban sustainability, transparency, and civic participation. As such, they relate to vast and overlapping academic disciplines, including policy studies, governance, communication, and management sciences [
9]. To contextualize our comparative, longitudinal evaluation of Latin American initiatives, we reviewed the literature for key findings in three areas: activities of sustainability indicator projects, their organizational structure, and their achievements, including longevity; a transversal concern in each area is the influence of contextual factors.
Context differences are under-researched regarding community indicator initiatives yet are likely to play a major role in their success or failure. Informed by sectoral reviews, such as the one by Wray et al. [
10], and the transparency and accountability literature, such as Grandvoinnet et al. [
13], contextual factors with major relevance for community indicator initiatives include the political–legal regime, data availability and the presence of alternative, competing transparency and accountability actions at the country and city levels.
With regards to organizational set-up, a joint venture of governmental and non-governmental organizations is often taken for granted [
15] or even put forward as the “best practice [
11]. A comparative review of the longevity of 82 indicator initiatives assessed the participation of governments and academic institutions and also concluded that “a broad and cross-cutting alliance of stakeholders is the most promising, because it can best ensure ongoing demand for the product, collective accountability, [...] a robustness of funding” [
2] (p. 25). The same study implicitly describes barriers impairing the long-term functioning of indicator initiatives, namely funding and sustained demand for indicator information. An organization’s legitimacy is also mentioned yet rarely studied comparatively; this is no surprise, as it is highly contextual and hard to operationalize [
16].
Research on indicator projects has been dominated for years by studies exploring how they select which indicators. One main distinction concerns bottom-up, participatory, and context-specific versus top-down, expert-led, standardized approaches, with each having advantages and advocates [
17,
18]. While a set of indicators can also be merged into one index, most initiatives forgo this option, as aggregation obscures meaning and transparency [
19]. Sustainability monitoring typically involves outcome indicators, often clustered in the environmental, social, and economic domains [
20]. According to a recent global analysis of 67 measurement initiatives, a city’s unemployment rate and green urban space are the most widely used indicators [
21]. For these two examples, indicator initiatives in rich countries can obtain relevant information from official statistics or they may just need to convert raw data into more meaningful indicators, such as “green space per capita”. For subjective wellbeing, however, another indicator that is widely used among community initiatives internationally [
2,
22], and pioneers in Latin America [
23,
24], all data needs to be collected through surveys, representing an expensive undertaking. In many indicator systems, political processes only receive marginal attention [
21], though exceptions have been documented, such as a multi-year, voluntary benchmark among Dutch municipalities exclusively tracking sustainability policies [
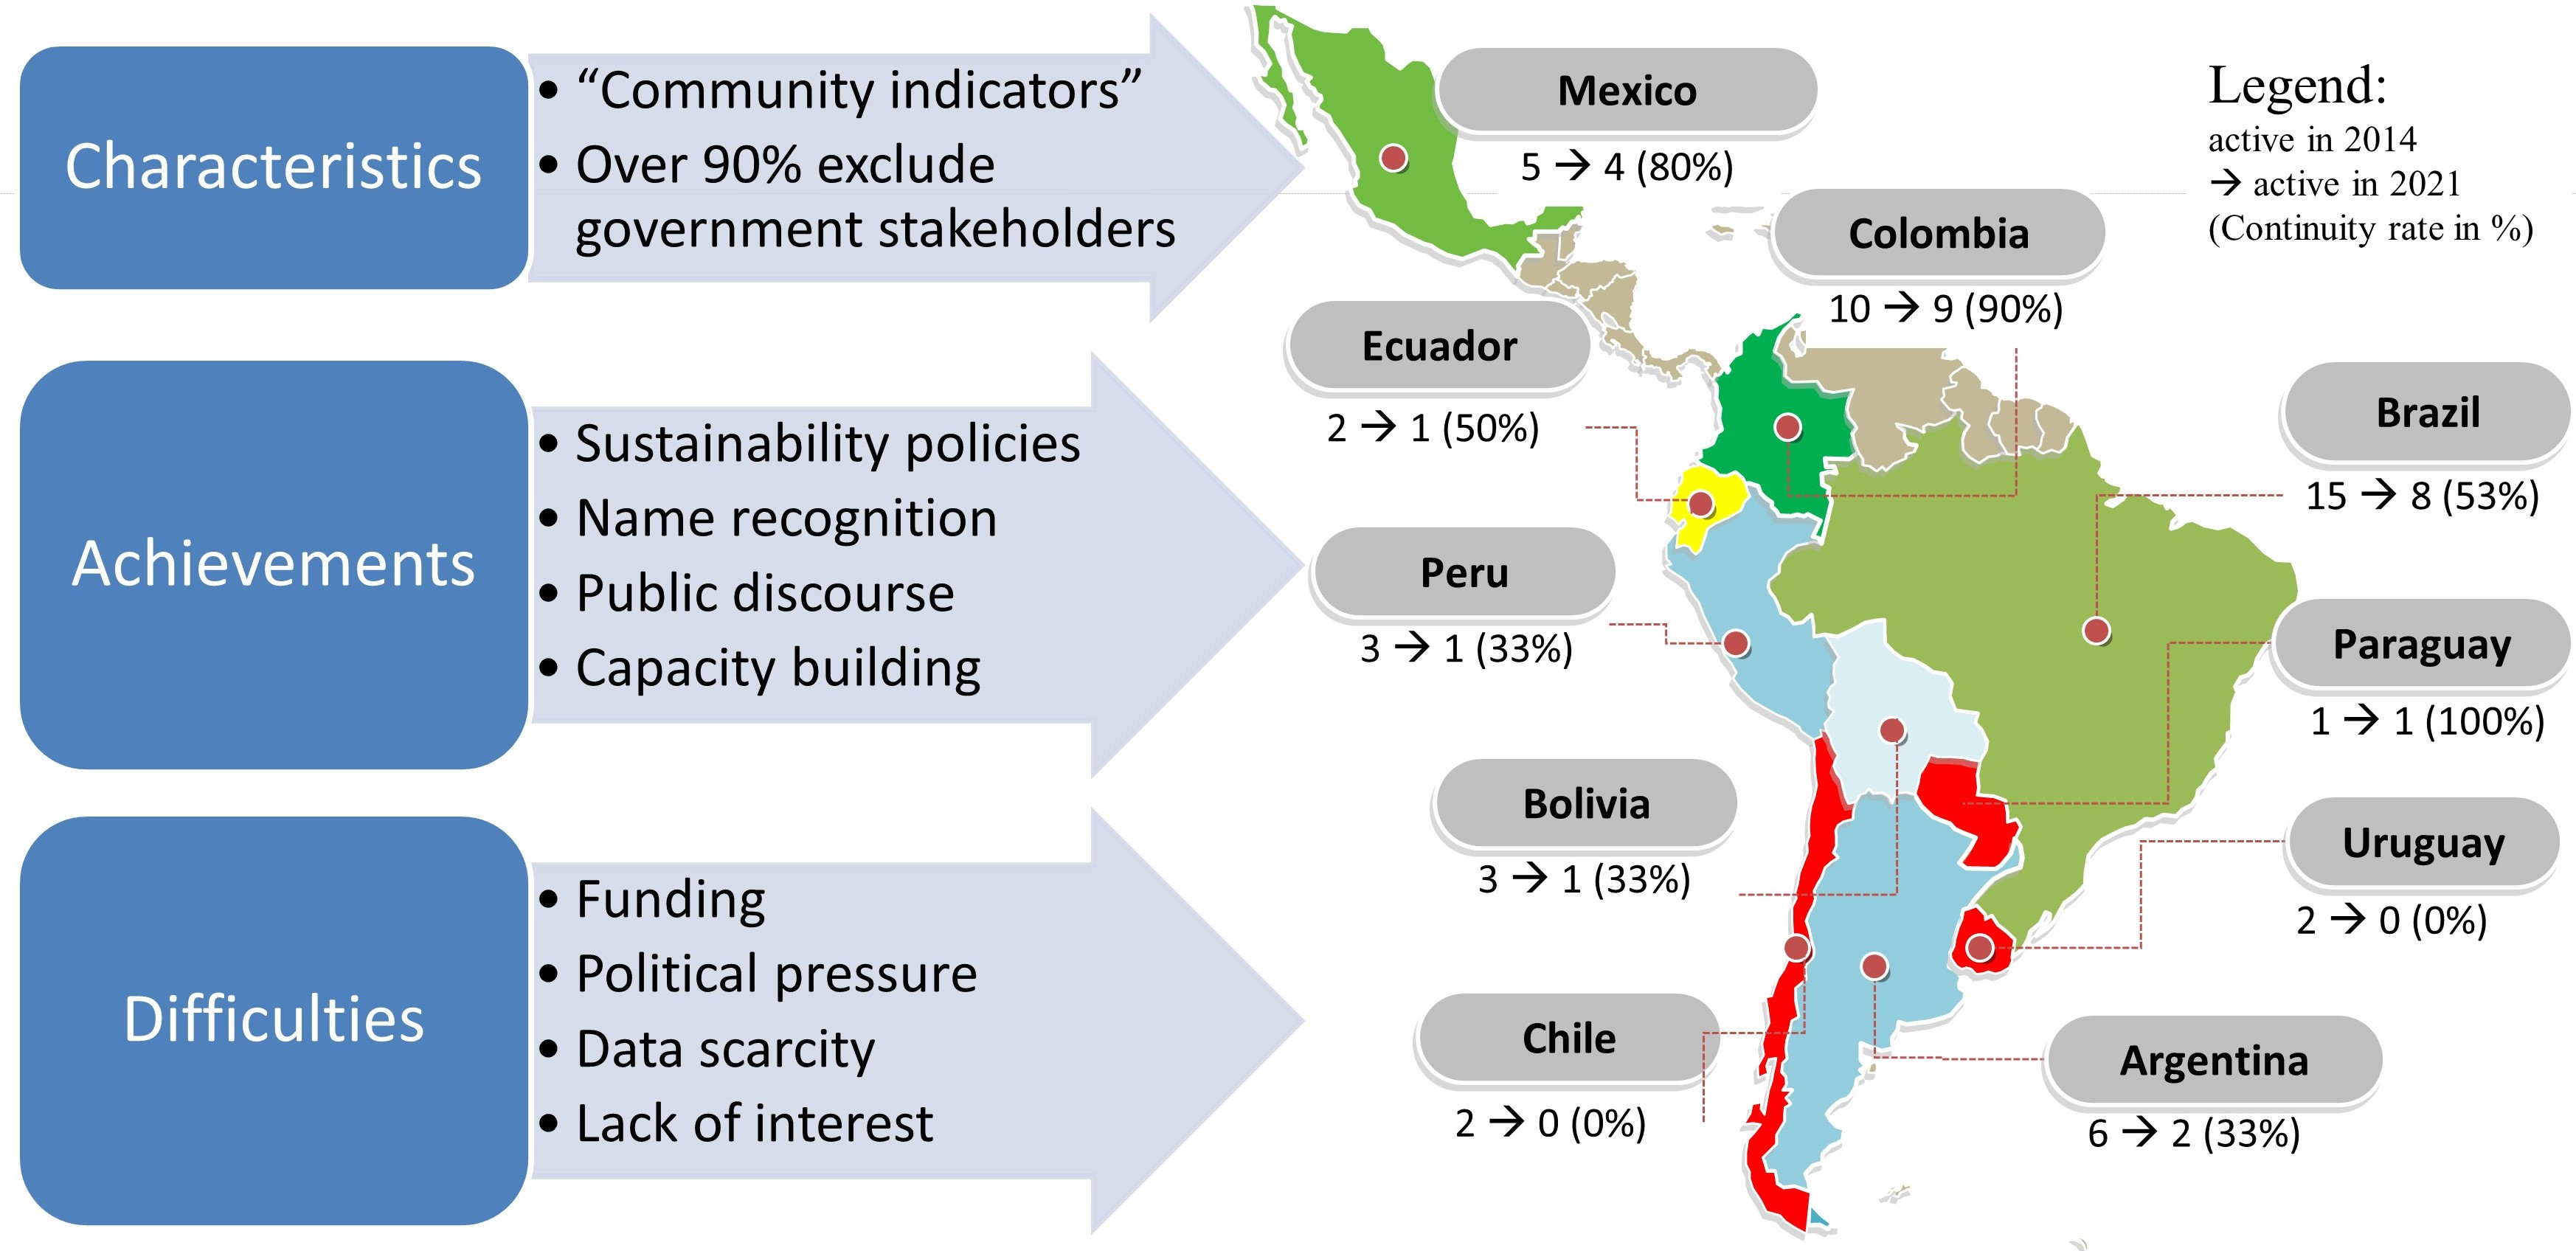
25]. Further, in addition to reporting outcome indicators, many initiatives deal with political processes, either through monitoring policy-related indicators—for example, government expenditures—or active community engagement, for example, by organizing round tables, public events, and so forth.
Figure 2 visualizes this array through sample activities found in this study and the literature [
4]. The set is non-exhaustive, but it illustrates the spectrum of activities involving indicator reporting (concerning outcomes in the city and processes or inputs by the local government) and actions for community engagement. The latter may also be conceptualized as targeting generic processes (e.g., via community events) as well as the outcomes of deliberations, such as formalized spatial development plans. This spectrum mirrors that of sustainability reporting by local governments; a study by Niemann and Hoppe concerning the practices of European pioneers found significant divergence in terms of content along outcome and process dimensions and various degrees of citizen engagement strategies [
26]. A number of North American community indicator initiatives also attempt to monitor government performance at large [
27]. On the other hand, process-focused activities may also be carried out by other organizations not working on sustainability. From this perspective, community indicator projects with their diverging scope of community engagement can be conceptualized as belonging to the broad field of transparency and accountability initiatives [
13].
Assessments of effectiveness conceptually require taking objectives into account so one can measure progress against actual goals. Naturally, goals differ between indicator projects in different contexts and lifecycles [
28]. Beyond the implicit notion of improving local governance and sustainability, however, initiatives often lack explicitly stated objectives [
29]. To help assess outcomes in general terms, other studies about sustainability indicators [
30] distinguished three clusters of use and influence: instrumental (i.e., bearing on decision and policymaking), conceptual (e.g., learning and capacity development among public servants), and political–symbolic (e.g., public discourse). These clusters overlap but help identify intended effects—such as instrumental influence on local government policies—as well as unintended uses and misuses.
A common challenge for research on the effects of “infomediaries” [
13] and multi-stakeholder actions is identifying causality. As all community indicator projects operate in networks (of different data providers, users, target audiences, etc.), their societal impact cannot be studied in isolation but requires a systems perspective. The method of process tracing allows for the gathering of high-quality evidence; a study applying it to three American community indicator initiatives found positive impacts regarding agenda-setting and other dimensions [
29]. Process tracing and similar methods, however, require complex methodological rigour, which cannot easily be applied at a large scale. This explains why large-N comparative studies typically resort to more superficial measures of success, such as organizational survival or “staying power” [
2].
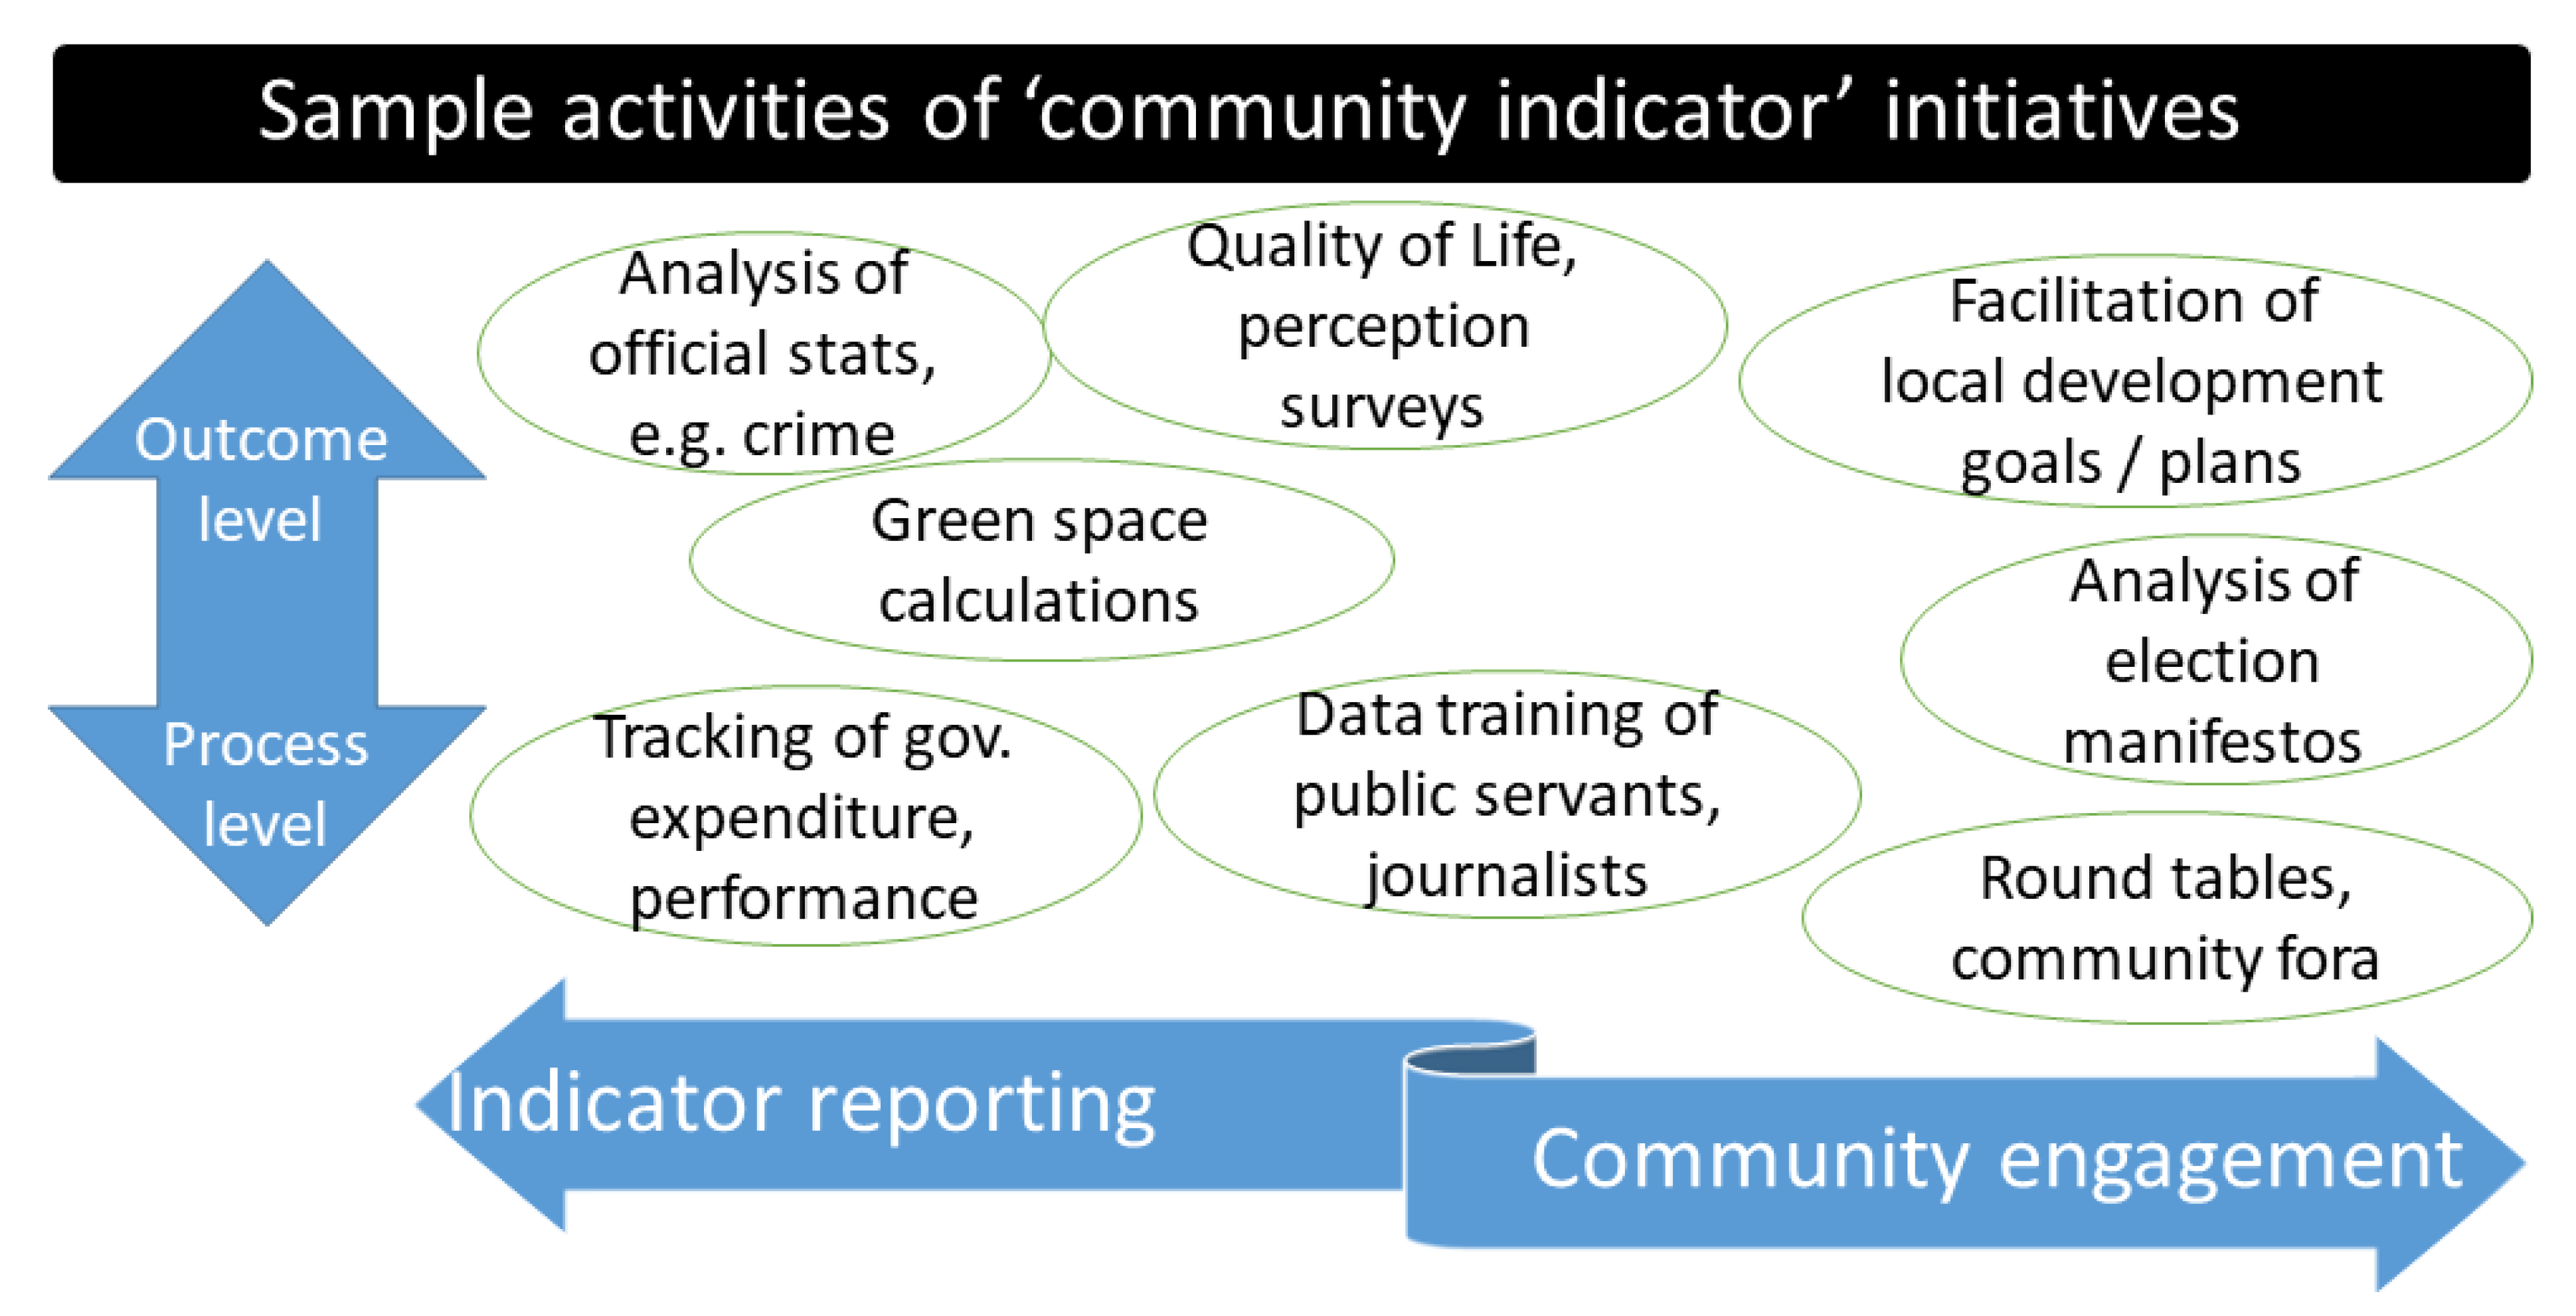
Figure 3 summarizes the main factors thus identified in this literature review—various contextual factors (at country and city levels) as well as design choices (in particular, about organizational set-up and actions) that have a bearing on what community indicator projects achieve in terms of uses and influence. A further variable of interest is organizational evolution, which also serves as a reminder that none of the other constructs are static but actually co-evolve over time.
3. Population and Methods
The world’s “battle for sustainability will be won or lost in cities”, the United Nations proclaimed [
31]. According to this metaphor, Latin America is an important battleground inasmuch as it is the world’s most urbanized region, where about 80% of the population lives in cities. In 2011, the Latin American Network for Fair, Democratic, and Sustainable Cities (In Spanish:
Red Latinoamericana por Ciudades y Territorios Justos, Democráticas y Sustentables) was created by community indicator organizations from across the region. Some, for example,
Bogotá Como Vamos, had already been working for years with salaried staff. In other countries (e.g., Ecuador), all initiatives were run by volunteers, without funding or legal status, and with just a Facebook page to begin with. In conferences and discussions, a shared purpose was agreed—namely, promoting equitable development and democracy by reporting on sustainability indicators and the local government’s management—as well as the stipulation that members are civil society organizations. In terms of joint activities, priority was given to communication (websites, newsletters, etc.) and developing an indicator database for benchmarking. In the absence of their own financial resources, grants from philanthropic foundations (notably, AVINA) allowed the funding of a part-time communication officer in Lima, a secretary in Mexico, and consultants in Brazil developing a collective indicator database (For joint communication, the network used to run the website
www.redciudades.net (accessed on 1 April 2021) that following the end of project funding, has been offline since 2016). Network representatives also decided to support this longitudinal research by sharing the (contact) details of member initiatives and volunteering to be interviewed. Importantly, key informants concurred that the network included virtually all relevant, city-based Latin American initiatives and that no alternative institutional model (such as sustainability reporting by local governments) were prevalent in any country. Therefore, membership, as assessed in 2014, can be considered representative of the population of Latin American community indicator initiatives at the time. The network counted 65 initiatives on its own website, but verification of individual internet sites showed 8 as actually inactive in 2014. As documented in the
Supplementary File, these initiatives were discarded from this longitudinal study, just as 8 fledgling initiatives only started in 2013 (As also documented in the
Supplementary File, at least 9 initiatives have been founded since 2014, including one in Guatemala, as an additional country). Therefore, the main sample consisted of 49 city-based community indicator initiatives started by 2012 and active in 2014.
For research on the practices, experiences, and long-term viability of these Latin American community indicator initiatives, the conceptual model derived from previous studies (cf.
Figure 3) served as a starting point. For each of its main dimensions (context, set-up, actions, use and influence, evolution), we identified the key parameters and data collection methods, as presented in
Table 1. To assess an initiative’s context, we relied on “hard data”, such as city population numbers and the UN’s Human Development Index at the country level. To explore the political–legal landscape, we further mapped country ratings from four international indices (by the World Bank, Transparency International, Reporters Without Borders, RTI). Such governance indicators are methodologically contested [
32,
33], unsuited to reliably capture all discontinuities, such as those arising from radically different presidencies in Brazil and Mexico, and not necessarily valid sub-nationally. However, country differences plausibly have repercussions at the city level and comparative indices may be meaningful to show overall trends and country clusters. For further validation and information at the city level, we interviewed and surveyed representatives of indicator initiatives in Spanish (and in Portuguese for Brazil).
The main survey contained open and closed questions about each initiative’s set-up, objectives, activities, and experiences (including political interference and quality of public data). It was sent electronically in 2014 and responded to by 44 initiatives, a 90% response rate. Most answers were given by a person with high knowledge of internal processes, such as the initiative’s director, and included frank statements about sensitive topics, such as relations with local governments. In response to requests for confidentiality, the survey and interview data were anonymized and summarized at the country level without identifying individual cities. Additional interviews were held with 11 representatives of indicator initiatives in 2014, 2019, and 2020.
To assess current activities, the websites of all initiatives were screened in 2021. This allowed for reliably mapping whether an initiative publishes indicators (on sustainability, quality-of-life, or government performance) but not their inherently diffuse and less visible community engagement activities; the majority of initiatives lack annual reports. Uses and influences were assessed qualitatively, with estimations (in 2014) of name recognition among various target groups serving as one quantifiable proxy indicator.
An initiative’s level of continuity in 2021 was assessed through the visibility of activities on the internet. If an initiative’s main website no longer existed, alternatives were explored via search engines and social media sites. If the initiative showed substantial activity in any channel (beyond a simple “like” or retweet) in the last 6 months, it was classified as “active”. If no sign of life was found in more than 12 months, the initiative was classified as “discontinued”, and cases in between as “unclear” (see
Supplementary File for details). Average continuity or “survival rates” were subsequently compared to other factors, such as city size and country context. Comparisons based on country averages, however, are only explorative in nature due to the small number of cases involved.
4. Results
To structure this section, we present our findings as responses to three research sub-questions. These are descriptive (about the functioning of community indicator initiatives), analytic (about their experiences), and tentatively predictive (exploring the relationship between continuity and context).
4.1. Sub-Question (1): How Do City-Level Community Indicator Initiatives Function in Different Latin American Countries?
The Latin American community indicator initiatives studied hail from a geographically vast area, as they work in 49 cities located in 10 countries between Mexico and Argentina. See the
Supplementary Files for details on names, city population, year of establishment, main activities, and website.
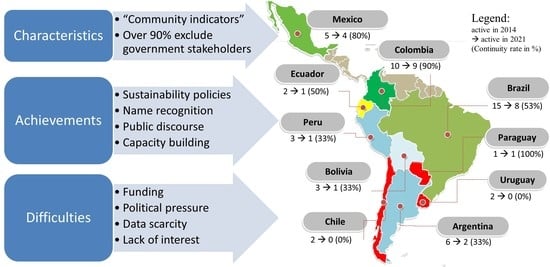
Table 2, below, summarizes, at the country level, the number of initiatives that existed in 2014, with certain characteristics in terms of organizational set-up and actions, and that continue to exist in 2021. As evident from this table and the
Supplementary File, Brazil (15) and Colombia (10) have had the largest number of initiatives. Some were started in small municipalities of just 20,000 inhabitants but the majority in large cities. The average population size is close to 2 million, and from among the 10 largest Latin American cities, all except for Caracas were at some moment represented in the
Latin American Network for Fair, Democratic and Sustainable Cities. In terms of organizational set-up, a large majority of initiatives are distinct civil society organizations. Exceptions include those where the community indicator work is run as another NGO’s project, or entirely by volunteers, or as a public–private partnership led by a local government. In fact, local governments are only included as stakeholders in 6% of all initiatives. Significantly more prevalent are media firms (stakeholders in 50% of all initiatives), academic institutions such as universities (63%) and business institutions (e.g., chamber of commerce), and private foundations (69%). Whereas initiatives called
Cómo Vamos are usually governed by three or four-member institutions, others opted for more fluid internal governance;
Nossa Sao Paolo auto-identifies as a network with hundreds of stakeholders. In 2014, the number of salaried staff varied from 0 (in fledgeling initiatives or those organized purposefully as a “citizen collective”) to 13; the median was 3.
In terms of activities assessed in the study period, about a third of initiatives dedicated explicit attention on their websites to their local government’s policies, such as ordinances and compliance with election pledges. Most combined reporting about a set of sustainability-related indicators (obtained from official sources) with those of quality-of-life surveys implemented by the initiatives themselves. In Colombian cities, such subjective perception surveys are a trademark activity and implemented annually via professional pollsters contracted at a high cost. Other initiatives only have periodic surveys. One Ecuadorian, volunteer-run initiative used sociology students assigned by their university for polling. All initiatives also carry out a wide array of outreach activities not amenable to simple quantification. A case in point is capacity building; “the personnel of eight municipalities have been trained to fill out the files to collect the indicators. It’s a permanent job”, explained informant PE#3. Other examples include organizing public debates with mayoral candidates in the run-up to elections [
34] and numerous thematic round tables with officials and experts about issues such as sustainable transport or child malnutrition. In terms of organizational continuity, the verification of internet sites showed that 55% of the 49 initiatives tracked since 2014 were assessed as being active in 2021.
4.2. Sub-Question (2): What Do Such Initiatives Perceive as Their Objectives, Barriers, and Achievements?
According to the charter of the Latin American Network for Fair, Democratic and Sustainable Cities (agreed upon in 2011), member initiatives have five common objectives: (i) to monitor a city’s situation in terms of quality-of-life, social justice, democracy, and sustainability; (ii) to promote civic participation; (iii) to monitor and influence public policies; (iv) to promote space for dialogue between civil society, the private sector, and the state; (v) to disseminate information and knowledge for informed civic participation and decision-making processes. In terms of target groups and strategies, the sampled initiatives developed a range of priorities. Whereas virtually all (95% of survey respondents) considered elected officials a main target group, about 60% also targeted researchers and staff in public institutions. As a Peruvian respondent (PE#03) explained, “The work is in stages. We are giving priority to young people through actions and training. The media is getting information and workshops, just as the technical personnel of the institutions, the latter primarily on indicator issues. Social leaders are convened; we sign institutional agreements”.
Since (indicator) data represent the lifeblood of initiatives, their availability and reliability are a main concern in some countries. In Bolivia, a respondent (BO#1) explained that “there’s very little access to information. Normally we gather it from sources such as interviews and focal groups”. In neighbouring Chile, “the official statistics generally have high fidelity” (CH#2). At an aggregate level, 7% of survey respondents in 2014 considered data obtained from national sources as having no or little reliability, and even 28% thought so of data from local sources. The former, however, are often not usable at the local level; as an Argentine respondent (AR#5) explained, “we were unable to access disaggregated data in our locality”.
To explore barriers and bottlenecks, the survey contained questions about the prevalence of difficulties in several areas—out of these, finding suitable staff and media attention was not considered problematic by most respondents. Over 50% of them, however, reported significant difficulties in accessing indicator data and finding funding (for running costs and specific projects). Further, on a survey question about political pressure or interference (in relation to areas of work, research, positive and negative news, and involved personnel), 38% of initiatives indicated suffering from them “frequently” or “very frequently”; only a third did not experience pressures. Sometimes this was experienced as a matter of evolving trust—in the words of one Peruvian informant (PE#3), “At the beginning of our activities, there was mistrust of our institution and it was accused of having a political overtone—this on the part of the municipal authorities and also in some cases of civil society”. In other instances, however, maturing initiatives felt increasing heat. A Brazilian informant (BR#5) stated, “We are going through a period of great political pressure from the current municipal public administration”.
Achievements are largely intangible and hard to measure. To quantitatively assess to what extent initiatives were effective in achieving name recognition, the 2014 survey asked respondents to estimate which percentages of three target groups knew the initiative’s work; the reported averages were 26% for the city’s general population, 49% for relevant technical staff of public institutions, and 72% for decision-makers such as the mayor and councillors. Regarding the latter, individual responses ranged from 1% to 100% between fledging and mature organizations. It is worth mentioning that some indicator initiatives assess their name recognition via surveys, and also have reliable ways to monitor their interaction with office-bearers if they are invited to present quality-of-life survey results in, say, a municipal council meeting. As a Colombian informant (CO#3) explained, “The percentage of the population was measured in our citizen perception survey [...]. Among decision-makers, everyone knows us because we constantly interact with them, either requesting information or at different round tables”.
Regarding other outcomes, key informants reported evidence of effects (in some cases backed up by detailed explanations in annual reports) in various dimensions. In terms of conceptual use and influence, 77% of survey respondents indicated having contributed to the development of capacities among public institutions. As a Peruvian respondent (PE#03) stated, “We have achieved that information-generating institutions, as well as public institutions, disseminate their information and try to update it [as] municipal public servants are finally understanding the importance of data”. Regarding instrumental use and influence, 72% of initiatives (according to the survey) reported having had some—and 30%, even “very large”—achievements in influencing the design of public policies. According to a Colombian respondent (CO#8), “We made recommendations on the elaboration of the municipal development plans [and] 20% of our recommendations were accepted”. A major achievement for many initiatives—especially in Brazil and Argentina—was also the successful lobby for new bylaws introducing a legal obligation for mayoral candidates to create action plans with targets for various sustainability indicators, about which the elected mayor then has to report back in public accountability meetings; such bylaws are known as “plan(o) de metas” in Spanish and Portuguese [
35]. By nature, the cluster of political–symbolic uses and influences is the most intangible; one economic way to assess them is through subjective perceptions of key informants and proxy indicators such as media coverage. Over 90% of survey respondents reported that their initiative had contributed to the city’s agenda, public discourse, and knowledge. As an Argentine informant (AR#3) observed, “if by impact we understand that the issues are debated or published, we have had important achievements since in general, the information that we produce is published by the main media outlets”.
4.3. Sub-Question (3): Which Contextual Factors in Combination with Organizational Strategies Are Associated with the Success and Failure of These Initiatives?
The analysis of activity levels showed that 27 of 49 (i.e., 55%) of city initiatives sampled in 2014 were confirmed as active in 2021, but 13 were classified as “discontinued” and 10 as “unclear”; the latter category applies to initiatives with a functioning website but no evidence of recent activities (cf.
Supplementary File). This leads to a conservative estimate of continuity since some of the initiatives classified as “unclear” continue to work as a less formalized citizen movement with rudimentary social media activity. Interestingly, the cities hosting each of these three groups (active, unclear, and discontinued) showed similar average population numbers. Therefore, city size does not appear to be a predictor of long-term viability. It deserves mentioning, though, that small, rural communities were overrepresented among the initiatives that had stopped by 2014 (cf.
Section 3).
Chile, Ecuador, Paraguay, and Uruguay each had only one or two initiatives in the initial sample, which implies a limited base for generalizations. In these cases, the average “survival rates” thus need to be interpreted with much caution. Nonetheless, the number of initial initiatives per country appears to matter. As shown in
Table 2, Brazil (53%), Colombia (90%), and Mexico (80%) showed the highest continuity rates. The first two also have active networks at the national level (
www.redcomovamos.org (accessed on 1 April 2021) and
www.cidadessustentaveis.org.br (accessed on 1 April 2021). (The Colombian network also registered
Cómo Vamos as a national trademark; elsewhere, the brand is not protected and has been adopted by other actors such as a newspaper in Mexico City). With its 90% survival rate, the Colombian model, including its established brand and tight internal governance (centred around a small set of stakeholders including a media firm, university, and chamber of commerce), is ostensibly successful. According to the network’s website, it now boasts 16 initiatives covering 60% of Colombia’s urban population. A similar institutional
Cómo Vamos model was successfully emulated in Lima but abandoned in Rio de Janeiro. In several countries, network-oriented models prevailed. As a radical example of a community indicator initiative of the non-institutionalized type, a “citizen collective” in the Ecuadorian city of Cuenca has now run successfully for 10 years with neither legal personality nor salaried staff. Both tight and loose, network-oriented models of internal governance have thus been shown to thrive. This is also evident from diverging advice given by key informants about institutional strategies: “Make sure to establish an organizational structure very early in order to receive resources and have professionals working full time” (BR#9) versus “be an inclusive movement and look for less institutionalized operating models” (BR#2).
To explore the relevance of contextual factors,
Table 3 shows the number and percentage of surviving initiatives per country juxtaposed to the selected sample of socio-economical and governance indices. Due to methodological limitations, including the small number of cases and untested validity of country governance assessments, statistical analyses are not meaningful. However, the data suggest the presence of country clusters. Chile and Uruguay are, according to international comparisons (with
Table 3 showing most recent data available), the region’s top performers in terms of government effectiveness, press freedom, and low levels of perceived corruption. Bolivia, Paraguay, and Peru represent the other end of the spectrum, while Argentina holds a middle ground. In five of these six countries, the observed continuity rate is below 50%, whereas it is higher in the four countries occupying average positions in regional comparisons of human development (as measured by the HDI) and governance. (Paraguay had seen the emergence of five initiatives since 2013 that did not attain organizational continuity. The one established in its capital in 2010 and included in this study remains active.) At the city level, these observations match the prevalence of obstacles reported by key informants. In Chile and Uruguay, the quality of public data sources and political interference was no major concern. In Bolivia, Peru, and Paraguay, however, access to data was a frequently mentioned problem. Another dimension on which key informants reported diverging experiences is political interference and intimidation at the city level—these were high in Mexico and Brazil but virtually absent in other countries (According to the RTI, Paraguay, Bolivia, and Ecuador have poorly developed access to information laws, whereas Mexico belongs to the world’s top performers. At the city level, key informants reported that progressive laws can be helpful yet miss immediate relevance for their work if public institutions do not collect sustainability data).
5. Discussion and Conclusions
In response to the research question “Which design and context factors are associated with the influence and long-term viability of community indicator initiatives in Latin American cities?”, this study showed that 49 initiatives located in 10 countries had an average continuity or survival rate of 55% after seven years. This is a conservative estimate since some of the remaining 45% may be active in a different or less institutionalized form.
Our finding that many initiatives fizzled out over time complements evidence from other continents (e.g., [
4]). Underneath the regional averages, we found significant differences at the country level. Some countries studied for this article—notably, Colombia—evidenced high continuity rates of 90%, with further institutional growth in recent years. Importantly, community indicator initiatives struggle in different contexts for different reasons. Our data suggest that in higher income and more democratic countries, maintaining institutional funding and sustained (media) attention are common difficulties, while the absence of immediate policy impacts constitutes a main reason for disillusionment among practitioners. In poorer or more violent contexts, however, scarce availability of reliable public data and political intimidation often represent additional existential threats for community indicator projects. This finding aligns with the growing body of literature about the fate of transparency and accountability initiatives [
36] and makes a new contribution to community indicator research, which has hitherto been biased in favour of high-income countries, while ignoring developments in the Global South.
Regarding their organizational set-up, virtually all Latin American community indicator initiatives are civil society alliances excluding governmental stakeholders. This differs from other world regions and challenges “best practice” recommendations about the inclusion of governments [
11]. Moreover, successful Latin American initiatives show diversity in their organizational set-up; whereas some are governed by a small set of founding members (notably, philanthropic foundations, media firms, and universities), others function as looser networks.
The implementation of citizen perception surveys proved an expensive yet effective way of gaining wide (media) attention. This mirrors similar trends found by scholars elsewhere [
2,
37]. Many Latin American initiatives also offer training in data literacy and indicator use to diverse target groups, such as public servants, journalists, and community leaders. According to key informants, and corroborated by evidence including representative household surveys, several initiatives also gained significant name recognition in their cities among the general public, technical staff of local governments, and political decision-makers, such as the mayor and councillors. Using their standing, some initiatives successfully influenced public policies such as municipal development plans; another achievement in several cities concerned the approval of new legal requirements for local governments to incorporate sustainability considerations and citizen-led accountability fora into their planning and reporting systems. For relatively small organizations with usually less than 10 staff members, these are significant achievements in megacities such as Bogotá, São Paulo, Lima, and La Paz, where numerous pressure groups vie for attention.
This study is exploratory in nature, which implies methodological limitations. Tracking dozens of initiatives over time required selecting a limited set of research constructs, and thereby disregarding the complex nature, evolution, and interaction between a country’s and city’s context and a networked community indicator initiative. However, to avoid blind spots, we supplemented the deductive analysis of constructs derived from previous research with qualitative, inductive feedback from key informants.
More research is needed. Our findings and the conceptual models developed (cf.
Figure 3,
Table 1) contain leads for further investigations. To facilitate follow-up research, a number of hypotheses (and the countries serving as relevant cases) were identified for each of the main dimensions of the conceptual model, as listed in
Table 4. In terms of context, for example, we surmise that the demise of civil society-run community indicator initiatives in Chile and Uruguay may partially be attributable to the relatively better quality of government-run indicator systems in these countries (cf. [
38]). In terms of organizational set-up, partnerships with media firms perceived as unbiased (where available) are hypothesized to foster organizational continuity. Further research on internal leadership and the choice of working as broad networks or via a small group of stakeholders will help elucidate the relative advantages of each strategy and how these play out over time. Such studies may be informed by findings in the literature that any (performance) indicator system requires continual reconsideration [
39], and that citizen participation tools should be aligned to a local population’s evolving “sustainability literacy" [
40]. Regarding activities, we hypothesize (based on findings in various countries) that the implementation of surveys that tap citizens’ satisfaction with mayors may bring attention but also accusations of partisan meddling. Beyond these hypotheses, further research is needed for several other issues, such as the precise nature of community engagement strategies, including cooperation with other urban movements [
41], and various ways of using indicators and indices, as well as relating local monitoring efforts to international frameworks such as the UN’s Sustainable Development Goals [
42].
We conclude by positing that 20 years of sustainability indicator projects in Latin America offers a wealth of lessons for this and other world regions. Arguably, the “socio-ecological niche” and potential positive contribution of community indicator projects is globally increasing due to three major trends: (i) continued urbanization, (ii) increased data availability due to public investments, technological developments, and open data laws and (iii) many increases in socio-economic inequalities, recently exacerbated by the viral pandemic. Sadly, the more unequal a city, the more informative and newsworthy a localized comparison of relevant indicators. In this endeavour, collaboration involving researchers, practitioners, and policymakers is key, as is stamina. As an Argentine informant (AR#3) recommended to others wanting to start a community indicator project, “It is very important to have and guarantee the continuity of the work long-term. Keep in mind that we work with people and that the generation of trust is a central point for the success of the initiative. It is very important to achieve the most heterogeneous participation possible so that different sectors feel identified and represented”.


