Article

Visual Characteristics of Drivers at Different Sections of an Urban Underpass Tunnel Entrance: An Experimental Study

School of Transportation, Wuhan University of Technology, Wuhan 430063, China
*
Author to whom correspondence should be addressed.
Sustainability 2021, 13(9), 5224; https://0-doi-org.brum.beds.ac.uk/10.3390/su13095224
Submission received: 1 April 2021 / Revised: 25 April 2021 / Accepted: 30 April 2021 / Published: 7 May 2021

Abstract

:
The increase in the number of traffic accidents due to the increasing number of urban underpass tunnels necessitate a better investigation of drivers’ visual characteristics when entering the tunnels. A total of 20 drivers were gathered to perform a real vehicle experiment in an urban underpass tunnel. The saccade angle, saccade frequency, and fixation time were selected as the research indexes. The urban underpass tunnel entrance was divided into five sections, namely the external straight line section, the upper half of the ramp, the lower half of the ramp, the shading shed section, and the entrance inner section. The results showed that the saccade angle and frequency of the ramp were significantly smaller than that of the external straight line and the tunnel interior, and the saccade range in front of the entrance was more concentrated. The changes in fixation time and the difference range of 15th-85th fixation time threshold in each section were analyzed. The fixation time of all sections was distributed within the range of 149.476 to 475.414 ms. The driver’s fixation was more and more concentrated when the sidewalls were higher and closer to the portal.

1. Introduction

With rapid urbanization, underpass tunnels have become a new type of road form in many major cities. Compared to conventional counterparts, urban underpass tunnels have a crucial impact on drivers’ sight distance and sight zone due to their unique alignments, including wide road environment outside the entrance, downhill in front of the entrance, sidewalls on both sides of the downhill, and monotonous limited space in the tunnel [1]. The sustainability of urban tunnel traffic development is not only reflected in energy and environment [2], the improvement of tunnel traffic environment and traffic safety will be conducive to healthy and sustainable development.
After entering the tunnel, the driver suffers from poor visual environment and lacks visual impact in this relatively confined environment [3]. Furthermore, the driver’s vigilance reduces, which leads to distraction [4,5]. Compared to uphill in the tunnel exit, drivers are more nervous when driving downhill [6]. The dramatic transition in the visual environment while entering the tunnels often increases the likelihood of traffic accidents, such as rear-end collisions. The accident rate near the entrance and exit of tunnels is significantly higher than that of other sections [7]. A study in Singapore analyzed 608 traffic accidents in tunnel and the results also showed that the traffic accident rate in the transition zone was higher than that in the interior, and the accident type was mainly multivehicle collisions [8].
Existing studies have shown that the safety and accident prevention techniques destined for tunnels need to integrate the principles of physiology and ergonomics with a particular focus on the visual adaptability of drivers [9]. Understanding drivers’ physiological, psychological and accident proneness would help to design safety policies and improve road safety [10]. In the research of driver’s visual characteristics aiming at the white and black hole effects at the tunnel entrance and exit, the visual oscillation duration was used to quantitatively evaluate the visual load and driving safety [11]. The difficulty of visual information was closely related to visual characteristics, such as driver’s fixation time, which was positively correlated with the difficulty of the work and the visual load [12]. When entering a highway tunnel, the average fixation time of drivers in the daytime showed an increase, which was negatively correlated with the vehicle speed. It should be noted that the same behavior was not observed at night [13]. In the straight-line section of the tunnel, the fixation point was concentrated on the visual centroid of the tunnel. The average fixation point, however, was concentrated on the sidewall of the tunnel when making a turn [14]. The fixation of experienced drivers was mostly concentrated in the center of the sight area compared to novice drivers [15]. While driving into the curved sections of extra-long urban underwater tunnels, the driver’s saccade time increased with the increase of section radius, and the visual load on small radius curves and long straight sections was higher [16].
Gil-Martín et al. proposed a reasonable setting of shading sheds to improve the visual adaptability at tunnel entrances and hence the traffic safety [17]. Zhang et al. studied the impact of sun glare on traffic safety in urban tunnels and designed a sunshade system [18]. Wan et al. studied the impact of signs on the sidewalls of highway tunnels to determine the low-cost traffic engineering methods [19]. The results revealed that the color and frequency of signs had a significant impact on the stimulation of drivers’ reaction time. Zheng et al. used a visual guiding method to improve drivers’ sense of speed, distance, direction, and position in tunnels [20]. Chen et al. analyzed the influence of sidewall decoration on drivers’ brain activity through experiments, and the results validated that sidewall decoration could provide the drivers with better space and speed perception [21]. Qin et al. found out that visual comfort and driving safety inside the tunnel could be improved by adding environmental information on tunnel sidewalls [22].
The current research mainly focuses on highway tunnels and their inner sections, often neglecting the visual characteristics of drivers in urban underpass tunnels, especially in the entrance sections. The entrance of urban underpass tunnel is quite different from that of highway tunnel. For example, the road before urban underpass tunnel portal is a continuous downhill, and there are side walls on both sides of the ramp, and the tunnel entrance is usually equipped with a shading shed. Hence, this paper studies these characteristics in the external straight-line section, the entrance ramp section, and the entrance internal section, based on the alignment before tunnel entrance and the characteristics of sight distance and sight zone. Based on the analysis of fixation and saccade characteristics, the fixation time threshold of each section is analyzed, and accordingly, the measures to improve visual guiding are provided. We believe that our work investigating the entrance section of urban underpass tunnels will positively impact traffic safety, reducing the number of accidents.

2. Materials and Methods

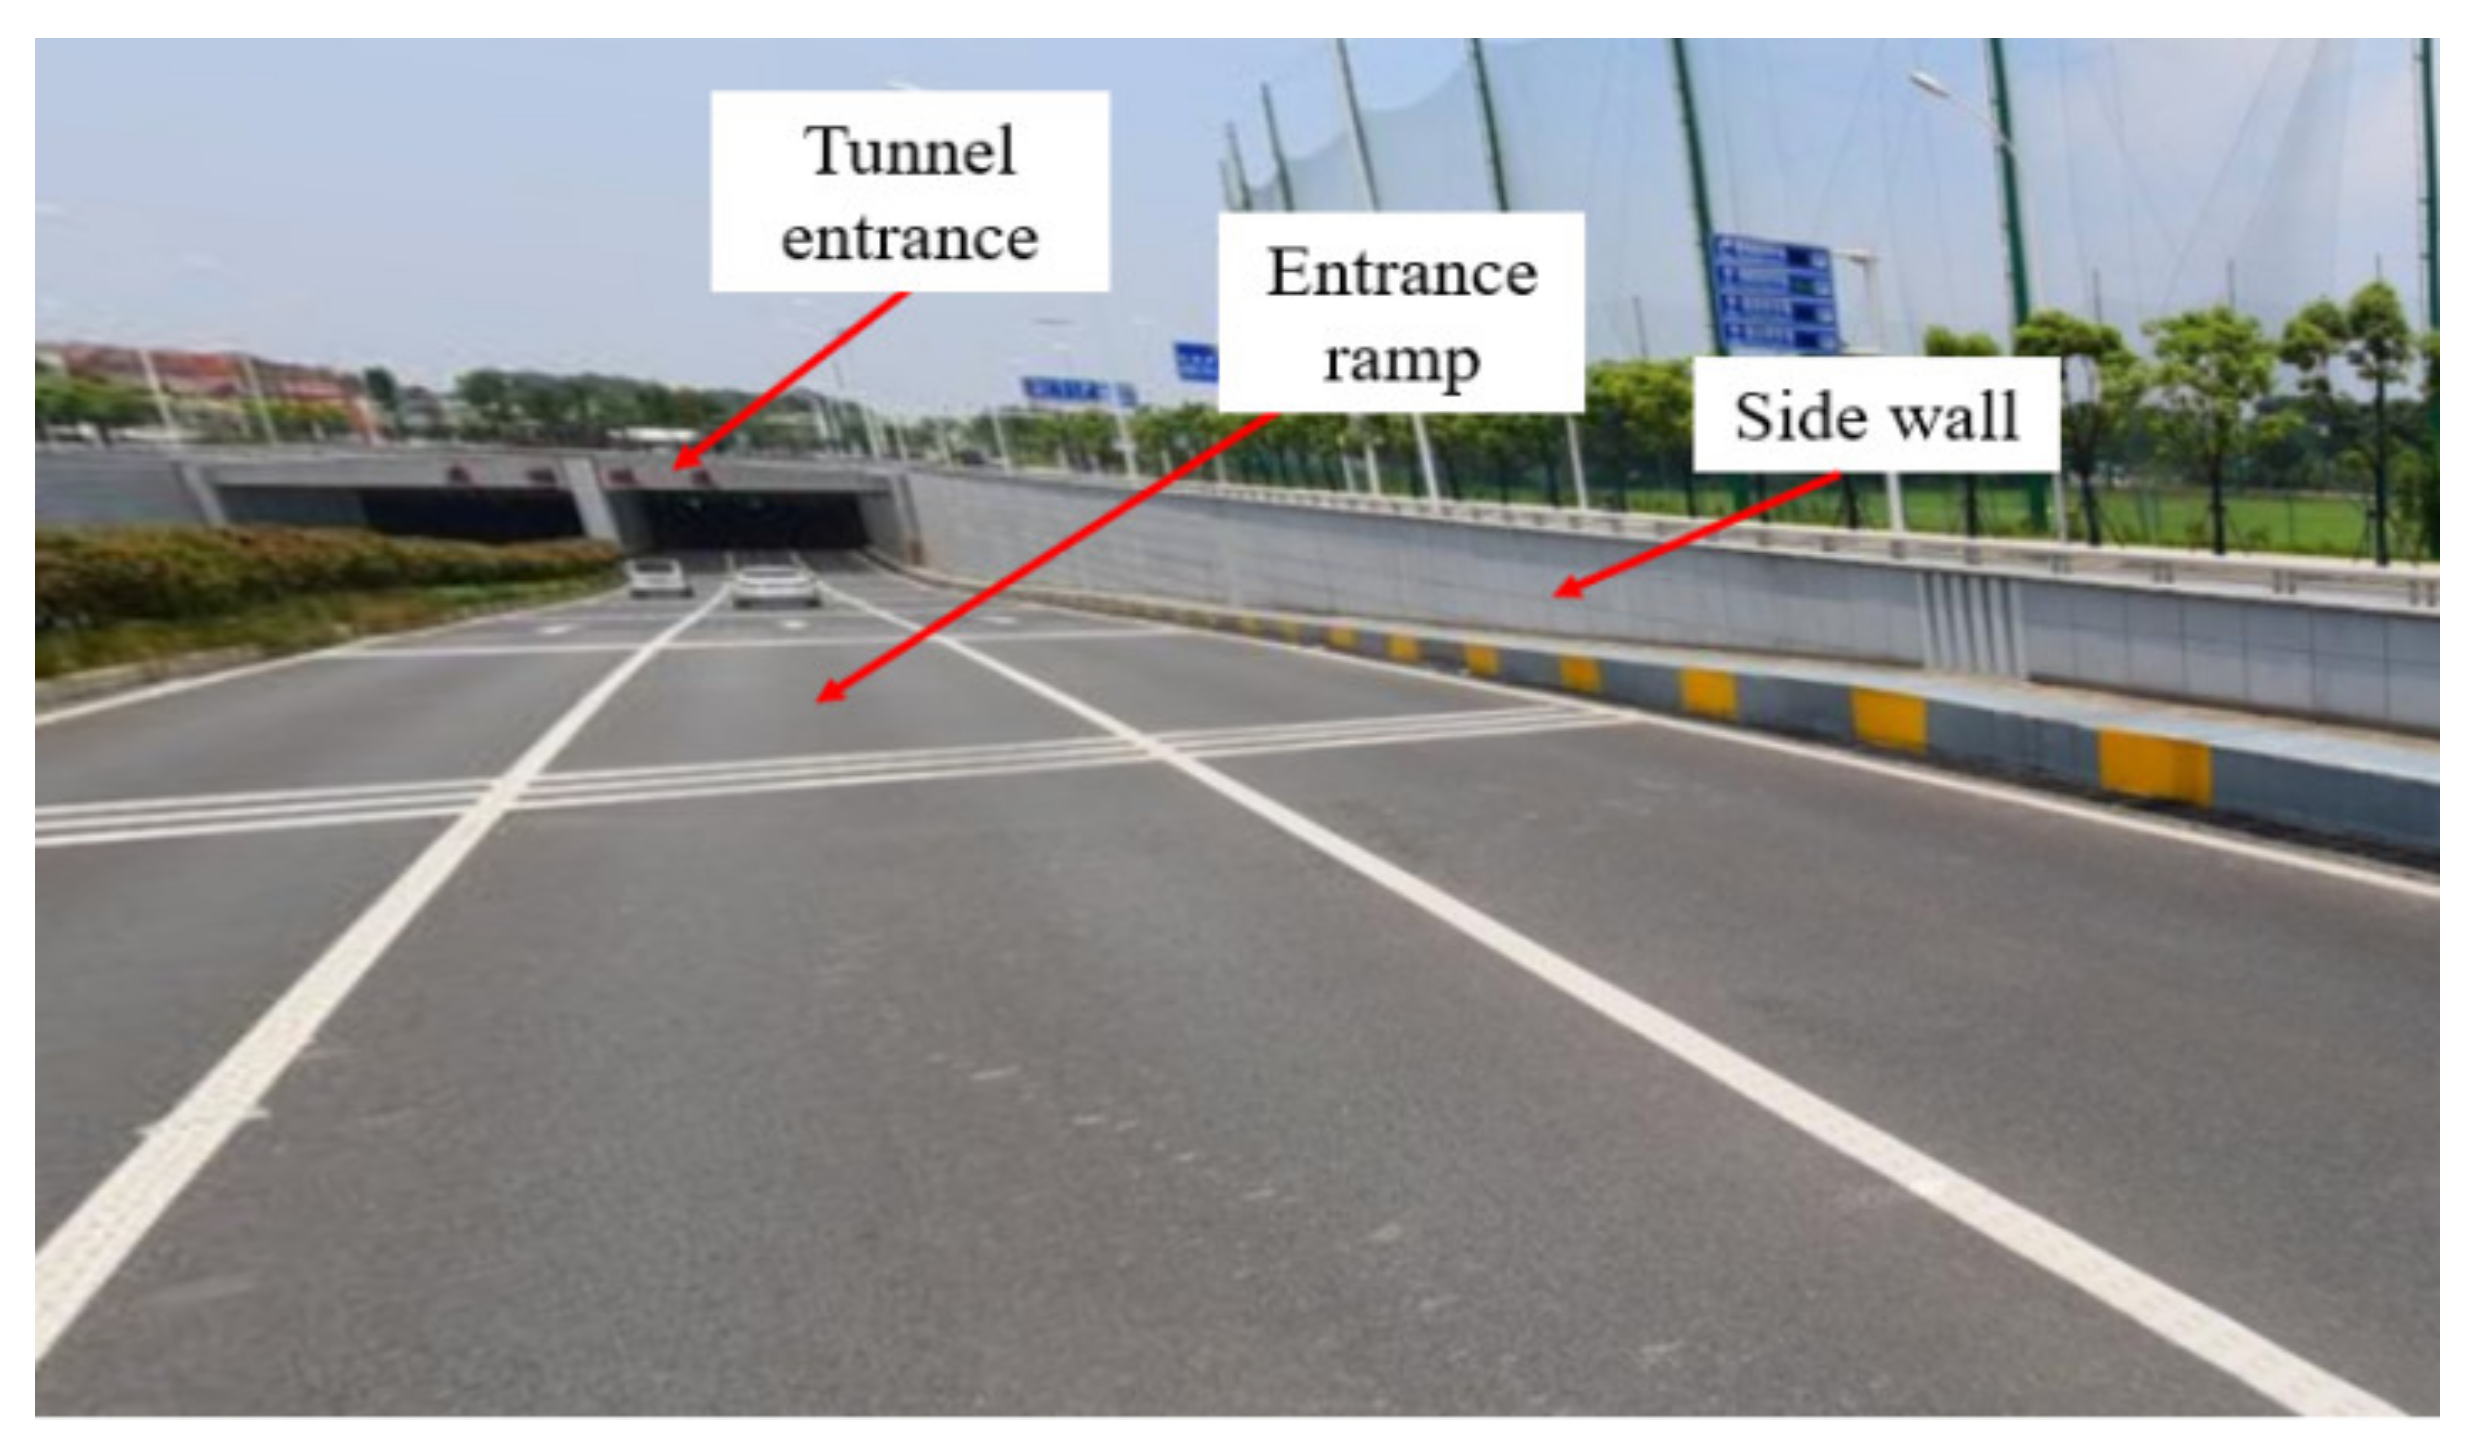
2.1. Real Vehicle Experiment

The real vehicle experiment was conducted in an urban underpass in Wuhan, China, during the peak period of 9:00 to 11:00 a.m. on weekdays under good weather conditions to minimize the interference of surrounding vehicles on the drivers’ fixation and saccade behaviors. Carrying out the experiment on weekdays can reduce the variables of traffic flow between weekdays and weekends. The alignment of the tunnel entrance and the division of road sections used in this study are shown in Figure 1 and Figure 2.
As shown in Figure 1, the tunnel entrance is composed of the external straight-line section, the entrance ramp section, and the entrance internal section. The sidewall of the ramp becomes higher when it gets closer to the tunnel portal, i.e., the shorter the sight distance, the smaller the sight zone. To study the visual characteristics of each road section combining alignment characteristics, considering the road environment such as straight line, downhill ramp, shading shed, and tunnel, the entrance ramp section is divided into upper and lower halves and the tunnel entrance internal section is divided into the shading shed section and the entrance inner section. The red and blue sectors in Figure 2 respectively show the driver’s sight zone and sight distance in different road sections.

2.2. Research Indexes

Saccade angle and frequency can reflect the driver’s viewpoint shift, physiological and psychological changes, and indicate how safe they drive [23]. The fixation time objectively demonstrates the difficulty that the driver experiences when extracting road information, for which the short-term fixation characteristics are better [24]. Due to the changes in sight distance and zone when entering a tunnel, the saccade angle can reflect the change of driver’s fixation point spatial dimension, and the fixation time can reveal the temporal dimension.
To better understand the influence of entrance ramp and the sidewalls on saccade vision, time-weighted average saccade angle and saccade frequency were introduced as follows:
S m = i = 1 N m ( S i × t i ) i = 1 N m t i ,
p m = N m T m ,
where Sm is the drivers’ time-weighted average saccade angle while driving with alignment m (in degrees), m ∊ {the external straight line section, the upper half of the ramp, the lower half of the ramp, the shading shed section, the entrance inner section}, Nm is the number of saccades while driving with alignment m (in times), Si is the saccade angle of the i-th saccade (in degrees), ti is the saccade time of the i-th saccade (in seconds), pm is the saccade frequency while driving with alignment m (in numbers/seconds), and Tm is the total time while driving with alignment m (in seconds).
An eye tracker can acquire the fixation time and number, which can be formulated as:
q j , m = M j , m M m ,
where qj,m denotes the drivers’ frequency distribution of fixation time ratio in the j-distribution interval while driving with alignment m, Mj,m means the number of fixation in the j-distribution interval while driving with alignment m (in times), and Mm represents the total number of fixation while driving with alignment m (in times).

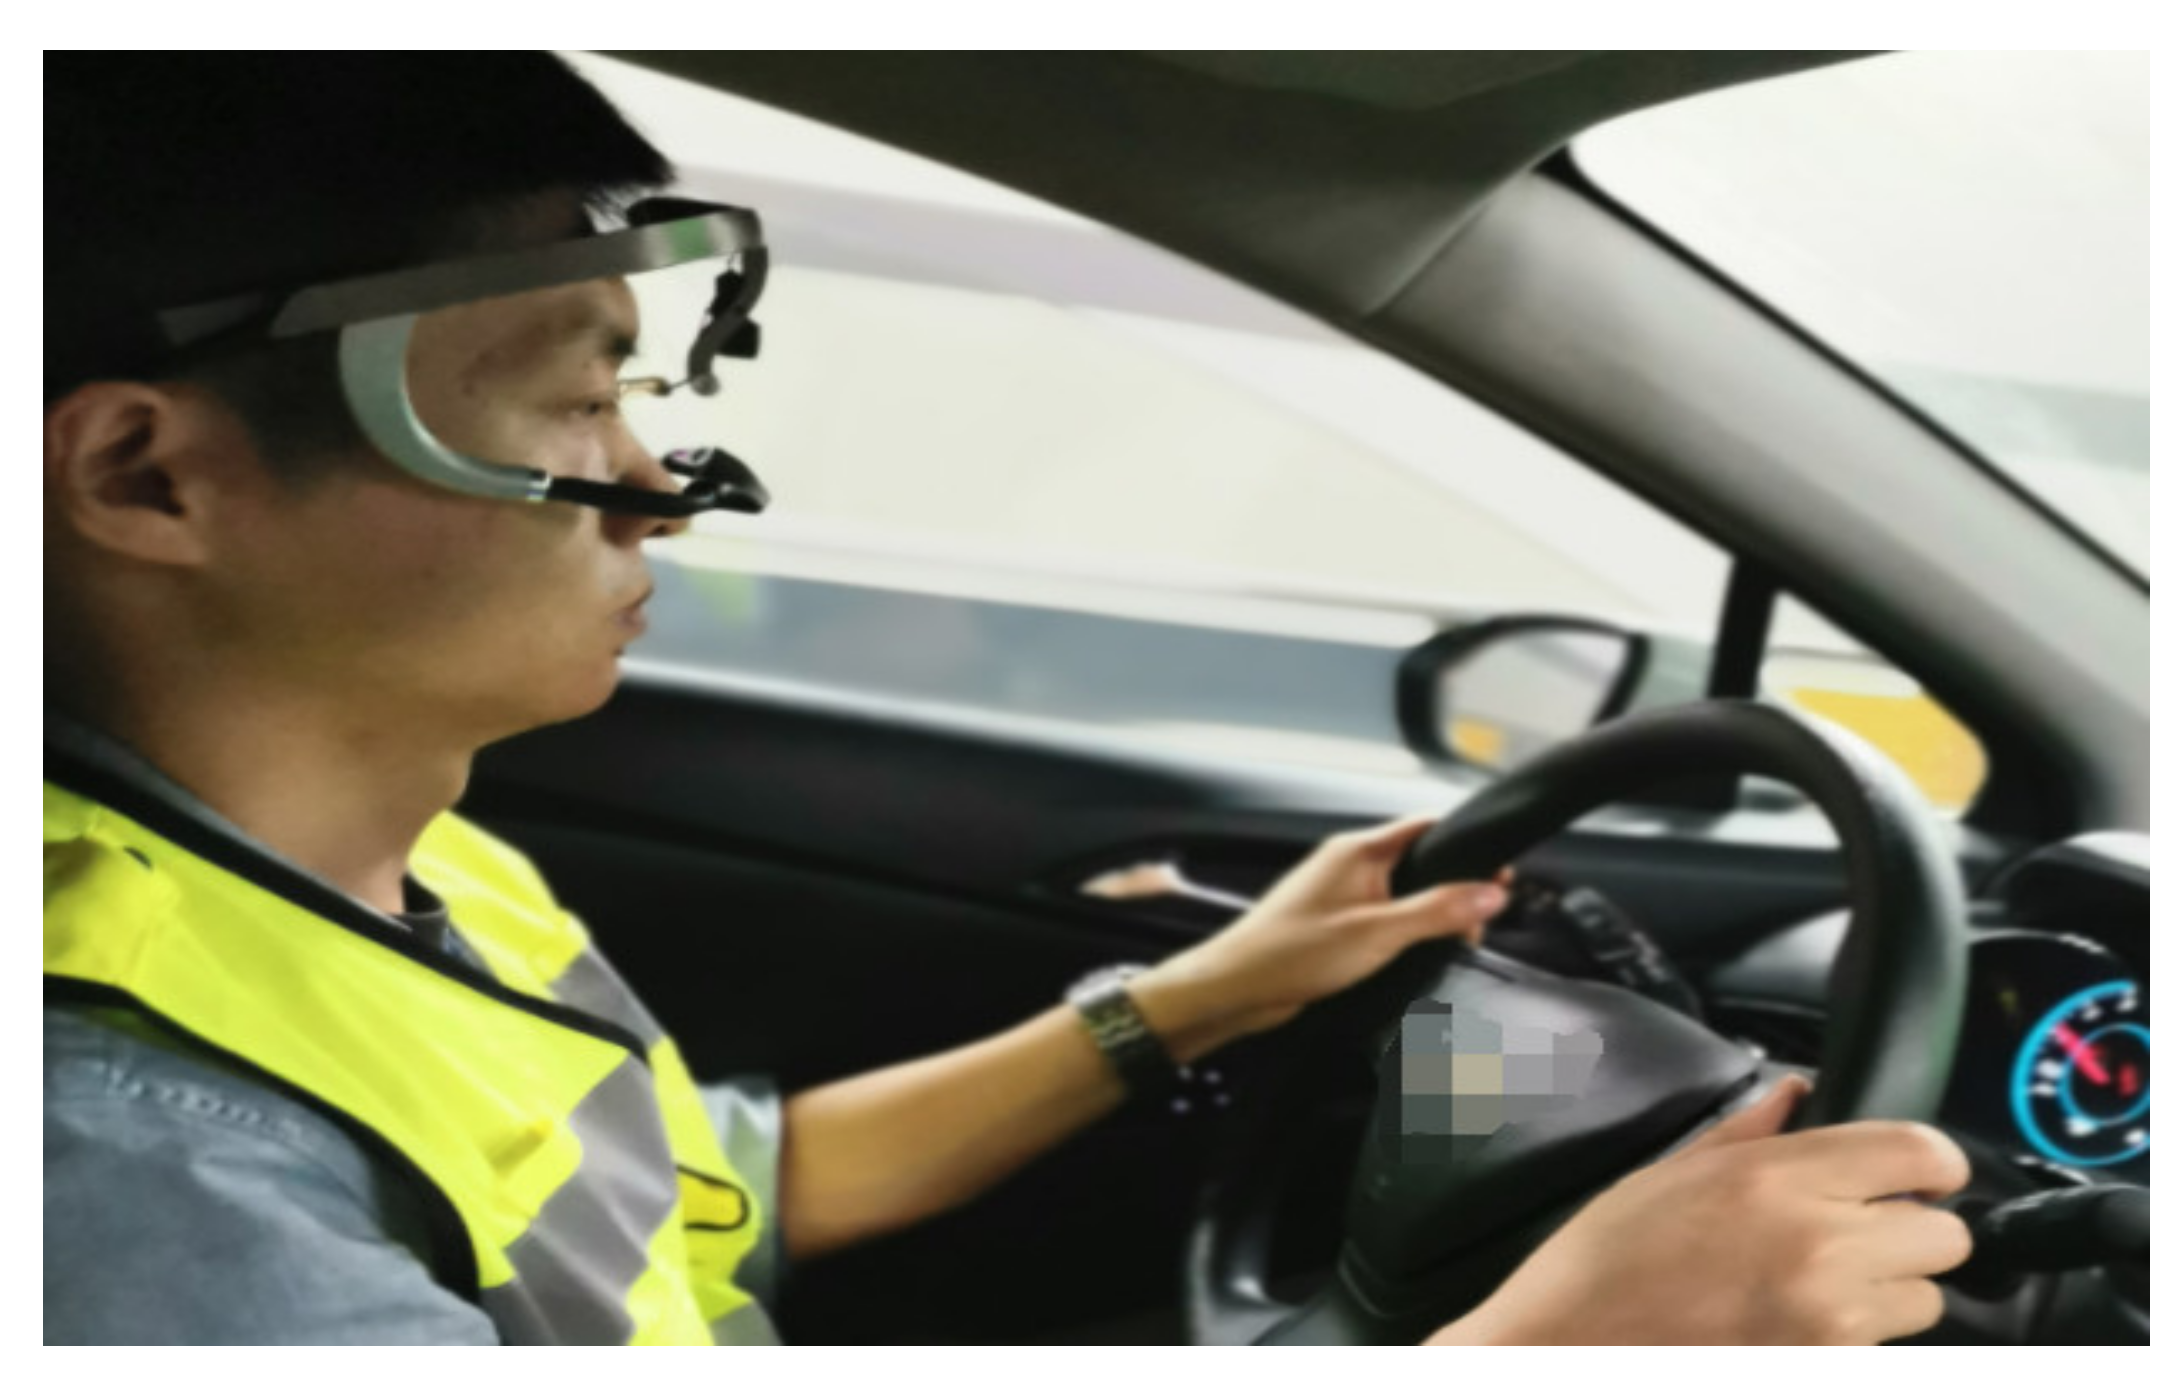
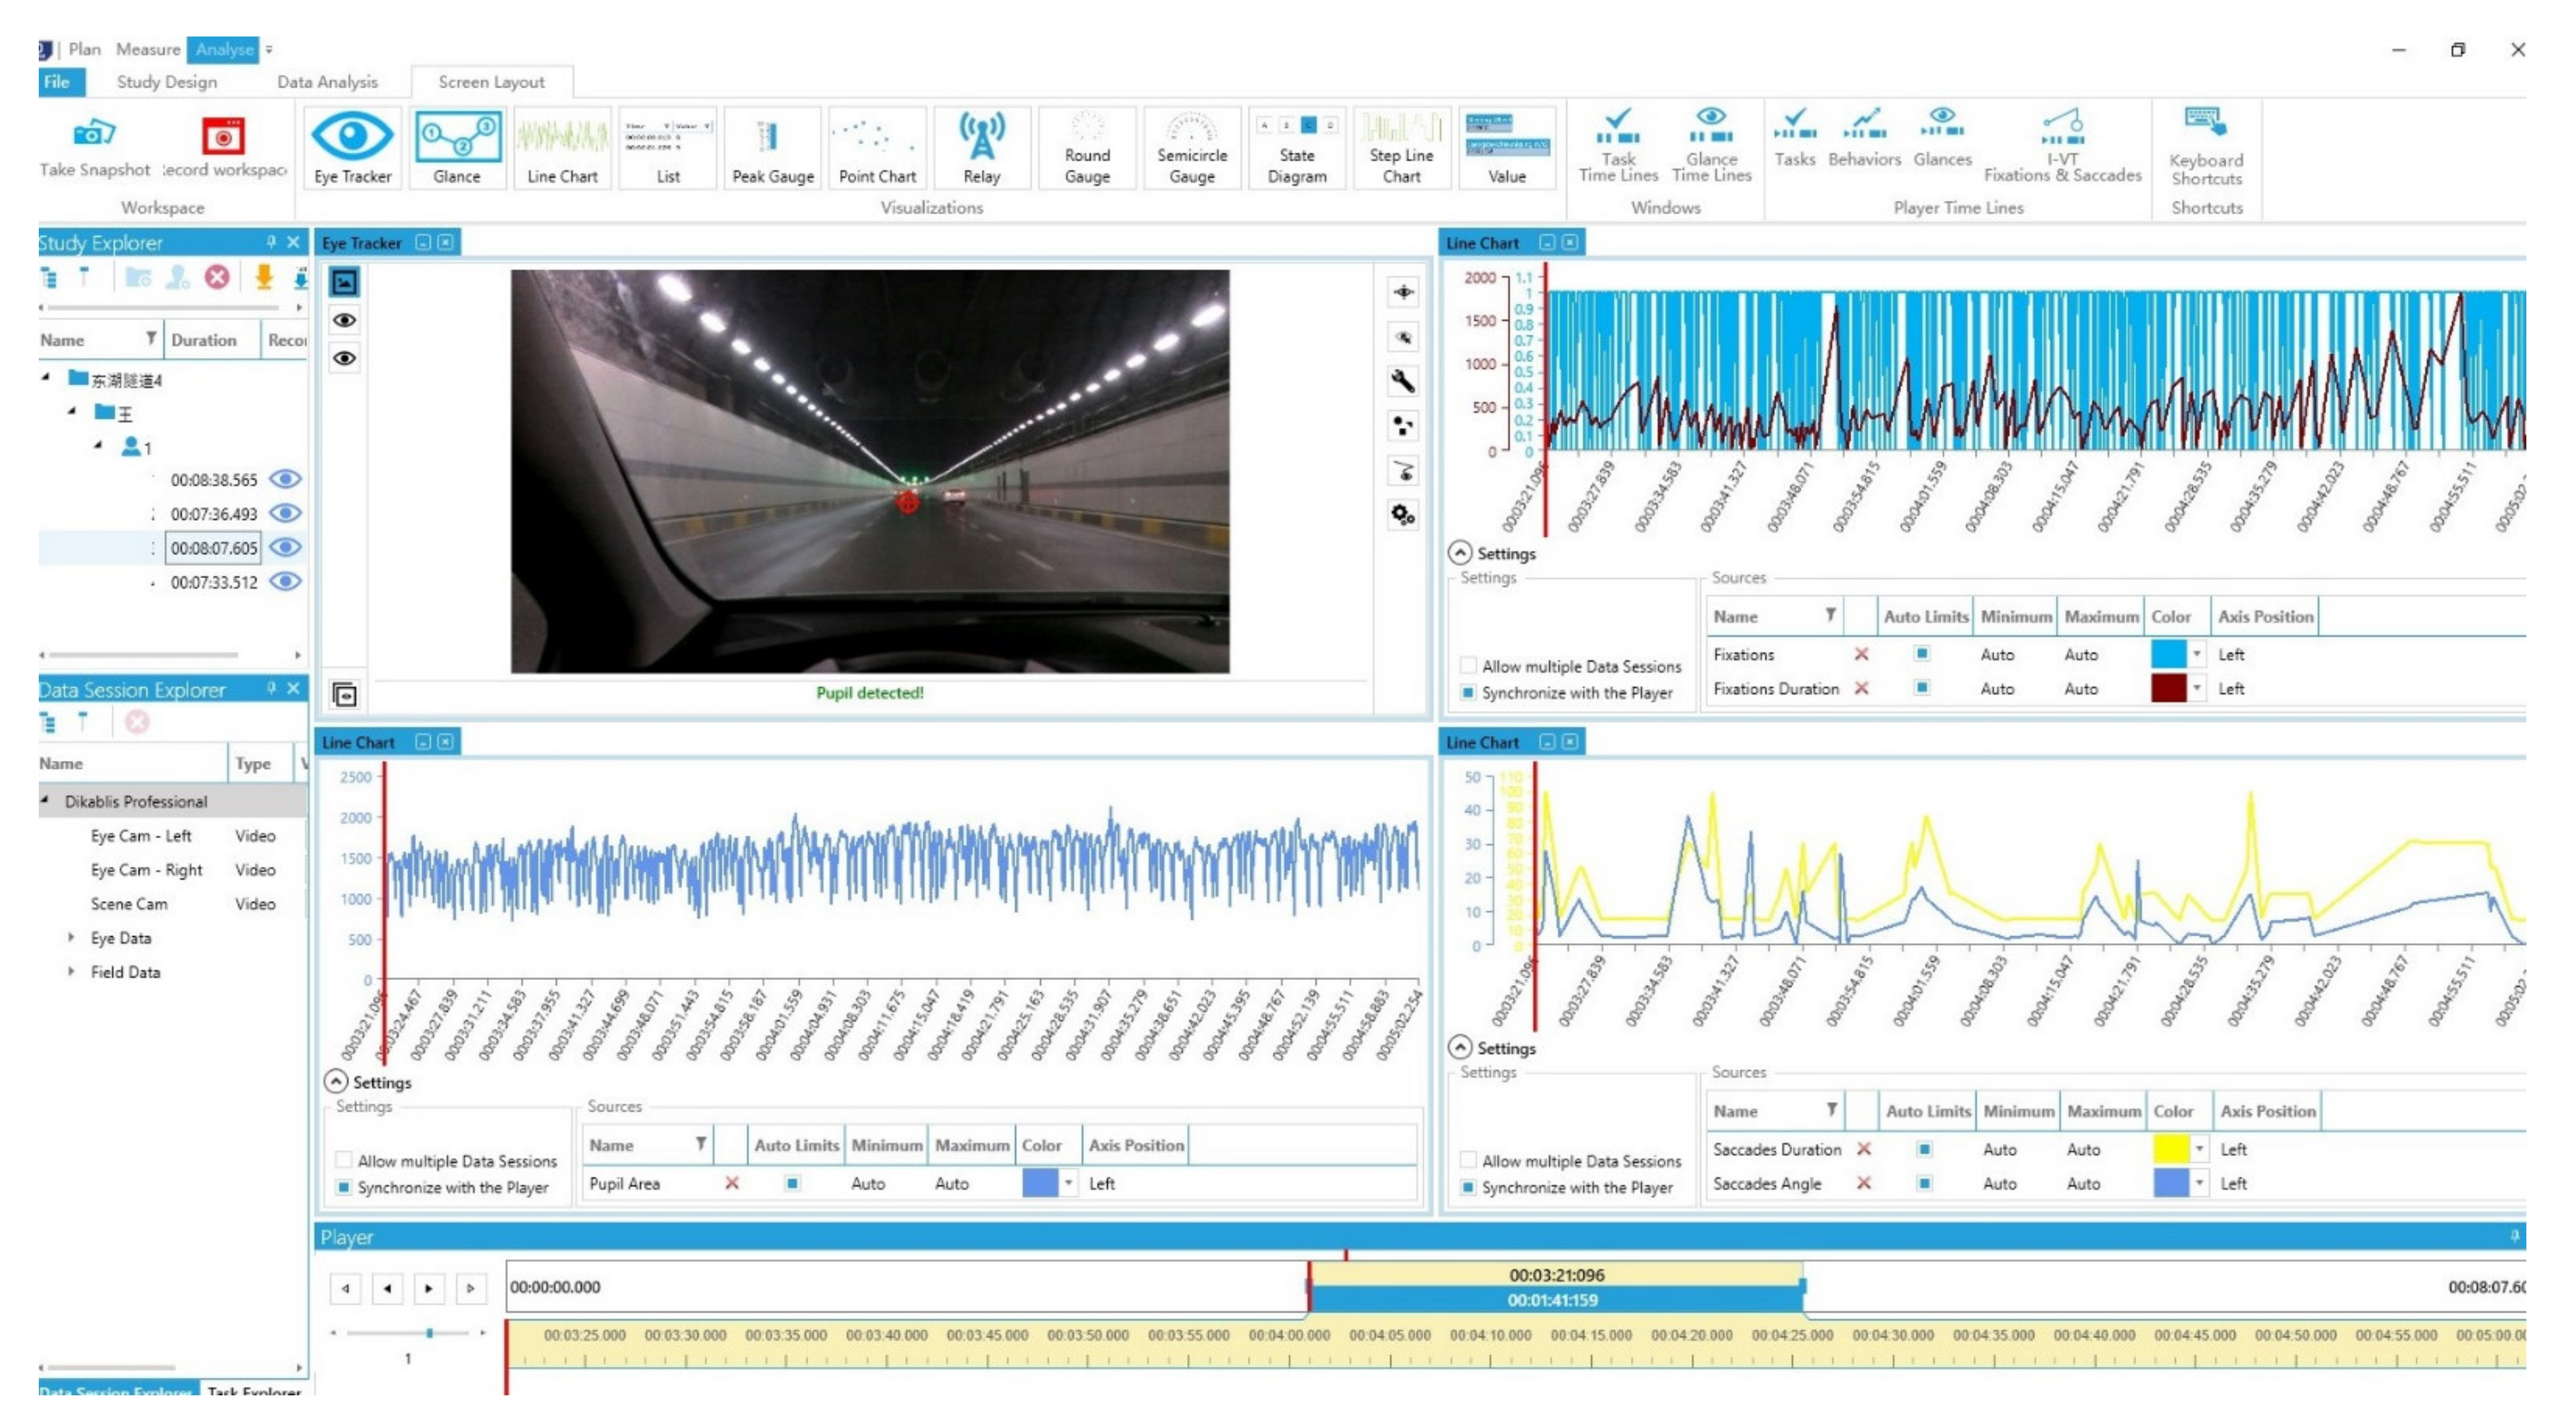
2.3. Participants and Data Collection

A total of 20 effective drivers (14 males and 6 females) aged from 25 to 43 participated in the real vehicle experiment. They were engaged in different occupations such as engineer, designer, company employee, teacher and graduate student. All drivers were in good health, with normal or corrected vision, and experienced in urban underpasses. The field investigation showed that almost all vehicles ran at a speed close to the speed limit of the tunnel when entering it, so the variations in vehicle speed were not considered in this study. During the test, all drivers drove into the tunnel at a free-flow speed close to the tunnel speed limit.
For data acquisition, Dikablis Professional eye tracker (see Figure 3) worn by the driver was used to record basic eye movements, such as saccade and fixation. Before starting the test, the driver was allowed to get used to the tracker to avoid any interference during the test.
The collected data were extracted by the D-Lab software (see Figure 4). In data analysis, the external straight-line section was marked as Section A, the upper half of the ramp was marked as Section B, the lower half of the ramp was marked as Section C, the shading shed section was marked as Section D, and the entrance inner section was marked as Section E to study the visual characteristics of different road sections more conveniently. The length of Section A was the driving distance of 10 s before the downhill point. Section B and Section C took half of the length of the downhill ramp respectively. Obviously, Section D was the length of the shading shed. And the length of Section E was the driving distance of 10 s after driving through the shading shed and entering the tunnel. The data of each Section can be accurately divided by the video and time recorded by the equipment.

3. Results

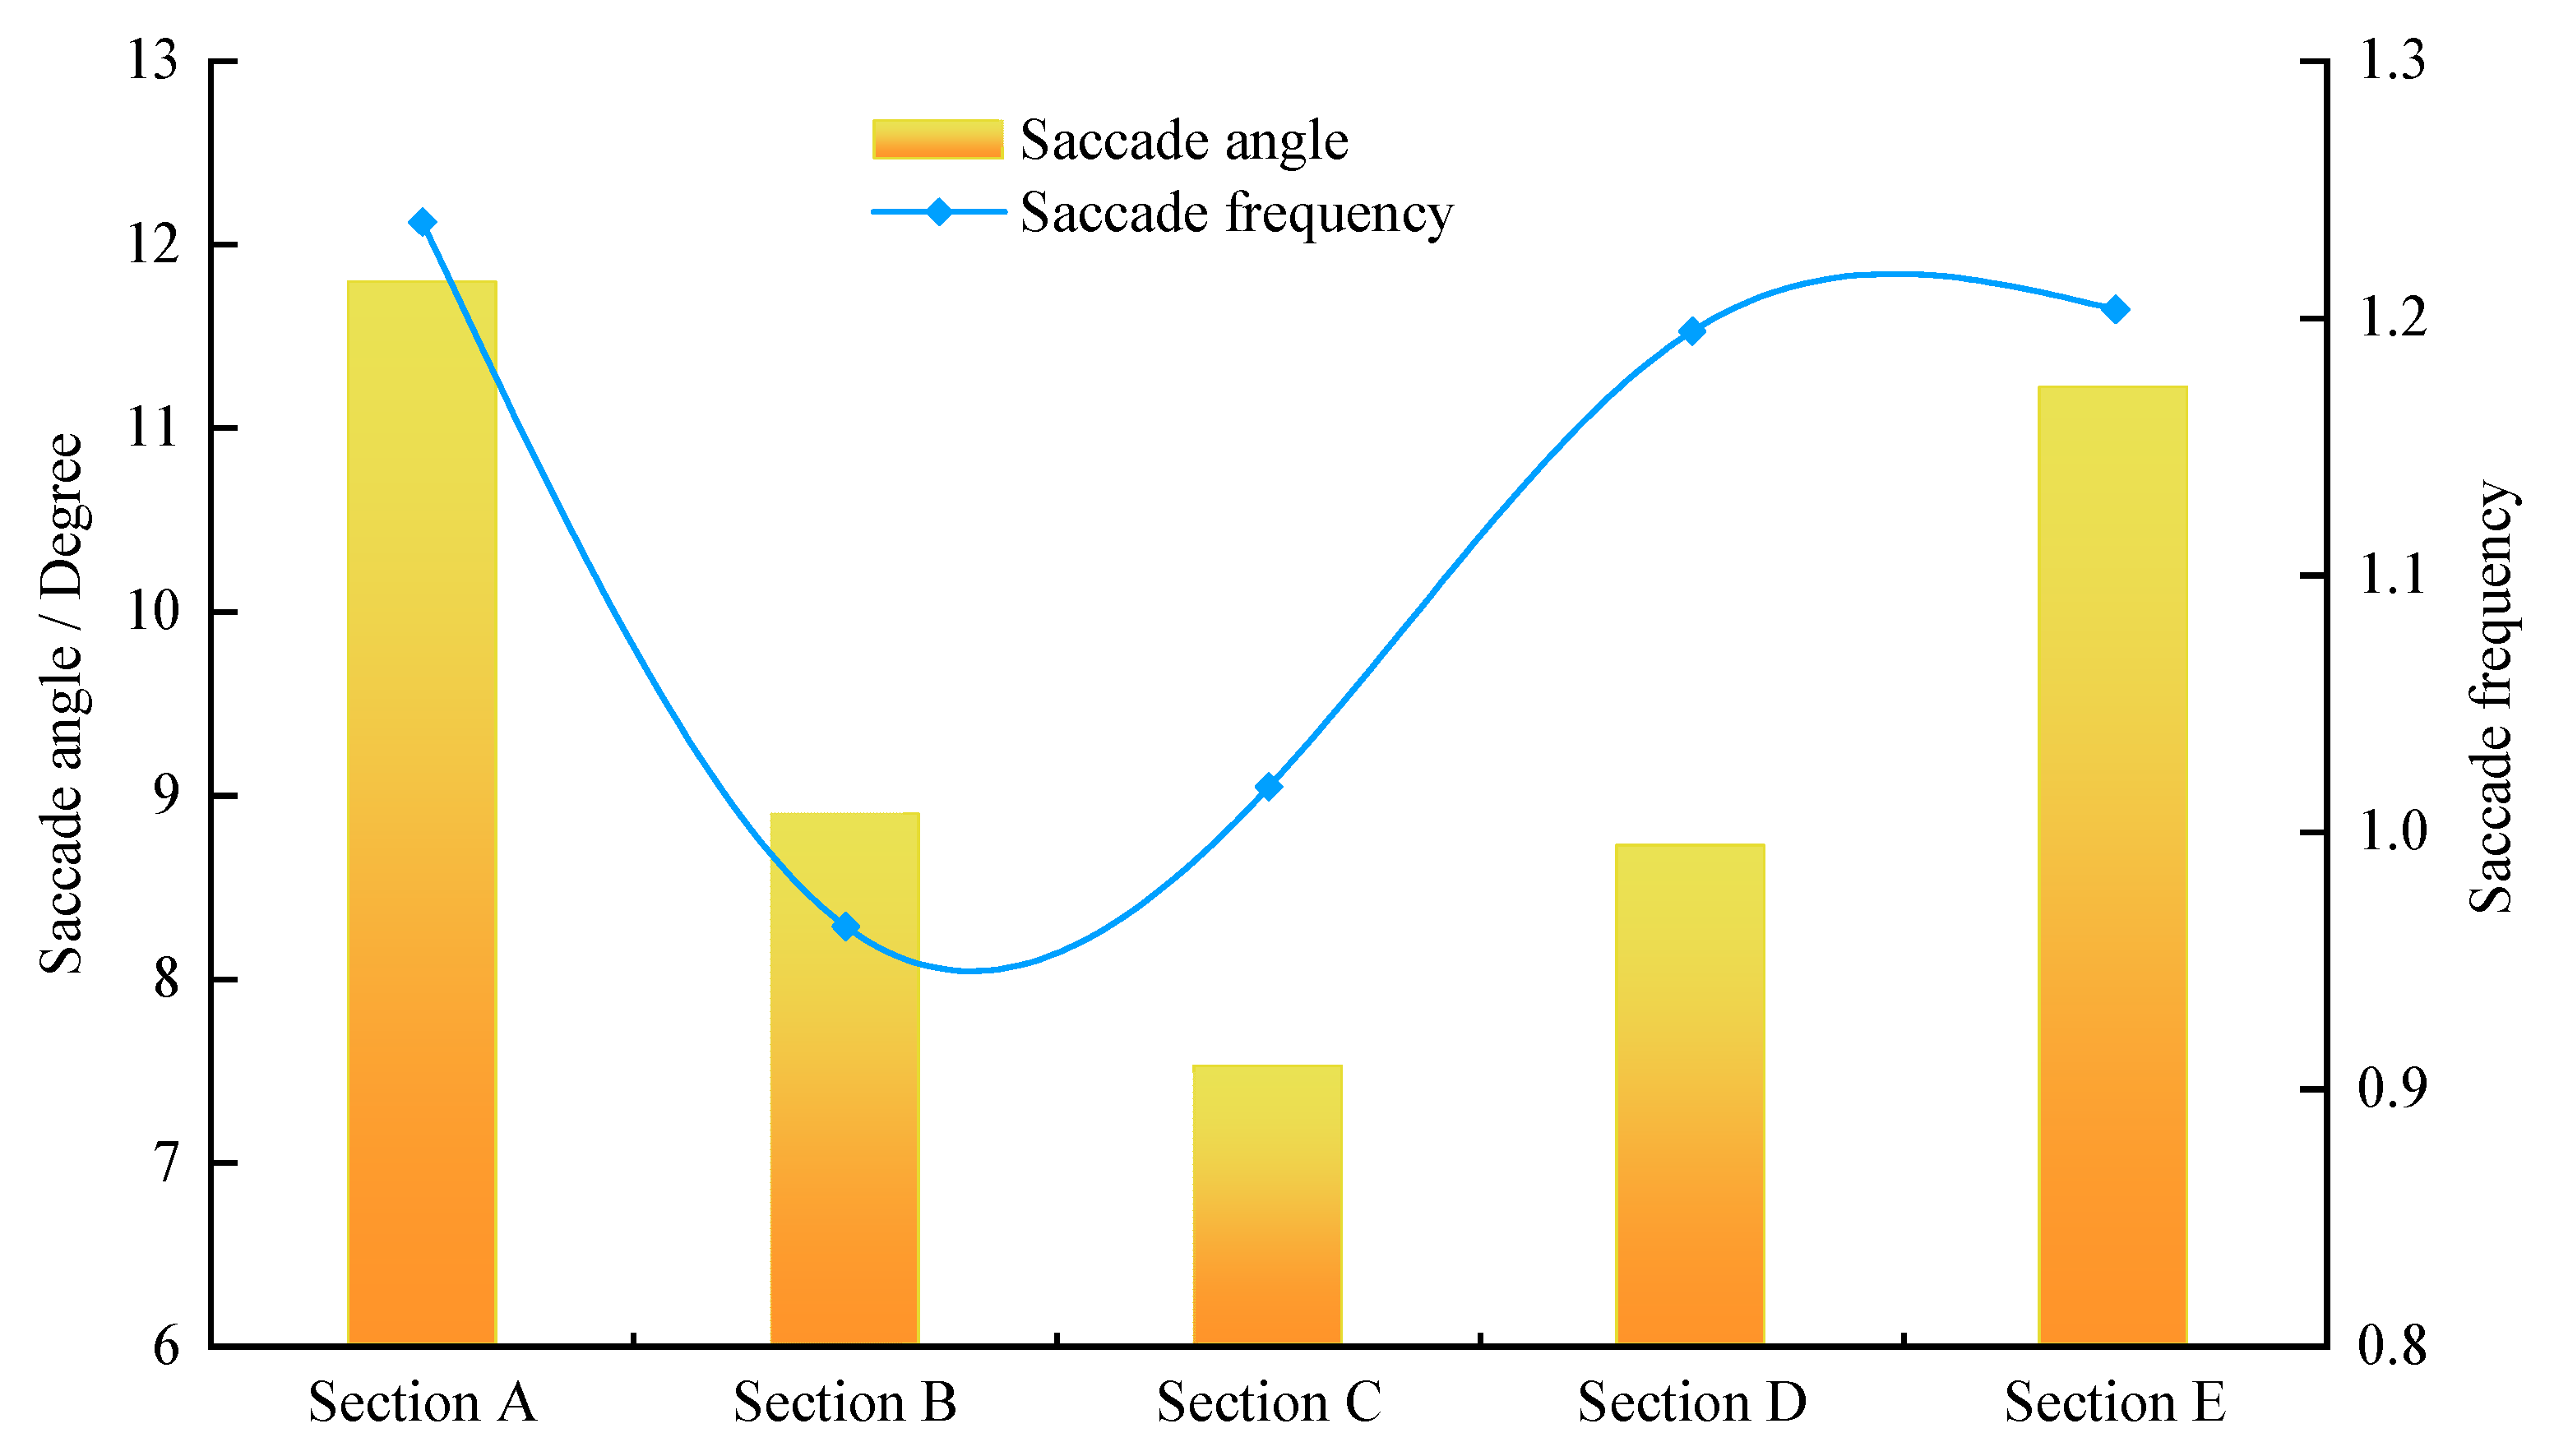
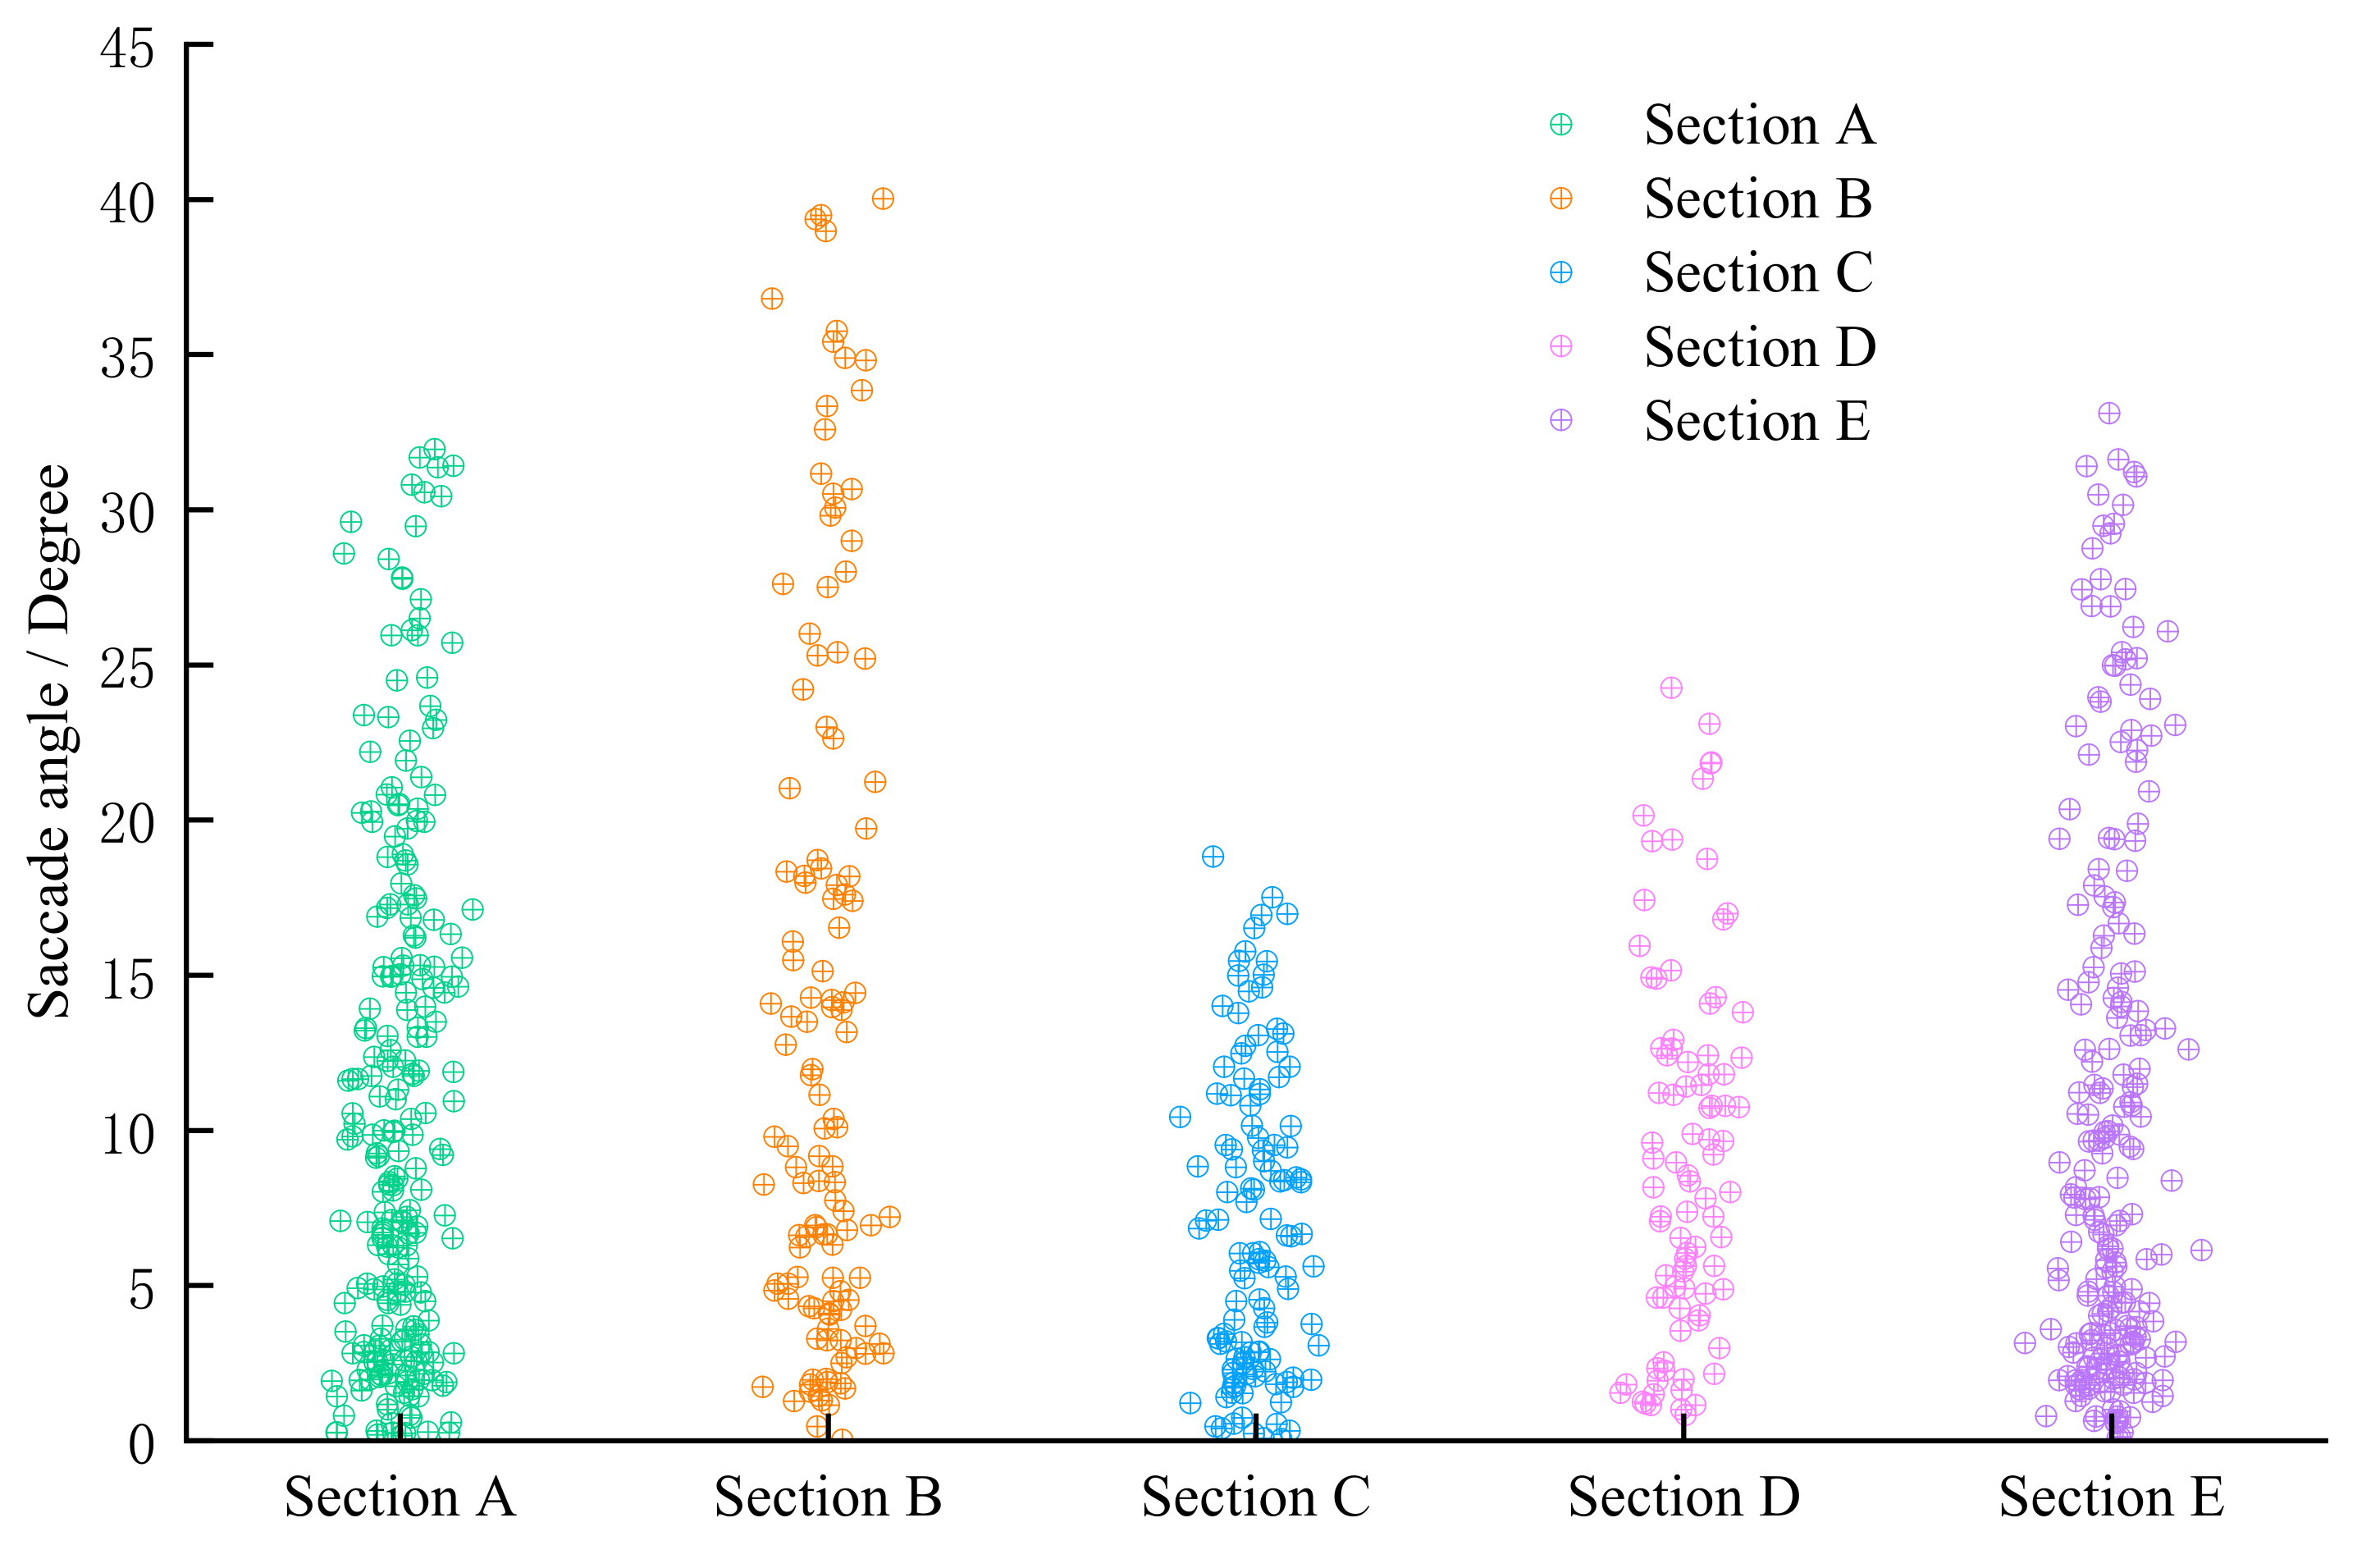
3.1. Saccade Angle and Frequency
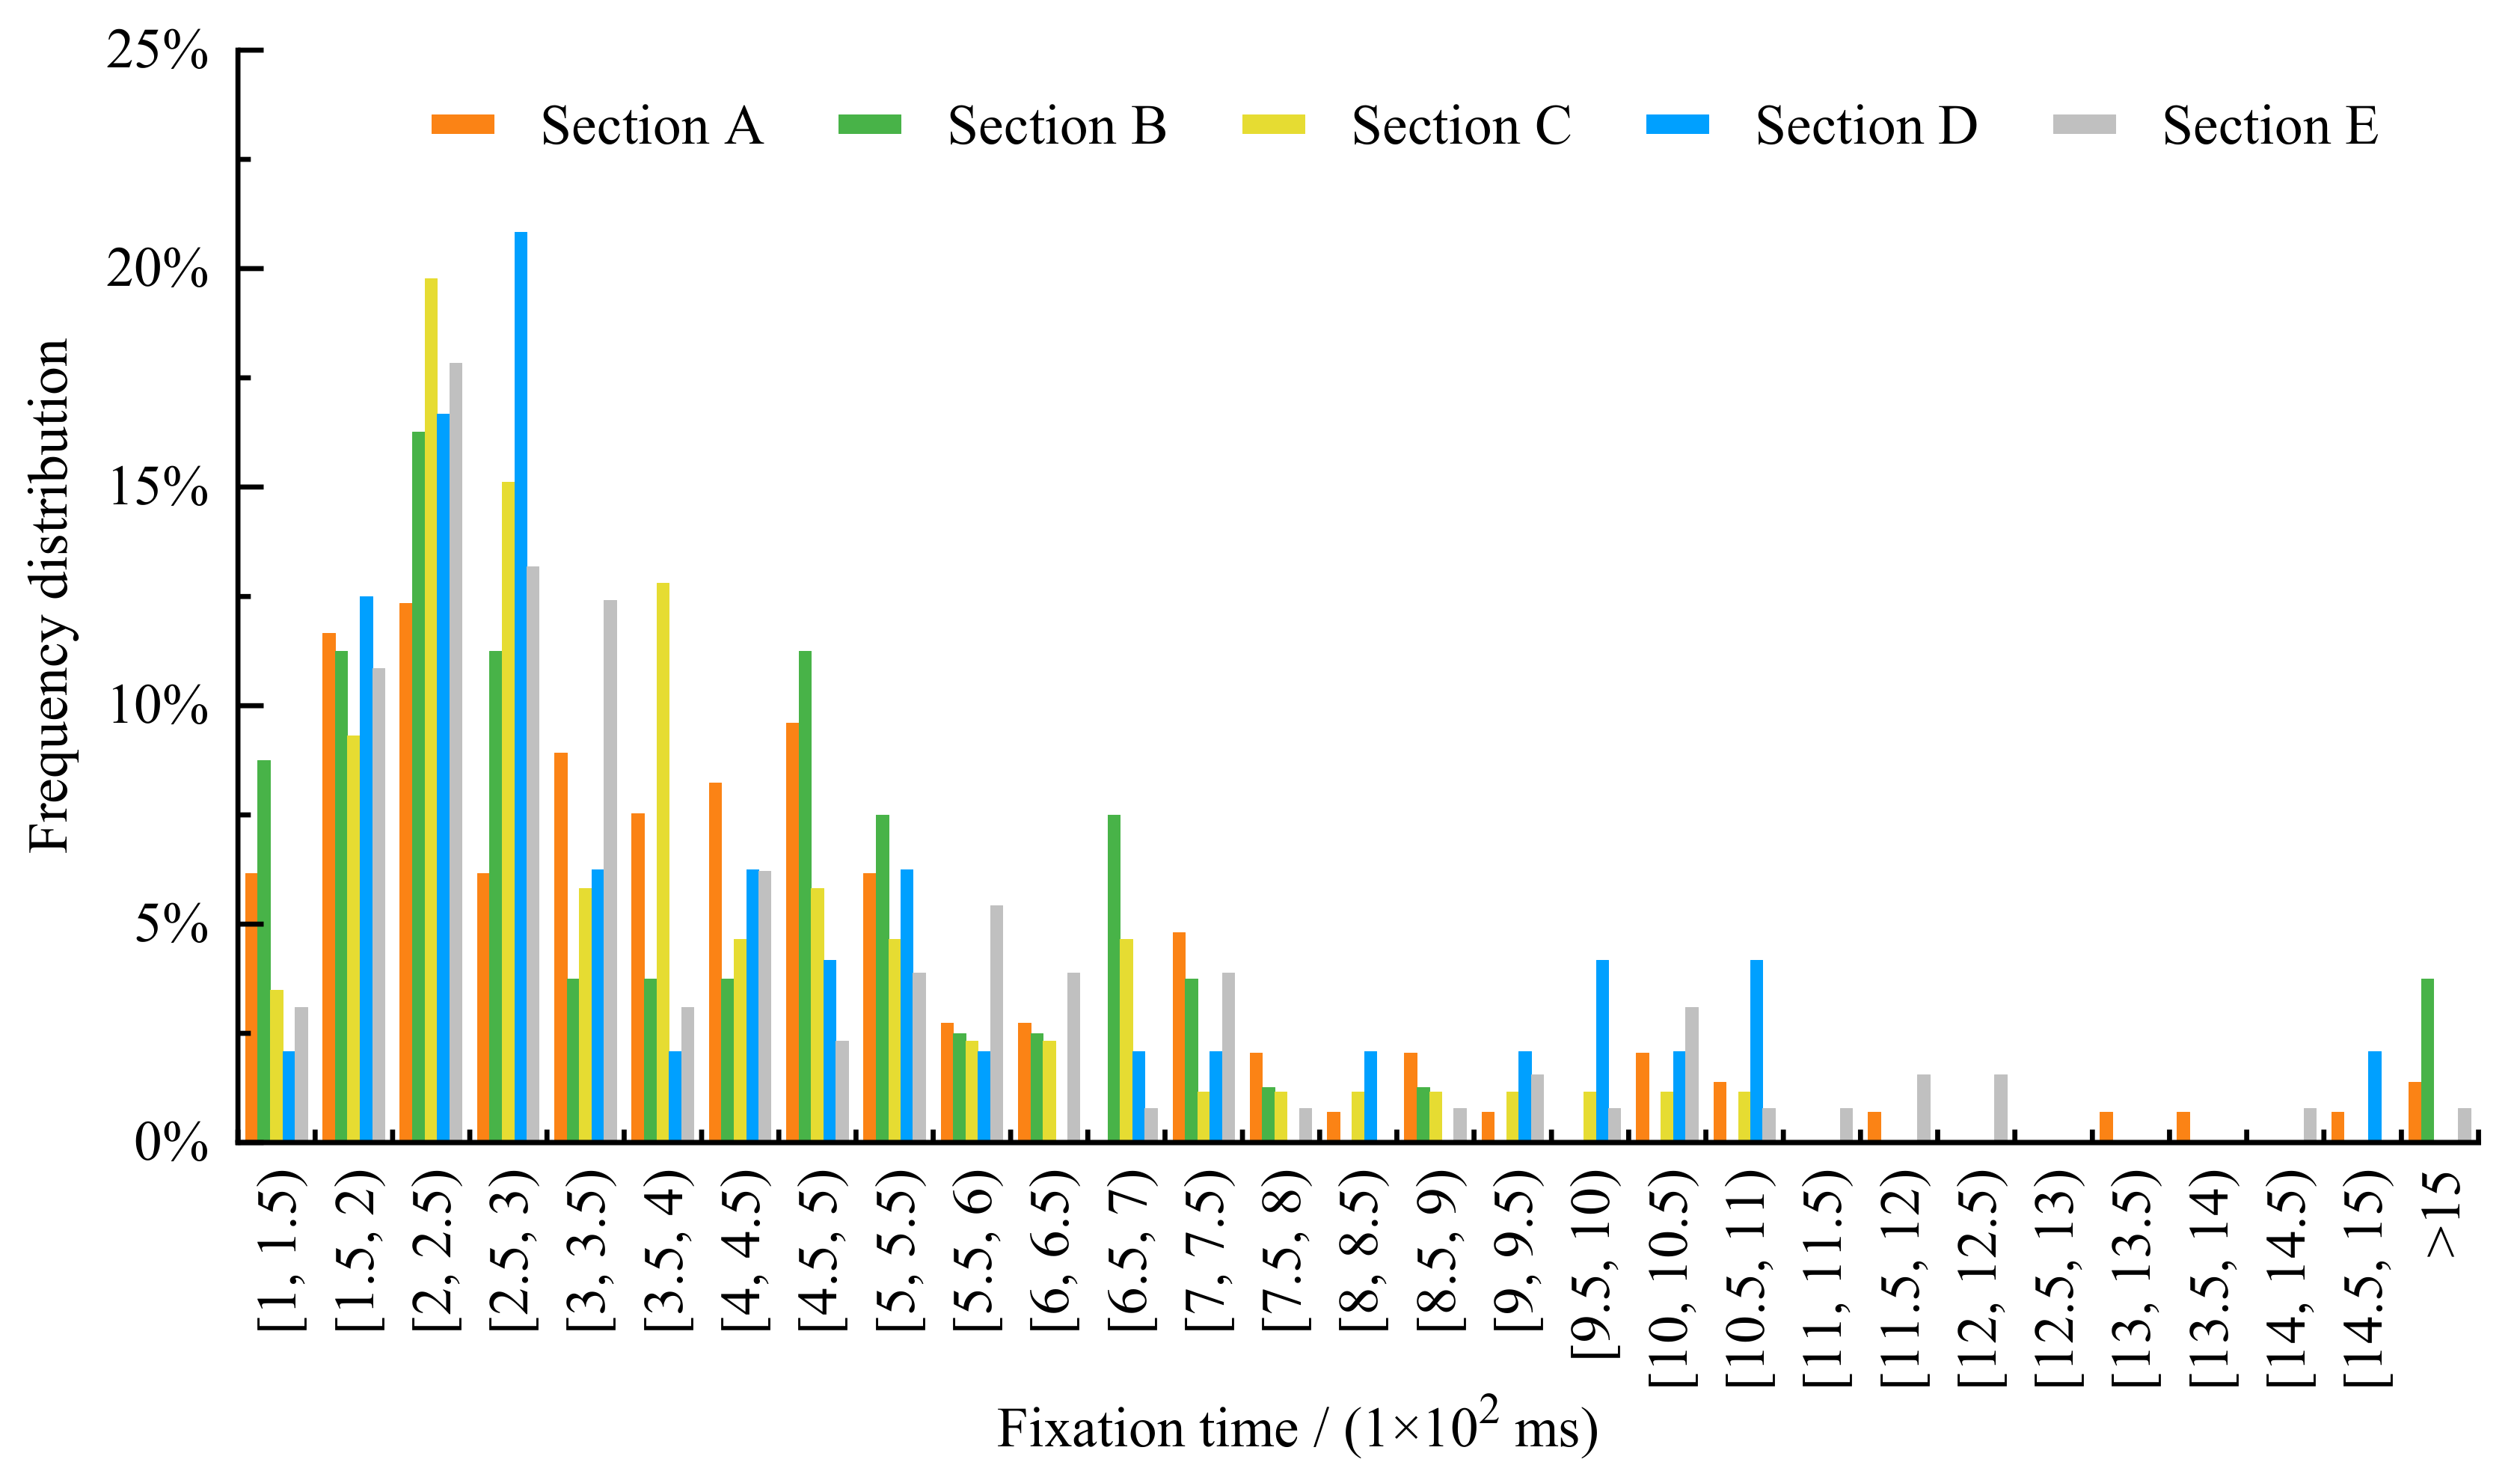
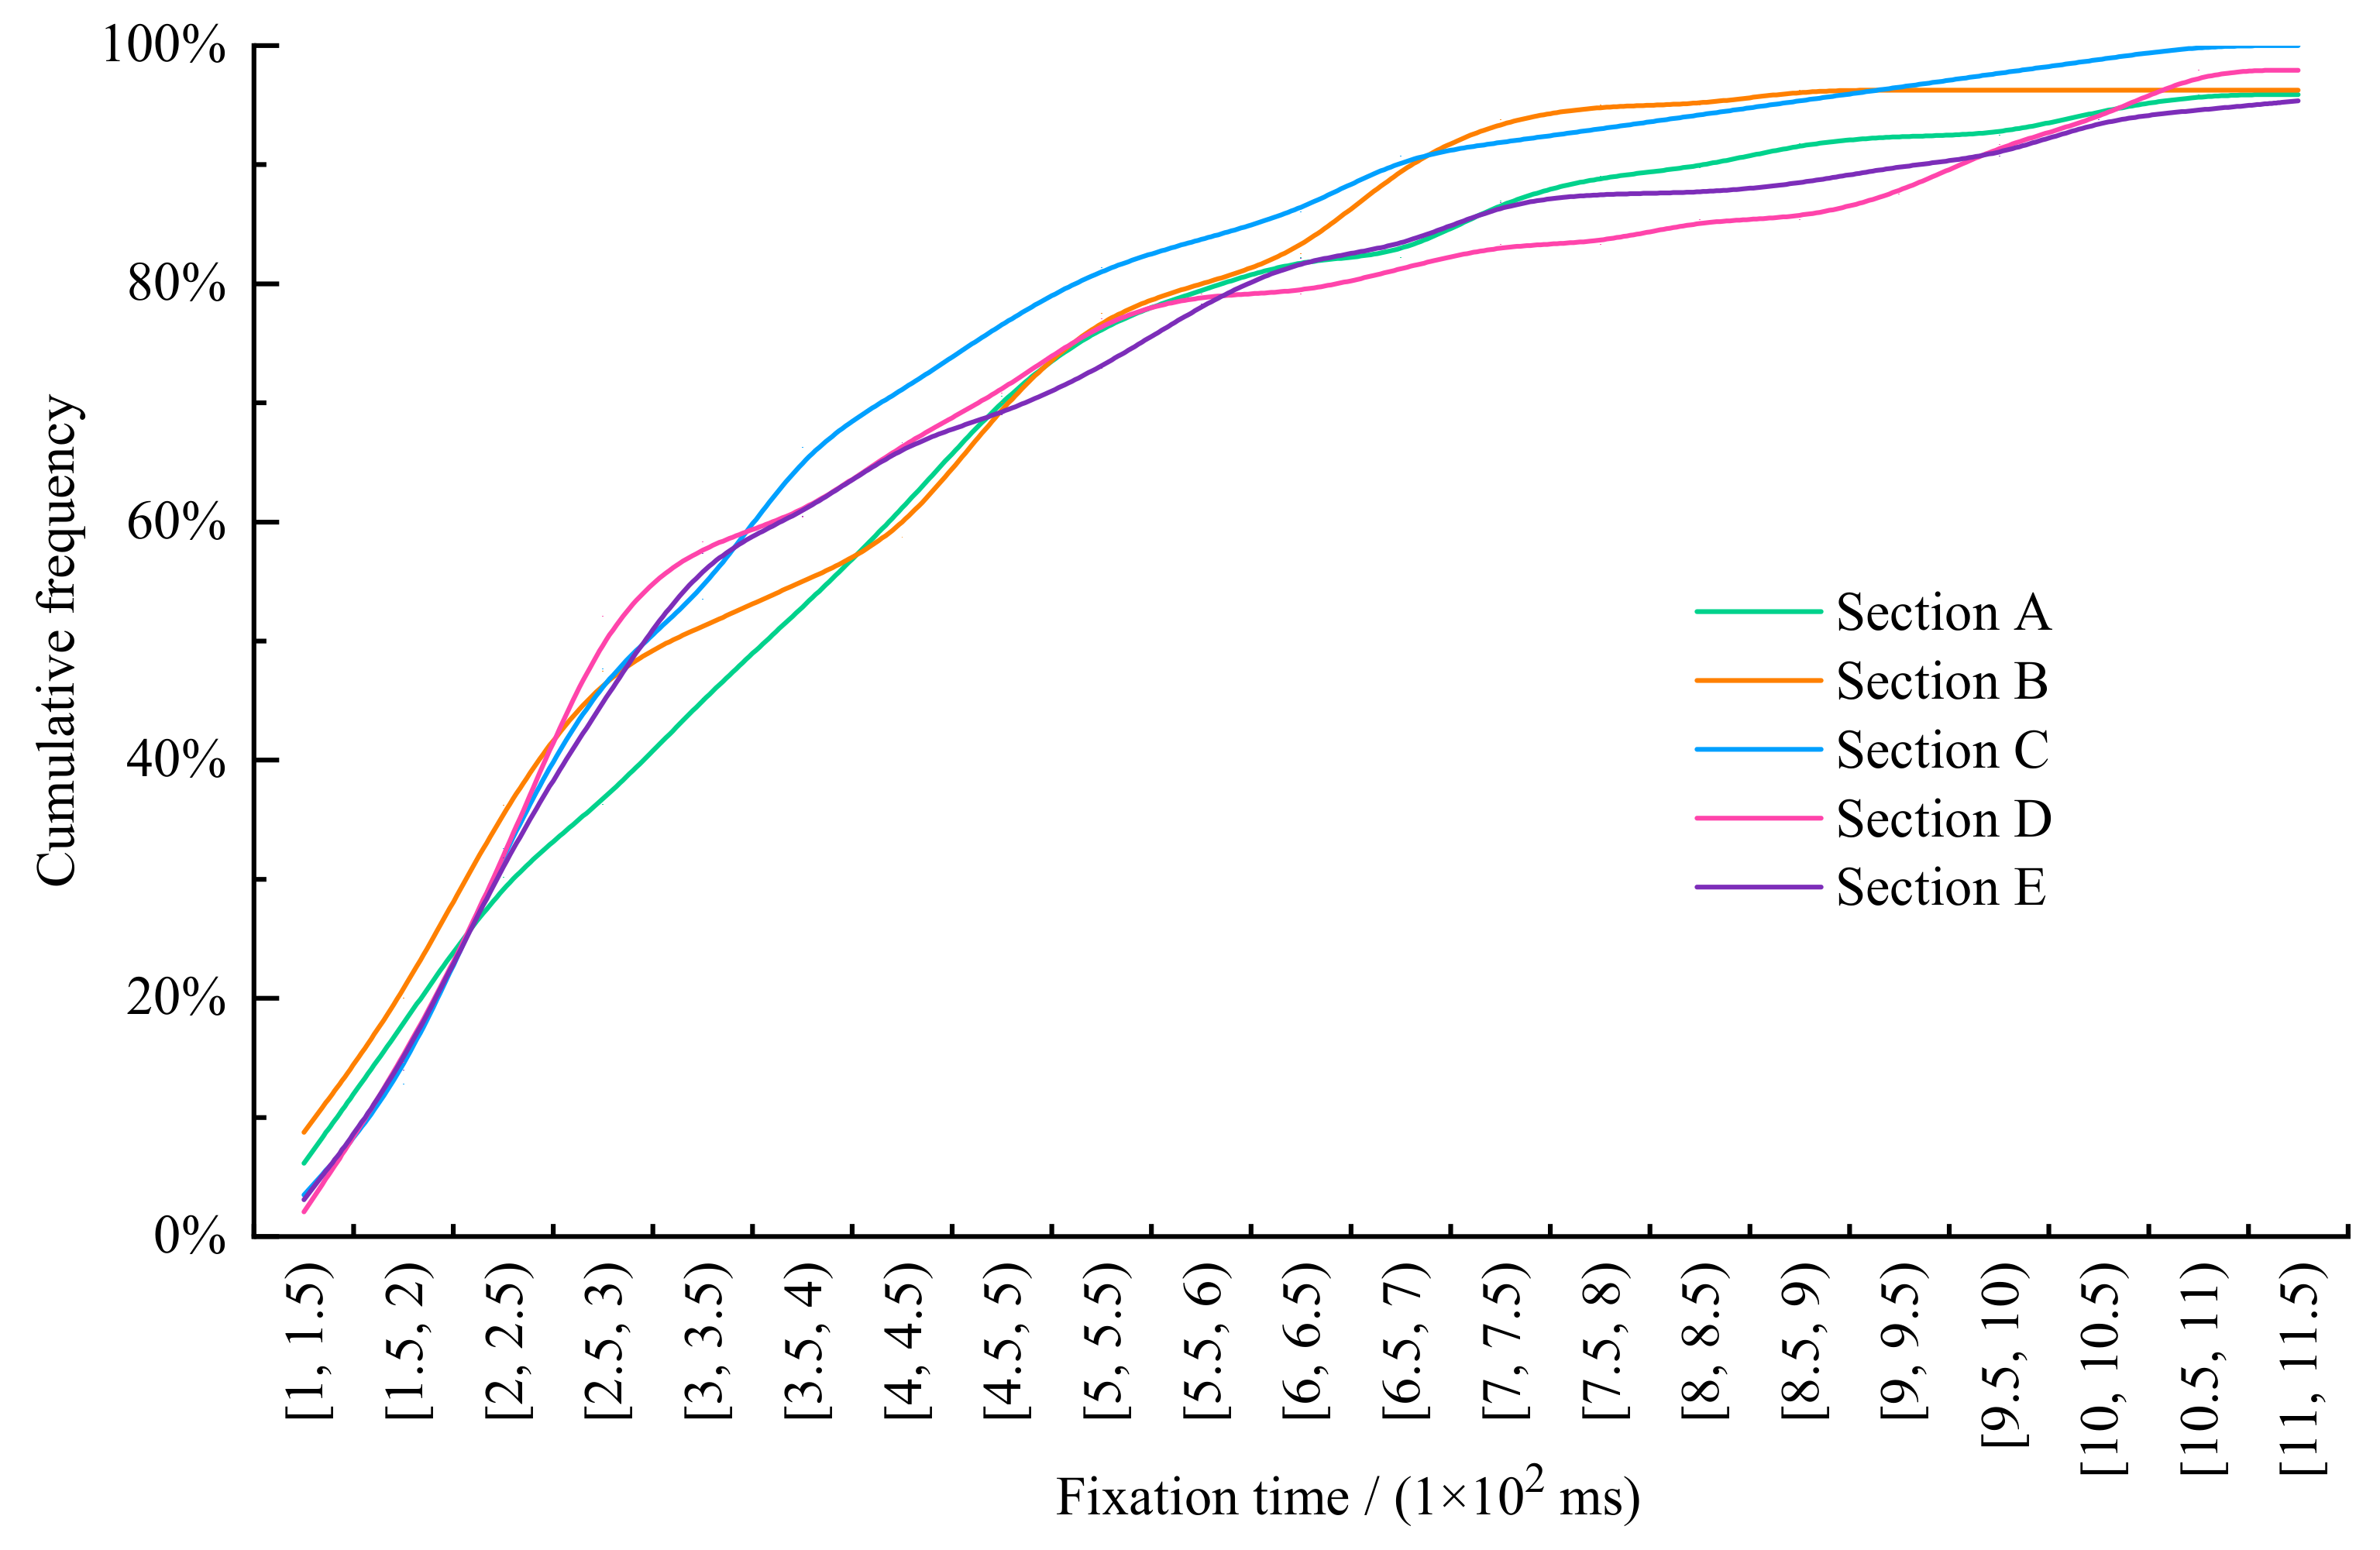
The saccadic eye movement is mainly controlled by instantaneous visual information of the surrounding environment and the global search strategy, and when the target is within the range of the saccade angle, it is easy to be recognized, which is not true for the out-of-range case [25]. The time-weighted average saccade angle, the maximum, and the standard deviation of each section are shown in Table 1.
The time-weighted average saccade angle and frequency of each section is illustrated in Figure 5.
Figure 5 shows that Section C had the lowest saccade angle, Section A had the largest, and the overall distribution was Section C < Section D < Section B < Section E < Section A. It should also be noted that the trend of the maximum value of each section was the same. The saccade angle of Section A was 1.570 times of Section C, which was 2.027 for standard deviation. This means that the saccade range and dispersion of the external straight-line section were stronger.
The distribution of saccade frequency was Section B < Section C < Section D < Section E < Section A. Although the sequence of saccade frequency and the angle were different, they showed that the saccade range on the ramp section was small, and the drivers’ saccade activity in the external straight-line section and the entrance inner section was intense.

3.2. Fixation Time

The fixation time became longer with the increasing difficulty of target information processing. The fixation distribution, on the other hand, becomes denser with the increasing complexity of cognitive activities [26]. The driver’s fixation time was analyzed for all sections at 50 ms intervals. Figure 6 shows the frequency distribution of fixation time in different sections.
The proportion of fixation time to frequency distribution in different sections was different. The highest proportions of Section A, Section B, Section C, and Section E appeared in the interval of [200, 250) ms, which were 12.329%, 16.250%, 19.767%, and 17.829%, respectively. Section D, on the other hand, reached its highest value, 20.833%, in the interval of [250, 300) ms.
By accumulating the proportion of each frequency interval, it was found that 95% of the fixation time was within 1150 ms, and 90% of the fixation time was within 950 ms. The total proportion of the five sections was more than 80% in the intervals of [600, 650), [550, 600), [550, 600), [550, 600), [600, 650) ms, i.e., more than 80% of the fixation time of all sections was concentrated at 600 ± 50 ms.

3.3. Fixation Time Threshold

Some studies on driver’s fixation time threshold showed that the fixation time should not be less than 100 ms [27], while others claimed that the minimum fixation time should be at least 200 ms [28]. Hence, it is necessary to investigate the reasonable threshold range of the fixation time in different sections of urban underpasses to improve the safety at their entrance. Figure 7 shows the cumulative frequency of fixation time in different sections.
For the interval of [200, 250) ms, the cumulative frequencies of the five sections were similar. For the interval of [250, 400) ms, the cumulative frequency of Section A was significantly lower than that of the other sections. For the interval of [350, 700) ms, the cumulative frequency of Section C was significantly higher than that of the other sections. Starting from the point of 650 ms, Section B and Section C obtained higher cumulative frequencies than the other three sections, and similar to each other.
The cumulative frequency of fixation time of the five sections was fitted, and their accuracies were compared. The fitted mathematical models of Section A–E were shown in Equations (4)–(8), respectively.
F = 1 E 6 t 2 + 0.0024 t 0.1864 ,
F = 1 E 6 t 2 + 0.0024 t 0.1519 ,
F = 1 E 6 t 2 + 0.0027 t 0.2076 ,
F = 1 E 6 t 2 + 0.0022 t 0.1182 ,
F = 1 E 6 t 2 + 0.0024 t 0.1613 ,
where F is the cumulative frequency of fixation time, t is the drivers’ fixation time (in seconds).
Referring to the 85th/15th percentile speed as the basis of speed limit theory [29], the range of the 15th–85th was considered as the fixation time of interest, i.e., the fixation time within this range was reasonable and acceptable for all drivers. For the fixation time less than the 15th, the driver’s interest could not be aroused. For the fixation time more than the 85th, it was hard to extract the fixation information. After obtaining the fitting curves, the fixation time values of the 85th and the 15th were calculated via interpolation as summarized in Table 2.
For the 85th fixation time, it was hard to extract information from the fixation point. The sections were enumerated as Section C (475.414 ms) < Section B (538.109 ms) < Section E (545.248 ms) < Section A (564.705 ms) < Section D (608.268 ms), where the difference between the maximum and the minimum was 132.854 ms. The ranking for the 15th fixation time was Section D (129.536 ms) < Section B (133.182 ms) < Section E (137.597 ms) < Section C (139.669 ms) < Section A (149.476 ms). For this time, the difference between the maximum and the minimum values was only 19.940 ms, which was very close.
Considering all road sections, the range occurred between the lowest value of the 85th fixation time and the maximum value of the 15th fixation time, which were 475.414 ms and 149.476ms, respectively. In other terms, when entering the tunnel, the driver’s fixation time in each section was in the range of 149.476 to 475.414 ms.

4. Discussion

4.1. Saccade Characteristics

Previous studies have shown that there was a positive correlation between the driver’s saccade angle and sight distance [16]. In the process of entering the urban underpass tunnel, the distribution of the driver’s saccade angle in each section is shown in Figure 8. Here we discuss the results of the saccade angle in combination with the changes of the sight distance and sight zone in different sections of the tunnel, such as the external straight-line section, the ramp, and the entrance inner section.
Due to the spacious environment and various signs of the external straight-line section, the drivers needed to pay extra attention to surrounding vehicles and their vicinity in this area. Hence, the saccade angle, saccade angle dispersion, and saccade frequency were the largest. The changes of sight distance and sight zone in different sections of urban underpass tunnel entrance are shown in Figure 9 and Figure 10.
In the upper half of the ramp, since the sidewall of the downhill section became gradually higher, the driver’s sight zone was increasingly limited, and the sightline was concentrated at the entrance. Hence, the saccade angle and frequency were reduced. The saccade angle and the standard deviation of the lower half of the ramp were the smallest, i.e., the dispersion of the saccade angle in front of the entrance was smaller and the saccade range was more concentrated.
Looking back at the driving video recorded of the eye tracker for analysis, in the shading shed section, the driver has just entered the tunnel. Due to the limited sight distance and zone, the driver needed urgent perception of changes in the surrounding environment, so the saccade angle and frequency were improved compared to the lower half of the ramp. After entering the tunnel through the shading shed, the saccade angle and frequency were similar to those of the straight-line section; however, the standard deviation was 20.925% lower, and the saccade range was more concentrated.

4.2. Fixation Characteristics

The statistics of drivers’ fixation time in Section A–Section E are shown in Table 3. The average and median values both showed that the fixation time of the external straight-line section (Section A) and the entrance inner section (Section E) was significantly longer than that of other sections, and the lower half of the ramp (Section C) and the shading shed section (Section D) have the smallest fixation time. The standard deviation also reflected that the fixation time distribution of section C in front of tunnel portal was more concentrated, and the smallest standard deviation was 33.372% lower than the maximum.
According to the changes of visual environment in different sections of tunnel entrance, the 85th and the 15th fixation times proposed in this paper were discussed. Figure 11 shows drivers’ the 15th and the 85th fixation times and the difference between them in different sections.
The differences between the 15th and the 85th fixation times in the external straight-line section, the upper and the lower halves of the ramp, the shading shed section, and the entrance inner section were 415.229, 404.927, 335.745, 478.732, and 407.651 ms, respectively. As revealed, the fixation range became more concentrated when the fixation time threshold gets smaller. The 15th–85th fixation time and the different range of the external straight-line were larger than that of the ramp section. The surrounding environment, such as the signs, of the external straight-line section was more complex than that of the ramp section; hence, the driver had to focus on extracting the key information required for the drive. The sight zone of the ramp section was narrow, and the environment was relatively monotonous. The driver paid more attention to the direction of the entrance, and the distribution range of the fixation time in the ramp section was the smallest. The 85th fixation time threshold of the lower half of the ramp was smaller than that of the upper half, which indicated that the driver’s fixation was more and more concentrated when the sidewalls were higher and closer to the portal.
In the shading shed section, the driver’s 85th fixation time and the range of 15th–85th difference were the largest. The longer the fixation time, the harder it gets to recognize [12]. The visual load and the psychological pressure in the tunnel were higher compared to the outside [11], and the fixation time of this section was significantly longer than that of the external section of the tunnel. After driving through the shading shed section, the driver gradually adapted to the tunnel despite the limited space; hence, the fixation time of this section was shorter than that of the shading shed section.

5. Conclusions and Future Work

Alleviating the adverse effects of vision before entering the tunnel is of utmost importance to enhance traffic safety in the tunnel. The research conducted the real vehicle experiment in an urban underpass tunnel, the drivers’ saccade and fixation characteristics at different sections of the entrance were studied. The main research conclusions were as follows:
(1)
The distribution of saccade angle in entrance different sections was the lower half of the ramp < the shading shed section < the upper half of the ramp < the entrance inner section < the external straight-line section. Saccade range on the ramp section was small, and the drivers’ saccade activity in the external straight-line section and the entrance inner section was intense.
(2)
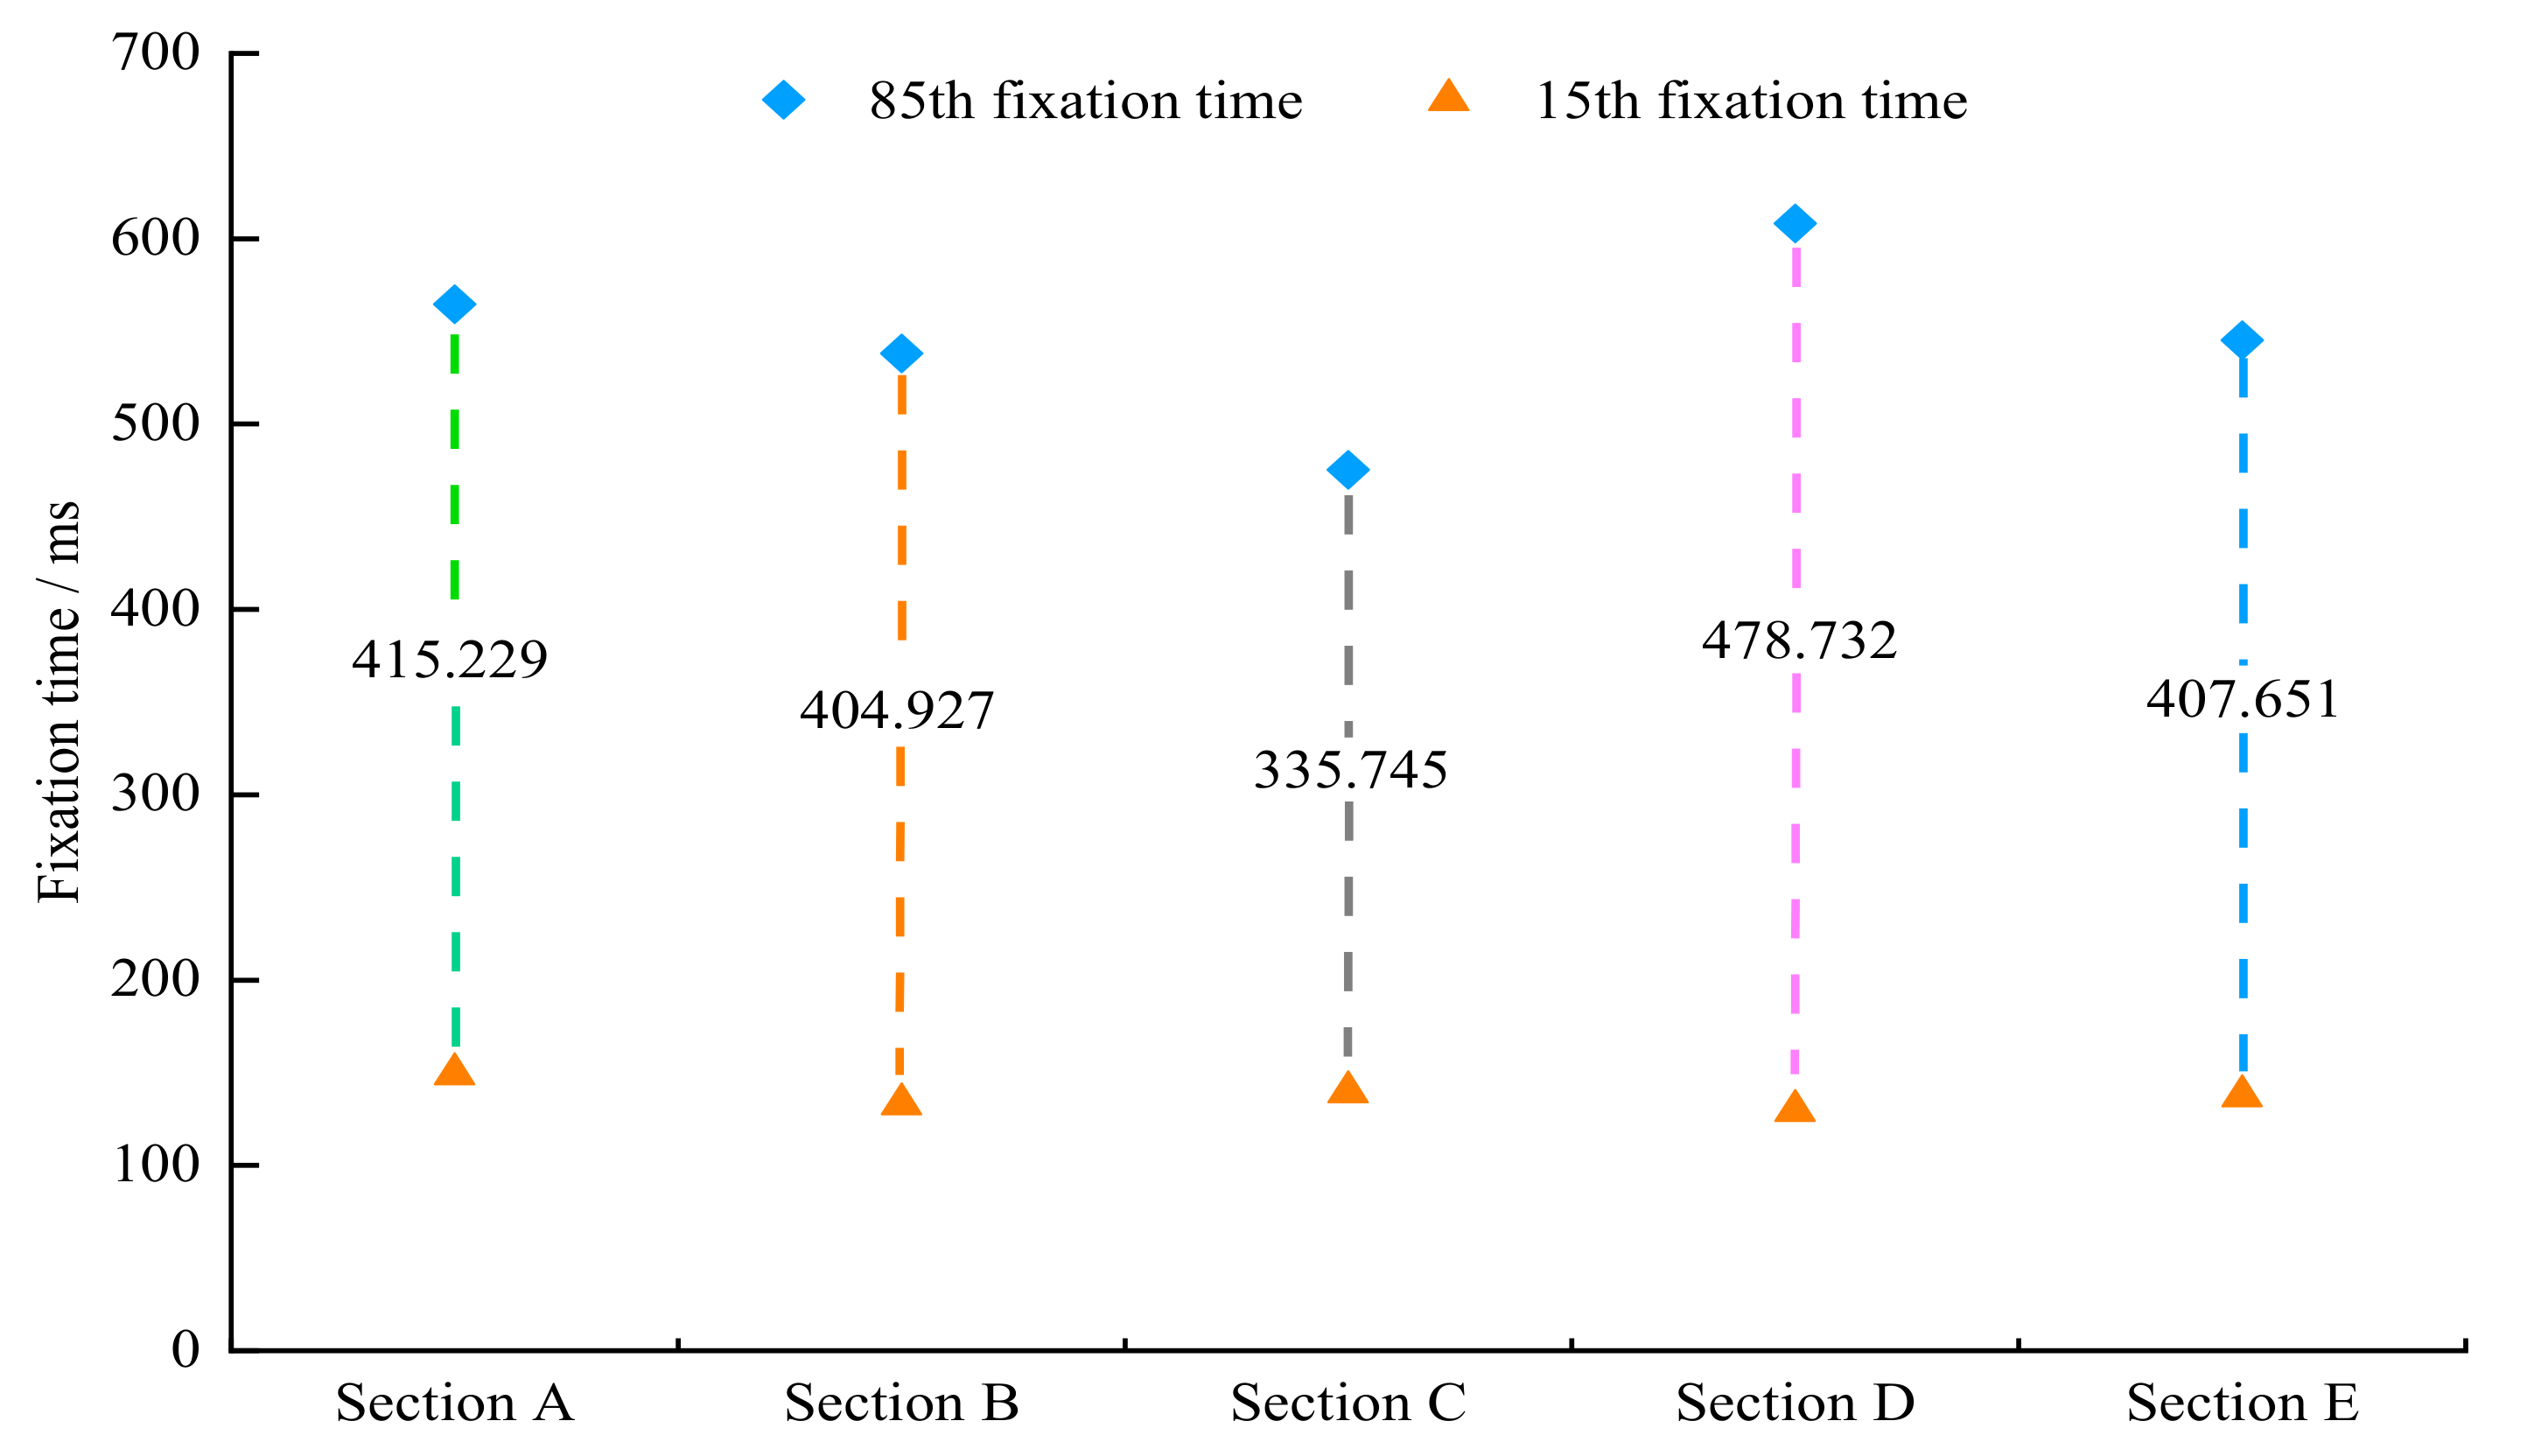
For the 85th fixation time threshold, the enumeration was as follows: the lower half of the ramp < the upper half of the ramp < the entrance inner section < the external straight-line section < the shading shed section. And more than 80% of the fixation time in all entrance sections was within 600 ± 50 ms.
(3)
According to the calculation results of the fixation time threshold, the driver’s fixation time was in the range of 149.476 to 475.414ms under normal circumstances when entering the urban underpass tunnel.
(4)
This study could provide a theoretical basis for line-of-sight guidance and traffic safety improvement at tunnel entrance.
This paper studied the fixation and saccade characteristics of drivers in consideration of underpass entrance alignment, drivers’ sight distance, and sight zone. However, the changes in the drivers’ pupil area and the subtle variations in vehicle speed were not considered when entering the tunnel. In our future studies, we will investigate these issues for a better understanding. At the same time, the improvement of visual guiding and traffic safety facilities based on the drivers’ visual characteristics is our next focus.

Author Contributions

Conceptualization, F.J. and Z.D.; methodology, F.J. and H.Z.; software, S.W.; validation, Z.D., H.Z.; formal analysis, F.J.; investigation, F.J. and S.W.; resources, L.H.; data curation, L.H. and C.C.; writing—original draft preparation, F.J.; writing—review and editing, Z.D.; visualization, S.W.; supervision, H.Z.; project administration, F.J.; funding acquisition, Z.D. All authors have read and agreed to the published version of the manuscript.

Funding

This research was funded by Fundamental Research Funds for the Central Universities, grant number 2020-YB-018, and by National Natural Science Foundation of China, grant number 52072291.

Institutional Review Board Statement

Not applicable.

Informed Consent Statement

Written informed consent has been obtained from the patient(s) to publish this paper.

Data Availability Statement

Restrictions apply to the availability of these data. Data was obtained from a real vehicle experiment conducted by School of Transportation, Wuhan University of technology and are available from the authors with the permission of School of Transportation.

Acknowledgments

The authors gratefully acknowledge all participants who participated in this study, and support from China Scholarship Council.

Conflicts of Interest

The authors declare no conflict of interest. The funders had no role in the design of the study; in the collection, analyses, or interpretation of data; in the writing of the manuscript, or in the decision to publish the results.

References

  1. Liu, C.; Wang, Q. Simulating Human Visual Perception in Tunnel Portals. Sustainability 2021, 13, 3741. [Google Scholar] [CrossRef]
  2. Zhao, W.; Liang, Y.; Xu, Z.; Kong, J.; Chen, T.; Wang, B. Study on the influence of bypass tunnel angle on gas shunting efficiency of urban road tunnels. J. Wind Eng. Ind. Aerod. 2020, 205, 104229. [Google Scholar] [CrossRef]
  3. Yeung, J.; Wong, Y.; Xu, H. Driver perspectives of open and tunnel expressways. J. Environ. Psychol. 2013, 36, 248–256. [Google Scholar] [CrossRef]
  4. Thiffault, P.; Bergeron, J. Monotony of road environment and driver fatigue: A simulator study. Accid. Anal. Prev. 2003, 35, 381–391. [Google Scholar] [CrossRef]
  5. Ting, P.; Hwang, J.; Dong, J.; Jeng, M. Driver fatigue and highway driving: A simulator study. Physiol. Behav. 2008, 94, 448–453. [Google Scholar] [CrossRef]
  6. Feng, Z.; Yang, M.; Zhang, W.; Du, Y.; Bai, H. Effect of longitudinal slope of urban underpass tunnels on drivers’ heart rate and speed: A study based on a real vehicle experiment. Tunn. Undergr. Space Technol. 2018, 81, 525–533. [Google Scholar] [CrossRef]
  7. Lu, L.; Lu, J.; Xing, Y.; Wang, C.; Pan, F. Statistical analysis of traffic accidents in shanghai river crossing tunnels and safety countermeasures. Discrete. Dyn. Nat. Soc. 2014, 1, 1–7. [Google Scholar] [CrossRef]
  8. Jian, S.; Wong, Y. Road traffic accidents in Singapore expressway tunnels. Tunn. Undergr. Space Technol. 2013, 38, 534–541. [Google Scholar] [CrossRef]
  9. Ye, F.; He, C.; Wang, S.; Zhang, J. Landscape design of mountain highway tunnel portals in China. Tunn. Undergr. Space Technol. 2012, 29, 52–68. [Google Scholar] [CrossRef]
  10. Tang, T.; Guo, Y.; Zhou, X.; Labi, S.; Zhu, S. Understanding electric bike riders’ intention to violate traffic rules and accident proneness in China. Travel. Behav. Soc. 2020, 23, 25–38. [Google Scholar] [CrossRef]
  11. Du, Z.; Zheng, Z.; Zheng, M.; Ran, B.; Zhao, X. Drivers’ visual comfort at highway tunnel portals: A quantitative analysis based on visual oscillation. Transp. Res. Part D Transp. Environ. 2014, 31, 37–47. [Google Scholar] [CrossRef]
  12. Victor, T.; Harbluk, J.; Engstrem, J. Sensitivity of eye-movement measures to in-vehicle task difficulty. Transp. Res. Part F Traffic Psychol. Behav. 2005, 8, 167–190. [Google Scholar] [CrossRef]
  13. Qin, L.; Dong, L.; Xu, W.; Zhang, L.; Leon, A. Influence of Vehicle Speed on the Characteristics of Driver’s Eye Movement at a Highway Tunnel Entrance during Day and Night Conditions: A Pilot Study. Int. J. Environ. Res. Public Health 2018, 15, 656. [Google Scholar] [CrossRef] [PubMed] [Green Version]
  14. Gramann, K.; Sharkawy, J.; Deubel, H. Eye-Movements during Navigation in a Virtual Tunnel. Int. J. Neurosci. 2009, 119, 1755–1778. [Google Scholar] [CrossRef]
  15. Yan, Y.; Wang, X.; Shi, L.; Liu, H. Influence of light zones on drivers’ visual fixation characteristics and traffic safety in extra-long tunnels. Traffic Inj. Prev. 2017, 18, 102–110. [Google Scholar] [CrossRef] [PubMed]
  16. Jiao, F.; Du, Z.; Wang, S.; Ni, Y.; He, R. Drivers’ Saccade Characteristics in Curves of Extra-Long Urban Underwater Tunnels. Transp. Res. Rec. 2020, 2674, 102–111. [Google Scholar] [CrossRef]
  17. Gil-Martin, L.; Gomez-Guzman, A.; Pena-Garcia, A. Use of diffusers materials to improve the homogeneity of sunlight under pergolas installed in road tunnels portals for energy savings. Tunn. Undergr. Space Technol. 2015, 48, 123–128. [Google Scholar] [CrossRef]
  18. Zhang, F.; Lu, J.; Hu, X.; Hao, X. Investigating safety impact of sun glare in urban tunnels based on cellular automata approach. Accid. Anal. Prev. 2020, 148, 105821. [Google Scholar] [CrossRef]
  19. Wan, H.; Du, Z.; Yan, Q. The speed control effect of highway tunnel sidewall markings based on color and temporal frequency. J. Adv. Transp. 2016, 50, 1352–1365. [Google Scholar] [CrossRef]
  20. Zheng, Z.; Du, Z.; Yan, Q.; Xiang, Q.; Chen, G. The impact of rhythm-based visual reference system in long highway tunnels. Safety Sci. 2017, 95, 75–82. [Google Scholar] [CrossRef]
  21. Chen, P.; Chen, F.; Zhang, L.; Ma, X.; Pan, X. Examining the influence of decorated sidewall in road tunnels using FMRI technology. Tunn. Undergr. Space Technol. 2020, 99, 103362. [Google Scholar] [CrossRef]
  22. Qin, X.; Zhang, N.; Zhang, W.; Meitner, M. How does tunnel interior color environment influence driving behavior? Quantitative analysis and assessment experiment. Tunn. Undergr. Space Technol. 2020, 98, 103320. [Google Scholar] [CrossRef]
  23. Konstantopoulos, P.; Chapman, P.; Crundall, D. Exploring the ability to identify visual search differences when observing drivers’ eye movements. Transp. Res. Part F Traffic Psychol. Behav. 2012, 15, 378–386. [Google Scholar] [CrossRef]
  24. Christie, J.; Just, M. Remembering the location and content of sentences in a prose passage. J. Educ. Psychol. 1976, 68, 702–710. [Google Scholar] [CrossRef]
  25. Chan, A.; Tang, N. Visual lobe shape and search performance for targets of different difficulty. Ergonomics 2007, 50, 289–318. [Google Scholar] [CrossRef]
  26. Reimer, B. Impact of Cognitive Task Complexity on Drivers’ Visual Tunneling. Transp. Res. Rec. 2009, 2138, 13–19. [Google Scholar] [CrossRef]
  27. Crundall, D.; Underwood, G. Effects of experience and processing demands on visual information acquisition in drivers. Ergonomics 1998, 41, 448–458. [Google Scholar] [CrossRef]
  28. Konstantopoulos, P.; Chapman, P.; Crundall, D. Driver’s visual attention as a function of driving experience and visibility. Using a driving simulator to explore drivers’ eye movements in day, night and rain driving. Accid. Anal. Prev. 2010, 42, 827–834. [Google Scholar] [CrossRef] [PubMed]
  29. Abbas, S.; Adnan, M.; Endut, I. Exploration of 85th percentile operating speed model on horizontal curve: A case study for two-lane rural highways. Procedia Soc. Behav. Sci. 2011, 16, 352–363. [Google Scholar] [CrossRef] [Green Version]
Figure 1. Front view of the urban underpass tunnel.
Sustainability 13 05224 g001
Figure 2. Schematic diagram of each section of an urban underpass tunnel entrance.
Sustainability 13 05224 g002
Figure 3. Dikablis eye tracker.
Sustainability 13 05224 g003
Figure 4. Analysis interface of D-Lab software.
Sustainability 13 05224 g004
Figure 5. Saccade angle and frequency of each section.
Sustainability 13 05224 g005
Figure 6. Frequency distribution of fixation time in different sections.
Sustainability 13 05224 g006
Figure 7. Cumulative frequency of fixation time in different sections.
Sustainability 13 05224 g007
Figure 8. Saccade angle distribution of Section A–Section E.
Sustainability 13 05224 g008
Figure 9. Driver’s sight distance and sight zone in the upper half of the ramp (Section B).
Sustainability 13 05224 g009
Figure 10. Driver’s sight distance and sight zone in the lower half of the ramp (Section C).
Sustainability 13 05224 g010
Figure 11. Fixation time thresholds of different sections.
Sustainability 13 05224 g011
Table 1. Saccade angle statistics of each section.
TypeSection ASection BSection CSection DSection E
Average value/Degree11.7988.8937.5178.71911.223
Maximum/Degree40.02231.41918.82524.26233.109
Standard deviation8.8467.8354.3646.5026.995
Table 2. Fixation time threshold for different sections.
TypeSection ASection BSection CSection DSection E
85%564.705538.109475.414608.268545.248
15%149.476133.182139.669129.536137.597
Table 3. Mathematical statistics of drivers’ fixation time of each section.
TypeSection ASection BSection CSection DSection E
Average value/ms443.212 418.313 381.116 419.891 434.357
Median value/ms383.000 308.500 300.000 283.000 317.000
Standard deviation302.535 329.168 219.319 300.569 309.730
Publisher’s Note: MDPI stays neutral with regard to jurisdictional claims in published maps and institutional affiliations.

