Article

The Influence of Extruded Sugar Beet Pulp on Cookies’ Nutritional, Physical and Sensory Characteristics

1
Faculty of Technology Novi Sad, University of Novi Sad, Bul. Cara Lazara 1, 21000 Novi Sad, Serbia
2
Faculty of Food Technology Osijek, Josip Juraj Strossmayer University of Osijek, Franje Kuhača 18, 31000 Osijek, Croatia
3
Elementary School “Dositej Obradović”, Zmaj Jovina 59, 22406 Irig, Serbia
4
Department of Food Technology, Karlovac University of Applied Sciences, Trg J.J. Strossmayera 9, 47000 Karlovac, Croatia
5
University College Aspira, Mike Tripala 6, 21000 Split, Croatia
6
Department of Agriculture, Polytechnic in Požega, Vukovarska 17, 34000 Požega, Croatia
*
Author to whom correspondence should be addressed.
Sustainability 2021, 13(9), 5317; https://0-doi-org.brum.beds.ac.uk/10.3390/su13095317
Submission received: 12 April 2021 / Revised: 6 May 2021 / Accepted: 7 May 2021 / Published: 10 May 2021

Abstract

:
Sugar beet pulp (SBP) is a by-product of the sugar industry in which the dietary fiber content ranges from 73% to 80%. Compared to cereal fibers mainly used in biscuit production, sugar beet fibers are gluten free and have a perfect ratio of 2/3 insoluble fiber. In this work, sugar beet pulp was extruded with corn grits (ratios of corn grits to sugar beet pulp in extrudates were 85:15, 70:30, and 55:45), and the obtained sugar beet pulp extrudates (SBPEs) were used for improving the nutritional quality of cookies. The wheat flour in cookies was replaced with SBPEs in the amount of 5, 10, and 15%. The influence of three factors (the percentage of sugar beet pulp in the SBPEs, the size of the SBPE particles, and the percentage of wheat flour substituted with SBPEs) and their interactions on the nutritional quality of cookies, as well as their physical and sensory characteristics are examined using the Box–Behnken experimental design. The addition of extruded sugar beet pulp (SBPEs) significantly increased the amount of total dietary fiber and mineral matter of cookies. On the whole, the addition of SBPEs increased cookie hardness, but the hardness decreased with an increase in extrudate particle size. Sensory characteristics (except for the taste) were the most influenced by extrudate particle size.

1. Introduction

In developed countries, food waste in the food industry is up to 40%. Large quantities of waste, in addition to the large loss of valuable materials, also cause serious problems, both economically and ecologically. In the food industry, there is a large number of by-products; if not used in animal food production, these are considered as waste, which greatly pollute the environment [1]. While it is reported that 870 million people are chronically undernourished, one-third of the food produced for human consumption is wasted globally. Therefore, the use of this waste has become a growing trend in the food industry [2]. Components that can be found in the food by-products (protein, minerals, fiber, antioxidants) may increase the nutritional value of the new products and thus reduce the overall waste [3]. In recent years, there have been a lot of studies that investigated the influence of food industry by-product on the nutritional characteristics of different food products. Jozinovic et al. concluded that the addition of brewer’s spent grain, sugar beet pulp (SBP), and apple pomace increased the total phenolic content, antioxidant activity, and dietary fiber of snack products based on corn grits [4]. Cookies’ nutritional characteristics were improved by the addition of orange-juice industry by-products [5,6], blueberry pomace [7,8], carrot pomace [9], cocoa shell [10], apple peel [11], grape pomace [12,13,14], sour cherry pomace [15], and potato peel [16]. Likewise, investigations showed that it is possible to make high-fiber bread with acceptable sensory characteristics using olive-industry by-products [17], grape pomace [18], brewer’s spent grain [19,20], mango peel [21], by-products from the flaxseed industry [22], sugar beet pulp, and apple pomace [23].
These by-products usually contain a high percentage of moisture and are prone to microbial degradation, so it is necessary to stabilize them in some way and allow for a longer storage period and easy dosing when involved as raw material in the production of new food products. The extrusion process has many advantages over other processes. These include lower energy losses and operating costs without major investment, high productivity and process continuity, and the increased nutritional quality of the product due to the increased digestibility of proteins and starches, the inactivation of enzymes and anti-nutritive components, and an increase in the proportion of soluble dietary fiber. Moreover, by selecting the right process parameters, a wide variety of products can be obtained, and the product can retain natural colors and aromas [24,25].
Sugar beet pulp is a by-product of the sugar extraction process. Approximately 25% to 30% of the world’s sugar production is provided by sugar beet. Each year, the world produces 120 million tons of sugar beet pulp [26]. Physical and chemical properties suggest the possible utilization of sugar beet pulp as dietary fiber in human nutrition [27]. Sugar beet pulp has high dietary fiber content, typically ˃750 mg/g, and it is well known for its high soluble fiber content (10–20%) [28].
Nutritional data show that beet fiber contains around 8% protein (by weight) and 67% carbohydrates such as hemicellulose (28%), cellulose (19%), and pectin (18%) [29]. Dietary fiber available for human digestion is generally more than 20% [28]. Leontowicz et al. [30] investigated the effect of sugar beet pulp on cholesterol with a positive result. Al-Tamimi et al. [31] claimed that pectic oligosaccharides in sugar beet pulp (arabinan) may function as a prebiotic in the human gut. The use of sugar beet fiber in processed foods is limited by its texture and taste [32]. These limitations can be overcome by the extrusion process. Ralet et al. [33] concluded that extrusion-cooking increased the solubility of sugar beet fiber, which can modify their functional properties and lead to new technological applications.
Cookies are a suitable basis for the addition of biologically active components that will significantly improve their nutritional characteristics. Cookie production is quite simple, they are not expensive, and have a long shelf-life [34]. By introducing a cheap, nutritionally valuable by-product like sugar beet pulp as raw material into the production process, a functional product could be obtained. Taking into consideration that any change in the ingredients can modify cookie characteristics, this paper investigates the effect of the addition of extruded sugar beet pulp to the characteristics of the cookies. They are examined based on the quantity of wheat flour replaced by the extruded sugar beet pulp (SBPEs), the different size of the extrudate particles, as well as the portion of the by-product (sugar beet pulp) in the extrudate.

2. Materials and Methods

2.1. Materials

Corn grits were obtained from ‘‘Žito’’ company Ltd., Osijek (Croatia), sugar beet pulp from Sugar Factory Osijek Ltd. (Croatia), and wheat flour for cookie production from the milling company “Ratar“ Pančevo (Serbia). Vegetable fat (palm oil) was obtained from the oil factory “Dijamant” (Serbia). Powdered sugar, salt, sodium bicarbonate, and ammonium bicarbonate were obtained in a local store.

2.2. Preparation of Sugar Beet Pulp Extrudates (SBPEs)

Corn grits and sugar beet pulp were mixed in ratios 85:15, 70:30, and 55:45. The chemical composition of used raw materials for the production of SBPEs was presented in our previous work [35]. Blended mixtures were conditioned to 30% of moisture, put in plastic bags, and left for 24 h before the extrusion. Prepared samples were extruded using the laboratory single screw extruder 19/20DN, Brabender, Germany. Extrusion parameters were as follows: compression ratio screw: 1:1; die: 5 mm; temperature profile: 70 °C in dosing zone, 90 °C in compression zone, and 100 °C in ejection zone; screw speed: 600 rpm; dosing speed: 40 rpm. Prepared extrudates were air-dried overnight at ambient temperature and stored in plastic bags. The extrudates were subsequently ground with an IKA MF10 laboratory mill and sieved through a laboratory sieve stack (BÜHLER, MLU300) to produce three fractions: fraction 1—particles < 250 μm; fraction 2—particles from 250 to 1000 μm; and fraction 3—particles from 1000 to 2000 μm. Thus, nine sugar beet pulp extrudates (SBPEs) were obtained (Table 1). The appearance of the SBPEs is shown in Figure 1.

2.3. Chemical Composition

The chemical composition of sugar beet pulp extrudates (SBPEs), wheat flour, and subsequently prepared cookies were determined according to the methods described in the AOAC [36]—protein (No. 950.36), fat (No. 935.38), total dietary fiber (No. 958.29), insoluble dietary fiber (No. 930.22) ash (No. 930.22), and moisture (No. 926.5). The analysis of variance (ANOVA) and Duncan’s least significant differences test were applied at 5% significance level to determine differences among the analyzed samples of extrudates and wheat flour using Statistica 13.3 software (TIBCO Software Inc., Palo Alto, CA, USA, 2016).

2.4. Preparation of Mixtures of Wheat Flour and Sugar Beet Pulp Extrudates (SBPEs) for Cookie Sample Production

Mixtures of wheat flour and SBPE used for the preparation of cookie samples were combined in the F-6-RVC agitator (Forberg International AS, Oslo, Norway). The wheat flour in the mixtures was substituted with SBPEs in the amount of 5, 10, and 15%.

2.5. Alkaline Water Retention Capacity (AWRC)

The AWRC (Alkaline Water Retention Capacity) of the wheat flour–SBPE mixtures was determined according to the standard method (AACC method 56-10) [37]. The analysis of variance (ANOVA) described in Section 2.3 was used to determine differences among the analyzed samples.

2.6. Experiment Planning and Statistical Analysis

In this study, the Box–Behnken experimental design was an efficient option for the analysis of the significance of factor influence because the aim of investigation was to analyze the influence of three input factors and their interactions on cookies characteristics. The input factors were seated on three levels—low (−1), medium (0), and high (+1). Factor A (extrudate fraction, i.e., particle size)—fraction 1, fraction 2, and fraction 3; factor B (percentage of sugar beet pulp in the extrudate)—15%, 30%, and 45%; and factor C (percentage of wheat flour substitution with extrudate)—5%, 10%, and 15%.
The chosen design recommended 15 combinations of factors (15 experiments) instead of 27 for full factorial design, but with 3 central points, which give sufficient information for testing the lack of fit. For each of the responses–measured characteristic of cookies (R), a response surface regression analysis was performed using a fitted full quadratic model obtained by the design, given as:
R = β0 + β1A + β2B + β3C + β12AB + β13AC + β23BC + β11A2 + β22B2 + β33C2
where R is a measured response; β0 is an intercept; βi to βij, i,j ϵ {1,2,3} are regression coefficients; A, B, and C are independent variables. The terms AB, AC, and BC represent interactions of input factors, while A2, B2, and C2 are quadratic terms. The analysis of variance (ANOVA) was used to determine the significance of each input factor. A factor was considered to affect the response if the p-value was less than 0.05 (5% level of significance was used). Corresponding contributions were calculated using the sum of squares obtained by the ANOVA. The analysis was carried out using Statistica 12 and Design Expert 7 (trial version) [38].

2.7. Production of Cookies

Cookie samples were prepared as described by Petrović et al. [39], according to the following formula: wheat flour (i.e., flour/sugar beet pulp extrudate mixture), 200.00 g; vegetable fat, 42.00 g; sugar, 70.00 g; sodium bicarbonate (NaHCO3), 0.6 g; ammonium bicarbonate (NH4HCO3), 0.4 g; and sodium chloride (NaCl), 1.1 g. The amount of water was calculated in relation to the water content of the flour blends in order to obtain dough samples with 22% moisture content. The raw materials were mixed in a mixer (ZD2245, Stephan–Werke GmbH and Co., Hamelin, Germany) for a total of 20 min. After mixing, the dough sample was allowed to rest for 30 min in covered bowls and sheeted between two cylinders of laminator (Marchand LA4-500, Materiel modern Marchand, Rueil—Malmaison, France) with the gap settings between the cylinders measuring 14 mm, 10 mm, 7 mm, and 5 mm. After sheeting, the dough was cut using a 6 cm diameter mould and baked for 10 min at 230 °C in a laboratory oven.

2.8. Cookie Characteristics

2.8.1. Cookie Color

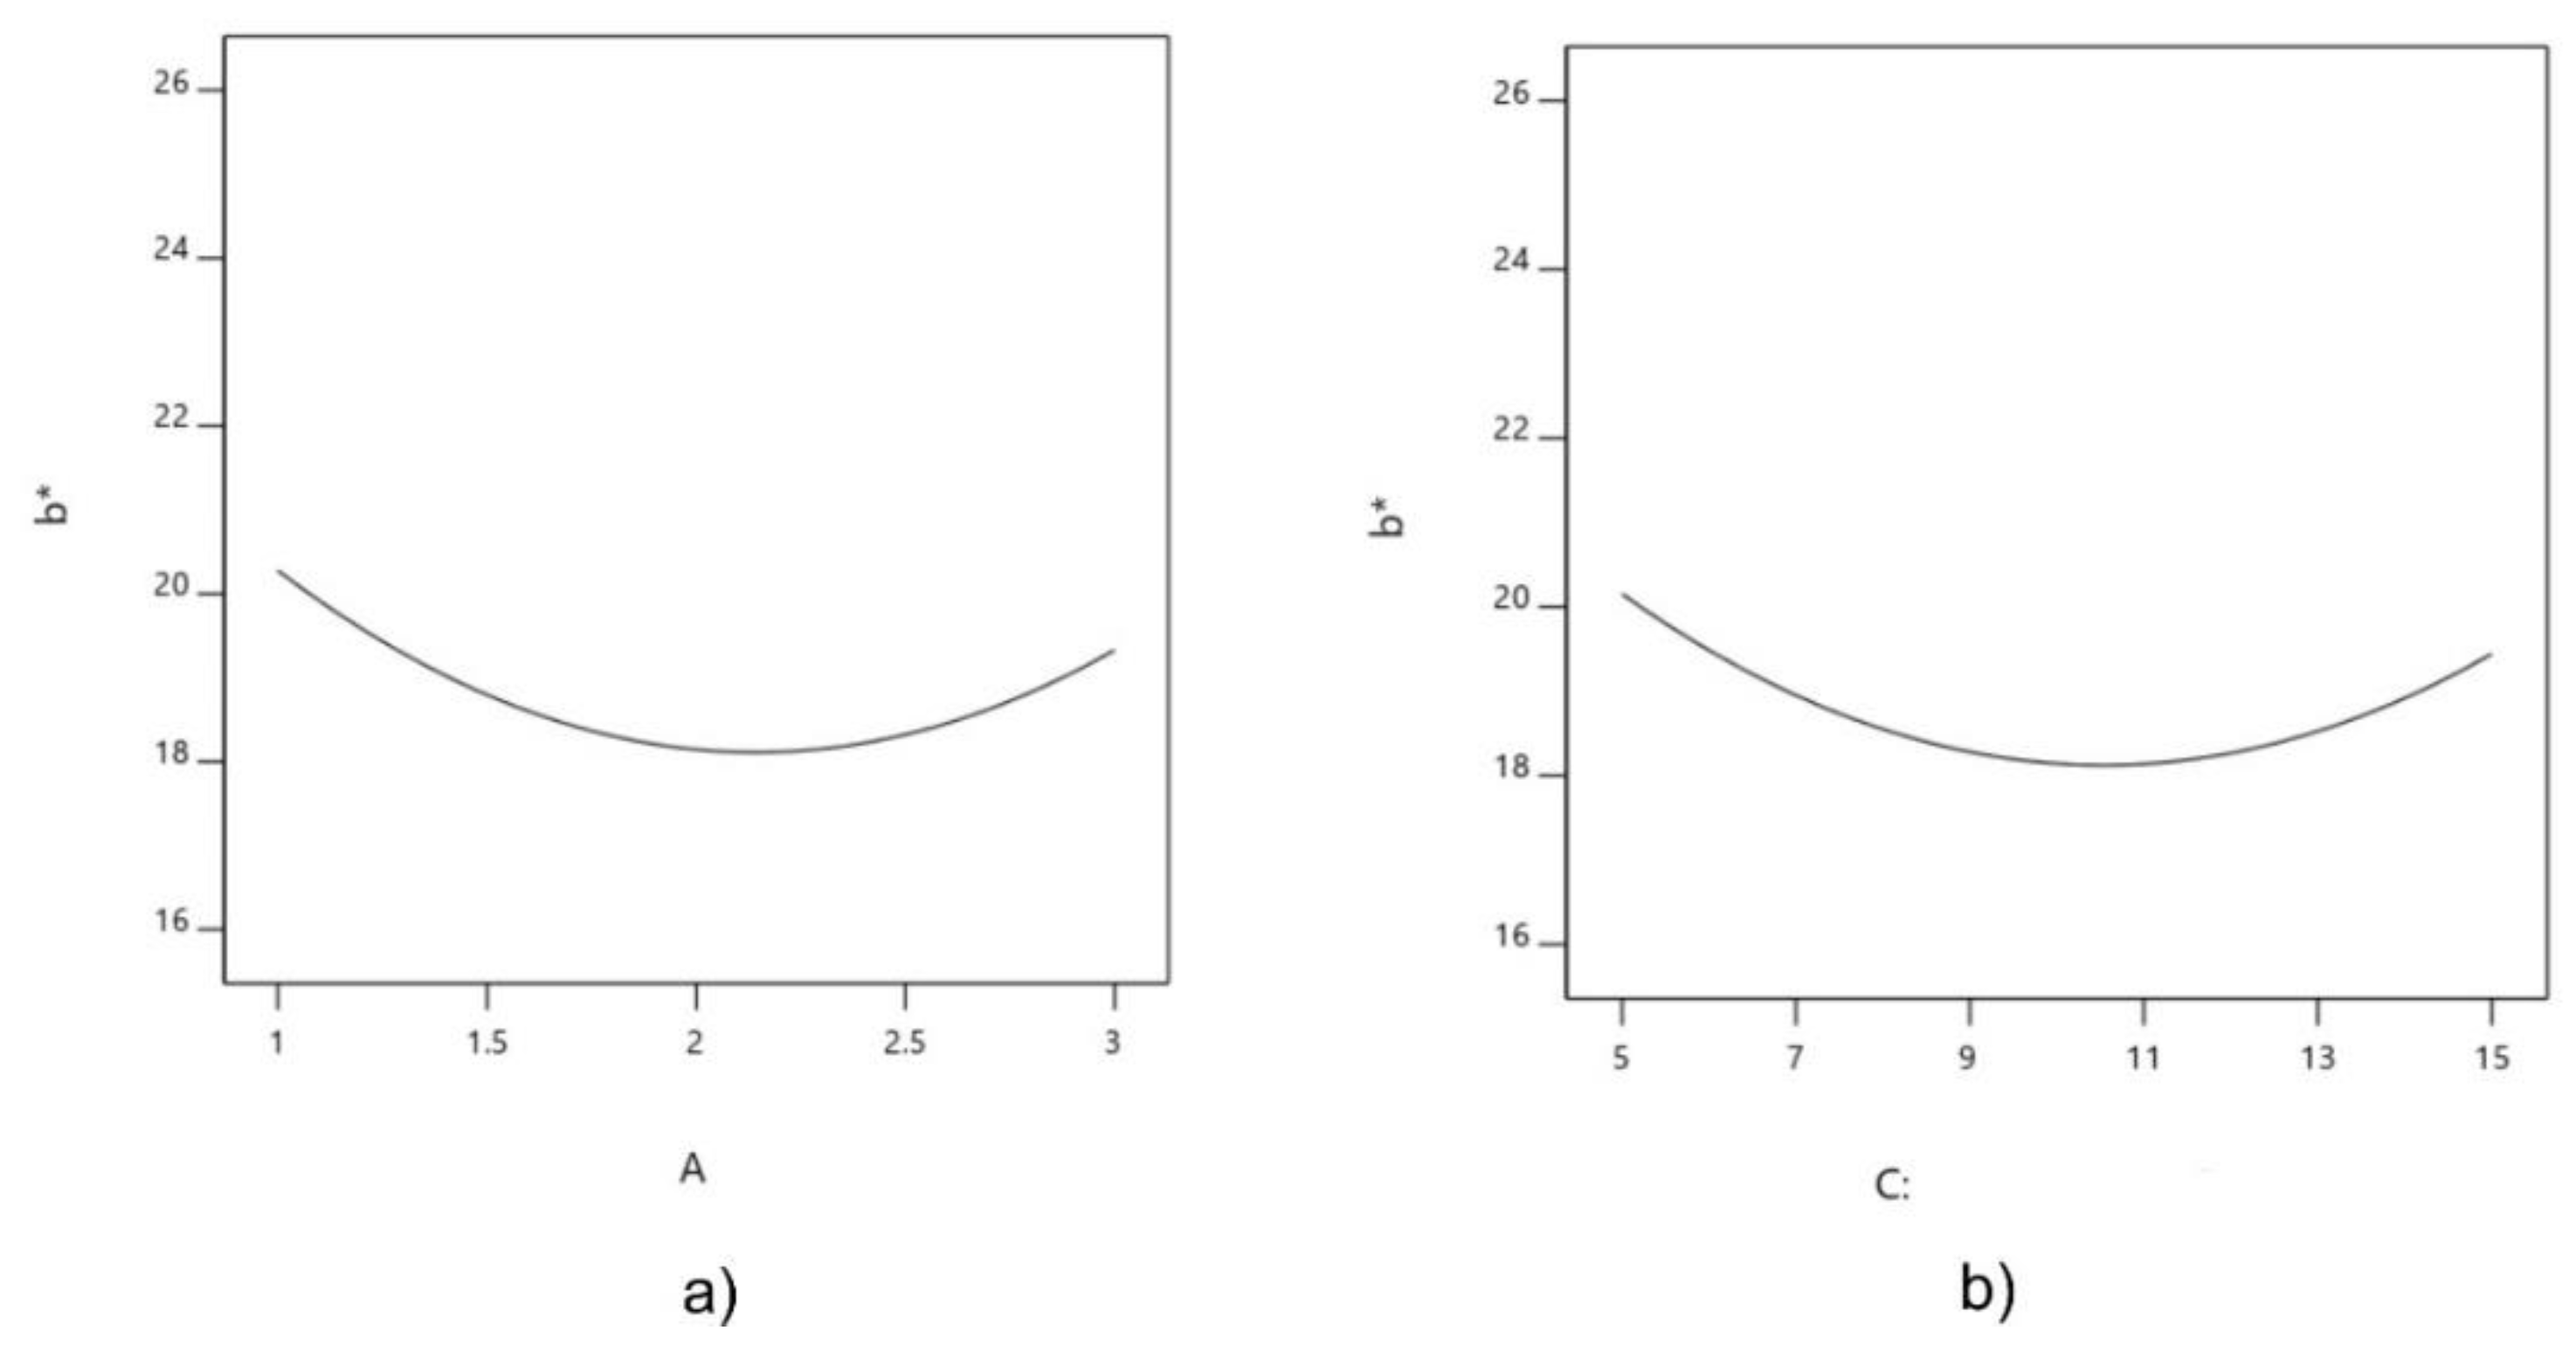
The color of cookie samples was measured in triplicate using a MINOLTA Chroma Meter CR-400 (Minolta Co., Ltd., Osaka, Japan), 24 h after baking. The CIE L*, a*, b* color coordinates (L*—lightness, a*—redness to greenness, and b*—yellowness to blueness) [40] were determined using D-65 lighting, a 2-standard observer angle and an 8-mm aperture in the measuring head.

2.8.2. Cookie Hardness

The hardness was determined with the use of a texture analyser TA.HD Plus (Stable Micro systems, Godalming, UK), obtaining the hardness measurement of biscuits by the cutting method (hardness measurement of biscuit by cutting, BIS2/KB, Texture Exponent 32 software version 4.0.11.0 Stable Micro Systems, Godalming, Surrey, UK). The measurements were performed in three replicates using a knife edge with a slotted insert (HDP/BS) and 25 kg load cell with the following operating parameters: 1.5 mm/s pretest speed, test speed of 2 mm/s, 10 mm/s post-test speed, and 5mm distance. The resulting force–deformation curve was analysed with the Stable Micro systems software, and values of hardness (mean maximum force values) were obtained automatically.

2.8.3. Dimensions of Cookies

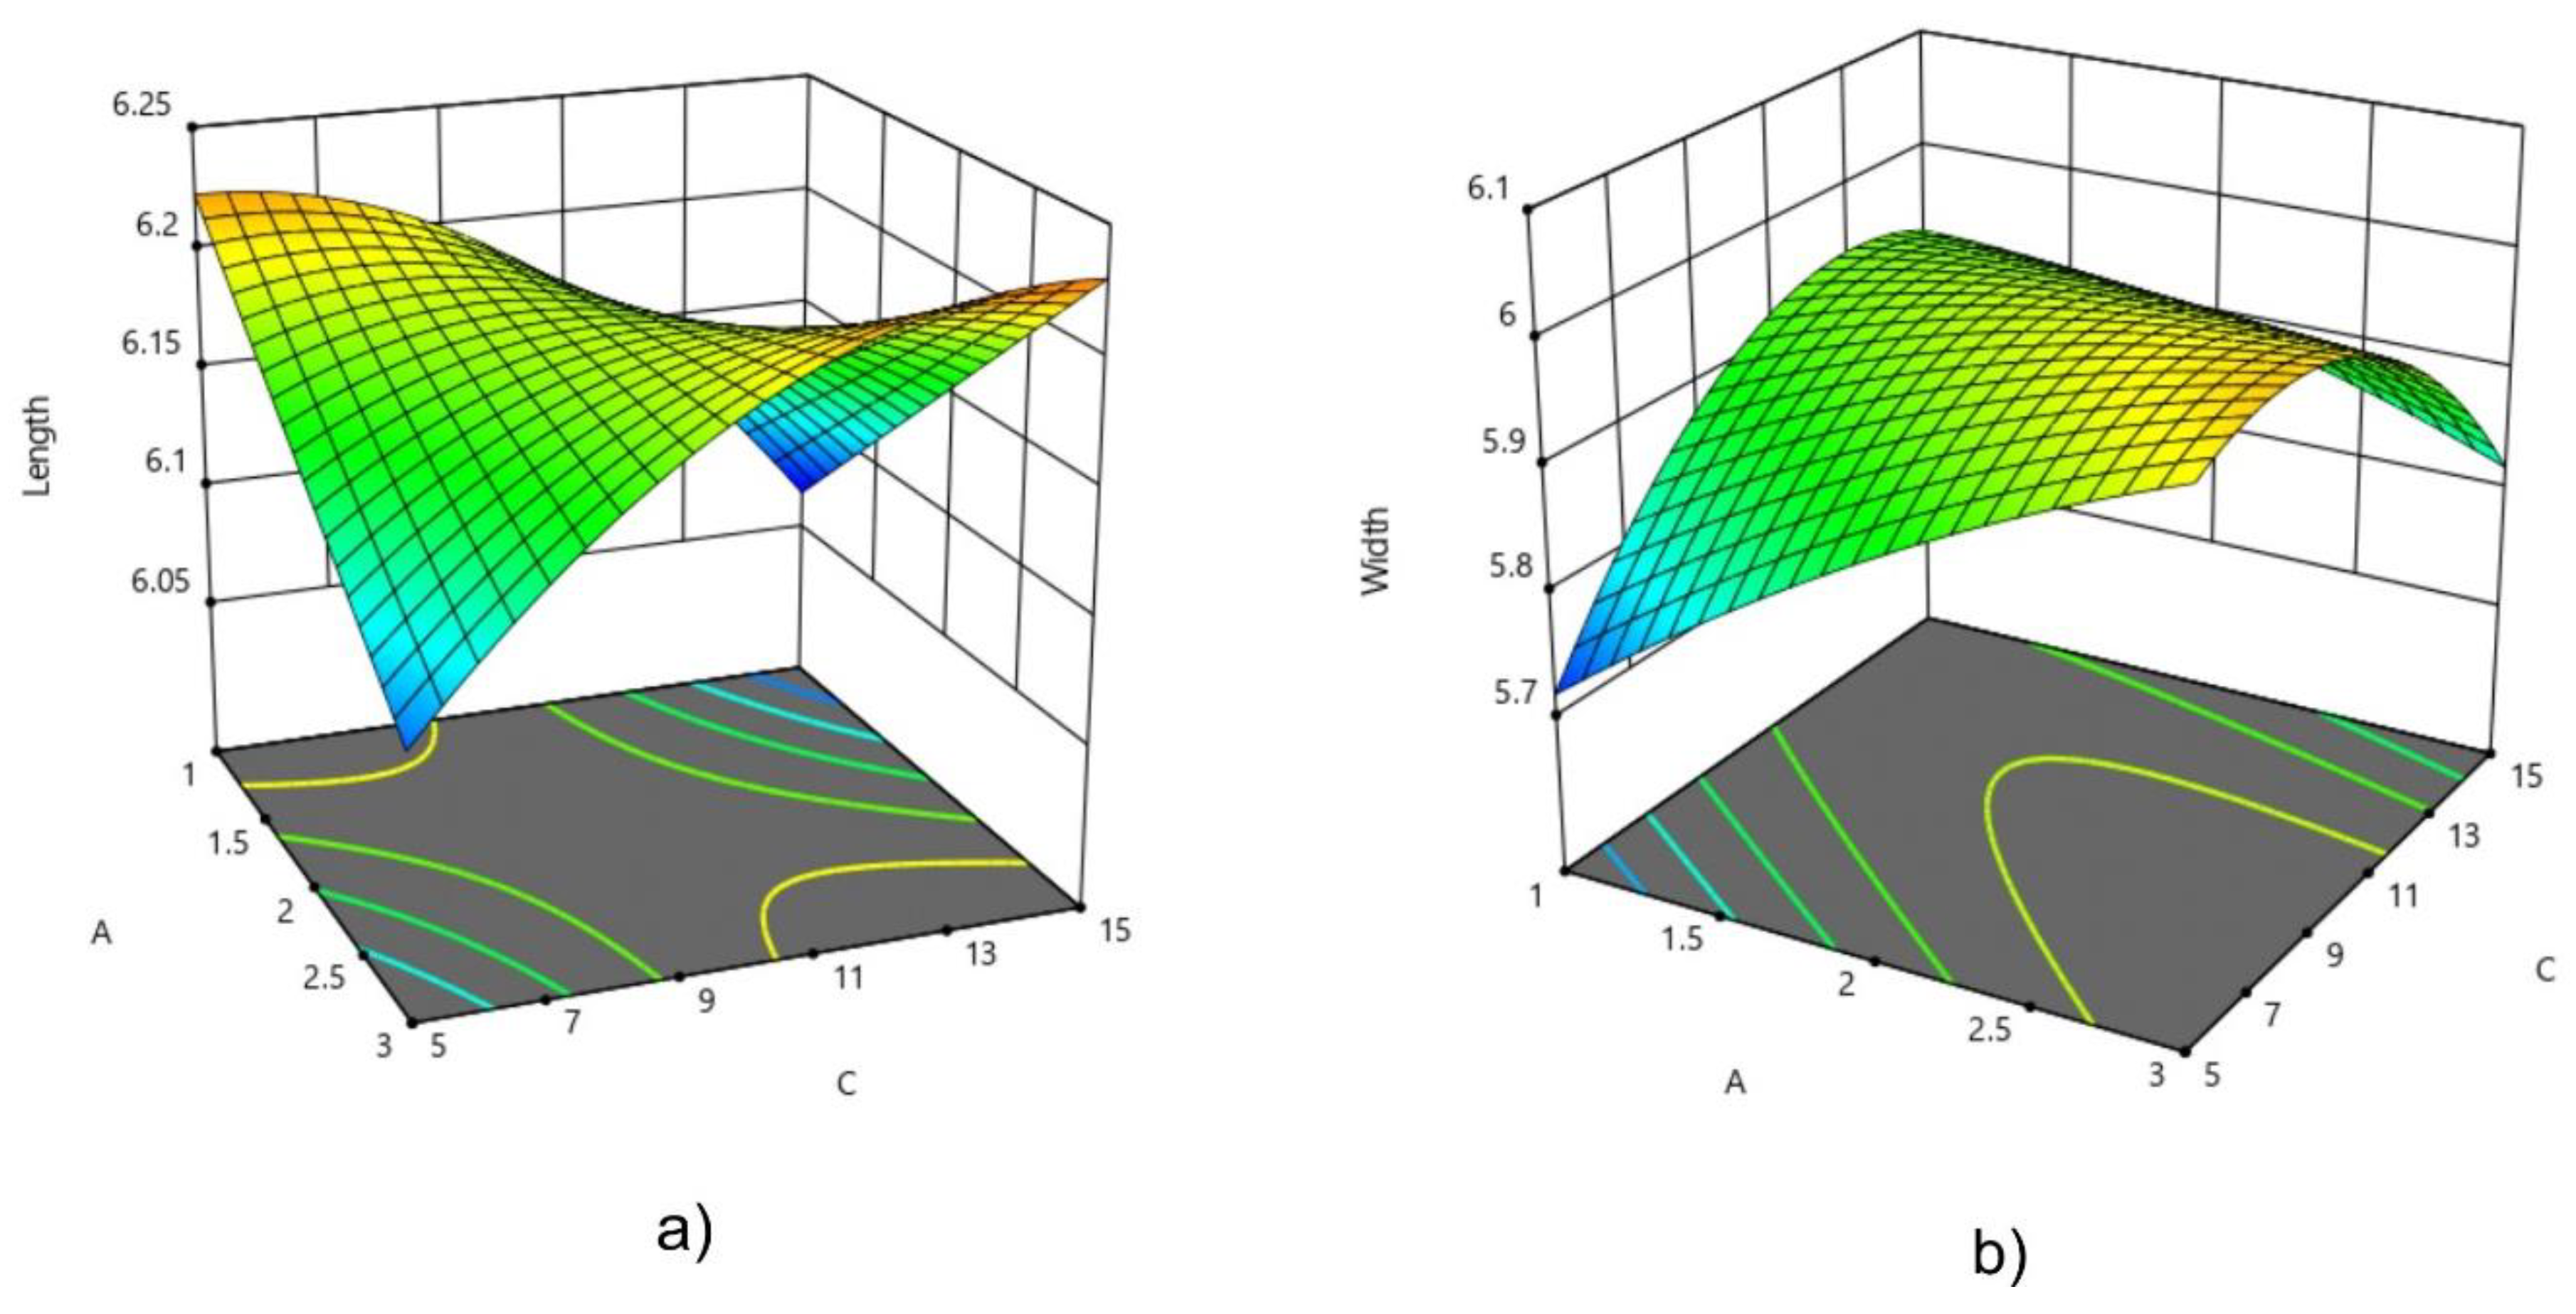
The width, length, and thickness of cookies were measured using a nonius, and the weight of the cookies using a technical scale (EL204-IC; Mettler, Buchi Switzerland).

2.8.4. Sensory Analysis

Cookie samples were evaluated by a panel comprising 10 trained members—4 men and 6 women, all food technologists. The evaluators developed and adopted a final list of 6 significant sensory attributes to be used in the examination. The intensity of each attribute was indicated on a 7-point intensity scale (1 = lowest intensity, 7 = highest intensity) [41]. The evaluated attributes were: color (color intensity on the surface: from 1—extremely light to 7—extremely dark); surface appearance (number of cracks on the surface of the cookies: from 1—many to 7—none); pore appearance (size and arrangement of air cells at the cross section of the cookies: from 1—non-uniform to 7—small, uniform); hardness (the ease with which samples could be broken into two parts: from 1—extremely soft to 7—extremely hard); granularity (the proportion of small solids between the teeth during chewing: from 1—many to 7—none); and taste (from 1—bad, foreign to 7—fine, characteristic). The evaluation of cookies was done 24 h after baking in the sensory laboratory of the Faculty of Technology, University of Novi Sad, which is designed according to the standard ISO 8589 [42]. Cookie samples were placed on white plastic plates by the assessors, encoded with three-digit codes from a random number table. Each evaluator evaluated five samples per session.

3. Results and Discussion

3.1. Chemical Composition of Sugar Beet Pulp Extrudates (SBPEs)

Table 1 shows the chemical characteristics of SBPEs and wheat flour, which is often used for cookie production. As can be seen, wheat flour had significantly lower ash and dietary fiber content than the SBPEs. The mineral content and fiber content, both total and insoluble, went up with an increase in the proportion of sugar beet pulp in the extrudate, as well as with an increase in extrudate particle size. Sugar beet pulp is a good source of minerals, especially potassium, sodium, magnesium, calcium, iron, copper, and zinc [43].
The rise in these parameters with increasing particle size can be explained by the fact that, while the obtained corn–sugar beet pulp extrudates were ground, corn particles were crushed more than the sugar beet pulp (which is a fibrous material). Therefore, after the sifting of ground corn–sugar beet pulp extrudates, a larger proportion of corn grits was present in smaller extrudate fractions (with particles < 250 µm), while the larger fractions of extrudates (1000–2000 µm) had higher proportions of sugar beet pulp.
On the other hand, maize has higher fat content than sugar beet pulp. Thus, a higher fat content in smaller extrudate fractions (Table 1) is also an indication that these fractions contained a higher proportion of corn than the sugar beet pulp.

3.2. AWRC Values of Wheat Flour–Sugar Beet Pulp Extrudate (SBPEs) Mixtures

AWRC values are used to determine the quality of flour best for cookie production as AWRC values affect cookie hardness and diameter [44].
AWRC values of wheat flour and of wheat flour/SBPE mixtures used for the preparation of cookie samples recommended by the Box–Behnken experimental design are provided in Table 2. Sugar beet pulp extrudates contain a higher proportion of water-binding fibers than wheat flour (as can be seen in Table 1); therefore, the results expectedly showed that the wheat flour/SBPE mixtures had a greater ability to retain water than wheat flour.
The result showed that the AWRC values of the mixtures rose with the increase in the percentage of sugar beet pulp in the extrudate and with the increase in the percentage of wheat flour substitution with extrudate. The highest AWRC value was observed in the mixture in which 15% of wheat flour was substituted with the SBPEs (corn grit: sugar beet pulp ratio = 55:45). Likewise, it was noticed that the AWRC values increased in mixtures with a higher particle size of extrudates, which was in contrast to a number of studies where it was concluded that flours with smaller particles retain more water [44,45,46,47].
Such results can also be explained by differences in the chemical composition of different extrudate fractions, as shown in Table 1 (a higher amount of fiber and protein in the fractions with a higher particle size has the ability to bind more water).

3.3. Chemical Composition of Cookie Samples

The results of the chemical analysis of cookie samples recommeded by Box–Behnken experimental design are shown in Table 3. The regression equation coefficients (Equation (1)) are listed in Table 4. The addition of extruded sugar beet pulp significantly influenced the increase in the minerals and fiber proportion (total and insoluble) in the cookie samples.
Table 4 shows that the values of the coefficient β2 have a positive sign for the protein, fat, ash, and the total and insoluble fiber values. This means that with the increase of the sugar beet pulp percentage in the extrudate (factor B), there was an increase of these chemical components contained in the cookies. Only the moisture content decreased (coefficient β2 has a negative sign for this response). The inclusion of SBPEs with a larger particle size also led to a significant reduction of moisture in biscuit samples (negative sign of coeficients β1 and β11 in Table 4).
Sugar beet pulp contains a lower proportion of protein than wheat flour, thus the cookie samples with the addition of SBPEs had lower protein content than the control cookie sample. The addition of SBPEs in cookies had the biggest influence on the fiber content. The fiber content ranged from 4.25% to 7.82%, which is 2–4 times more than the fiber content in the control sample. All three factors had significant influence on the fiber content in cookies (Table 4). Fiber content in cookies rose with the increase in the amount of sugar beet pulp in the SBPEs (Factor B), with the increase in SBPE particle size (Factor A), and with the increase in the substitution of wheat flour with the SBPEs in the cookie samples (Factor C). These results were expected considering the results of the chemical analyses of the raw materials shown in Table 1.

3.4. Physical Characteristics of Cookies

3.4.1. Cookie Color

Surface color is a very important feature that significantly determines the product’s acceptability by the consumer. As can be seen in Table 5, the values of the color parameters of most cookie samples with the addition of sugar beet pulp extrudates (SBPEs) are very similar to the values for the control sample. Table 6 shows that the particle size (factor A) and the percentage of wheat flour replacement by SBPEs (factor C) had a statistically significant effect on cookie lightness (L* value). As the particle size of the SBPEs increased, the L* value increased (a positive sign of the coefficient β1 for L* in Table 6), i.e., the color of the cookie surface became lighter; however, with the increase in the proportion of extrudate in cookies (factor C), the L* value decreased (a negative sign of the coefficient β3 for L* in Table 6). The interaction of B and C factors also had a significant effect on the lightness of the cookies, as can be seen in Table 6, while the direction of this effect can be seen in Figure 2.
Although the addition of sugar beet pulp in bakery products can lead to a decrease in parameters a* and b*, as was the case with the addition of sugar beet pulp to cookies [48], pasta [49], and bread [50] (which had a slightly greyish color), the cookie samples with SBPEs had positive a* values and b* values similar to the control cookie sample (Table 5).
The values of the parameter a* were dependent on the particle size of the extrudate (factor A). The contribution of this factor for parameter a* was 53.48% (results not shown). As can be seen in Table 6, the coefficient β1 had a negative sign for parameter a*, which means that the red tone on the cookie surface decreased with an increased particle size of the added extrudate. The percentage of sugar beet pulp in the extrudate (factor B) and the percentage of wheat flour replacement by the extrudate (factor C) had no statistically significant effect on the values of parameter a* (p > 0.05).
The extrudate particle size (factor A) also had a statistically significant effect on the yellow tone of the cookie surface (parameter b*). The quadratic member of this influence (A2) had a significance ratio of 23.06% (results not shown). Additionally, a similar proportion of significance (contribution of 22.86%) to this parameter had the square term of factor C (C2), that is, the share of extrudates in the cookies. The directions of influence of these factors on parameter b* are shown in Figure 3a,b.

3.4.2. Cookie Dimensions and Hardness

The physical characteristics of cookie samples (hardness, weight, length, width, and thickness) are shown in Table 5. The regression coefficients are shown in Table 6. For weight and thickness, the model was not statistically significant, i.e., the factors with a significant influence on the weight and thickness values of the cookies could not be determined by the method of experiment.
It can be seen in Table 5 that the addition of the SBPEs had a significant effect on the increase in cookie hardness as compared to the control sample made only from wheat flour. Factor A, i.e., the particle size of the extrudate had the greatest influence on the hardness (Table 6). The contribution of this influence is 51% (result not shown). As the particle size increased, the hardness of the cookies decreased (the value of coefficient β1 has a negative sign for hardness). This is in accordance with Petrović et al. [39], who concluded that with the decrease of wheat germ particle size, the hardness of cookies increases due to more compact cells and a denser structure of cookie samples.
The interaction of factors A and B had a statistically significant effect on cookie hardness. This interaction is shown in Figure 4. Factor B has a greater influence on the cookie hardness when SBPEs with a smaller particle size are included in biscuit production (at lower values of factor A), and hardness rose with increasing sugar beet pulp content in the SBPEs from 15% to 45%. It was expected that factor B would have a greater influence on cookie hardness as sugar beet pulp contains a significant fiber proportion that absorbs water and can cause a more intense increase in cookie hardness. It is possible that during extrusion cooking, there was a modification that resulted in a smaller effect of factor B on cookie hardness. During extrusion, one part of the insoluble fibers pass into the soluble ones, as was reported in previous studies [50,51,52,53,54]. They explained that this effect could be the result of the breakage of covalent and non-covalent linkages between carbohydrates and proteins associated with the fiber, resulting in small molecular fragments, which would be more soluble.
There was an increase in cookie length and a decrease in cookie width as compared to the control cookie sample (Table 5). Factors A and C—that is, their interaction—had a statistically significant effect on the length and width of cookies (Table 6), causing a slight cookie shape deformation. The directions of these impacts are shown in Figure 5a,b, respectively. With smaller shares of SBPEs in cookies (5%), the length decreased with increased SBPE particle size, while at higher SBPE proportion in cookies (15%), length increased as SBPE particle size increased. Flours with lower AWRC (as was the case with mixtures with lower particles of SBPEs and a lower amount of SBPEs (Table 2)) cause lower thickness and higher spread ratio of cookies [44].
Moreover, with the addition of the SBPEs, an increase in the cookie thickness as compared to the control sample was noticeable (Table 5). Wheat flour had the lower AWRC value than the flour/SBPE mixtures, hence the control cookie had a lower thickness and a higher length compared to others cookie samples.

3.4.3. Sensory Analysis

The application of sugar beet dietary fibers changes the main characteristics of bakery product quality, the most important being color and aroma [55]. As can be seen in Table 7 and Table 8, the particle size of the SBPEs (factor A) had a significant effect on all examined sensory characteristics of cookies. The panelists’ ratings for the color of cookie samples decreased, i.e., cookies became lighter with the increase in particle size of the extrudate, which was in line with the values obtained by instrumental color measurement (Table 4). The values of the surface appearance and pore appearance at the cross-section decreased with the increase in the particle size of the SBPEs, while as the percentage of wheat flour replacement by the SBPEs increased (factor C) (negative coefficients β1 and β3 for these responses in Table 8), the number of cracks on the cookie surface increased and the pores on the surface were more uneven.
Cookie hardness increased significantly with the decrease in extrudate particle size (factor A) and with the increase in extrudate content (factor C) (Table 8), which are also consistent with the results of instrumental hardness measurement (Table 6).
All examined factors had a statistically significant effect on the graininess of the cookie samples (Table 8). However, the particle size of the extrudates had the greatest influence where the contribution of factor A was as high as 79.27% (result not shown). This effect was negative (as the particle size of the extrudates increased, the panelists scores for the graininess of the cookies decreased). The taste of the cookie samples depended on the percentage of wheat flour replacement by the SBPEs (factor C). The taste ratings decreased with the increase in the proportion of extrudate in the cookie (a negative sign of coefficient β3 for the taste scores in Table 8). In addition, a quadratic term of factor A (A2) had a significant effect on cookie taste (Table 8). Cookie samples with SBPE particles from 250 to 1000 µm had higher scores for taste than samples with SBPE particles smaller than 250 µm. However, a further increase in SBPE particle size from 1000 to 2000 µm led to a further decrease in cookie taste scores.
Sugar beet pulp is a material that has a very specific smell, taste, texture, and color. Extrusion cooking with corn grits can improve the color, texture, and taste of material and reduce the odor so that all cookie samples would be acceptable for consumption.

4. Conclusions

The addition of sugar beet pulp extrudates (SBPEs) significantly influenced the increase in the proportion of minerals and fibers (total and insoluble) in the cookies as compared to the control sample. In addition to the proportion of SBPEs in the cookies, the particle size of the extrudates (factor A) also had a statistically significant effect (p < 0.05) on all chemical parameters of the cookies. Moisture and fat content decreased, while mineral and dietary fiber content increased with the increase in extrudate particle size.
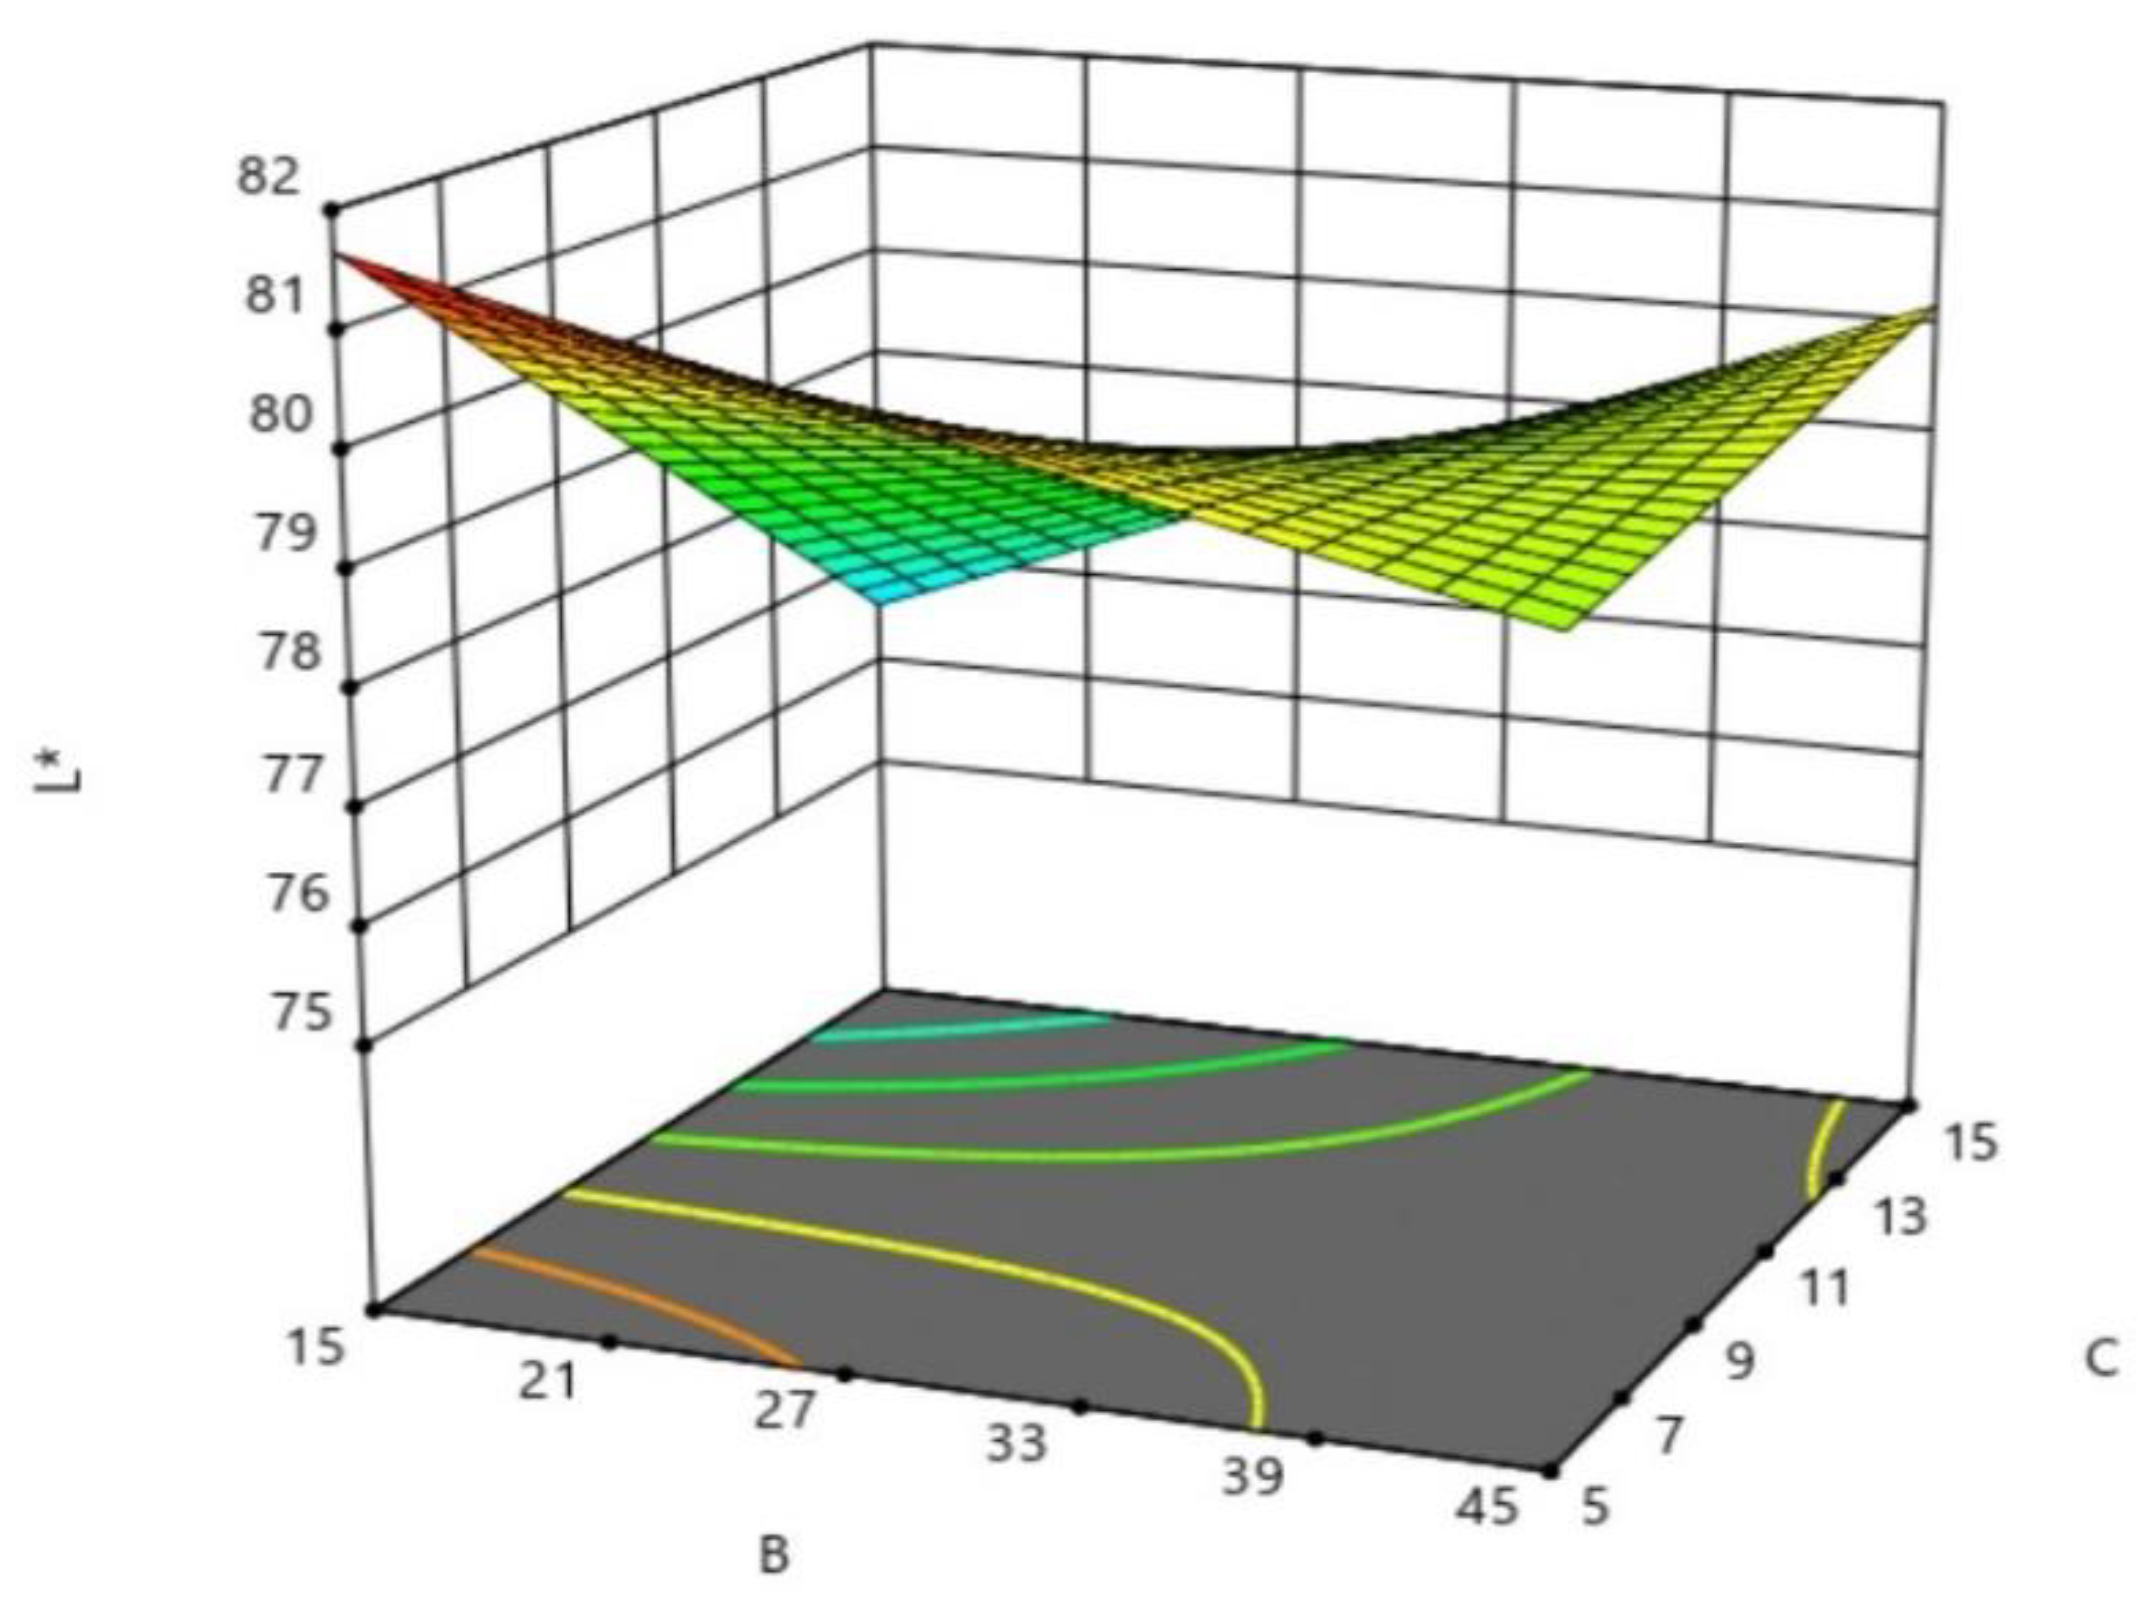
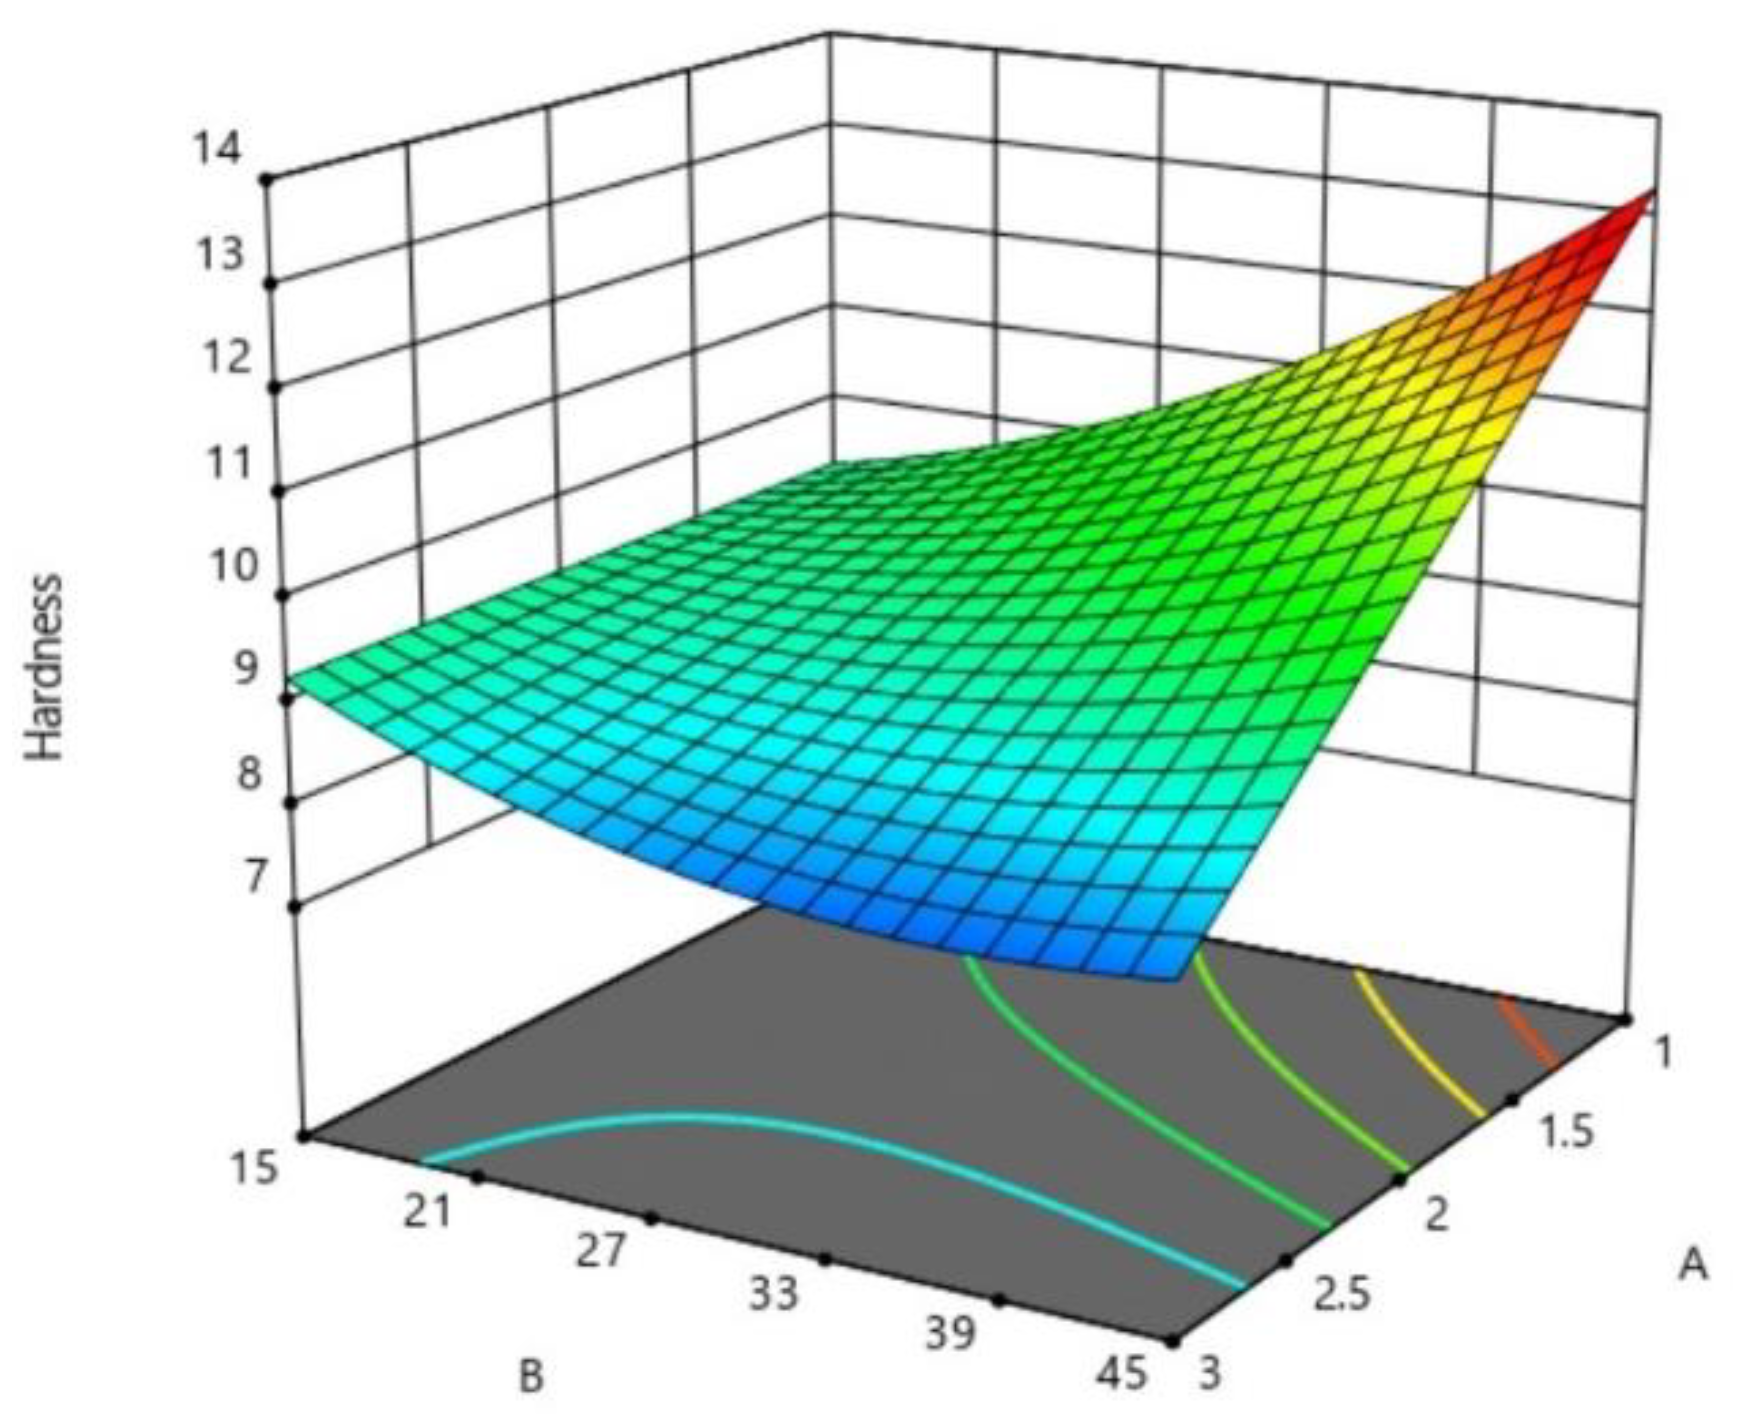
The percentage of wheat flour replaced by the extrudate and the extrudate particle size had a statistically significant effect on the cookie lightness (L* value). As the particle size of the extrudate increased, the color of cookie surface became darker. Extrudate particle size had the greatest influence on the hardness. With an increase in particle size, the hardness of cookie samples decreased. The addition of the extrudate led to an increase in graininess, poorer appearance of the cookie surface with more pronounced cracks and slight deformation of the shape. The substitution of wheat flour with sugar beet pulp extrudates (SBPEs) up to 15% did not adversely affect the sensory acceptability of the cookie samples, so that cookies with the best combination of nutritional and sensory characteristics can be obtained by substituting 15% of wheat flour with SBPEs with a particle size from 250 to 1000 µm (fraction 2).

Author Contributions

Conceptualization, J.P., I.L., and B.P.; methodology, A.J. and J.P.; formal analysis, J.P., I.L., and A.J.; software, D.R.; investigation, S.S., J.P., and I.L.; data curation, D.R. and S.N.; writing—original draft preparation, S.S. and J.P.; writing—review and editing, M.B., B.M., and A.F.; visualization, D.R. and S.N.; supervision, B.P. and A.F.; funding acquisition, M.B., A.J., and B.M. All authors have read and agreed to the published version of the manuscript.

Funding

This research was funded as part of the “Atrium of Knowledge” project, co-financed by the European Union through the European Regional Development Fund and the Operational Programme Competitiveness and Cohesion 2014–2020, Contract No: KK.01.1.1.02.0005, and as part of the “Modification of cheese ripening process and development of whey based products-SIRENA” project, co-financed by the European Union through the European Structural and Investment Funds in the financial period 2014–2020 and the Operational Programme Competitiveness and Cohesion, Contract No: KK.01.1.1.04.0096.

Institutional Review Board Statement

Not applicable.

Informed Consent Statement

Not applicable.

Data Availability Statement

The data presented in this study are available on request from the corresponding authors.

Acknowledgments

This research was supported by the program of the Ministry of Education, Science and Technological Development, Republic of Serbia (451-03-9/2021-14/200134). Authors also gratefully acknowledge to University College Aspira for technical and financial support.

Conflicts of Interest

The authors declare no conflict of interest.

References

  1. Ishangulyyev, R.; Kim, S.; Lee, S.H. Understanding Food Loss and Waste—Why Are We Losing and Wasting Food? Foods 2019, 8, 297. [Google Scholar] [CrossRef] [Green Version]
  2. FAO—Food and Agricultural Organization of the United Nation. Food Loss and Food Waste. Available online: http://www.fao.org/food-loss-and-food-waste/en/ (accessed on 24 July 2020).
  3. Sagar, N.A.; Pareek, S.; Sharma, S.; Yahia, E.M.; Lobo, M.G. Fruit and Vegetable Waste: Bioactive Compounds, Their Extraction, and Possible Utilization. Compr. Rev. Food Sci. Food Saf. 2018, 17, 512–531. [Google Scholar] [CrossRef] [PubMed] [Green Version]
  4. Jozinović, A.; Šubarić, D.; Ačkar, Đ.; Babić, J.; Orkić, V.; Guberac, S.; Miličević, B. Food Industry By-Products as Raw Materials in the Production of Value-Added Corn Snack Products. Foods 2021, 10, 946. [Google Scholar] [CrossRef]
  5. Kaderides, K.; Mourtzinos, I.; Goula, A.M. Stability of pomegranate peel polyphenols encapsulated in orange juice industry by-product and their incorporation in cookies. Food Chem. 2020, 310, 125849. [Google Scholar] [CrossRef] [PubMed]
  6. Bb, B.; Pm, K.; Sn, G.; Ud, C. Studies on utilization of orange peel powder in the preparation of cookies. Int. J. Chem. Stud. 2021, 9, 1600–1602. [Google Scholar] [CrossRef]
  7. Perez, C.; Tagliani, C.; Arcia, P.; Cozzano, S.; Curutchet, A. Blueberry by-product used as an ingredient in the development of functional cookies. Food Sci. Technol. Int. 2017, 24, 301–308. [Google Scholar] [CrossRef] [PubMed]
  8. Curutchet, A.; Cozzano, S.; Tárrega, A.; Arcia, P. Blueberry pomace as a source of antioxidant fibre in cookies: Consumer’s expectations and critical attributes for developing a new product. Food Sci. Technol. Int. 2019, 25, 642–648. [Google Scholar] [CrossRef]
  9. Sahni, P.; Shere, D.M. Physico-chemical and sensory characteristics of carrot pomace powder incorporated fibre rich cookies. Asian J. Dairy Food Res. 2017, 36, 327–331. [Google Scholar] [CrossRef] [Green Version]
  10. De Barros, H.E.A.; Natarelli, C.V.L.; Tavares, I.M.D.C.; De Oliveira, A.L.M.; Araújo, A.B.S.; Pereira, J.; Carvalho, E.E.N.; Boas, E.V.D.B.V.; Franco, M. Nutritional Clustering of Cookies Developed with Cocoa Shell, Soy, and Green Banana Flours Using Exploratory Methods. Food Bioprocess. Technol. 2020, 13, 1566–1578. [Google Scholar] [CrossRef]
  11. De Almeida, T.; Rostagno, M.A.; Da Silva, L.C. Production of functional cookies enriched with flour apple industries and apple peel (Malus domestica Borkh). Rev. Trab. Iniciaç. Cient. UNICAMP 2019, 26. [Google Scholar] [CrossRef]
  12. Theagarajan, R.; Narayanaswamy, L.M.; Dutta, S.; Moses, J.A.; Chinnaswamy, A. Valorisation of grape pomace (cv. Muscat) for development of functional cookies. Int. J. Food Sci. Technol. 2019, 54, 1299–1305. [Google Scholar] [CrossRef]
  13. Maman, R.; Yu, J. Chemical Composition and Particle Size of Grape Seed Flour and Their Effects on the Characteristics of Cookies. J. Food Res. 2019, 8, 111–121. [Google Scholar] [CrossRef] [Green Version]
  14. Nakov, G.; Brandolini, A.; Hidalgo, A.; Ivanova, N.; Stamatovska, V.; Dimov, I. Effect of grape pomace powder addition on chemical, nutritional and technological properties of cakes. LWT 2020, 134, 109950. [Google Scholar] [CrossRef]
  15. Šaponjac, V.T.; Ćetković, G.; Čanadanović-Brunet, J.; Pajin, B.; Djilas, S.; Petrović, J.; Lončarević, I.; Stajčić, S.; Vulić, J. Sour cherry pomace extract encapsulated in whey and soy proteins: Incorporation in cookies. Food Chem. 2016, 207, 27–33. [Google Scholar] [CrossRef] [PubMed]
  16. Rowayshed, G.; Sharaf, A.M.; El-Faham, S.Y.; Ashour, M.; Zaky, A.A. Utilization of potato peels extract as source of phytochemicals in biscuits. J. Basic Appl. Res. Int. 2015, 8, 190–201. [Google Scholar]
  17. Cedola, A.; Cardinali, A.; Del Nobile, M.A.; Conte, A. Enrichment of Bread with Olive Oil Industrial By-Product. J. Agric. Sci. Technol. B 2019, 9, 119–127. [Google Scholar] [CrossRef]
  18. Smith, I.N.; Yu, J. Nutritional and sensory quality of bread containing different quantities of grape pomace from different grape cultivars. EC Nutr. 2015, 2, 291–301. [Google Scholar]
  19. Fărcaș, A.C.; Socaci, S.A.; Tofană, M.; Mureşan, C.; Mudura, E.; Salanţă, L.; Scrob, S. Nutritional properties and volatile profile of brewer’s spent grain supplemented bread. Rom. Biotechnol. Lett. 2014, 19, 9705–9714. [Google Scholar]
  20. Waters, D.M.; Jacob, F.; Titze, J.; Arendt, E.K.; Zannini, E. Fibre, protein and mineral fortification of wheat bread through milled and fermented brewer’s spent grain enrichment. Eur. Food Res. Technol. 2012, 235, 767–778. [Google Scholar] [CrossRef]
  21. Ramírez-Maganda, J.; Blancas-Benítez, F.J.; Zamora-Gasga, V.M.; García-Magaña, M.D.L.; Bello-Pérez, L.A.; Tovar, J.; Sáyago-Ayerdi, S.G. Nutritional properties and phenolic content of a bakery product substituted with a mango (Mangifera indica) ‘Ataulfo’ processing by-product. Food Res. Int. 2015, 73, 117–123. [Google Scholar] [CrossRef]
  22. Wirkijowska, A.; Zarzycki, P.; Sobota, A.; Nawrocka, A.; Blicharz-Kania, A.; Andrejko, D. The possibility of using by-products from the flaxseed industry for functional bread production. LWT 2020, 118, 108860. [Google Scholar] [CrossRef]
  23. Torbica, A.; Škrobot, D.; Hajnal, E.J.; Belović, M.; Zhang, N. Sensory and physico-chemical properties of wholegrain wheat bread prepared with selected food by-products. LWT 2019, 114, 108414. [Google Scholar] [CrossRef]
  24. Riaz, M.N. Extruders in Food Applications; CRC Press: Boca Raton, FL, USA, 2000; p. 19. [Google Scholar]
  25. Fellows, P.J. Food Processing Technology: Principles and Practice, 3rd ed.; CRC Press and Woodhead Publication Ltd.: Cambridge, UK, 2009; p. 184. [Google Scholar]
  26. Cho, S.S.; Samuel, P. Fiber Ingredients: Food Applications and Health Benefits; CRC Press: Boca Raton, FL, USA, 2009; p. 383. [Google Scholar]
  27. Southgate, D.A.T.; Waldron, K.; Johnson, I.T.; Fenwick, G.R. Dietary Fibre: Chemical and Biological Aspects; Elsevier: Amsterdam, The Netherlands, 1990; p. 80. [Google Scholar]
  28. Cho, S.S. Handbook of Dietary Fiber; CRC Press: Boca Raton, FL, USA, 2001; p. 1995. [Google Scholar]
  29. Michel, F.; Thibault, J.-F.; Barry, J.-L.; De Baynast, R. Preparation and characterisation of dietary fibre from sugar beet pulp. J. Sci. Food Agric. 1988, 42, 77–85. [Google Scholar] [CrossRef]
  30. Leontowicz, M.; Gorinstein, S.; Bartnikowska, E.; Leontowicz, H.; Kulasek, G.; Trakhtenberg, S. Sugar beet pulp and apple pomace dietary fibers improve lipid metabolism in rats fed cholesterol. Food Chem. 2001, 72, 73–78. [Google Scholar] [CrossRef]
  31. Al-Tamimi, M.; Palframan, R.; Cooper, J.; Gibson, G.; Rastall, R. In vitro fermentation of sugar beet arabinan and arabino-oligosaccharides by the human gut microflora. J. Appl. Microbiol. 2005, 100, 407–414. [Google Scholar] [CrossRef] [PubMed]
  32. Dhingra, D.; Michael, M.; Rajput, H.; Patil, R.T. Dietary fibre in foods: A review. J. Food Sci. Technol. 2011, 49, 255–266. [Google Scholar] [CrossRef] [Green Version]
  33. Ralet, M.C.; Thibault, J.F.; Della Valle, G. Solubilization of sugar-beet pulp cell wall polysaccharides by extrusion-cooking. LWT Food Sci. Technol. 1991, 24, 107–112. [Google Scholar]
  34. Manley, D. Biscuit, Cookie and Cracker Manufacturing Manuals: Manual 1: Ingredients; Woodhead Publishing: Cambridge, UK, 1998; Volume 1, p. 36. [Google Scholar]
  35. Ačkar, Đ.; Jozinović, A.; Babić, J.; Miličević, B.; Balentić, J.P.; Šubarić, D. Resolving the problem of poor expansion in corn extrudates enriched with food industry by-products. Innov. Food Sci. Emerg. Technol. 2018, 47, 517–524. [Google Scholar] [CrossRef]
  36. AOAC (Association of Official Analytical Chemists). International, Official Methods of Analysis of the Association of Official Analytical Chemists International, 17th ed.; Association of Official Analytical Communities: Gaithersburg, MD, USA, 2000. [Google Scholar]
  37. American Association of Cereal Chemists (AACC). Approved Methods of Analysis, 10th ed.; Methods (AACC Method 56-10); AACC: St. Paul, MN, USA, 2000. [Google Scholar]
  38. Anderson, M.J.; Whitcomb, P.J. DOE Simplified: Practical Tools for Effective Experimentation, 3rd ed.; CRC Press: Boca Raton, FL, USA, 2017. [Google Scholar]
  39. Petrović, J.; Rakić, D.; Fišteš, A.; Pajin, B.; Lončarević, I.; Tomović, V.; Zarić, D. Defatted wheat germ application: Influence on cookies’ properties with regard to its particle size and dough moisture content. Food Sci. Technol. Int. 2017, 23, 597–607. [Google Scholar] [CrossRef] [PubMed]
  40. CIE—International Commission on Illumination. Colorimetry: Official Recommendation of the International Commission on Illumination, Publication CIE No. (E- -1.31); Bureau Central de la CIE: Paris, France, 1976. [Google Scholar]
  41. International Organization for Standardization, ISO 4121. Sensory Analysis—Methodology—Evaluation of Food Product by Methods of Using Scales; ISO: Geneva, Switzerland, 2002. [Google Scholar]
  42. International Organization for Standardization, ISO 8589. Sensory Analysis-General Guidance for the Design of Test Rooms; ISO: Geneva, Switzerland, 2007. [Google Scholar]
  43. Škrbić, B.; Ðurišić-Mladenović, N.; Mačvanin, N. Determination of Metal Contents in Sugar Beet (Beta vulgaris) and Its Products: Empirical and Chemometrical Approach. Food Sci. Technol. Res. 2010, 16, 123–134. [Google Scholar] [CrossRef]
  44. Barak, S.; Mudgil, D.; Khatkar, B.S. Effect of flour particle size and damaged starch on the quality of cookies. J. Food Sci. Technol. 2014, 51, 1342–1348. [Google Scholar] [CrossRef] [Green Version]
  45. Drakos, A.; Kyriakakis, G.; Evageliou, V.; Protonotariou, S.; Mandala, I.; Ritzoulis, C. Influence of jet milling and particle size on the composition, physicochemical and mechanical properties of barley and rye flours. Food Chem. 2017, 215, 326–332. [Google Scholar] [CrossRef] [PubMed]
  46. Holas, J.; Tipples, K.H. Factors affecting farinograph and baking absorption. I. Quality characteristics of flour streams. Cereal Chem. 1978, 55, 637–652. [Google Scholar]
  47. Raghavendra, S.; Swamy, S.R.; Rastogi, N.; Raghavarao, K.; Kumar, S.; Tharanathan, R. Grinding characteristics and hydration properties of coconut residue: A source of dietary fiber. J. Food Eng. 2006, 72, 281–286. [Google Scholar] [CrossRef]
  48. Köksel, H.; Özboy, Ö. Effects of sugarbeet fiber on cookie quality. ZuckerIndustrie 1999, 124, 542–544. [Google Scholar]
  49. Minarovičová, L.; Lauková, M.; Kohajdová, Z.; Karovičová, J.; Dobrovická, D.; Kuchtová, V.; Lucia, M.; Michaela, L.; Zlatica, K.; Jolana, K.; et al. Qualitative properties of pasta enriched with celery root and sugar beet by-products. Czech J. Food Sci. 2018, 36, 66–72. [Google Scholar] [CrossRef] [Green Version]
  50. Djordjević, M.; Šoronja-Simović, D.; Nikolić, I.; Djordjević, M.; Šereš, Z.; Milašinović-Šeremešić, M. Sugar beet and apple fibres coupled with hydroxypropylmethylcellulose as functional ingredients in gluten-free formulations: Rheological, technological and sensory aspects. Food Chem. 2019, 295, 189–197. [Google Scholar] [CrossRef]
  51. Larrea, M.; Chang, Y.; Bustos, F.M. Effect of some operational extrusion parameters on the constituents of orange pulp. Food Chem. 2005, 89, 301–308. [Google Scholar] [CrossRef]
  52. Bjorck, I.; Nyman, M.; Asp, N.G. Extrusion cooking and dietary fiber: Effects on dietary fiber content and on degradation in the rat intestinal tract. Cereal Chem. 1984, 61, 174–179. [Google Scholar]
  53. Ralet, M.-C.; Della Valle, G.; Thibault, J.-F. Raw and extruded fibre from pea hulls. Part I: Composition and physico-chemical properties. Carbohydr. Polym. 1993, 20, 17–23. [Google Scholar] [CrossRef]
  54. Wang, W.M.; Klopfenstein, C.F.; Ponte, J.G. Effects of twin-screw extrusion on the physical properties of dietary fiber and other components of whole wheat and wheat bran and on the baking quality of the wheat bran. Cereal Chem. 1993, 70, 707–711. [Google Scholar]
  55. Šereš, Z.; Gyura, J.; Filipovic, N.; Simovic, D. Šoronja Application of decolorization on sugar beet pulp in bread production. Eur. Food Res. Technol. 2005, 221, 54–60. [Google Scholar] [CrossRef]
Figure 1. SBPE samples–corn extrudates with the addition of sugar beet pulp in the amount of 15, 30, and 45%, ground and sieved to produce three fractions: fraction 1—particles <250 μm; fraction 2—particles from 250 to 1000 μm; fraction 3—particles from 1000 to 2000 μm.
Sustainability 13 05317 g001
Figure 2. The influence of the interaction of factor B (percentage of sugar beet pulp in the extrudate) and factor C (percentage of wheat flour substituted with extrudate) on cookie lightness (L* value).
Sustainability 13 05317 g002
Figure 3. Directions of influence of factors on cookie samples’ yellowness (b* value): (a) factor A (the size of the extrudate particles; (b) factor C (percentage of wheat flour substituted with extrudate).
Sustainability 13 05317 g003
Figure 4. The influence of the interaction of factor A (the size of the extrudate particles) and factor B (percentage of sugar beet pulp in the extrudate) on cookie hardness.
Sustainability 13 05317 g004
Figure 5. The influence of the interaction of factor A (the size of the extrudate particles) and factor C (percentage of wheat flour substituted with extrudate) on the cookies: (a) length; (b) width.
Sustainability 13 05317 g005
Table 1. Chemical characteristics of the wheat flour and sugar beet pulp extrudates (SBPEs).
SamplePercentage of SBP in the Extrudate (%)The size of the Extrudate Particles (µm)Moisture (%)Fat (%)Protein (%)Ash (%)Total Fiber (%)Insoluble Fiber (%)
R-1-1515<2508.81 ± 0.31 b0.58 ± 0.03 c7.56 ± 0.12 c0.97 ± 0.03 a12.56 ± 0.39 b8.82 ± 0.29 b
R-2-1515250–10008.94 ± 0.29 b0.31 ± 0.07 b8.50 ± 0.15 a,e1.04 ± 0.04 a14.20 ± 0.09 c10.74 ± 0.27 c
R-3-15151000–20008.85 ± 0.16 b0.19 ± 0.05 a7.95 ± 0.14 d1.17 ± 0.02 d16.55 ± 0.34 d12.90 ± 0.08 d
R-1-3030<2509.52 ± 0.07 a0.62 ± 0.04 c7.29 ± 0.08 b1.71 ± 0.08 b18.88 ± 0.43 e12.18 ± 0.08 e
R-2-3030250–10009.72 ± 0.08 a0.31 ± 0.04 b8.28 ± 0.07 a1.72 ± 0.07 b21.21 ± 0.32 f14.61 ± 0.16 f
R-3-30301000–20009.61 ± 0.11 a0.23 ± 0.04 a7.88 ± 0.13 d1.99 ± 0.04 h24.32 ± 0.57 g18.62 ± 0.09 g
R-1-4545<2509.52 ± 0.07 a0.71 ± 0.03 e7.48 ± 0.06 b,c1.38 ± 0.08 e30.75 ± 0.23 h20.61 ± 0.22 h
R-2-4545250–10008.18 ± 0.29 c0.42 ± 0.02 d8.68 ± 0.09 e1.51 ± 0.03 f35.31 ± 0.44 i26.80 ± 0.19 i
R-3-45451000–20009.53 ± 0.16 a0.25 ± 0.04 a,b8.44 ± 0.10 a1.85 ± 0.06 g39.68 ± 0.11 j28.39 ± 0.13 j
Wheat flour 10.83 ± 0.21 d0.95 ± 0.03 f10.04 ± 0.17 f0.54 ± 0.03 c3.57 ± 0.08 a1.89 ± 0.10 a
SBP—sugar beet pulp; means ± SD with different superscript letters (a–j) in the same column differ significantly (p < 0.05).
Table 2. AWRC values for wheat flour and for wheat flour/sugar beet pulp extrudates (SBPEs) mixtures.
Wheat Flour-SBPEs MixtureSBPEs Fraction
(Particle Size)
Corn Grit:Sugar Beet Pulp Ratio in the SBPEs (%)Percentage of Wheat Flour Substituted with SBPEs (%)AWRC Value (%)
2.45.152 (250–1000 µm)55:451590.51 ± 0.31 i
3.45.103 (1000–2000 µm)55:451085.76 ± 0.44 h
1.30.151 (<250 µm)70:301581.30 ± 0.34 f
1.30.51 (<250 µm)70:30574.13 ± 0.21 b
2.15.52 (250–1000 µm)85:15573.89 ± 0.42 b
2.30.102 (250–1000 µm)70:301079.00 ± 0.21 d
2.45.52 (250–1000 µm)55:45575.65 ± 0.19 c
2.15.152 (250–1000 µm)85:1515−79.81 ± 0.32 e
3.30.53 (1000–2000 µm)70:30573.96 ± 0.65 b
3.30.153 (1000–2000 µm)70:301591.51 ± 0.52 j
1.45.101 (<250 µm)55:451081.46 ± 0.50 f
1.15.101 (<250 µm)85:151081.11 ± 0.27 f
3.15.103 (1000–2000 µm)85:151083.96 ± 0.17 g
Wheat flour//071.57 ± 0.20 a
Means ± SD with different superscript letters (a–j) in the same column differ significantly (p < 0.05).
Table 3. The 15-factor combinations (15 cookie samples) recommended by Box–Behnken experimental design and chemical characteristics of cookie samples.
SampleFactor CombinationsResponses (Chemical Characteristics (%))
A *B **C ***MoistureProteinFatAshTotal FiberInsoluble Fiber
1115103.726.6013.800.544.402.31
2315103.466.7313.660.634.612.71
3145103.946.9013.910.575.962.99
4345102.517.0213.690.596.054.01
513052.966.7914.000.604.692.05
633052.657.0313.760.674.762.30
7130154.016.5213.760.695.493.39
8330153.756.6513.280.726.153.82
921553.666.6013.740.584.251.64
1024552.867.0013.830.615.143.92
11215154.336.7513.390.614.953.06
12245153.597.1513.750.707.124.40
13230104.366.8013.680.655.183.34
14230104.056.7513.600.605.163.95
15230104.026.8213.710.625.204.00
Control///5.027.5013.98 0.452.021.19
* Factor A—extrudate particle size: fraction 1 (particles < 250 µm); fraction 2 (particles 250–1000 µm); fraction 3 (particles 1000–2000 µm); ** Factor B—percentage of sugar beet pulp in the in the extrudate (15, 30, and 45%); *** Factor C—percentage of wheat flour substituted with the extrudate (5, 10, and 15%).
Table 4. Regression coefficients for the chemical characteristics of cookie samples enriched with sugar beet pulp extrudates (SBPEs).
MoistureProteinFatAshTotal FiberInsoluble Fiber
β04.146.813.670.62465.013.96
β1 (A)−0.2825 *0.0775−0.135 *0.0263 *0.31 *0.175
β2 (B)−0.2838 *0.1737 *0.0737 *0.01380.5825 *0.5875 *
β3 (C)0.4438 *−0.0437−0.1438 *0.0325 *0.7175 *0.67 *
β12 (AB)−0.2925 * −0.01750.33750.48 *
β13 (AC) −0.06
β23 (BC) 0.06750.015 −0.385
β11 (A2)−0.5017 *−0.05330.0611 −0.7242 *
β22 (B2)−0.23420.0742 −0.0431 *0.3338−0.2092
β33 (C2)−0.2992 * 0.0444 *−0.3112−0.3492 *
R20.92180.72830.87830.89510.90630.9749
Lack of Fit0.40170.07030.310.63030.03250.1436
* p < 0.05.
Table 5. Physical characteristics of cookies enriched with sugar beet pulp extrudates (SBPEs).
Sample Responses
L*a*b*Hardness (N)Weight (g)Length (cm)Width (cm)Thickness (cm)
179.042.2024.43208.3011.436.205.900.62
279.570.0819.86205.1610.506.225.890.65
377.900.8119.29249.8811.446.225.970.62
480.200.1920.10144.1610.486.246.100.65
580.660.5420.75197.7010.636.215.700.69
681.620.2421.56162.4011.946.076.010.63
775.271.5322.18219.8611.026.095.900.64
880.200.2121.34155.1410.376.255.820.65
980.941.0023.24154.7410.236.225.900.68
1079.660.3120.62206.9211.046.175.870.66
1177.090.3818.87159.4610.766.195.890.62
1281.650.4320.93234.1810.066.115.930.62
1379.830.1318.18185.1410.446.215.940.59
1478.960.0618.52182.0210.356.156.020.60
1579.290.0117.74183.5810.306.205.950.62
Control79.270.0922.31135.8611.596.256.050.60
* Factor combinations of samples 1–15 recommended by the Box–Behnken experimental design are shown in Table 3.
Table 6. Regression coefficients for the physical characteristics of cookies enriched with sugar beet pulp extrudates (SBPEs).
L*a*b*Hardness (N)Weight (g)Length (cm)Width (cm)Thickness (cm)
β079.460.151918.159.37 6.195.98
β1 (A)1.09 *−0.5442 *−0.4742−1.33 * 0.00750.0437 *
β2 (B)0.3472−0.2396−0.68130.685 −0.01130.0362
β3 (C)−1.09 *0.0579−0.35620.2988 −0.00370.0075
β12 (AB)0.44170.37421.35−1.31 * 0.035
β13 (AC)0.99 −0.375 0.075 *−0.0975 *
β23 (BC)1.46 * 1.17
β11 (A2) 0.4174 *1.66 * −0.0238
β22 (B2) 0.31491.120.5943 0.0248
β33 (C2) 1.65 * −0.0402 *−0.0913 *
R20.81940.82280.82760.7672 0.78540.8565
* p < 0.05.
Table 7. Sensory characteristics of cookies enriched with sugar beet pulp extrudates (SBPEs).
SampleFactor CombinationsResponses
A *B **C ***ColorSurface AppearancePore AppearanceHardnessGranularityTaste
1115104.585.695.745.456.395.78
2315104.742.504.955.383.056.02
3145104.795.126.055.926.206.24
4345104.051.604.554.952.155.82
513055.556.206.125.556.556.25
633054.123.805.145.104.026.13
7130155.955.305.806.156.406.07
8330154.152.034.974.982.905.84
921554.55.726.355.066.156.59
1024555.026.006.205.265.556.45
11215155.623.005.215.045.366.12
12245154.873.205.545.855.186.00
13230105.364.105.765.185.596.33
14230104.723.856.005.205.836.48
15230104.684.686.135.296.106.22
Control//05.556.696.355.046.806.51
* Factor A—extrudate particle size: fraction 1 (particles < 250 µm); fraction 2 (particles 250–1000 µm); fraction 3 (particles 1000–2000 µm); ** Factor B—percentage of sugar beet pulp in the in the extrudate (15, 30 and 45%); *** Factor C—percentage of wheat flour substituted with the extrudate (5, 10 and 15%).
Table 8. Regression coefficients for sensory characteristics of cookies enriched with sugar beet pulp extrudates (SBPEs).
ColorSurface AppearancePore AppearanceHardnessGranularityTaste
β04.854.215.985.275.916.36
β1 (A)−0.4763 *−1.55 *−0.5125 *−0.3325 *−1.68 *−0.0663
β2 (B)−0.0888−0.12380.01120.1312−0.2338 *0
β3 (C)0.175−1.02 *−0.2863 *0.1313 *−0.3037 *−0.1737 *
β12 (AB) −0.1775−0.225−0.1775−0.165 *
β13 (AC) −0.2175 −0.18−0.2425
β23 (BC)−0.3175 0.120.1525
β11 (A2) −0.315−0.481 *0.1664−1 *−0.3 *
β22 (B2) −0.1675−0.1635 −0.4092 *−0.0825
β33 (C2) 0.4375
R20.5610.93520.92120.90410.98350.8773
* p < 0.05.
Publisher’s Note: MDPI stays neutral with regard to jurisdictional claims in published maps and institutional affiliations.

