Article

Chemical and Microbiological Air Quality in a Municipal Solid Waste Landfill and Its Surroundings, in South-Eastern Romania

1
Faculty of Veterinary Medicine, Banat’s University of Agricultural Sciences and Veterinary Medicine “King Michael I of Romania”, Calea Aradului 119, 300645 Timisoara, Romania
2
Vidra Landfill, 077186 Ilfov County, Romania
3
Ophtalmology Department, “Victor Babeș” University of Medicine and Pharmacy, Piața Eftimie Murgu 2, 300041 Timisoara, Romania
*
Author to whom correspondence should be addressed.
Sustainability 2022, 14(1), 156; https://0-doi-org.brum.beds.ac.uk/10.3390/su14010156
Submission received: 19 November 2021 / Revised: 21 December 2021 / Accepted: 21 December 2021 / Published: 24 December 2021
(This article belongs to the Topic Solid Waste Management)

Abstract

:
The aim of this study was to assess the microbiological and chemical air quality in a municipal solid waste landfill and its inhabited surroundings, in a particular context in which Romania struggles with the incapacity to comply with its environmental commitments. The research was conducted on a landfill near the capital Bucharest between November 2018 and September 2019. To evaluate the chemical (oxygen, carbon dioxide, methane, hydrogen sulfide, ammonia and carbon monoxide–MX6 iBrid™ Détector multigas) and microbiological (airborne bacteria and fungi–aspiration method) parameters, eight sampling points were established, located both on the perimeter of the landfill and within its surroundings. CO and CH4 were not detected in any of the sampling points, during the study period; O2 was in normal values 20.09–21.05%; CO2 had a maximum average concentration of 620 ± 215; H2S had values between 0.1 and 5.0 ppm only in the sampling points inside the landfill; NH3 was present only once in a single sampling point with values between 1.0 and 3.0 ppm. The microbiological results provide an overview of the total plate count and total fungal count, with no significant differences between the level of contamination inside the landfill and within its surroundings (p > 0.05). Ten bacterial species and fungi from six genera have been identified. It was also found that the number of microorganisms in the air was significantly lower during the winter, spring and early summer months compared with the late summer and autumn months (p < 0.05).

1. Introduction

Rapid population growth and urbanization, having direct consequences on the way of life, have accentuated food industrialization and led to an exponential increase in the quantity and diversity of household waste [1].
A few centuries ago, waste was stored directly uncontrolled on the ground or in running water, but was assimilated and neutralized by nature. Currently, municipal solid waste (MSW) is a major problem for human settlements, forcing managers to adopt controlled waste storage solutions [2,3]. Among the various waste treatment and disposal methods, landfilling is the leading method in most countries, especially in low-income and upper-middle-income countries. On a global level, about 70% of all generated MSW is disposed in some sort of landfill (sanitary and unsanitary landfills, open dumps) [4]. Municipal solid waste landfills are permanent storage spaces placed in locations unusable for other economic and social purposes, outside the localities and built and equipped to prevent environmental pollution [5]. Landfill sites, even if well protected, beside their basic positive role of contribution to the environment, are likely to negatively impact the public health, since they form a source of diverse air contaminants, such as chemical substances (e.g., gas contaminations), odours or microorganisms as bioaerosols [6]. Thus, landfills, especially those that do not implement adequate self-control programs are responsible for releasing chemical and microbiological contaminants not only to the atmosphere but also to surface water and groundwater [7]. In addition to being a source of dust and unpleasant odors, household waste dumps influence the management of neighboring lands, affect the topographic profile of the area and may cause physical and emotional discomfort for the population of neighboring localities [8,9].
One of the biggest concerns when it comes to landfills is represented by the short- and long-term gaseous emissions [10]. Raw landfill gas (LFG) is generated from the biodegradation of disposed organic matter inside the landfill and normally consists of 50–60% methane, 40–50% carbon dioxide and hundreds of different compounds in trace amounts referred to as” trace gases” (~1% in the total volume, originating either from disposed waste products and hazardous waste and/or from waste degradation processes occurring in the landfill body) [11].
Although trace gas emissions represent only a very small portion of the overall emission from landfills, they continue to be a concern, due to the adverse effects on the environment and human health [10]. Compounds, such as benzene and vinyl chloride, are carcinogenic to humans and it is also widely recognized that sulfur compounds, together with some oxygenated compounds and hydrocarbons, are responsible for the offensive odors emanating from landfills. Moreover, emissions of chlorofluorocarbons and halocarbons contribute to ozone depletion and global warming and some alkanes and aromatics combine with nitrogen oxides in the atmosphere to form secondary air pollutants [10,12].
Along with the wastewater treatment plants, composting plants and animal farms, the municipal solid waste landfills are a considerable source of bioaerosols that may negatively impact air quality and can create health issues for employees and the nearby residents [6]. Bioaerosols are airborne biological particles consisting of cells, pollen, fungi, parasite eggs, bacteria or viruses [13].
Most landfill sites provide favorable conditions such as nutrients and moisture for degradation of waste and proliferation of microbes, some of which are pathogenic [14]. The primary source of bioaerosols in the landfill site is the deposited organic waste. Some elements of municipal solid waste disposed of in landfills may comprise enteric pathogenic microorganisms. Waste discarded from residential units contains decomposed raw and cooked food waste, packaging materials, fecal matter of pets, soiled diapers and facial tissues which house a large quantity of microbes [15,16]. Similarly, commercial units like restaurants, hotels, hypermarket chains, but also slaughterhouses and food processing units discard a large amount of putrescible food waste that may harbor also pathogenic bacteria [14,17,18,19]. These microbes along with dust particles are aerosolized during various waste management activities comprising transporting the waste to landfill sites, unloading the waste from the vehicles, spreading and levelling, sorting, compacting and covering the waste with soil [20]. Therefore, people who reside adjacent to landfill sites may be exposed to bioaerosols and even develop bioaerosol-related diseases [21,22].
According to the 2019 European Commission (EC) Country Report regarding the implementation of European Union (EU) environmental law and policy in the member states, waste management remains a key challenge for Romania, despite formal progress thanks to the adoption of the national waste management plan in December 2017. The country’s performance continues to be characterized by very low recycling of municipal waste (14%) and very high landfilling rates. This is contrary to the waste hierarchy and comes in spite of the recycling targets set at EU level. The landfill rate reported by Romania to the EC in 2017 was 70% [23]. Moreover, Romania had 101 non-compliant landfills which should have been closed as of 2019, but by 2021, it only managed to rehabilitate 86 of them and the calendar for closing the 15 illegal landfills which are still operating is uncertain, as works to do so have not even began for most of them. So, in 2021, the EC has issued new infringement procedures against Romania for not complying with its environmental commitments in waste, natural habitats and water and air quality issues [24].
In this particular context of not complying with the environmental commitments in waste, landfills and air quality, it is of great importance for our country to permanently provide up to date information regarding the air quality in vicinities or inhabited areas close to the municipal solid waste landfills, to constantly ascertain biological and physical health risks, to inform stakeholders, policymakers and the general population. The aim of the study was to assess the microbiological and chemical air quality in a municipal solid waste landfill and its inhabited surroundings in South-Eastern Romania, in order to improve knowledge on this particular country issue and to identify potential public health implications.

2. Materials and Methods

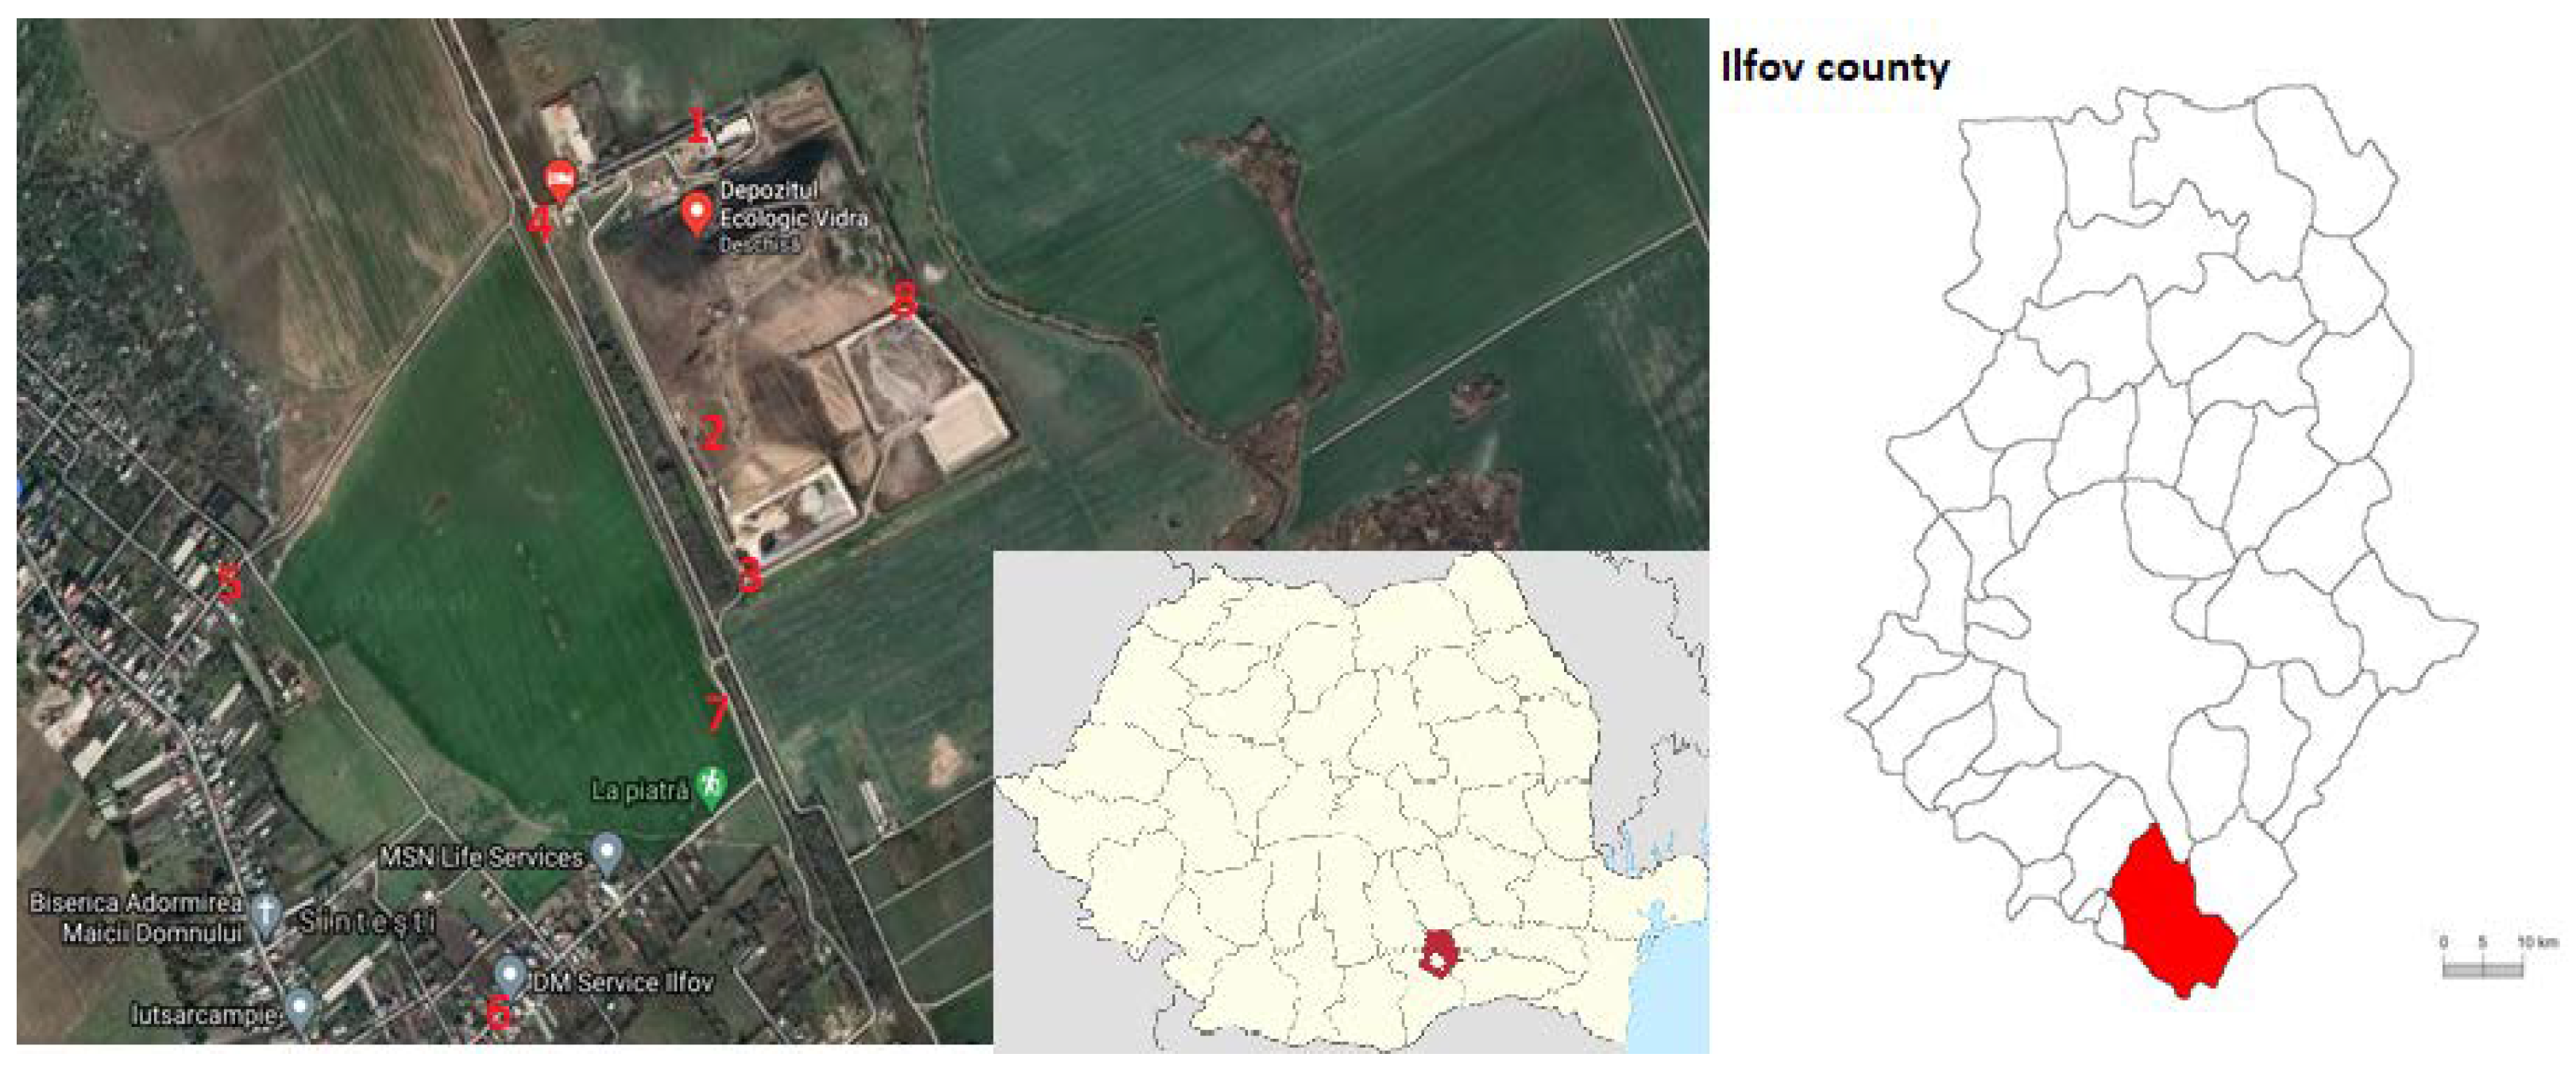
2.1. Description of the Study Location

The research was conducted in a municipal solid waste landfill located near Bucharest (Ilfov County, Romania), which lies in the S-SE part of Romania (Figure 1). Ilfov is the county that surrounds Bucharest, the capital of Romania. Many of the county’s villages and communes developed into high-income commuter towns, which act like suburbs or satellites of Bucharest. It has a population of 472,343 and an annual growth of about 4% [25].
The Vidra Landfill is located in a rural area, about 12 km south-west of Bucharest. The vicinities of the landfill are represented either by agricultural lands or by lands without agricultural destination (unproductive, degraded lands) and the nearest inhabited area is located at approximately 600 m from the landfill.
The landfill is included in class B-landfill of non-hazardous household waste. The total storage capacity is 11,500,000 m3, with a daily average waste stream of approximately 2400 t and, consequently, an average annual quantity of 480,000 t. The landfilling activity started in July 2021. The landfill covers an area of 42 ha, which includes a storage area of approximately 38.6 ha divided into 8 compartments and a service area of approximately 3 ha. The storage cells have an average horizontal usable area of 4.2 ha, each one delimited by perimeter dams.
The prevailing winds in the region blow NE to SW.

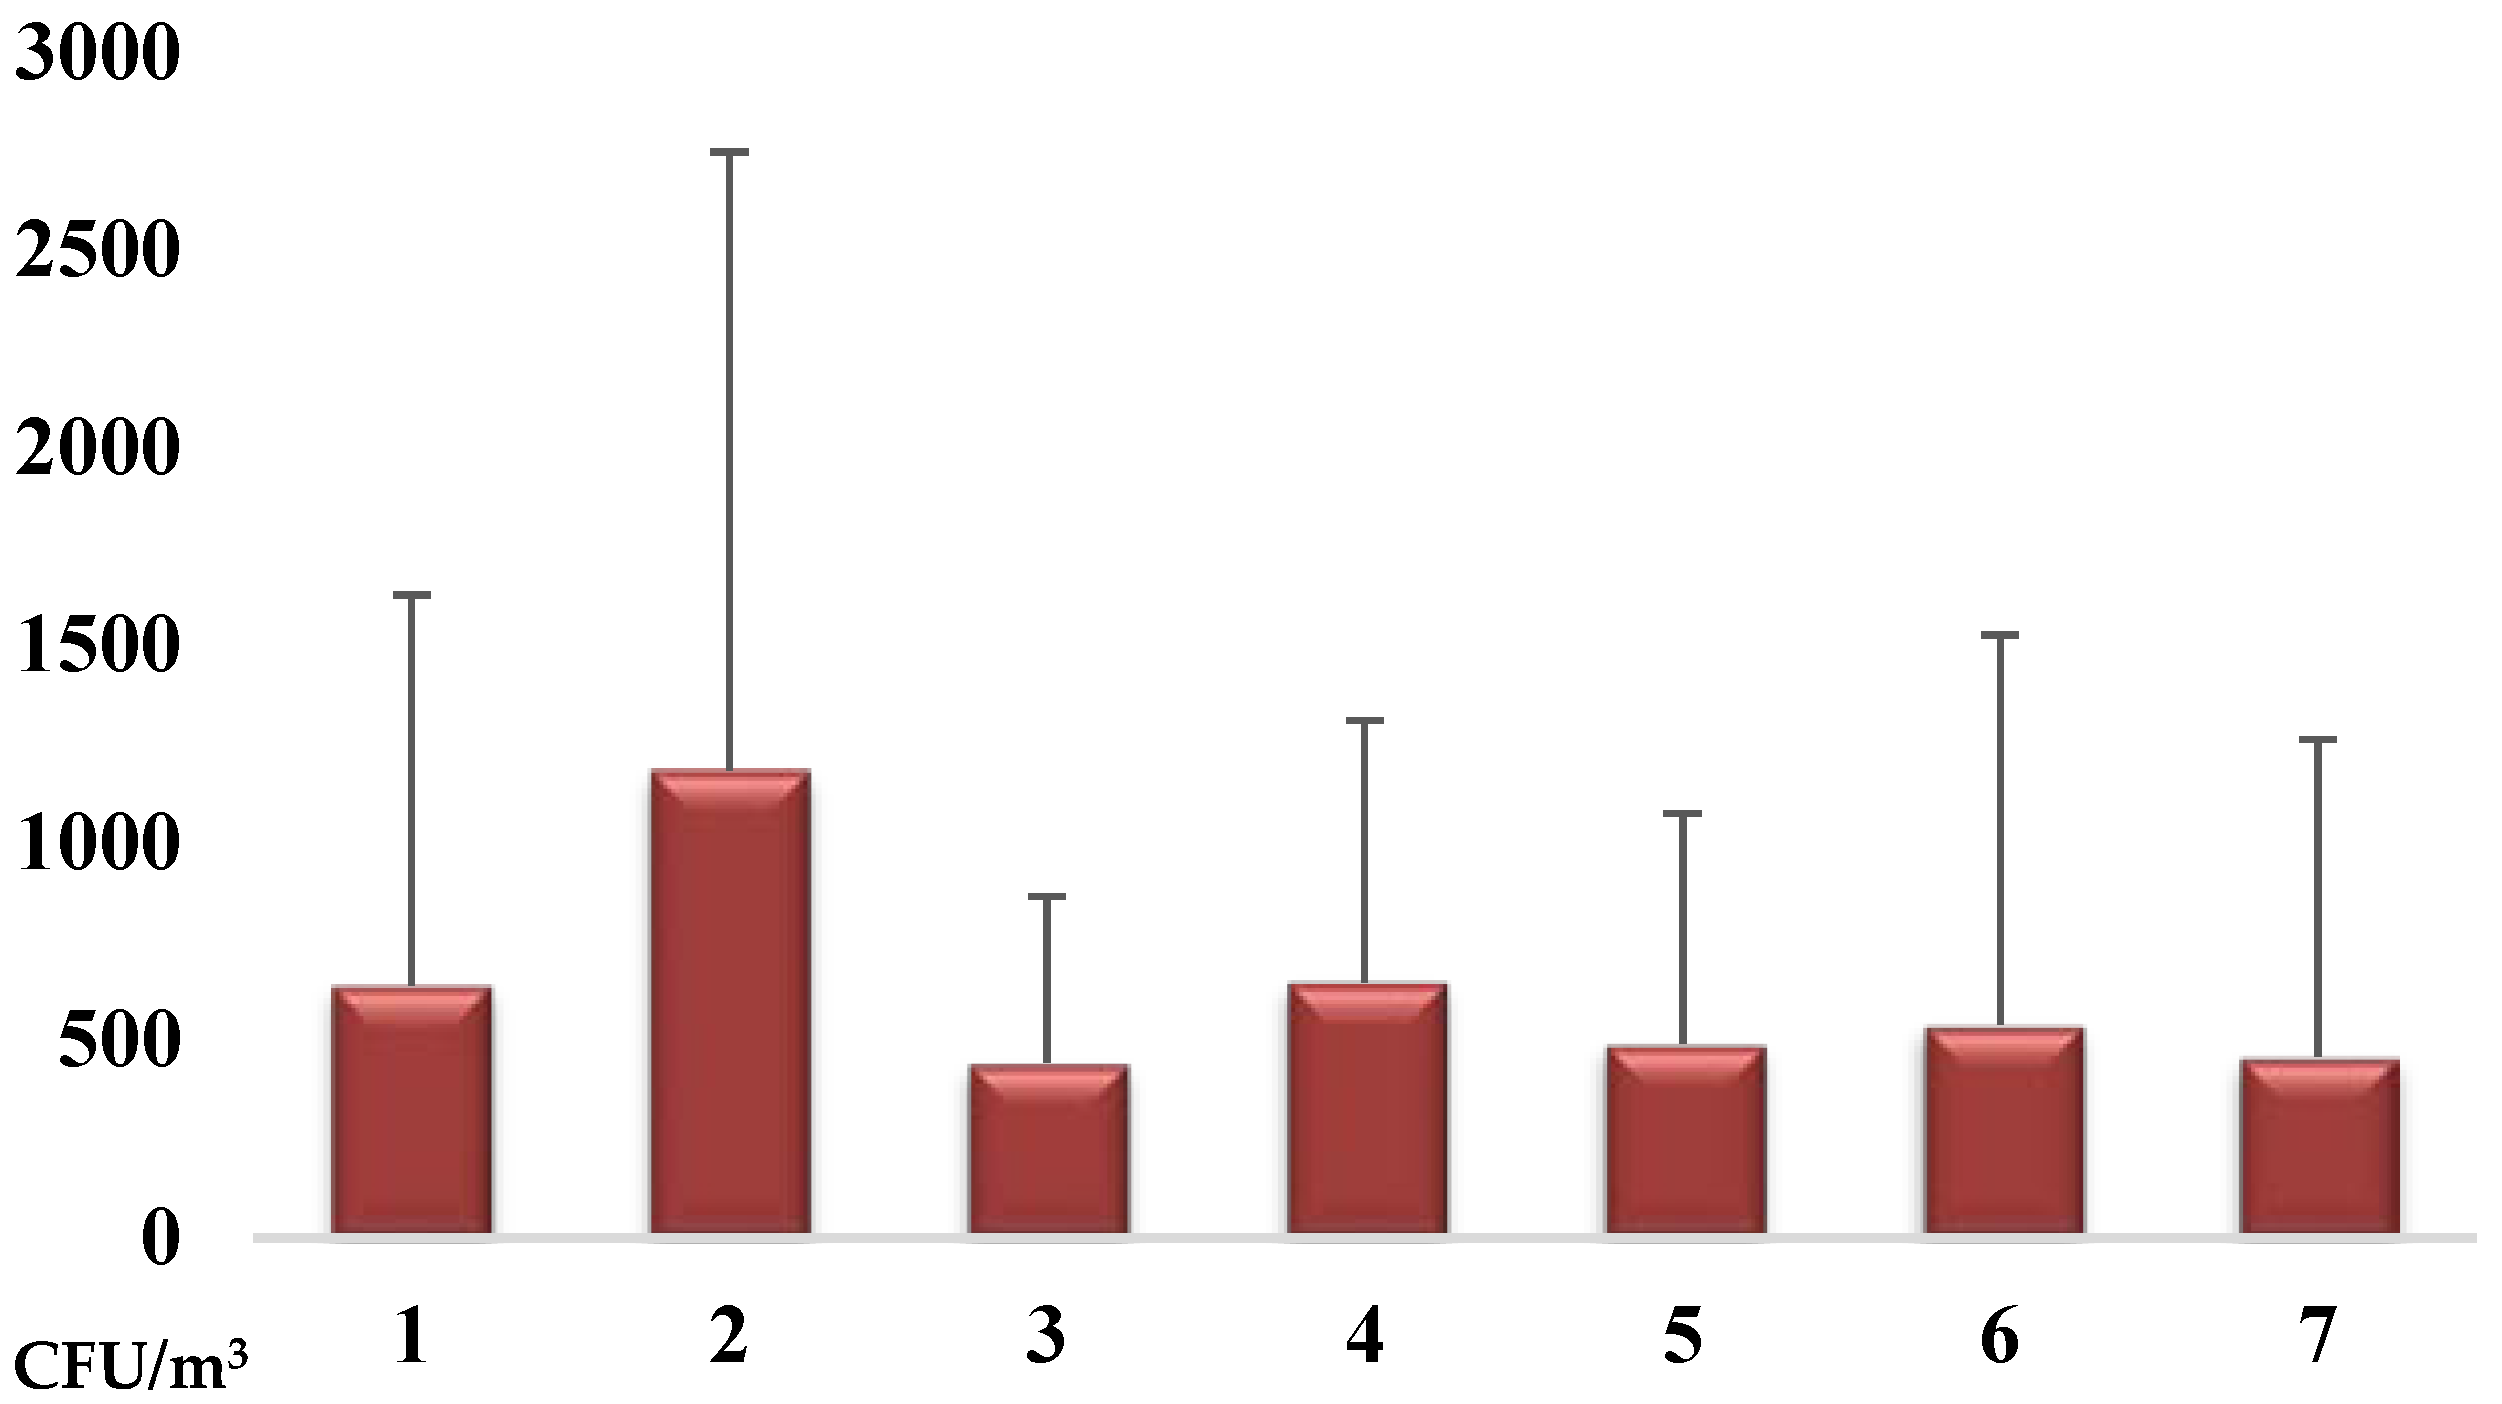
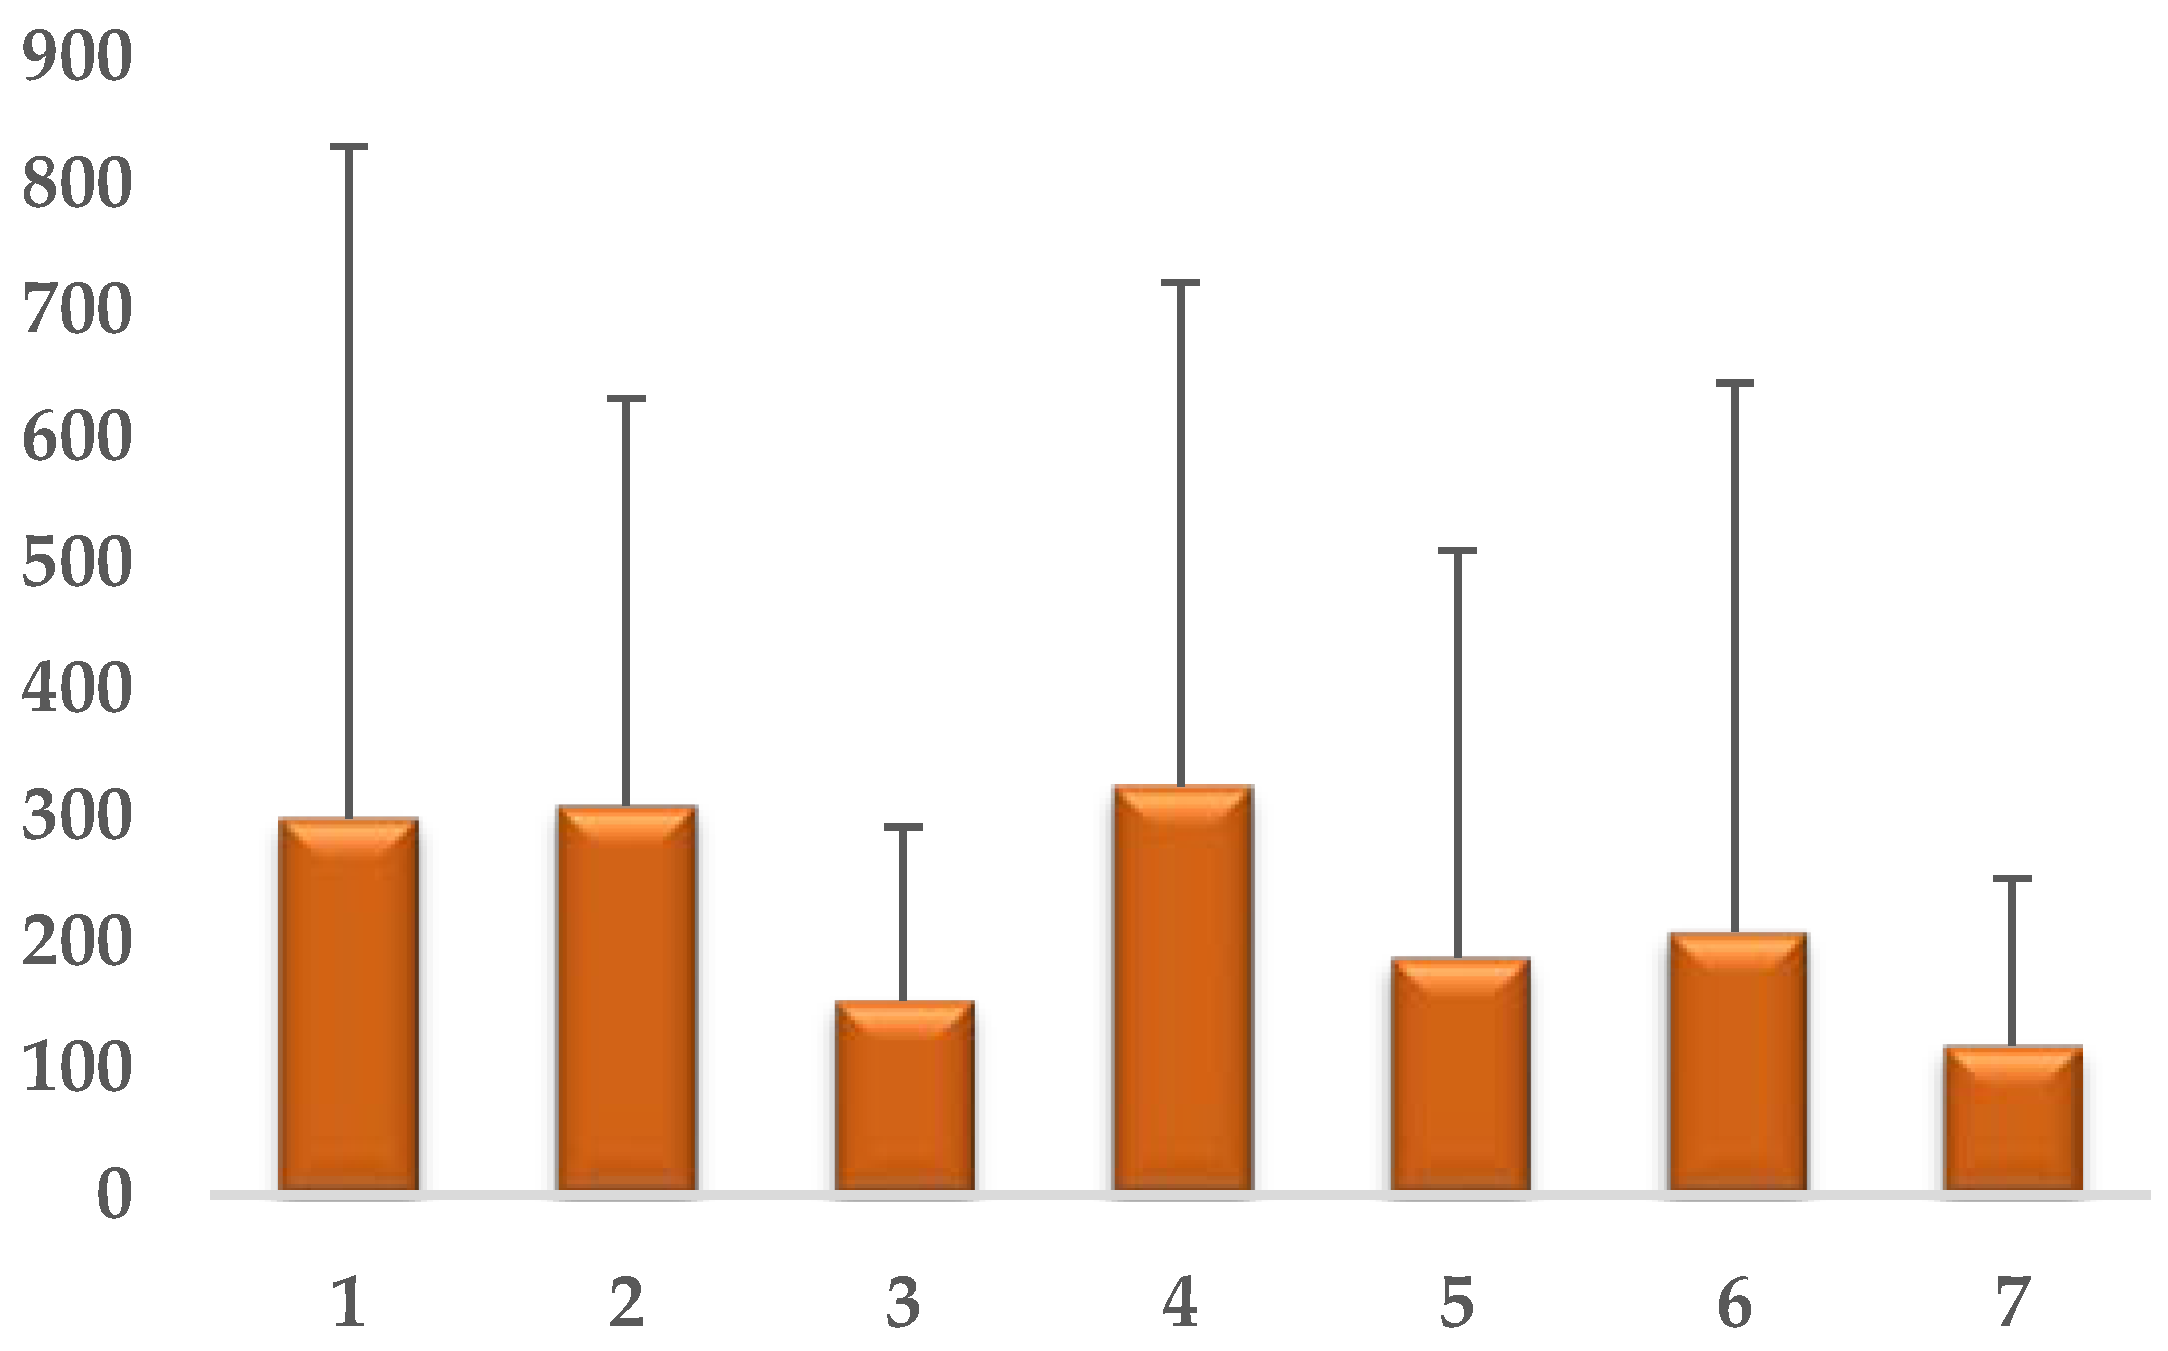
2.2. Sampling Points and Period

To evaluate the chemical and microbiological parameters within the landfill and its surroundings, eight sampling points were established, located both on the perimeter of the landfill and in the nearby inhabited areas (A and B) as shown in Figure 1 and detailed below:
  • Sampling point 1–located inside the landfill on the concrete platform near the sorting station, N 44 31.893–E 26 12.623;
  • Sampling point 2–located at the entrance of the active cell, direction S-W to inhabited area A, N 44 31.341–E 26 12.659;
  • Sampling point 3–established on the property limit of the landfill, direction S-SW to inhabited area A, N 44 31.182–E 26 12.722;
  • Sampling point 4–situated at the edge of the property, at the entrance gate for the garbage trucks, N 44 31.756–E 26 12.251;
  • Sampling points 5 (N 44 31.174–E 26 11.492) and 6 (N 44 30.493–E 26 12.181)–set in the nearest inhabited rural area (A) (600 m), west, respectively south-west to the landfill.
  • Sampling point 7–located as an intermediate point between the nearby inhabited area and the landfill, south to the landfill, N 44 30.948–E 26 12.710;
  • Sampling point 8–established at the eastern property boundary of the landfill, in the direction of the second nearby inhabited area (B) (1000 m), N 44 31.613–E 26 13.36.
The chemical parameters were determined between November 2018 and September 2019, while sampling for bacterial and fungal load was carried out within October 2018 and September 2019. This period covered the following seasons: autumn (September, October and November), winter (December, January and February), spring (March, April and May) and summer (June, July and August).

2.3. Sampling Procedure

Gas (ammonia NH3, hydrogen sulfide H2S, carbon monoxide CO, carbon dioxide CO2 and methane CH4) and atmospheric oxygen (O2) concentrations were measured using a MX6 iBrid™ Détector multigas (Table 1). In November, December and April the determinations were made twice a month and in the other months, once a month at peak hours (8:30 am–3:30 pm) and at a height of 1.3–1.5 m above ground level.
Microbiological air samples were taken twice a month in November and April and once a month in the rest of the study period from seven out of the eight sampling locations. Sampling height was maintained at 1.3–1.5 m above ground level to signify the breathing zone. In each sampling point, 200 L of air were aspired using a Sampl’Air AESAP 1075 sampling device.
The measurements of the gas concentrations and air sampling were made in conditions of atmospheric stability, in the absence of precipitation, strong wind or fog.

2.4. Bacterial and Fungal Counts, Isolation and Identification

Nutrient agar was used to determine the aerobic plate count (APC) and Sabouraud medium was used to determine the total fungal count (TFC). After 24–48 h incubation at 37 °C for APC and 25 °C for TFC, the plates were examined by counting the colonies developed on the surface of the culture medium; the number of colonies identified on each plate was then equated, in real values, using the standardized tables provided by the manufacturer of the sampling device.
To identify the main bacterial and fungal species, isolation and examination of cultural and morphological characteristics were made. Thus, the bacterial colonies obtained on plate count agar were first of all classified based on the cultural features, followed by staining and microscopic examinations. The identification of the isolates was carried out using selective and chromogenic media (Levine, MacConkey, Palcam, Oxford and Rambach medium) or biochemical tests (MIU and TSI tests to identify the species included in the Enterobacteriaceae family). Likewise, airborne fungal spores grown on Sabouraud medium were grouped based on its cultural aspects. The genus identification of the dominant fungal colonies was made using slides wetted with lactophenol blue which where microscopically observed and identified (400×).

2.5. Statistical Analysis

Data are spatially and temporal presented as mean ± SD of each chemical and microbiological indicator. Where applicable, one way ANOVA followed by Tukey HSD or ANOVA Kruskal–Wallis followed by Dunn’s test (Statistical Package for the Social Sciences-SPSS) were used to compute and analyze the differences obtain between different sampling points and time intervals. The level of significance was considered at p < 0.05.

3. Results

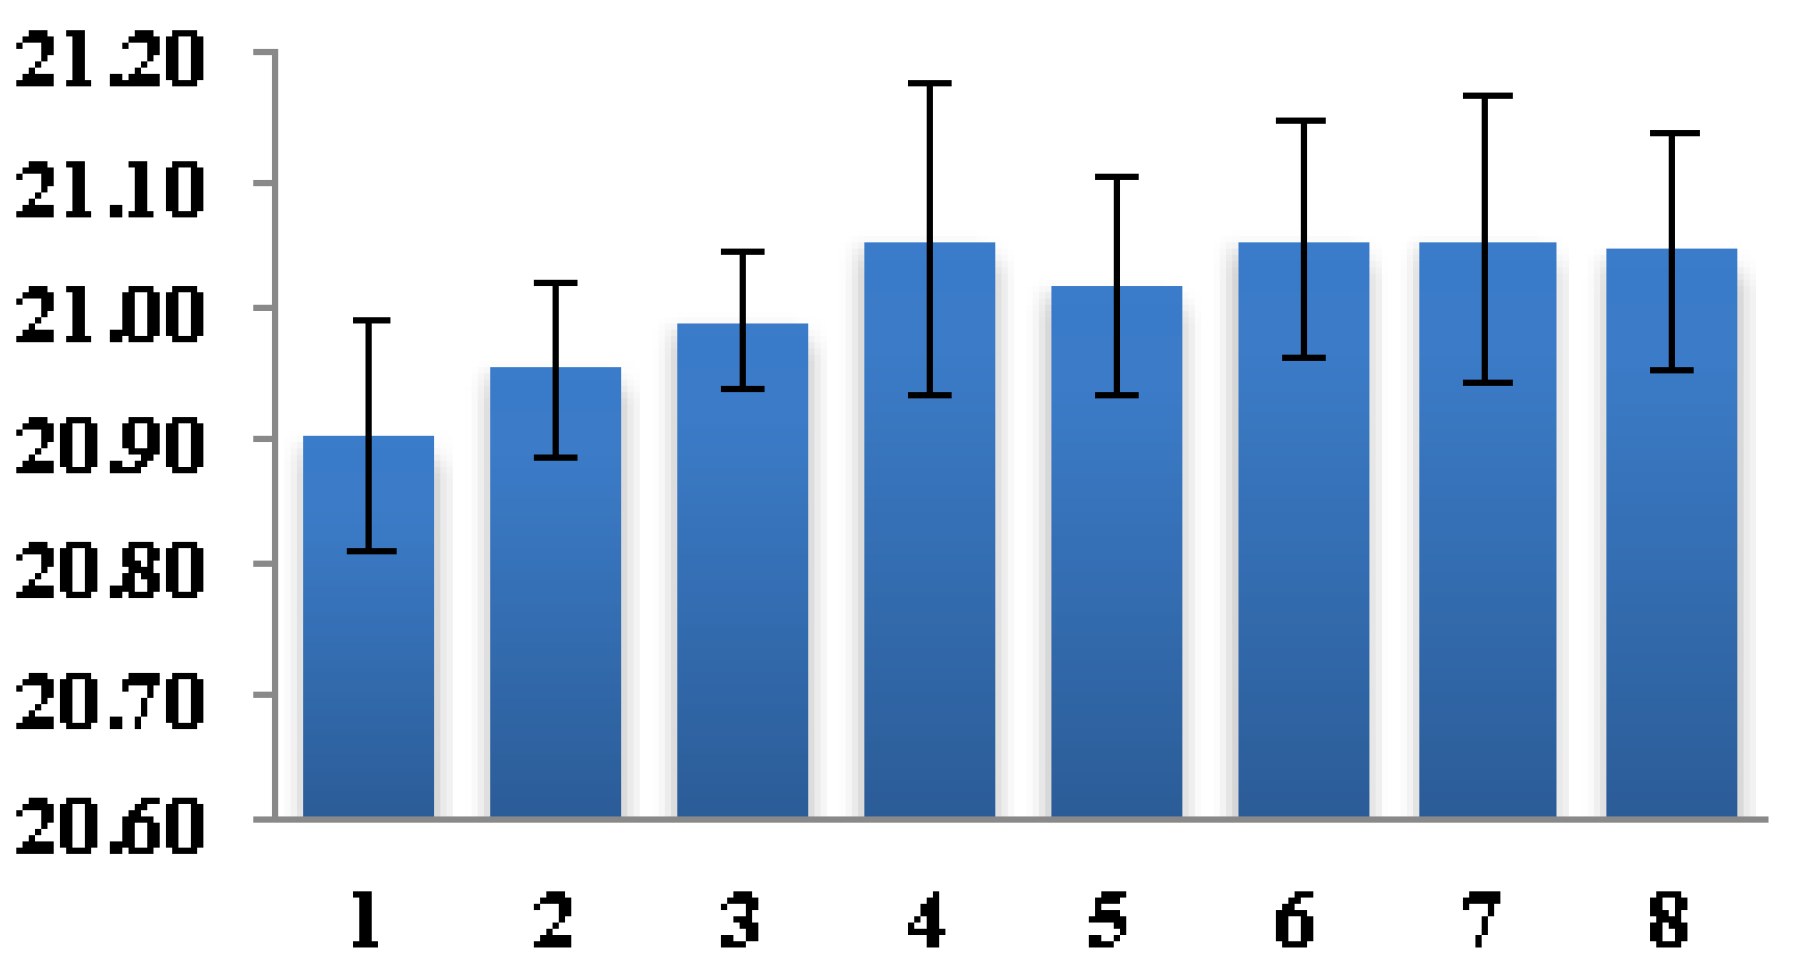
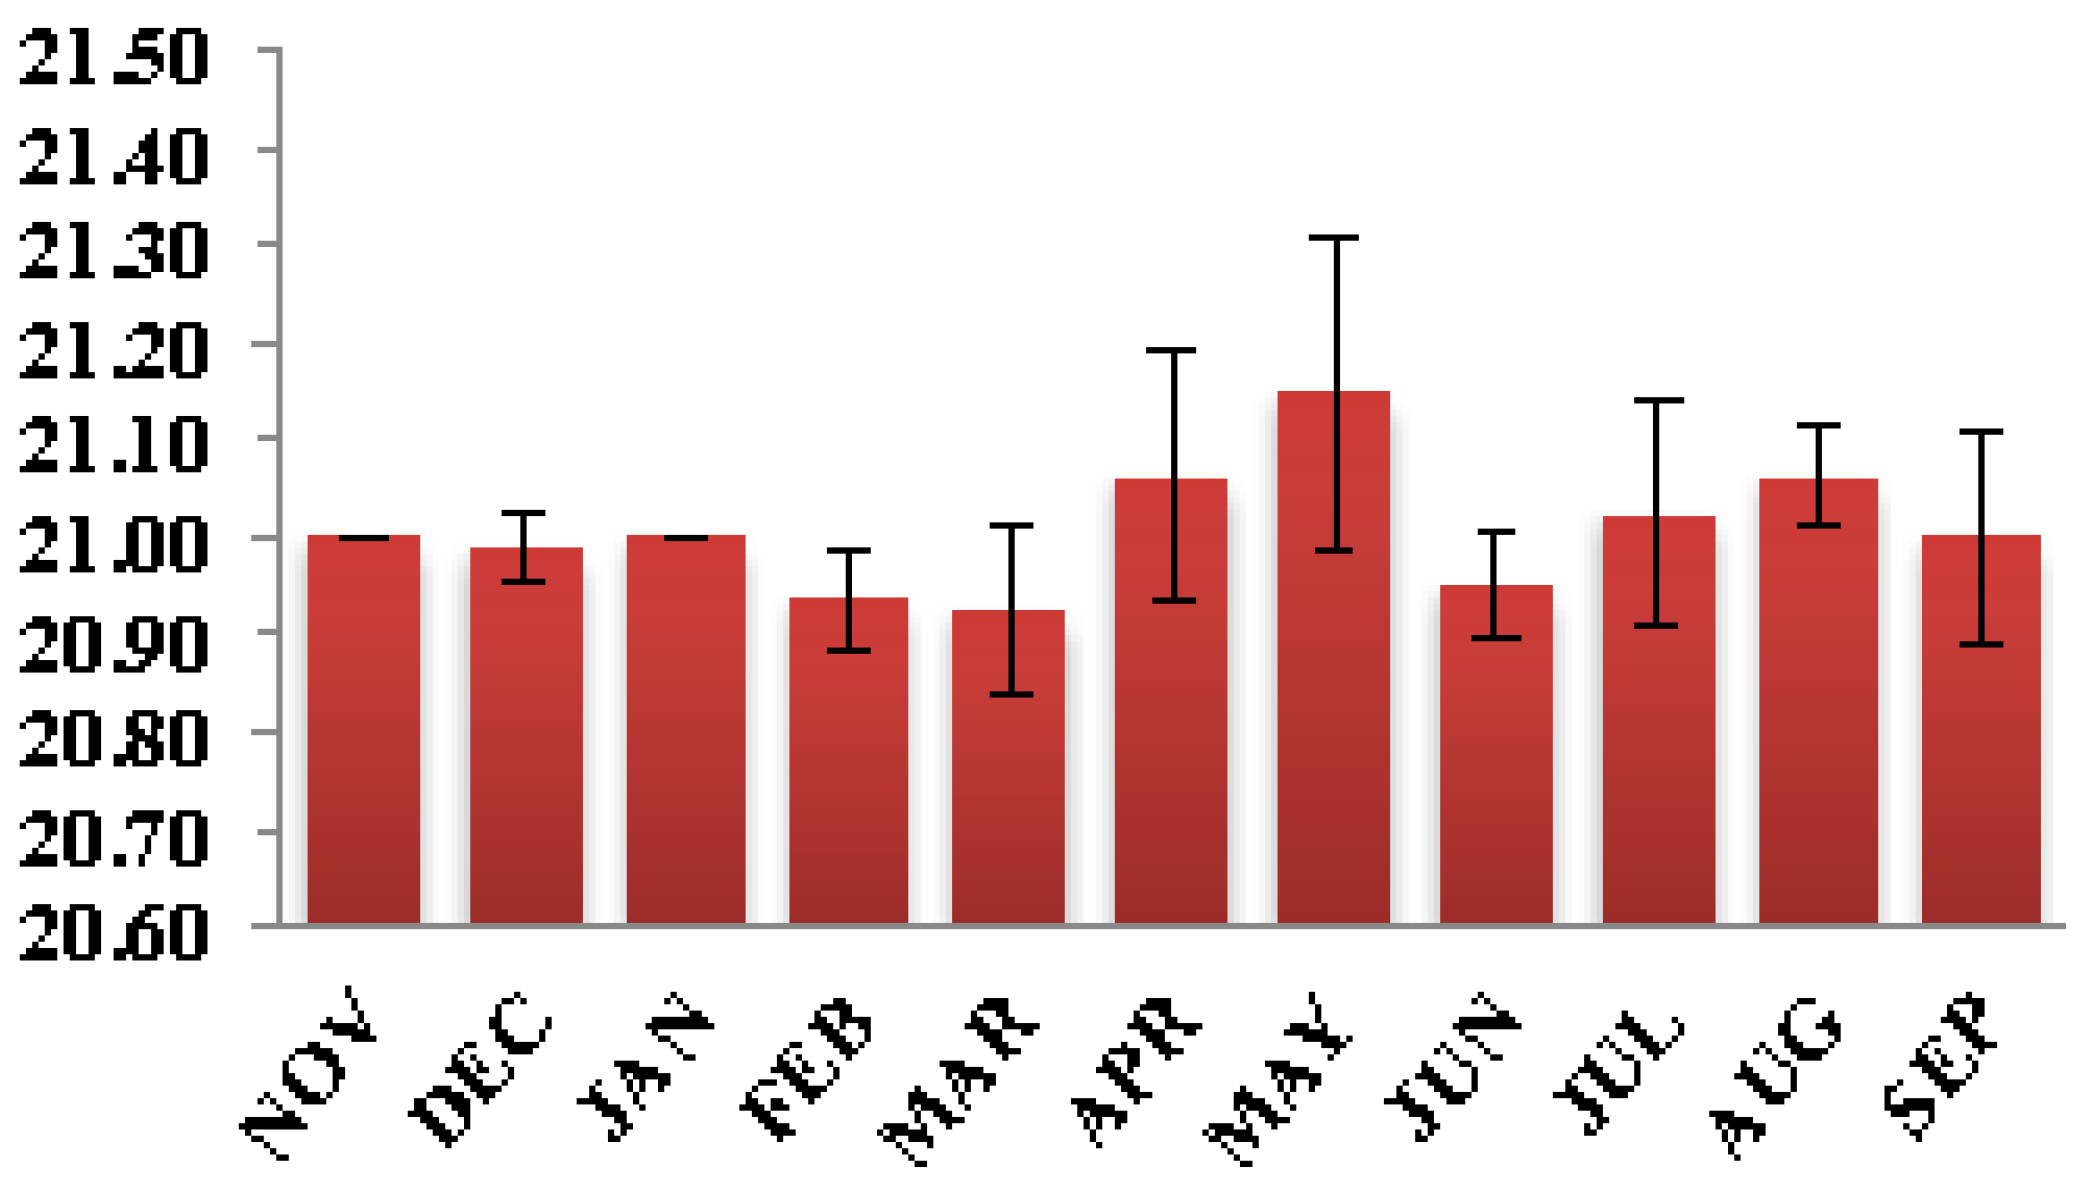
3.1. Atmospheric Oxygen and Chemical Pollutants Concentrations (CO2, H2S, NH3, CO and CH4)

In terms of atmospheric oxygen concentrations, both the sampling points and the sampling period proved to be significant factors F (7, 80) = 4.2, p < 0.001, respectively, F (10, 77) = 4.37, p < 0.001. Significant differences were found between sampling point 1 (20.9% ± 0.09%) and points 4 (21.0% ± 0.12%), 6 (21.05% ± 0.09%), 7 (21.05% ± 0.11%) and 8 (21.05% ± 0.09%) (p < 0.01) (Figure 2). The highest concentration of atmospheric oxygen was recorded in May (21.15 ± 0.16%), with significant differences (p < 0.05) compared with November (21.00 ± 0.00%), December (20.99 ± 0.04%), January (21.00 ± 0.00%) and September (21.00 ± 0.11%) and very significant (p < 0.001) differences compared with February (20.94 ± 0.05%), March (20.93 ± 0.09%) and June (20.95 ± 0.05%) (Figure 3).
At the sampling points, the average concentrations of carbon dioxide (CO2) ranged from 499 ± 101 (sampling point 2) to 620 ± 215 ppm (sampling point 5), with no significant differences F (7, 77) = 1.7, p = 0.12 (Figure 4). During the sampling period (November 2018–September 2019), the average values ranged between 430 ± 26.32 (August) and 617 ± 149.68 ppm (January) and no significant differences were found F (10, 74) = 1.81, p = 0.07 (Figure 5).
Of the total samples (N = 85), 7% showed CO2 concentrations for clean air, below 400 ppm (0.04%): at sampling point 3 in November and March, at sampling points 2, 6 and 7 in February and at sampling point 7 in March, while 93% showed CO2 values between 402 and 978 ppm. The highest concentrations, 947 ppm in November, 887 ppm in March and 978 ppm in April, were recorded at sampling point 5.
Of all samples (N = 87), six were positive for hydrogen sulfide (H2S), with values between 0.1 and 5.0 ppm. Thus, in December, hydrogen sulfide was present at sampling points 1 and 2 at 0.2–1.9, respectively 0.2 ppm. In April, only at sampling point 1 was recorded a concentration of 0.1 ppm; in June, also at point 1, the values ranged between 0.1 and 5.0 ppm. Instead, in August, the presence of H2S was registered at sampling points 2 and 4 with a value of 0.4 ppm.
Ammonia (NH3) was detected only at sampling point 1 in June, with values between 1.0 and 3.0 ppm.
Methane (CH4) and carbon monoxide (CO) were not detected in any of the sampling points during the study period.

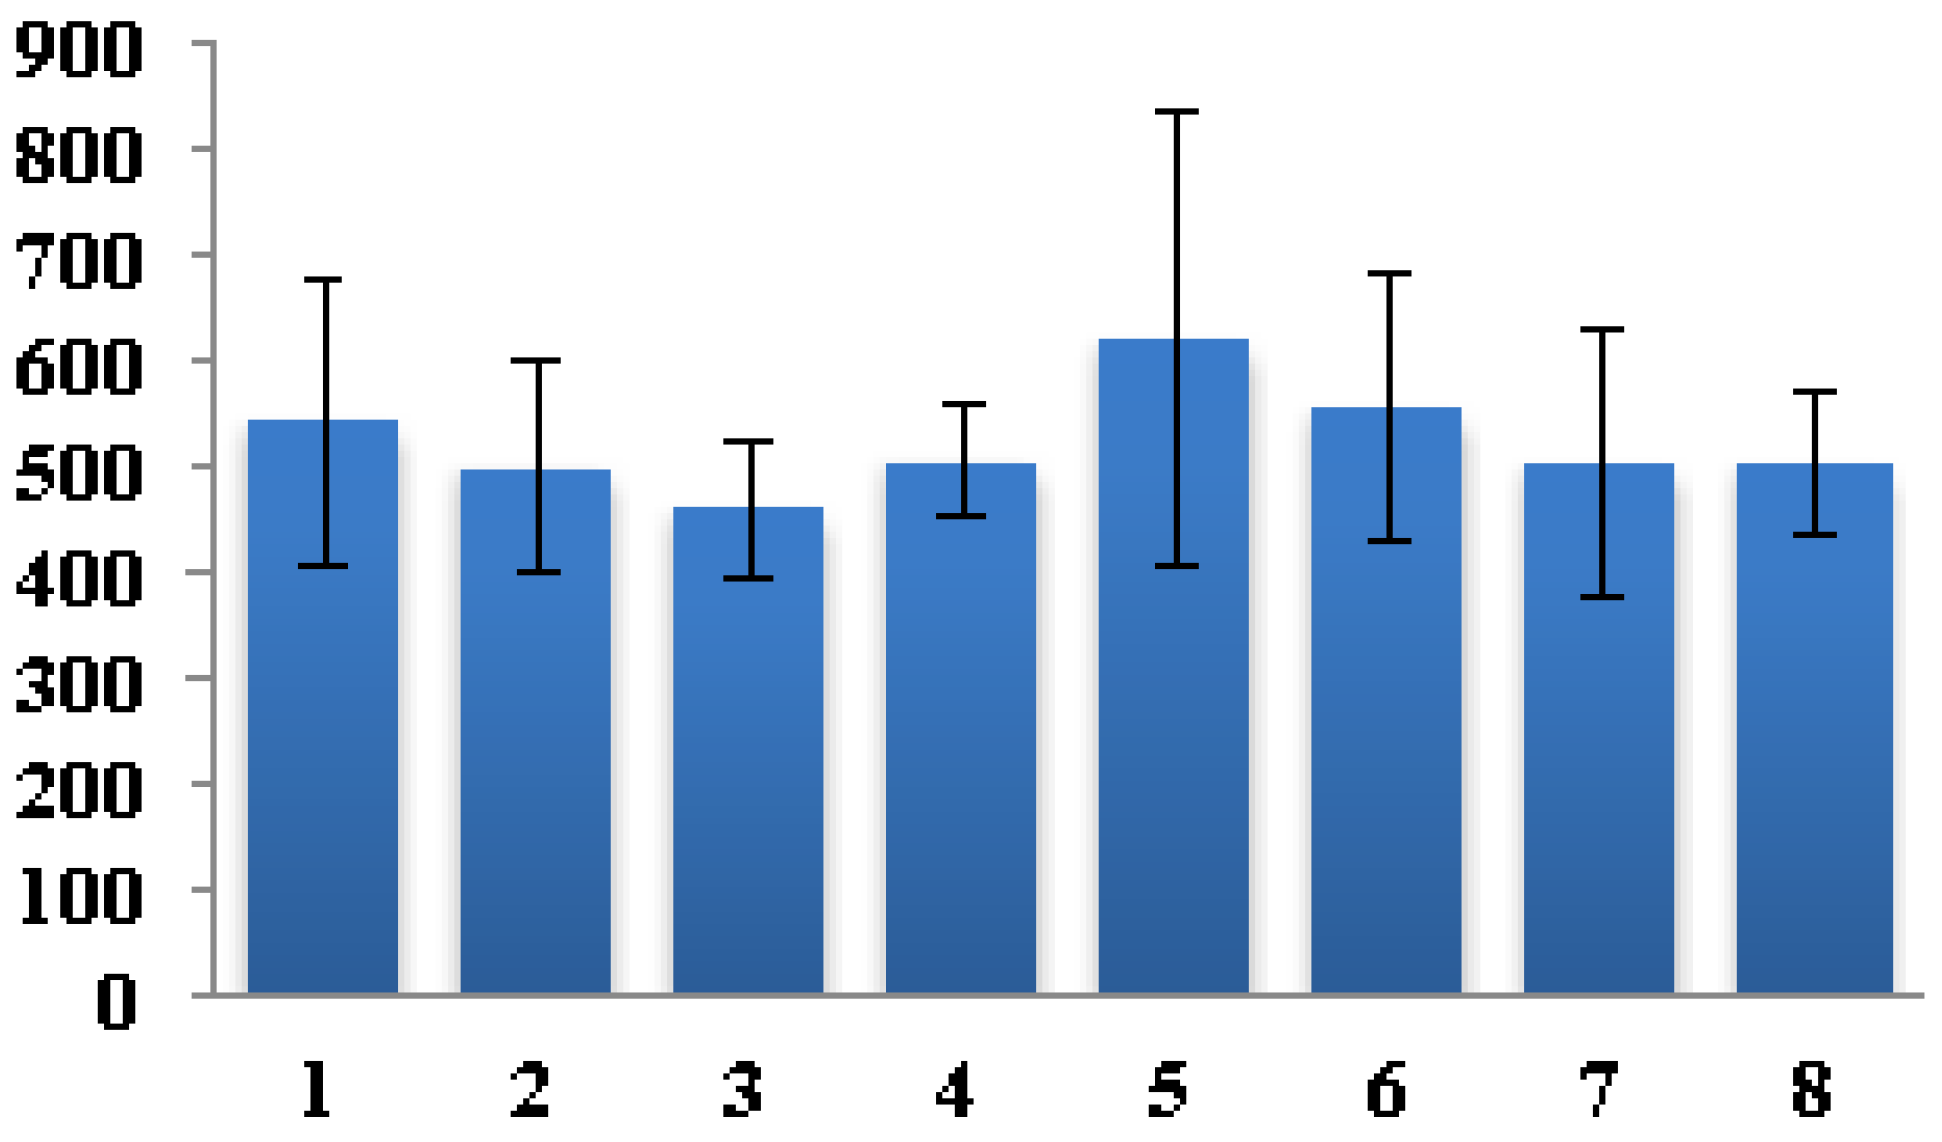
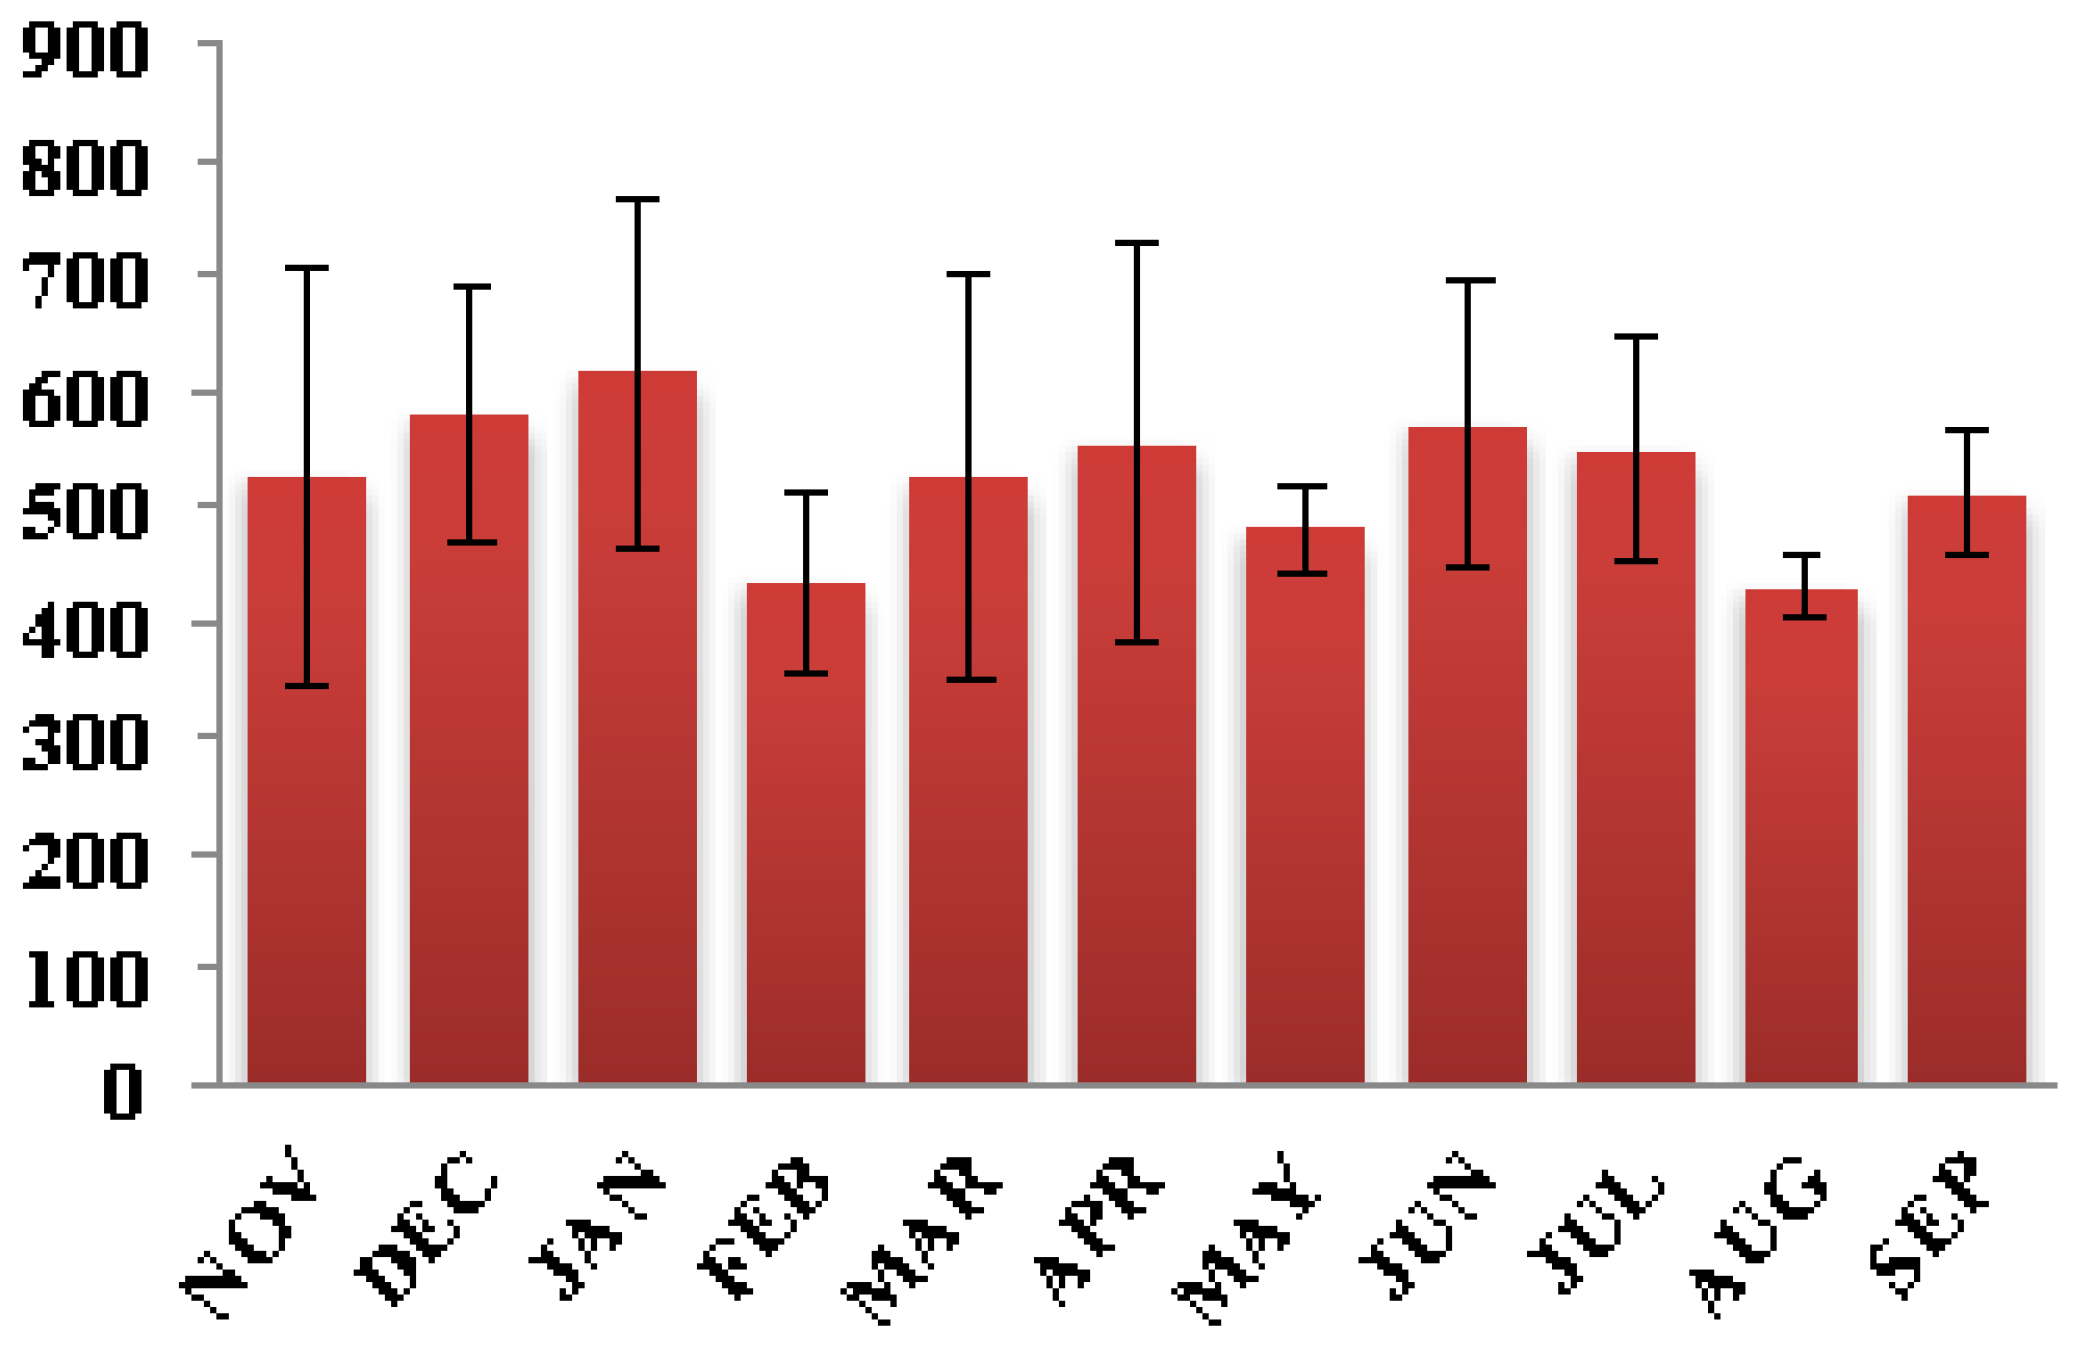
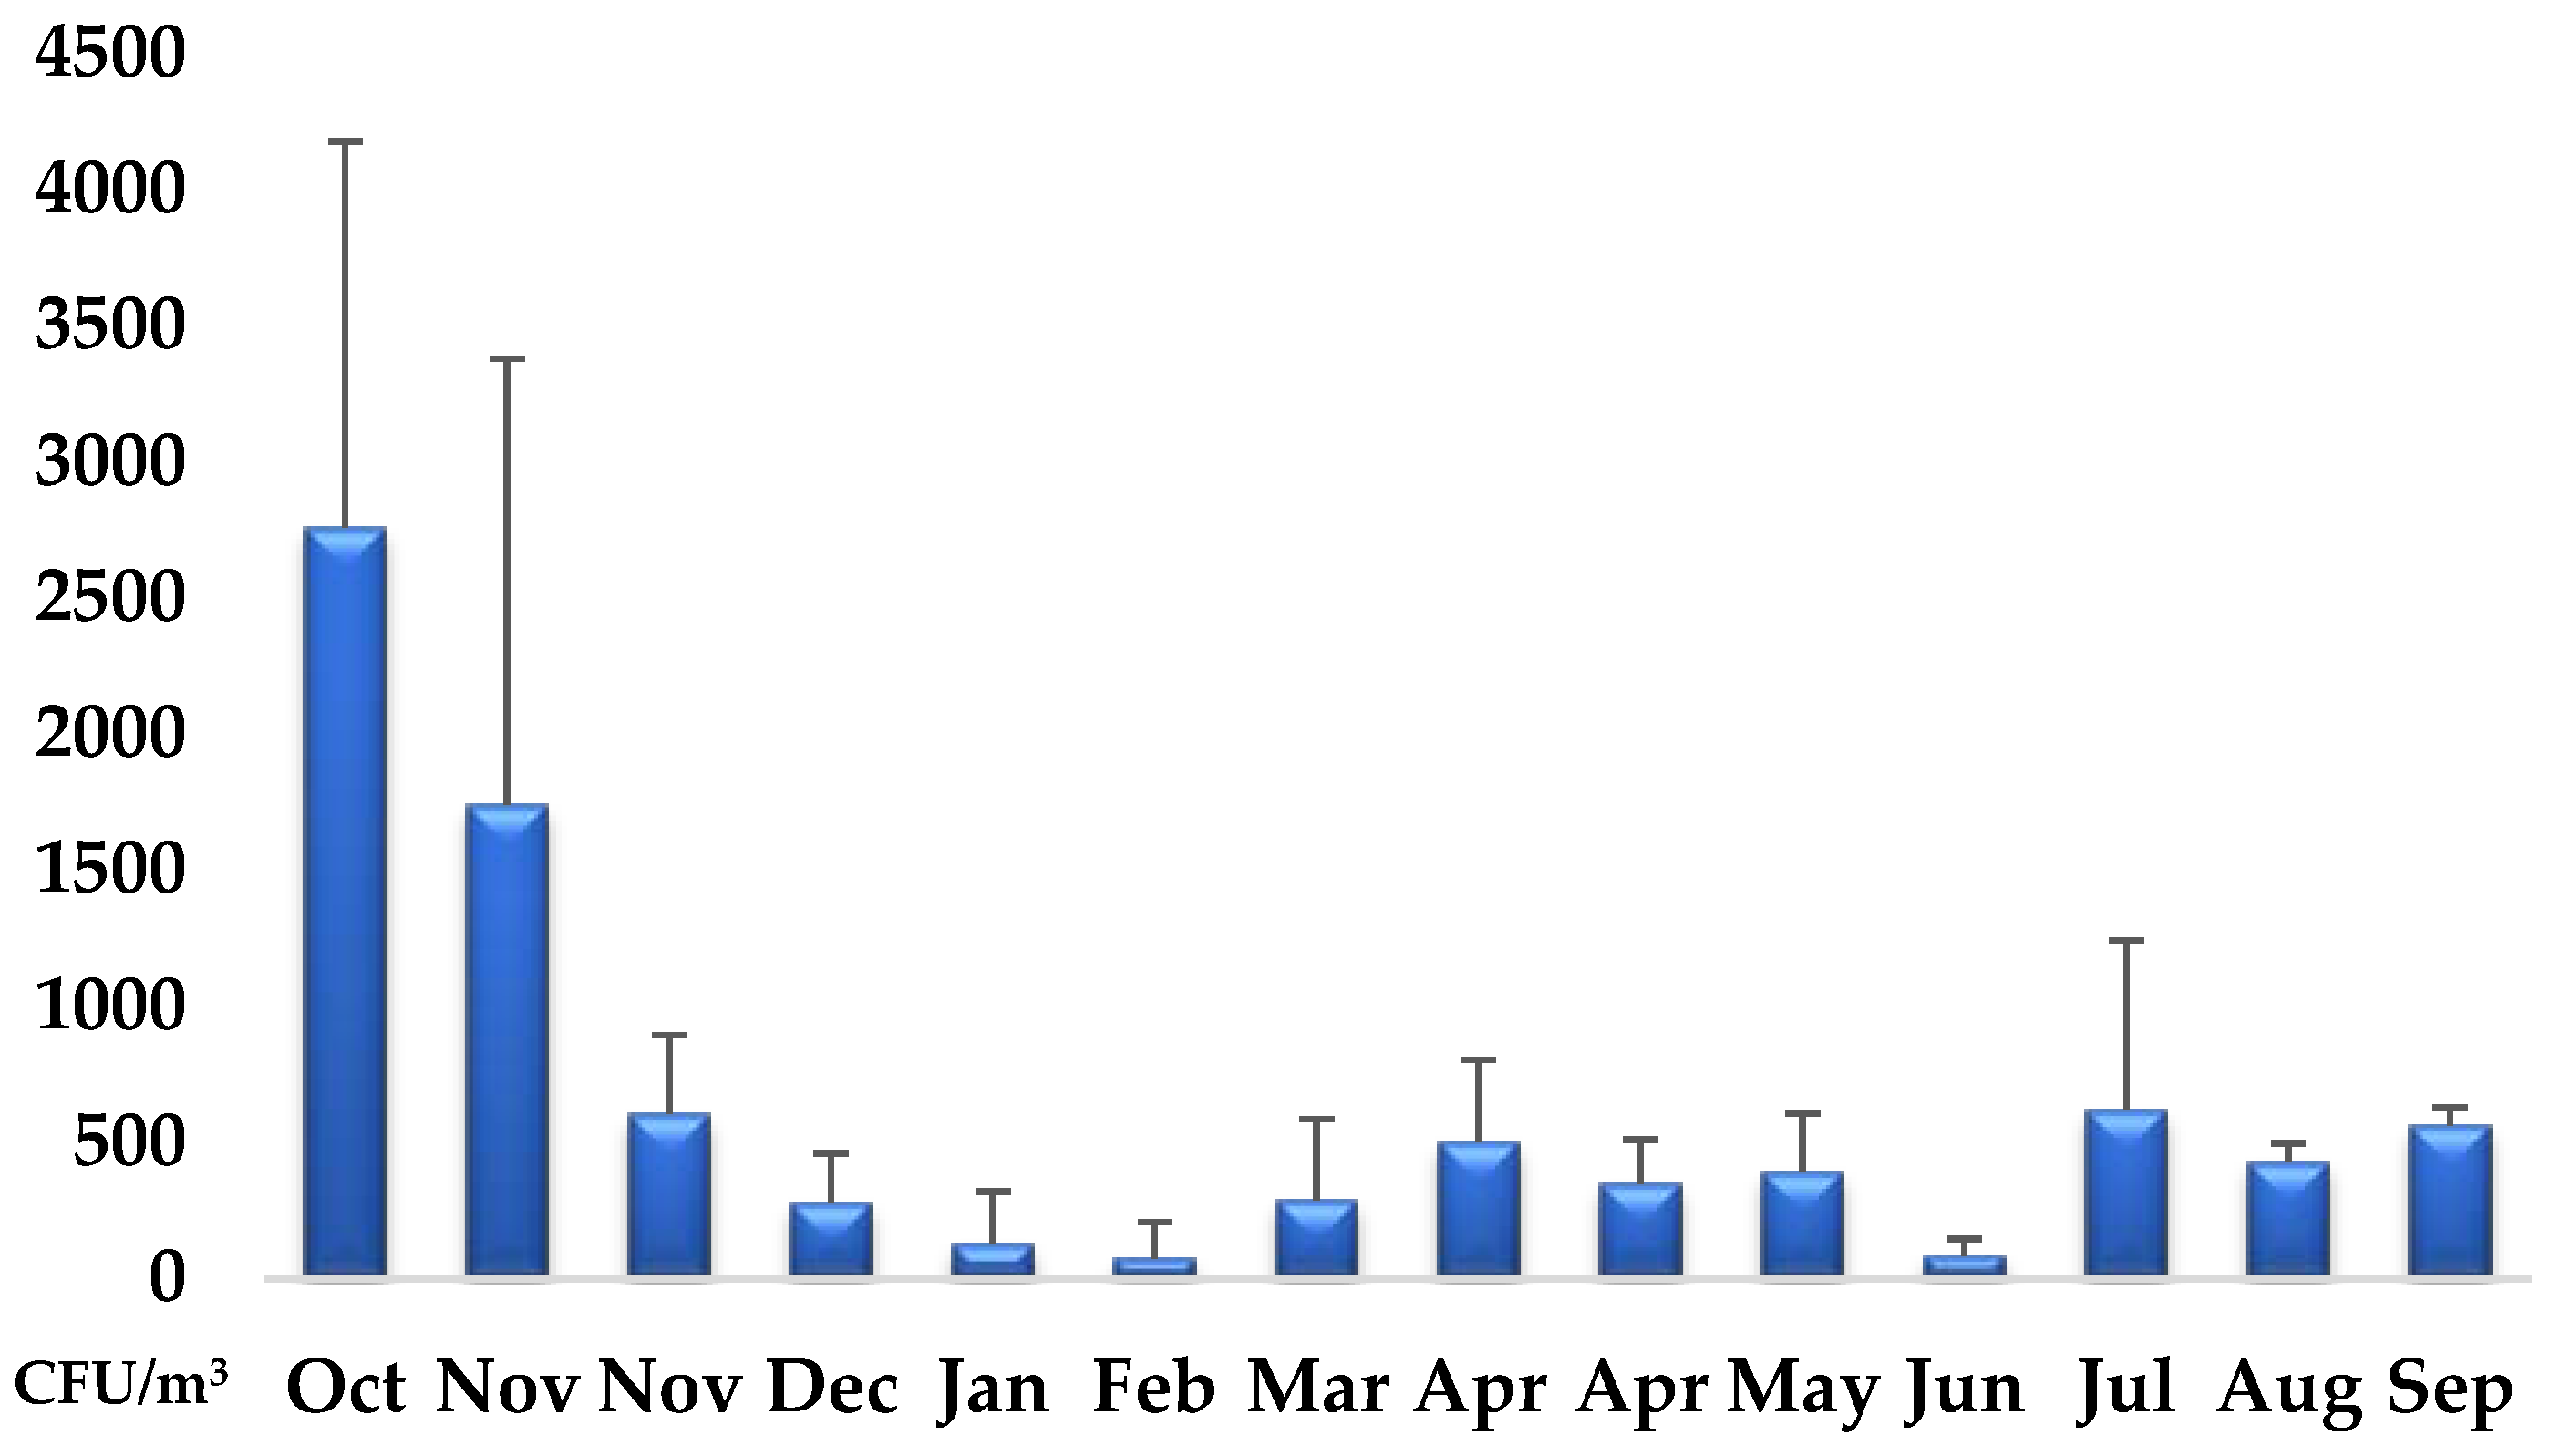
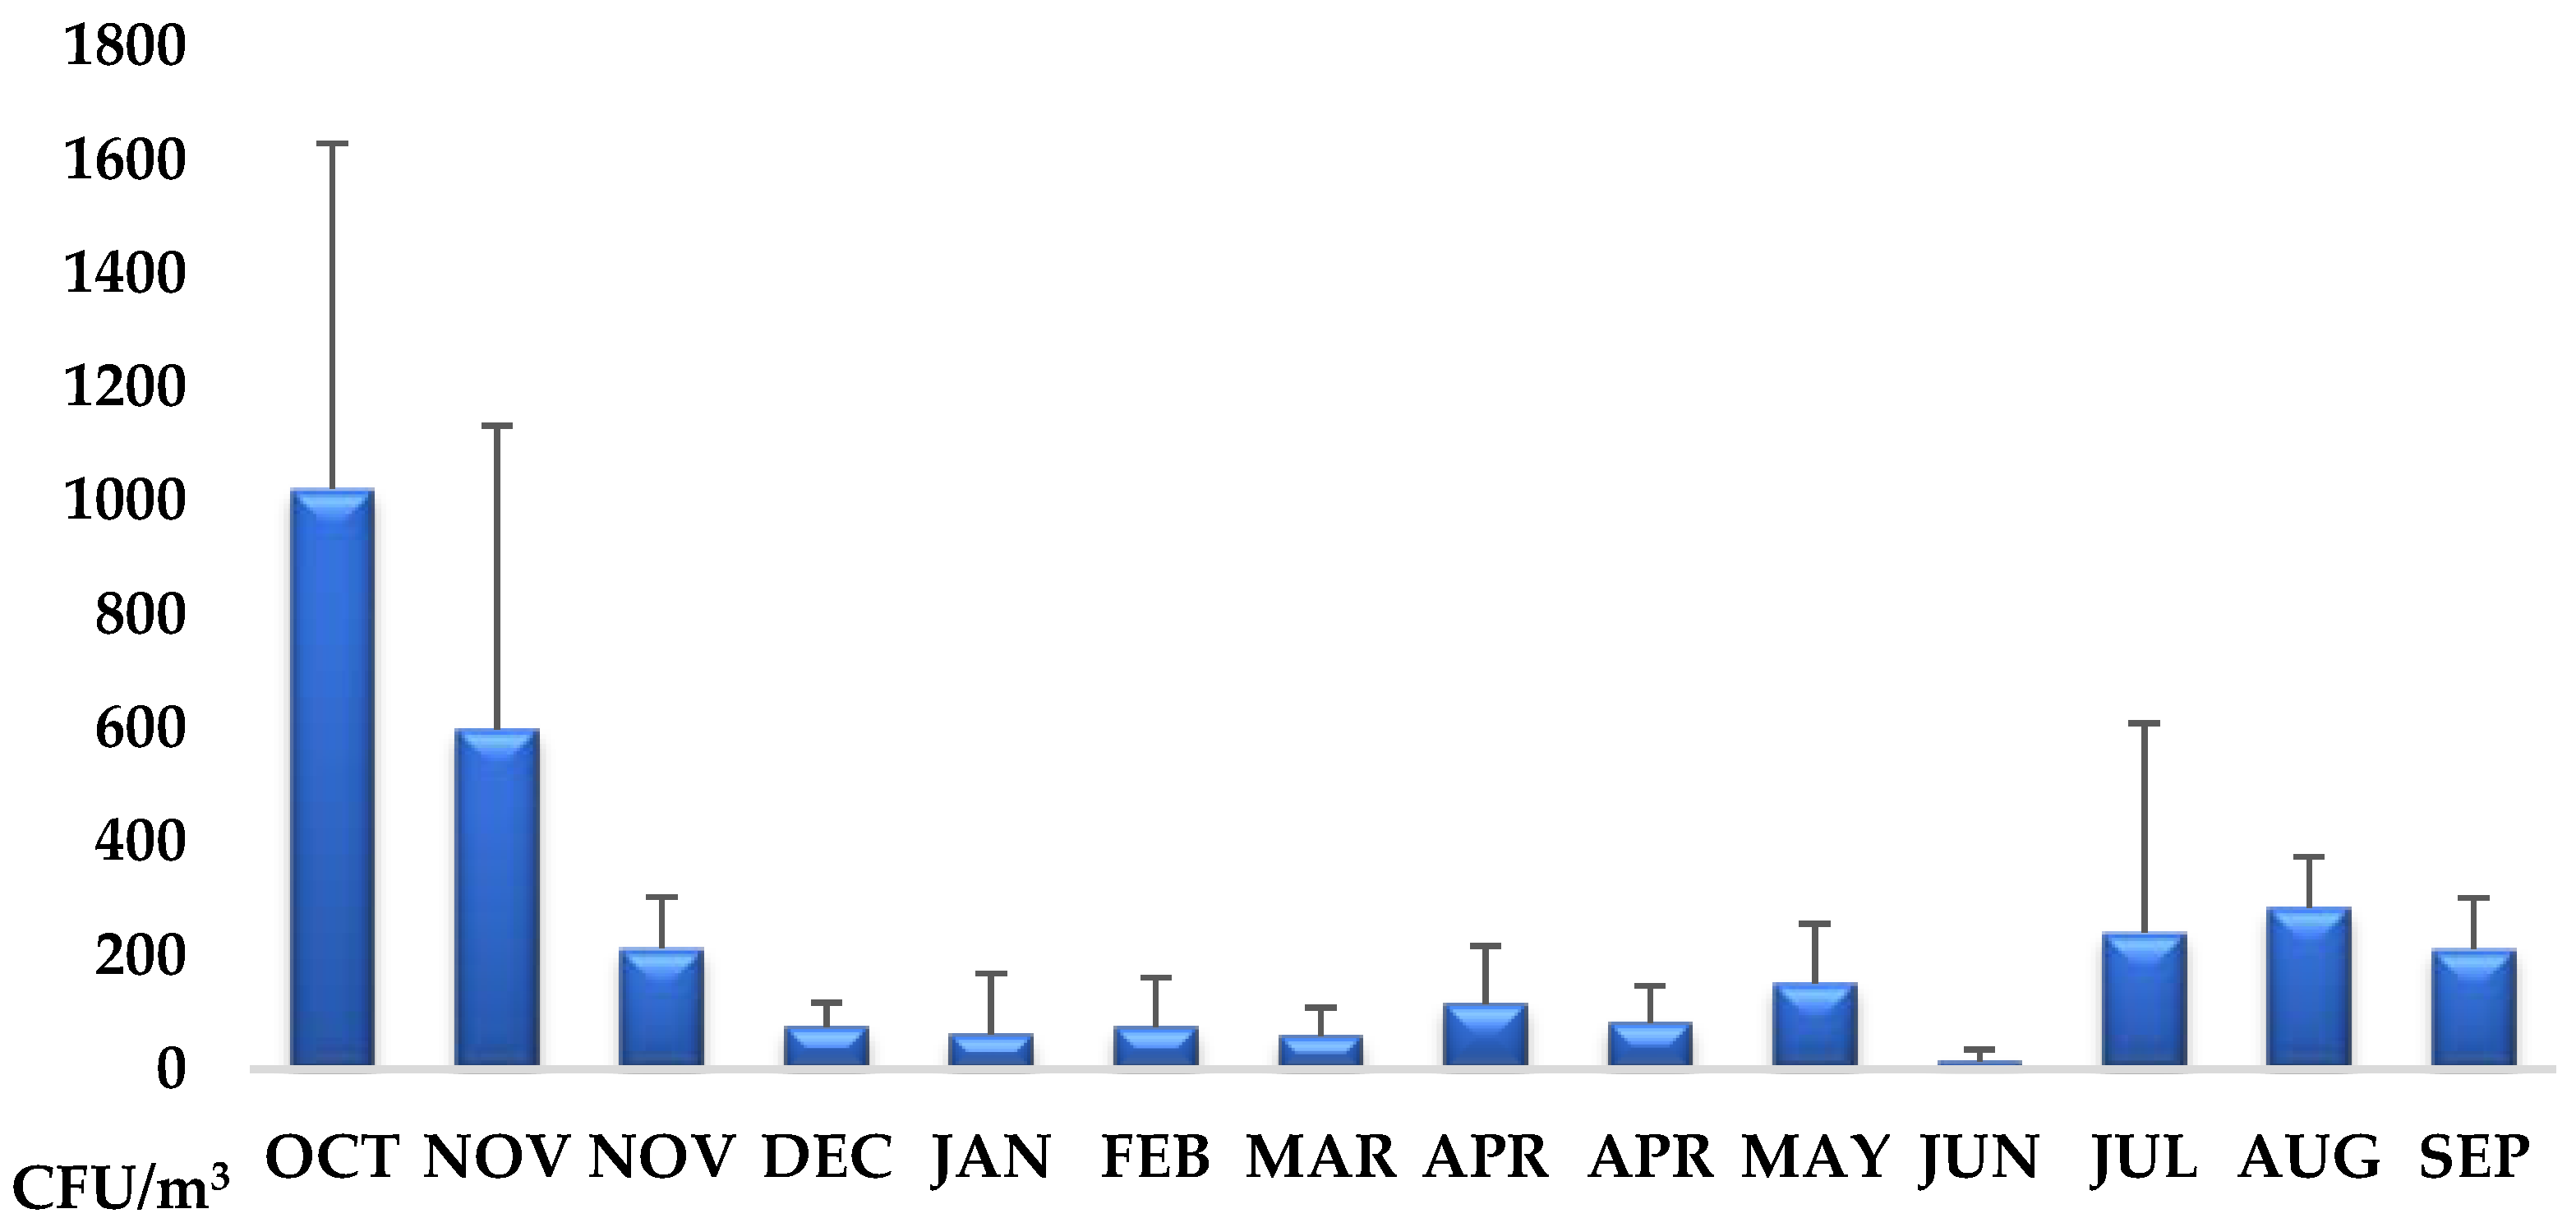
3.2. Microbiological Air Quality–Aerobic Plate Count (APC), Total Fungal Count (TFC), Bacterial and Fungal Identification

At the sampling points, the aerobic plate count (APC) ranged from 1184 ± 1565 CFU/m3 (sampling point 2) to 444 ± 419 CFU/m3 (sampling point 3), with no significant differences H (6) = 8.29, p > 0.05. The second highest value was recorded at sampling point 4 (646 ± 662 CFU/m3), followed very closely by 1 (639 ± 662 CFU/m3) and 6 (540 ± 985 CFU/m3) (Figure 6).
Instead, the sampling period proved to be a significant factor in the APCs dynamics H (13) = 58.24, p < 0.001. In October and early November, the values were very high compared with the rest of the study period. The lowest values were recorded in February and June. From October (2757 ± 1418 CFU/m3) to February (73 ± 134 CFU/m3), APC values decreased significantly (p < 0.01); in the following months, from March to May the values fluctuated without significant differences (p > 0.05), from 289 ± 297 CFU/m3 to 393 ± 215 CFU/m3. In June (84 ± 61 CFU/m3), there was an important decrease (p < 0.01) followed immediately by a significant enhance in July (620 ± 623 CFU/m3) (p < 0.05). In the following months, the values remained relatively constant (p > 0.05) (Figure 7).
The following bacterial species were identified: Clostridium spp., Enterobacter spp., Escherichia coli, Listeria monocytogenes, Micrococcus luteus, Proteus spp., Pseudomonas aeruginosa, Salmonella spp., Staphylococcus spp. and Streptococcus spp.
The total fungal count (TFC) followed closely the same spatial and temporal pattern as the APC, but exhibiting lower average values. Therefore, at the sampling points, the TFC ranged from 324 ± 398 CFU/m3 (sampling point 4) to 118 ± 132 CFU/m3 (sampling point 7), with no significant differences H (6) = 8.55, p > 0.05. The second highest value was recorded at sampling point 2 (308 ± 322 CFU/m3), followed very closely by 1 (298 ± 531 CFU/m3) and 6 (208 ± 434 CFU/m3) (Figure 8).
The same as for APC, the sampling period proved to be a significant factor in the fungal dynamics H (13) = 57.94, p < 0.001. In October, the values were very high compared with the rest of the study period. The lowest values were recorded in June and March. From October (1021 ± 607 CFU/m3) to December (73 ± 134 CFU/m3), TFC values decreased significantly (p < 0.01); in the following months, till March (59 ± 50 CFU/m3), the values had minor fluctuations (p > 0.05). In April (115 ± 101 CFU/m3) there was a slightly increase and the values remained constant till May (151 ± 105 CFU/m3) (p > 0.05). In June (13 ± 22 CFU/m3), there was an important decrease (p < 0.01) followed immediately by a significant enhance in July (241 ± 368 CFU/m3) (p < 0.05). In the following months, the values remained relatively constant (p > 0.05) (Figure 9).
The following fungal genera were identified: Aspergillus, Penicillium, Alternaria, Rhizopus, Candida, Fusarium and Mucor. Of these, species included in the genera Aspergillus and Penicillium were identified in most samples, followed by species belonging to the genera Candida, Rhizopus and Alternaria.

4. Discussion

United States Occupational Safety and Health Administration (OSHA) states for the normal, fresh air an oxygen level of 20.9% and defines an oxygen deficient atmosphere as anything less than 19.5% oxygen by volume [26]. In the present study, the spatial oxygen variations were between 20.09 ± 0.09% (sampling point 1) and 21.05% (sampling points 6, 7, 8). The temporal variations were situated between 21.15 ± 0.16% (May) and 20.93 ± 0.09% (March) These variations in the oxygen level, even if significant between some of the sampling points and during the sampling period, are in the normal range of atmospheric oxygen. Regarding the sampling points, the differences are likely to be due to the variations in the proportion of the other atmospheric gases. When it comes to the sampling interval, in the late spring period (April and May) the vegetation is the most abundant and has an important contribution to the increase of atmospheric oxygen level.
Once organic waste is landfilled, it starts decomposing under anaerobic conditions and generates landfill gas, a mixture of methane (CH4), carbon dioxide (CO2) and a small amount of other gaseous substances [11,27]. When the gas goes through landfill covers, a portion of non-collected CH4 oxidizes into CO2. While the generated CO2 is emitted without being converted into other molecules, regardless of the gas collection conditions, a portion of the CH4 generated from landfilled waste is combusted or oxidized into CO2 [27].
Carbon dioxide is the most important of Earth’s long-lived greenhouse gases. It absorbs less heat per molecule than CH4 or nitrous oxide, but it is more abundant and it stays in the atmosphere much longer. Based on preliminary analysis, the global average atmospheric carbon dioxide in 2020 was 412.5 ppm, setting a new record high amount despite the economic slowdown due to the COVID-19 pandemic [28].
In the present study, there have not been registered statistically significant spatial and temporal variations in atmospheric CO2 concentrations. The concentration of carbon dioxide in the atmospheric air at the four sampling points inside the landfill was in the range of 459.9 ± 65.08 (sampling point 3)–543.72 ± 136.56 ppm (sampling point 1). Instead, the highest concentrations were recorded in sampling points 5 (620 ± 215 ppm) and 6 (554.54 ± 127.23 ppm) located in the inhabited rural area closest to the landfill. As revealed by the results, in three particular situations the concentrations recorded at the sampling point 5 were almost twice as high as those recorded at the collection points located inside the landfill. The large standard deviations obtained for sampling points 5, 6, 7, but also for 1 and 2, located near the sorting station, respectively, at the entrance of the active cell, suggests the existence of uncontrolled sporadic CO2 emissions. The carbon dioxide in the atmosphere of sampling points 5 and 6 comes from local sources because the inhabitants from this area used to burn industrial and other types of waste from which metals are recovered and subsequently sold. Consequently, these open and uncontrolled waste incinerations do pose serious environmental and air quality concerns in the area.
Hydrogen sulfide (H2S) was detected only at sampling points 1, 2 and 4 inside the landfill at concentrations between 0.1 and 5.0 ppm (139 µg/m3 and 6.9 × 10³ µg/m3). Sulphur compounds are one of the dominant chemical groups in raw landfill gas and H2S usually prevails over other sulfur compounds [10]. Concentrations of sulfur compounds in ambient air measured above different landfill surfaces/areas are generally below 1000 µg/m3 and the highest concentrations are mostly observed at the active working area or above uncovered waste surfaces. Of those gases measured above landfill surfaces, H2S also appears frequently in high concentrations up to 800 µg/m3, although abundant levels of carbon disulfide, DMS and DMDS are also found, sometimes even exceeding H2S concentrations and becoming the dominant compounds [29,30]. Kim et al. [31] measured concentrations of reduced sulfur compounds from vent pipes at six Korean landfills and found that H2S accounted for >90% of the sulfur-containing gases in landfill gas, whilst average concentrations ranged across several orders of magnitude, from 6.3 µg/m3 up to 3.8 × 10⁶ µg/m3. The low concentrations were measured at closed or old landfills, whereas young and active landfills were responsible for the higher concentrations ranging from hundreds of thousands to several millions [31].
Sampling point 1 and 2 were located near the sorting station, respectively in the area of the active cell, where the waste is handled (unloaded, leveled and compacted), until being covered with sterile material, during which gases can diffuse into the air. Sampling point 4 was located at the entrance gate, where the garbage trucks are weighed and checked, time during which the diesel exhaust gases can diffuse into the atmosphere in the area of the collection point. At sampling points 5 and 6, all samples registered a value of zero for hydrogen sulfide, which is relevant for the evaluation of the impact of the landfill on inhabited areas.
Ammonia (NH3) was detected only at sampling point 1, located near the sorting station in June, with values between 1.0 and 3.0 ppm (697 µg/m3 and 2090 µg/m3). Ammonia and amines are produced as a result of the degradation of organic contents in municipal solid waste, such as lipid- and protein-containing food and fruit waste, livestock and poultry waste or sewage sludge [32,33]. In Romania, the process of selective waste collection is deficient, so that recyclable waste is mixed with biodegradable waste and other types of waste, in the same transport vehicle. The high temperatures in June might have favored their rapid fermentation, which led to the accumulation and subsequent release of a larger amount of gas during the sorting process.
Relatively low concentrations of NH3 from passive vents were also reported at two Chinese landfills, 1500 µg/m3 and 10.7 µg/m3, respectively [32,34]. NH3 concentrations in ambient air above landfill surfaces have been reported at several sites, ranging between 103 and 4.0 × 10³ µg/m3 [35,36].
The presence of ammonia, similar to hydrogen sulfide, is explained by the fermentation process occurring due to high temperatures and the waste arriving at the landfill a few days after collection. Thus, from the analysis of the data obtained it can be concluded that the presence of ammonia in the detected concentrations does not affect the air quality in the inhabited area.
It is well known that measuring landfill trace gases with a single sampling technique is insufficient to describe the entire gas emissions from a landfill, because the concentrations vary with different sampling techniques and sampling points. In addition, direct measurements of trace gases from ambient air are easily influenced by meteorological parameters such as temperature, precipitation and atmospheric pressure [10,37]. In addition, the concentrations of bioaerosols in various landfills sections depends on meteorological conditions, on the distance from operational areas and waste management activities [38]. Therefore, a limitation of the present study was that the meteorological conditions (precipitation level, humidity and temperature) were monitored, but not included in the study and not correlated with the chemical and microbiological results.
The maximum quantity of bacterial load (1184 ± 1565 CFU/m3), but also a high concentration of fungal aerosols (308 ± 322 CFU/m3) were identified in sampling point 2, located at the entrance of the active cell. Similar findings were stated by other authors, mentioning that the maximum quantity of potential pathogenic bioaerosols was reported in the main operational area of the landfill site [39,40]. In addition, sampling point 4, located at the entrance gate for the garbage trucks, represented the peak for the fungal load (324 ± 398 CFU/m3). Likewise, it was mentioned that high traffic of vehicles carrying waste, waste unloading and levelling operation aerosolize the microbes present in the solid waste resulting in high concentrations of bioaerosols [41,42].
Bacterial and fungal counts where higher in the sampling points located inside the landfill and started to decrease in the sampling points located in the nearby areas, according to the distance, even if without statistical significance. This is further espoused by Vilavert et al. [43], who referred to the decrease in the bioaerosol concentration with the distance from the landfill sites.
Regarding the temporal variations of the bioaerosol concentrations, in the present study, the sampling period proved to be a significant factor in both the bacterial and fungal dynamics. Beginning with the second summer month (July) the bioaerosols levels started to increase till the mid-autumn (October) when they reached the highest values. Subsequently, during winter and spring, there was an important decrease. In the last years, Romania’s temperate-continental climate has been characterized by very dry summers, with temperatures often exceeding 35 degrees and also by very warm and long autumn seasons.
Most researchers from countries with temperate or continental climates reported higher fungal aerosols during the warm season compared to the cold season [22,44,45,46]. Cyprowski et al. [44] reported the highest concentration of total viable bacteria in summer (temperature range 10–29.1 °C), while the levels of gram-negative bacteria were highest in autumn (temperature range 0.8–10 °C) in Poland. Similarly, Fernanda et al. [45] analyzed the bioaerosol levels in landfill sites located in Brazil for all three seasons and observed highest concentrations of airborne bacteria in summer and fungi in spring. Madhwal et al. [22] also reported peak in fungal and bioaerosol concentrations during monsoon (temperature 29.14 ± 2.38 °C and RH 67.31 ± 8.64%), while winter (temperature 17.46 ± 3.0 °C and RH 34.83 ± 8.57%) witnessed a dip in the levels of bioaerosols released from Indian MSW landfill. Conversely, Huang et al. [47] reported higher concentrations of fungal and bacterial bioaerosol during winter in Taiwan as the temperature and relative humidity range in winter was 23–27 °C and 69–72%, respectively.
In the present study, the higher APC and TFC were encountered at the sampling points inside the landfill, mainly at sampling points 2 (located at the entrance of the active cell) and 4 (located at the entrance gate for the garbage trucks). It has been stated that high temperature with low wind velocity and relative humidity restricts the transport of bioaerosols to the short distance which can peak the concentration of bioaerosols in the landfill and adjoining areas [46]. In addition, higher temperature values, coupled with lower relative humidity, affect the protein, nucleic acid and phospholipid membrane of microbes, preventing their growth and proliferation [42], which may explain the decreasing trend of APC and TFC during the late spring and beginning of the summer (June).
According to recent studies, the bioaerosols released from the landfill sites commonly comprise bacterial species including Bacillus, Clavibacter, Corynebacterium, Curtobacterium, Micrococcus, Pseudomonas and Staphylococcus, while fungal types include Cladosporium Alternaria, Penicillium and Aspergillus [20,39,40,42,48].
Most experts suggest that microscopic fungi and their spores are an important group of microbial air pollutants in landfills. Thus, in the air above and around the landfill, a large number of spores and hyphae fragments of fungi were isolated from the genera Penicillium, Cladosporium, Aspergillus, Alternaria, Fusarium, etc., but also yeasts such as Candida, which play a major pathological role [49,50].
The diversity of the identified fungal species depended on climatic conditions. Thus, species of the Aspergillus genus, which grow best in warm, humid conditions, were identified most frequently and consistently in the sorting area, an area that provides these conditions.

5. Conclusions

As long as the municipal waste landfills operate in optimal parameters and compliance with the legal framework, there is no strong evidence for environmental and public health risk. Knowing that Romania is facing the impossibility of properly managing environmental issues and those associated with waste management, it is important to constantly assess whether landfills can be an additional source of chemical and microbiological air pollution.

Author Contributions

Conceptualization, I.N.; methodology, D.Z. and E.T.; validation, K.I.; formal analysis, G.C.; investigation, D.Z. and A.T.; resources, M.P.; data curation, G.C.; writing—original draft preparation, I.B. and M.P.; writing—review and editing, K.I.; visualization, I.B.; supervision, E.T. All authors have read and agreed to the published version of the manuscript.

Funding

This research received no external funding.

Institutional Review Board Statement

Not applicable.

Informed Consent Statement

Not applicable.

Data Availability Statement

All data generated or analysed during this study are included in the submitted version of the manuscript.

Acknowledgments

The authors gratefully acknowledge the support of Banat’s University of Agricultural Sciences and Veterinary Medicine „King Michael I of Romania” from Timișoara and Research Institute for Biosecurity and Bioengineering Timișoara, Romania supporting the paper publication from the own funds.

Conflicts of Interest

The authors declare no conflict of interest.

References

  1. Giusti, L. A review of waste management practices and their impact on human health. Waste Manag. 2009, 29, 2227–2239. [Google Scholar] [CrossRef] [PubMed]
  2. Forastiere, F.; Badaloni, C.; De Hoogh, K.; Von Kraus, M.K.; Martuzzi, M.; Mitis, F.; Palkovicova, L.; Porta, D.; Preiss, P.; Ranzi, A.; et al. Health impact assessment of waste management facilities in three European countries. Environ. Health 2011, 10, 53. [Google Scholar] [CrossRef] [PubMed] [Green Version]
  3. Mattiello, A.; Chiodini, P.; Bianco, E.; Forgione, N.; Flammia, I.; Gallo, C.; Pizzuti, R.; Panico, S. Health effects associated with the disposal of solid waste in landfills and incinerators in populations living in surrounding areas: A systematic review. Int. J. Public Health 2013, 58, 725–735. [Google Scholar] [CrossRef]
  4. Kaza, S.; Yao, L.C.; Bhada-Tata, P.; Van Woerden, F. What a Waste 2.0: A Global Snapshot of Solid Waste Management to 2050; World Bank Publications: Washington, DC, USA, 2018. [Google Scholar]
  5. Directive 2008/98/EC of the European Parliament and of the Council of 19 November 2008 on Waste and Repealing Certain Directives. Available online: https://eur-lex.europa.eu/legal-content/EN/TXT/PDF/?uri=CELEX:32008L0098&qid=1640251175490&from=EN (accessed on 15 December 2021).
  6. Burkowska, A.; Swiontek-Brzezinska, M.; Kalwasińska, A. Impact of the municipal landfill site on microbiological contamination of air. In Contemporary Problems of Management and Environmental Protection. Some Aspects of Environmental Impact of Waste Dumps. 2011, Volume 9, pp. 71–87. Available online: http://uwm.edu.pl/environ/vol09/vol09_chapter05.pdf (accessed on 1 December 2021).
  7. Elliott, P.; Richardson, S.; Abellan-Andres, J.J.; Thomson, A.; De Hoogh, C.; Jarup, L.; Briggs, D.J. Geographic density of landfill sites and risk of congenital anomalies in England. Occup. Environ. Med. 2008, 66, 81–89. [Google Scholar] [CrossRef] [PubMed] [Green Version]
  8. Aatamila, M.; Verkasalo, P.K.; Korhonen, M.J.; Suominen, A.L.; Hirvonen, M.-R.; Viluksela, M.K.; Nevalainen, A. Odour annoyance and physical symptoms among residents living near waste treatment centres. Environ. Res. 2011, 111, 164–170. [Google Scholar] [CrossRef] [PubMed]
  9. Heaney, C.D.; Wing, S.; Campbell, R.L.; Caldwell, D.; Hopkins, B.; Richardson, D.; Yeatts, K. Relation between malodor, ambient hydrogen sulfide, and health in a community bordering a landfill. Environ. Res. 2011, 111, 847–852. [Google Scholar] [CrossRef] [Green Version]
  10. Duan, Z.; Scheutz, C.; Kjeldsen, P. Trace gas emissions from municipal solid waste landfills: A review. Waste Manag. 2021, 119, 39–62. [Google Scholar] [CrossRef]
  11. US EPA. Emission Factor Documentation for AP-42 Section 2.4 Municipal Solid Waste Landfills Revised; Research Triangle Park: Durham, NC, USA, 1997.
  12. Canzano, S.; Salvestrini, S.; Iovino, P. Emission rate of non-methane volatile organic compounds from biodegradable domestic waste. Fresenius Environ. Bull. 2010, 19, 88–93. [Google Scholar]
  13. Blais-Lecours, P.; Perrott, P.; Duchaine, C. Non-culturable bioaerosols in indoor settings: Impact on health and molecular approaches for detection. Atmos. Environ. 2015, 110, 45–53. [Google Scholar] [CrossRef]
  14. Nair, A.T. Bioaerosols in the landfill environment: An overview of microbial diversity and potential health hazards. Aerobiologia 2021, 37, 185–203. [Google Scholar] [CrossRef]
  15. Pahren, H.R.; Clark, C.S. Microorganisms in municipal solid waste and public health implications. Crit. Rev. Environ. Control. 2009, 17, 187–228. [Google Scholar] [CrossRef]
  16. Gaspar, C.M.; Cocora, Z.M.; Brudiu, I.; Lazarescu, C.F.; Popovici, R.A.; Tigmeanu, C.V.; Tibru, I. Absorbent Food PADS from Meat Packages-Potential Source of Contamination. Rev. Chim. 2019, 70, 784–789. [Google Scholar] [CrossRef]
  17. Morar, A.; Sala, C.; Imre, K. Occurrence and antimicrobial susceptibility of Salmonella isolates recovered from the pig slaughter process in Romania. J. Infect. Dev. Ctries. 2015, 9, 99–104. [Google Scholar] [CrossRef] [Green Version]
  18. Tîrziu, E.; Bărbălan, G.; Morar, A.; Herman, V.; Cristina, R.T.; Imre, K. Occurrence and Antimicrobial Susceptibility Profile of Salmonella spp. in Raw and Ready-To-Eat Foods and Campylobacter spp. in Retail Raw Chicken Meat in Transylvania, Romania. Foodborne Pathog. Dis. 2020, 17, 479–484. [Google Scholar] [CrossRef] [PubMed] [Green Version]
  19. Imre, K.; Herman, V.; Morar, A. Scientific Achievements in the Study of the Occurrence and Antimicrobial Susceptibility Profile of Major Foodborne Pathogenic Bacteria in Foods and Food Processing Environments in Romania: Review of the Last Decade. BioMed Res. Int. 2020, 2020, 5134764. [Google Scholar] [CrossRef] [PubMed]
  20. Kalwasińska, A.; Burkowska, A.; Brzezinska, M.S. Exposure of Workers of Municipal Landfill Site to Bacterial and Fungal Aerosol. CLEAN-Soil Air Water 2013, 42, 1337–1343. [Google Scholar] [CrossRef]
  21. Njoku, P.O.; Edokpayi, J.N.; Odiyo, J.O. Health and Environmental Risks of Residents Living Close to a Landfill: A Case Study of Thohoyandou Landfill, Limpopo Province, South Africa. Int. J. Environ. Res. Public Health 2019, 16, 2125. [Google Scholar] [CrossRef] [Green Version]
  22. Madhwal, S.; Prabhu, V.; Sundriyal, S.; Shridhar, V. Distribution, characterization and health risk assessment of size fractionated bioaerosols at an open landfill site in Dehradun, India. Atmos. Pollut. Res. 2019, 11, 156–169. [Google Scholar] [CrossRef]
  23. European Commission. The Environmental Implementation Review 2019—Country Report Romania. Brussels, 4.4.2019. SWD (2019) 130 Final. European Union. 2019. Available online: https://ec.europa.eu/environment/eir/pdf/report_ro_en.pdf (accessed on 15 December 2021).
  24. European Commission. Applying EU Law. Infringement Decisions. 2021. Available online: https://ec.europa.eu/atwork/applying-eu-law/infringements-proceedings/infringement_decisions/?lang_code=en (accessed on 15 December 2021).
  25. INS-Direcţia Judeţeană de Statistică ILFOV. 2021. Available online: https://ilfov.insse.ro/ (accessed on 15 December 2021).
  26. United States Department of Labor. Occupational Safety and Health Administration (OSHA). Occupational Safety and Health Standards—Respiratory Protection, Standard no. 1910.134. Available online: https://www.osha.gov/laws-regs/regulations/standardnumber/1910/1910.134 (accessed on 15 December 2021).
  27. Lee, U.; Han, J.; Wang, M. Evaluation of landfill gas emissions from municipal solid waste landfills for the life-cycle analysis of waste-to-energy pathways. J. Clean. Prod. 2017, 166, 335–342. [Google Scholar] [CrossRef]
  28. Lindsey, R. Climate Change: Atmospheric Carbon Dioxide. Available online: https://www.climate.gov/news-features/understanding-climate/climate-change-atmospheric-carbon-dioxide (accessed on 15 December 2021).
  29. Yue, D.; Han, B.; Sun, Y.; Yang, T. Sulfide emissions from different areas of a municipal solid waste landfill in China. Waste Manag. 2013, 34, 1041–1044. [Google Scholar] [CrossRef]
  30. Song, S.-K.; Shon, Z.-H.; Kim, K.-H.; Kim, S.C.; Kim, Y.-K.; Kim, J.-K. Monitoring of atmospheric reduced sulfur compounds and their oxidation in two coastal landfill areas. Atmos. Environ. 2007, 41, 974–988. [Google Scholar] [CrossRef]
  31. Kim, K.-H.; Baek, S.O.; Choi, Y.-J.; Sunwoo, Y.; Jeon, E.-C.; Hong, J.H. The Emissions of Major Aromatic Voc as Landfill Gas from Urban Landfill Sites in Korea. Environ. Monit. Assess. 2006, 118, 407–422. [Google Scholar] [CrossRef] [PubMed]
  32. Fang, J.-J.; Yang, N.; Cen, D.-Y.; Shao, L.-M.; He, P.-J. Odor compounds from different sources of landfill: Characterization and source identification. Waste Manag. 2012, 32, 1401–1410. [Google Scholar] [CrossRef] [PubMed]
  33. Lou, Z.; Wang, M.; Zhao, Y.; Huang, R. The contribution of biowaste disposal to odor emission from landfills. J. Air Waste Manag. Assoc. 2015, 65, 479–484. [Google Scholar] [CrossRef]
  34. Cheng, Z.; Sun, Z.; Zhu, S.; Lou, Z.; Zhu, N.; Feng, L. The identification and health risk assessment of odor emissions from waste landfilling and composting. Sci. Total Environ. 2018, 649, 1038–1044. [Google Scholar] [CrossRef]
  35. Fang, J.; Lü, F.; Zhang, H.; Shao, L.; He, P. Odor compounds released from different zones of two adjacent waste treatment facilities: Interactive influence and source identification. J. Air Waste Manag. Assoc. 2015, 65, 1446–1455. [Google Scholar] [CrossRef] [Green Version]
  36. Lim, J.-H.; Cha, J.-S.; Kong, B.-J.; Baek, S.-H. Characterization of odorous gases at landfill site and in surrounding areas. J. Environ. Manag. 2018, 206, 291–303. [Google Scholar] [CrossRef] [PubMed]
  37. Ko, J.H.; Xu, Q.; Jang, Y.-C. Emissions and Control of Hydrogen Sulfide at Landfills: A Review. Crit. Rev. Environ. Sci. Technol. 2015, 45, 2043–2083. [Google Scholar] [CrossRef]
  38. Breza-Boruta, B. The assessment of airborne bacterial and fungal contamination emitted by a municipal landfill site in Northern Poland. Atmos. Pollut. Res. 2016, 7, 1043–1052. [Google Scholar] [CrossRef]
  39. Kalwasińska, A.; Burkowska, A. Municipal landfill sites as sources of microorganisms potentially pathogenic to humans. Environ. Sci. Process. Impacts 2013, 15, 1078–1086. [Google Scholar] [CrossRef]
  40. Pagalilauan, H.A.M.; Paraoan, C.E.M.; Vital, P.G. Detection of pathogenic bioaerosols and occupational risk in a Philippine landfill site. Arch. Environ. Occup. Health 2017, 73, 107–114. [Google Scholar] [CrossRef] [PubMed]
  41. Breza-Boruta, B. Bioaerosols of the municipal waste landfill site as a source of microbiological air pollution and health hazard. Ecol. Chem. Eng. A 2012, 19, 851–862. [Google Scholar] [CrossRef]
  42. Schlosser, O.; Robert, S.; Debeaupuis, C. Aspergillus fumigatus and mesophilic moulds in air in the surrounding environment downwind of non-hazardous waste landfill sites. Int. J. Hyg. Environ. Health 2016, 219, 239–251. [Google Scholar] [CrossRef]
  43. Vilavert, L.; Nadal, M.; Figueras, M.J.; Domingo, J.L. Volatile organic compounds and bioaerosols in the vicinity of a municipal waste organic fraction treatment plant. Human health risks. Environ. Sci. Pollut. Res. 2011, 19, 96–104. [Google Scholar] [CrossRef] [PubMed]
  44. Cyprowski, M.; Ławniczek-Wałczyk, A.; Gołofit-Szymczak, M.; Frączek, K.; Kozdrój, J.; Górny, R. Bacterial aerosols in a municipal landfill environment. Sci. Total Environ. 2018, 660, 288–296. [Google Scholar] [CrossRef]
  45. Wikuats, C.F.H.; Duarte, E.H.; Prates, K.V.M.C.; Janiaski, L.L.L.; Gabriel, B.D.O.; Molina, A.D.C.; Martins, L.D. Assessment of airborne particles and bioaerosols concentrations in a waste recycling environment in Brazil. Sci. Rep. 2020, 10, 14812. [Google Scholar] [CrossRef]
  46. Frączek, K.; Kozdrój, J.; Górny, R.; Cyprowski, M.; Gołofit-Szymczak, M. Fungal air contamination in distinct sites within a municipal landfill area. Int. J. Environ. Sci. Technol. 2017, 14, 2637–2648. [Google Scholar] [CrossRef] [Green Version]
  47. Huang, C.-Y.; Lee, C.-C.; Li, F.-C.; Ma, Y.-P.; Su, H.-J.J. The seasonal distribution of bioaerosols in municipal landfill sites: A 3-yr study. Atmos. Environ. 2002, 36, 4385–4395. [Google Scholar] [CrossRef]
  48. Hameed, A.A.A.; Habeebuallah, T.; Mashat, B.; Elgendy, S.; Elmorsy, T.H.; Elserougy, S. Airborne fungal pollution at waste application facilities. Aerobiologia 2015, 31, 283–293. [Google Scholar] [CrossRef]
  49. Allmers, H.; Huber, H.; Baur, X. Two year follow-up of a garbage collector with allergic bronchopulmonary aspergillosis (ABPA). Am. J. Ind. Med. 2000, 37, 438–442. [Google Scholar] [CrossRef]
  50. Candela, S.; Ranzi, A.; Bonvicini, L.; Baldacchini, F.; Marzaroli, P.; Evangelista, A.; Luberto, F.; Carretta, E.; Angelini, P.; Sterrantino, A.F.; et al. Air Pollution from Incinerators and Reproductive Outcomes: A multisite study. Epidemiology 2013, 24, 863–870. [Google Scholar] [CrossRef] [PubMed]
Figure 1. Vidra landfill and sampling points-spatial view (left) and Ilfov county (right).
Sustainability 14 00156 g001
Figure 2. Average oxygen values (%) at the sampling points.
Sustainability 14 00156 g002
Figure 3. Average oxygen values (%) during the sampling period.
Sustainability 14 00156 g003
Figure 4. Average values of carbon dioxide (ppm) at the sampling points.
Sustainability 14 00156 g004
Figure 5. Average values of carbon dioxide (ppm) during the sampling period.
Sustainability 14 00156 g005
Figure 6. Average values of the aerobic plate count (APC) at the sampling points (mean + 1 SD).
Sustainability 14 00156 g006
Figure 7. Average values of the aerobic plate count (APC) during the sampling period (mean + 1 SD).
Sustainability 14 00156 g007
Figure 8. Average values of the total fungal count (TFC) at the sampling points (mean + 1 SD).
Sustainability 14 00156 g008
Figure 9. Average values of the total fungal count (TFC) during the sampling period (mean + 1 SD).
Sustainability 14 00156 g009
Table 1. Sensor properties and accuracy.
Sensor NameRange/Detection LimitsAccuracy Over Full Measurement and Temperature Ranges
Temperature RangeAccuracy
O2
(electrochemical)
0–30% vol−20 °C to 55 °C±0.8% vol
CO2
(infrared)
0–5%−20 °C to 55 °C±15.0%
CH4
(infrared)
0–100% LEL−20 °C to 55 °C±15.0%
NH3
(electrochemical)
0 to 500 ppm−20 °C to 40 °C±15.0%
H2S
(electrochemical)
0 to 500 ppm−20 °C to 55 °C±15.0%
CO
(electrochemical)
0 to 1500 ppm−20 °C to 55 °C±15.0%
Publisher’s Note: MDPI stays neutral with regard to jurisdictional claims in published maps and institutional affiliations.

