
Enabling Progress in Developing Economies: A Novel Hybrid Decision-Making Model for Green Technology Planning


1
School of Business Administration, Al Akhawyan University, Ifrane Avenue Hassan II, P.O. Box 104, Ifrane 53 000, Morocco
2
Donahue Graduate School of Business, Duquesne University, 820 Rockwell Hall, 600 Forbes Avenue, Pittsburg, PA 15252, USA
3
Industrial Engineering and Management, The Lappeenranta-Lahti University of Technology, P.O. Box 20, FI-53851 Lappeenranta, Finland
4
Department of Economia Aziendale, University G. d’Annuzio Chieti-Pescara, 66100 Chieti, Italy
*
Author to whom correspondence should be addressed.
Sustainability 2022, 14(1), 258; https://0-doi-org.brum.beds.ac.uk/10.3390/su14010258
Submission received: 2 December 2021
/
Revised: 20 December 2021
/
Accepted: 23 December 2021
/
Published: 27 December 2021
(This article belongs to the Special Issue Green Technologies towards Cleaner Production and Sustainable Development)
Abstract
:Green technologies play an essential role in designing and developing sustainable and environmental strategies at a country level. With a growing emphasis on green technology strategies in strategic decision making, there is an opportunity for developing and implementing strategies to accelerate green technologies in developing economies. Therefore, this study develops an integrated strategic framework based on Strengths, Weaknesses, Opportunities, and Threats (SWOT) for effective green technology planning. The SWOT approach scans internal and external factors and sub-factors essential for green technology planning in Pakistan. Subsequently, the Grey Analytical Hierarchical Process (GAHP) method is employed to compute weights of twenty-one subfactors. Finally, Grey Technique for Order Performance by Similarity to Ideal Solution (GTOPSIS) is used to prioritize eighteen strategies developed for sustainable green technology planning. Results reveal that high productivity potential in the agriculture sector, less foreign investment due to terrorism and security issues, decreasing the cost of green technologies, and the opportunity to build a positive image are key sub-factors for strategic green technology planning. In contrast, improving the security situation in the country to attract foreign direct investment, fewer taxes and duties on import of green technology and lenient rules for local business in transition, and plans and programs to promote green technology in the agriculture sector are observed as optimal strategies. This study is the first to propose a systematic, integrated framework for sustainable green technology planning in Pakistan. Our study fills a gap in the strategic planning and implementation process and provides pathways for policymakers in addressing impediments when implementing green technology planning.
1. Introduction
Green technology (GT) is a significant parameter in attaining regional and international sustainable development goals (SDGs). It also helps to minimize the environmental impacts of economic growth and boost social progress [1]. There is a promising future for green technology to meet the need for economic prosperity in developing countries. However, overlapping social and environmental factors might affect green technology deployment within a given country. Hottenrott et al. [2] discovered that technology’s feasibility and potential impact of economic and environmental factors should be addressed before implementing green technologies. While humans are striving to increase productivity and economic growth, these goals have polluted the water, air, and global ecological systems. In such circumstances, green economic transitions are necessary for stabilizing natural systems as developing countries consider their vulnerability to environmental hazards [3]. For the sake of this study, we focus on a developing country context and Pakistan.
Solow [4] presented an economic theory for technological change and impacts on a production function. This theory has parameters for technological upgrades considering managerial and system factors in an organization. More recently, a green productivity paradigm now alters our awareness of technological change and production functions. As a result, we now have more awareness of sustainable development while highlighting the importance of merging environmental and energy factors with economic development models. This awareness can help ensure improved sustainability and development [5].
Technological advancements promote human development and accelerates economic development in society [6]. Green innovations protect the environment by providing safe means to utilize energy and resources [7]. When combined, the deployment of green technology reduces environmental impacts and increases productivity [8]. Therefore, economic and social development differs across regions, requiring unique, sustainable development and strategic investment plans [9]. In recent years, few countries took the initiative to promote green growth development with national and regional investment banks. Such investment platforms boost economic growth while ensuring environmental sustainability. The UK’s Green Investment Bank and Austria’s Clean Energy Finance Corporation are examples of such investment banks [10]. OECD has been taking the initiative to promote green investment banks. At the time of developing this study, there are twelve functioning banks. Recent research discovered that such investment banks attract a great deal of private investments for funding green infrastructure and technological innovation [11].
In recent years, Pakistan’s government has established a GT program to provide investment to encourage and facilitate green technology development and transition. This investment program is an initiative to implement and comply with the Paris Agreement and UN’s 2030 agenda. The Ministry of Science and Technology of Pakistan and the Ministry of Planning and Development of Pakistan designed this program to facilitate technology transition in the country. Green investment banks are responsible for funding green technology directly with the sole objective to provide a green solution to transitioning customers and support for this process.
Despite the programs in place, the adoption and deployment of GT faces many hurdles [12,13]. Such barriers can be the result of weak state policies [14], an inappropriately aligned market [15], a lack of understanding of the phenomenon [16], and the inability to find proper financial resources [17,18]. In many developing countries, there are no strategies developed for sustainable green technology. The absence of a proper categorization system creates an ambiguous situation in the selection of green technologies. GT is a dynamic concept; thus, the absence of a proper planning system can result in confusion around this technology and its economic impacts. Although various countries use GTs, the strategic planning process is not consistent across countries or regions, hindering the GT transfer process at an international level. In order to better promote global green technological transfer, it is crucial to establish a framework for investment banks, consumers, investors, and technology providers in order to understand the important aspect of GT opportunity.
One of the objectives of green growth is to promote ecofriendly products in relevant countries and industries and to help protect the environment from harmful emissions. Hottenrott et al. [2] stressed the importance of GT, the adoption process, and efficient energy resources to help enterprises with this transition. A green technological transition is not the obligation of one entity in a country. Public and private sectors need to collaborate to achieve technological advancement and ensure economic stability. Zhang and Li [19] suggested that political regimes influence green innovation and green investments. Thus, green growth and green technology require substantial support from central authorities in order to flourish.
In Pakistan, the GT growth program has three main goals: First, to comply with and execute the Paris agreement and 2030 agenda at the national level; second, effective collaboration between the ministry of technology and science and the ministry of finance promotes green-tech transfer at the national and international levels; third, provide opportunities for the technology to advance green technologies in the country. As an initiative, green technology investment was established as part of a national plan to promote Pakistan’s innovative practices. In 2019, the Ministry of Science and Technology of Pakistan highlighted the importance of GT in speeding up the development of innovative mechanisms for green technology with a market-oriented approach [20].
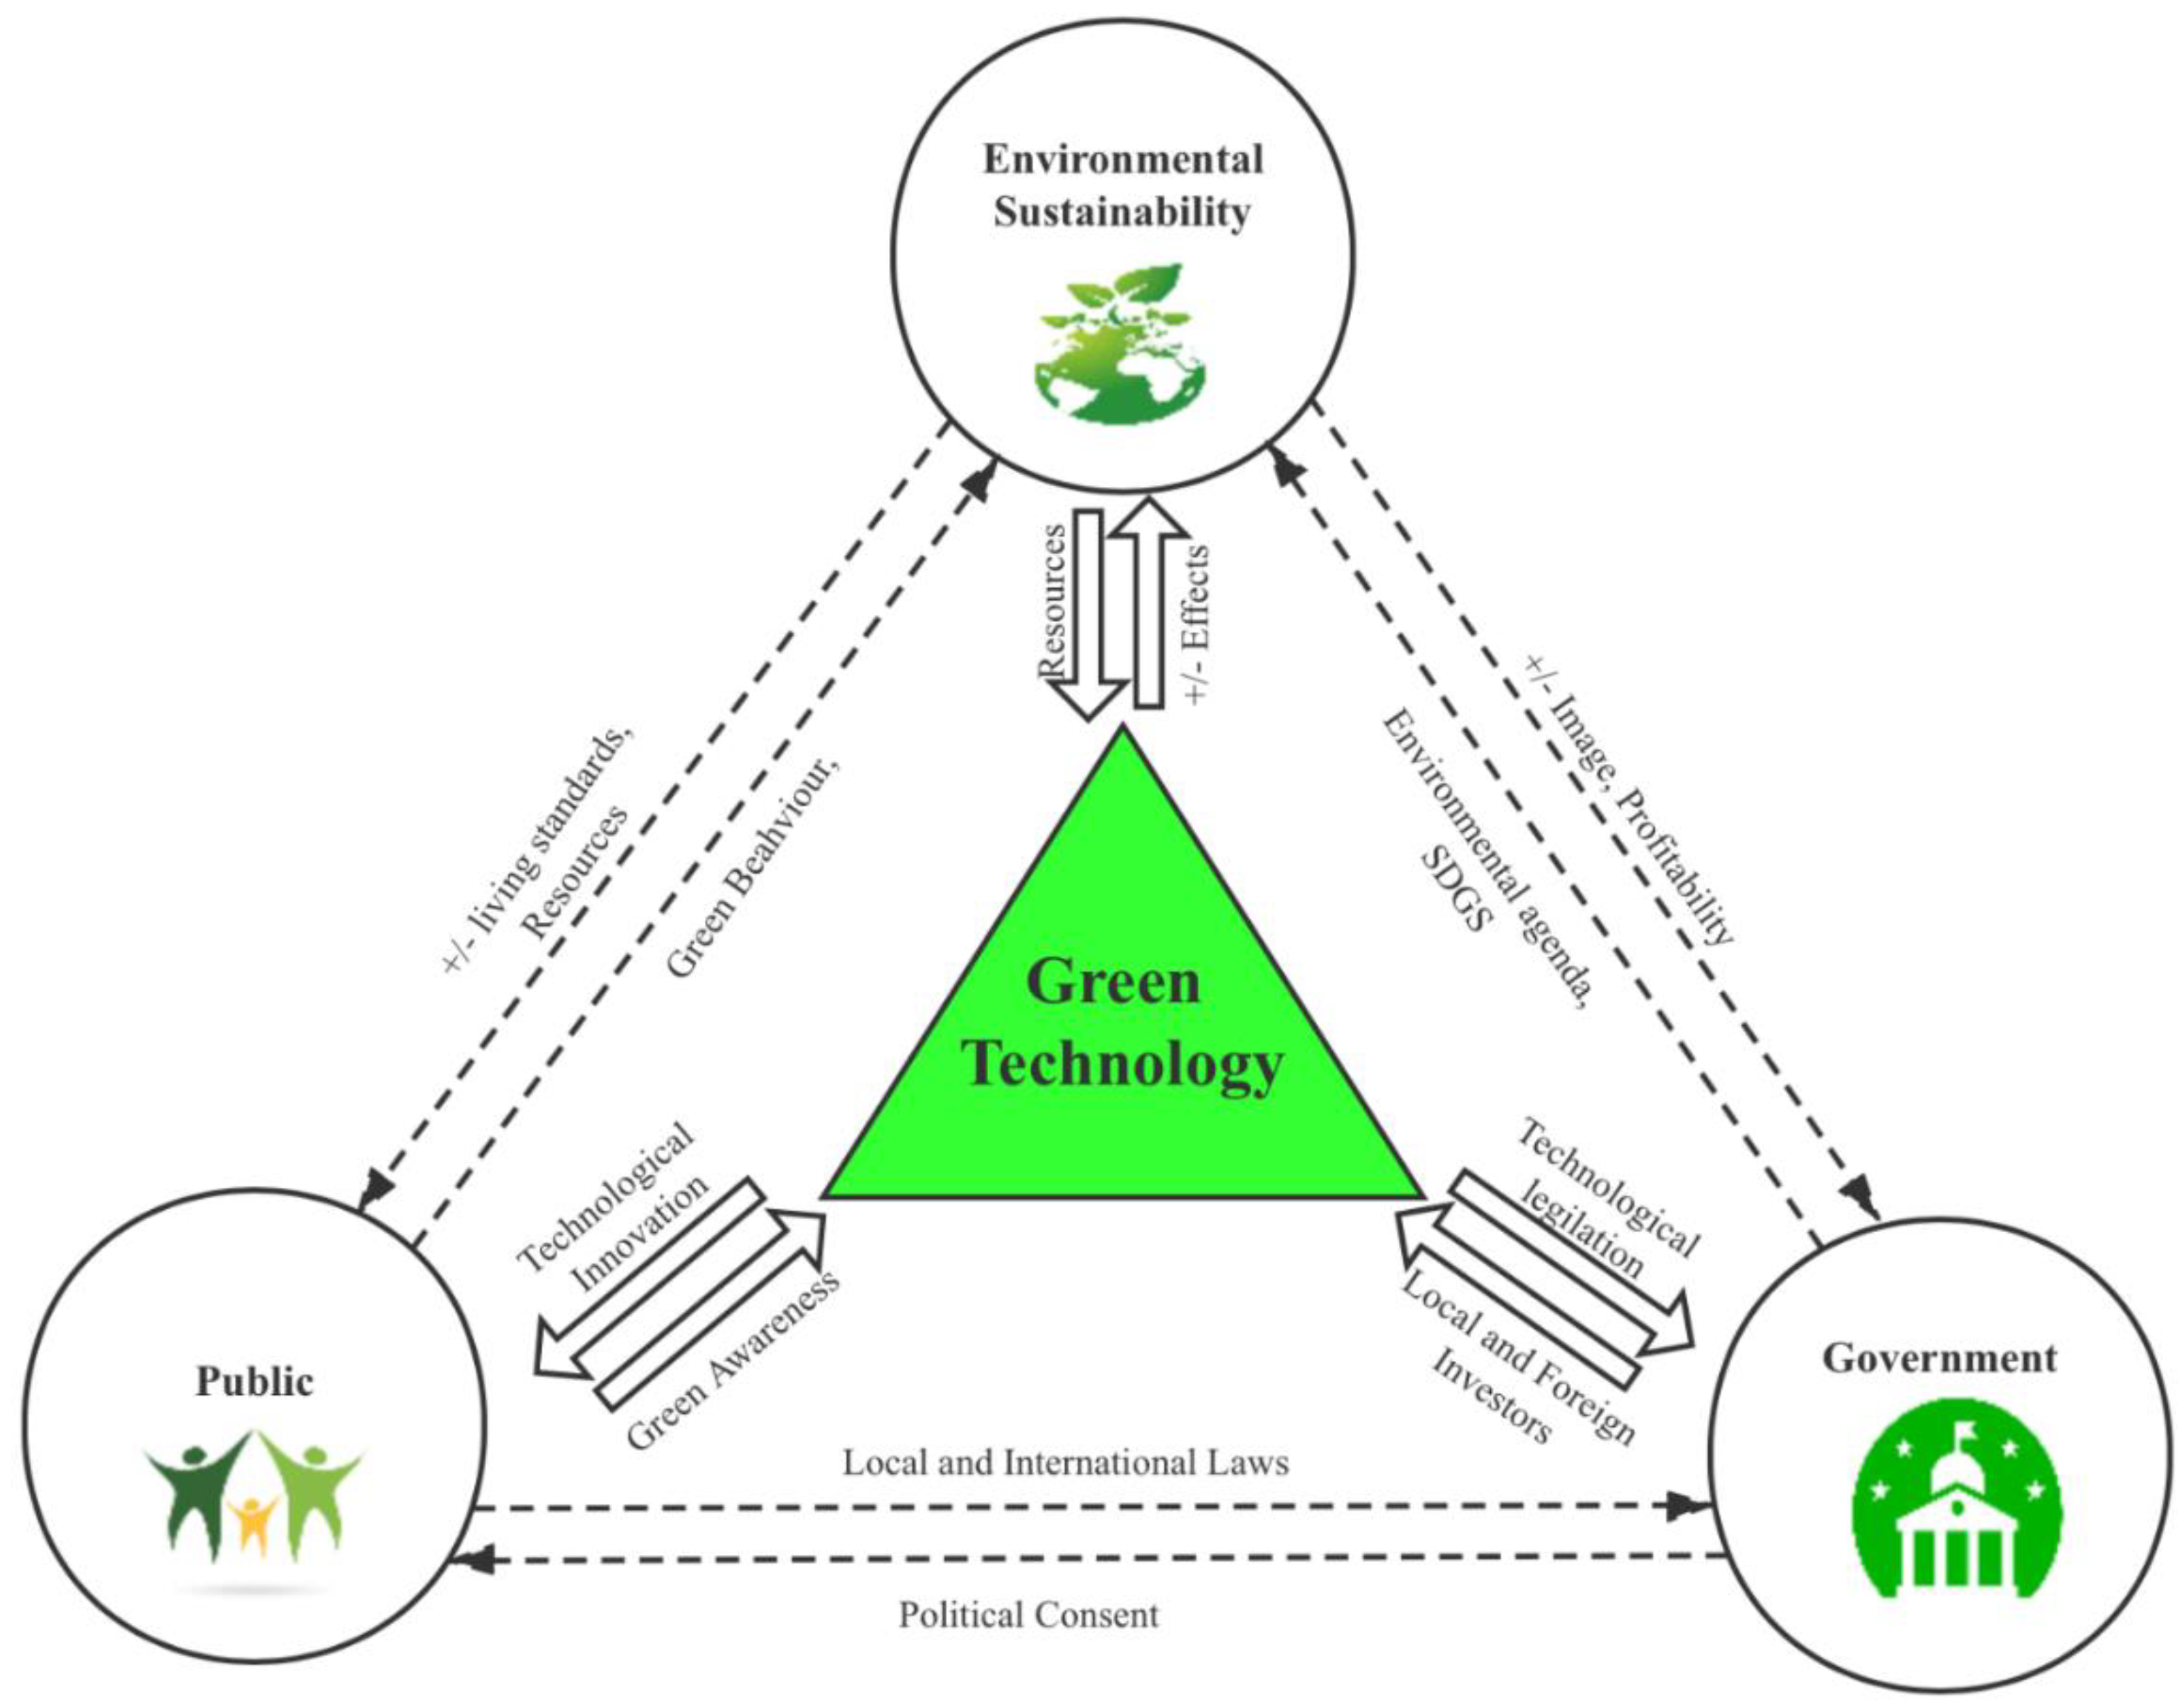
GT plays a significant role in renewable innovation and investment. Pakistan as a developing country that is transitioning to green technologies, but there is no strategic planning framework to understand the process and technologies involved. Therefore, we observe a significant research gap in the context of this country that can be applied to other countries. The primary agenda of this research study is to fill this gap. This study’s main contribution is to provide an integrated GT strategies framework for sustainable planning at the country level. Given the growing importance of integrated management (see, for example, Sroufe [21]), we have developed an integrated framework for GT strategies for the planning process presented in Figure 1.
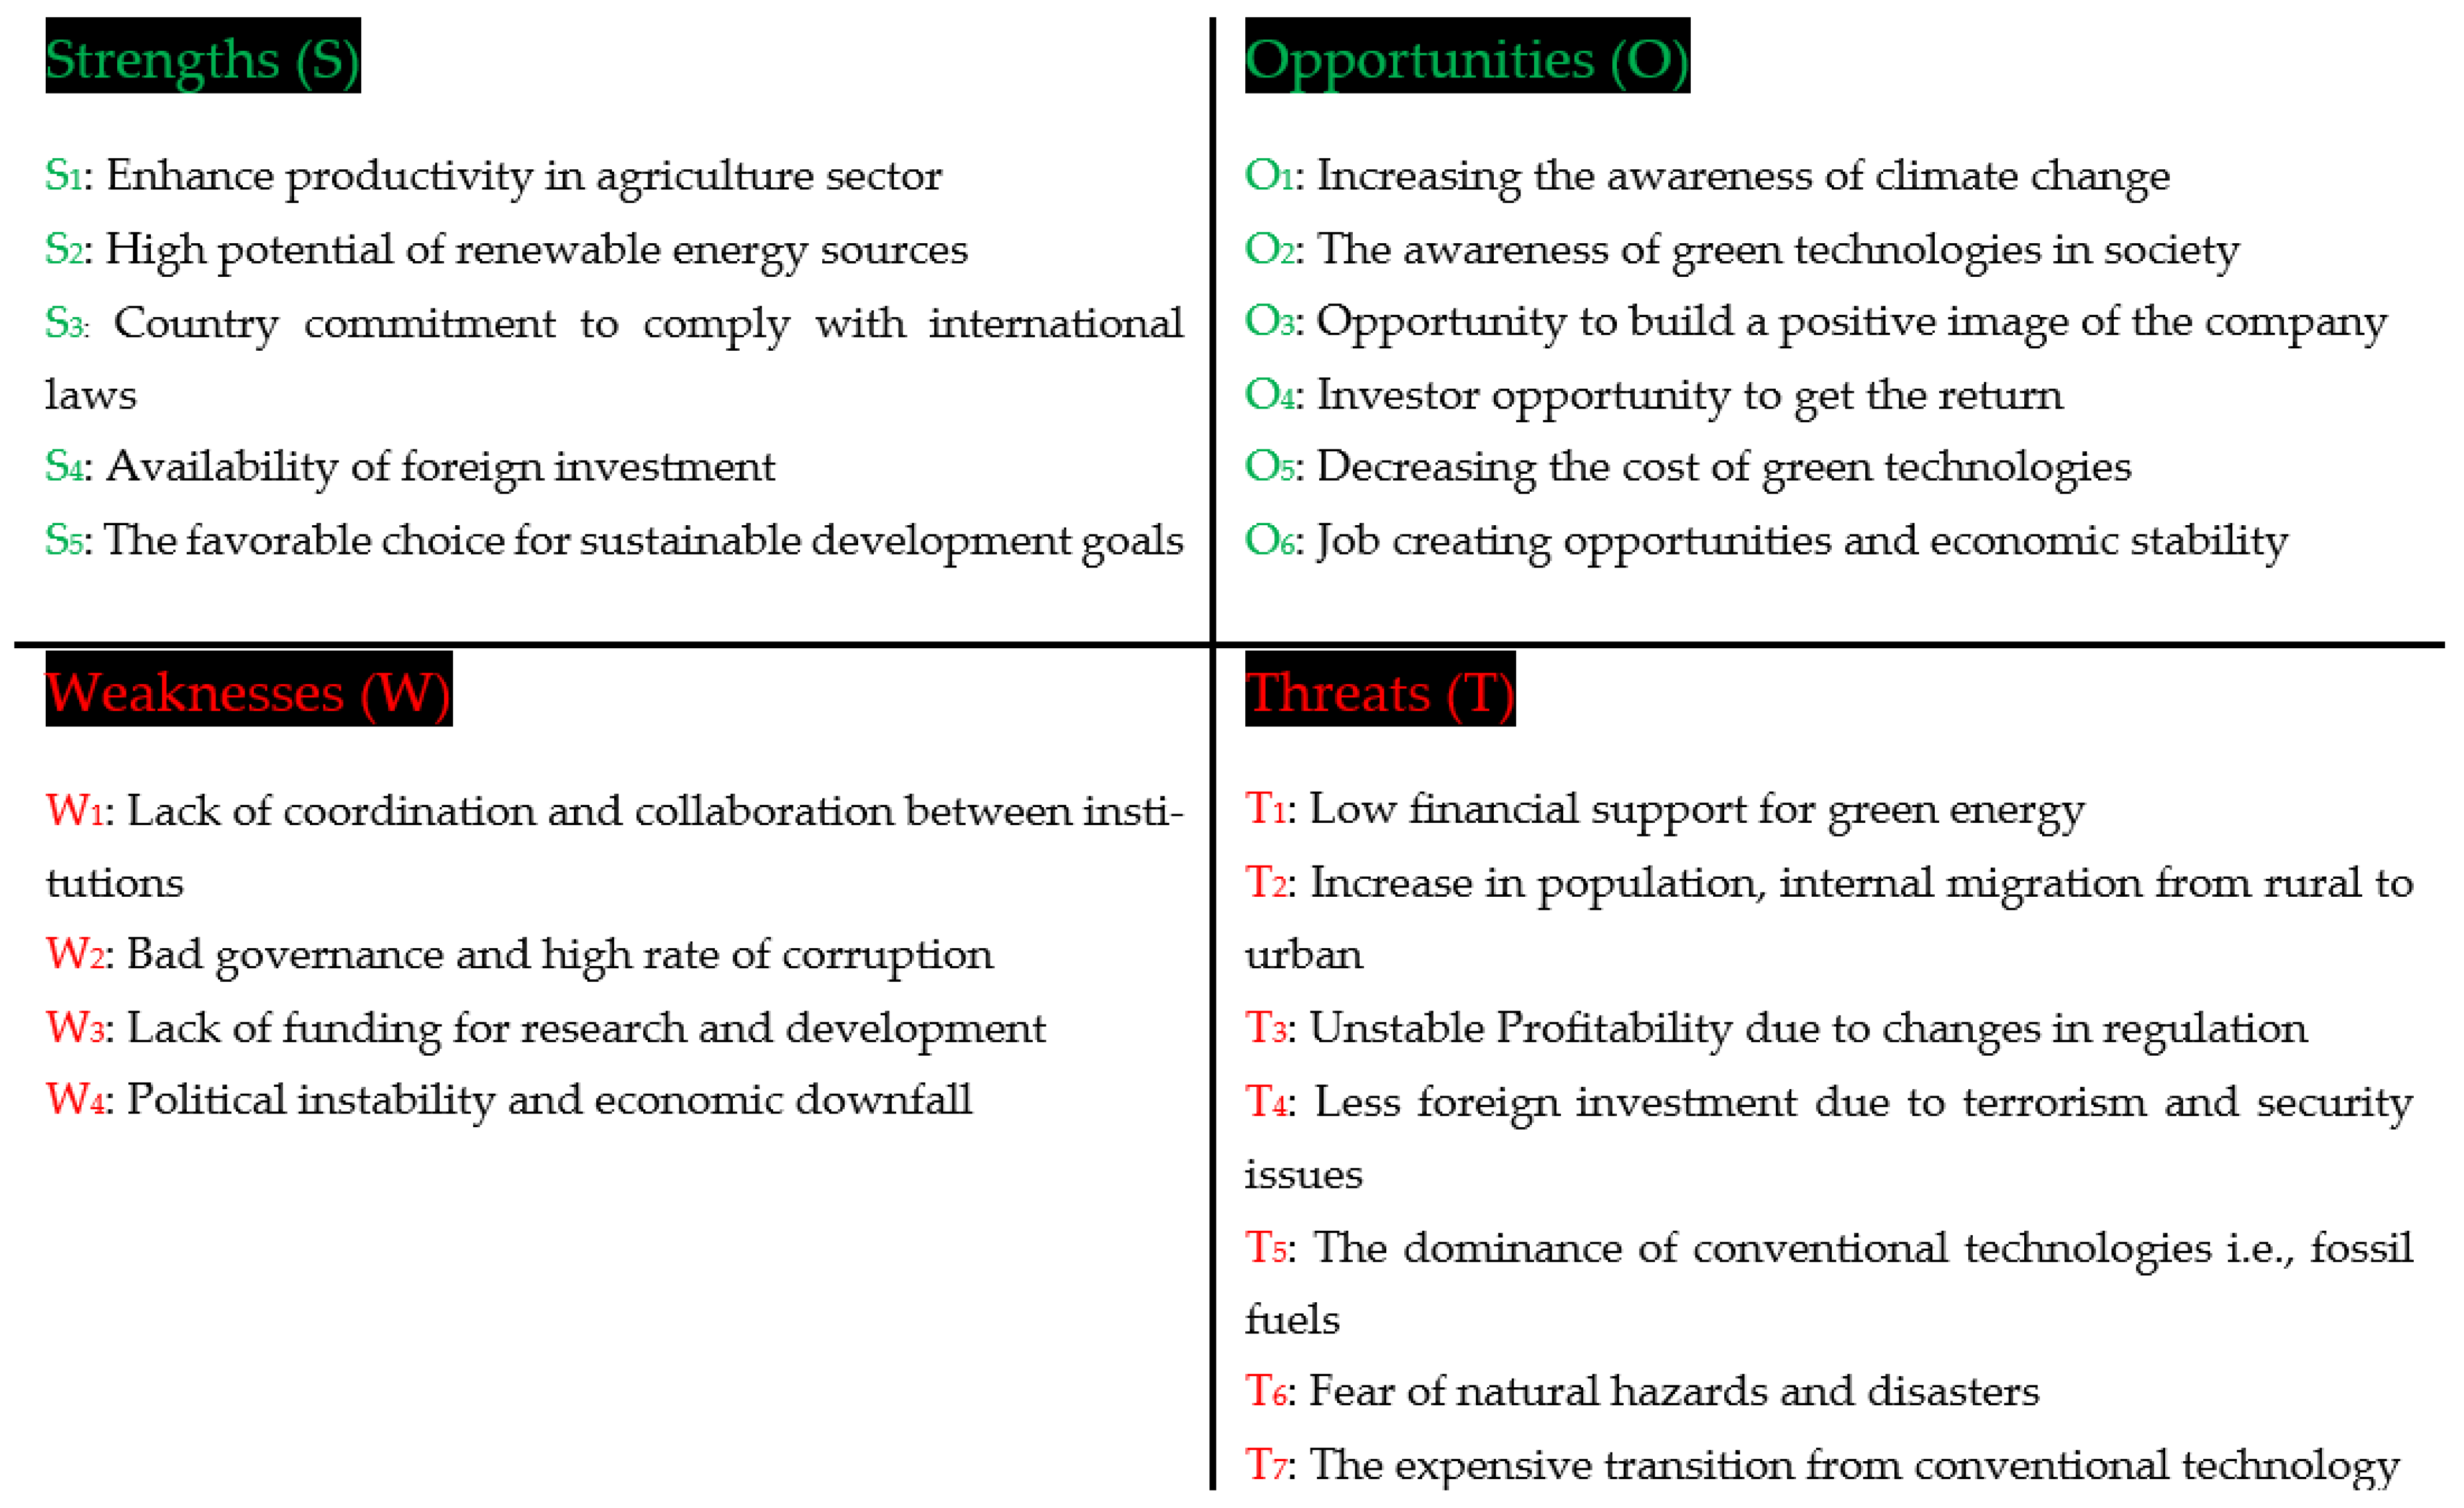
The integrated framework helps to understand how GT helps develop environmental sustainability and improved living standards. It also provides valuable information for stakeholders and investors to understand the concept of green technologies. In this study, we utilize a strategic SWOT (Strengths, Weaknesses, Opportunity, and Threats) approach to identify internal and external factors involved in strategic planning for green technology. Here, we develop and evaluate green technologies strategies according to their relevance for green economic growth in Pakistan. This study’s outcomes include but are not limited to the following: (1) helping policymakers devise more appropriate and systematic policies to understand and address green technologies; (2) the literature reviewed in this study helps develop a new mode of inquiry and will attract more researchers to study this domain; and (3) the theoretical framework developed in this study can serve as a guide to relevant studies in other country contexts. Additionally, this study’s insights can help enable investments in green technology and lay the foundation for more sustainable development in Pakistan.
Our study aims to provide significant contributions to the GT literature. First, the literature lacks understanding as to the collective factors of GT implementations and how they enhance strategic decision making to leverage resources in exploiting opportunities to achieve sustainable development objectives. While previous literature has examined the establishment of evaluation index weight of GT innovation in the manufacturing industry [22], little to no research has identified key opportunities and threats in implementing the GT planning process. Second, previous researchers suggested that possible identification barriers in GT adoption and transformation are necessary to develop a policy framework for overcoming impediments to facilitate decision making [23]. Our study narrows the gap between strategic planning and implementation process by providing pathways for policymakers that address impediments in implementing GT initiatives successfully. Third, a fundamental challenge to the organization is a lack of understanding of potential GT adoption opportunities and organizations’ transformation. This study is the first study to develop an integrated strategies framework for GT planning in a developing country context. Our findings help policymakers, strategic planners, and government agencies in the process of green technology planning.
The analysis has three sections. In the Section 1, a SWOT technique is used to identify green technologies’ internal and external factors. We finalized twenty-two SWOT sub-factors for further data analysis. In the second part, the Grey Analytical Hierarchy Process (GAHP) is employed to determine the weights of SWOT factors and sub-factors. As a second phase, we merged internal and external factors as Strength–Opportunity, Weakness–Opportunity, Strength–Threat, and Weakness–threat and prioritized twenty-one green technology strategies. Finally, Grey Technique for Order Performance by Similarity to Ideal Solution (GTOPSIS) evaluates eighteen green technology strategies for a developing country, i.e., Pakistan’s planning. The study’s structure is as follows: Section 2 presents a literature review on green technologies with a SWOT approach. Section 3 offers the integrated SWOT method, Grey Analytical Hierarchy Process (FAHP), and Grey Technique for Order Performance by Similarity to Ideal Solution (GTOPSIS), resulting from calculating weights and ranking of leading green technologies according to factors and sub-factors and evaluation of green technology strategies. The conclusion, implications, and future directions are in the Section 5 of the study.
2. Developing a Green Technology Strategic Planning Framework
The organizational commitments to protect and sustain the environment attract and drive investments in green technology, regardless of the sector (public or private) [24]. By managing waste materials efficiently, green technologies protect the environment and help control toxic pollution and preserve natural order [25,26]. Climate change has caused several shifts in the environment. In response to these shifts, domestic and international authorities have made several laws that motivate enterprises to transition from conventional technologies to green technologies deployment [27]. To comply with the regulations and cope with environmental challenges, organizational commitment towards the environment is one factor that can make them invest in green technologies [28]. Although strict state or international laws can catalyze green technology investment, the study of Dangelico and Pujari [29] found that environmental laws cannot only instill a fear of compliance to avoid penalties or punishment. Environmental regulations also open up opportunities to build strong values in the eyes of stakeholders and help to generate and sustain revenues.
In addition to regulations and environmental challenges, management involvement can also serve as a motivator for GT investment. Bossle et al. [30] found that green organizational practices are a byproduct of managerial concern toward the environment. Xie et al. [31] explained green revolution in technology as green innovation. Chen (Chen, 2008) [32] argued that product and process innovations in an organization could be improved with management’s engagement and commitment toward continuous learning about the environment and green practices. Huang et al. [33] suggested that managerial concerns toward environmental challenges during HR practices (training and development) truly reflect their involvement in green innovation and practices at an organizational level. Lisi et al. [34] further finds green innovation as a key element in business and environmental management, which helps organizations channel performance and productivity, build reputation, and gain a competitive advantage in national and international markets. Stucki [35] stated that transition from traditional technology to GT is costly for organizations and can take some time to improve productivity and organizational performance. He further argued that if managerial concern and green technology transfer are merged with the organizational change process, it can help organizations adopt and efficiently use technology to enhance productivity.
According to Rauter et al. [36], a growing concern about the environment has been observed in people worldwide. This concern is putting substantial pressure on firms to meet society’s expectations. They further found that firms worldwide are trying to meet sustainability goals in order to build up a reputation and draw potential consumers’ attention. Consumer perception and demand can also serve as a potential driver for GT. We also know that organizations adopt green practices and eco-innovation to fulfill customer’s and society’s demands. Yasir et al. [37] found that raising awareness about environmental challenges makes customers demand organizations adopt processes and produce ecofriendly and energy-efficient products and services. Therefore, organizations need green innovations and technology to attract and retain customers by offering them environmentally friendly products and services [38,39].
Despite regulations, management concerns, and consumers, there can be few perceived economic drivers for green technology adoption aligned with achieving sustainable development goals. First, managers typically look at the firm’s economic growth to satisfy stakeholders with cost-effective products and services [40,41]. Next, the organization’s monetary interest and performance focus are on low production costs and sufficient revenues [42]. Research by Saunila et al. [43] suggested that economic sustainability objectives are antecedents of green technology. Hojnik and Ruzzier [44] state that cost efficiency is not motivated by adopting and deploying green technology. However, it can attract research and development funding to support environmentally friendly processes.
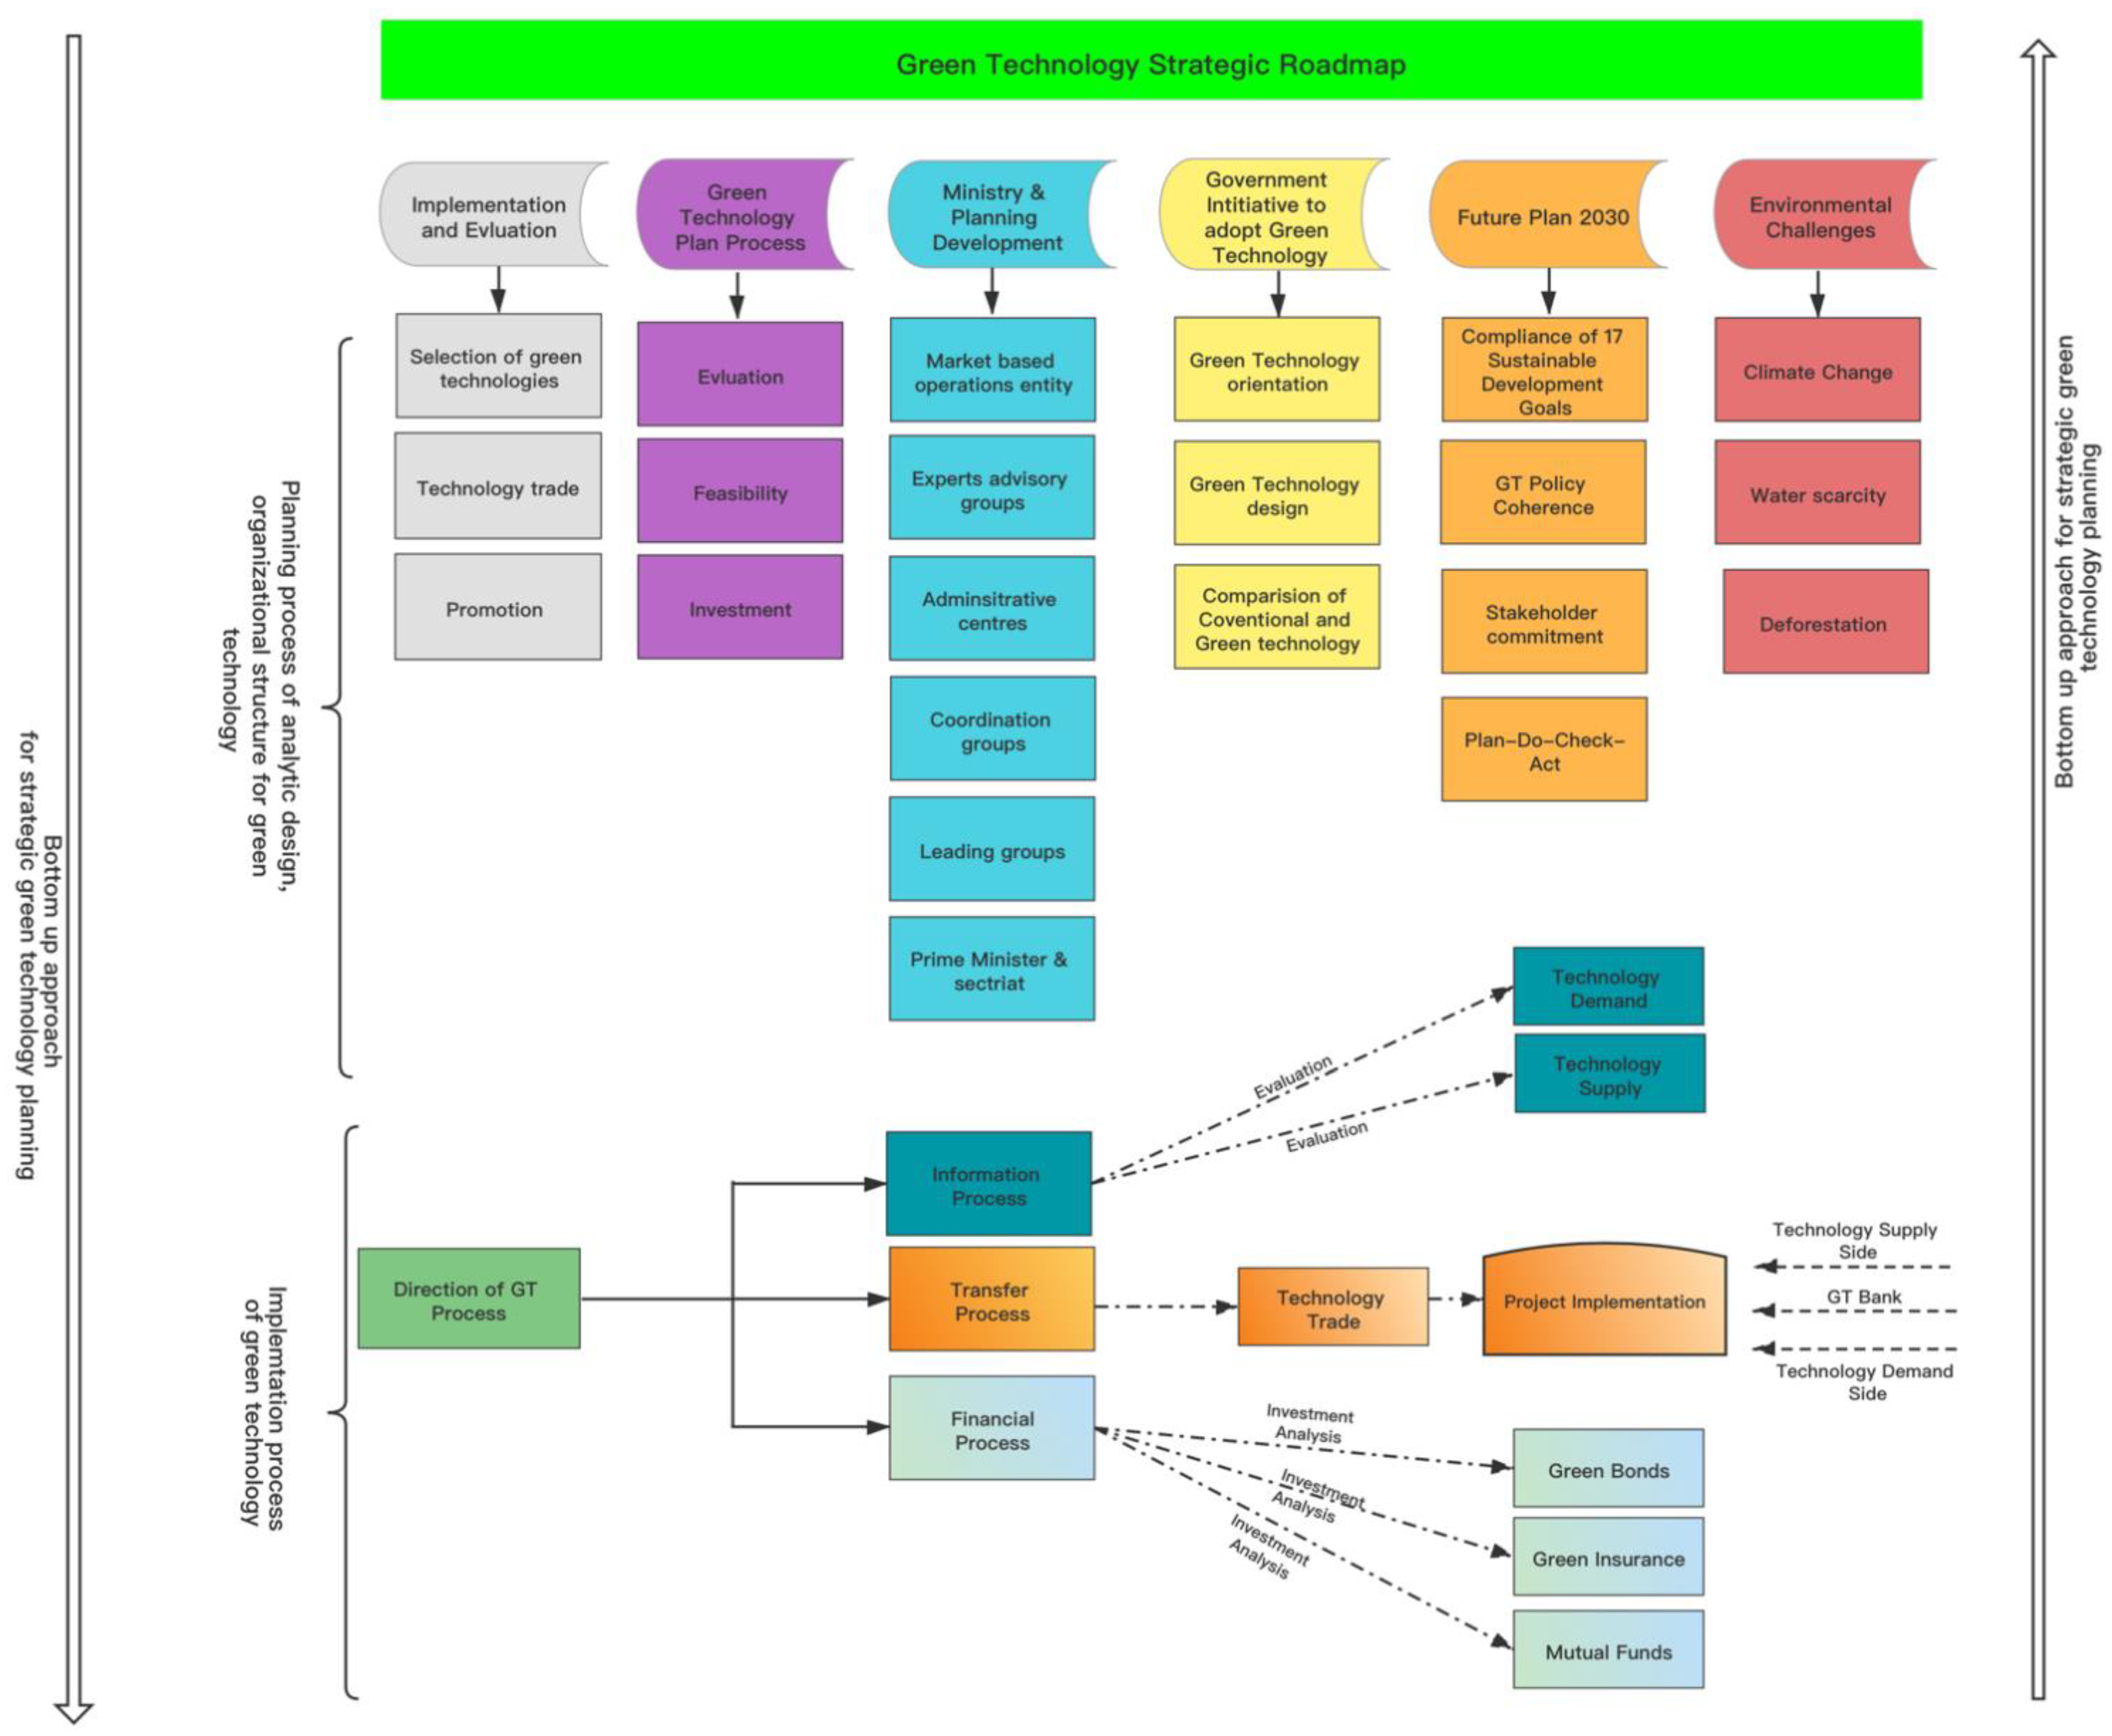
Designing a GT strategic road map comprises two main processes. The first is the planning process of analytic design and organizational structure of green technology in Pakistan, presented in Figure 2. In the first phase, Pakistan’s main environmental challenges are highlighted, such as climate change issues, water scarcity due to lack of dams and political instability, and the issue of deforestation due to unplanned urbanization and industrial development. The 2030 agenda comprises SDGs, fulfills stakeholders’ requirements, and implants green technologies at a Plan-Do-Check-ACT (PDCA) process approach. The government and parliament intend to adopt and promote GTs in Pakistan. The next important step in GT’s strategic planning comprises three sub-parts such as evaluation, feasibility, and investment planning in GT. The last step in planning phases involves classifying GTs, technology trade, and promotion of GTs, respectively.
In contrast, the second process involves implementation. This phase involves the direction processes of GT, such as information process, transfer process, and financial process. In the information process of GT, technology demand and technology suppliers are involved. At the same time, the transfer process indicates technology trade for green projects at a country level based on three supporting factors: the technology supply side, GT bank, and technology demand side. Finally, the financial process provides financial assistance to invest in GT through financial products such as green bonds, green insurance, and mutual funds.
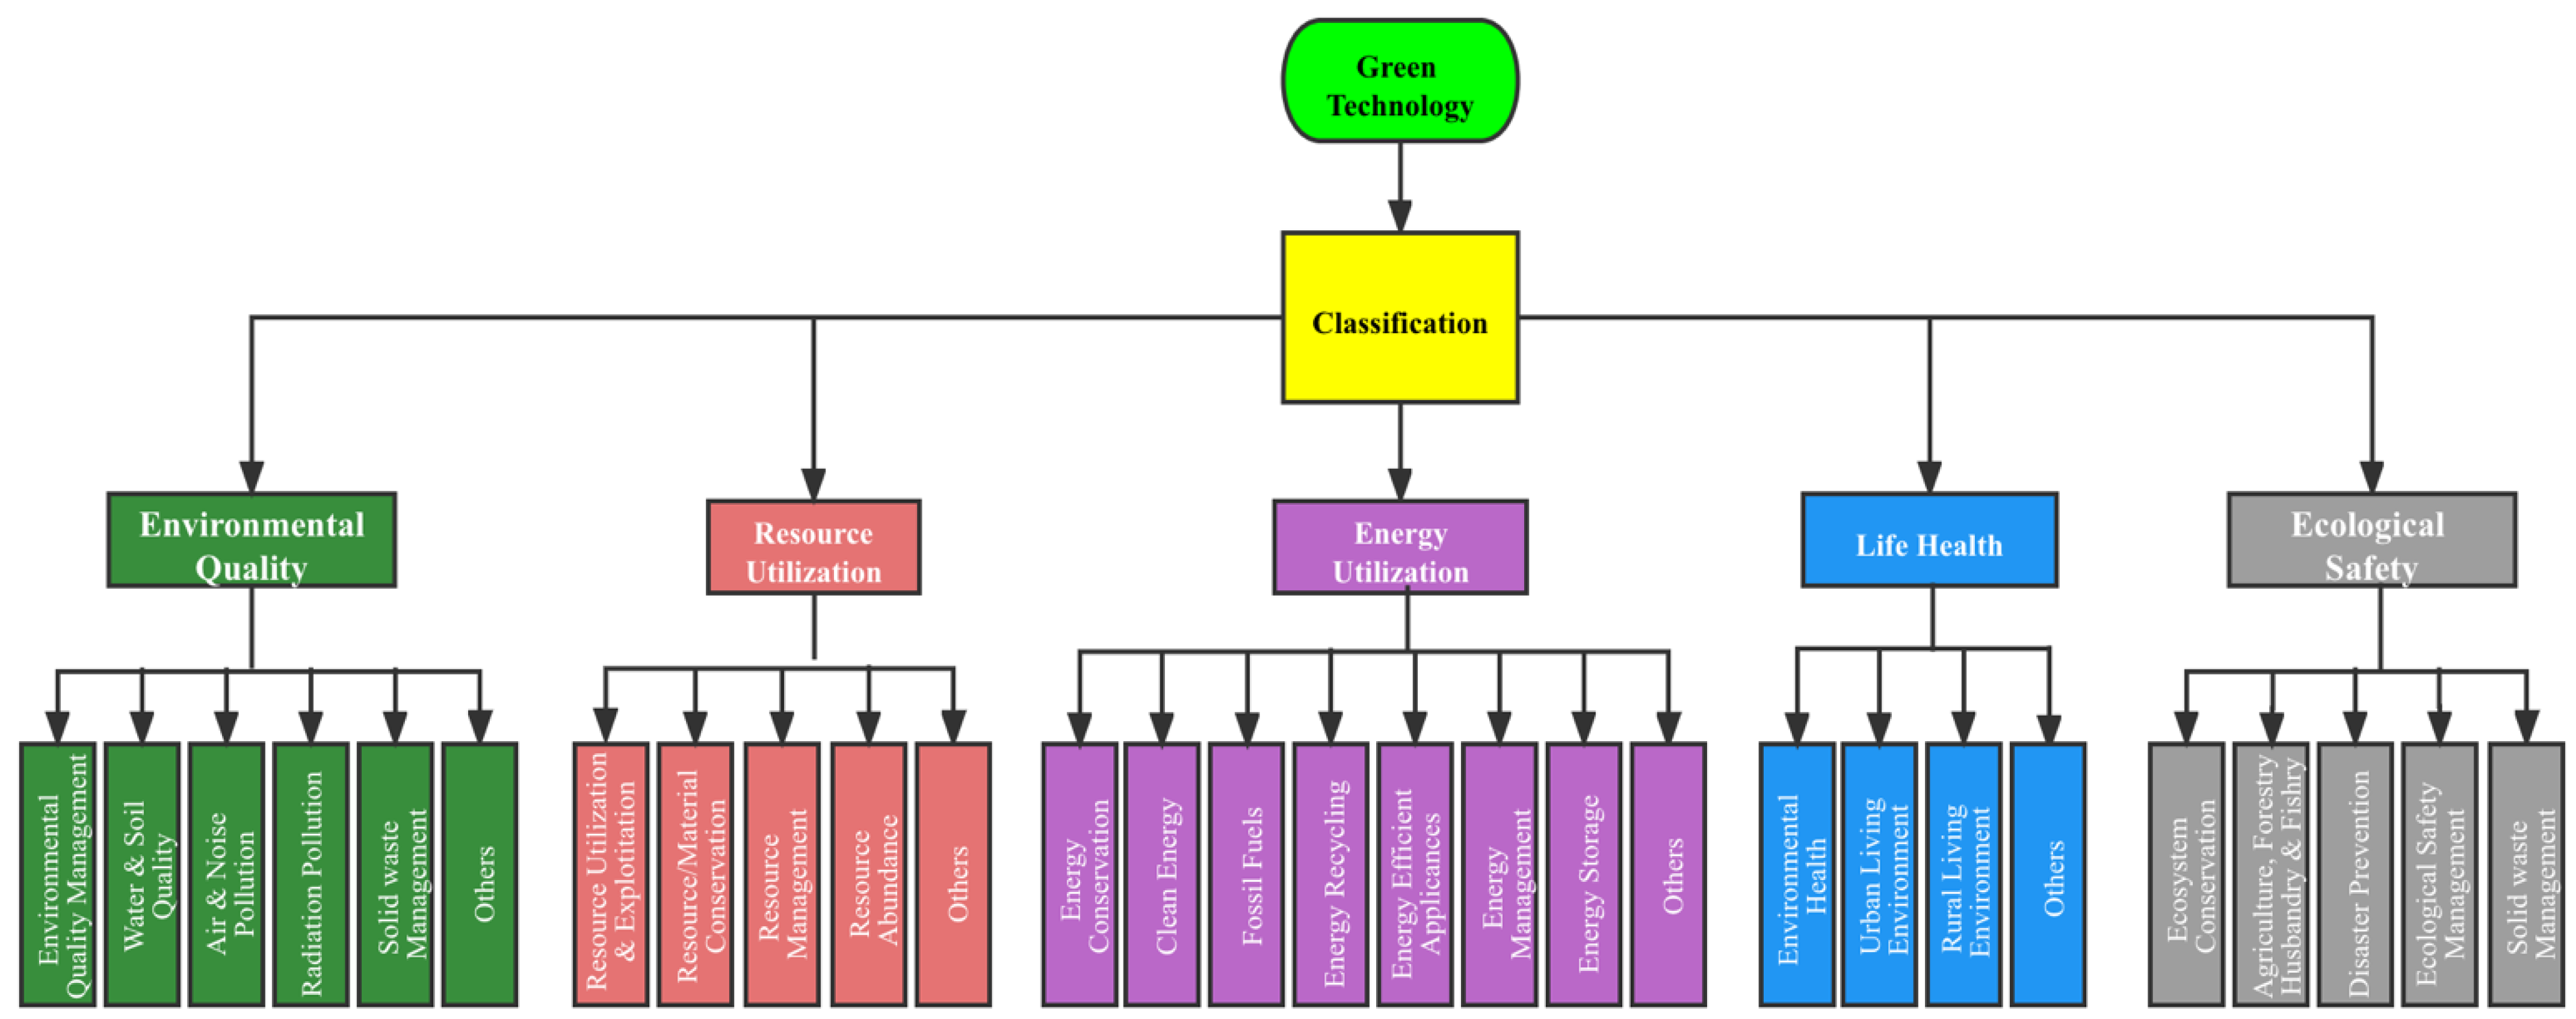
Organizations tend to use material and energy-efficient sources to reduce operational and production costs to minimize the cost of taxes [45]. Therefore, the prices of energy sources and product materials can drive the eco-innovation process. Every organization strives to increase productivity and this productivity provides opportunities for green technology adoption [2]. Improved production systems offer economic benefits to an organization and green technology, thus improving productivity and enhancing operations. While there are many vital criteria and types of technology to consider, decision makers need tools to determine which criteria are critical to good decision making. In this study, we classified GT into five main categories, such as environmental quality, resource utilization, energy utilization, life health, and ecological safety, and then divided these further into subcategories under each main category (see Figure 3).
Multi-Criteria Decision Making (MCDM) Related Literature
Multi-Criteria Decision Making (MCDM) methods have been extensively used to evaluate clean technologies to provide an optimal solution for complex decision-making problems. There are numerous types of MCDM methods that can be applied either in their conventional or in a fuzzy form to solve green technology planning decision problems. Table 1 presents MCDM methods applied to previous studies regarding clean technology development with summary information for the research problem, study objectives, methods/approach used, different criteria selected, and study outcomes. These prior studies used either single or combined methods to determine an optimal solution for clean/green technology planning. This study is the first to use integrated MCDM methods combined with Grey System Theory (GST) and SWOT approaches to evaluate green technology strategies for sustainable planning in Pakistan.
3. Research Methodology
3.1. Integrated SWOT-GAHP and GTOPSIS Methods
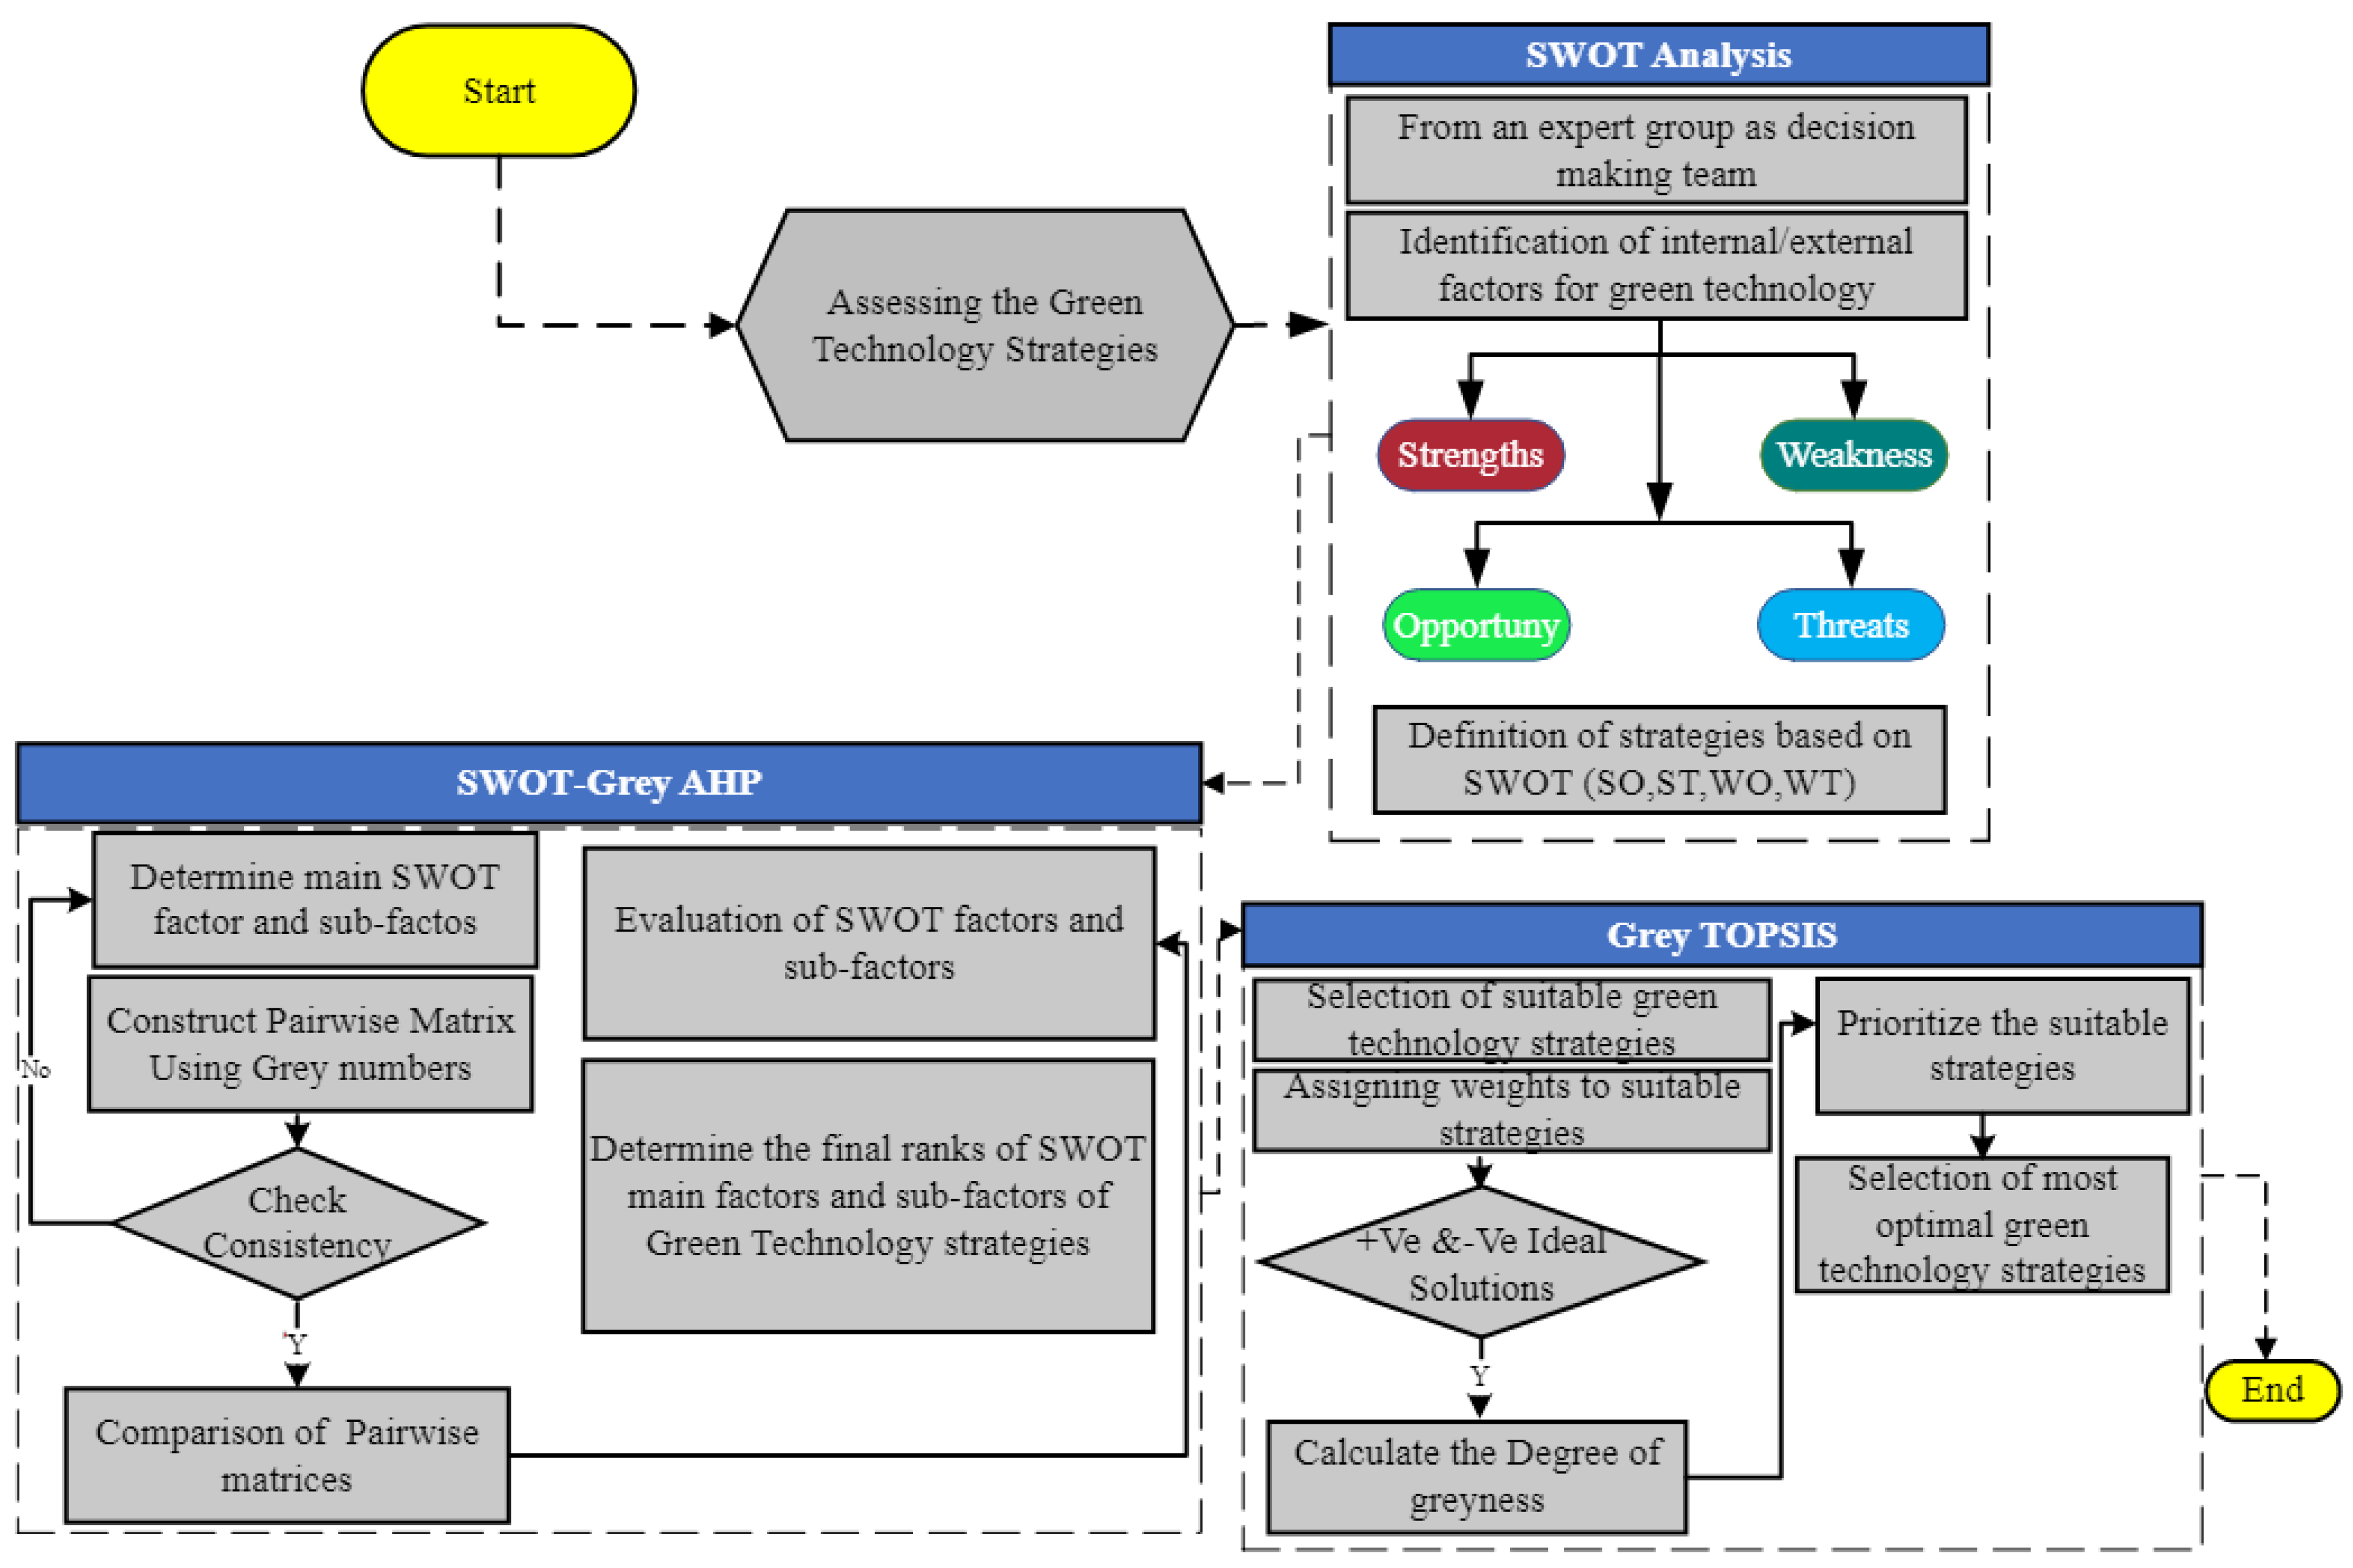
This study uses an integrated SWOT, GAHP, and G-TOPSIS methodology to assess and prioritize green technology strategies for increased sustainable development in Pakistan, as presented in Figure 4. Within this study, a SWOT approach is applied to identify GT’s internal and external factors for sustainable investment in Pakistan. In contrast, the GAHP technique computes each internal and external main factor and sub-factors’ weight characterized by SWOT analysis. Finally, the GTOPSIS technique prioritizes and identifies optimal green technology strategies for Pakistan’s sustainable development.
3.2. SWOT-GAHP Approach
In this study, we integrated the SWOT approach with GAHP. As a building block, SWOT is the most widely adopted systematic and strategic approach for sustainable planning and analyzing internal and external factors. Moreover, it cannot prioritize these factors during the strategic development process [58]. Hence, SWOT-GAHP integration measures internal and external factors quantitatively in the decision-making process. There are two main stages involved in SWOT analysis: (1) the construction of the SWOT matrix and (2) the development process of strategies using the SWOT matrix. Previous scholars have applied SWOT analysis to combine AHP and TOPSIS to make strategic decisions in different industries [51,59]. A schematic framework of integrated methods utilized in this study is presented in Figure 4. Previous research studies have proposed a hybrid methodology based on AHP-TOPSIS and AHP-SAW methods in prioritizing renewable energy resources [46]: the AHP-TOPSIS technique for design parameter selection [60] and SWOT-AHP [59,61] for strategy development for the space industry and forest certifications. None of these studies used the grey hybrid model technique. In order to fill the gap in literature, this study used the integrated grey hybrid model of Grey-SWOT AHP and Grey TOPSIS to develop green technology strategies for sustainable planning. Furthermore, the main advantage of using GAHP and over simple AHP is that G-AHP is more proficient in dealing with uncertain or an incomplete set of judgments [62]. We chose G-AHP over fuzzy AHP because the former already includes fuzzy conditions and, therefore, handles fuzziness in decision making [63].
To the best of the author’s knowledge, there is no standard available for how many experts should be involved in this analysis. However, prior studies used a different number of experts for data analysis to obtain reliable results. For example, Solangi et al. [51] selected ten experts for data analysis for the assessment of renewable energy barriers for sustainable energy planning in Pakistan, whereas Wang et al. [58] selected five experts by using FAHP to select strategic renewable energy resources in Pakistan to improve sustainable development. In this study, we utilized eight academic and industrial experts to help with this analysis.
3.3. Grey Analytical Hierarchy Process
Within this study, we used the Grey Analytical Hierarchy Process (G-AHP) method to obtain weights of major and sub-criteria of green technology strategies using the integration of Grey System Theory (GST) and Saaty’s AHP. In order to evaluate experts’ feedback, the following (1, 3, 5, 7, and 9) five scales were used in GAHP. On the other hand, in Saaty’s AHP, a 1–9 scale was used to construct pairwise judgment matrices. Table 2 presents the details of GAHP linguistic values. GAHP has numerous advantages, such as high accuracy over traditional AHP. In addition, it works better on incomplete information and a set of expert feedback [64,65]. We are using the GAHP method over Fuzzy AHP because the former already includes fuzzy conditions and, therefore, expertly handles fuzziness in decision making. This method confirms the elements of the evaluation matrix by using grey numbers and explicit weight functions that do not depend excessively on the experience of experts [66]. The construction of GAHP comprises the following steps.
Step 1: The first step involves the development of a hierarchal structure by defining the study goal, main criteria, and sub-criteria and provides an optimal solution for the problem to be solved.
Step 2: The second step involves the construction of pairwise comparisons matrices by using the greyscale presented in Table 2. M indicates the GAHP pairwise comparison matrix as follows:
where the grey number is represented by , = 1 if i = j, and indicates the upper limit, whereas are upper and lower limits of , respectively.
Step 3: We normalized the GAHP pairwise matrix, which is presented as follows.
presents upper limit, whereas indicates the lower limit, and the normalized limits are obtained as follows.
Step 4: The final step involves the computation of relative grey weights for the normalized lower and upper limit, which is presented as follows.
The grey weight score is converted to definite weight score as follows.
λ presents the grey coefficient for which its value is set as 0.5. Based on the decision maker’s pessimistic and optimistic inputs, the value of the grey coefficient can be varied.
We checked the reliability and consistency of results obtained by GAHP by using a consistency ratio (CR) to calculate pairwise matrices [67]. If the value of CR records less than 0.1, this implies the acceptability of results; otherwise, the results of criteria and sub-criteria are considered unreliable, and the process of obtaining experts’ feedback must be revised.
3.4. Grey Numbers
Grey numbers are defined as the interval between known and unknown values, which consist of an incomplete data system. The grey number is presented by symbol . Grey numbers have various classes, and we used three classes in this study: lower bound, upper bound, and internal grey numbers [68]. The definition of these three grey numbers is as follows.
Class 1: A grey number is called a lower bound grey number if it is only evaluated by its lower bound and is presented by .
Class 2: A grey number is called an upper bound grey number if it is only evaluated by its upper bound and is denoted by .
Class 3: A grey number is called an interval grey number if it is evaluated by both lower and upper bound and is presented by .
The function of arithmetic operations can be applied on two grey numbers with grey values and , which are presented in Equations (6)–(9).
Equation (10) presents the length of the grey number .
3.5. Grey Group TOPSIS (G-TOPSIS) Method
Yoon and Hwang (1985) developed the widely adapted TOPSIS method, and it has been used in various fields of study [70]. The method assesses alternatives by using parameters. The benefit of this method is that it measures both the optimal positive and negative solutions for the decision problem. Moreover, a positive optimal solution indicates sustainable development and a negative optimal solution present a reduction in environmental issues in this study. An optimal alternative is the one with the least distance from the optimal positive solution and the highest distance from the optimal negative solution. The primary purpose of integrating grey system theory with TOPSIS is to ensure accurate assessment and remove ambiguity in expert’s feedback. The construction of the Grey TOPSIS method comprises the following steps.
Step 1: Initially, this step involves the calculation of each criteria weight as per experts’ feedback determined by using the grey linguistic variables presented in Table 3. Assuming that is the number of decision makers, we can compute criterion weight of alternatives using Equation (12).
Stage 2: To determine all alternatives’ position in each of the criteria, grey linguistic variables are used. If represents the number of decision makers in criterion j, then the value of alternative is determined as follows.
Stage 3: This step involves the grey decision matrix and is represented by the following equation.
Here, presents the significance of the alternative in criterion .
Step 4: In this stage, the matrix of grey decision is normalized and denoted by in Equation (15).
If the criteria increase benefit attributes, then Equation (16) is utilized for normalization as follows.
If the criteria reduce cost attributes, then the following equation is used for normalization.
The values of the grey matrix would be within the range of [0, 1] after the normalization process.
Stage 5: This step involves constructing a grey-weighted normalized decision matrix denoted by letter and is presented in the equation below.
Step 6: The optimal positive and negative solutions for the decision problem can be calculated by Equations (19) and (20).
Step 7: The calculation formula of greyness degree between optimal and alternative solutions is presented in Equation (21).
Step 8: According to values obtained in step 7, the alternatives are then set in ascending sequence according to the values obtained in stage 7, which implies that higher priority is provided to the alternative with a minimum greyness degree coefficient.
4. Results and Discussion
The results of this study are divided into two sections. The first section of the results presents SWOT-GAHP in which SWOT main factors and sub-factors of green technologies are analyzed and ranked as per relative importance given to them by experts. In the second section of the results, GTOPIS is employed to prioritize green technology strategies and provides an optimal solution for decision makers towards sustainable development.
4.1. GAHP Results
In the first section of our analysis, we used a GAHP technique based on a pairwise comparison matrix of SWOT main factors and sub-factors for green technology development in Pakistan. The hierarchical structure based on SWOT’s four main and twenty-two sub-factors has been drawn in Figure 5. The results of GAHP are divided into three parts. The first part presents the goal that is achieved in this study; the ranking of SWOT factors and sub-factors of green technology based on weights calculation by pairwise comparison matrix is presented in the second part; finally, the third part represents the overall ranking of all sub-factors of SWOT that has been performed by using GAHP, respectively.
4.2. Ranking of SWOT Factors
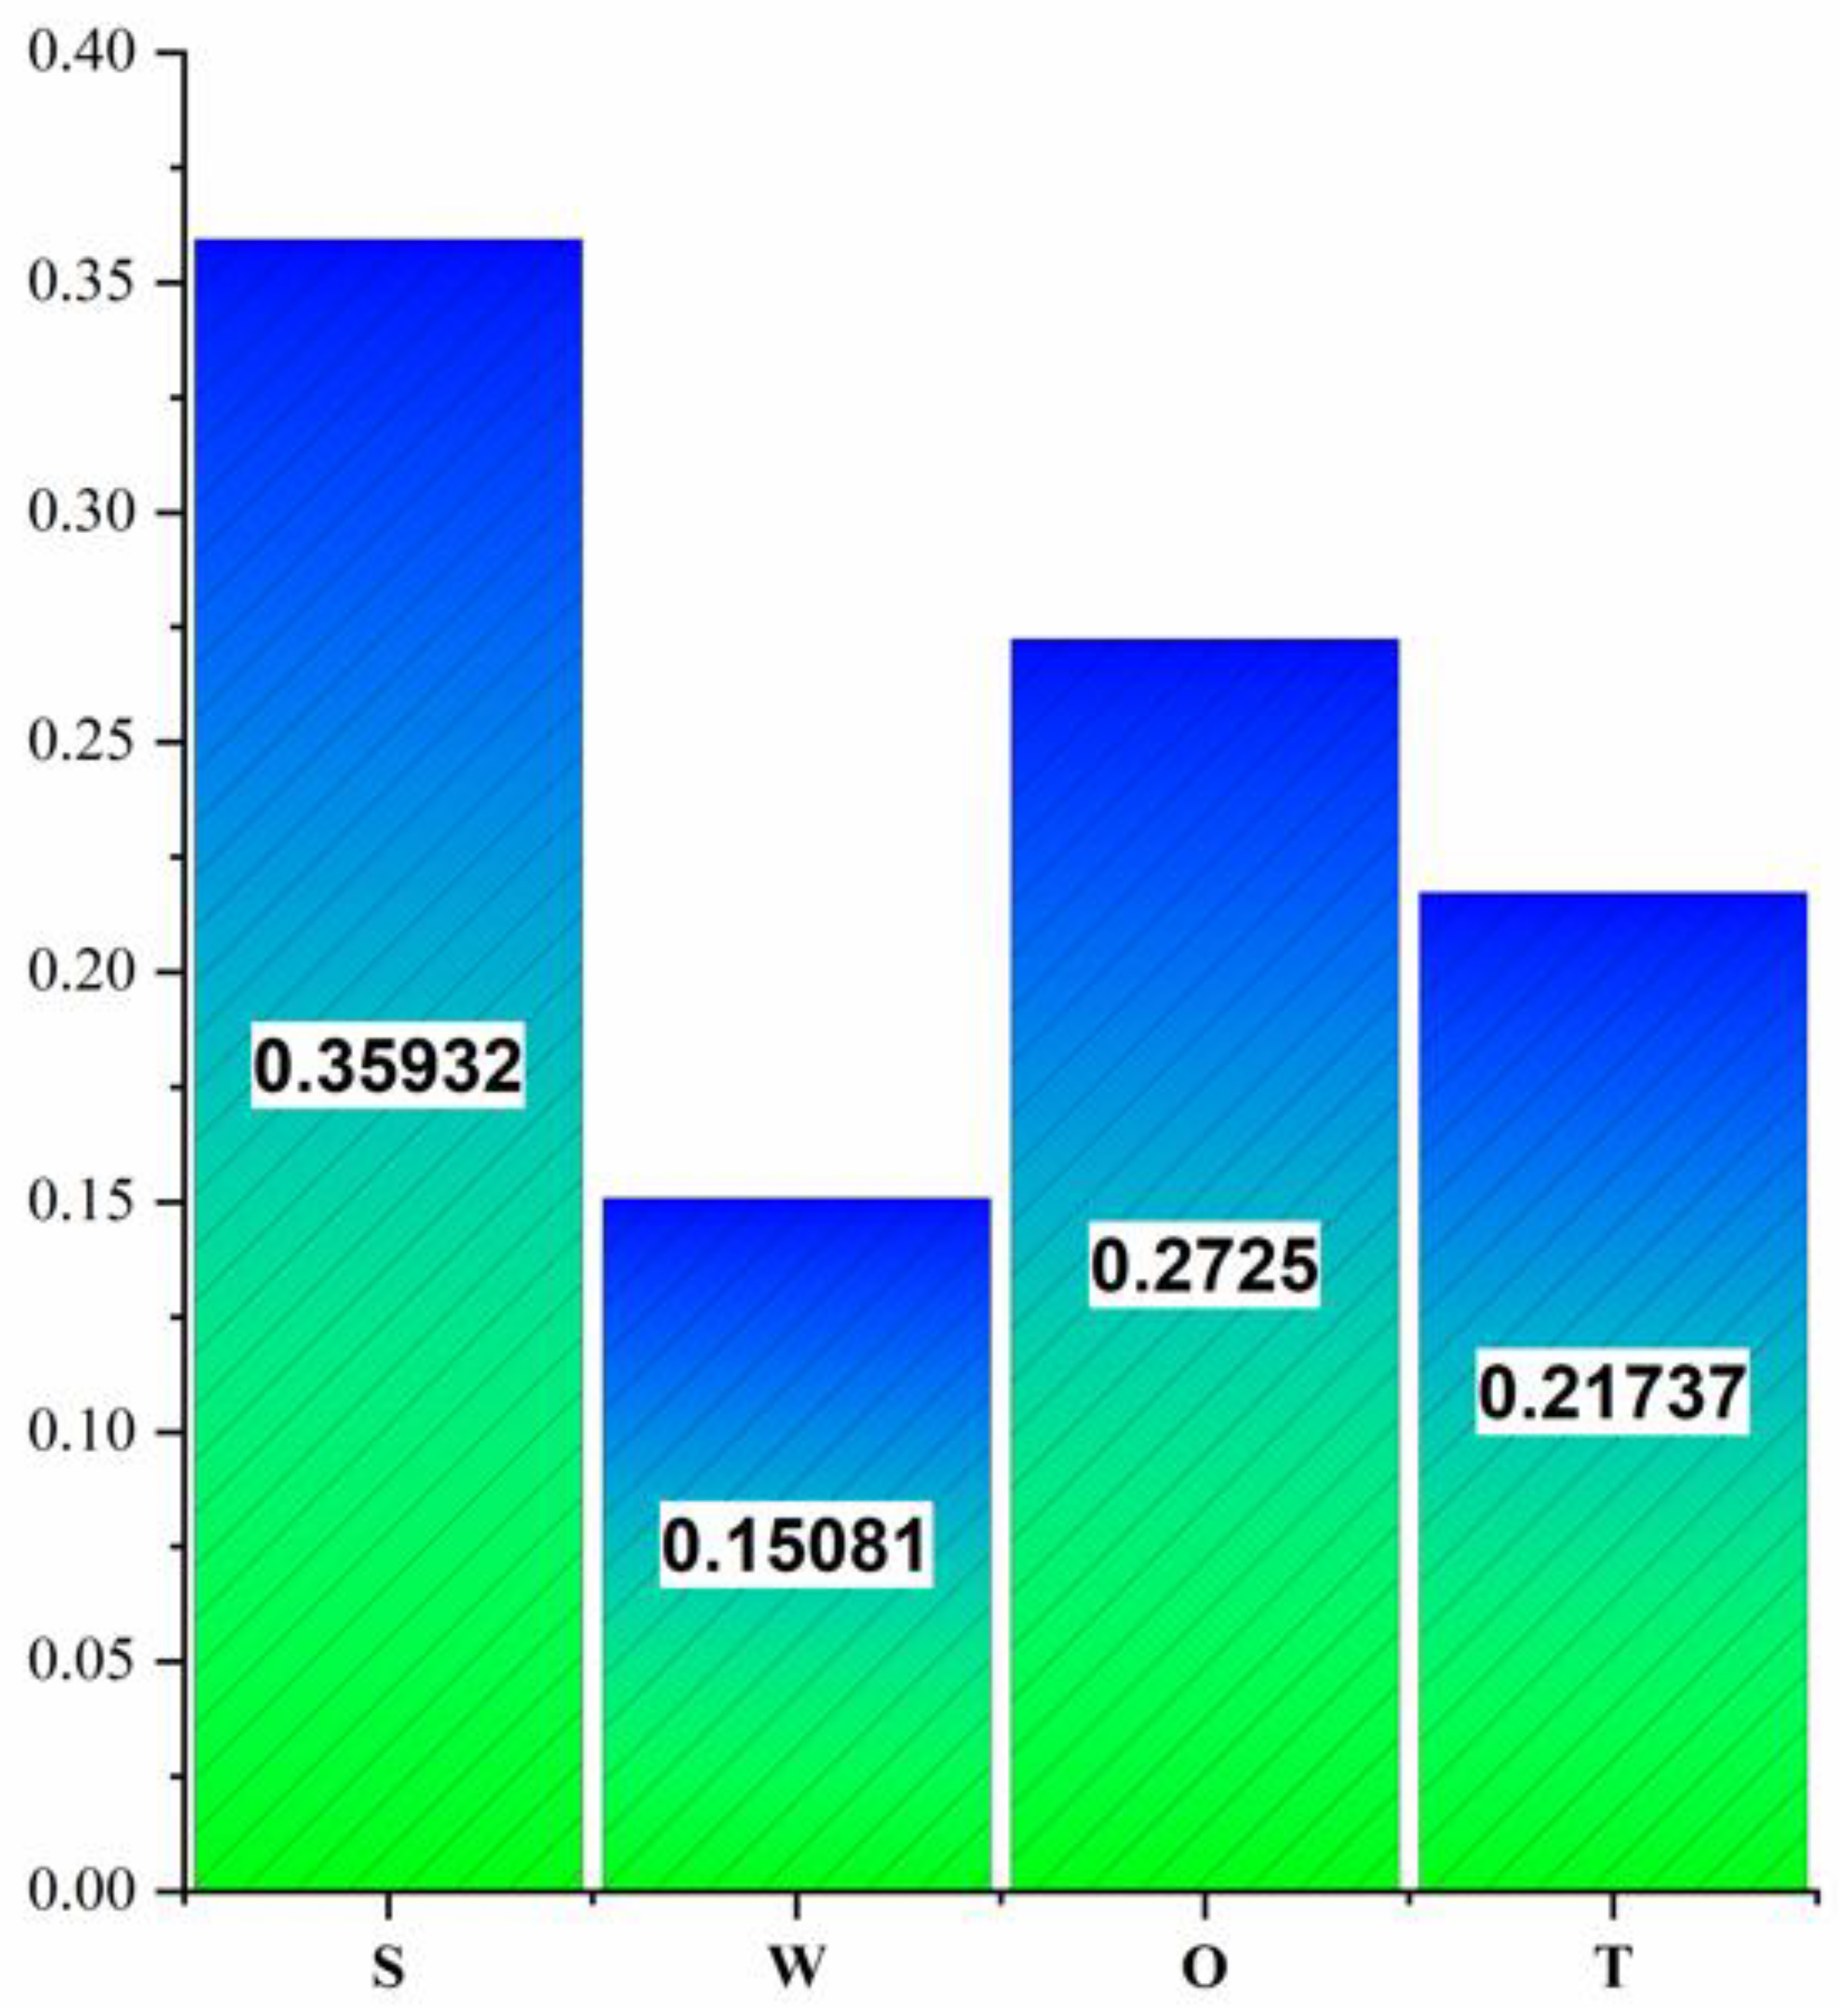
The relative weights of SWOT factors and sub-factors received by solving grey pairwise matrix ranking is presented in Figure 6.
It can be observed that Strengths (S) have received the highest weight of 0.35932 followed by Opportunities (O) 0.2725, Threats 0.21737, and Weaknesses 0.15081, respectively. The ranking of SWOT major factors obtained by GAHP reveals that strength strategy recorded the essential Weaknesses, Opportunities, and Threats strategies. Hence, we can say that all major SWOT strategies are important in decision making. Nonetheless, the Strength factor plays a vital role in green technology development in this country context.
4.2.1. Ranking of Strength Sub-Factors
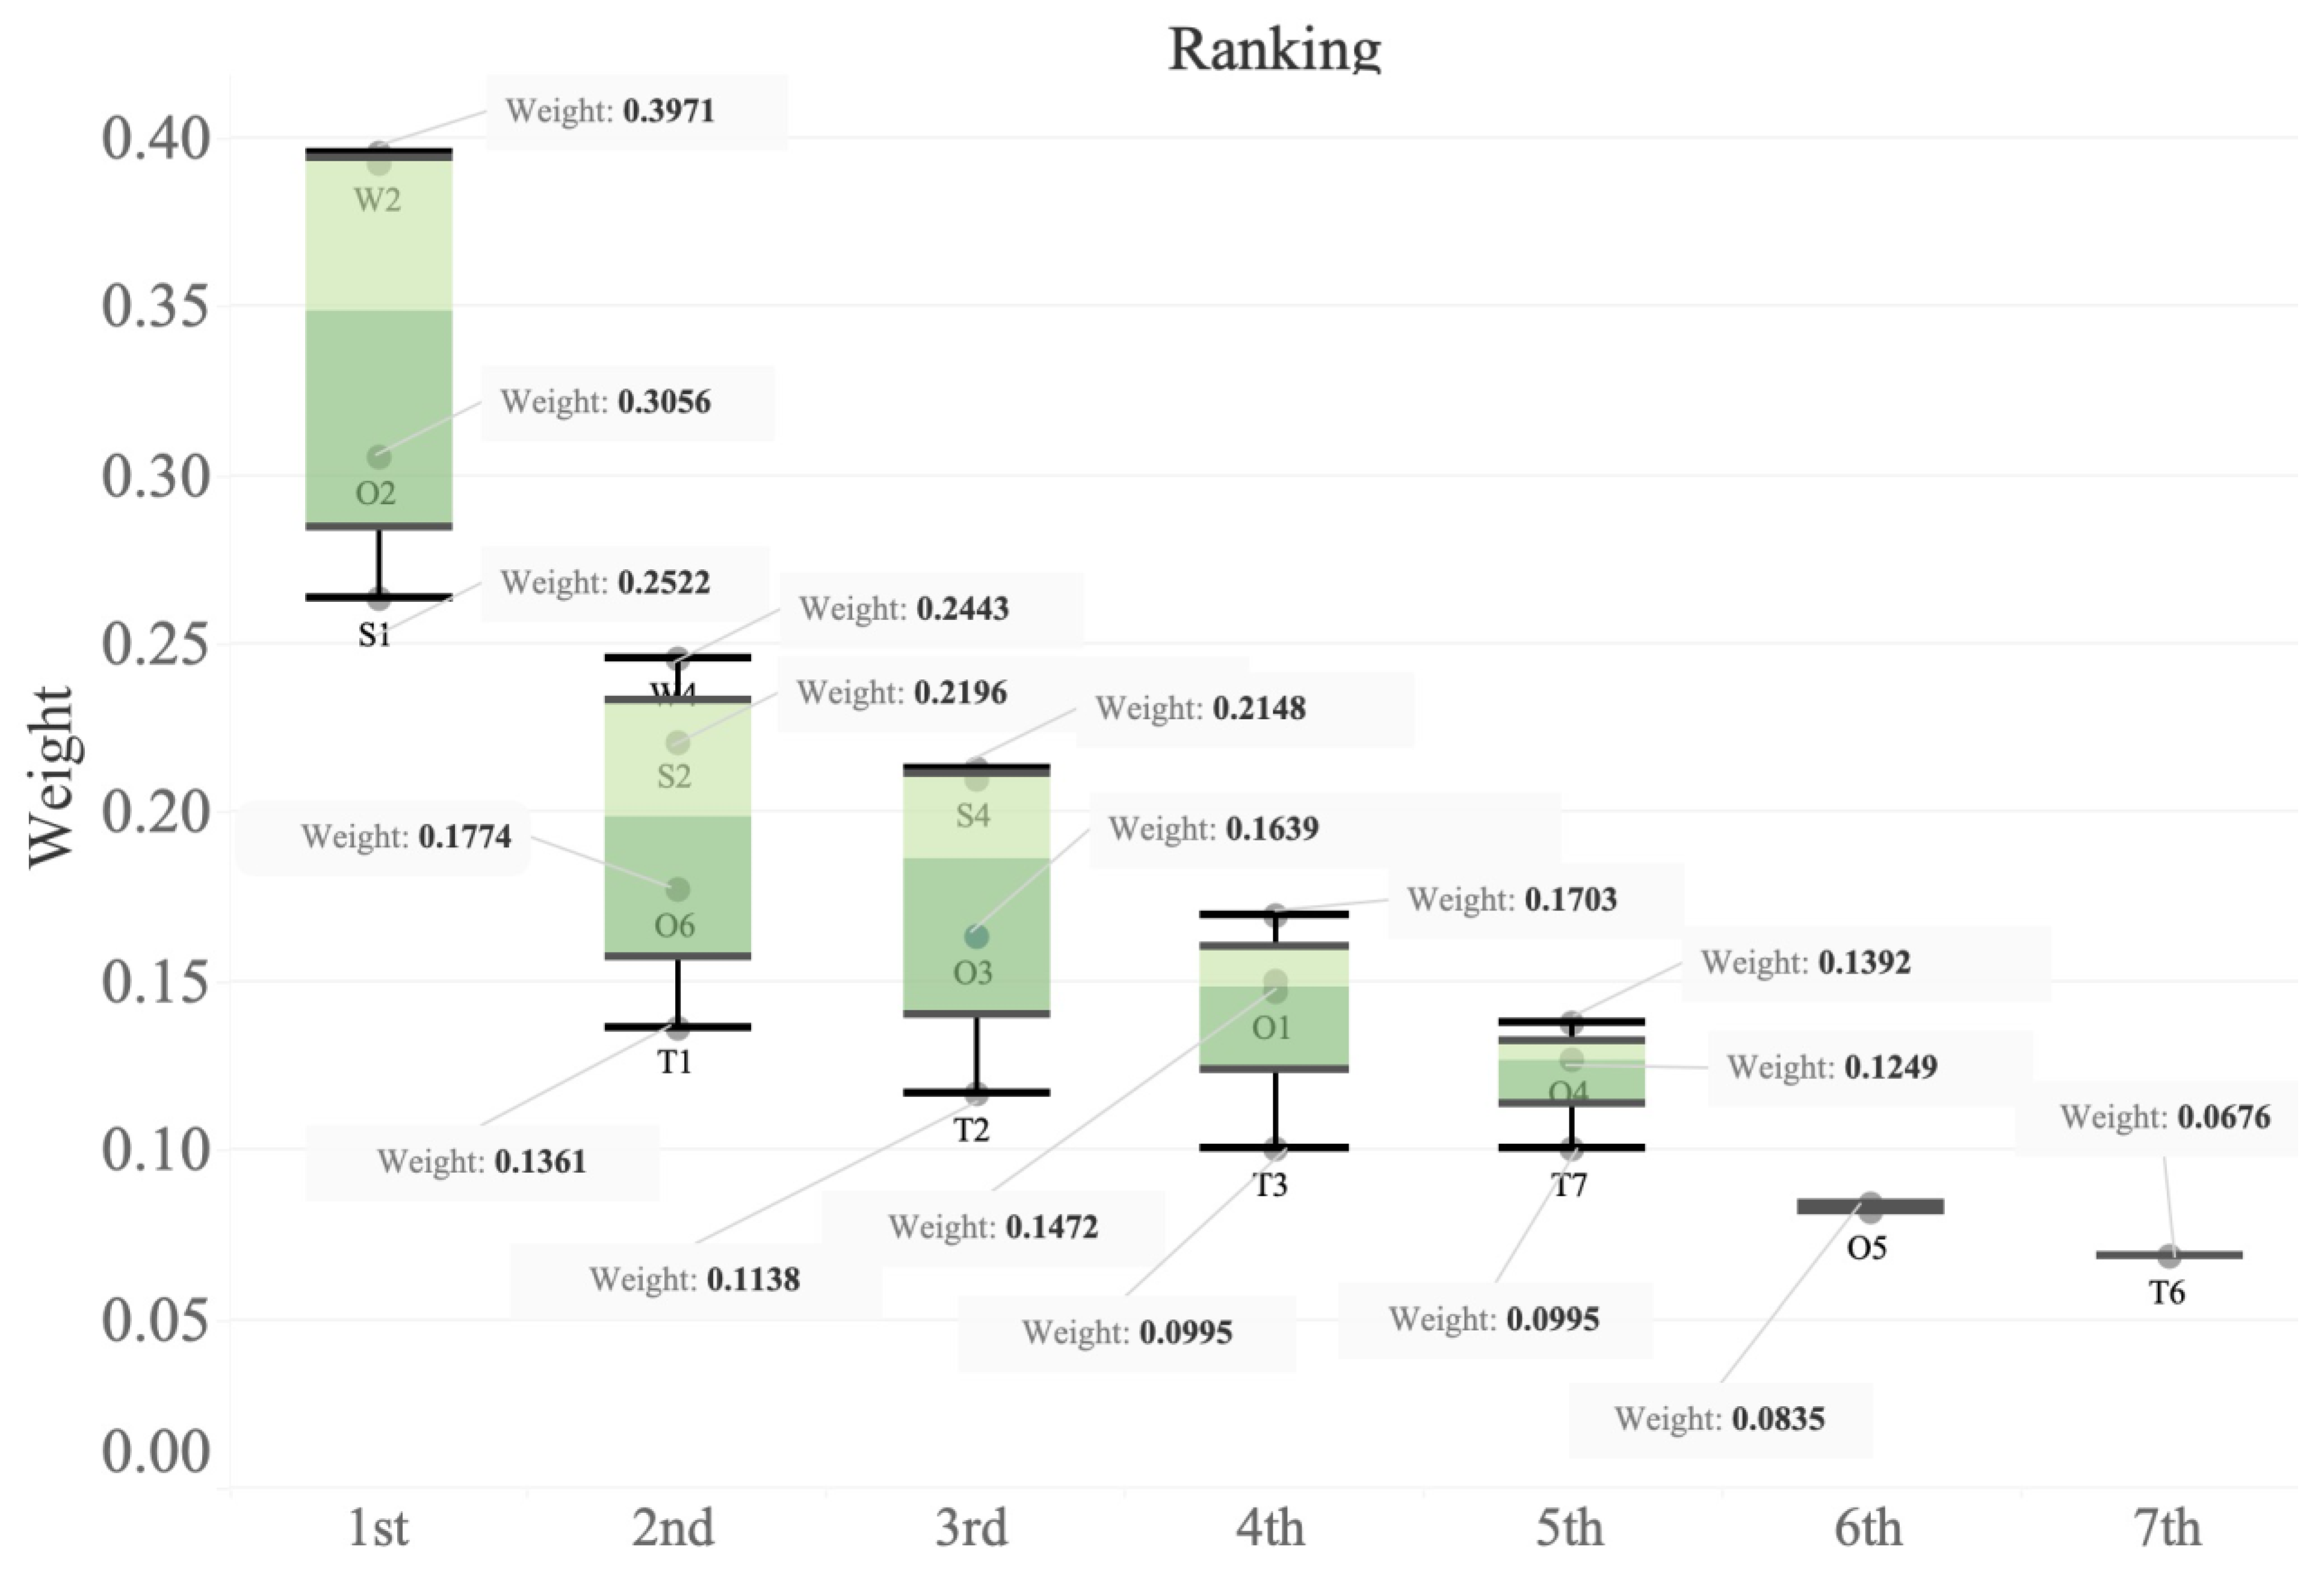
Once we received SWOT main factor weights, we now quantify how each SWOT sub-factor affects each GT strategy. In order to perform this, we have constructed twenty-two pairwise comparison matrices, one for each category of factor. Next, experts were asked to compare sub-factors under each SWOT category. The weights of sub-factor under each SWOT category are calculated by solving these matrices and presented in Figure 7. It should be noted that any SWOT sub-factor receiving higher weight shall be considered more affected for the sustainable investment for green technology in Pakistan. Hence, the lower the weights, the less effective the rankings of the SWOT sub-factors.
Under the SWOT strengths category, weights obtained by sub-factors (from higher to lower) are as follows: Enhanced productivity in the agriculture sector (S1) obtained the highest weight score of 0.2629 and recorded that the most prioritized sub-factor of SWOT is in Figure 7. Pakistan is an agricultural country. The agriculture sector employs more than 50% of the population and serves as the economy’s backbone. Based on the literature and the study analysis, we find that green technology enhances resource productivity and improves environmental quality (Cheng, Awan, Ahmad, and Tan, 2021); thus, green technology investment is a method for the Pakistan government to support its agricultural productivity.
The high potential of renewable energy resources (S2) and the availability of foreign investors (S4) come in the second and third positions by obtaining the weight of 0.2208 and 0.2095 within the category. The province of Pakistan has excellent and varying potential for renewable energy, e.g., Sindh for solar energy, KPK for water and wind, and Punjab for solar, wind, and water [71]. All these factors are a means to achieve strength for the country by exploiting green technology. However, it requires a sufficient level of government involvement in the process, and it demands good policy in this area [52]. The favorable choice for sustainable development goals (S5) and country commitment to comply with international laws (S3) recorded the least influencing SWOT sub-factors within the category by receiving weights of 0.1693 and 0.1375, respectively. Green tech-investment includes machinery (electric car), infrastructure, and electricity generation for this technology. The world climate leader has been placing a great deal of pressure on every economy in order to protect the ecosystem and increase green innovation [72]. There are many international laws, such as the Paris agreement, that demand a country’s environmental commitments. Investment in green technology can serve the purpose and help comply with and fulfill the organization’s environmental protection responsibility [73]. Green technology is a method for attracting foreign investors to the country, which will help stabilize the economy and help the country achieve SDGs.
4.2.2. Ranking of Weaknesses Sub-Factors
There are potential weaknesses that must be addressed in order to take the best advantage of GT in Pakistan. The ranking of weakness sub-factors under the GAHP method can be observed in Figure 7. It is revealed that bad governance and high corruption (W2) are the top prioritized concern and have obtained the highest weight score of 0.3919. According to the world governance scale, Pakistan could not obtain a good score, and corruption is one primary reason.
The weakness sub-factor Political instability and economic downfall is the second most influencing concern by gaining the weight score of 0.2450 for strategic investment planning on GT in Pakistan. Political shifts and government effectiveness are reasons behind fluctuating Pakistani economy over the years. In the presence of all the mentioned factors, it will be hard for Pakistan to exploit the best GT in the country.
Lack of coordination and collaboration between institutions (W1) has been considered the moderate influencing sub-factor, coming in at the third position within the SWOT weaknesses category by obtaining a weight score of 0.2129. There are colossal communication and coordination gaps among various institutions in Pakistan if Pakistan wants to transition from traditional technology to green technology, which requires policies and collaboration and coordination between various institutions.
Lack of funding for research and development (W3) was prioritized as the least influencing sub-factor within the same category by receiving the lowest weight score of 0.1502. A government’s expenditure on research and development depicts its commitment to increase technology, innovation, and development [7]. Unfortunately, the smallest part of the Pakistani budget has been allocated to R&D in the country. The SWOT sub-factor findings for green technology strategies imply that the government of Pakistan should take serious steps to allocate the budget for R&D in order to develop sustainability.
4.2.3. Ranking of Opportunities Sub-Factors
We have discovered many potential opportunities for Pakistan in the domain of GT investment. The ranking of SWOT opportunities sub-factors is presented in Figure 7. It revealed that green technologies in society and policy initiatives at the national level (O2) are recorded as the most critical sub-factors by receiving the highest weight of 0.3051 within the category. The conventional sources of energy production have severely affected the environment, and now society demands alternative methods. Green sources of production are means to achieve sustainable goals.
The sub-factor job creates opportunities and economic stability (O6) and the opportunity to build a positive image (O3) come in second and third positions, posessing a weight score of 0.17721 and 0.16321 within SWOT opportunities category. Green growth will open many new jobs needed to understand and operate green technology in different sectors. In addition, the adoption of green technology presents an opportunity for Pakistan’s government to invite green investment, and investors can build a positive image of the country at the national and international levels.
It is evident from GAHP analysis that the increase in the awareness of climate change (O1) is an opportunity for investors to obtain returns (O4) by obtaining the weight score of 0.14656 and 0.12677. Furthermore, due to people’s growing concern at national and international levels, they become aware of environmental issues and show their sensitivity toward environmental sustainability (Bakaki et al., 2020) (Wang, 2020) [74,75]. Therefore, there is an opportunity for a national and global investors to obtain the best possible investment return in green technology. Finally, decreasing the cost of green technologies (O5) was recorded as the least influencing indicator among six opportunities sub-factors by receiving a weight of 0.08115. In summary, the opportunity awareness of green technologies in society and policy initiatives at the national level (O2) is looked at as the most promising opportunity by experts.
4.2.4. Ranking of Threats Sub-Factors
Under the SWOT Threats category, the ranking of sub-factors is presented in Figure 7. There are many threats in the transition from a traditional Pakistan economy to a green economy. Less foreign investment due to terrorism and security issues (T4) came in at the first position by obtaining the highest weight score of 0.3950. Pakistan is one of the countries in Asia that have been affected by terrorism, making it hard to attract foreign investment. Therefore, it imposes a great deal of threat on foreign investment [76].
Moreover, low financial support for green energy due to economic downturn (T1) and increase in population, internal migration from rural to an urban area, and unplanned urbanization (T2) obtained the highest weight of 0.1362 and 0.1162 after T4. The economic situation of Pakistan is facing fluctuation over the years for many reasons. When the government regulation system does not work efficiently during economic downturns, authorities tend to cut the extra cost of green energy. However, an uncontrolled increase in the population and low literacy rate or education opportunities make it hard for a society or community to realize the importance of addressing the grassroot level environmental challenges [77].
Threats T3 and T7, unstable profitability due to regulation changes, and the expensive transition from conventional to green technology, have been considered moderate threats by receiving weights of 0.1001 and 0.0999, respectively. Pakistan is a developing country. The transition from conational technology to green ones requires substantial investment in the area, which will be a threat if a country is facing economic constraints.
Within the threat category, the dominance of conventional technologies, i.e., fossil fuels for energy generation (T5) and fear of natural hazards or disasters (T6), is recorded to influence sub-factors for green technology investment by receiving the weight of 0.0841 and 0.0685. Pakistan has vast gas and coal reserves rather than efficient green sources; the economy depends on fossil fuels and traditional technology to produce energy in different sectors across the country [78]. Moreover, Pakistan, similarly to other developing countries, is vulnerable to natural hazards such as earthquakes and floods. Such disasters affect the and progress toward a green path and push the country back to plan and start over again in those regions.
4.2.5. Overall Ranking of SWOT Sub-Factors
This section represents overall ranking results of all twenty-two SWOT sub-factors altogether, irrespective of their categories such as Strengths (S), Weaknesses (W), Opportunities (O), and Threats (T), which can be observed in Figure 8. In order to analyze the final ranking, weights of sub-factors of SWOT under each category of the main factor are multiplied with that weight. Finally, each sub-factor weight is summed to obtain cumulative weight, which is the basis of the final ranking presented in Table 4. The final ranking of sub-factors for green technology strategy bodies to develop sustainability is as follows: S1 > T4 > O5 > O3 > S4 > T5 > S3 > O1 > T6 > T1 > W2 > W3 > O6 > O2 > S5 > S2 > T7 > O4 > W4 > T3 > W1 > T2.
It is evident from our analysis that high productivity potential in the agriculture sector (S1), less foreign investment due to terrorism and security issues (T4), decreasing the cost of green technologies (O5), and the opportunity to build a positive image are key sub-factors for green technology strategic planning.
4.3. Grey TOPSIS Results
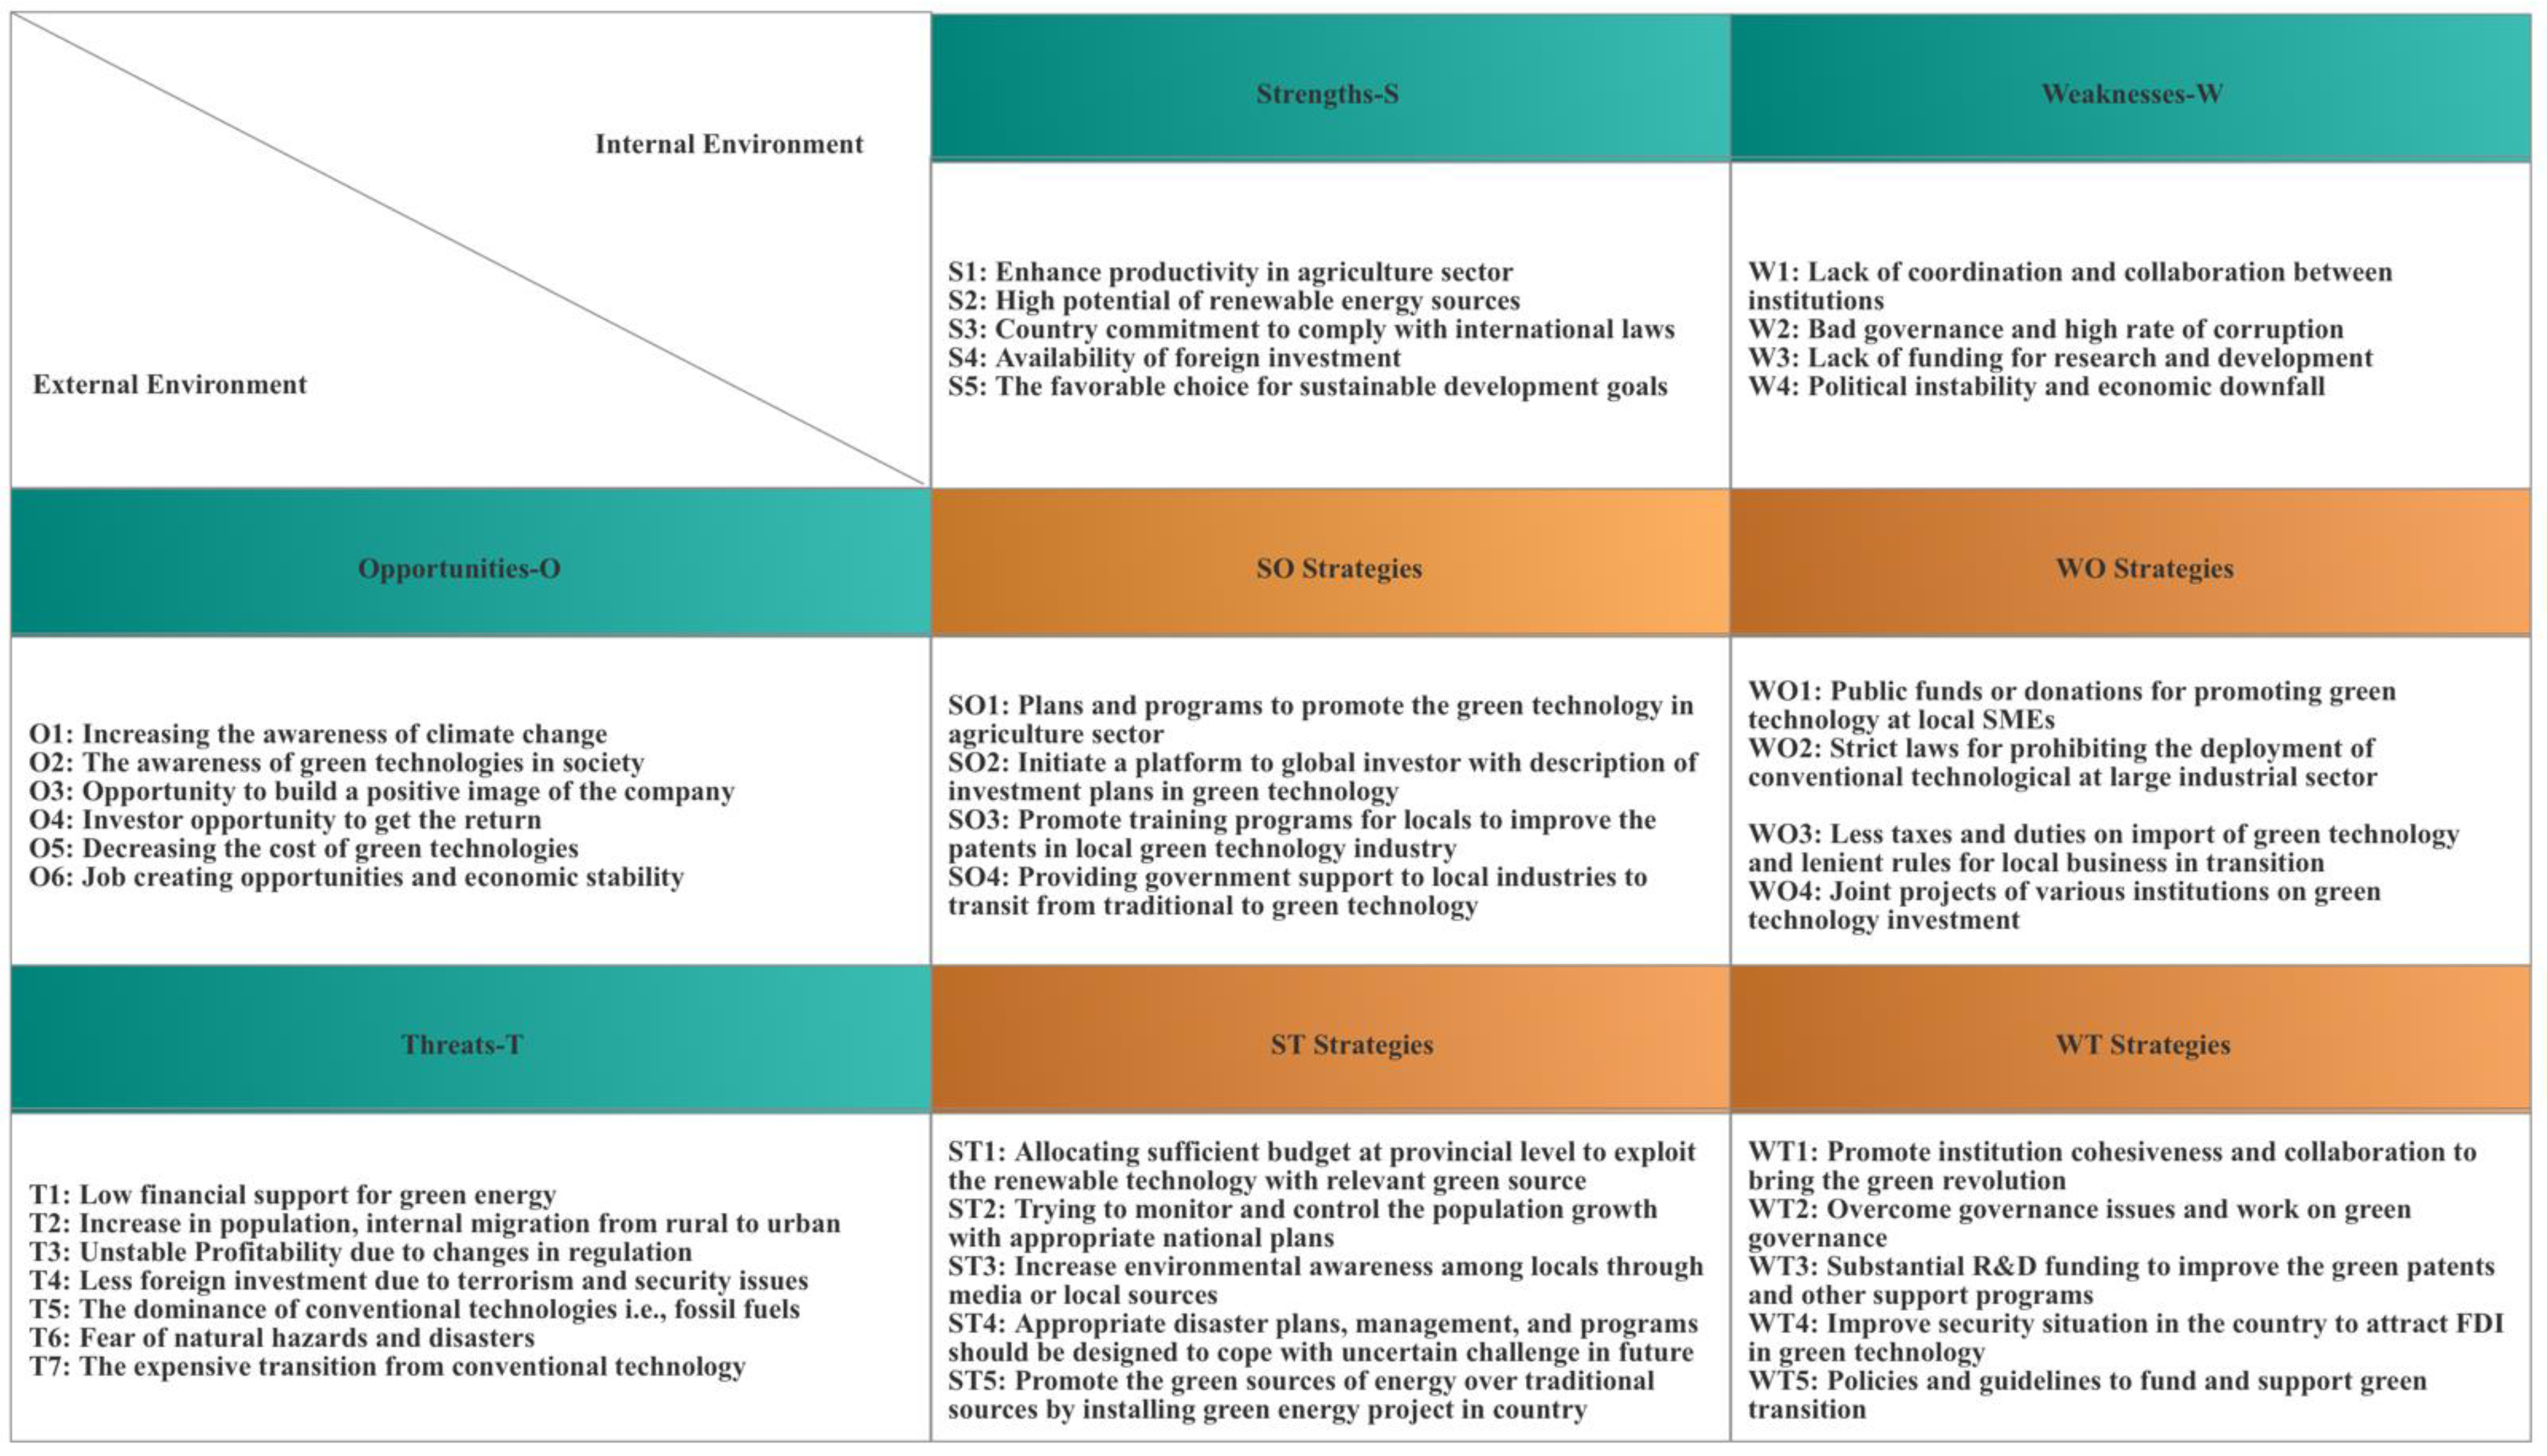
This study attempts to provide SWOT strategies for GT investment in a single country context based on SWOT factors. First, we separately identified the Strength, Weaknesses, Opportunities, and Threats in green technology and prioritized the sub-factor with the help of GAHP. As a second phase, we merged internal and external factors as Strength–Opportunity, Weakness–Opportunity, Strength–Threat, and Weakness–threat. Finally, we prioritized twenty-one green technology strategies by utilizing the GTOPIS approach. Strength–Opportunity (SO) strategies can help exploit opportunities with relevant strengths when applied in specific circumstances.
In contrast, Weakness–Opportunity (WO) strategies are helpful to reduce or minimize the impact of weakness by exploiting opportunities appropriately. Strength–Threat (ST) strategies provide an opportunity to overcome possible threats by rightfully exploiting strength. By exploiting Weakness–Threat (WT), opportunities represent minimizing the weakness to avoid potential threats. SO, WO, ST, and WO strategic models for green technology are presented in Figure 9.
4.3.1. Strength—Opportunity (SO) Strategies
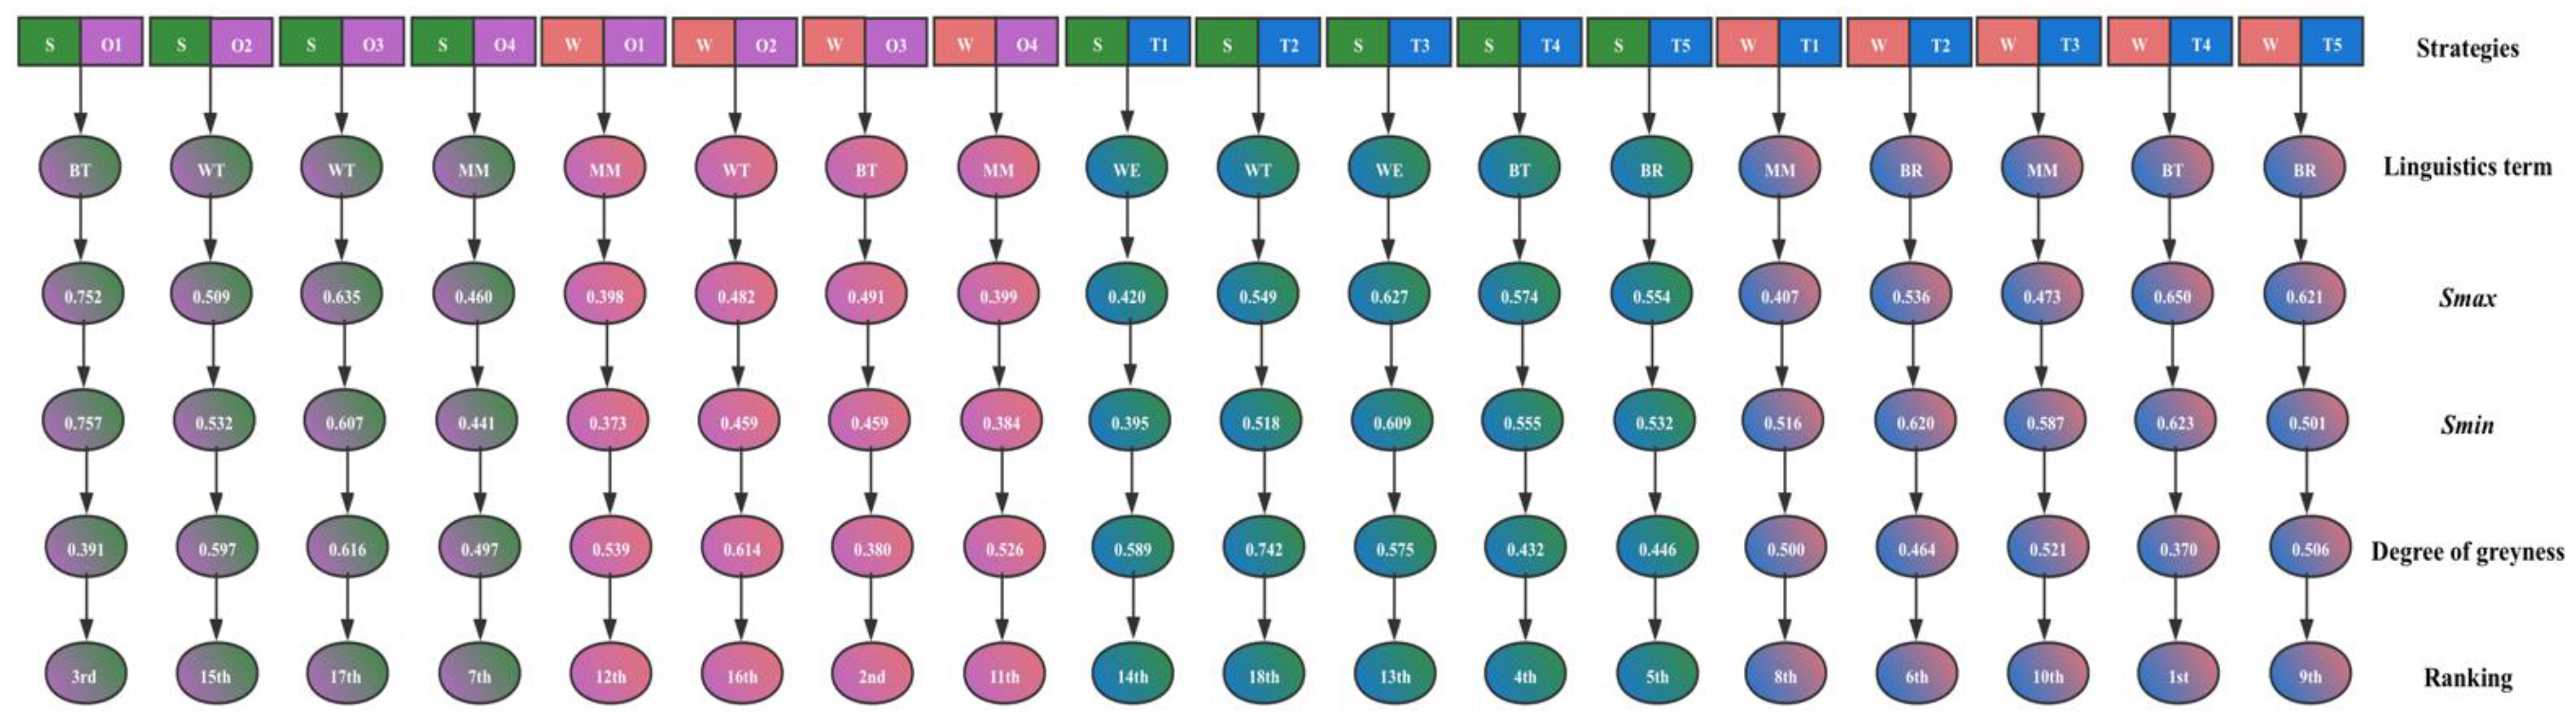
Under the SO strategy category, the following strategies are in Figure 10. The ranking of SO strategies analyzed by using the GTOPSIS method is in Table 4. GTOPSIS offers optimal positive and negative ideal solutions of alternatives. The final ranking of SWOT strategies for green technology in Pakistan is based on greyness, which implies that the lower value of greyness degree tends towards the high priority of strategy and vice versa. Plans and programs to promote green technology in the agriculture sector (SO1) are ranked as the third most optimal strategy by receiving a weight of 0.3910599. Pakistan’s government needs to formulate and implement policies to help the agriculture sector transition from traditional to green technologies. As Pakistan is an agrarian country blessed with all types of natural resources, this edge must be utilized by attracting global investors to invest in green technology across sectors. On the other hand, initiating a platform to global investors with descriptions of investment plans in GT (SO2) appeared in the 15th position with a weight of 0.596673.
Furthermore, promoting training programs for locals to improve patents in the local GT industry (SO3) appeared the least essential strategy because it received a grey degree of 0.6164829, and providing government support to local industries to transit from traditional to green technology (SO4) came in at the seventh position. The detailed description of construction decision matrix and grey weighted decision matrix is provided in Table 5 and Table 6. The government must support the local tech market to improve their work in technology and help local SMEs deploy GTs by lowering imports and other taxes on subsidies. GT can enable conservation of the environment. Knowing the population while promoting important green subjects in all educational fields will help to excel respective sectors of the country and help the environment [79,80].
4.3.2. Strength—Threat’s Strategies
Although Pakistan has excellent potential for renewables across this process, poverty, lack of budget, corruption, and poor policy implementation make it hard to exploit green strengths. Under the ST strategy category, the following strategies have been formed and shown in Figure 10. Allocating sufficient budget at the provincial level to exploit renewable technology with relevant green source (ST1) received 0.5886639 degrees of dryness. It stood at the fourteen positions among twenty-two green technology strategies. On the other hand, trying to monitor and control population growth with appropriate national plans (ST2) and increase environmental awareness among locals by using media or local sources (ST3) obtained 0.742203 and 0.5753286 weights, as shown in Figure 11.
Designing appropriate disaster plans, management, and programs can be considered to cope with uncertain challenges in the future (ST4) and promoting green sources of energy over traditional sources by installing green energy projects in this country (ST5) are recorded as the top five most crucial green technology strategies for sustainable investment and they obtained a degree of greyness at 0.431739 and 0.4455792, respectively. While raising awareness in locals with media help, authorities must allocate sufficient budget to each province according to their renewable potential and make proper plans to execute green technology strategies. In this manner, the country would be able to reduce fossil fuels’ dependence by deploying more green resources and technology for energy production.
4.3.3. Weakness—Opportunity Strategies
Under the WO strategy category, the following strategies have been developed and are presented in Figure 7. Fewer taxes and duties on importing green technology and lenient rules for local business transition (WO3) is considered the second most favorable strategy in SWOT strategies by obtaining a grey degree of 0.3802788. In contrast, public funds or donations for promoting green technology at local SMEs (WO1), strict laws for prohibiting the deployment of conventional technologies in large industrial sectors (WO2), and joint projects of various institutions on green technology investment (WO4) are recorded as moderately favorable strategies in SWOT green technology strategies paradigm by obtaining grey degrees of 0.5387283, 0.6135426, and 0.5263137, respectively. Local businesses need funds and support to utilize green technology for maximum efficiency. In order to overcome funding issues, the government must look up FDI (Foreign Direct Investment) options to invest in local SMEs (Small Medium Enterprises) and look for options for collaboration in SMEs to promote green technology.
4.3.4. Weakness—Threat Strategies
Figure 11 presents WO strategies for green technology. Improving the security situation in the country to attract FDI in green technology (WT4) is recorded as the topmost strategy by obtaining a greyness degree of 0.3694977, followed by overcoming governance issues and working on green governance (WT2), promoting institution cohesiveness and collaboration to bring about green revolution (WT1), policies and guidelines to fund and support green transition (WT5), and substantial R&D funding to improve green patents and other support programs (WT3). The value of greyness degree is listed in Figure 11.
Pakistan has fought the war against terrorism for almost 20 years now, which has affected its economy, infrastructure, and FDI [81]. Poor governance, unawareness, and corruption worsened the situation. With poor security systems and a lack of support from authorities and locals, foreign investors were pushed back by the fear of terrorism [82]. Since 2015, the situation is improving with each passing month, but the economy has been shattered. Pakistan has improved the security situation and opened the door for FDI; despite substantial efforts, the desired outcome has not yet been achieved. Corruption, poverty, infrastructure, and security are all factors that are interlinked. Institutions need to work together to overcome the damage caused by terrorism in Pakistan.
Pakistan has had acute corruption and governance issues in the country for years. To promote GT at the national level in order to overcome environmental challenges, the government must encourage cohesiveness and collaboration among various institutions. Policies and plans must be established to improve security conditions to attract FDI in the country. Lastly, the government must allocate a sufficient budget for R&D.
5. Conclusions and Policy Implications
This study is the first to develop and assess GT strategies for sustainable development by using integrated SWOT-grey AHP and grey TOPSIS approach. To perform this, we combined SWOT internal and external factors such as Strength–Opportunity, Weakness–Opportunity, Strength–Threat, and Weakness–threat and prioritized twenty-one green technology strategies. We explored twenty-two sub-factors of green technology under four categories of SWOT main factors: Strengths, Weaknesses, Opportunities, and Threats and twenty-two sub-factors and determined their weights by using a novel GAHP method based on their relative importance. The results reveal that Strengths (S) and Opportunities (O) are the most critical SWOT factors with the highest score of 0.35932 and 0.2725 for initiating the green technology program in Pakistan. On the other hand, high productivity potential in the agriculture sector (S1), less foreign investment due to terrorism and security issues (T4), decreasing the cost of GTs (O5), and the opportunity to build a positive image are vital SWOT sub-factors of GT strategic planning in this developing country context.
The outcomes of this study provide a pathway to appropriate strategies for implementing GT in a developing county context, which include strength opportunity (SO) and strength threat (ST). ST strategies include allocating budget for creating awareness on how to take advantage of renewable energy resources and develop appropriate alternate strategies for switching from conventional energy resources to green energy resources. SO includes developing and deploying investment plans to facilitate GTs and training programs on sourcing and implementing technologies for energy generation with the public sector’s support for small and medium enterprises. These combined results are span boundaries, enabling policy, practitioners, and future scholarly studies. Improving security situation in the country to attract FDI in green technology (WT4), fewer taxes and duties on import of green technology and lenient rules for local business in transition (WO3), and plans and programs to promote green technology in the agriculture sector (SO1) are considered the most promising strategies for green technology and green finance planning in Pakistan.
The research summarized in this study aims to provide three significant contributions to the GT literature. First, the literature lacks understanding as to the collective factors of GT implementations and how they enhance strategic decision making to leverage resources to exploit opportunities to achieve sustainable development objectives. While previous literature has examined the establishment of evaluation index weight of GT innovation in the manufacturing industry, little to no research has identified the key opportunities and threats in implementing the GT planning process. Second, previous researchers suggested that possible identification barriers in GT adoption and transformation are necessary to develop a policy framework for overcoming impediments to facilitate decision making. Our study narrows the gap between the strategic planning and implementation process by providing policymakers with pathways to address impediments in implementing GT initiatives successfully. Third, a fundamental challenge to the organization is a lack of understanding of potential GT adoption opportunities and transformation in organizations. This study is the first study to develop an integrated framework for GT planning in a developing country context.
We have various contributions and new insights regarding GT initiatives in developing countries for achieving the Sustainable Development Goals (SDGs). The results of this study have far-reaching policy implications at national and regional levels as a modeling tool enabling decision making and progress toward global goals of sustainable development. This study fills a gap in the literature by developing an integrated framework of green technology strategies. Furthermore, this study proposed that the integrated methodology comprises SWOT-GAHP and GTOPSIS for identifying internal/external green technology factors and sub-factors and assesses GT strategies in a developing country context. These methods and this modeling approach provide a foundation to include multiple criteria in policy-making decisions. Finally, our findings help policymakers, strategic planners, and government agencies in the process of green technology planning.
Managerial Implications and Future Research
Our research provides several theoretical and practical implications. Theoretical implications include exploring SWOT main factors and sub-factors and developing GT strategies by proposing a taxonomy of GT indicators to achieve sustainable development. We also observe benefits for increased green business practices and sustainable development planning from an integrated approach at a country level. We predict additional benefits from integrated management at the firm level and provide this opportunity for future research.
A practical implication identified from the study is that our framework can help decision makers, planners, and government agencies develop GT strategies at a country level. The application of SWOT-GAHP and GTOPSIS provides a new insight where the agriculture sector has a high potential for GT investment because Pakistan’s economy is highly dependent on agriculture. This framework can be applied to other developing countries to help align investment in technologies and industries that align with the United Nation’s SDGs. An important take away is that Pakistan should improve its security situation as this will help to open the door for FDIs in GT.
The underlying purpose of this research is to identify and assess GT strategies for more sustainable financial planning in a developing county context. We have provided a foundation for these strategies based on a literature review and built upon prior work in this field using modeling and expert insight. Future research can build on this study by developing other factors to help formulate GT strategies by using other MCDM methods to ensure sustainable GT planning for developing countries while applying our methods to countries, regions, and industries.
Author Contributions
Conceptualization, M.I.; methodology, M.I.; software, M.I.; validation, M.I., R.S, U.A. and N.A.; formal analysis, M.I.; investigation, M.I.; resources, M.I.; data curation, M.I.; writing—original draft preparation, M.I.; writing—review and editing, M.I, R.S., U.A. and N.A.; visualization, M.I.; supervision, M.I. and R.S.; project administration, M.I.; funding acquisition, M.I. All authors have read and agreed to the published version of the manuscript.
Funding
This research received no external funding.
Institutional Review Board Statement
Not applicable.
Informed Consent Statement
Not applicable.
Data Availability Statement
Not applicable.
Conflicts of Interest
The authors declare no conflict of interest.
References
- Du, K.; Li, J. Towards a green world: How do green technology innovations affect total-factor carbon productivity. Energy Policy 2019, 131, 240–250. [Google Scholar] [CrossRef]
- Hottenrott, H.; Rexhäuser, S.; Veugelers, R. Organisational change and the productivity effects of green technology adoption. Resour. Energy Econ. 2016, 43, 172–194. [Google Scholar] [CrossRef] [Green Version]
- Abid, N.; Ikram, M.; Wu, J.; Ferasso, M. Towards environmental sustainability: Exploring the nexus among ISO 14001, governance indicators and green economy in Pakistan. Sustain. Prod. Consum. 2021, 27, 653–666. [Google Scholar] [CrossRef]
- Solow, R.M. Technical Change and the Aggregate Production Function. Rev. Econ. Stat. 1957, 39, 312. [Google Scholar] [CrossRef] [Green Version]
- Ikram, M.; Zhang, Q.; Sroufe, R.; Shah, S.Z.A. Towards a sustainable environment: The nexus between ISO 14001, renewable energy consumption, access to electricity, agriculture and CO2 emissions in SAARC countries. Sustain. Prod. Consum. 2020, 22, 218–230. [Google Scholar] [CrossRef]
- Zhu, L.; Luo, J.; Dong, Q.; Zhao, Y.; Wang, Y.; Wang, Y. Green technology innovation efficiency of energy-intensive industries in China from the perspective of shared resources: Dynamic change and improvement path. Technol. Forecast. Soc. Change 2021, 170, 120890. [Google Scholar] [CrossRef]
- Bai, Y.; Song, S.; Jiao, J.; Yang, R. The impacts of government R&D subsidies on green innovation: Evidence from Chinese energy-intensive firms. J. Clean. Prod. 2019, 233, 819–829. [Google Scholar] [CrossRef]
- Burström, T.; Parida, V.; Lahti, T.; Wincent, J. AI-enabled business-model innovation and transformation in industrial ecosystems: A framework, model and outline for further research. J. Bus. Res. 2021, 127, 85–95. [Google Scholar] [CrossRef]
- Sikder, A.; Inekwe, J.; Bhattacharya, M. Economic output in the era of changing energy-mix for G20 countries: New evidence with trade openness and research and development investment. Appl. Energy 2019, 235, 930–938. [Google Scholar] [CrossRef]
- Geddes, A.; Schmidt, T.S.; Steffen, B. The multiple roles of state investment banks in low-carbon energy finance: An analysis of Australia, the UK and Germany. Energy Policy 2018, 115, 158–170. [Google Scholar] [CrossRef]
- OECD. Green Investment Banks. In Scaling up Private Investment in Low-Carbon, Climate-Resilient Infrastructure; OECD Green Finance and Investment Series; OECD: Paris, France, 2016; Available online: https://www.oecd.org/environment/cc/green-investment-banks-9789264245129-en.htm (accessed on 3 March 2021).
- Darko, A.; Chan, A.P.C.; Ameyaw, E.E.; He, B.J.; Olanipekun, A.O. Examining issues influencing green building technologies adoption: The United States green building experts’ perspectives. Energy Build. 2017, 144, 320–332. [Google Scholar] [CrossRef] [Green Version]
- Yaqoot, M.; Diwan, P.; Kandpal, T.C. Review of barriers to the dissemination of decentralized renewable energy systems. Renew. Sustain. Energy Rev. 2016, 58, 477–490. [Google Scholar] [CrossRef]
- Gupta, P.; Anand, S.; Gupta, H. Developing a roadmap to overcome barriers to energy efficiency in buildings using best worst method. Sustain. Cities Soc. 2017, 31, 244–259. [Google Scholar] [CrossRef]
- Agyemang, M.; Zhu, Q.; Adzanyo, M.; Antarciuc, E.; Zhao, S. Evaluating barriers to green supply chain redesign and implementation of related practices in the West Africa cashew industry. Resour. Conserv. Recycl. 2018, 136, 209–222. [Google Scholar] [CrossRef]
- Zhang, G.; Deng, N.; Mou, H.; Zhang, Z.G.; Chen, X. The impact of the policy and behavior of public participation on environmental governance performance: Empirical analysis based on provincial panel data in China. Energy Policy 2019, 129, 1347–1354. [Google Scholar] [CrossRef]
- Yin, S.; Zhang, N.; Li, B.; Dong, H. Enhancing the effectiveness of multi-agent cooperation for green manufacturing: Dynamic co-evolution mechanism of a green technology innovation system based on the innovation value chain. Environ. Impact Assess. Rev. 2021, 86, 106475. [Google Scholar] [CrossRef]
- Wakeford, J.J.; Gebreeyesus, M.; Ginbo, T.; Yimer, K.; Manzambi, O.; Okereke, C.; Black, M.; Mulugetta, Y. Innovation for green industrialisation: An empirical assessment of innovation in Ethiopia’s cement, leather and textile sectors. J. Clean. Prod. 2017, 166, 503–511. [Google Scholar] [CrossRef]
- Zhang, W.; Li, G. Environmental decentralization, environmental protection investment, and green technology innovation. Environ. Sci. Pollut. Res. 2020, 1–16. [Google Scholar] [CrossRef]
- Weforum. How Cleantech Can Help Power Pakistan’s Green Revolution. 2019. Available online: https://www.weforum.org/agenda/2019/09/how-cleantech-can-help-power-pakistans-green-revolution/ (accessed on 3 March 2020).
- Sroufe, R. Integrated Management: How Sustainability Creates Value for Any Business; Emerald Group Publishing: Bingley, UK, 2018. [Google Scholar]
- Peng, B.; Zheng, C.; Wei, G.; Elahi, E. The cultivation mechanism of green technology innovation in manufacturing industry: From the perspective of ecological niche. J. Clean. Prod. 2020, 252, 119711. [Google Scholar] [CrossRef]
- Xia, D.; Zhang, M.; Yu, Q.; Tu, Y. Developing a framework to identify barriers of Green technology adoption for enterprises. Resour. Conserv. Recycl. 2019, 143, 99–110. [Google Scholar] [CrossRef]
- Fujii, H.; Managi, S. Decomposition analysis of sustainable green technology inventions in China. Technol. Forecast. Soc. Change 2019, 139, 10–16. [Google Scholar] [CrossRef] [Green Version]
- Dhir, A.; Malodia, S.; Awan, U.; Sakashita, M.; Kaur, P. Extended valence theory perspective on consumers’ e-waste recycling intentions in Japan. J. Clean. Prod. 2021, 312, 127443. [Google Scholar] [CrossRef]
- Saunila, M.; Ukko, J.; Rantala, T. Sustainability as a driver of green innovation investment and exploitation. J. Clean. Prod. 2018, 179, 631–641. [Google Scholar] [CrossRef]
- Nasiri, M.; Rantala, T.; Saunila, M.; Ukko, J.; Rantanen, H. Transition towards Sustainable Solutions: Product, Service, Technology, and Business Model. Sustainability 2018, 10, 358. [Google Scholar] [CrossRef] [Green Version]
- Schreurs, M.A. Breaking the impasse in the international climate negotiations: The potential of green technologies. Energy Policy 2012, 48, 5–12. [Google Scholar] [CrossRef]
- Dangelico, R.M.; Pujari, D. Mainstreaming green product innovation: Why and how companies integrate environmental sustainability. J. Bus. Ethics 2010, 95, 471–486. [Google Scholar] [CrossRef]
- Bossle, M.B.; de Barcellos, M.D.; Vieira, L.M.; Sauvée, L. The drivers for adoption of eco-innovation. J. Clean. Prod. 2016, 113, 861–872. [Google Scholar] [CrossRef]
- Xie, X.; Huo, J.; Zou, H. Green process innovation, green product innovation, and corporate financial performance: A content analysis method. J. Bus. Res. 2019, 101, 697–706. [Google Scholar] [CrossRef]
- Chen, Y.S. The driver of green innovation and green image—Green core competence. J. Bus. Ethics 2008, 81, 531–543. [Google Scholar] [CrossRef]
- Huang, L.C.; Ahlstrom, D.; Lee, A.Y.P.; Chen, S.Y.; Hsieh, M.J. High performance work systems, employee well-being, and job involvement: An empirical study. Pers. Rev. 2016, 45, 296–314. [Google Scholar] [CrossRef]
- Lisi, W.; Zhu, R.; Yuan, C. Embracing green innovation via green supply chain learning: The moderating role of green technology turbulence. Sustain. Dev. 2020, 28, 155–168. [Google Scholar] [CrossRef]
- Stucki, T. Which firms benefit from investments in green energy technologies?—The effect of energy costs. Res. Policy 2019, 48, 546–555. [Google Scholar] [CrossRef]
- Rauter, R.; Globocnik, D.; Perl-Vorbach, E.; Baumgartner, R.J. Open innovation and its effects on economic and sustainability innovation performance. J. Innov. Knowl. 2019, 4, 226–233. [Google Scholar] [CrossRef]
- Yasir, M.; Majid, A.; Qudratullah, H. Promoting environmental performance in manufacturing industry of developing countries through environmental orientation and green business strategies. J. Clean. Prod. 2020, 275, 123003. [Google Scholar] [CrossRef]
- Hullova, D.; Simms, C.D.; Trott, P.; Laczko, P. Critical capabilities for effective management of complementarity between product and process innovation: Cases from the food and drink industry. Res. Policy 2019, 48, 339–354. [Google Scholar] [CrossRef] [Green Version]
- Centobelli, P.; Cerchione, R.; Esposito, E. Pursuing supply chain sustainable development goals through the adoption of green practices and enabling technologies: A cross-country analysis of LSPs. Technol. Forecast. Soc. Change 2020, 153, 119920. [Google Scholar] [CrossRef]
- Fernandes, C.I.; Veiga, P.M.; Ferreira, J.J.M.; Hughes, M. Green growth versus economic growth: Do sustainable technology transfer and innovations lead to an imperfect choice? Bus. Strateg. Environ. 2021, 30, 2021–2037. [Google Scholar] [CrossRef]
- Song, M.; Wang, S. Market competition, green technology progress and comparative advantages in China. Manag. Decis. 2018, 56, 188–203. [Google Scholar] [CrossRef]
- Paul, J.; Modi, A.; Patel, J. Predicting green product consumption using theory of planned behavior and reasoned action. J. Retail. Consum. Serv. 2016, 29, 123–134. [Google Scholar] [CrossRef]
- Saunila, M.; Rantala, T.; Ukko, J.; Havukainen, J. Why invest in green technologies? Sustainability engagement among small businesses. Technol. Anal. Strateg. Manag. 2019, 31, 653–666. [Google Scholar] [CrossRef]
- Hojnik, J.; Ruzzier, M. What drives eco-innovation? A review of an emerging literature. Environ. Innov. Soc. Transit. 2016, 19, 31–41. [Google Scholar] [CrossRef]
- Cainelli, G.; D’Amato, A.; Mazzanti, M. Resource efficient eco-innovations for a circular economy: Evidence from EU firms. Res. Policy 2020, 49, 103827. [Google Scholar] [CrossRef]
- Sedghiyan, D.; Ashouri, A.; Maftouni, N.; Xiong, Q.; Rezaee, E.; Sadeghi, S. Prioritization of renewable energy resources in five climate zones in Iran using AHP, hybrid AHP-TOPSIS and AHP-SAW methods. Sustain. Energy Technol. Assess. 2021, 44, 101045. [Google Scholar] [CrossRef]
- Shah, S.A.A.; Longsheng, C.; Solangi, Y.A.; Ahmad, M.; Ali, S. Energy trilemma based prioritization of waste-to-energy technologies: Implications for post-COVID-19 green economic recovery in Pakistan. J. Clean. Prod. 2021, 284, 124729. [Google Scholar] [CrossRef]
- Anser, M.K.; Mohsin, M.; Abbas, Q.; Chaudhry, I.S. Assessing the integration of solar power projects: SWOT-based AHP—F-TOPSIS case study of Turkey. Environ. Sci. Pollut. Res. 2020, 27, 31737–31749. [Google Scholar] [CrossRef]
- Hamurcu, M.; Eren, T. Electric bus selection with multicriteria decision analysis for green transportation. Sustainability 2020, 12, 2777. [Google Scholar] [CrossRef] [Green Version]
- Shah, S.A.A.; Solangi, Y.A.; Ikram, M. Analysis of barriers to the adoption of cleaner energy technologies in Pakistan using Modified Delphi and Fuzzy Analytical Hierarchy Process. J. Clean. Prod. 2019, 235, 1037–1050. [Google Scholar] [CrossRef]
- Solangi, Y.A.; Tan, Q.; Mirjat, N.H.; Ali, S. Evaluating the strategies for sustainable energy planning in Pakistan: An integrated SWOT-AHP and Fuzzy-TOPSIS approach. J. Clean. Prod. 2019, 236, 117655. [Google Scholar] [CrossRef]
- Awan, U.; Kraslawski, A.; Huiskonen, J.; Suleman, N. Exploring the Locus of Social Sustainability Implementation: A South Asian Perspective on Planning for Sustainable Development. In Universities and Sustainable Communities: Meeting the Goals of the Agenda 2030; Springer: Cham, Switzerland, 2020. [Google Scholar]
- Si, J.; Marjanovic-Halburd, L. Criteria weighting for green technology selection as part of retrofit decision making process for existing non-domestic buildings. Sustain. Cities Soc. 2018, 41, 625–638. [Google Scholar] [CrossRef] [Green Version]
- Sun, L.; Miao, C.; Yang, L. Ecological-economic efficiency evaluation of green technology innovation in strategic emerging industries based on entropy weighted TOPSIS method. Ecol. Indic. 2017, 73, 554–558. [Google Scholar] [CrossRef]
- Ekholm, T.; Karvosenoja, N.; Tissari, J.; Sokka, L.; Kupiainen, K.; Sippula, O.; Savolahti, M.; Jokiniemi, J.; Savolainen, I. A multi-criteria analysis of climate, health and acidification impacts due to green house gases and air pollution—The case of household—Level heating technologies. Energy Policy 2014, 74, 499–509. [Google Scholar] [CrossRef]
- Ikram, M.; Zhang, Q.; Sroufe, R. Developing integrated management systems using an AHP-Fuzzy VIKOR approach. Bus. Strateg. Environ. 2020, 29, 2265–2283. [Google Scholar] [CrossRef]
- D’Adamo, I.; Falcone, P.M.; Gastaldi, M.; Morone, P. RES-T trajectories and an integrated SWOT-AHP analysis for biomethane. Policy implications to support a green revolution in European transport. Energy Policy 2020, 138, 111220. [Google Scholar] [CrossRef]
- Wang, Y.; Xu, L.; Solangi, Y.A. Strategic renewable energy resources selection for Pakistan: Based on SWOT-Fuzzy AHP approach. Sustain. Cities Soc. 2020, 52, 101861. [Google Scholar] [CrossRef]
- Lee, J.; Kim, I.; Kim, H.; Kang, J. SWOT-AHP analysis of the Korean satellite and space industry: Strategy recommendations for development. Technol. Forecast. Soc. Change 2020, 164, 120515. [Google Scholar] [CrossRef]
- Kumar, S.; Maithani, R.; Kumar, A. Materials Today: Proceedings Optimal design parameter selection for performance of alumina nano-material particles and turbulence promotors in heat exchanger: An AHP-TOPSIS technique. Mater. Today Proc. 2021, 42, 1498–1501. [Google Scholar] [CrossRef]
- Kurttila, M.; Pesonen, M.; Kangas, J.; Kajanus, M. Utilizing the analytic hierarchy process (AHP) in SWOT analysis—A hybrid method and its application to a forest-certification case. For. Policy Econ. 2000, 1, 41–52. [Google Scholar] [CrossRef]
- Ikram, M.; Zhang, Q.; Sroufe, R.; Ferasso, M. Contribution of Certification Bodies and Sustainability Standards to Sustainable Development Goals: An Integrated Grey Systems Approach. Sustain. Prod. Consum. 2021, 28, 326–345. [Google Scholar] [CrossRef]
- Thakkar, J.J. Application of Integrated Approach of Grey AHP and Grey TOPSIS. In Multi-Criteria Decision Making; Springer: Singapore, 2021; pp. 325–338. [Google Scholar]
- Sahoo, S.; Dhar, A.; Kar, A. Environmental vulnerability assessment using Grey Analytic Hierarchy Process based model. Environ. Impact Assess. Rev. 2016, 56, 145–154. [Google Scholar] [CrossRef]
- Javed, S.A.; Liu, S. Evaluation of project management knowledge areas using grey incidence model and AHP. In Proceedings of the 2017 International Conference on Grey Systems and Intelligent Services (GSIS), Stockholm, Sweden, 8–11 August 2017; p. 120. [Google Scholar] [CrossRef]
- Bu, H.; Guo, X.; Chen, S. Grey analytic hierarchy process applied to effectiveness evaluation for crime prevention system. In Proceedings of the 2010 International Conference on Biomedical Engineering and Computer Science (ICBECS 2010), Wuhan, China, 23–25 April 2010; pp. 1–4. [Google Scholar] [CrossRef]
- Ikram, M.; Sroufe, R.; Zhang, Q. Prioritizing and overcoming barriers to integrated management system (IMS) implementation using AHP and G-TOPSIS. J. Clean. Prod. 2020, 254, 120121. [Google Scholar] [CrossRef]
- Ikram, M.; Sroufe, R.; Rehman, E.; Shah, S.Z.A.; Mahmoudi, A. Do Quality, Environmental, and Social (QES) Certifications Improve International Trade? A Comparative Grey Relation Analysis of Developing vs. Developed Countries. Phys. A Stat. Mech. Its Appl. 2020, 545, 123486. [Google Scholar] [CrossRef]
- Guo, S.; Li, Y.; Dong, F.; Li, B.; Yang, Y. Multi-attribute grey target decision-making based on ‘kernel’ and double degree of greyness. J. Grey Syst. 2019, 31, 27–36. [Google Scholar]
- Yoon, K.; Hwang, C.L. Manufacturing plant location analysis by multiple attribute decision making: Part isingle plant strategy. Int. J. Prod. Res. 1985, 23, 345–359. [Google Scholar] [CrossRef]
- Irfan, M.; Hao, Y.; Ikram, M.; Wu, H.; Akram, R.; Rauf, A. Assessment of the public acceptance and utilization of renewable energy in Pakistan. Sustain. Prod. Consum. 2021, 27, 312–324. [Google Scholar] [CrossRef]
- Awan, U.R.; Nauman, S.; Sroufe, R. Exploring the effect of buyer engagement on green product innovation: Empirical evidence from manufacturers. Bus. Strateg. Environ. 2020, 30, 463–477. [Google Scholar] [CrossRef]
- Awan, U.; Arnold, M.G.; Gölgeci, I. Enhancing green product and process innovation: Towards an integrative framework of knowledge acquisition and environmental investment. Bus. Strateg. Environ. 2021, 30, 1283–1295. [Google Scholar] [CrossRef]
- Bakaki, Z.; Böhmelt, T.; Ward, H. The triangular relationship between public concern for environmental issues, policy output, and media attention. Environ. Polit. 2020, 29, 1157–1177. [Google Scholar] [CrossRef]
- Wang, C.H. An environmental perspective extends market orientation: Green innovation sustainability. Bus. Strateg. Environ. 2020, 29, 3123–3134. [Google Scholar] [CrossRef]
- Bildirici, M.; Gokmenoglu, S.M. The impact of terrorism and FDI on environmental pollution: Evidence from Afghanistan, Iraq, Nigeria, Pakistan, Philippines, Syria, Somalia, Thailand and Yemen. Environ. Impact Assess. Rev. 2020, 81, 106340. [Google Scholar] [CrossRef]
- Rehman, E.; Ikram, M.; Feng, M.T.; Rehman, S. Sectoral-based CO2 emissions of Pakistan: A novel Grey Relation Analysis (GRA) approach. Environ. Sci. Pollut. Res. 2020, 27, 29118–29129. [Google Scholar] [CrossRef]
- Shah, S.A.A. Feasibility study of renewable energy sources for developing the hydrogen economy in Pakistan. Int. J. Hydrog. Energy 2020, 45, 15841–15854. [Google Scholar] [CrossRef]
- Wu, T.; Kung, C.-C. Carbon emissions, technology upgradation and financing risk of the green supply chain competition. Technol. Forecast. Soc. Change 2020, 152, 119884. [Google Scholar] [CrossRef]
- Yu, X.; Lan, Y.; Zhao, R. Strategic green technology innovation in a two-stage alliance: Vertical collaboration or co-development? Omega 2021, 98, 102116. [Google Scholar] [CrossRef]
- Shahzad, S.J.H.; Zakaria, M.; Rehman, M.U.; Ahmed, T.; Fida, B.A. Relationship Between FDI, Terrorism and Economic Growth in Pakistan: Pre and Post 9/11 Analysis. Soc. Indic. Res. 2016, 127, 179–194. [Google Scholar] [CrossRef]
- Nadeem, M.A.; Liu, Z.; Younis, A.; Asghar, F.; Ghani, U.; Xu, Y. How governance structure, terrorism, and internationalisation affect innovation? Evidence from Pakistan. Technol. Anal. Strateg. Manag. 2021, 33, 670–684. [Google Scholar] [CrossRef]
Figure 1.
A framework of integrated green technology flows.

Figure 2.
Green technology strategic roadmap for sustainable planning.

Figure 3.
Classification of green technology.

Figure 4.
A schematic framework of integrated methods utilized in this study.

Figure 5.
SWOT main factors and sub-factors.

Figure 6.
Ranking of SWOT factors.

Figure 7.
Ranking evaluation of SWOT sub-factors.

Figure 8.
Overall Ranking of SWOT sub-factors.

Figure 9.
SWOT based strategic green technology model.

Figure 10.
SO, WO, ST, and WO strategic model for green technology.

Figure 11.
Final ranking of green technology strategies.


Table 1.
Summary of MCDM method used in green technology studies.
| Study | Region | Application Area | Study Objective | Research Problem | Method/ Approach | Criteria | Study Outcomes | |||
|---|---|---|---|---|---|---|---|---|---|---|
| Env | Soc. | Eco. | Others | |||||||
| [46] | Iran | Selection of optimal energy technologies | Prioritization of renewable energy resource | Due to increasing usage of fossil fuels for generation of electricity, further study is needed to develop environmental sustainability in five regions of Iran. | AHP, TOPSIS, and SAW | X | X | X | X | Economic criteria recorded the most influencing criteria for renewable resources and environmental sustainability in Iran. |
| [47] | Pakistan | Selection of energy to waste technologies | Assessment of energy to waste technologies for green growth: A post-COVID-19 scenario. | Massive level of waste generation in different sectors can be utilize for as feedstock for electricity generations. | Fuzzy ANP, Fuzzy DEMATEL, Fuzzy VIKOR | X | X | X | The technology of gasification was analyzed along with the most favorable technology for generating energy from waste. It is concluded that there is need for green technology to cop up pollution and emissions problems to prevent the economy from future crises. | |
| [48] | Turkey | Site selection for solar energy projects | A case study on assessing the integration of solar power projects | There is a huge potential of solar energy production in Turkey, but selection of optimal site is still under investigation to install the solar projects in Turkey. | AHP and Fuzzy VIKOR | X | X | X | X | Government influences to allocate land and road accessibility are the most influencing factors to install solar energy projects in Turkey. Moreover, it is recorded that the total 1527 kWh per square meter per year electricity can be produced every year through solar projects |
| [49] | Egypt | Green Transportation | Selection of electric bus for green transportation. | Ankara is a highly populated area with heavy traffic that produces emissions and has adverse effects on human health and environment. Therefore, there is a need to investigate the selection of electric buses to improve air quality and reduce emissions. | AHP and TOPSIS | X | X | X | ||
| [50] | Pakistan | Cleaner energy technologies | They are assessing the barriers to the implementation of cleaner energy technologies. | Pakistan has a severe shortfall of electricity. However, Pakistan has an excess amount of renewable energy sources but unfortunately the country remains unsuccessful in utilizing these sources in order to fulfill electricity demand. | Modify Delphi and Fuzzy AHP | X | X | X | Political instability and regulatory barriers are the most influencing barriers that have become hurdles in utilization of renewable energy sources in Pakistan. Based on the results, there is a need to establish an effective governance and institutional system to promote renewable energy policies. | |
| [51] | Pakistan | Sustainable Energy Planning | Evaluating the strategies for sustainable energy planning in Pakistan | Pakistan has rich sources of renewable and sustainable energy sources. The rapid increase in population growth and industrial development posits high demands of energy, which may raise the level of GHG emissions. Therefore, policymakers and experts need to develop strategic sustainable energy plan to promote renewable energy production as well as protect the ecosystem. | SWOT-AHP and Fuzzy TOPSIS | X | X | X | X | The government should emphasis and promote RE and provide low cost and sustainable electricity to residents, industries as well as commercial areas. This study provides policy guidelines for policymakers to develop strategies for sustainable energy planning in Pakistan. |
| [52] | Pakistan | Social Sustainability implementation | To identify the critical factors that hinder the implementation of social sustainability performance | There are several barriers with respect to implementing social sustainability to achieve Sustainable Development Goals (SDG3, SDG5, and SDG17) in Pakistan. In addition, this study identified existing barriers in manufacturing firms and provided solution to impede these barriers. | AHP | X | X | It analyzed that governance barriers are the most influencing barriers and become hurdles in the implementation of social sustainability practices in the manufacturing sector of Pakistan. | ||
| [23] | China | Green technology adoption | They are assessing the barriers of green technology adoption for enterprises. | The transformation of technology from conventional to green is a multifaceted process. In addition, the identifications of barriers that hinder implementing green technology are complicated. Therefore, this study is conducted to fills gaps in the literature. | Fuzzy AHP | X | X | X | This study developed a systematic decision-making model for green technology adoption for Chinese enterprises at micro levels. Furthermore, this study develops a decision support system to identify barriers such as psychological and competence barriers, which hinder the promotion of sustainable development and corporate environmental performance. | |
| [53] | United Kingdom (UK) | Green buildings technology | Selection of retrofit for non-domestic building by using green technology. | There are many factors and criteria involved in selection of green technology for retrofitting to existing buildings to reduce carbon emission and energy consumption. Therefore, a in-depth investigation is needed to dig out the most optimal solution to assess and rank the retrofitting of existing buildings. | AHP | X | X | X | X | This study developed an integrated green technology framework to select the appropriate green technology for retrofitting to existing buildings in order to reduce carbon emission and energy consumption. It has been observed that variable speed drives in air handling units were ranked the most effective criteria. |
| [54] | China | Green technology innovation | The evaluation of green technology innovation on ecological-economic efficiency of strategic emerging industries. | To identify obstacle factors in the implementation of green technology to improve ecological and economic efficiency. | Entropy weighted TOPSIS | X | X | This study proposed a systematic green technology innovation framework to evaluate environmental and economic efficiency. Moreover, two approached were identified to effectively implement green technologies such as internal integration (culture and institution) and external integration (knowledge and information). | ||
| [55] | Finland | Household heating technologies | We are prioritizing the six household-level heating technologies to improve climate and health standard. | Conventional household heating technologies have adverse effect on climate and human health. Therefore, the transformation of conventional household heating technologies to green technologies is needed to control the emissions and reduce PM2.5 in order to improve living standards. | AHP | X | X | X | This study proposed a framework based on the MCDM model to adopt green technology household heating technology to reduce the impact of climate change and improve air quality. In this study, the adoption of modern wood base chip combustion technologies was suggested for helping to minimize the exposure of PM 2.5 in non-urban areas. | |
| [56] | China | Integrated Management System | The development of integrated management systems for sustainable development | There are various management standards that have different features and benefits, but there is no standardized integrated management system that can be developed with the help of these management standards. Thus, there is a gap in literature. | AHP and Fuzzy VIKOR | X | X | X | The International Organization for Standardization (ISO) standards and Global Reporting Initiative (GRI) standards are the best standards for developing a dynamic integrated management system. | |
| [57] | Europe | Green Transport | The analysis of the current share of renewables in the European transport sector (RES-T) | How do the European member states perform prospects of biogas, biomethane development in terms of both RES-T share and per capita indexes, and what are the barriers hindering the achievement of sustainable development targets? | SWOT-AHP | X | X | X | X | This study suggested that the biomethane is a sustainable fuel for vehicles and it can replace other fuels to help the environment to become more sustainable. Moreover, the development of biomethane fuel can grow with the support of governments. |
Table 2.
Grey analytical hierarchy process scale.
| Scale | Linguistics | Abbreviation | Grey Numbers |
|---|---|---|---|
| 1 | Not Very Important | NVI | (1, 2) |
| 3 | Not Important | NI | (2, 4) |
| 5 | Undecided | U | (4, 6) |
| 7 | Important | I | (6, 8) |
| 9 | Very Important | VI | (8, 10) |
Table 3.
Grey linguistic variables with grey numbers.
| Linguistic Variables | Abbreviation | Grey Numbers |
|---|---|---|
| Worst | WT | (0.0, 0.2) |
| Worse | WE | (0.2, 0.4) |
| Medium | MM | (0.4, 0.6) |
| Better | BR | (0.6, 0.8) |
| Best | BT | (0.8, 1.0) |
Table 4.
Final ranking of GT sub-factors for sustainable planning.
| Main Attributes | Main Criteria Codes | Main Attribute Weights | Sub-Attributes Codes | Consistency Ratio (CR) | Normalized Weight |
|---|---|---|---|---|---|
| Strengths | S | 0.35932 | S1 | 0.0073 | 0.08146463 |
| S2 | 0.03023028 | ||||
| S3 | 0.05508253 | ||||
| S4 | 0.06500217 | ||||
| S5 | 0.03086326 | ||||
| Weakness | W | 0.15081 | W1 | 0.0001 | 0.01391418 |
| W2 | 0.04323837 | ||||
| W3 | 0.04070667 | ||||
| W4 | 0.01762218 | ||||
| Opportunity | O | 0.2725 | O1 | 0.0112 | 0.05339362 |
| O2 | 0.03430073 | ||||
| O3 | 0.08347127 | ||||
| O4 | 0.01930932 | ||||
| O5 | 0.08714887 | ||||
| O6 | 0.03995127 | ||||
| Threat | T | 0.21737 | T1 | 0.0002 | 0.04904463 |
| T2 | 0.01267542 | ||||
| T3 | 0.01534383 | ||||
| T4 | 0.08821172 | ||||
| T5 | 0.06322895 | ||||
| T6 | 0.05334007 | ||||
| T7 | 0.02671038 |
Table 5.
Decision matrix.
| (0.4,0.6) | (0.2,0.4) | (0.2,0.4) | (0.4,0.6) | (0.4,0.6) | (0,0.2) | (0.8,1.0) | ||||||||
| (0.6,0.8) | (0.8,1.0) | (0.6,0.8) | (0.8,1.0) | (0.2,0.4) | (0.6,0.8) | (0,0.2) | ||||||||
| (0.6,0.8) | (0.6,0.8) | (0.2,0.4) | (0,0.2) | (0.6,0.8) | (0.8,1.0) | (0,0.2) | ||||||||
| (0.4,0.6) | (0.2,0.4) | (0.6,0.8) | (0.6,0.8) | (0.2,0.4) | (0.8,1.0) | (0.4,0.6) | ||||||||
| (0.6,0.8) | (0.6,0.8) | (0.6,0.8) | (0.2,0.4) | (0.6,0.8) | (0.2,0.4) | (0.4,0.6) | ||||||||
| (0.8,1.0) | (0.4,0.6) | (0,0.2) | (0.8,1.0) | (0.2,0.4) | (0.8,1.0) | (0,0.2) | ||||||||
| (0.4,0.6) | (0.2,0.4) | (0,0.2) | (0,0.2) | (0.6,0.8) | (0.0,0.2) | (0.8,1.0) | ||||||||
| (0.6,0.8) | (0.2,0.4) | 0.4,0.6) | (0.6,0.8) | (0.6,0.8) | (0,0.2) | (0.4,0.6) | ||||||||
| (0.8,1.0) | (0.8,1.0) | (0.6,0.8) | (0.2,0.4) | (0.8,1.0) | (0.2,0.4) | (0.2,0.4) | ||||||||
| (0.4,0.6) | (0.2,0.4) | (0.2,0.4) | (0.6,0.8) | (0.6,0.8) | (0.6,0.8) | (0.0,0.2) | ||||||||
| (0.2,0.4) | (0.6,0.8) | (0.8,1.0) | (0.2,0.4) | (0.4,0.6) | (0.4,0.6) | (0.2,0.4) | ||||||||
| (0,0.2) | (0.2,0.4) | (0.6,0.8) | (0.8,1.0) | (0.2,0.4) | (0,0.2) | (0.8,1.0) | ||||||||
| (0.2,0.4) | (0.4,0.6) | (0.4,0.6) | (0.8,1.0) | (0.4,0.6) | (0.8,1.0) | (0.6,0.8) | ||||||||
| (0,0.2) | (0.4,0.6) | (0,0.2) | (0.2,0.4) | (0.2,0.4) | (0,0.2) | (0.4,0.6) | ||||||||
| (0.4,0.6) | (0.2,0.4) | (0.4,0.6) | (0.8,1.0) | (0.4,0.6) | (0.8,1.0) | (0.6,0.8) | ||||||||
| (0.4,0.6) | (0.6,0.8) | (0.6,0.8) | (0.4,0.6) | (0.8,1.0) | (0.2,0.4) | (0.4,0.6) | ||||||||
| (0.0,0.2) | (0.4,0.6) | (0.2,0.4) | (0.8,1.0) | (0.4,0.6) | (0.6,0.8) | (0.6,0.8) | ||||||||
| (0.2,0.4) | (0.0,0.2) | (0.6,0.8) | (0.2,0.4) | (0.6,0.8) | (0.2,0.4) | (0.2,0.4) | ||||||||
| (0.4,0.6) | (0.2,0.4) | (0.2,0.4) | (0.6,0.8) | (0.8,1.0) | (0.6,0.8) | (0.4,0.6) | ||||||||
| (0.2,0.4) | 0.4,0.6) | (0.8,1.0) | (0,0.2) | (0.2,0.4) | (0.2,0.4) | (0,0.2) | ||||||||
| (0.4,0.6) | (0.6,0.8) | (0.4,0.6) | (0.8,1.0) | (0.2,0.4) | (0.8,1.0) | (0.2,0.4) | ||||||||
| (0.6,0.8) | (0,0.2) | (0.6,0.8) | (0,0.2) | (0.4,0.6) | (0.2,0.4) | (0.8,1.0) | ||||||||
| (0.2,0.4) | (0.6,0.8) | (0.2,0.4) | (0.6,0.8) | (0.6,0.8) | (0.4,0.6) | (0,0.2) | ||||||||
| (0.4,0.6) | (0.8,1.0) | (0.4,0.6) | (0.8,1.0) | (0,0.2) | (0.6,0.8) | (0.2,0.4) | ||||||||
| (0,0.2) | (0,0.2) | (0.2,0.4) | (0.6,0.8) | (0,0.2 | (0.0,0.2) | (0.4,0.6) | ||||||||
| (0.2,0.4) | (0.4,0.6) | (0.2,0.4) | (0.4,0.6) | (0.4,0.6) | (0.4,0.6) | (0.2,0.4) | ||||||||
| (0.4,0.6) | (0.2,0.4) | (0.8,1.0) | (0.8,1.0) | (0.6,0.8) | (0.2,0.4) | (0.2,0.4) | ||||||||
| (0.8,1.0) | (0.6,0.8) | (0.6,0.8) | (0.6,0.8) | (0.8,1.0) | (0.4,0.6) | (0.8,1.0) | ||||||||
| (0.2,0.4) | (0.4,0.6) | (0.4,0.6) | (0.2,0.4) | (0.4,0.6) | (0.2,0.4) | (0.2,0.4) | ||||||||
| (0.4,0.6) | 0.4,0.6) | (0.2,0.4) | (0.6,0.8) | (0.2,0.4) | (0.8,1.0) | (0.8,1.0) | ||||||||
| (0.6,0.8) | (0,0.2) | (0.4,0.6) | (0.2,0.4) | (0.4,0.6) | (0.2,0.4) | (0,0.2) | ||||||||
| (0,0.2) | (0.2,0.4) | (0.2,0.4) | (0.6,0.8) | (0,0.2) | (0.6,0.8) | (0.6,0.8) | ||||||||
| (0.2,0.4) | (0.4,0.6) | (0.6,0.8) | (0.2,0.4) | (0.4,0.6) | (0.4,0.6) | (0.2,0.4) | ||||||||
| (0.6,0.8) | (0,0.2) | (0.4,0.6) | (0.4,0.6) | (0.2,0.4) | (0.4,0.6) | (0.4,0.6) | ||||||||
| (0.8,1.0) | (0,0.2 | (0,0.2) | (0,0.2) | (0,0.2) | (0.2,0.4) | (0.6,0.8) | ||||||||
| (0.4,0.6) | (0.8,1.0) | (0.8,1.0) | (0.6,0.8) | (0.8,1.0) | (0.4,0.6) | (0.2,0.4) | ||||||||
| (0.2,0.4) | (0.6,0.8) | (0.4,0.6) | (0.8,1.0) | (0.2,0.4) | (0.6,0.8) | (0.0,0.2) | (0.6,0.8) | |||||||
| (0.4,0.6) | (0.8,1.0) | (0.4,0.6) | (0,0.2) | (0.2,0.4) | (0.2,0.4) | (0.6,0.8) | (0.8,1.0) | |||||||
| (0.8,1.0) | (0.4,0.6) | (0,0.2) | (0.6,0.8) | (0.4,0.6) | (0.8,1.0) | (0.2,0.4) | (0.4,0.6) | |||||||
| (0.4,0.6) | (0.8,1.0) | (0.8,1.0) | (0.6,0.8) | (0.6,0.8) | (0,0.2) | (0.2,0.4) | (0.6,0.8) | |||||||
| (0.6,0.8) | (0.4,0.6) | (0.6,0.8) | (0.4,0.6) | (0,0.2) | (0.6,0.8) | (0.6,0.8) | (0.8,1.0) | |||||||
| (0.4,0.6) | (0.2,0.4) | (0,0.2) | (0.6,0.8) | (0.2,0.4) | (0.4,0.6) | (0.4,0.6) | (0.4,0.6) | |||||||
| (0.6,0.8) | (0.2,0.4) | (0.2,0.4) | (0.8,1.0) | (0.6,0.8) | (0.8,1.0) | (0.6,0.8) | (0.6,0.8) | |||||||
| (0.2,0.4) | (0.8,1.0) | (0.4,0.6) | (0.6,0.8) | (0.8,1.0) | (0.2,0.4) | 0.4,0.6) | (0.2,0.4) | |||||||
| 0.4,0.6) | (0.6,0.8) | (0.2,0.4) | (0.4,0.6) | (0.2,0.4) | (0.2,0.4) | (0.2,0.4) | (0.6,0.8) | |||||||
| (0.2,0.4) | (0.8,1.0) | (0.4,0.6) | (0,0.2 | (0.8,1.0) | (0.8,1.0) | (0.2,0.4) | (0.0,0.2) | |||||||
| (0.8,1.0) | (0.8,1.0) | (0,0.2) | (0.8,1.0) | (0.6,0.8) | (0.4,0.6) | (0.8,1.0) | (0.6,0.8) | |||||||
| (0.6,0.8) | (0.6,0.8) | (0.8,1.0) | 0.4,0.6) | (0.4,0.6) | (0.8,1.0) | (0.8,1.0) | (0,0.2) | |||||||
| (0.4,0.6) | (0,0.2) | (0.4,0.6) | (0,0.2) | (0.6,0.8) | (0.6,0.8) | (0.2,0.4) | (0.2,0.4) | |||||||
| (0.2,0.4) | (0.2,0.4) | (0.6,0.8) | (0.4,0.6) | (0.8,1.0) | (0.8,1.0) | (0.8,1.0) | (0.6,0.8) | |||||||
| (0.6,0.8) | (0,0.2) | (0.8,1.0) | (0.6,0.8) | (0.2,0.4) | (0.8,1.0) | (0.4,0.6) | (0.2,0.4) | |||||||
| (0.8,1.0) | (0.4,0.6) | (0.4,0.6) | (0.4,0.6) | (0.6,0.8) | (0,0.2 | (0.6,0.8) | (0,0.2) | |||||||
| (0.2,0.4) | (0.8,1.0) | (0.2,0.4) | (0,0.2) | (0.4,0.6) | (0.4,0.6) | (0.6,0.8) | (0.4,0.6) | |||||||
| (0.6,0.8) | (0.2,0.4) | (0.4,0.6) | (0.6,0.8) | (0.0,0.2) | (0.6,0.8) | (0.2,0.4) | (0.2,0.4) | |||||||
Table 6.
Grey weighted decisionm matrix.
| (0.03,0.045) | (0.021,0.037) | (0.024,0.03) | (0.017,0.033) | (0.067,0.077) | (0.029,0.046) | (0.046,0.063) | ||||||||
| (0.042,0.062) | (0.029,0.045) | (0.027,0.059) | (0.022,0.033) | (0.036,0.053) | (0.056,0.07) | (0.056,0.07) | ||||||||
| (0.037,0.052) | (0.022,0.045) | (0.03,0.044) | (0.016,0.026) | (0.05,0.067) | (0.046,0.063) | (0.05,0.067) | ||||||||
| (0.034,0.069) | (0.034,0.056) | (0.024,0.032) | (0.018,0.022) | (0.039,0.056) | (0.053,0.07) | (0.036,0.07) | ||||||||
| (0.045,0.069) | (0.029,0.045) | (0.023,0.044) | (0.021,0.03) | (0.043,0.06) | (0.033,0.067) | (0.06,0.074) | ||||||||
| (0.034,0.045) | (0.023,0.05) | (0.029,0.04) | (0.02,0.028) | (0.056,0.074) | (0.033,0.05) | (0.029,0.046) | ||||||||
| (0.054,0.079) | (0.029,0.045) | (0.035,0.053) | (0.024,0.036) | (0.039,0.056) | (0.029,0.046) | (0.056,0.074) | ||||||||
| (0.035,0.048) | (0.023,0.031) | (0.035,0.053) | (0.018,0.024) | (0.039,0.074) | (0.043,0.074) | (0.043,0.06) | ||||||||
| (0.048,0.077) | (0.027,0.04) | (0.032,0.048) | (0.018,0.036) | (0.036,0.07) | (0.046,0.063) | (0.039,0.074) | ||||||||
| (0.032,0.04) | (0.034,0.056) | (0.024,0.032) | (0.024,0.036) | (0.05,0.067) | (0.036,0.053) | (0.046,0.063) | ||||||||
| (0.034,0.04) | (0.029,0.049) | (0.032,0.048) | (0.018,0.022) | (0.043,0.074) | (0.043,0.077) | (0.053,0.07) | ||||||||
| (0.04,0.057) | (0.038,0.045) | (044,0.077) | (0.028,0.046) | (0.033,0.05) | (0.046,0.063) | (0.033,0.067) | ||||||||
| (0.045,0.069) | (0.034,0.056) | (0.029,0.067) | (0.036,0.077) | (0.029,0.046) | (0.026,0.06) | (0.039,0.056) | ||||||||
| (0.042,0.065) | (0.250,0.070) | (0.055,0.075) | (0.060,0.018] | (0.025,0.045) | (0.055,0.35) | (0.065,0.025) | ||||||||
| (0.035,0.52) | (0.020,0.080) | (0.052,0.015) | (0.015,0.065) | (0.047,0.061) | (0.040,0.034) | (0.017,0.075) | ||||||||
| (0.025,0.043) | (0.015,0.039) | (0.070,0.019) | (0.032,0.057) | (0.027,0.066) | (0.060,0.080) | (0.035,0.055) | ||||||||
| (0.025,0.045) | (0.010,0.030) | (0.075,0.095) | (0.020,0.040) | (0.025,0.047) | (0.058,0.080) | (0.030,0.070) | ||||||||
| (0.016,0.080) | (0.040,0.060) | (0.012,0.040) | (0.035,0.070) | (0.045,0.25) | (0.040,0.016) | (0.075,0.015) | ||||||||
| (0.014,0.024) | (0.011,0.043) | (0.035,0.048) | (0.021,0.04) | (0.051,0.063) | (0.053,0.07) | (0.09,0.067) | ||||||||
| (0.009,0.021) | (0.028,0.035) | (0.042,0.062) | (0.023,0.031) | (0.049,0.07) | (0.06,0.074) | (0.046,0.063) | ||||||||
| (0.61,0.024) | (0.047,0.031) | (0.032,0.042) | (0.026,0.037) | (0.015,0.047) | (0.067,0.059) | (0.054,0.07) | ||||||||
| (0.021,0.063) | (0.027,0.05) | (0.048,0.062) | (0.024,0.034) | (0.059,0.17) | (0.043,0.06) | (0.05,0.067) | ||||||||
| (0.019,0.045) | (0.074,0.071) | (0.04,0.057) | (0.08,0.045) | (0.063,0.019) | (0.16,0.064) | (0.039,0.056) | ||||||||
| (0.015,0.029) | (0.028,0.055) | (0.24,0.087) | (0.052,0.045) | (0.033,0.063) | (0.06,0.074) | (0.046,0.063) | ||||||||
| (0.041,0.024) | (0.061,0.043) | (0.43,0.043) | (0.049,0.024) | (0.039,0.074) | (0.033,0.067) | (0.039,0.06) | ||||||||
| (0.029,0.045) | (0.03,0.061) | (0.03,0.057) | (0.043,0.05) | (0.043,0.061) | (0.076,0.053) | (0.056,0.074) | ||||||||
| (015,0.029) | (0.027,0.05) | (0.041,0.057) | (0.021,0.027) | (0.013,0.652) | (0.044,0.08) | (0.05,0.076) | ||||||||
| (0.072,0.019) | (0.04,0.061) | (0.03, 0270) | (0.041,0.05) | (0.45,0.0631) | (0.032,0.063) | (0.043,0.74) | ||||||||
| (0.034,0.074) | (0.033,0.046) | (0.037,0.052) | (0.12,0.024) | (0.016,0.071) | (0.064,0.074) | (0.063,0.074) | ||||||||
| (0.019,0.045) | (0.046,0.077) | (0.042,0.062) | (0.023,0.031) | (0.033,0.067) | (0.066,0.043) | (0.043,0.06) | ||||||||
| (0.039,0.045) | (0.012,0.046) | (0.035,0.077) | (0.047,0.04) | (0.022,0.039) | (0.08,0.046) | (0.029,0.046) | ||||||||
| (0.014,0.044) | (0.021,0.049) | (0.023,0.061) | (0.045,0.08) | (0.021,0.063) | (0.021,0.063) | (0.022,0.084) | ||||||||
| (0.029,0.045) | (0.038,0.052) | (0.009,0.021) | (0.026,0.057) | (0.014,0.024) | (0.015,0.029) | (0.01,0.014) | ||||||||
| (0.047,0.025) | (0.024,0.052) | (0.023,0.063) | (0.035,0.051) | (0.034,0.074) | (0.063,0.021) | (0.055,0.011) | ||||||||
| (0.032,0.045) | (0.035,0.063) | (0.039,0.045) | (0.041,0.057) | (0.019,0.045) | (0.067,0.035) | (0.015,0.029) | ||||||||
| (0.077,0.035) | (0.027,0.055) | (0.011,0.017) | (0.038,0.054) | (0.018,0.044) | (0.019,0.045) | (0.019,0.045) | ||||||||
| (0.019,0.045) | (0.012,0.045) | (0.032,0.046) | (0.032, 0.06) | (0.022,0.019) | (0.024,0.013) | (0.017,0.065) | (0.015,0.059) | |||||||
| (0.014,0.024) | (0.009,0.013) | (0.027,0.055) | (0.035,0.049) | (0.013,0.021) | (0.017,0.035) | (0.025,0.043) | (0.017,0.035) | |||||||
| (0.045,0.029) | (0.022,0.019) | (0.046,0.06) | (0.049,0.063) | (0.017,0.035) | (0.015,0.029) | (0.069,0.045) | (0.032,0.049) | |||||||
| (0.031,0.063) | (0.019,0.045) | (0.035,0.063) | (0.046,0.06) | (0.019,0.045) | (0.039,0.085) | (0.013,0.023) | (0.081,0.063) | |||||||
| (0.0173,0.021) | (0.019,0.053) | (0.032,0.06) | (0.021,0.049) | (0.021,0.063) | (0.061,0.023) | (0.047,0.025) | (0.014,0.044) | |||||||
| (0.015,0.029) | (0.025,0.049) | (0.062,0.046) | (0.043,0.057) | (0.014,0.024) | (0.014,0.024) | (0.019,0.045) | (0.012,0.045) | |||||||
| (0.055,0.063) | (0.039,0.055) | (0.053,0.036) | (0.029,0.043) | (0.61,0.015) | (0.008,0.015) | (0.021,0.063) | (0.023,0.011) | |||||||
| (0.077,0.035) | (0.021,0.063) | (0.049,0.063) | (0.013,0.027) | (0.012,0.079) | (0.012,0.019) | (0.014,0.024) | (0.052,0.019) | |||||||
| (0.089,0.015) | (0.013,0.021) | (0.012,0.046) | (0.046,0.06) | (0.053,0.021) | (0.021,0.063) | (0.063,0.021) | (0.078,0.011) | |||||||
| (0.015,0.029) | (0.019,0.045) | (0.027,0.055) | (0.035,0.049) | (0.029,0.045) | (0.015,0.029) | (0.073,0.021) | (0.61,0.024) | |||||||
| (0.046,0.06) | (0.029,0.06) | (0.013,0.063) | (0.014,0.024) | (0.069,0.045) | (0.012,0.045) | (0.032,0.06) | (0.046,0.06) | |||||||
| (0.021,0.063) | (0.073,0.021) | (0.012,0.045) | (0.013,0.021) | (0.032,0.046) | (0.032,0.06) | (0.013,0.021) | (0.021,0.063) | |||||||
| (0.019,0.045) | (0.085,0.029) | (0.021,0.063) | (0.012,0.019) | (0.049,0.063) | (0.046,0.06) | (0.019,0.045) | (0.012,0.045) | |||||||
| (0.013,0.021) | (0.091,0.015) | (0.009,0.013) | (0.009,0.013) | (0.046,0.06) | (0.021,0.049) | (0.021,0.063) | (0.013,0.063) | |||||||
| (0.014,0.024) | (0.075,0.029) | (0.015,0.029) | (0.015,0.029) | (0.056,0.061) | (0.029,0.043) | (0.024,0.044) | (0.014,0.024) | |||||||
| (0.01,0.095) | (0.11,0.029) | (0.07,0.029) | (0.012,0.045) | (0.027,0.055) | (0.035,0.049) | (0.039,0.045) | (0.015,0.029) | |||||||
| (0.012,0.019) | (0.035,0.049) | (0.043,0.057) | (0.007,0.042) | (0.012,0.019) | (0.71,0.024) | (0.015,0.052) | (0.019,0.045) | |||||||
| (0.062,0.029) | (0.027,0.041) | (0.035,0.049) | (0.019,0.045) | (0.015,0.029) | (0.013,0.021) | (0.014,0.024) | (0.012,0.079) | |||||||
Publisher’s Note: MDPI stays neutral with regard to jurisdictional claims in published maps and institutional affiliations. |
© 2021 by the authors. Licensee MDPI, Basel, Switzerland. This article is an open access article distributed under the terms and conditions of the Creative Commons Attribution (CC BY) license (https://creativecommons.org/licenses/by/4.0/).
Share and Cite
MDPI and ACS Style
Ikram, M.; Sroufe, R.; Awan, U.; Abid, N. Enabling Progress in Developing Economies: A Novel Hybrid Decision-Making Model for Green Technology Planning. Sustainability 2022, 14, 258. https://0-doi-org.brum.beds.ac.uk/10.3390/su14010258
AMA Style
Ikram M, Sroufe R, Awan U, Abid N. Enabling Progress in Developing Economies: A Novel Hybrid Decision-Making Model for Green Technology Planning. Sustainability. 2022; 14(1):258. https://0-doi-org.brum.beds.ac.uk/10.3390/su14010258
Chicago/Turabian StyleIkram, Muhammad, Robert Sroufe, Usama Awan, and Nabila Abid. 2022. "Enabling Progress in Developing Economies: A Novel Hybrid Decision-Making Model for Green Technology Planning" Sustainability 14, no. 1: 258. https://0-doi-org.brum.beds.ac.uk/10.3390/su14010258
Note that from the first issue of 2016, this journal uses article numbers instead of page numbers. See further details here.