
Green Construction Grade Evaluation of Large Channels Based on Uncertain AHP-Multidimensional Cloud Model

1
Construction Administration of the Second Phase Project of Zhaokou Irrigation District of the Yellow River in Henan Province, Kaifeng 475000, China
2
School of Water Conservancy Engineering, Zhengzhou University, Zhengzhou 450001, China
*
Author to whom correspondence should be addressed.
Sustainability 2022, 14(10), 6143; https://0-doi-org.brum.beds.ac.uk/10.3390/su14106143
Submission received: 24 April 2022
/
Revised: 14 May 2022
/
Accepted: 16 May 2022
/
Published: 18 May 2022
(This article belongs to the Section Resources and Sustainable Utilization)
Abstract
:(1) Background. With the increasing national investment in infrastructure in recent years, water conservancy construction has been developed rapidly, which has greatly improved people’s living standards, but at the same time, the damage to the environment and the waste of resources caused by construction is becoming more and more obvious. In the prospect of sustainable development, the application of a complete set of green construction evaluation system is imminent. (2) Methods. This paper takes the green construction of large channels as the research object, takes the Green Building Evaluation Standard (GB/T 50378-2019) as the guideline, takes the control items of “safety and durability, health and comfort, resource saving, environmental livability, improvement and innovation” in the Standard as the construction reference system, and combines the construction characteristics of water conservancy projects. It determines the evaluation index and carries out green construction grade evaluation by uncertain AHP (hierarchical analysis)-multidimensional cloud model. (3) Results. The green construction grade evaluation of large channels was carried out with the example, and the final green construction grade evaluation result of “three stars” was obtained. (4) Conclusions. The evaluation results are consistent with the traditional AHP (hierarchical analysis)-cloud model, but the evaluation model proposed in this paper takes into account the fuzziness, randomness and correlation among the evaluation factors, which is more in line with the actual situation. It plays a guiding role for the green construction of large channels.
1. Introduction
With the development of industrialization and urbanization of human society, resource shortage and environmental pollution have become the key issues limiting socio-economic development. The resource consumption and environmental impact generated by the construction and operation of buildings occupy a considerable proportion in all activities of human society. The national vigorous development of infrastructure construction has greatly improved people’s living standard, but the continuous increase of infrastructure construction has also triggered the above-mentioned problems. Therefore, green construction is imminent.
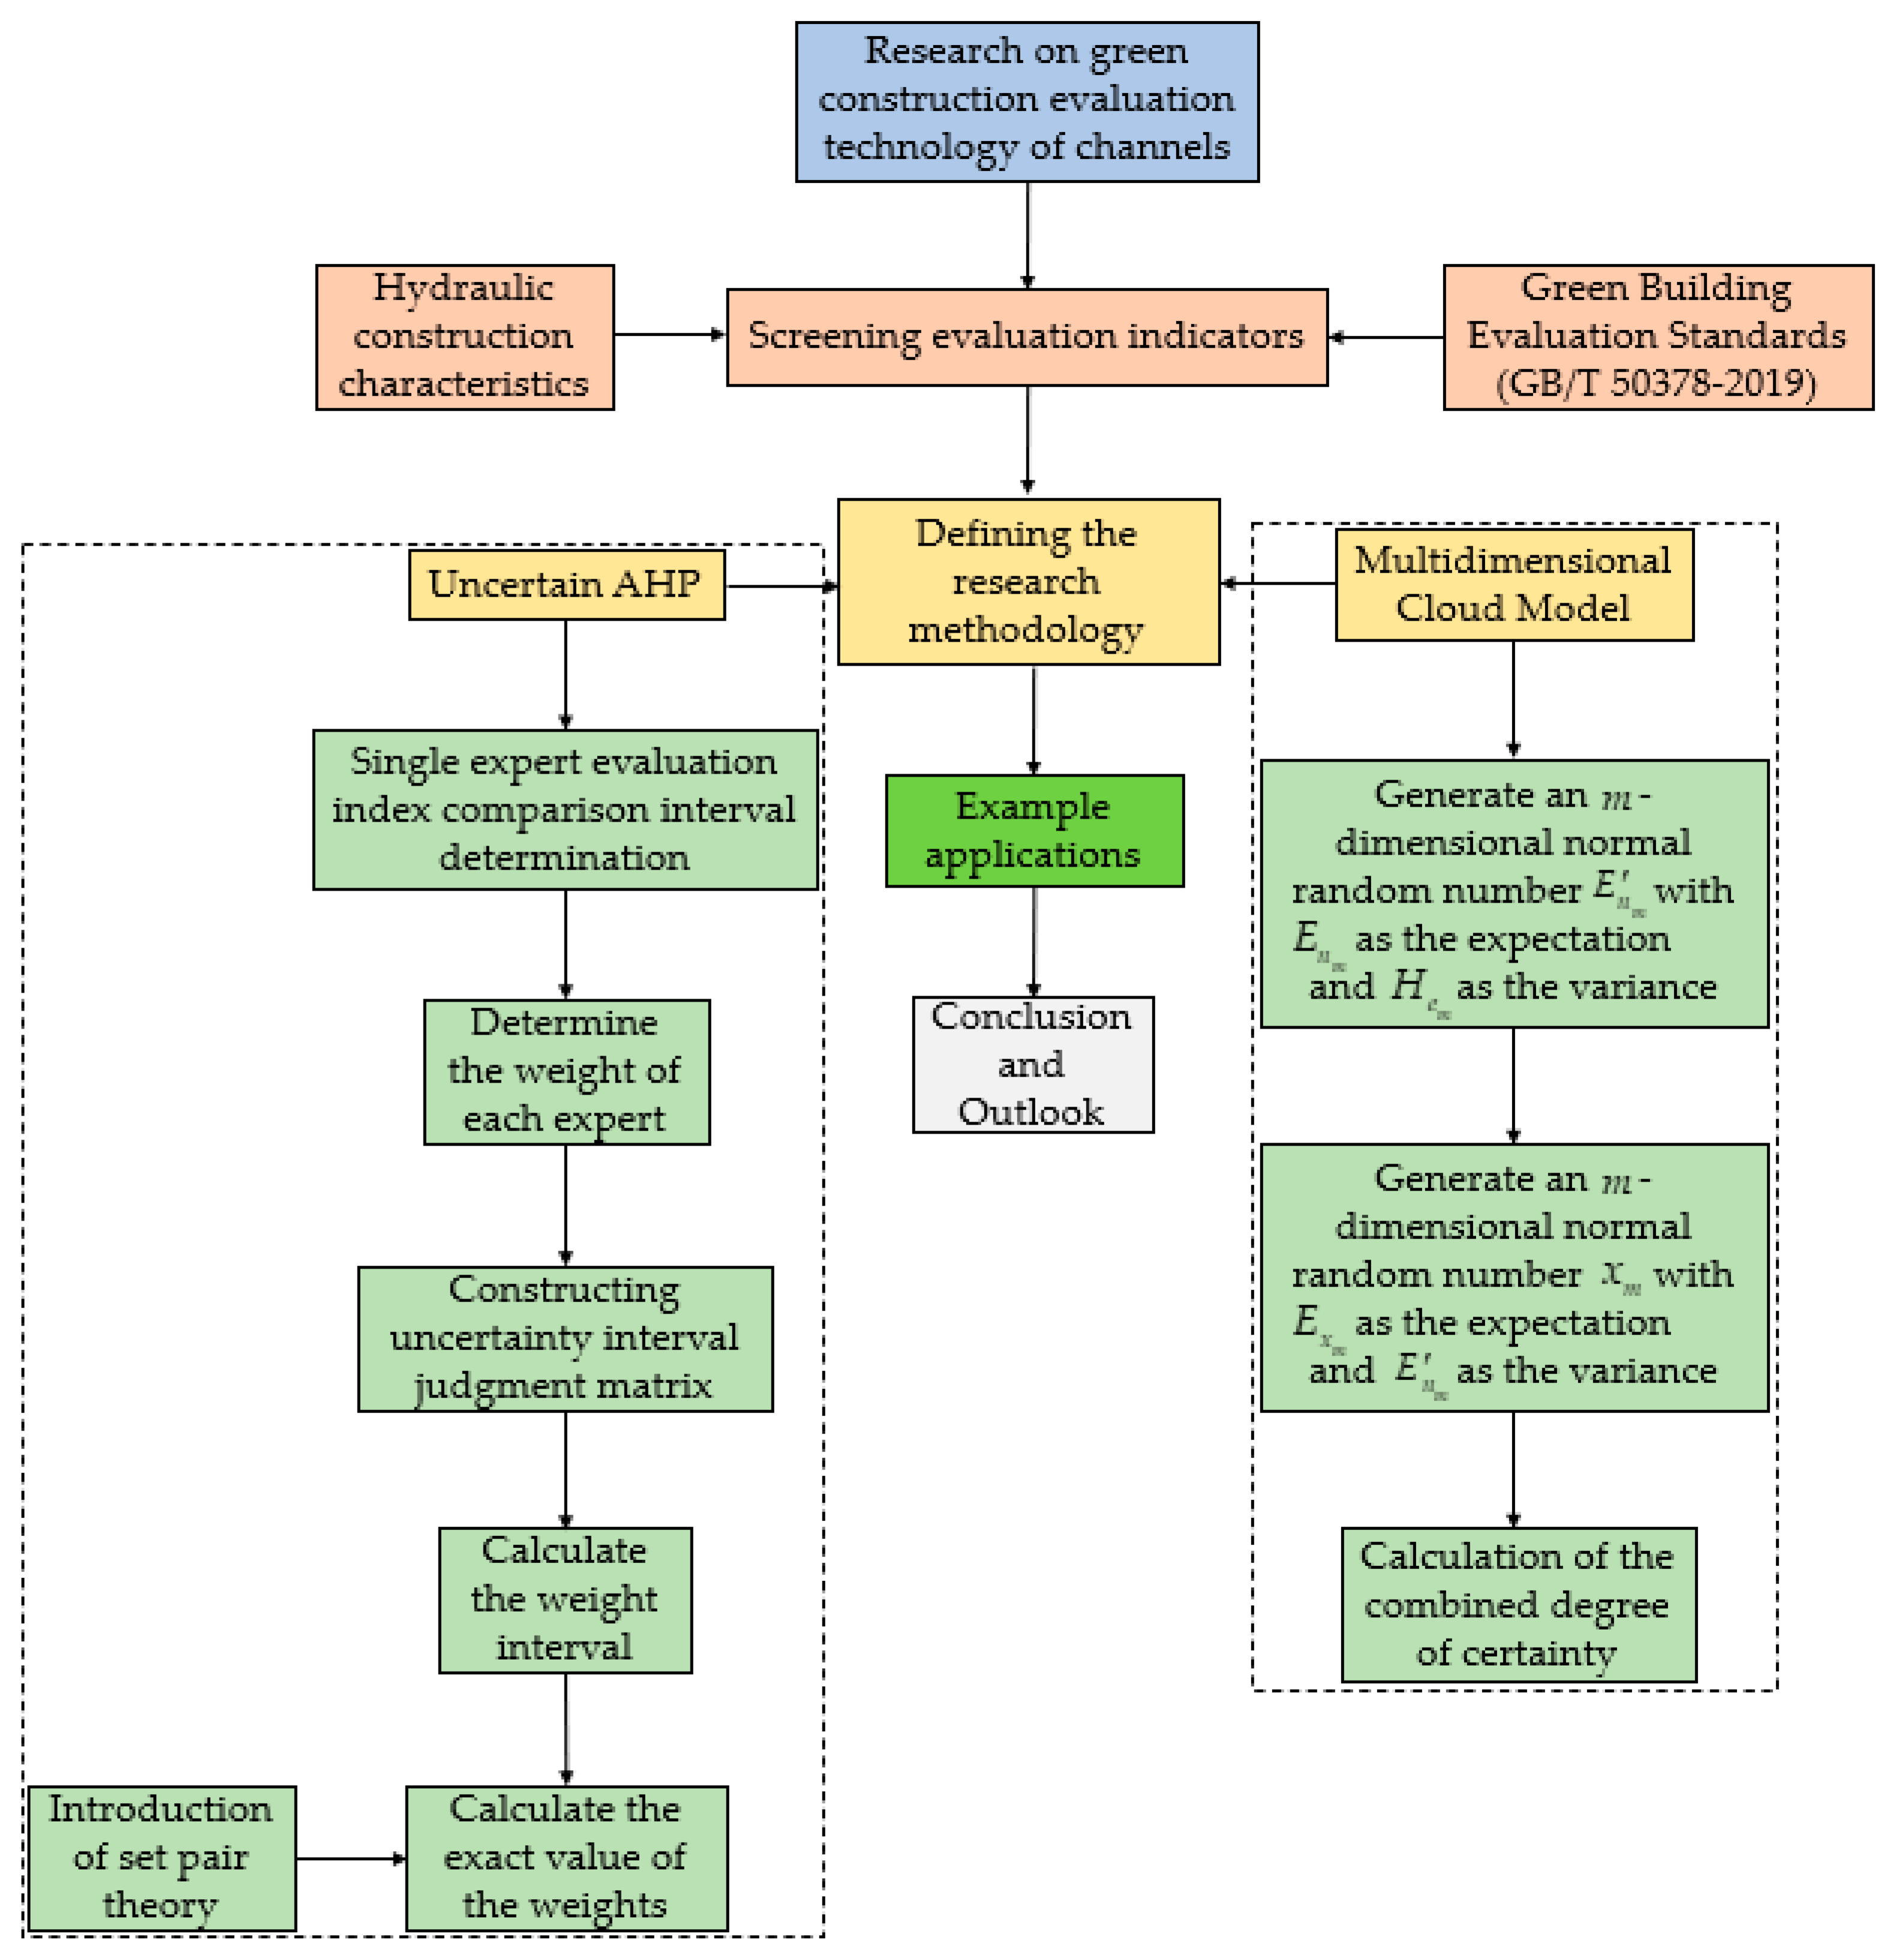
In this paper, we take the large channels of water conservancy engineering facilities as the research object, take the Green Building Evaluation Standard (GB/T 50378-2019) [1] as the guideline (hereinafter referred to as “Standard”), and take the control items in “safety and durability, health and comfort, resource saving, environmental livability, improvement and innovation” as the construction items in the Standard. The green construction grade evaluation of the channel is carried out by combining the construction characteristics of water conservancy projects with the reference system. As there are many indicators for green construction evaluation of large channels and many uncertainties in the evaluation process, the cloud model is used to quantify the randomness and fuzziness that may occur in the evaluation. Xu Jianzhong [2] et al. created a model to evaluate the green innovation capability of manufacturing companies based on the cloud model and conducted an empirical study on the eco-location perspective; Gao Zhiguo [3] et al. conducted a study on the grade evaluation of green construction of deep foundation pit based on cloud object element model; Hong Wenxia [4] et al. conducted an evaluation study on the microscopic risk of green construction based on AHP-entropy power combination empowerment-cloud model. The traditional one-dimensional cloud model has been applied in the evaluation of various engineering projects, but there are shortcomings of cumbersome evaluation process and low computational efficiency with the increase in evaluation indexes and sample size, and there are also disadvantages of biased evaluation results when the span of each evaluation grade interval is large. In order to improve the evaluation efficiency and simplify the process under the situation of many indexes, this paper adopts the multidimensional cloud that can better handle the evaluation of multiple indexes model method. Guo Rongxiao [5] et al. proposed a multi-attribute comprehensive evaluation method of multi-dimensional cloud model, and compared with the method of single-attribute multi-level description by one-dimensional cloud model, the obtained results are more intuitive. Zhang Qing [6] et al. evaluated the stability of rock slopes affected by many evaluation factors based on the multi-dimensional cloud model and obtained more efficient and accurate results than the one-dimensional cloud model. Similarly, for weight determination, the hierarchical analysis method (AHP) can well handle the weights of qualitative and quantitative indicators. Li Xin et al. [7] determined the indicator weights based on AHP and evaluated the green construction of urban water environment management by using artificial neural network as the evaluation model; Ren Yinlong [8] et al. combined the improved AHP and entropy weights based on game theory and conducted a comprehensive evaluation of the green construction environment of railroad by cloud model to conduct a comprehensive evaluation; Zhu Wenhao [9] et al. established a green construction plan comparison model for the railroad construction phase by attribute hierarchical analysis (AHM) and the improved ranking method of approximating ideal solutions (TOPSIS). The ambiguity of traditional AHP for expert evaluation and indicators makes it difficult to determine a certain evaluation index with deterministic values, so in this paper, the uncertain AHP method is formed by interval number judgment matrix construction and calculation through interval weights. Wang Jiayuan [10] et al. made a fuzzy comprehensive evaluation of the risk of construction projects based on uncertain AHP and concluded that this method can better consider the uncertainty in the evaluation process. Guo Rongchang [11] et al. evaluated the safety operation of train control based on the cloud model and uncertain AHP and verified the feasibility of the method through examples. In order to obtain more accurate and authoritative evaluation results, this paper attempts to combine the uncertain AHP and multi-dimensional cloud model, through example verification and comparison with the calculation results of traditional methods, and show that the method is more practical and the results are more reliable. The research flow of this paper is shown in Figure 1.
2. Selection of Evaluation Indicators
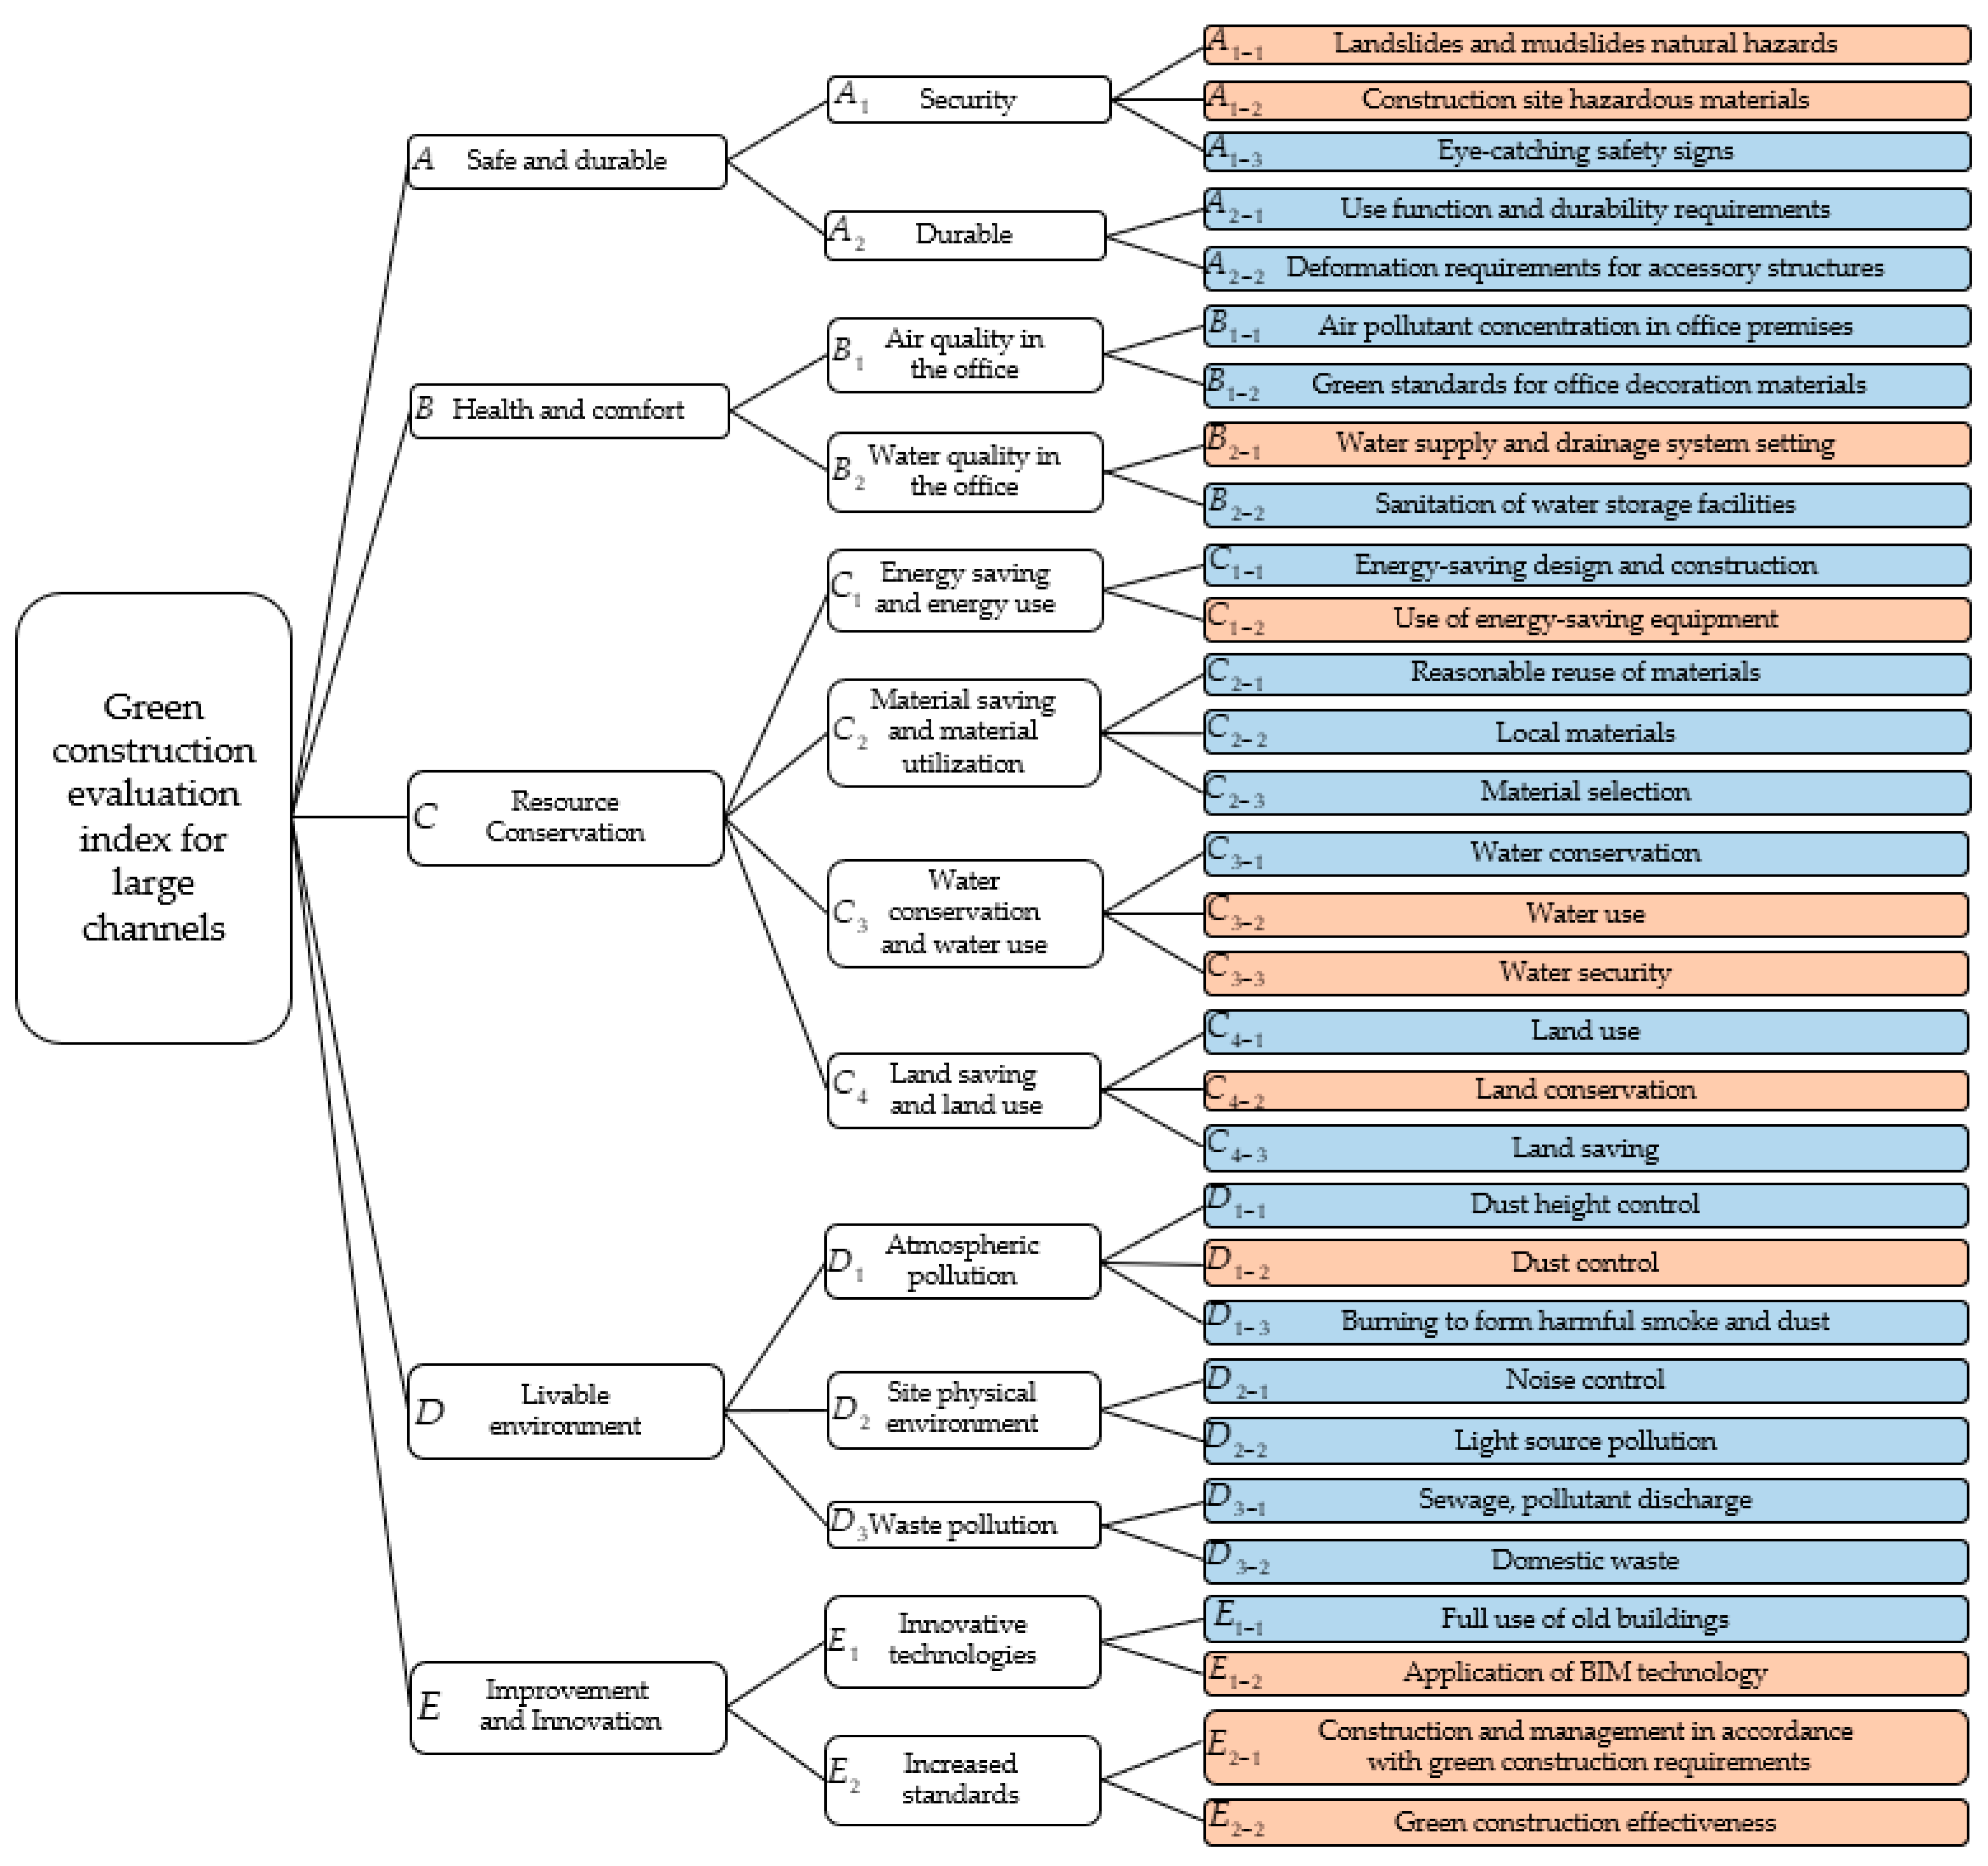
Through the Green Building Evaluation Standard (GB/T 50378-2019) and review of the related literature [12,13,14,15], the construction characteristics of water conservancy project channels are combined with the control items of “safety and durability, health and comfort, resource saving, environmental livability, improvement and innovation” in the Standard as the construction reference system. The evaluation indexes are divided into 5 primary indexes, 13 secondary indexes and 31 tertiary indexes, as shown in Figure 2, which include qualitative and quantitative indexes, among which qualitative indexes are scored by experts according to the actual situation of the construction site and the project construction organization and management documents, and quantitative indexes are scored by experts according to the actual situation of the construction site and the requirements of the control items in the Standard. (Among them, red is marked as qualitative indicators, and blue is marked as quantitative indicators.)
The parameters and meanings of the formulas to be used are summarized below in the order in which they appear, as shown in Table 1.
3. Rating Method
3.1. Uncertain AHP
- (1)
- Determine the comparison interval of evaluation indicators for individual experts
For a certain evaluation system, there are evaluation indicators, experts are invited to compare them two by two, and the number of intervals is used to express the mutual importance; let the comparison interval between evaluation indicators and of the () experts be
where are the lower and upper limits of the interval importance.
- (2)
- Determination of expert weights
Due to the differences of experts’ academic background, titles and working experience, the evaluation results of their evaluation indicators should be given different weights . Table 2 shows the weights corresponding to different sub-indicators, with the highest score of 10 for sub-indicators and the others in decreasing order.
- (3)
- Construction of uncertainty interval judgment matrix
The weight interval matrix of each evaluation index was obtained by combining the evaluation index intervals of experts according to the corresponding weights [10] as
The uncertainty interval judgment matrix is obtained as
- (4)
- Calculation of the weight interval
The consistent approximation matrix satisfying mutual inverse is obtained based on the judgment matrix , where is [11]
Compute the weights of the matrix , where is
Calculate the polar difference matrix
Derive the weight transfer error
The weight interval of the interval number judgment matrix is , where is
- (5)
- Calculate the weight value
The uncertain hierarchical analysis method can only obtain the weight intervals, and the ternary coefficients in the set-pair theory [16] are introduced to convert them into definite values, and the ternary coefficients are used to describe the weight interval values of the indexes in three aspects, i.e., for the weight interval , it is divided into three intervals and , which represent “the degree of certainty that can be achieved “, “not sure if it can be achieved” and “sure it cannot be achieved”. The expression of pairwise association degree is
where is the difference between the three corresponding intervals, respectively. That is, , , , and are the coefficients of the degree of difference and the degree of opposition, which only serve as markers.
The evaluation index weights are determined from the deterministic and uncertainty components, respectively [17], and the relative weights for the deterministic interval and for the uncertainty interval are calculated
Calculate the exact weight value of the indicator , where is
3.2. Multidimensional Linked Normal Cloud Model
- (1)
- Concept of multidimensional cloud model
Let be a -dimensional quantitative domain represented by exact values and be a qualitative concept on . If the quantitative value , and is a single random realization of the qualitative concept , and also if satisfies , where and has determinacy for , satisfying
Then the distribution of on is said to be a -dimensional normal cloud [18].
- (2)
- Determination of numerical features of multidimensional cloud models
The approximation method of indicators is used, i.e., the expectation is , and based on the ““ rule is used to determine the grades with clear boundaries such as “fail” and “pass”, and based on the “50% correlation” rule is used to determine the grades above “pass”, and the grade cloud super entropy is taken as 0.08 [19].
- (3)
- Multidimensional normal cloud model generated by multidimensional forward cloud generator
The number of cloud drops and the numerical eigenvalues are input to the multidimensional forward cloud generator, which can output cloud drops .
The specific steps [20] are
- Generate a -dimensional normal random number with as the expectation and as the variance.
- Generate a -dimensional normal random number with as the expectation and as the variance.
- Calculate the degree of certainty by means of Equation (15).
- denotes a cloud drop. where denotes the primary counterpart of the qualitative concept in and is a measure of the qualitative concept to which is subordinate.Repeat steps 1 to 4 until a cloud droplet is generated.
3.3. Evaluation of Results
Finally, the actual value of each green construction evaluation index is read and combined with the corresponding weights, the comprehensive determination of the project belonging to each green construction evaluation level is calculated by Equation (16), and the final green construction evaluation level is determined according to the principle of maximum affiliation [21].
4. Large-Scale Channel Green Construction Example Application
Zhao Kou Yellow Irrigation District Phase II Project is located in the south bank of the Yellow River in our province in the Yellow and Huai Plain of East Henan; the main construction content includes 43 channels, 36 ditches, 1 sedimentation pond project, 1181 buildings and field projects; the total project land scale is 498.15 hectares. In order to meet the needs of production and life, the project has set corresponding quality targets, schedule targets, green construction targets and safe and civilized production and life targets. Under the premise of relevant pre-requirements, the construction section near Fengzhuang Village of Fengzhuang Township near Xiaocheng Hub is used as an example for green construction evaluation. According to the specific terrain, site conditions and drawing planning requirements of this project, construction camps are set up in the designated areas near the construction area. The temporary construction road in the site makes full use of the existing road, and a temporary road connecting the construction camp, dumping site, construction operation area and existing road is built along the route, with a roadbed width of 6 m and a road surface width of 4.5 m, using cement gravel road surface. The construction camp sets up temporary facilities such as office and living of the project department, and production auxiliary facilities such as steel processing plant, wood processing plant, machinery parking site and warehouse according to the need. Temporary soil piling area is set along one side of the channel, and construction access road is set on the other side. Specific evaluation steps are as follows.
- (1)
- Determination of expert weights
In this paper, by reviewing the previous ratings of experts with different qualifications in the relevant fields and determining the expert weights according to their qualification levels, and listing the evaluation interval matrix of each expert. The expert weights are determined on the basis of Table 2 with the actual situation of each expert, and after summing and normalization, the actual weights of each expert = [0.284,0.254,0.194,0.2,68] are obtained as shown in Table 3.
- (2)
- Determine the comparison interval of evaluation indicators for individual experts
For the primary indicators, the corresponding matrix of comparison interval numbers was given by the four experts as
- (3)
- Constructing uncertainty interval judgment matrix
According to Equations (2) and (3), the evaluation index intervals of the four experts are combined according to the corresponding weights to obtain the weight interval matrix of each evaluation index shaped as Equation (4).
- (4)
- Calculation of the weight interval
The consistency approximation matrix satisfying the mutual inverse is obtained from the judgment matrix by Equation (5).
The weights of the matrix are obtained by Equation (6) and the polarity matrix is obtained by Equations (7) and (8).
The weight transfer error is obtained by Equations (9) and (10) as
The weight interval of the interval number judgment matrix is obtained by Equation (11)
- (5)
- Calculate the exact weight value
The weight interval is formed into a set pair with the interval [0,1], and the expression of the set pair connectedness is obtained by Equation (12)
The relative weight A of the deterministic interval and the relative weight B of the uncertain interval are calculated by Equation (13) as
The exact weight value of the indicator is calculated by Equation (14) as
The same steps were used to solve the weights for the secondary and tertiary indicators and calculate the total weights, and the final results are shown in Table 4.
- (6)
- Green construction index evaluation level classification
With reference to the current standards and specifications, construction technology demonstration guidelines, relevant research literature, and taking into account the expert experience standard values, the above evaluation indexes are divided into hierarchical standards, as shown in Table 5.
The evaluation criteria for each indicator:
—Whether the construction site is flat and whether there is extreme heavy rainfall in the past years.
—Presence of harmful geological materials.
—Whether the construction site has prominent safety signs.
—Whether the design and construction meet the requirements of use.
—Check whether the deformation meets the requirements during construction and use.
—According to the current national standard “Indoor Air Quality Standard” GB/T 18,883 (%).
—Meet the current national green product evaluation standards.
—Is there a clear and unambiguous permanent logo.
—Whether the measures meet the health requirements.
—The thermal performance of the envelope structure is improved compared with the relevant national current building energy-saving design standards (%).
—Energy efficiency of equipment is better than the limit value of GB 50,189 of the current national standard Energy-saving Design Standard for Public Buildings.
—The proportion of recyclable materials and reusable materials usage (%).
—Material usage within 500 km of construction site.
—Green building materials use.
—Whether to measure water.
—Rainwater, water use.
—Planning of water resources, whether the supply is guaranteed.
—Effective utilization rate of temporary facility floor space (%).
—Temporary land protection measures are perfect.
—Is the temporary facility footprint the minimum area.
—Whether it will spread off-site.
—Are there dust control measures in the construction program.
—Whether the construction site will burn garbage and use the required materials.
—According to the current national standard “Construction Site Environmental Noise Emission Standard” (GB 12523) attainment rate (%).
—Whether the construction organization design contains a section on light pollution control, and whether the construction process takes effective measures.
—Construction waste emissions per square meter ().
—Is the domestic waste disposal perfect.
—The degree of utilization of old building or old building materials after demolition (%).
—Whether the project is assisted by the application of new technologies such as BIM during the whole construction process.
—Whether the construction organization design has green construction and management requirements, and whether to implement according to the provisions.
—After the implementation of the relevant provisions of green construction according to the construction organization design, the effectiveness test.
- (7)
- Multidimensional cloud model digital features
According to the cloud model numerical characteristics calculation formula, the parameters of the multidimensional hierarchical cloud model of green construction evaluation indexes are calculated as shown in Table 6.
- (8)
- Multi-dimensional evaluation cloud model
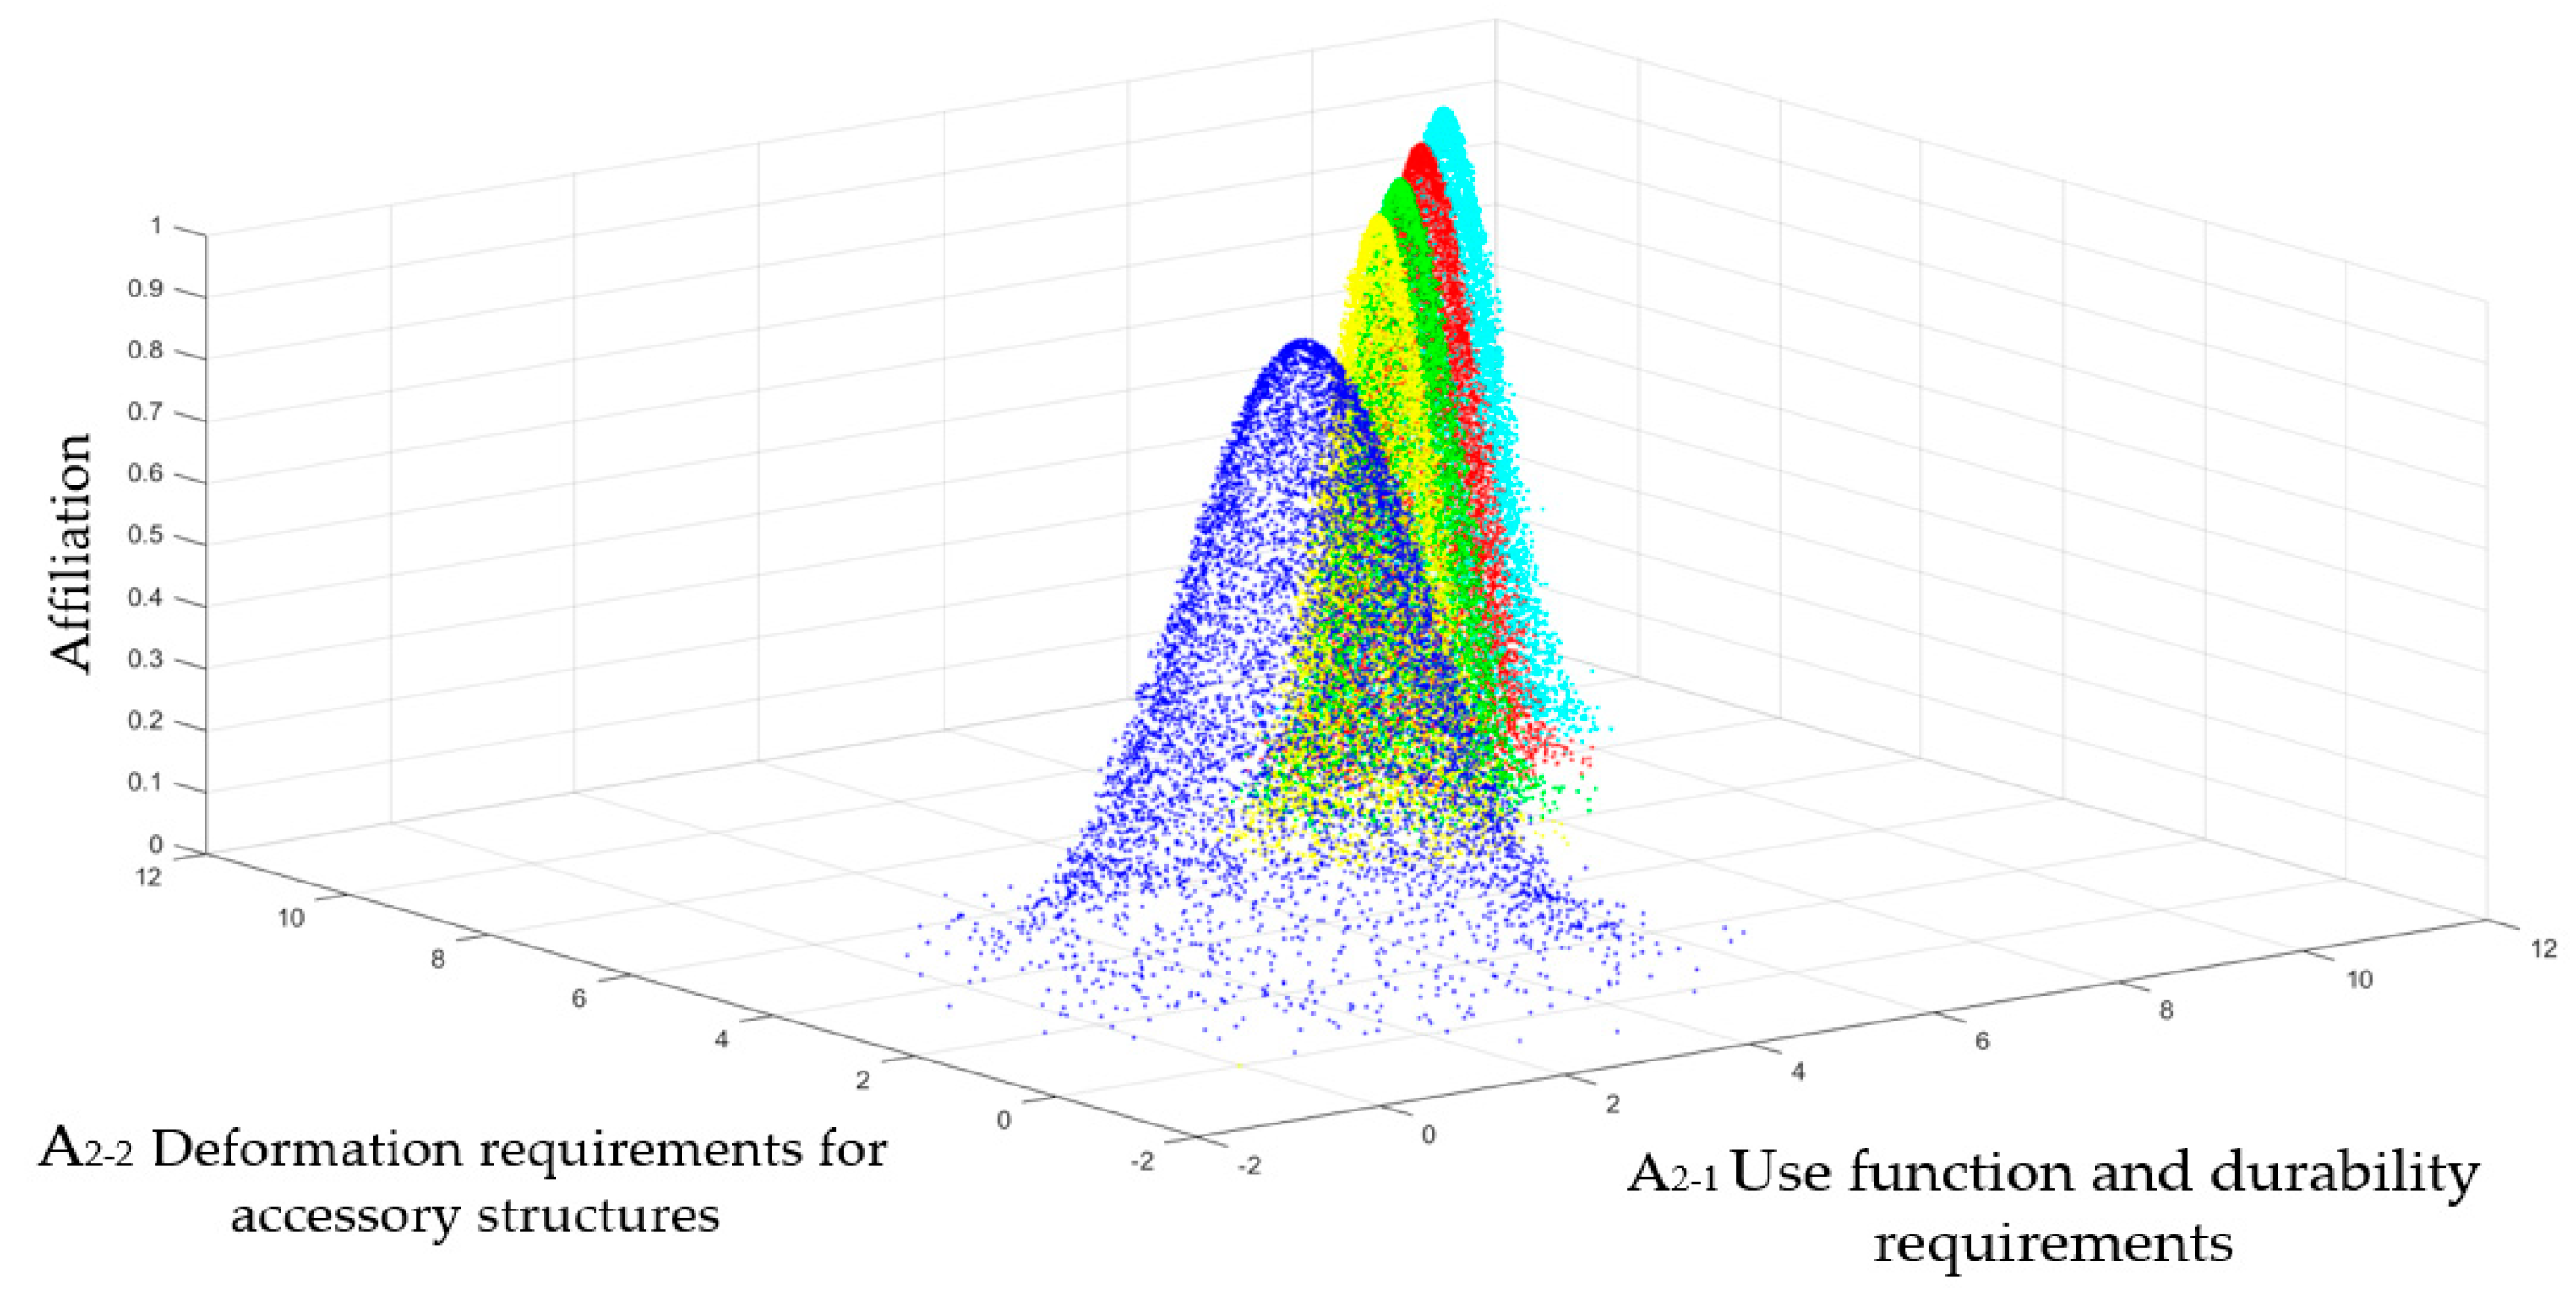
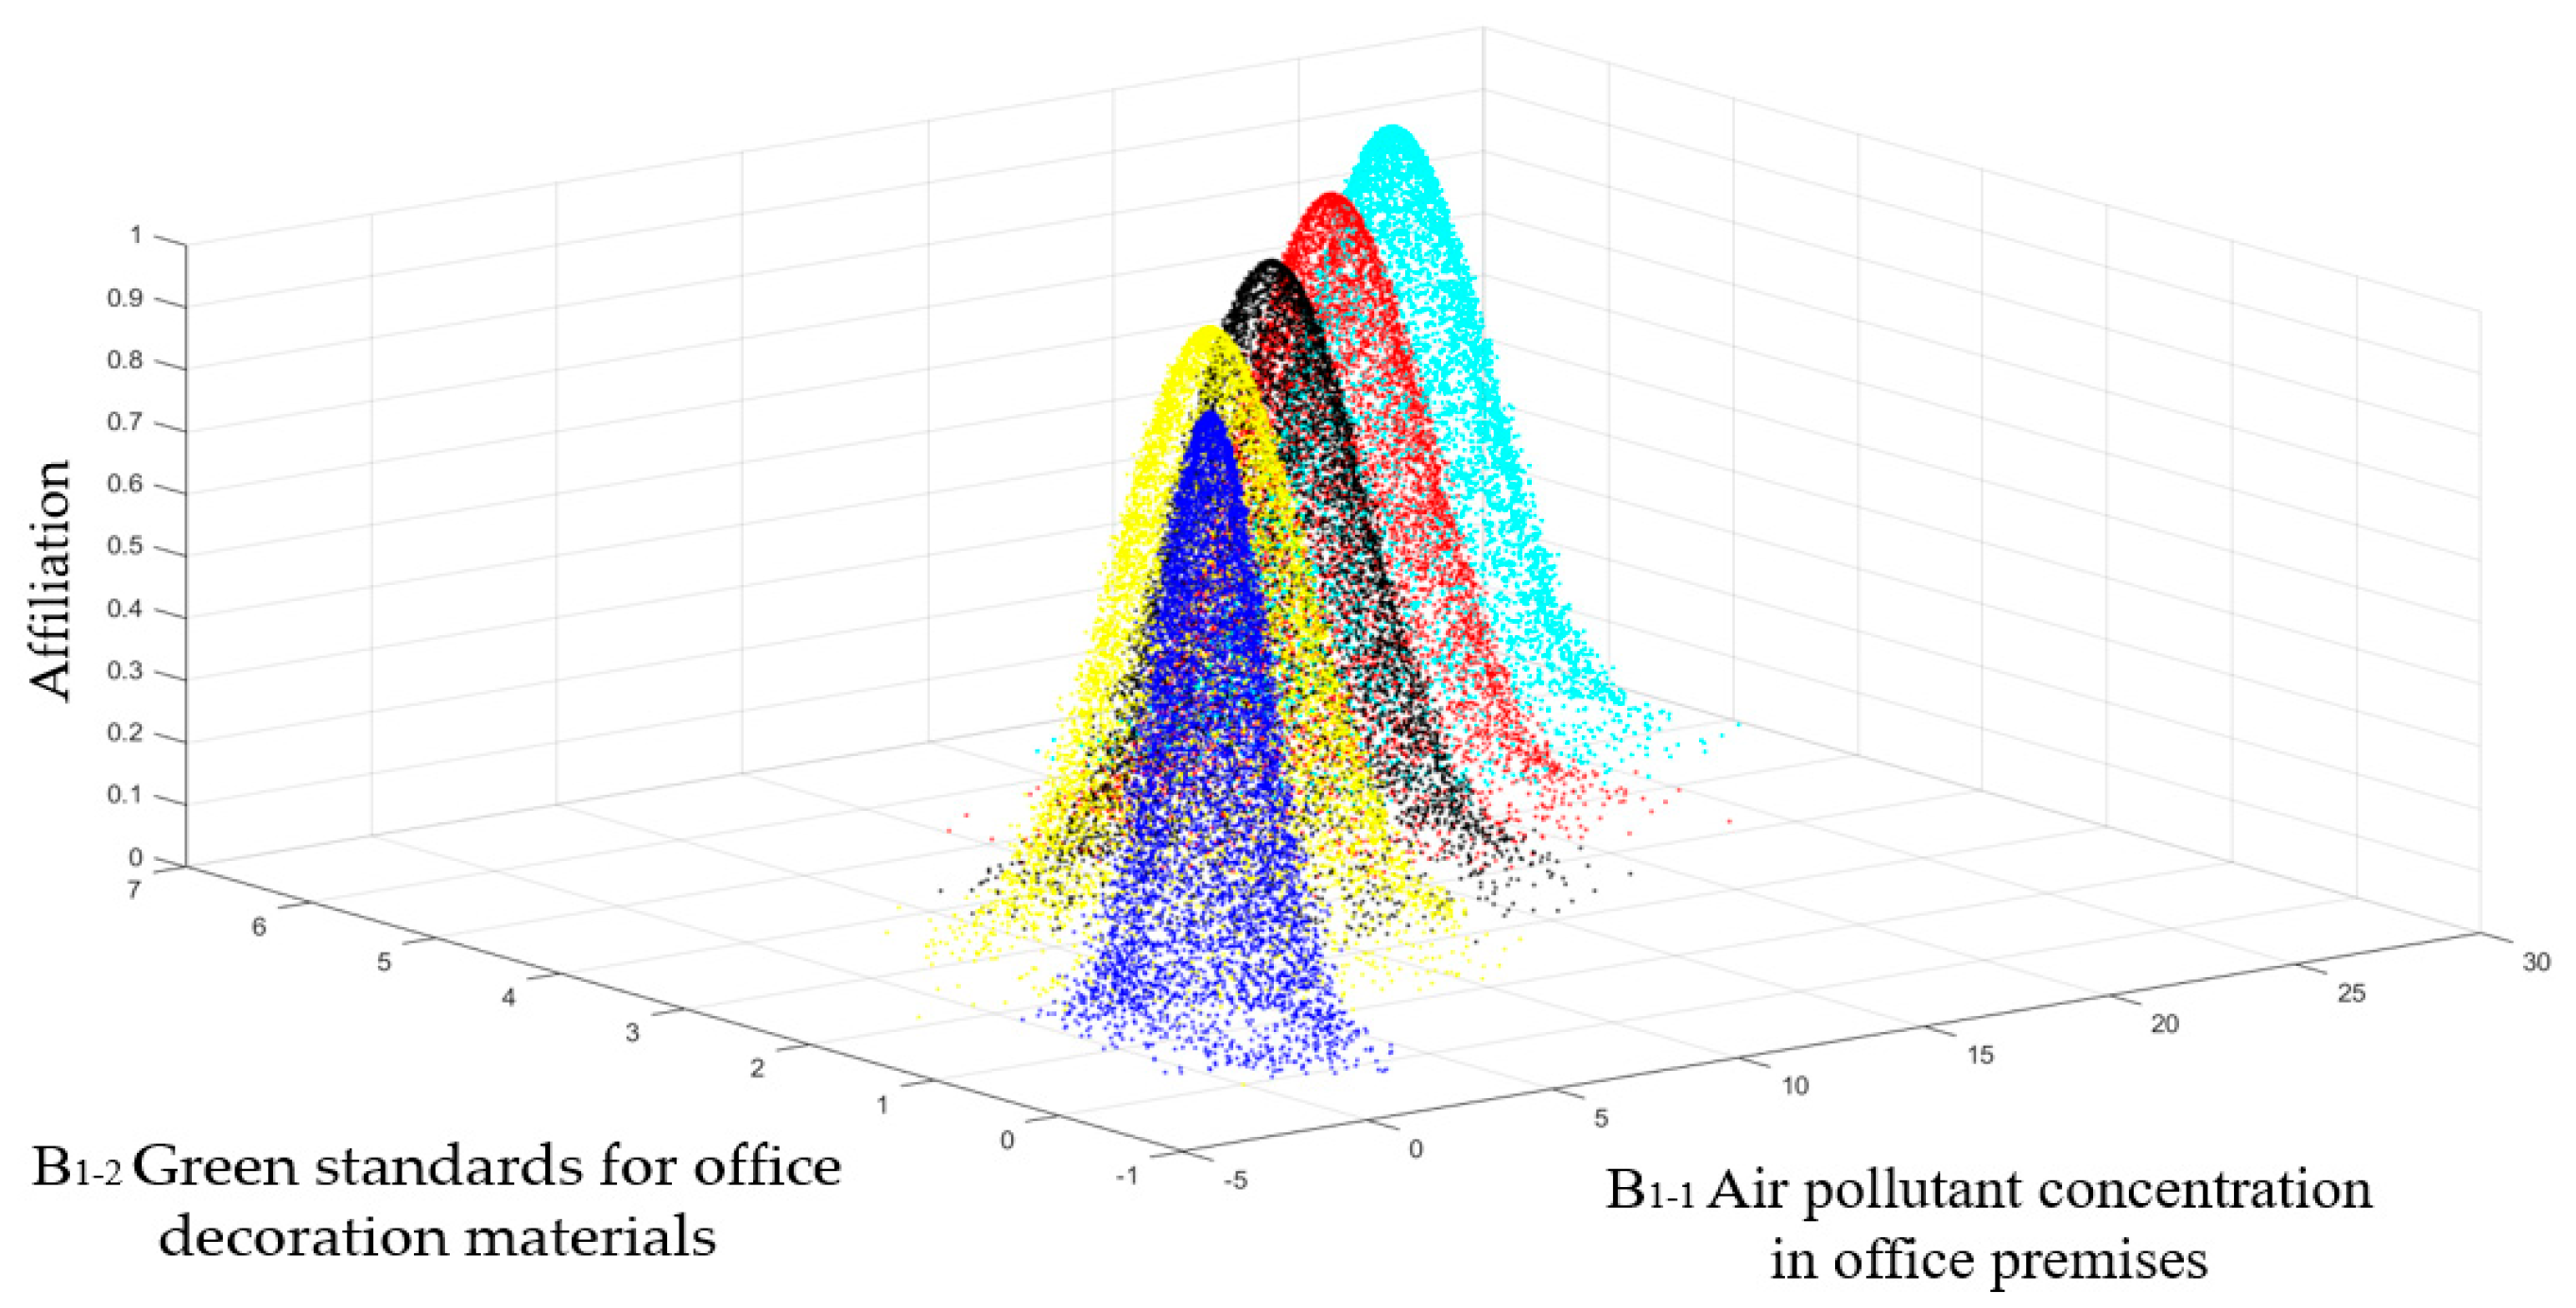
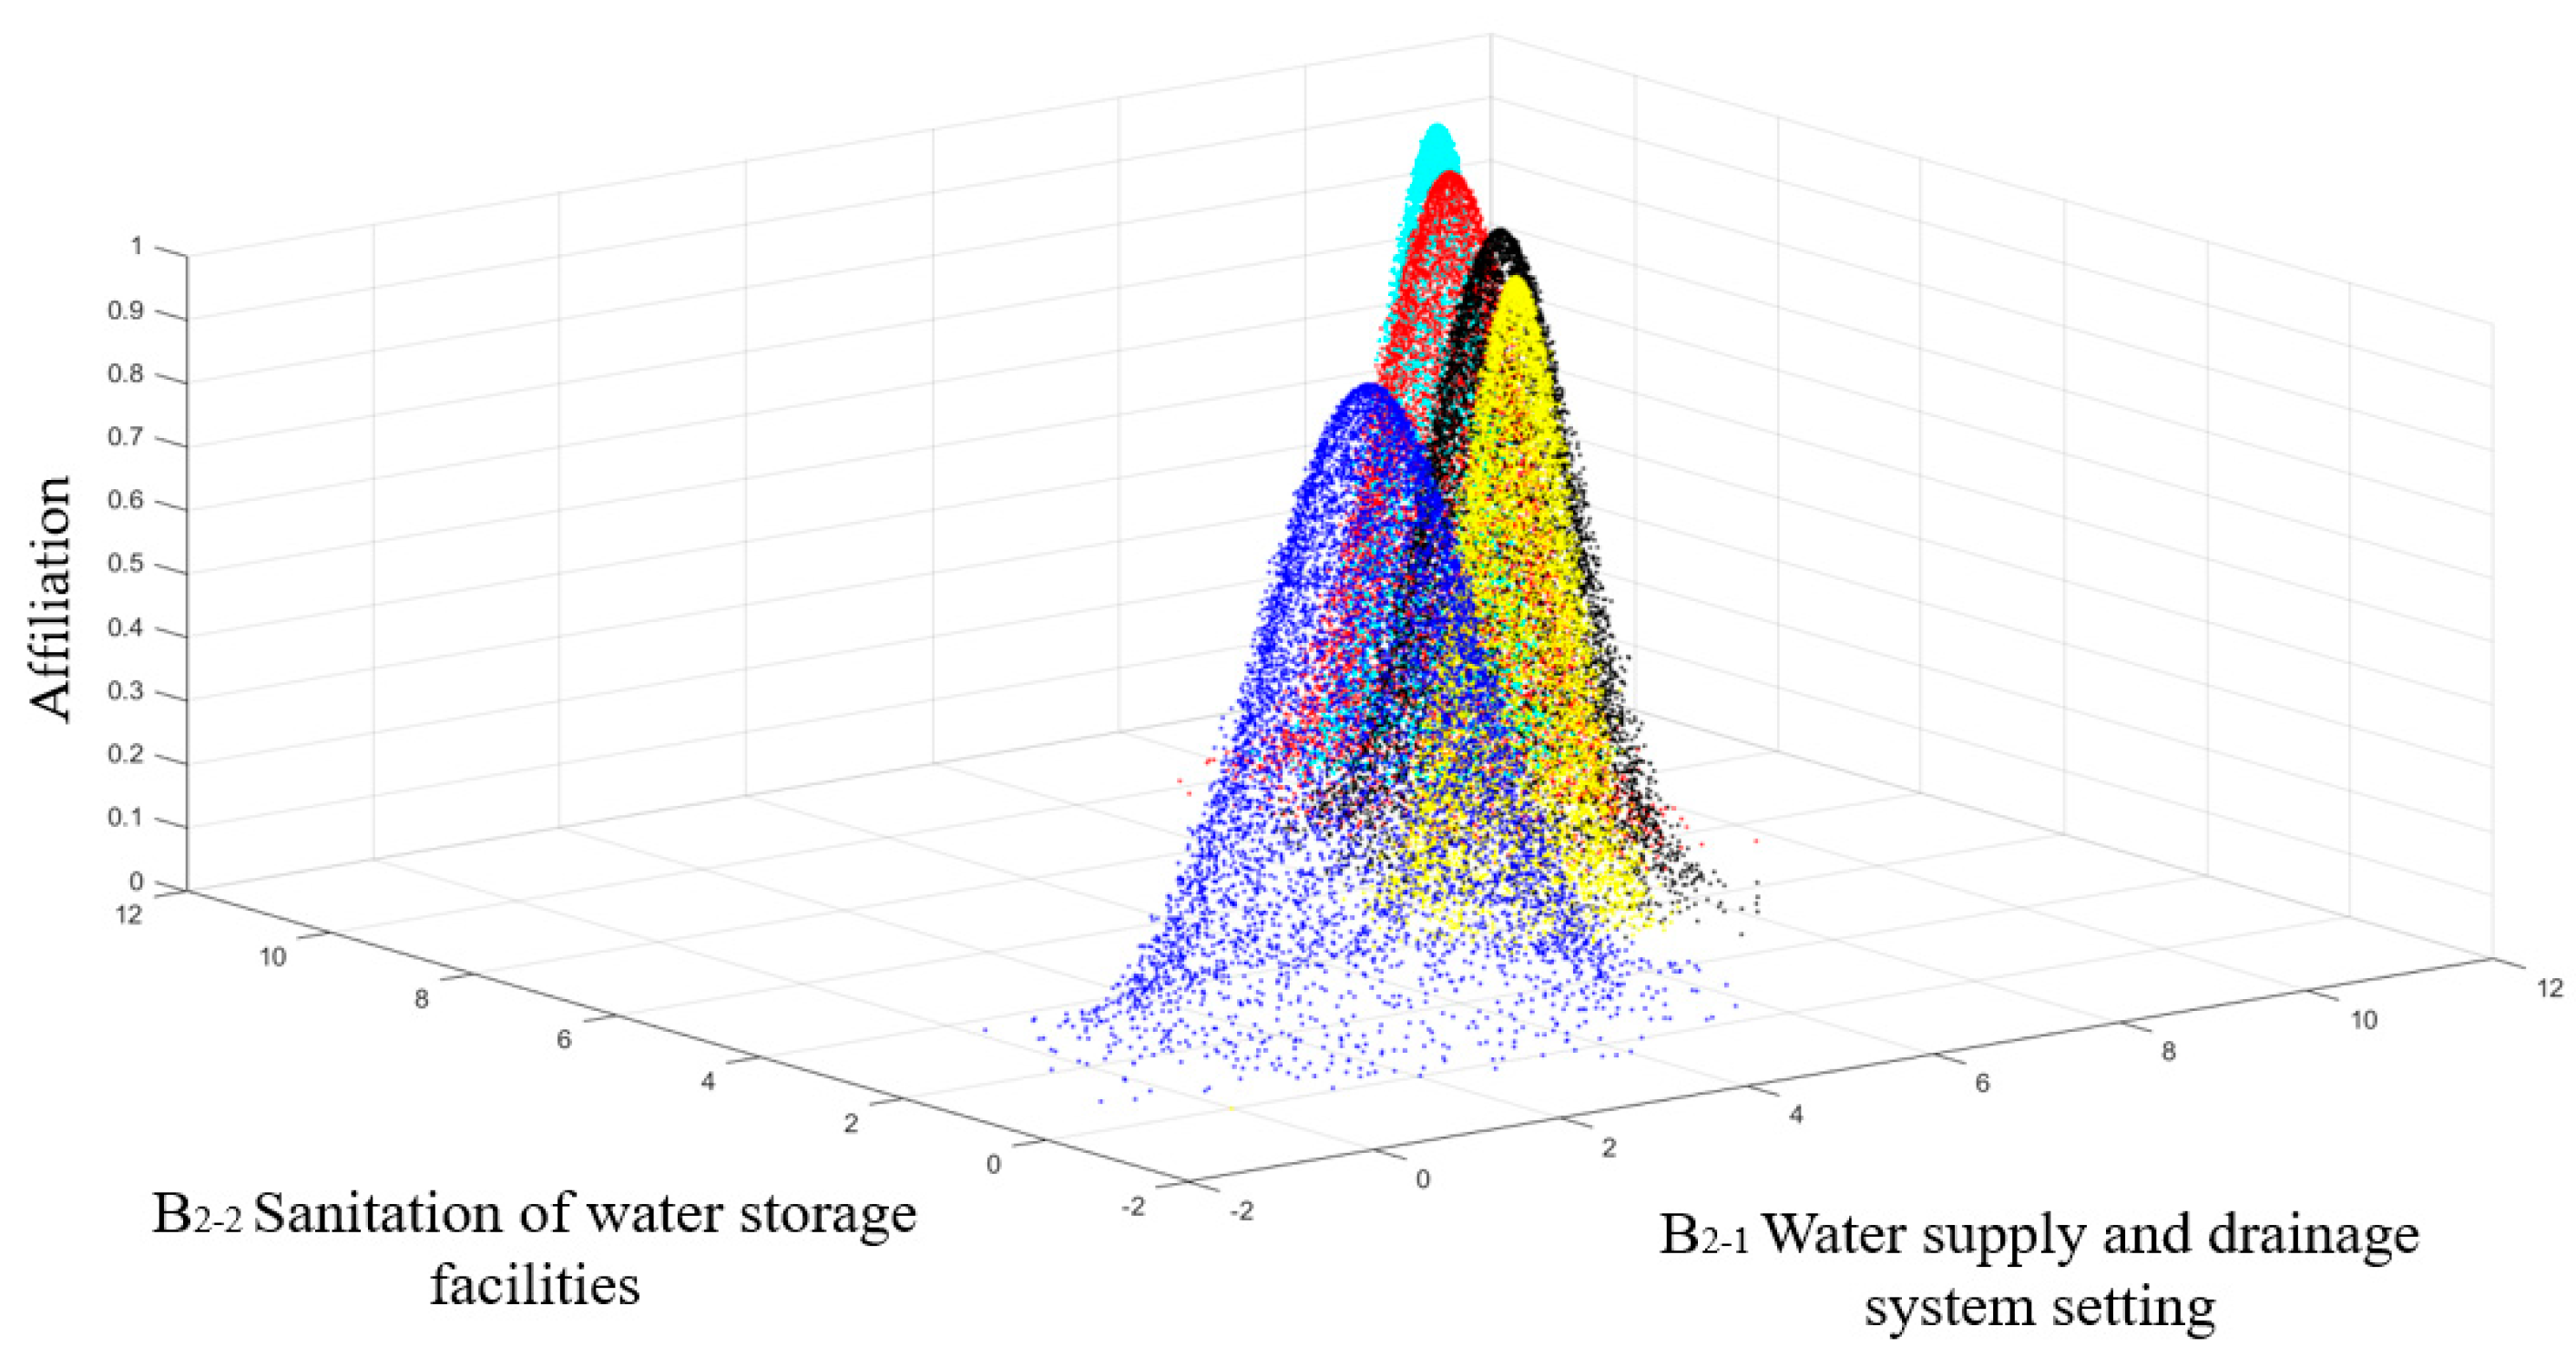
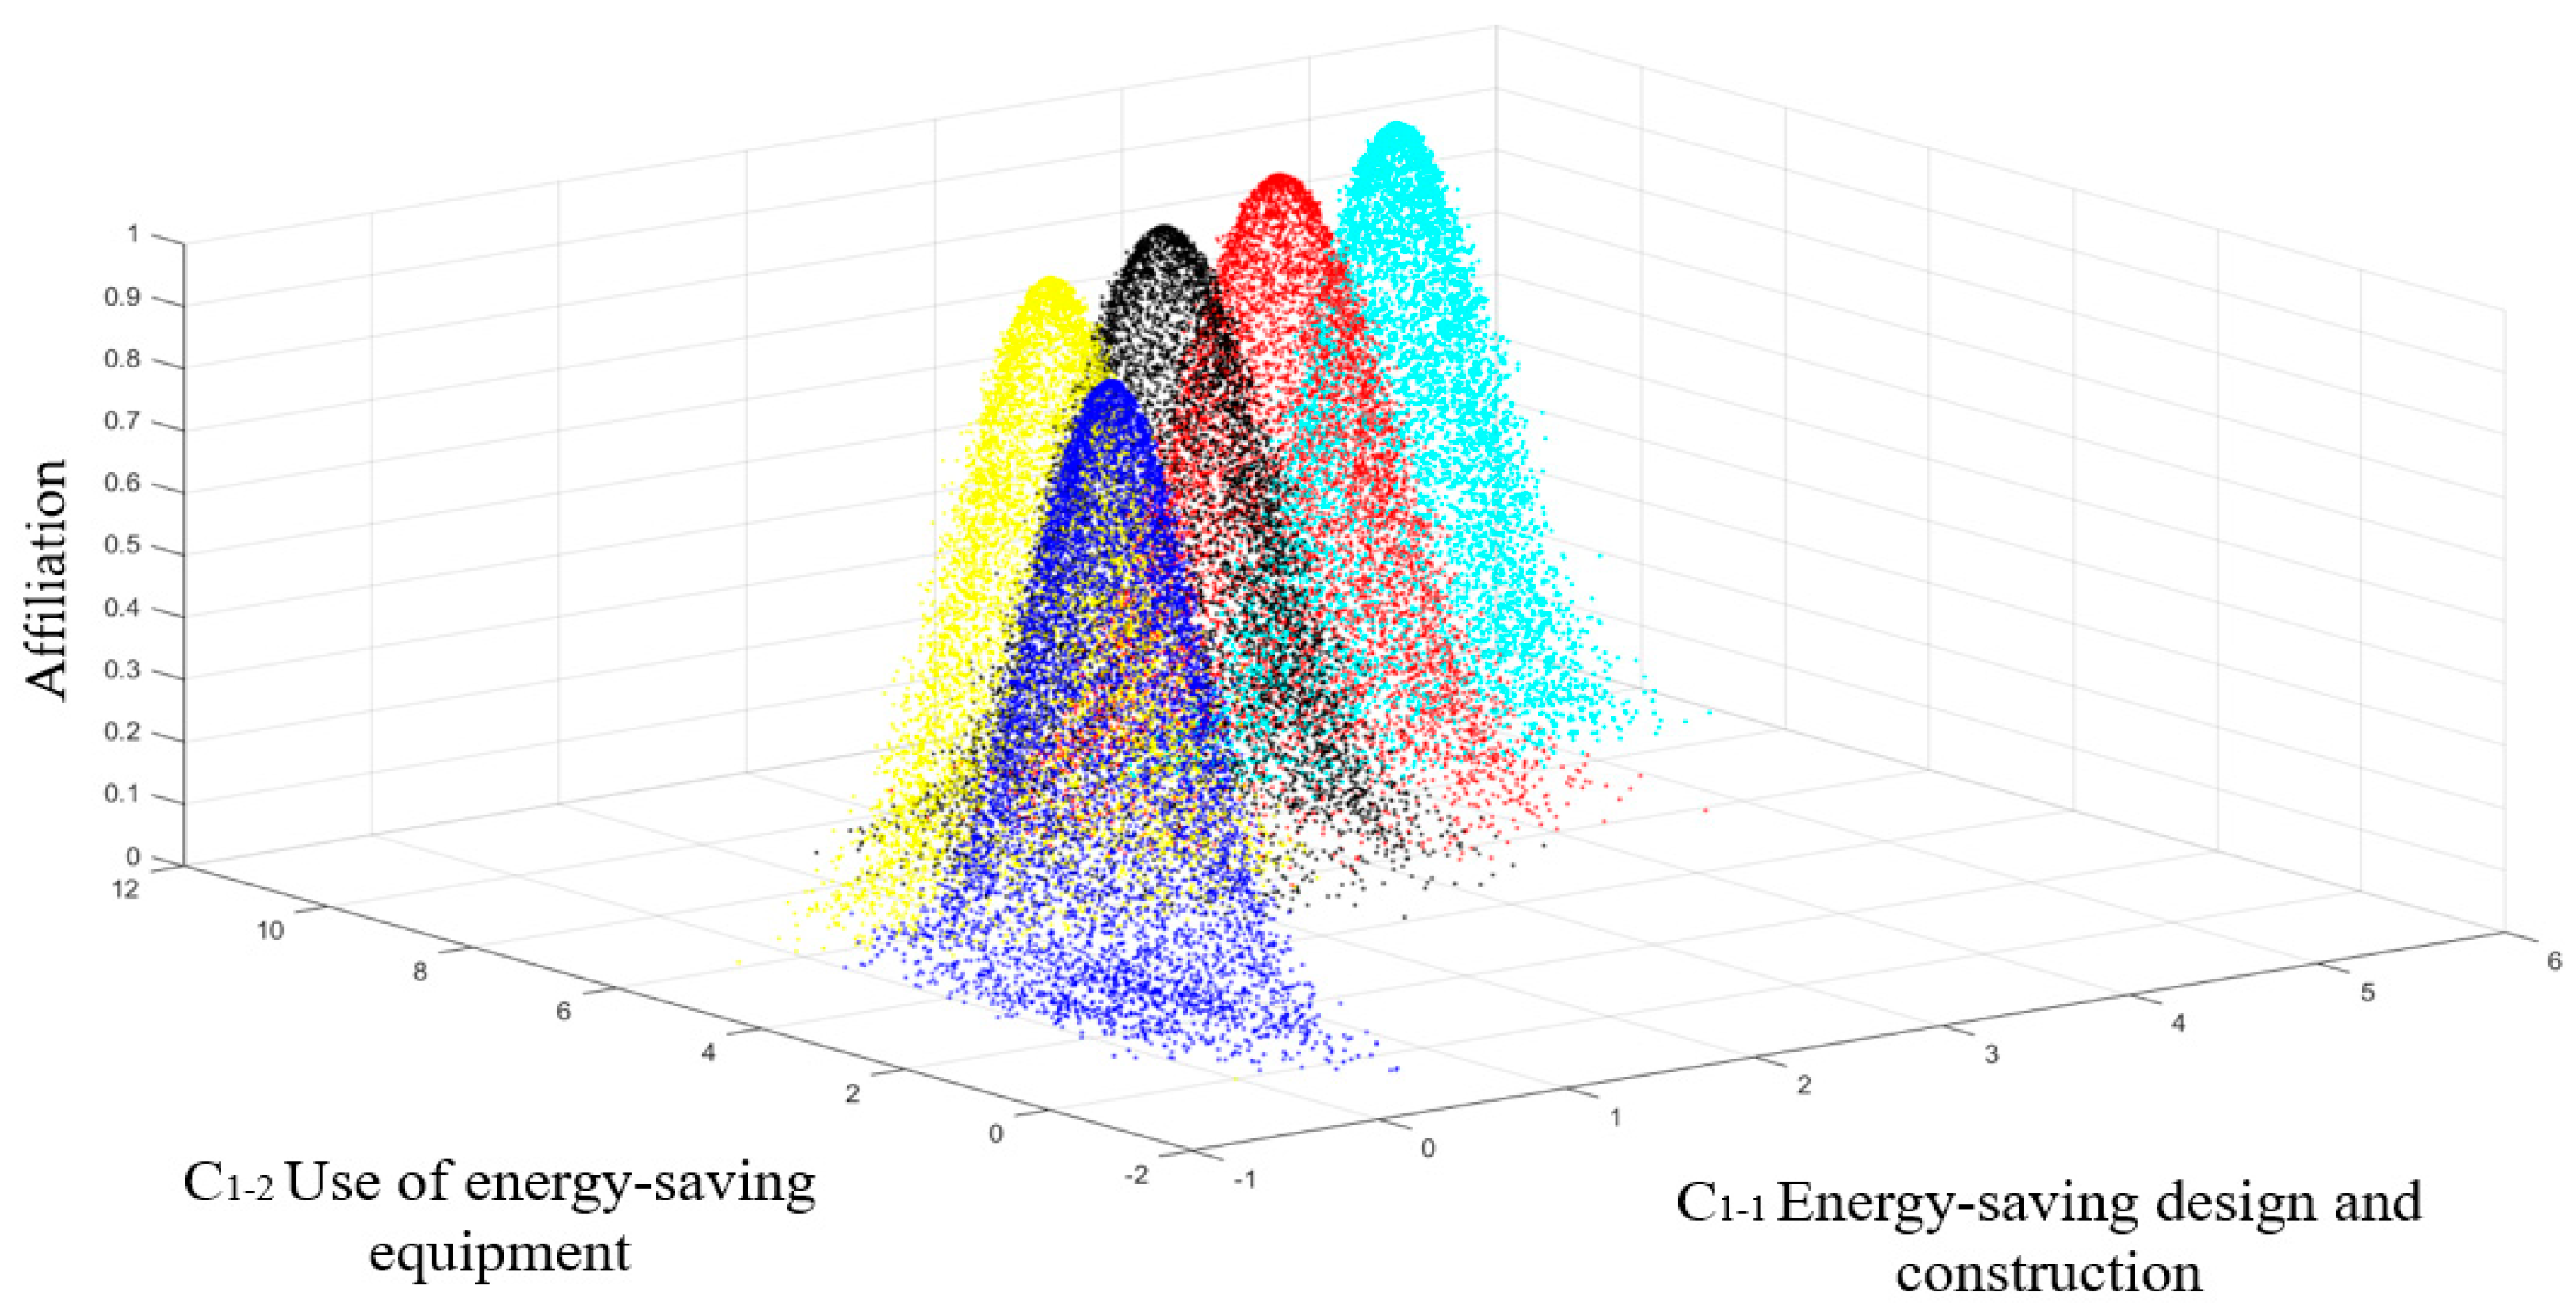
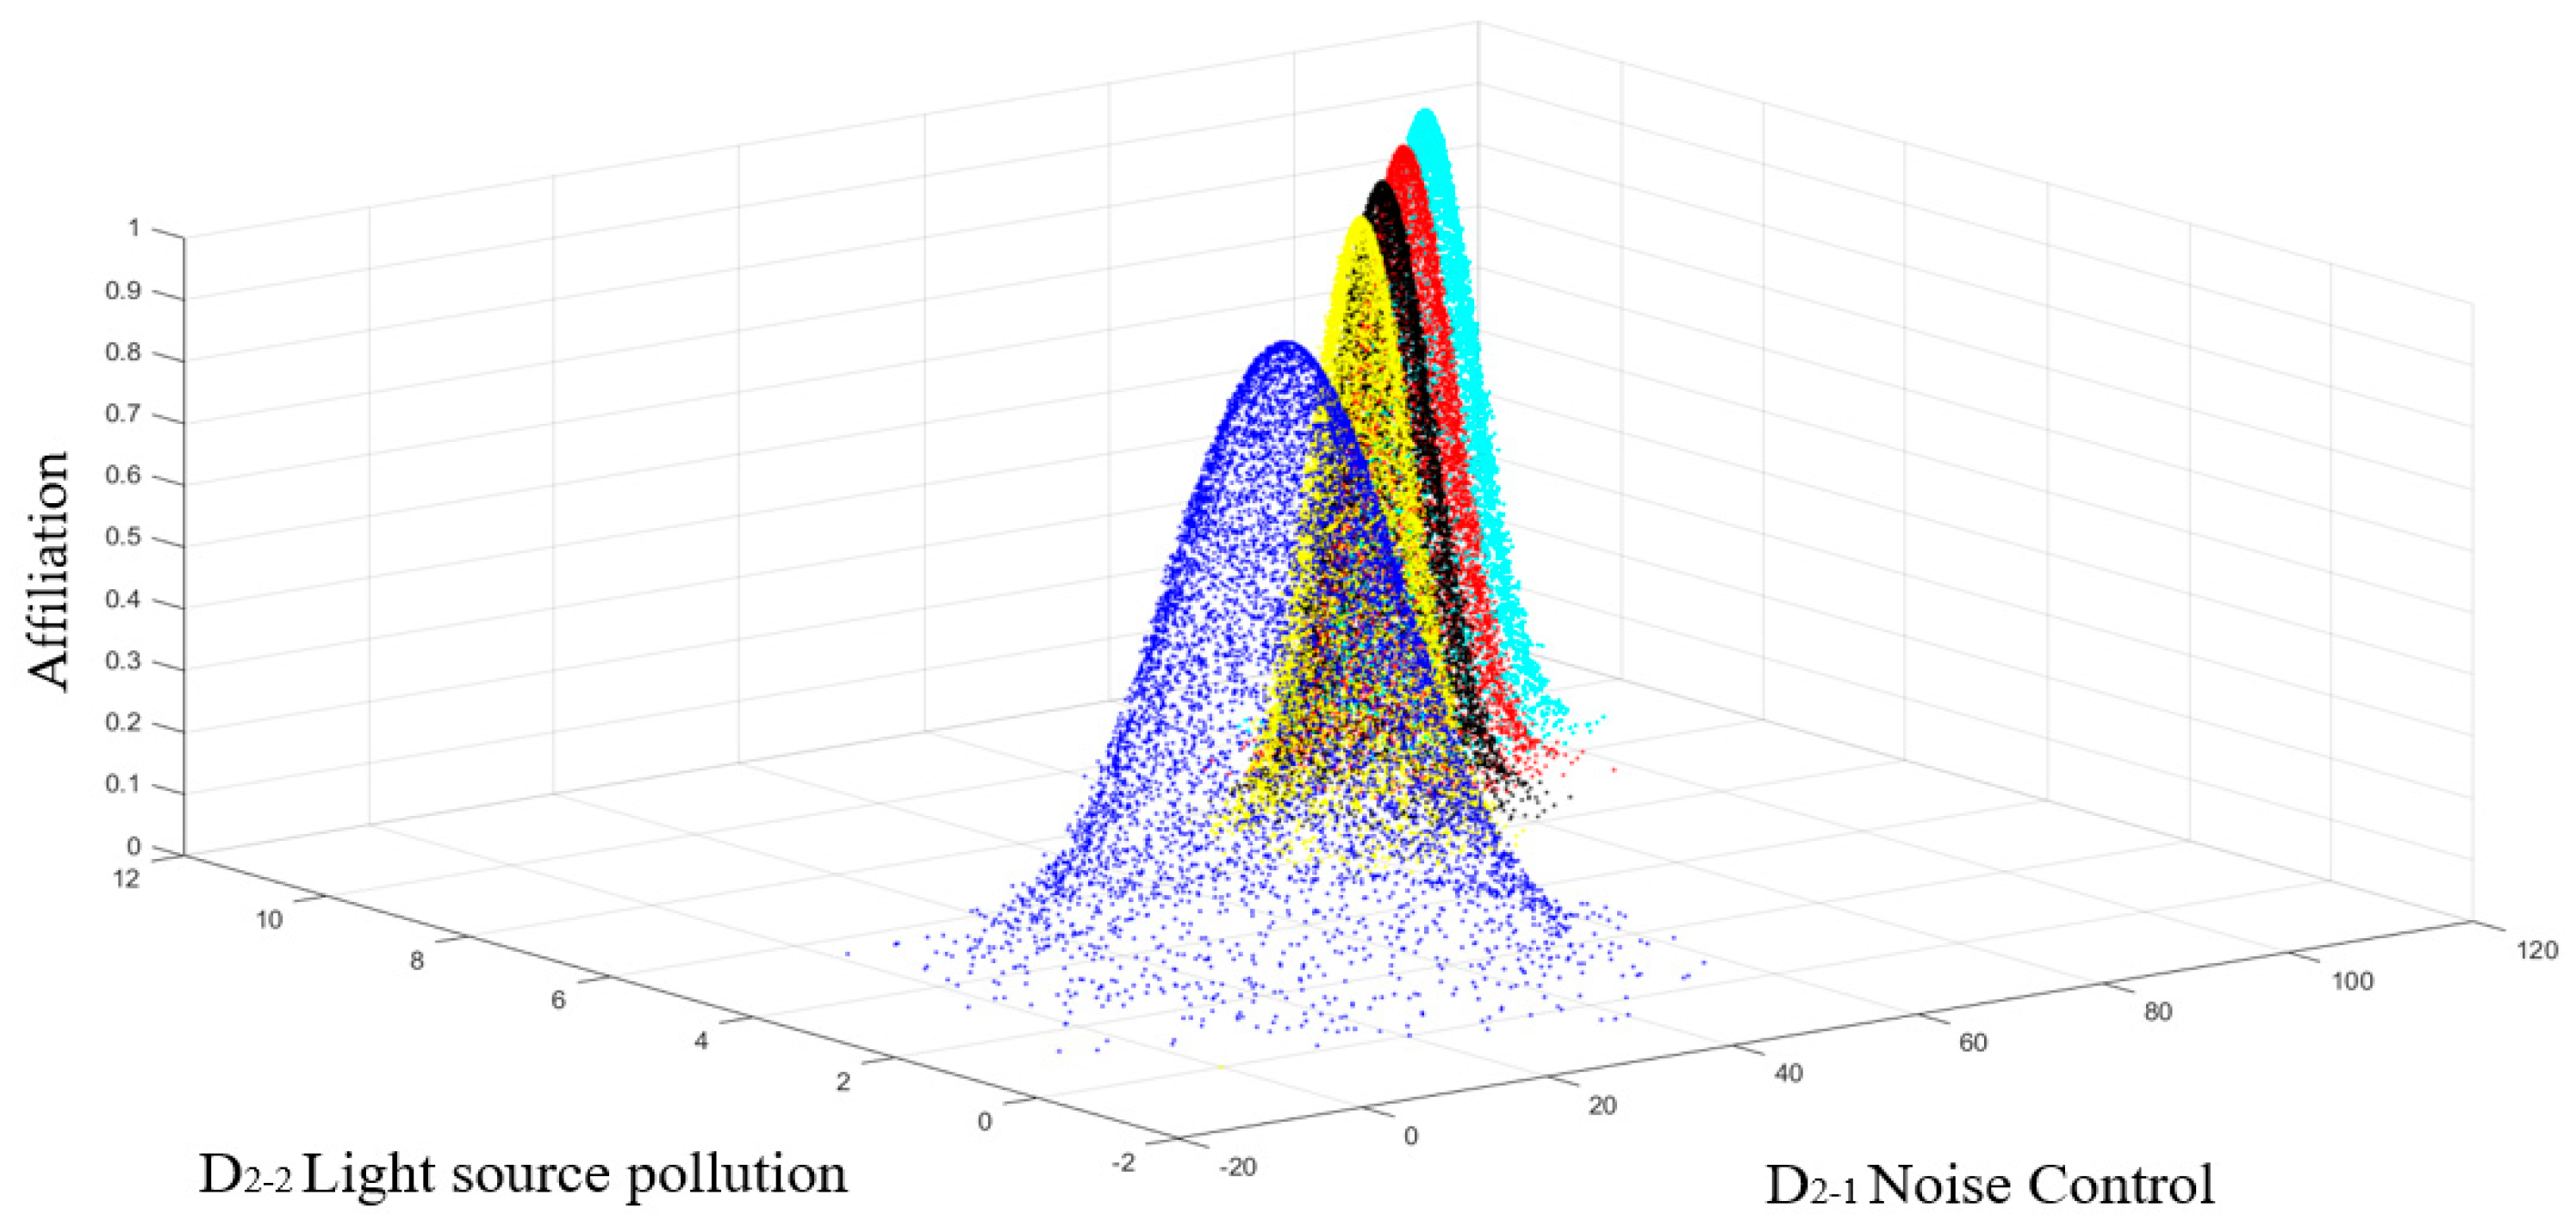
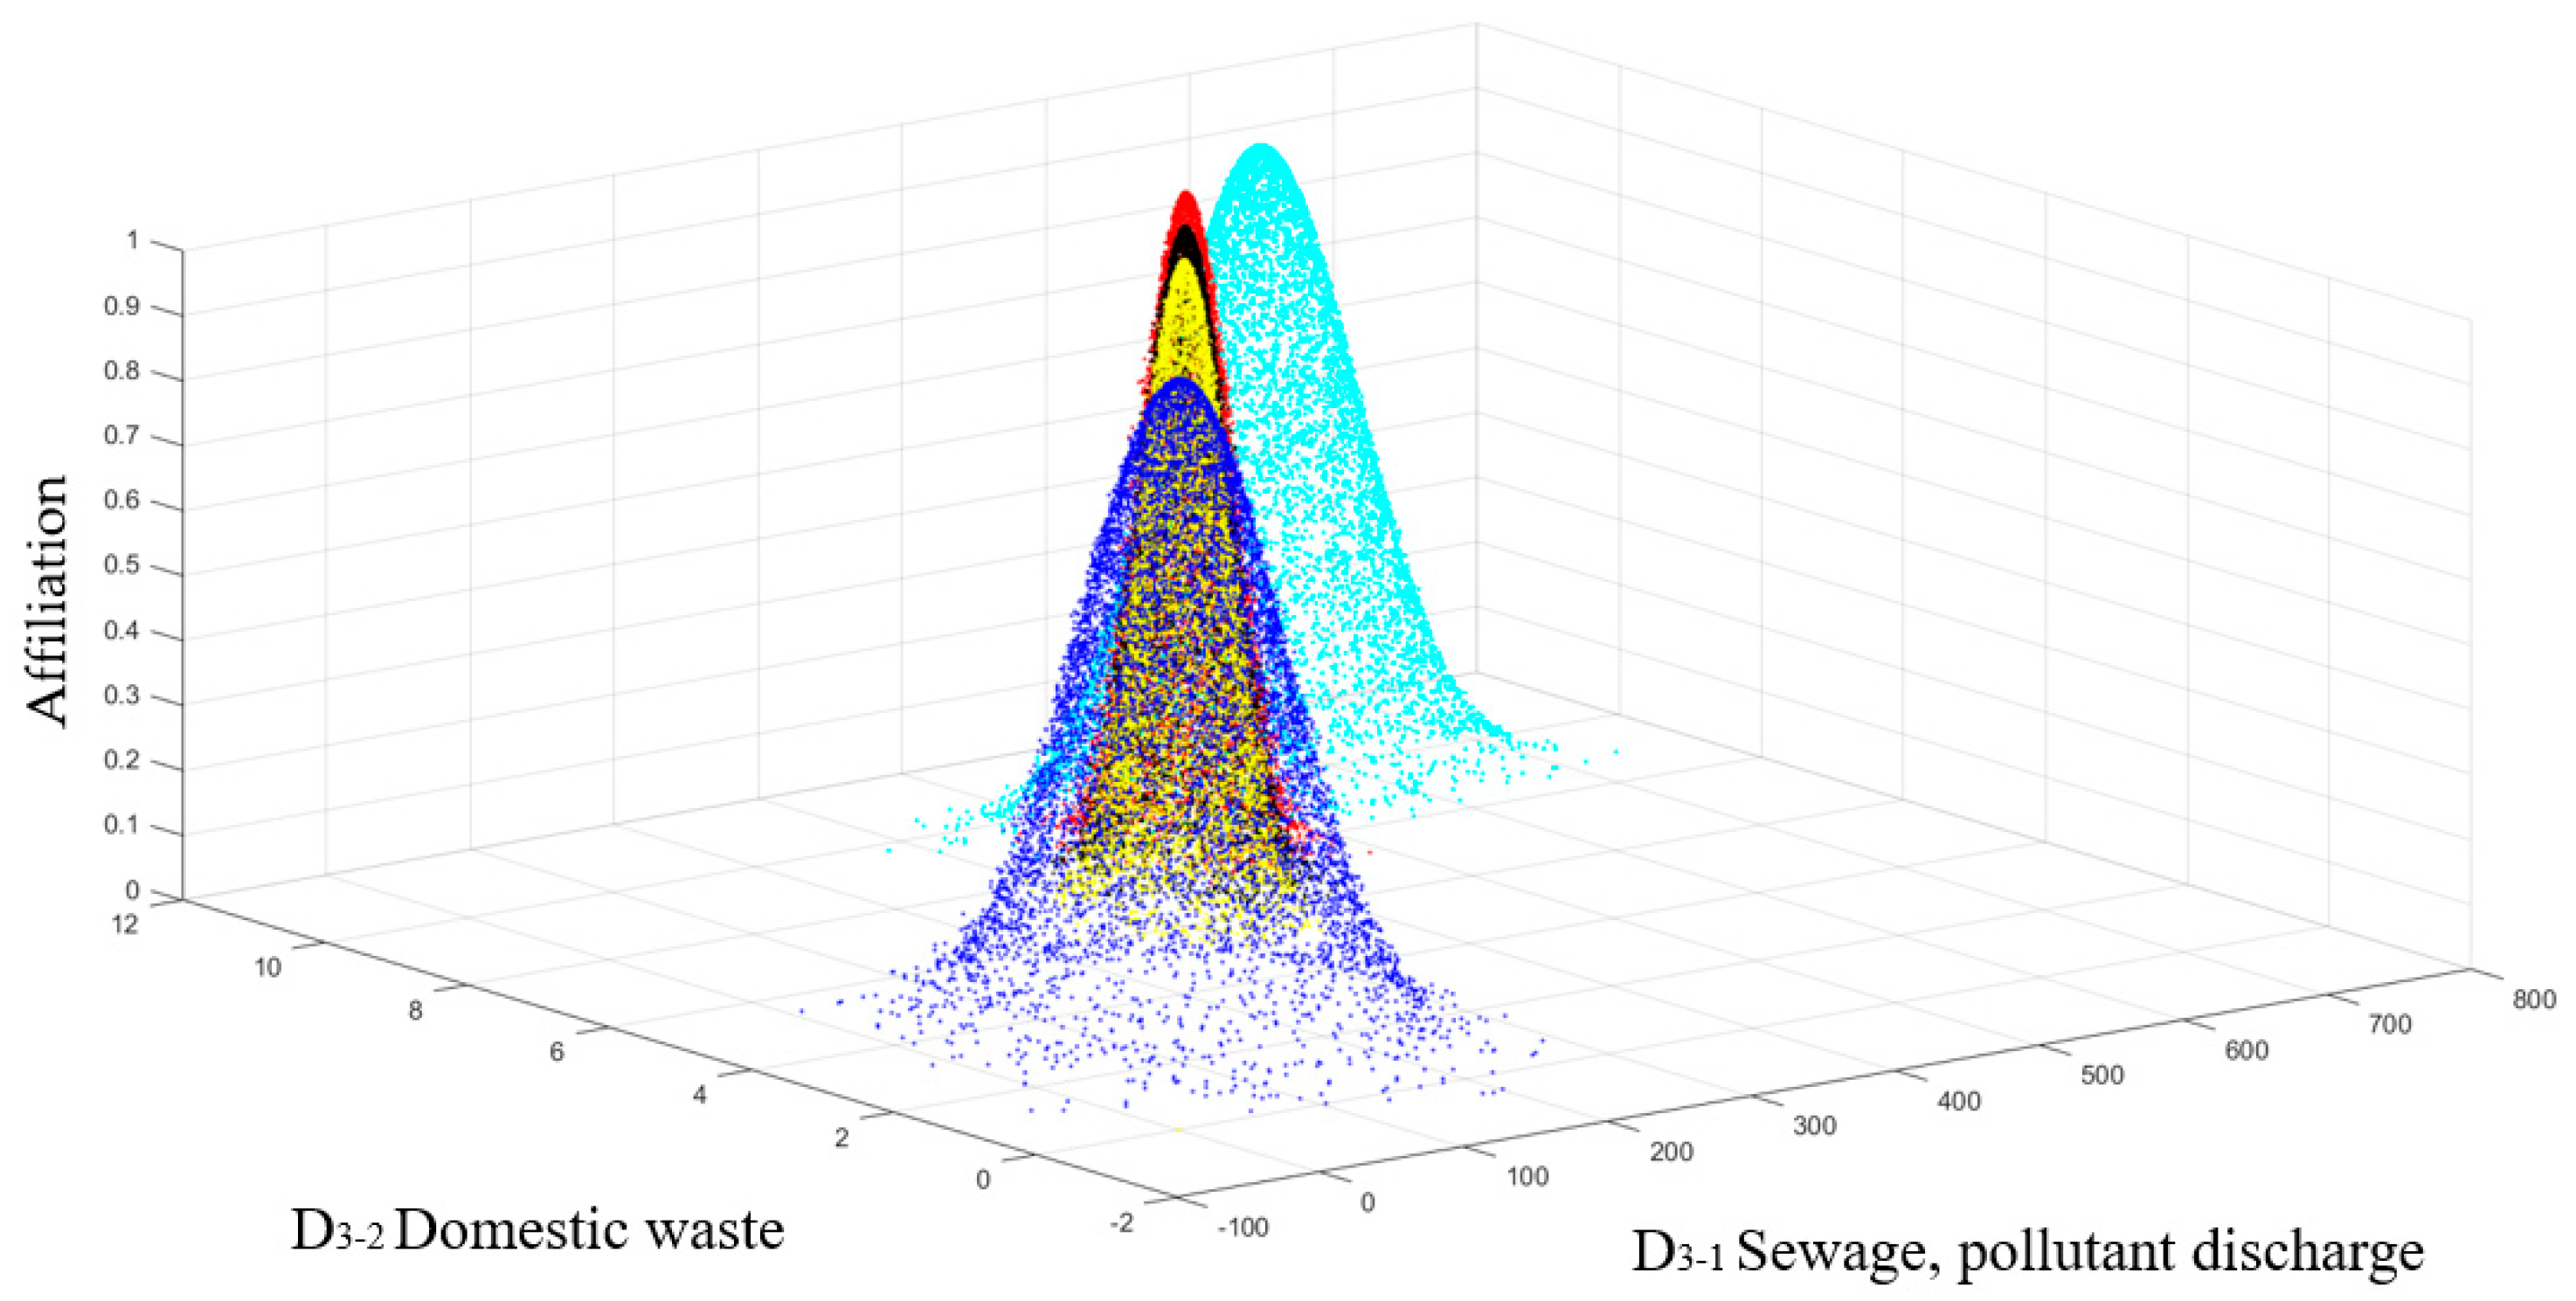
The cloud model feature values in Table 6 are input into the normal cloud generator to generate five 31-dimensional normal clouds, each corresponding to the evaluation level of each green construction. For illustration, the two–two interacting three-level indicators of the evaluation indexes, i.e., and , and , and , and , and , and , and , and used to generate the intuitive two-dimensional cloud plots [22] as shown in Figure 3, Figure 4, Figure 5, Figure 6, Figure 7 and Figure 8. Where blue is failing, yellow is basic level, black is one-star, red is two-star, and cyan is three-star; the cloud diagram formed by vs. and vs. , vs. and vs. is the same and is not repeated here.
- (9)
- Project evaluation results
The actual values of each evaluation index are shown in Table 7 through the field investigation and research of the project and decided by the discussion of the relevant person in charge of the construction project, the project manager, the supervisory unit and the construction unit.
The values of each factor are substituted into Equation (16), and the final affiliation of each grade is . According to the principle of maximum affiliation, the green construction grade of the project is determined to be 5, i.e., three stars, which indicates that the green construction degree of the project is relatively high. In order to verify the feasibility of the method proposed in this paper, the calculation results are compared with the traditional AHP-cloud model [23], which is shown in Table 8. it can be found that the calculation results are consistent, but the calculation method in this paper uses interval scale in determining the weights, which can well reflect the fuzziness of experts’ subjective judgment on the index system. At the same time, the multidimensional contact cloud method integrates multiple evaluation indicators to establish a multidimensional contact cloud, and each evaluation indicator is independent of each other, and then combined with the weight of each evaluation indicator, it avoids the inaccurate evaluation results caused by the excessive influence of a certain evaluation indicator. Moreover, the multidimensional contact cloud integrates all the selected evaluation indicators, and only one set-to-cloud model is established for each evaluation level, while the one-dimensional cloud model requires one cloud model for each evaluation level of each evaluation indicator. The evaluation process of this paper is more concise and the algorithm process is more convenient, which can be well applied to the evaluation of green construction level of large channels.
5. Conclusions
This paper takes green construction of large channels as the research object, and it carries out green construction grade evaluation by uncertain AHP-multidimensional cloud model, and it finally obtains the green construction grade evaluation result of “three stars”, which is consistent with the evaluation result of traditional AHP-cloud model. However, the calculation method of this paper adopts interval scale in determining the weights, which can well reflect the fuzziness of experts’ subjective judgment on the index system. At the same time, the multidimensional contact cloud integrates all the selected evaluation indicators, and only one set-pair cloud model is built for each evaluation level. Compared with the one-dimensional cloud model that requires one cloud model for each evaluation level, the evaluation process in this paper is more concise, and when the affiliation is calculated, substituting the actual measurement data into the formula at one time can simplify the calculation process and make the algorithm more convenient and fast, which plays a certain guiding role for the green construction of large channels. The green construction grade evaluation results have urged all parties involved in the project construction to standardize the construction, thus promoting resource conservation, environmental protection and sustainable development. However, in the future work, the coupling method between different indicators in the multidimensional cloud model needs to be studied in depth.
Author Contributions
Data collection, Q.L., L.L. and Z.W.; field investigation, Q.L., Z.W. and Q.M.; consulting experts, Z.W.; methodology, Q.L. and Z.W.; data processing, Z.W.; graphic simulation, Z.W. and L.L.; comparison verification Q.L. and Z.W.; conclusion summary, Q.M. All authors have read and agreed to the published version of the manuscript.
Funding
This research was funded by the Key Project of Water Conservancy Science and Technology of Henan Province (No. GG202062).
Institutional Review Board Statement
Not applicable.
Informed Consent Statement
Not applicable.
Data Availability Statement
Not applicable.
Conflicts of Interest
The authors declare no conflict of interest.
References
- 4GB/T 50378-2019; Green Building Evaluation Standard. China Construction Industry Press: Beijing, China, 2019.
- Xu, J. Evaluation Model and Empirical Research on the Green Innovation Capability of Manufacturing Enterprises from the Perspective of Ecological Niche. Sustainability 2021, 13, 11710. [Google Scholar] [CrossRef]
- Gao, Z.G.; Chen, W.G.; Yang, H.Y. Research on green construction level evaluation of deep foundation pit based on cloud material element model. J. Qingdao Univ. Technol. 2021, 42, 1–11. [Google Scholar]
- Hong, W.X.; Lu, C.; Zhao, D.F.; Li, B.B. Research on micro risk evaluation of green building based on combined empowerment-cloud model. J. Xi’an Univ. Archit. Technol. 2021, 40, 72–79. [Google Scholar] [CrossRef]
- Guo, R.X.; Xia, J.B.; Dong, S.F.; Long, M. A multi-attribute comprehensive evaluation method based on multi-dimensional cloud model. Comput. Sci. 2010, 37, 3. [Google Scholar]
- Zhang, Q.; Chen, J.; Lu, L.S.; Cao, Z.Z.; Duan, W.P. Multidimensional cloud model for rock slope stability assessment. Mod. Min. 2020, 36, 6. [Google Scholar]
- Li, X.; Li, W.; Lei, W.; Wang, Y.H.; Luo, N.; Fan, H.Y. Research on green construction evaluation of urban water environment management based on AHP-artificial neural network. Water Sci. Technol. Econ. 2021, 27, 18–23. [Google Scholar]
- Ren, Y.L.; Bao, X.Y. Comprehensive evaluation of environmental impact of railroad green construction based on game-theory-cloud model. Highw. Eng. 2021, 1–14. Available online: http://kns.cnki.net/kcms/detail/43.1481.U.20210408.1153.028.html (accessed on 23 April 2022).
- Zhu, W.H.; Zou, T. Green railroad construction phase scheme selection based on AHM and improved TOPSIS. J. Civ. Eng. Manag. 2018, 35, 187–191. [Google Scholar] [CrossRef]
- Wang, J.Y.; Wang, H.T. Fuzzy comprehensive evaluation of construction project risk based on uncertain AHP. J. Shenzhen Univ. 2006, 48–53. [Google Scholar] [CrossRef]
- Guo, R.C.; Chen, G.W.; Zhao, X.J.; Huo, J.Y.; Fan, D.W. Safety assessment of column control operation based on cloud model and uncertain AHP. J. Railw. 2016, 38, 69–74. [Google Scholar]
- Li, L. Research on Green Construction Organization and Management Technology of Large Bridges. Master’s Thesis, Zhengzhou University, Zhengzhou, China, 2017. [Google Scholar]
- Xie, S.J. Construction evaluation of water conservancy and hydropower projects based on green construction evaluation index system. Heilongjiang Water Conserv. Sci. Technol. 2018, 46, 219–223. [Google Scholar] [CrossRef]
- Li, H.W.; Bao, X.Y. Comprehensive evaluation of green construction level of railroad tunnel in Qinghai-Tibet plateau region. J. Railw. Sci. Eng. 2021, 18, 524–532. [Google Scholar] [CrossRef]
- Li, B.W.; Yang, M.R.; Wang, X.L.; Chen, T.J. Research on the evaluation index system of green road construction stage in Hainan Province. Highway 2020, 65, 265–272. [Google Scholar]
- Shi, Z.J.; Wang, H.W.; Wang, X. Aviation maintenance risk posture assessment based on multivariate linkage set-pair analysis. Syst. Eng. Electron. Technol. 2016, 38, 588–594. [Google Scholar]
- Li, D.S. Research on System Hazard Evaluation Based on Generalized Set-Pair Analysis. Ph.D. Thesis, Northeastern University, Boston, MA, USA, 2010. [Google Scholar]
- Zhou, T.; Hu, J.H.; Kuang, Y. Method and application of rock quality evaluation based on fuzzy RES-multidimensional cloud model. Chin. J. Nonferr. Met. 2019, 29, 1771–1780. [Google Scholar] [CrossRef]
- Yue, K.W. Comprehensive Evaluation of Power Quality Based on Cloud Object Element and Its Application Research. Master’s Thesis, Beijing Jiaotong University, Beijing, China, 2012. [Google Scholar]
- Wang, M.W.; Wang, X.; Long, J.Y.; Jin, J.L. Evaluation of debris flow hazard based on multidimensional linked normal cloud model. J. Appl. Basic Eng. Sci. 2021, 29, 368–375. [Google Scholar] [CrossRef]
- Liu, X.Y.; Yang, W.; Zhang, X.M. Rockburst prediction by multidimensional cloud model based on improved hierarchical method and CRITIC method. J. Hunan Univ. 2021, 48, 118–124. [Google Scholar] [CrossRef]
- Guo, J.; Zhang, W.X.; Zhao, Y. A comprehensive evaluation method of multidimensional cloud model for rockburst prediction. J. Rock Mech. Eng. 2018, 37, 1199–1206. [Google Scholar] [CrossRef]
- Luo, C.H.; Qu, G.J.; Zou, T.H.; Tang, T.; Xie, J.; Luo, Q. A multidimensional evaluation model of wind farm operation performance based on hierarchical analysis and cloud model. Mod. Electr. 2021, 38, 601–612. [Google Scholar] [CrossRef]
Figure 1.
Flow chart of the study.

Figure 2.
Green construction evaluation index of large channels.

Figure 3.
Cloud chart of two indicators under endurance index.

Figure 4.
Cloud diagram of two indicators under office air quality index.

Figure 5.
Water quality indicators under the two indicators cloud map.

Figure 6.
Energy saving and energy use indicators under the two indicators cloud chart.

Figure 7.
Cloud diagram of two indicators under the physical environment index of the site.

Figure 8.
Cloud plot of two indicators under waste pollution index.


Table 1.
Parameters and meanings.
| Notation | Explanation |
|---|---|
| Cloud model structure | |
| Comparison interval of evaluation indicators | |
| Lower limit of interval importance | |
| Upper limit of interval importance | |
| Expert Weights | |
| Weight interval matrix | |
| Uncertainty interval judgment matrix | |
| Consistent approximation matrix satisfying mutual inverse | |
| Weights of the consistency approximation matrix | |
| Polar difference matrix | |
| The weight interval of the interval number judgment matrix | |
| Set to contact degree | |
| Interval Difference | |
| Coefficient of variance | |
| Contrast coefficient | |
| Relative weights of deterministic intervals | |
| Relative weights of uncertainty intervals | |
| Precise weighting values of evaluation indicators | |
| Expected Value | |
| Entropy value | |
| Hyperentropy value | |
| Measured value | |
| Degree of certainty | |
| Constraint interval small value | |
| Constraint interval large value | |
| rule | |
| Cloud entropy based on “50% association degree” rule |
Table 2.
Relative weight values of sub-indicators.
| Sub-Indicators | Expert Title | Years in Channel Construction and Management (Years) | Familiarity with Engineering Green Construction | Understanding of This Channel Project | Sub-Index Score | Relative Weighting Values of Sub-Indicators |
| Positive senior | >20 | Very familiar | Very familiar | 10 | 0.323 | |
| Associate senior | 10~20 | Familiarity | Familiarity | 8 | 0.258 | |
| Intermediate | 5~10 | More familiar | More familiar | 6 | 0.193 | |
| Primary | 2~5 | Understanding | Understanding | 4 | 0.129 | |
| Other | <2 | Better understanding | Better understanding | 3 | 0.097 |
Note: The relative weight value of the sub-indicators in the table is obtained by dividing the corresponding score of the sub-indicators by the sum of the scores31, where the scores are determined according to the actual ability of experts, industry popularity, etc.
Table 3.
Actual weight per expert.
| Experts | Title | Number of Years Engaged in Channel Construction (Years) | Familiarity with Engineering Green Construction | Understanding of This Channel Project | Cumulative Weighting | Normalized Weights |
|---|---|---|---|---|---|---|
| 1 | Positive senior (0.323) | 22 (0.323) | Very familiar (0.323) | Familiarity (0.258) | 1.227 | 0.284 |
| 2 | Associate senior (0.258) | 18 (0.258) | Very familiar (0.323) | Familiarity (0.258) | 1.097 | 0.254 |
| 3 | Intermediate (0.193) | 9 (0.193) | Familiarity (0.258) | More familiar (0.193) | 0.837 | 0.194 |
| 4 | Positive senior (0.258) | 19 (0.258) | Very familiar (0.323) | Very familiar (0.323) | 1.162 | 0.268 |
Table 4.
Green construction evaluation index weighting table.
| Primary Indexes | Single Weighting | Secondary Indexes | Single Weighting | Total Weighting | Tertiary Indexes | Single Weighting | Total Weighting |
|---|---|---|---|---|---|---|---|
| 0.2660 | 0.6014 | 0.1600 | 0.5570 | 0.0891 | |||
| 0.2705 | 0.0433 | ||||||
| 0.1725 | 0.0276 | ||||||
| 0.3986 | 0.1060 | 0.7942 | 0.0842 | ||||
| 0.2058 | 0.0218 | ||||||
| 0.0650 | 0.3795 | 0.0247 | 0.3573 | 0.0088 | |||
| 0.6427 | 0.0159 | ||||||
| 0.6205 | 0.0403 | 0.3993 | 0.0161 | ||||
| 0.6007 | 0.0242 | ||||||
| 0.2207 | 0.2822 | 0.0623 | 0.6725 | 0.0419 | |||
| 0.3275 | 0.0204 | ||||||
| 0.4253 | 0.0939 | 0.1924 | 0.0181 | ||||
| 0.3058 | 0.0287 | ||||||
| 0.5018 | 0.0471 | ||||||
| 0.2241 | 0.0495 | 0.6047 | 0.0299 | ||||
| 0.2548 | 0.0126 | ||||||
| 0.1405 | 0.0070 | ||||||
| 0.0684 | 0.0151 | 0.6061 | 0.0091 | ||||
| 0.2399 | 0.0036 | ||||||
| 0.1540 | 0.0023 | ||||||
| 0.3624 | 0.6063 | 0.2197 | 0.2306 | 0.0508 | |||
| 0.2635 | 0.0579 | ||||||
| 0.5059 | 0.1111 | ||||||
| 0.2402 | 0.0870 | 0.7330 | 0.0638 | ||||
| 0.2670 | 0.0232 | ||||||
| 0.1535 | 0.0556 | 0.6616 | 0.0368 | ||||
| 0.3384 | 0.0188 | ||||||
| 0.0859 | 0.3573 | 0.0307 | 0.3617 | 0.0111 | |||
| 0.6383 | 0.0196 | ||||||
| 0.6427 | 0.0552 | 0.7149 | 0.0395 | ||||
| 0.2851 | 0.0157 |
Table 5.
Green construction index level division.
| Indicators | Green Level | ||||
|---|---|---|---|---|---|
| Failure | Basic Level | One-Star | Two-Star | Three-Star | |
| [0,6) | [6,7) | [7,8) | [8,9) | [9,10] | |
| [0,6) | [6,7) | [7,8) | [8,9) | [9,10] | |
| [0,6) | [6,7) | [7,8) | [8,9) | [9,10] | |
| [0,6) | [6,7) | [7,8) | [8,9) | [9,10] | |
| [0,6) | [6,7) | [7,8) | [8,9) | [9,10] | |
| [0,5) | [5,10) | [10,15) | [15,20) | [20,25] | |
| [0,2) | [2,3) | [3,4) | [4,5) | [5,6] | |
| [0,6) | [6,7) | [7,8) | [8,9) | [9,10] | |
| [0,4) | [4,5) | [5,7) | [7,9) | [9,10] | |
| [0,1) | [1,2) | [2,3) | [3,4) | [4,5] | |
| [0,6) | [6,7) | [7,8) | [8,9) | [9,10] | |
| [0,60) | [60,70) | [70,80) | [80,90) | [90,100] | |
| [0,6) | [6,7) | [7,8) | [8,9) | [9,10] | |
| [0,6) | [6,7) | [7,8) | [8,9) | [9,10] | |
| [0,5) | [5,10) | [10,15) | [15,20) | [20,25] | |
| [0,6) | [6,7) | [7,8) | [8,9) | [9,10] | |
| [0,6) | [6,7) | [7,8) | [8,9) | [9,10] | |
| [0,60) | [60,70) | [70,80) | [80,90) | [90,100] | |
| [0,6) | [6,7) | [7,8) | [8,9) | [9,10] | |
| [0,6) | [6,7) | [7,8) | [8,9) | [9,10] | |
| [0,6) | [6,7) | [7,8) | [8,9) | [9,10] | |
| [0,6) | [6,7) | [7,8) | [8,9) | [9,10] | |
| [0,6) | [6,7) | [7,8) | [8,9) | [9,10] | |
| [0,60) | [60,70) | [70,80) | [80,90) | [90,100] | |
| [0,6) | [6,7) | [7,8) | [8,9) | [9,10] | |
| [0,300) | [300,350) | [350,400) | [400,450) | [450,600] | |
| [0,6) | [6,7) | [7,8) | [8,9) | [9,10] | |
| [0,60) | [60,70) | [70,80) | [80,90) | [90,100] | |
| [0,6) | [6,7) | [7,8) | [8,9) | [9,10] | |
| [0,6) | [6,7) | [7,8) | [8,9) | [9,10] | |
| [0,6) | [6,7) | [7,8) | [8,9) | [9,10] | |
Table 6.
Parameters of multidimensional rank cloud model of green construction evaluation index.
| Indicators | Green Level | ||||
|---|---|---|---|---|---|
| Failure | Basic Level | One-Star | Two-Star | Three-Star | |
| (3,1,0.08) | (6.5,0.42,0.08) | (7.5,0.42,0.08) | (8.5,0.42,0.08) | (9.5,0.42,0.08) | |
| (3,1,0.08) | (6.5,0.42,0.08) | (7.5,0.42,0.08) | (8.5,0.42,0.08) | (9.5,0.42,0.08) | |
| (3,1,0.08) | (6.5,0.42,0.08) | (7.5,0.42,0.08) | (8.5,0.42,0.08) | (9.5,0.42,0.08) | |
| (3,1,0.08) | (6.5,0.42,0.08) | (7.5,0.42,0.08) | (8.5,0.42,0.08) | (9.5,0.42,0.08) | |
| (3,1,0.08) | (6.5,0.42,0.08) | (7.5,0.42,0.08) | (8.5,0.42,0.08) | (9.5,0.42,0.08) | |
| (2.5,0.83,0.08) | (7.5,2.12,0.08) | (12.5,2.12,0.08) | (17.5,2.12,0.08) | (22.5,2.12,0.08) | |
| (1,0.33,0.08) | (2.5,0.42,0.08) | (3.5,0.42,0.08) | (4.5,0.42,0.08) | (5.5,0.42,0.08) | |
| (3,1,0.08) | (6.5,0.42,0.08) | (7.5,0.42,0.08) | (8.5,0.42,0.08) | (9.5,0.42,0.08) | |
| (2,0.67,0.08) | (4.5,0.42,0.08) | (6,0.85,0.08) | (8,0.85,0.08) | (9.5,0.42,0.08) | |
| (0.5,0.17,0.08) | (1.5,0.42,0.08) | (2.5,0.42,0.08) | (3.5,0.42,0.08) | (4.5,0.42,0.08) | |
| (3,1,0.08) | (6.5,0.42,0.08) | (7.5,0.42,0.08) | (8.5,0.42,0.08) | (9.5,0.42,0.08) | |
| (30,10,0.08) | (65,4.25,0.08) | (75,4.25,0.08) | (85,4.25,0.08) | (95,4.25,0.08) | |
| (3,1,0.08) | (6.5,0.42,0.08) | (7.5,0.42,0.08) | (8.5,0.42,0.08) | (9.5,0.42,0.08) | |
| (3,1,0.08) | (6.5,0.42,0.08) | (7.5,0.42,0.08) | (8.5,0.42,0.08) | (9.5,0.42,0.08) | |
| (2.5,0.83,0.08) | (7.5,2.12,0.08) | (12.5,2.12,0.08) | (17.5,2.12,0.08) | (22.5,2.12,0.08) | |
| (3,1,0.08) | (6.5,0.42,0.08) | (7.5,0.42,0.08) | (8.5,0.42,0.08) | (9.5,0.42,0.08) | |
| (3,1,0.08) | (6.5,0.42,0.08) | (7.5,0.42,0.08) | (8.5,0.42,0.08) | (9.5,0.42,0.08) | |
| (30,10,0.08) | (65,4.25,0.08) | (75,4.25,0.08) | (85,4.25,0.08) | (95,4.25,0.08) | |
| (3,1,0.08) | (6.5,0.42,0.08) | (7.5,0.42,0.08) | (8.5,0.42,0.08) | (9.5,0.42,0.08) | |
| (3,1,0.08) | (6.5,0.42,0.08) | (7.5,0.42,0.08) | (8.5,0.42,0.08) | (9.5,0.42,0.08) | |
| (3,1,0.08) | (6.5,0.42,0.08) | (7.5,0.42,0.08) | (8.5,0.42,0.08) | (9.5,0.42,0.08) | |
| (3,1,0.08) | (6.5,0.42,0.08) | (7.5,0.42,0.08) | (8.5,0.42,0.08) | (9.5,0.42,0.08) | |
| (3,1,0.08) | (6.5,0.42,0.08) | (7.5,0.42,0.08) | (8.5,0.42,0.08) | (9.5,0.42,0.08) | |
| (30,10,0.08) | (65,4.25,0.08) | (75,4.25,0.08) | (85,4.25,0.08) | (95,4.25,0.08) | |
| (3,1,0.08) | (6.5,0.42,0.08) | (7.5,0.42,0.08) | (8.5,0.42,0.08) | (9.5,0.42,0.08) | |
| (150,50,0.08) | (325,21.23,0.08) | (375,21.23,0.08) | (425,21.23,0.08) | (525,63.7,0.08) | |
| (3,1,0.08) | (6.5,0.42,0.08) | (7.5,0.42,0.08) | (8.5,0.42,0.08) | (9.5,0.42,0.08) | |
| (30,10,0.08) | (65,4.25,0.08) | (75,4.25,0.08) | (85,4.25,0.08) | (95,4.25,0.08) | |
| (3,1,0.08) | (6.5,0.42,0.08) | (7.5,0.42,0.08) | (8.5,0.42,0.08) | (9.5,0.42,0.08) | |
| (3,1,0.08) | (6.5,0.42,0.08) | (7.5,0.42,0.08) | (8.5,0.42,0.08) | (9.5,0.42,0.08) | |
| (3,1,0.08) | (6.5,0.42,0.08) | (7.5,0.42,0.08) | (8.5,0.42,0.08) | (9.5,0.42,0.08) | |
Table 7.
Actual value of each index of the project.
| Green evaluation indicators | ||||||||
| Actual value | 8.732 | 9.347 | 9.635 | 9.986 | 9.451 | 17.845 | 5.298 | 9.171 |
| Green evaluation indicators | ||||||||
| Actual value | 9.617 | 3.687 | 8.947 | 98.199 | 9.491 | 9.249 | 18.267 | 8.115 |
| Green evaluation indicators | ||||||||
| Actual value | 9.333 | 97.442 | 9.777 | 9.713 | 9.911 | 8.336 | 9.633 | 93.147 |
| Green evaluation indicators | ||||||||
| Actual value | 10.000 | 437.116 | 9.525 | 91.478 | 7.663 | 8.797 | 9.211 |
Table 8.
Comparison of the calculation results of the two methods.
| Affiliation | Evaluation Results of This Paper | AHP-Cloud Model | ||||
|---|---|---|---|---|---|---|
| I | II | III | IV | V | ||
| V | V | |||||
Publisher’s Note: MDPI stays neutral with regard to jurisdictional claims in published maps and institutional affiliations. |
© 2022 by the authors. Licensee MDPI, Basel, Switzerland. This article is an open access article distributed under the terms and conditions of the Creative Commons Attribution (CC BY) license (https://creativecommons.org/licenses/by/4.0/).
Share and Cite
MDPI and ACS Style
Ma, Q.; Lu, L.; Li, Q.; Wang, Z. Green Construction Grade Evaluation of Large Channels Based on Uncertain AHP-Multidimensional Cloud Model. Sustainability 2022, 14, 6143. https://0-doi-org.brum.beds.ac.uk/10.3390/su14106143
AMA Style
Ma Q, Lu L, Li Q, Wang Z. Green Construction Grade Evaluation of Large Channels Based on Uncertain AHP-Multidimensional Cloud Model. Sustainability. 2022; 14(10):6143. https://0-doi-org.brum.beds.ac.uk/10.3390/su14106143
Chicago/Turabian StyleMa, Qiang, Linfang Lu, Qingfu Li, and Zhipeng Wang. 2022. "Green Construction Grade Evaluation of Large Channels Based on Uncertain AHP-Multidimensional Cloud Model" Sustainability 14, no. 10: 6143. https://0-doi-org.brum.beds.ac.uk/10.3390/su14106143
Note that from the first issue of 2016, this journal uses article numbers instead of page numbers. See further details here.