Article

Study on the Profile Distribution and Morphology of Soil Humic Substances in Karst Area of Zunyi City, China

1
State Key Laboratory of Simulation and Regulation of Water Cycle in River Basin, China Institute of Water Resources and Hydropower Research, Beijing 100038, China
2
School of Energy and Environmental Engineering, University of Science & Technology Beijing, Beijing 100083, China
3
School of Geomatics and Urban Spatial Informatics, Beijing University of Civil Engineering and Architecture, Beijing 102616, China
4
Tongren Municipal Ecology and Environment Bureau, Tongren 565300, China
5
Beijing Yuehai Sunshine Asset Management Co., Ltd., Beijing 100124, China
6
The People’s Government of Guanzhu Town, Dianbai District, Maoming 525426, China
*
Author to whom correspondence should be addressed.
These authors contributed equally to this work.
Sustainability 2022, 14(10), 6145; https://0-doi-org.brum.beds.ac.uk/10.3390/su14106145
Submission received: 18 April 2022 / Revised: 6 May 2022 / Accepted: 11 May 2022 / Published: 18 May 2022

Abstract

:
Soil degradation in low soil humus content karst areas is a serious problem. Humus is composed of a series of polymer organic compounds, with no fixed form, therefore it is difficult to study, especially humin. In this study, 13C CP/MAS NMR was used to study the humic acids (HA), fulvic acids (FA), and humin (HM) components in the soil profiles of carbonate rocks and argillaceous rocks in the Northern Guizhou region. Through the vertical distribution of humus in soil, the transformation mechanism among functional groups of humus was studied. The content of HA and FA in the soil of Zunyi New Area was low, and the humification degree was low. FA was the main HA with simple molecules, which were directly related to the surface vegetation in the area. There may have been some genetic relationship between Aliphatic C and Aromatic C, Aliphatic C and Carboxyl C in the same group of humus. In the phylogenetic relationship of HA, FA, and HM, more transformations existed between HA and FA, and between HA and HM, while the transformations between FA and HM were very rare. This study provides an important scientific basis for the theory of the formation and transformation of soil humus in karst area.

1. Introduction

Humic Substances (HS) are the main component of soil organic matter. After decomposition by soil microorganisms, it can take the form of a series of black to brown-black amorphous quasi-polymer organic compounds with aromatic ring structure, aliphatic characteristics, and newly formed by the polymerization of polyphenols and polyquinones. Humus accounts for approximately 70–80% of the total organic matter in soil, and is the main component of soil organic matter [1,2,3]. Under the joint action of physical, chemical, and biological factors, soil organic matter is decomposed and transformed. Most of the organic matter is rapidly decomposed into H2O and CO2, and a small component is transformed into soil humus.
As humus plays a major role in the distribution, migration, transformation, and end-destination behaviour of metal ions and organic pollutants, and is the main source of nutrient elements (such as N and P) required by plants, it is considered to be the most active part of soil organic matter [4,5,6]. Humus can effectively improve the physical and chemical properties of soil [7], and is crucial for soil fertility and carbon sequestration [8].
The composition and structure of humus is very complex, including hydroxyl, carboxyl, carbonyl, and other functional groups, which represent the proportion of total organic carbon in the global carbon cycle [9,10]. It is a very important carbon pool in the global carbon cycle. Soil organic matter is the largest carrier of soil carbon. The content and turnover rate of soil organic matter directly affect the carbon cycle of terrestrial ecosystems. Humus, as an important component of organic matter, contains a large number of carboxyl, hydroxyl, keto-methoxyl, and other active functional groups, which can interact with organic and inorganic pollutants in the environment [11].
As humus is composed of a series of macromolecular organic compounds, and has no fixed form, the study of humus is difficult [12] owing to the difficult extraction and purification process of the soil humus, and analysis method for the determination of the whole structure and properties of humus are limited. Therefore, basic research on the physical and chemical properties of humus need to be improved.
Humus can be divided into Humic Acids (HA), Fulvic Acids (FA), and Humin (HM) by virtue of their solubility in acids and bases. Since HA and FA are easily isolated and extracted from soil, studies on humus in China and globally mainly focus on HA and FA. Humic Acids in soil are an important component of organic matter and occupy the largest proportion of humus. They account for approximately 20–80% of soil organic carbon. Due to its insolubility and complex composition, HM is difficult to characterize using conventional methods, therefore HM is the least understood component of humus [13]. Due to the lack of studies on HM traits, previous studies on humus lack systematisms and integrity. Therefore, it is necessary to combine HA, FA, and HM components in humus with comparative studies on humus.
Karst ecosystems have high spatial heterogeneity formed through the interaction of atmosphere, water, rock, and living organisms based on carbonates. Vegetation degradation and soil nutrient deficiency problems in karst areas seriously restrict the development of the regional agricultural economy and ecological environment protection. Therefore, regarding the soil carbon fixation and migration problems in these areas, soil degradation is one of the important reasons for the degradation of karst ecosystems. It is of great scientific significance to explore the vertical distribution of humus and understand the transformation mechanisms of humus, which are of great significance to clarify the evolutionary mechanisms of karst ecosystems. It is an important theoretical basis for controlling rocky desertification and constructing ecological environments in karst ecosystems. As for the control of rocky desertification in karst areas, it is possible to transform plants into soil humus, which can therefore restore vegetation in degraded areas and reclaim wastelands [14].
Guizhou Plateau is located at the centre of karst areas in southwest China. The carbonate mountains accounts for 73.6% of the total land area of the province. It is the centre of the east Asian karst region with the most complex karst development, complete karst types, and the largest karst distribution area in the world. In recent years, due to excessive reclamation of steep slopes (≥25°), deforestation of vegetation and social activities of human beings, the ecosystem in this region has been seriously damaged [13]. Therefore, the study of soil in this region is representative and typical.
The main purpose of this study is to reveal the vertical distribution of humus in the typical karst area of Zunyi, Guizhou province and to study the transformation mechanism of humus functional groups. This is to provide an important scientific basis for the evolution and transformation of organic components in the karst ecosystem.

2. Materials and Methods
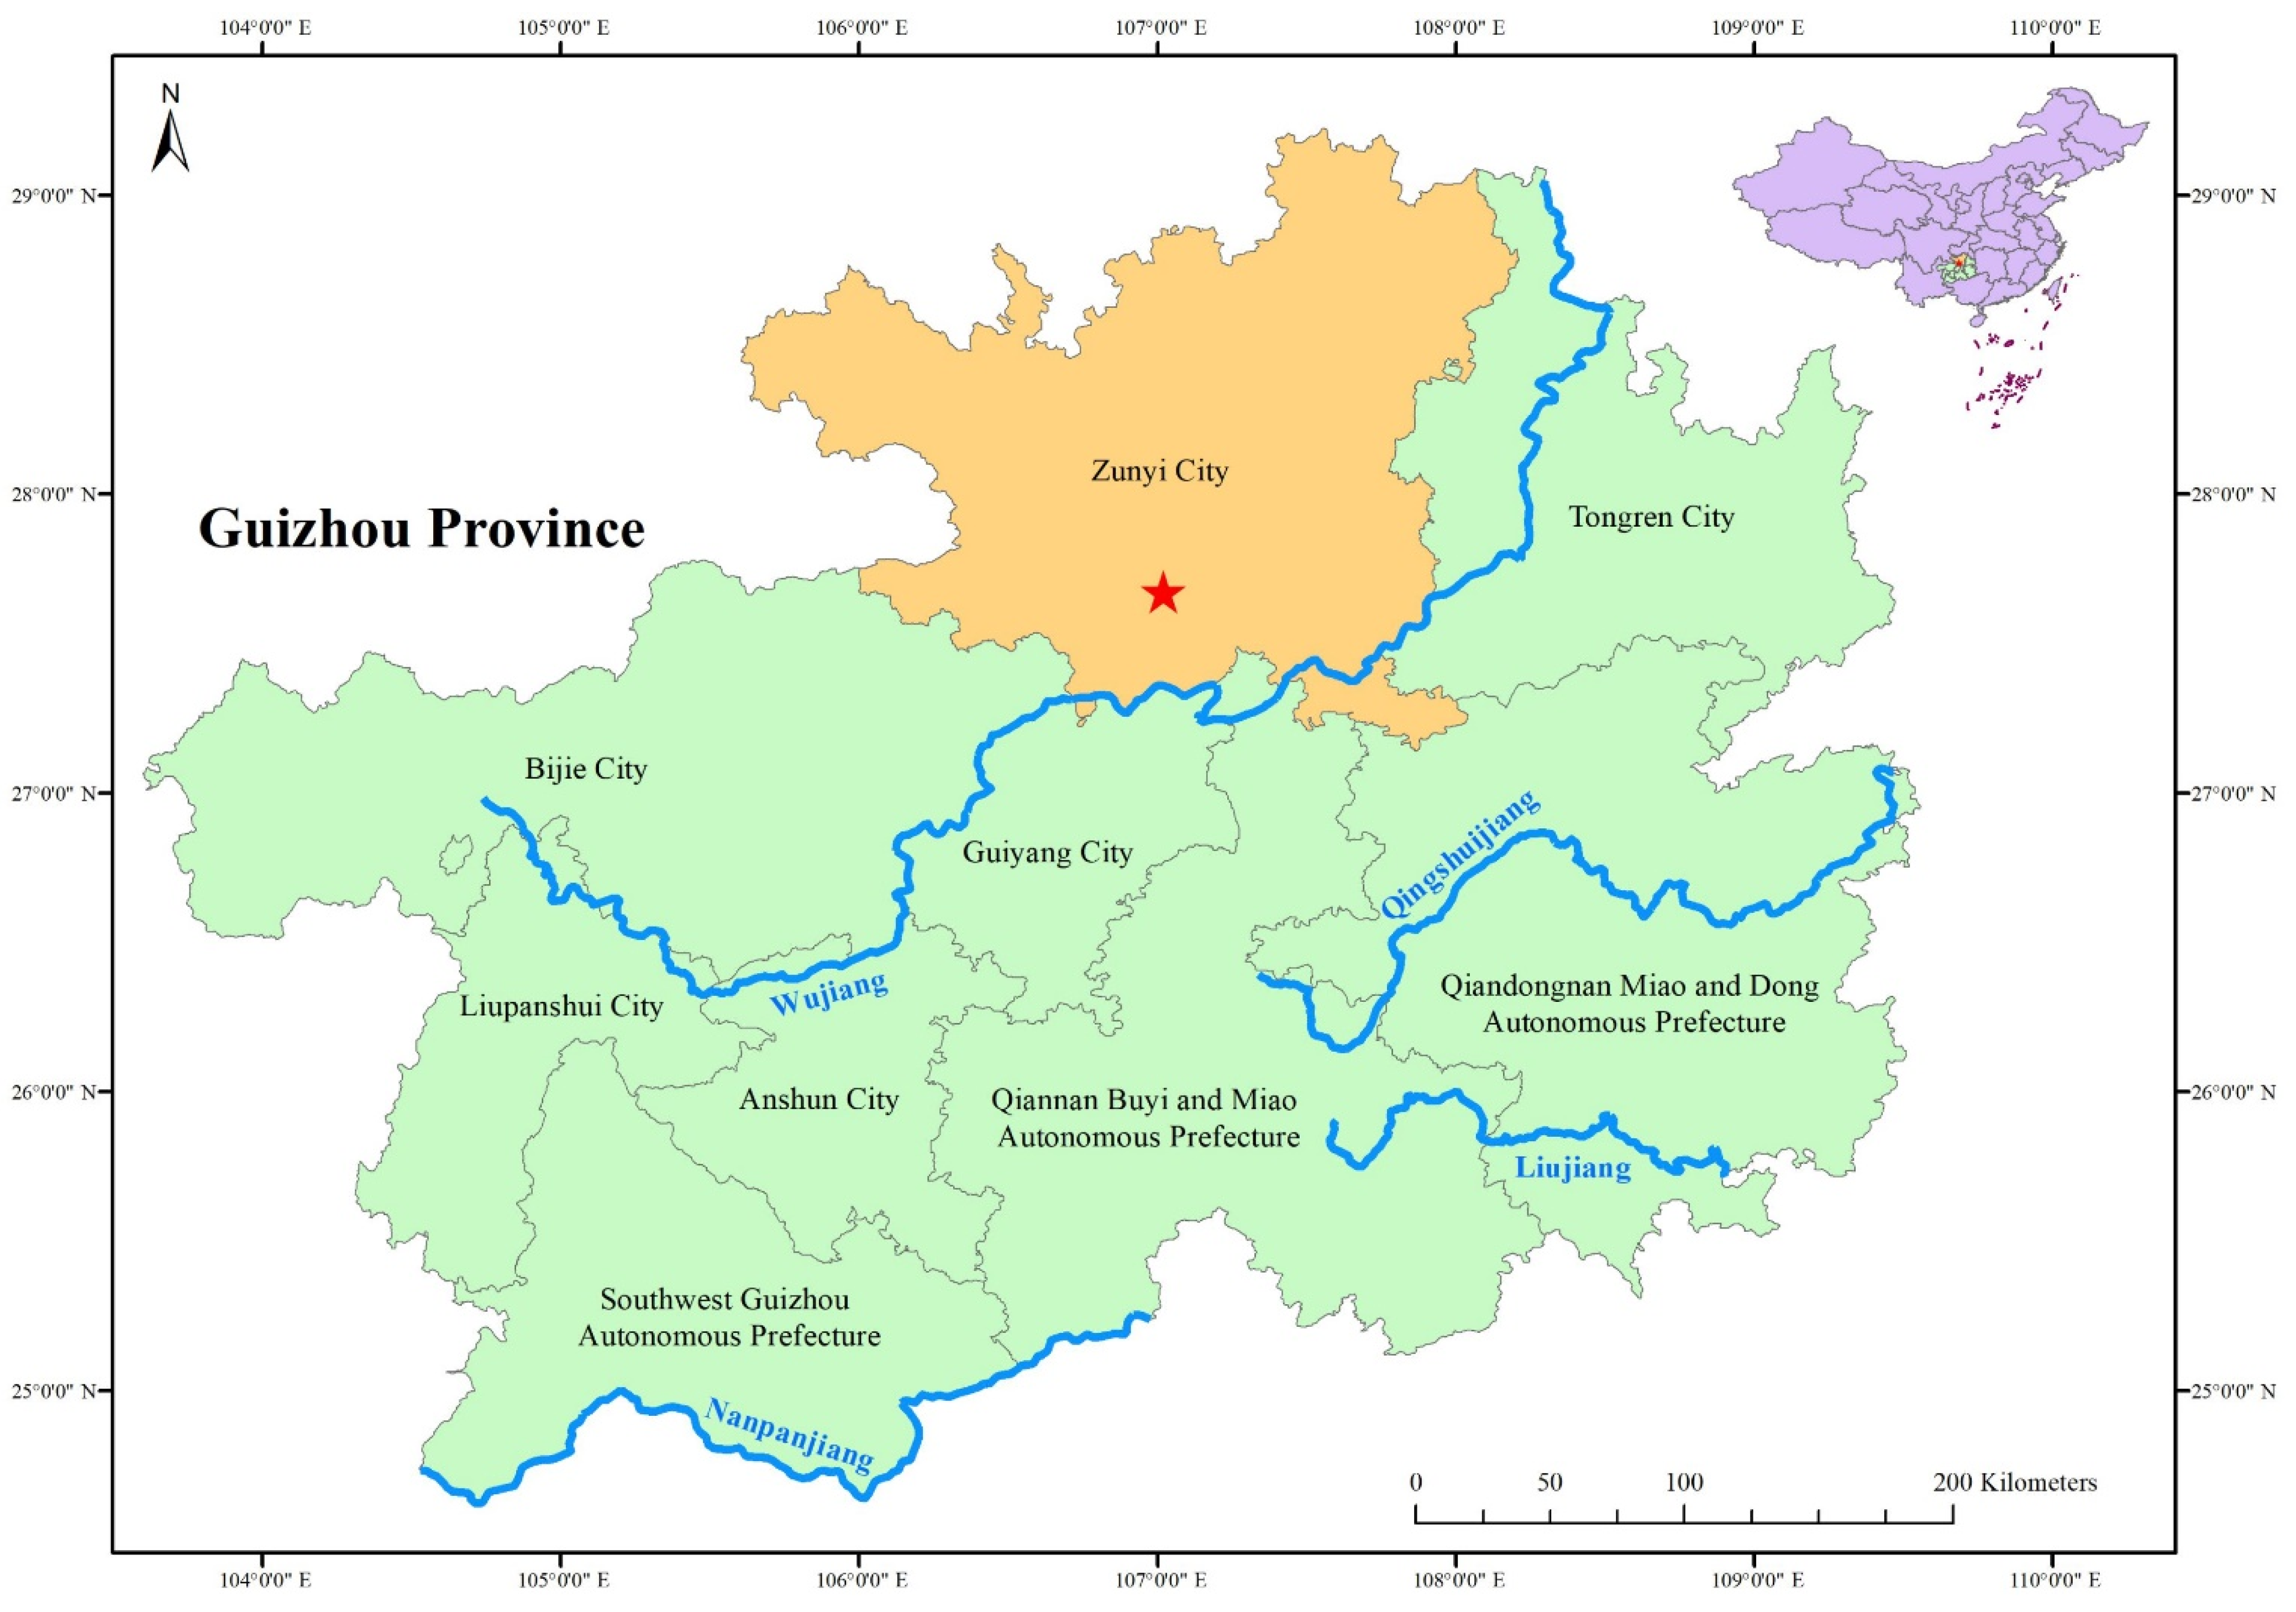
2.1. Study Site

The sampling sites are located in Xinzhong Village, Xinpu New District Honghuagang District, Zunyi City, Guizhou Province, China. The geographical location is 107°01.138′ E and 27°40.417′ N, which is a typical subtropical karst ecological environment (Figure 1). The vegetation in this area is predominantly karst secondary forest, and the parent rock is mainly carbonate rock and mud shale. The climate is characterized by the mid-subtropical monsoon climate region, with abundant rainfall, annual average temperature above 15 °C, characterized by less sunshine, cloudy and foggy weather, and annual precipitation of about 1000–1600 mm. The sampling site at this located is Guizhou Plateau, which is a subtropical karst plateau with extensive karst landforms and carbonate rocks accounting for 61.9% of the total land area of the province.

2.2. Collection and Pretreatment of Soil Samples

In August 2013, a set of soil samples at different depths in the soil profile were collected at two selected locations. Samples were collected from the surface soil (0–30 cm), litter was removed, and continuous samples were collected from the surface down without spacing between samples. Each soil sample location was sampled to a depth of 5 cm, and six soil samples were divided into two sections. The surface soils of the two profiles are developed by different types of sedimentary rocks, which have good representativeness and difference. The surface soil of profile XP1 was dark brown and weakly alkaline. The parent rock was carbonate rock. The vegetation on the surface was coniferous forest, and the litter on the surface consisted of pine needles. The surface soil of XP2 profile was yellow and highly acidic. The parent rock was argillaceous rock. The vegetation on the surface was shrub, with little litter and few roots. After the samples were dried, the roots and stems of plants were removed. After grinding, the samples were sieved by 2 mm and set aside. See Table 1 for the description of soil samples. Each test samples in this experiment are mixed by two groups of samples with the same environment in equal proportion. The two groups of samples have the same environmental characteristics and the same soil depth, and the distance between the two groups of samples is within 10 m.

2.3. Extraction and Purification of Humus

As Humic stances are difficult to purify, the methods are complex and varied [15]. The International Humic Substances Society (IHSS) therefore provided the recommended methods [16], which are mainly used for the qualitative research of HA and FA, but do not involve the quantitative and qualitative analysis of HM. In this experiment, the method recommended by IHSS [17] was used to extract and purify HA and FA.
The dried soil sample (75 g, <2 mm) was adjusted to pH 1–2 with 1 mol/L HCl. The 0.1 mol/L HCl was added to a solid–liquid ratio of 10:1. After shaking for 1 h, the precipitation was left standing, and the supernatant (FA1) and precipitation were separated by centrifugation. The precipitation was neutralized with 1 mol/L NaOH solution (pH = 7). The 0.1 mol/L NaOH was added to adjust the solid-liquid ratio to 10:1, and the precipitation was shaken for more than 4 h under the protection of N2. After standing overnight, the supernatant was centrifuged to separate the precipitate as crude HM. The supernatant was acidified with 6 mol/L HCl (pH = 1) and left for 12–16 h. The precipitate was HA and the supernatant was FA2.
Under the protection of N2, a small amount of 0.1 mol/L KOH was added to dissolve HA again. Solid KCl ([K+] = 0.3 mol/L) was added to remove suspended solids by centrifugation. Subsequently, 6 mol/L HCl was added to precipitate HA again and remove the supernatant. Then 0.1 mol/L HCl/ 0.3 mol/L HF solution was added, the supernatant removed, and repeated by adding HCl/HF solution until the ash content was less than 1%. The precipitate was transferred to a dialysis bag after dialysis and freeze-dried to obtain purified HA. The FA samples (including both FA1 and FA2) were repeatedly washed and extracted by XAD-8 resin column, and then freeze-dried the concentrated solution by H+ saturated cation exchange resin to obtain purified FA.
As the purified samples in this study were used for NMR testing to obtain spectra with high differentiation of various functional groups. Excessively high concentrations of HCl/HF mixture and long processing times should be avoided as they damage the samples. In this experiment, HM was extracted and purified by repeated extraction of HCl/HF solution with different concentrations. The crude MH samples were repeatedly treated with 0.5–40% HCl/HF solution successively, and finally washed with distilled water until no Cl- reaction (AgNO3 test). After freeze-drying, relatively pure HM was finally obtained. The extracted and purified humus samples were stored at 4 °C under dark conditions.

2.4. Analysis and Determination of Soil Samples

13C CP/MAS NMR: a 100 mg dried solid humus sample was measured in a 4 mm ZrO2 rotor by Swiss Bruker AV300 superconducting solid state NMR spectrometer. The 13C CP/MAS NMR technique was used, and the magic Angle spin frequency was 12 kHz. The pulse delay d1 = 5 s, the pulse width was 4.5 m, and the chemical shift range ranged from −50 to 250 × 10−6. The relative contents of different types of C were expressed as a percentage of the integral area of the chemical shift interval to the total integral area, and the effect of the rotating sideband was eliminated. In this study, soil humus samples were tested in Shanghai Key Laboratory of Nuclear Magnetic Resonance (East China Normal University, Minhang Campus: 500 Dongchuan Rd., Shanghai 200241, China) and Beijing University of Chemical Technology, 15 Beisanhuan Dong Lu, Chaoyang District, Beijing 100029, China.
Elemental analysis. The contents of C, H, N and S elements in soil samples were determined by Germany ELEMENTAR Vario MACRO Cube elemental analyzer. Precision: CHNS ≤ 0.1% O ≤ 0.2%, sample weight: 0.02–1000 mg. C: 0–40 mg; N: 0–15 mg; H: 0–3 mg; S: 0–6 mg; O: 0–6 mg; Cl: 0–2 mg.

3. Results and Discussion

3.1. Content and Distribution of HA and FA

XP2 generally showed low pH values ranging from 3.66 to 3.83, while XP1 samples showed neutral pH values ranging from 6.23 to 7.34. The pH difference between the two groups was related to land use and vegetation cover. The soil of XP1 was less disturbed by human activities, and the land cover was coniferous forest. The soil of XP2 was close to farmland and the surface vegetation was shrub. The strong acidity of XP2 samples was due to the effect of vegetation degradation from forest to shrub.

3.1.1. HA and FA Contents in Soil Samples

The quantity proportions and spatial distribution of soil humus have always been a concern to people. The HA/FA ratio is often used as an indicator of humus maturity. The higher the ratio, the higher the degree of humus decay and molecular complexity. The smaller the ratio, the lower the degree of humus decay and molecular complexity. The HA/FA values showed obvious zonal variation among soils in different regions.
In this experiment, the relative content of HA in XP1 soil profile ranged from 0.08–0.28 mg/g, and the lowest value appeared at 15–20 cm depth. The HA content in XP2 soil profile ranged from 0.08–0.54 mg/g, and the lowest value appeared at the depth of 20–25 cm. The relative content of FA in XP1 soil profile ranged from 1.26–1.69 mg/g, and the lowest value appeared at the depth of 25–30 cm. The content of FA in XP2 soil profile ranged from 1.14–2.35 mg/g, and the lowest value appeared at the depth of 25–30 cm. The HA/FA ratios of XP1 and XP2 soil profiles ranged from 0.05–0.22 and 0.06–0.24, respectively. In general, compared with other soil types in China, the contents of HA and FA in Zunyi New Area were lower than those in other soil types in China. Humic acid was the sum of the contents of HA and FA, which represented the content of soluble humus and reflected the content of active HA and FA in humus, as shown in Table 2.
The experimental data showed that the relative content of HA in the soil was much lower than that of FA at the same depth. This indicated that the humification degree of the main types of soil in Guizhou were generally low, and FA was dominant in HA with relatively simple molecules. As the content of humus components and HA/FA values varied with vegetation types, the overall low degree of soil humification in the study area was directly related to the surface vegetation, and to reduced surface soil moisture.

3.1.2. Vertical Distribution Characteristics of HA and FA

The changes of HA and FA contents in the soil with soil depth are shown in Figure 2. At 10–20 cm depth, the HA content gradually decreased with the increase of depth; at 20–30 cm depth, the HA content increased with the increase of depth. The content of HA in XP2 profile decreased with increasing depth.
In both XP1 and XP2 profiles, FA content gradually decreased with increasing depth, but in XP1 profile, there was an obvious fluctuation at 15 cm. If the depth of the soil profile was divided into 0–15 cm and 15–30 cm, the HA content of both soil profiles decreased gradually with the increase of depth. Due to the accumulation of surface biomass, humus content in soil surface was generally higher, and decreased with the increase of soil depth.
In the range of 0–25 cm depth, the HA/FA ratio of the two groups of profile samples showed a decreasing trend with the increase of depth. This was caused by the significant decrease of the relative content of HA in the soil at the same depth, and the slight decrease of the relative content of FA. This was affected by the accumulation of surface biomass. This was consistent with the research results of Kononova (1966) and He (2008) [18,19]. However, at 25–30 cm depth, the HA/FA ratio of the two groups of profile samples increased significantly, which was mainly caused by a small increase in the relative content of HA and a small decrease in the relative content of FA at the same depth.
The surface vegetation of profile XP1 was coniferous forest. The herbaceous plants under the coniferous forest grow weakly, and the accumulation of humus mainly depends on the decomposition of pine needles. The surface vegetation of profile XP2 was shrub, and the litter of shrub is easy to form HA. The growth rate of FA in soil under coniferous forest was faster than that of HA, while the growth rate of FA in soil under shrub was slower than that of HA. This study showed that from 25 cm, the closer the soil sample was to the surface, the higher the HA/FA ratio was. The HA/FA ratio of XP1 profile increased slightly, while that of XP2 profile increased greatly, which was caused by different surface vegetation.

3.2. Elements and Functional Groups of Soil Humus

3.2.1. Elemental Content Analysis of HA, FA and HM

The element composition of humus was relatively fixed, mainly composed of C, H, O, N, P, and S, with a small amount of Ca, Mg, Fe, Si, and other ash elements [20]. The ratios of H/C and C/N atoms in soil humus can usually be used to monitor the structural changes of humus and explain its molecular structure formula [21]. A small H/C value indicates a high degree of unsaturated and aromatic organic matter, while a large H/C value indicates a high degree of aliphication [22,23].
In this experiment, the element content of each humus component was shown in Table 3. Due to the high ash content of the extracted sample, the accuracy of the organic element content of humus was low, however this did not affect the analysis of the ratio of organic elements. With the exception of XP1-2 and XP1-5, the H/C value of FA was generally lower than that of HA and HM (Table 4). This indicated that the unsaturated degree and aromatics of FA were higher than that of HA and HM, while the H/C value of FA was higher than that of HA and HM at XP1-2 and XP1-5. It may have been caused by moisture during sample testing. The H/C ranges of HA samples in XP1 and XP2 profiles were 1.11–1.26 and 1.17–1.29, respectively. The H/C ranges of FA samples were 1.06–1.39 and 1.07–1.17, respectively. The H/C ranges of HM samples were 1.08–1.43 and 1.25–1.42, respectively. The H/C values of HA, FA, and HM were all less than 1.3, except that the H/C values of some samples were between 1.3 and 1.43, indicating that the samples were consistent with humus characteristics. The difference of some samples may have been caused by the purity of extraction, but it did not have much influence on the analysis results of soil humus element content. The H/C values of HA and HM were higher, indicating that HA and HM were less aromatic, saturated and aliphatic. In this study, the H/C ratios of HA, FA and HM showed no regular trend of change with the increase of soil depth.
An obvious feature of soil, sediment and sedimentary rock is that their C/N ratio is fixed, and for surface soil, the ratio is usually within the range of 10–12 [24]. In most soils, the C/N ratio decreases with increasing depth, but in some cases the C/N ratio increases significantly with increasing depth. In this study, soil humus was subdivided into HA, FA and HM, the C/N ratio of each component of humus was not within the range of 10–12 and was not used as a reference.
Soil microorganisms need to absorb 1 part of N for every 25 parts of C decomposed, and the C/N ratio was approximately 25–30/1. Organic matter decomposition in this range is faster. When the C/N ratio is greater than 30, it is impossible to produce nitrogen supply effect for plants in the initial stage of mineralization, however nitrogen deficiency occurs. If C/N is relatively small, the mineralization of nitrogen is larger, leading to the accumulation and increase of soil inorganic nitrogen. In general, the larger the C/N ratio, the weaker the mineralization of organic matter, and the less effective N is. The lower the C/N ratio, the stronger the mineralization of organic matter, and the more soil N is available. The C/N ratios of HA, FA and HM in humus of the sample soil did not show a regular trend with the increase of depth, however, showed that at the same depth, the C/N ratio was FA > HM > HA, that was, the mineralization of each humus component HA > HM > FA.

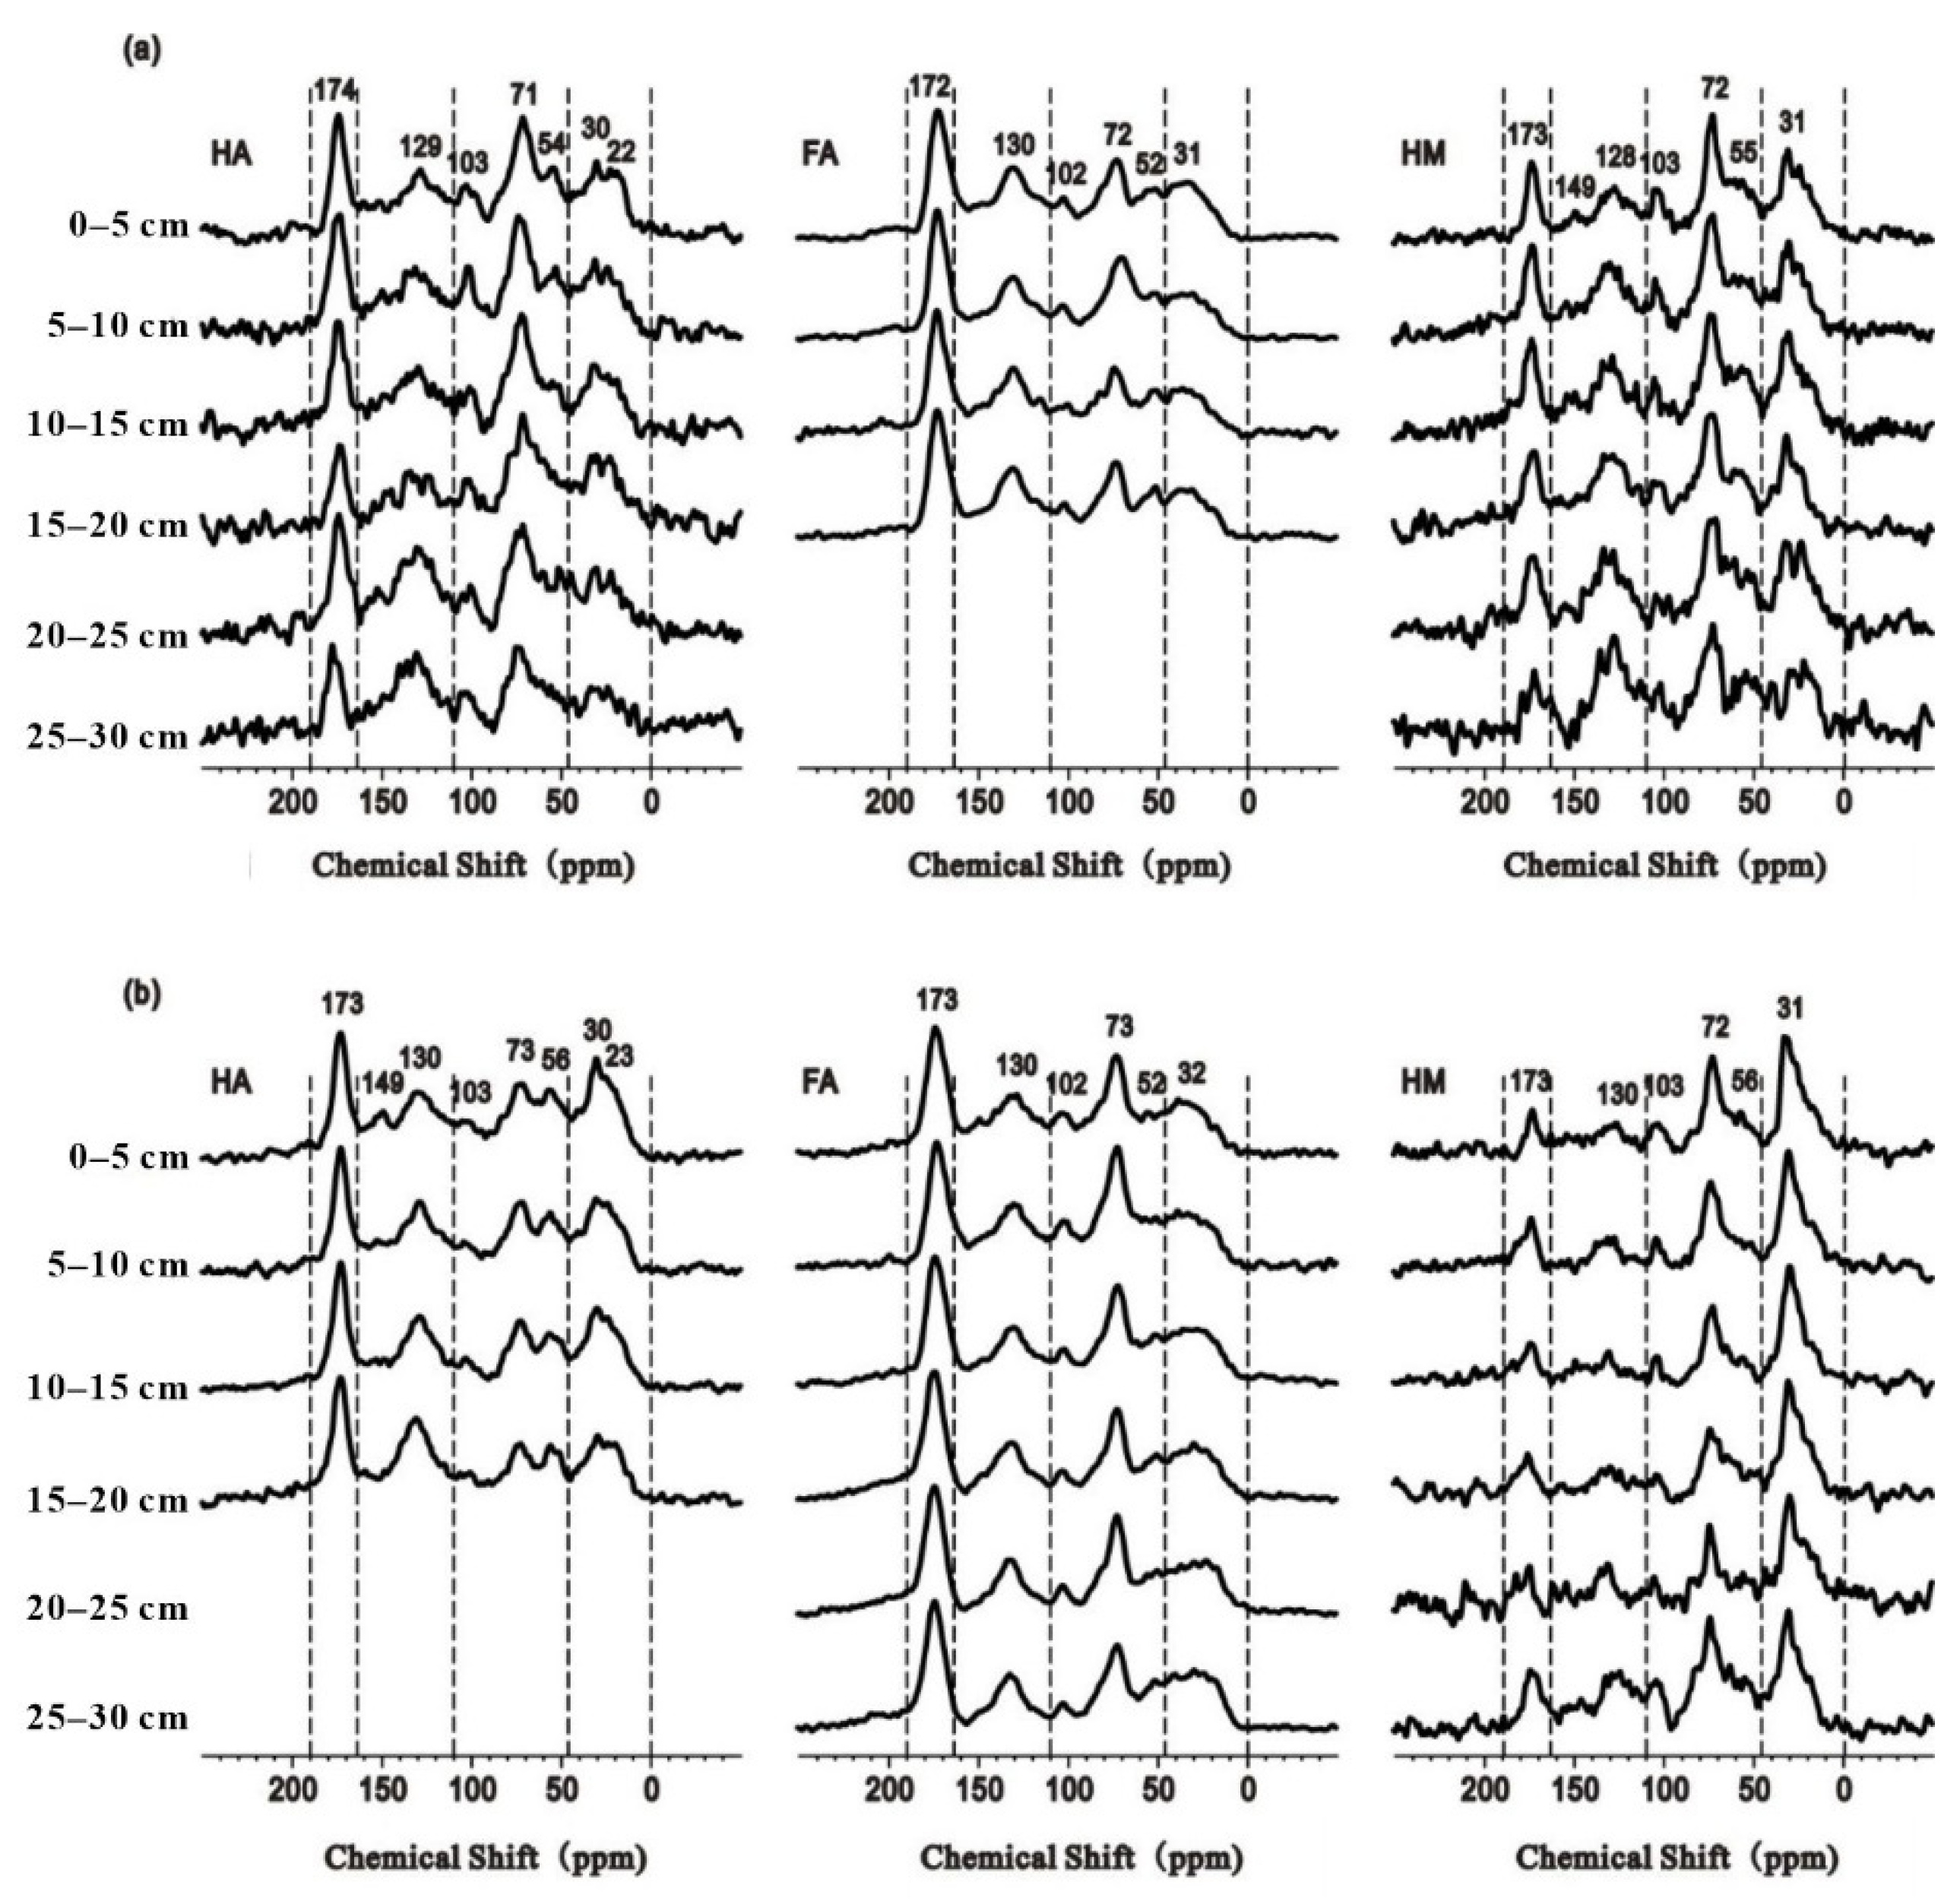
3.2.2. The Functional Group Contents of HA, FA, HM

Soil humus samples were tested by 13C CP/MAS NMR, and the obtained spectra had a high Signal-to-noise ratio (SNR) and a good resolution. As a part of inorganic carbon was still contained in the HM sample, the SNR of the HM sample was relatively low. In the experiment, a rotation frequency of 12 kHz was adopted to eliminate the influence of the rotating sideband. Therefore, the influence of the sideband peak generated by high-speed rotation on the research interval can be ignored.
The chemical shift widths of 13C CP/MAS NMR of soil humus ranged from 0–220 × 10−6, and the characteristic peak bands were divided into five intervals: Alkyl C [0–50 × 10−6], Oalkyl C [50 × 10−6–110 × 10−6], Alkyl C [110 × 10−6–160 × 10−6], Carboxyl C [160 × 10−6–190 × 10−6], and Carbonyl C [190 × 10−6–220 × 10−6] five chemical shift intervals. Alkyl C and Oalkyl C belonged to Aliphatic C, and they were subdivided into Alkyl C [110 ×10−6–145 ×10−6] with H and O atoms, and Oalkyl C [145 × 10−6–160 × 10−6] with O and N atoms.
The solid-state 13C NMR of HA, FA and HM samples showed the similarity of their respective characteristic bands, although the signal intensity was different (Figure 3). Based on a large number of references, and combined with the characteristics of the experimental sample, 5 intervals were subdivided into 20 characteristic peaks. The Alkyl C region was divided into four absorption peaks, mainly at 30 × 10−6, indicating methylene C. Oalkyl C was subdivided into seven characteristic peaks, of which 71 × 10−6–73 × 10−6 was the main absorption peak, indicating the oxy C related to cellulose. The interval of Aromatic C was divided into four characteristic peaks, of which the absorption peak at 130 × 10−6 indicates alkyl substituted Aromatic C. The region of Carboxyl C was divided into three characteristic peaks, of which the main absorption peak appeared at 171–173 ppm. Finally, Carbonyl C interval was divided into two smaller absorption peaks.
13C CP-MAS NMR spectra of HA, FA and HM at different depths are shown in Figure 4. Vertical variation of different functional groups in soil HA, FA and HM are shown in Figure 5.
(1)
HA
In this study, HA samples exhibited characteristic peaks at 15 × 10−6, 23 × 10−6, 31 × 10−6, 40 × 10−6 Alkyl C region, indicating long-chain alkanes, of which the peak at 31 × 10−6 was significant. The alkyl C region was characterized by peaks at 50 × 10−6, 56 × 10−6, 61 × 10−6, 72 × 10−6, 85 × 10−6, 96 × 10−6, 102 × 106, indicating C-O and C-N structures substituted by oxygen or nitrogen atoms, of which 72 × 10−6 was characterized by a significant peak (methyl ether). Four characteristic peaks appeared at 114 × 10−6, 131 × 10−6, 140 × 10−6, 153 × 10−6 of the Aromatic C region, of which 131 × 10−6 was significant. This indicated the characteristic peak of Aromatic carbons replaced by paraffin. The characteristic peaks at 167 × 10−6, 173 × 10−6 and 189 × 10−6 were in the range of carboxylic carbon, representing the signal region of carboxylic acid, amide and ester. The significant characteristic peaks at 173 × 10−6 were characteristic peaks of carboxylic acid functional groups. In the carbonyl carbon interval, the signal region of carbonyl group, aldehyde group and ketone group, HA showed no obvious characteristic peak in this interval, however only a small peak at 202 × 10−6, 212 × 10−6. This indicated that HA contained a small amount of carbonyl group and ketone group.
The results of 13C NMR showed that the strong signal mainly appeared at 31 × 10−6, 72 × 10−6, 131 × 10−6, 173 × 10−6, representing the main functional groups of Alkyl C, Oalkyl C, Aromatic C and Carboxyl C in the HA sample.
The functional groups of HA samples were Oalkyl C [33%] > Aromatic C [25%] > Alkyl C [21%] > Carboxyl C [17%] > Carbonyl C [4%]. The content of Oalkyl C was higher than that of Alkyl C. This was contrary to the conclusion that the volume of Alkyl C provided by IHSS was higher than that of Oalkyl C, which may have been due to differences in sample origin.
(2)
FA
The characteristic peaks of FA samples in 5 intervals were similar to those of HA. The functional groups of FA samples were Oalkyl C [33%] > Aromatic C [23%] > Carboxyl C [21%] > Alkyl C [19%] > Carbonyl C [3%]. FA was highly Oalkyl C. However, FA was higher Carboxyl C than Alkyl C, which was the opposite of HA and HM samples. The higher Carboxyl C content of FA indicated that FA was more oxidizing than HA and HM. This was consistent with the results of elemental content analysis, i.e., the unsaturated degree and aromatization of FA were higher, and mainly reflected in the higher Carboxyl C content and lower Alkyl C content of FA.
The higher volume of Alkyl C was found in FA samples, contrary to the higher volume of Alkyl C provided by IHSS, which may have been due to the differences in the source of the samples.
(3)
HM
The characteristic peaks of HM sample were similar to HA and FA. The Alkyl C content was Oalkyl C [35%] > Alkyl C [26%] > Aromatic C [21%] > Carboxyl C [13%] > Carbonyl C [5%]. Meanwhile, Alkyl C content of HM and HA was higher than that of Carboxyl C. In contrast with HA, Alkyl C was higher for HM than for Aromatic C.
The relative content of Alkyl C (Aliphatic C + Oalkyl C) in HA samples was 47–59%, that in FA samples was 48–56%, and that in HM samples is 54–68%. Compared with HA and FA from the same soil sample, the content of Aliphatic C in HM was higher, the Alkyl C was higher, and the Carboxyl C was lower than that of HA and FA from the same soil sample.
Comparing the same humic fractions with the same depth in the two groups of sections, there was a difference in humus in the two groups of sections. By comparing the HA samples from XP1 and XP2 profiles at the same depth, the peak of HA samples in XP1 profile was more obvious at 71 × 10−6. The Alkyl C region of HA samples in XP1 profile was characterized by two distinct peaks at 22 × 10−6 and 30 × 10−6, which was higher than that in XP2 profile. The integral values of the two peaks are slightly different in XP1, they were more distinct at 30 × 10−6 and less distinct at 22 × 10−6 in XP2 profile. The Alkyl C region of HM sample from XP1 profile were 22 × 10−6 and 30 × 10−6, which was more distinct than that of XP2 profile, which was consistent with HA profile. There was no significant difference between the two profiles of FA samples.
Semi-quantitative calculation of soil humus samples was carried out by 13C NMR, and vertical distribution of five C intervals was obtained, as shown in Figure 4. With the increase of soil depth, the five C intervals of samples all showed a certain fluctuation, however there was no obvious regular change trend.

3.2.3. Degree of Humification of HA, FA and HM

Humification index (HI) and Aromatics (fa) could be used to evaluate the structural characteristics of organic matter [25].
The HI was used to evaluate the properties of soil organic C. Alkyl C was a stable organic carbon component that was difficult to degrade, while Oalkyl C was relatively easy to decompose. Therefore, HI was commonly used to evaluate the degree of decomposition of soil organic matter [23,26,27,28]. The HI could be calculated as:
HI = Alkyl C (0–50 ppm)/Oalkyl C (50–110 ppm)
The Alkyl C/Oalkyl C ratio of soil humus components was compared. Except for a small fluctuation in the 15–20 cm depth range, the Alkyl C ratio of soil humus components was HM > HA > FA, indicating that the Alkyl C ratio of HM was the highest, and the stability of organic carbon was the highest, followed by HA. The alkylation degree of FA was the lowest.
The aromatic was often used to describe the humification degree of soil organic matter [29,30], and the calculation formula of aromatic was as follows:
Fa = Aromatic C/(Aromatic C + Alkyl C + Oalkyl C)
The content of Alkyl C and Oalkyl C was not high in the whole soil organic matter, which was generally only approximately 20%. The fa was low in 13C NMR, which was generally more than 20% lower than that of chemical methods, likely due to the oxidative degradation of alkaline KMnO4.
The soil HM had a low aromatic degree, ranging from 0.19–0.30, while soil HA and FA ranged from 0.27–0.37 and 0.23–0.35, respectively, showing a high aromatic degree (Table 5). The results showed that there were fewer aromatic nuclei and more aliphatic side chains in HM, which was consistent with the results of elemental analysis.
Aliphatic C/Aromatic C ratio could be used to reflect the complexity of humus molecular structure. The higher the ratio, the less Aromatic the nucleus structure, the more aliphatic side chains, the lower the condensation degree and the simpler molecular structure of humus [4]. The aliphatic C/Aromatic C ratio of soil HM in the two groups was higher than that of HA and FA. This indicated that there were fewer Aromatic nuclei and more aliphatic side chains in soil HM, which was consistent with the results of elemental analysis.
There are many factors affecting the humification coefficient, the first is the chemical composition of organic matter. The decomposition rate of different chemical components is different, water-soluble substances, benzene-alcohol-soluble substances, protein and hemifiber are decomposed quickly, while lignin is decomposed slowly.
The characteristic peaks of humus on 13C NMR were defined as four ratios, representing different properties: 73 ppm/105 ppm represented the corresponding contents of cellulose and lignin; 73 ppm/130 ppm represented the distribution characteristics of cellulose C and Aromatic C; 172 ppm/130 ppm represented the oxidation degree of humus; 56 ppm/130 ppm r represented the degree of humus mineralization [31].
The 172 ppm/130 ppm ratio of HA and FA was high, while the 172 ppm/130 ppm ratio of HM was low (Table 5). this indicated that the oxidation degree of HM was lower than that of HA and FA. This was consistent with the characteristics of the humification index of HM. The humification index of HM was larger than that of HA and FA, indicating that the alkylation degree of HM was higher. The Alkyl C content of HM was generally higher than Alkyl C of HA and FA from the same source (Figure 5). therefore, all indicators in this study consistently show that the Alkyl degree of HM was higher and the oxidation degree was lower.
The degree of mineralization could reflect the degree of decomposition of humus components. By analysing the ratio of 56 ppm/130 ppm of humus components, it could be concluded that HA > HM > FA. There are many factors affecting the mineralization of soil organic matter, including the C/N ratio of organic matter. The larger the C/N ratio, the weaker the mineralization of organic matter, and the less effective N was. The lower the C/N ratio, the stronger the mineralization of organic matter, and the more N was available in soil. The analysis results of 56 ppm/130 ppm ratio were consistent with the analysis results of C/N ratio, indicating that the degree of humus mineralization was HA > HM > FA, that is, HA was the most easily mineralized and could release more available N, while FA was more difficult to decompose and released less available N.

3.3. Migration and Transformation of Soil Humus Components

The formation and transformation of soil humus was still a mystery. Humus in soil was in the process of continuous formation and mineralization. In this process, humus was constantly decomposed and synthesized. The decomposition rate of newly formed humus was much faster than that of stable humus. Different environmental factors and soil characteristics had important effects on the mineralization of different components of soil humus. Due to the complex structure of humus, there were many influencing factors in the formation process, therefore there are many theories of humus formation. The differences of various theories mainly focus on the original source of humus, the stages of formation and the influencing factors of formation. However, there is some connection of formation and transformation between various components of humus and different functional groups of each component.
HA, FA and HM had similar elements and functional groups, which could undergo mutual transformation or one-way transformation after formation [26,32]. To some extent, FA and HA had a genetic connection, however the essence of this connection and the “mechanism” of transformation were not clear [18]. In the theory of humus formation, “lignin theory” and “polyphenol theory” were popular. According to “Lignin theory”, HM or HA, with relatively high molecular weight, was formed in the first stage of humus formation, and FA was divided into FA in the second stage under the action of microorganisms. According to the “polyphenol theory”, FA with low molecular weight was formed in the first stage of humification, and FA was further condensed to form HA and HM in the second stage [32]. Both the formation mechanism of humus and the mutual transformation of various components were closely related to functional groups, so the study of the transformation mechanism of humus must be conducted from the structure of its functional groups.
For this study, the correlation of different functional groups in soil HA, FA and HM shown in Figure 6.

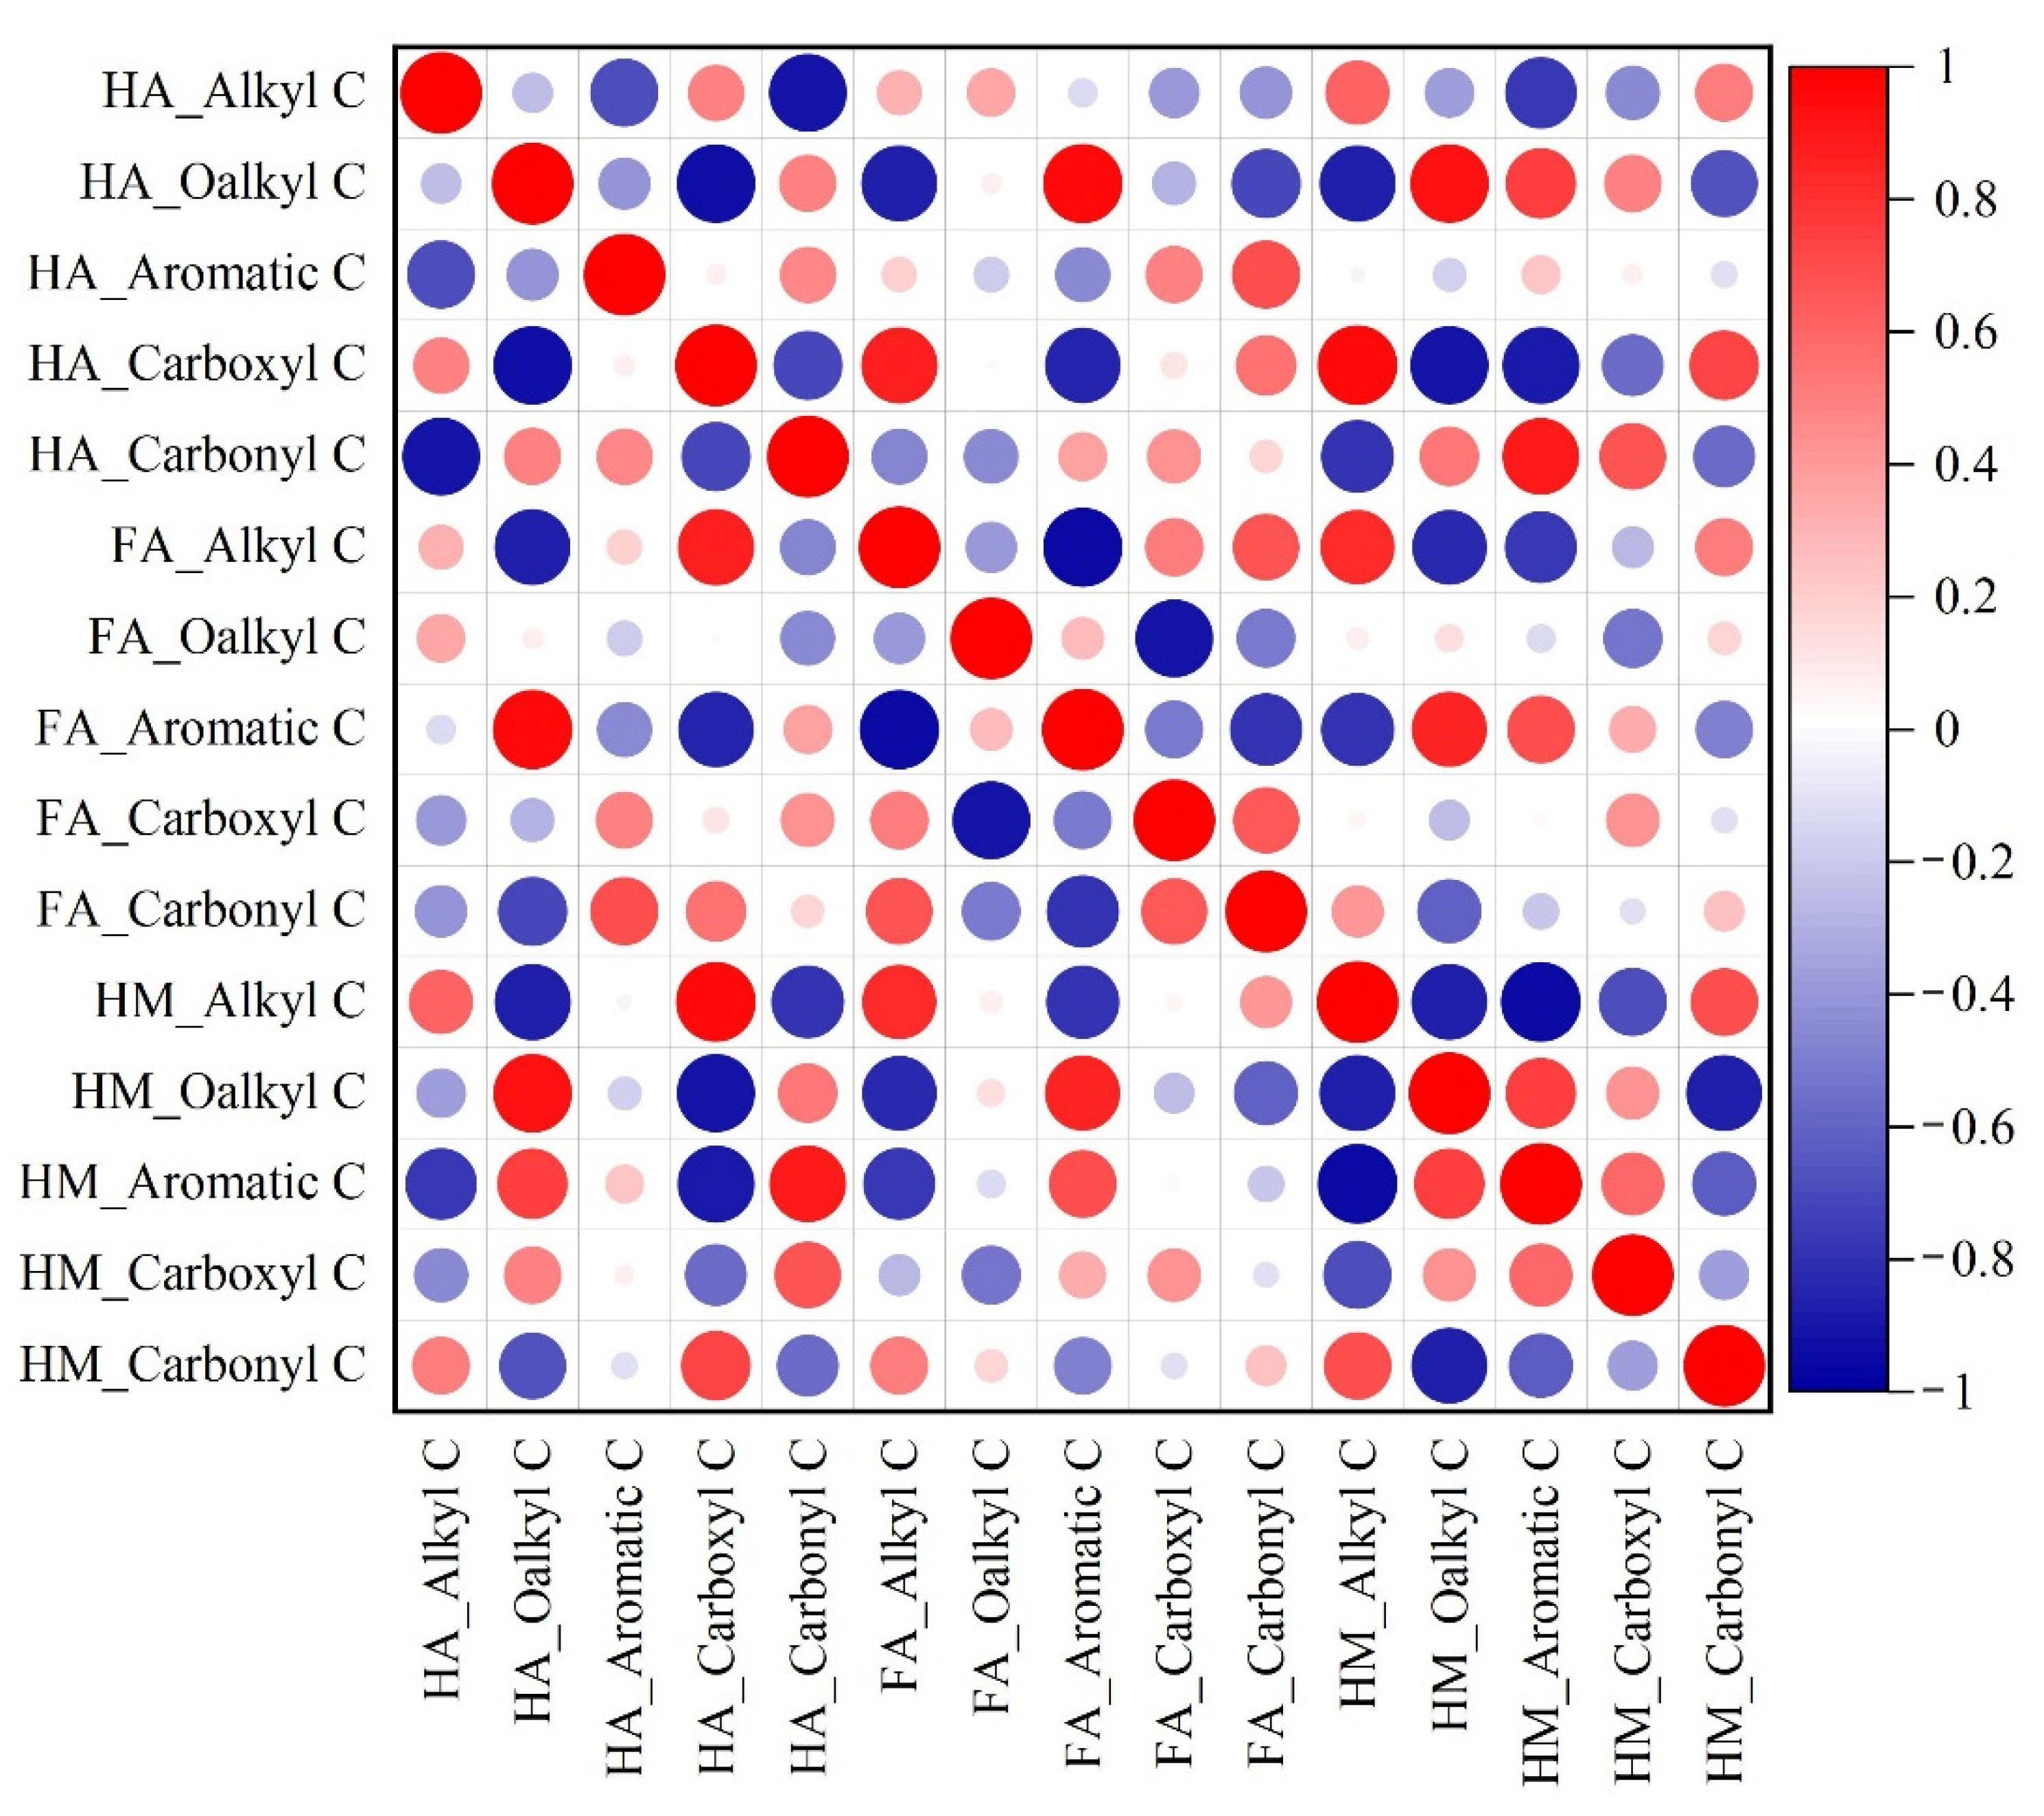
3.3.1. Correlation Analysis of Different Functional Groups in the Same Humic Fractions

Correlation analysis showed that the content of Alkyl C and Carbonyl C, Oalkyl C and Carboxyl C were significantly correlated (p < 0.05). The contents of Alkyl C and Aromatic C, Oalkyl C and Carboxyl C in FA were significantly correlated (p < 0.01). The contents of Alkyl C and Aromatic C, Oalkyl C and Carbonyl C were significantly correlated (p < 0.01). The contents of Alkyl C and Oalkyl C, Alkyl C and Carboxyl C were significantly correlated (p < 0.05). The correlation curves are shown in Figure 7, the statistics of Alkyl C + Carboxyl C (a) and Oalkyl C + Carboxyl C (b) in soil HA, FA and HM shown in Figure 8.
The Oalkyl C and Carboxyl C contents of HA and FA showed a consistent negative correlation, with correlation coefficients of −0.712 (n = 10) and −0.780 (n = 10), respectively, indicating that the content of Carboxyl C decreased with the increase of Oalkyl C content. The Alkyl C and Aromatic C contents of FA and HM were negatively correlated, with correlation coefficients of −0.857 (n = 10) and −0.843 (n = 12), respectively, indicating that the Alkyl C content decreased with the increase of Alkyl C content. Therefore, Alkyl C and Oalkyl C belonged to Aliphatic C, aliphatic C was negatively correlated with Aromatic C, and aliphatic C was negatively correlated with Carboxyl C in the same humus. Therefore, it could be concluded that during the formation and transformation of functional groups in the same group of humus, aliphatic C and Aromatic C, aliphatic C and Carboxyl C had an increasing and decreasing relationship. Furthermore, it was speculated that there may have been some genetic relationship between Aliphatic C and Aromatic C, aliphatic C and Carboxyl C in the same humus group.

3.3.2. Correlation Analysis of Different Functional Groups in Different Humic Fractions

Functional group is closely related to both the formation mechanism of humus and the mutual transformation between components. Therefore, a comprehensive study on the transformation mechanism of humus must be carried out from the structural composition of functional group.
There were more significant correlations between different types of C in HA and FA, and between HA and HM, while there are less significant correlations between different types of C in FA and HM. Thus, it could be inferred that in the phylogenetic relation of HA, FA and HM, more transformations existed between HA and FA (Figure 9) and between HA and HM (Figure 10), while transformations between FA and HM were rare. Based on the “lignin theory”, it can be considered that HA and HM are formed in the first stage of humification, there was a mutual transformation mechanism between HA and FA, and then HA was split into FA in the second stage under the action of microorganisms. Based on the “polyphenol theory”, it could be inferred that FA was formed in the first stage of humification, and FA was further condensed into HA, and then transformed from HA to HM.

4. Conclusions

(1)
Compared with other soil types in China, the content of HA and FA in soil of Zunyi New Area was relatively low. The relative content of HA in the soil at the same depth was much lower than that of FA, and the contribution of FA to the total humus was greater than that of HA (HA/FA < 0.25). This indicated that the humus degree of the main types of soils in Guizhou were relatively low as a whole, and FA was dominant in humus with relatively simple molecules, which was directly related to the surface vegetation in this area. In this study, the change of soil humic fraction concentration showed that the contents of HA and FA decreased with the increase of soil depth, and the ratio of HA/FA decreased with the increase of soil depth. This indicated that the humification degree and molecular complexity of soil decreased with the increase of soil depth. In this study, it was shown that from 25 cm, the higher the HA/FA ratio, the smaller the increase of HA/FA ratio in XP1 profile, and the larger the increase of HA/FA ratio in XP2 profile. This was caused by the difference of litter forming humus. Pine needles were more likely to form FA, while shrub litter was more likely to form HA.
(2)
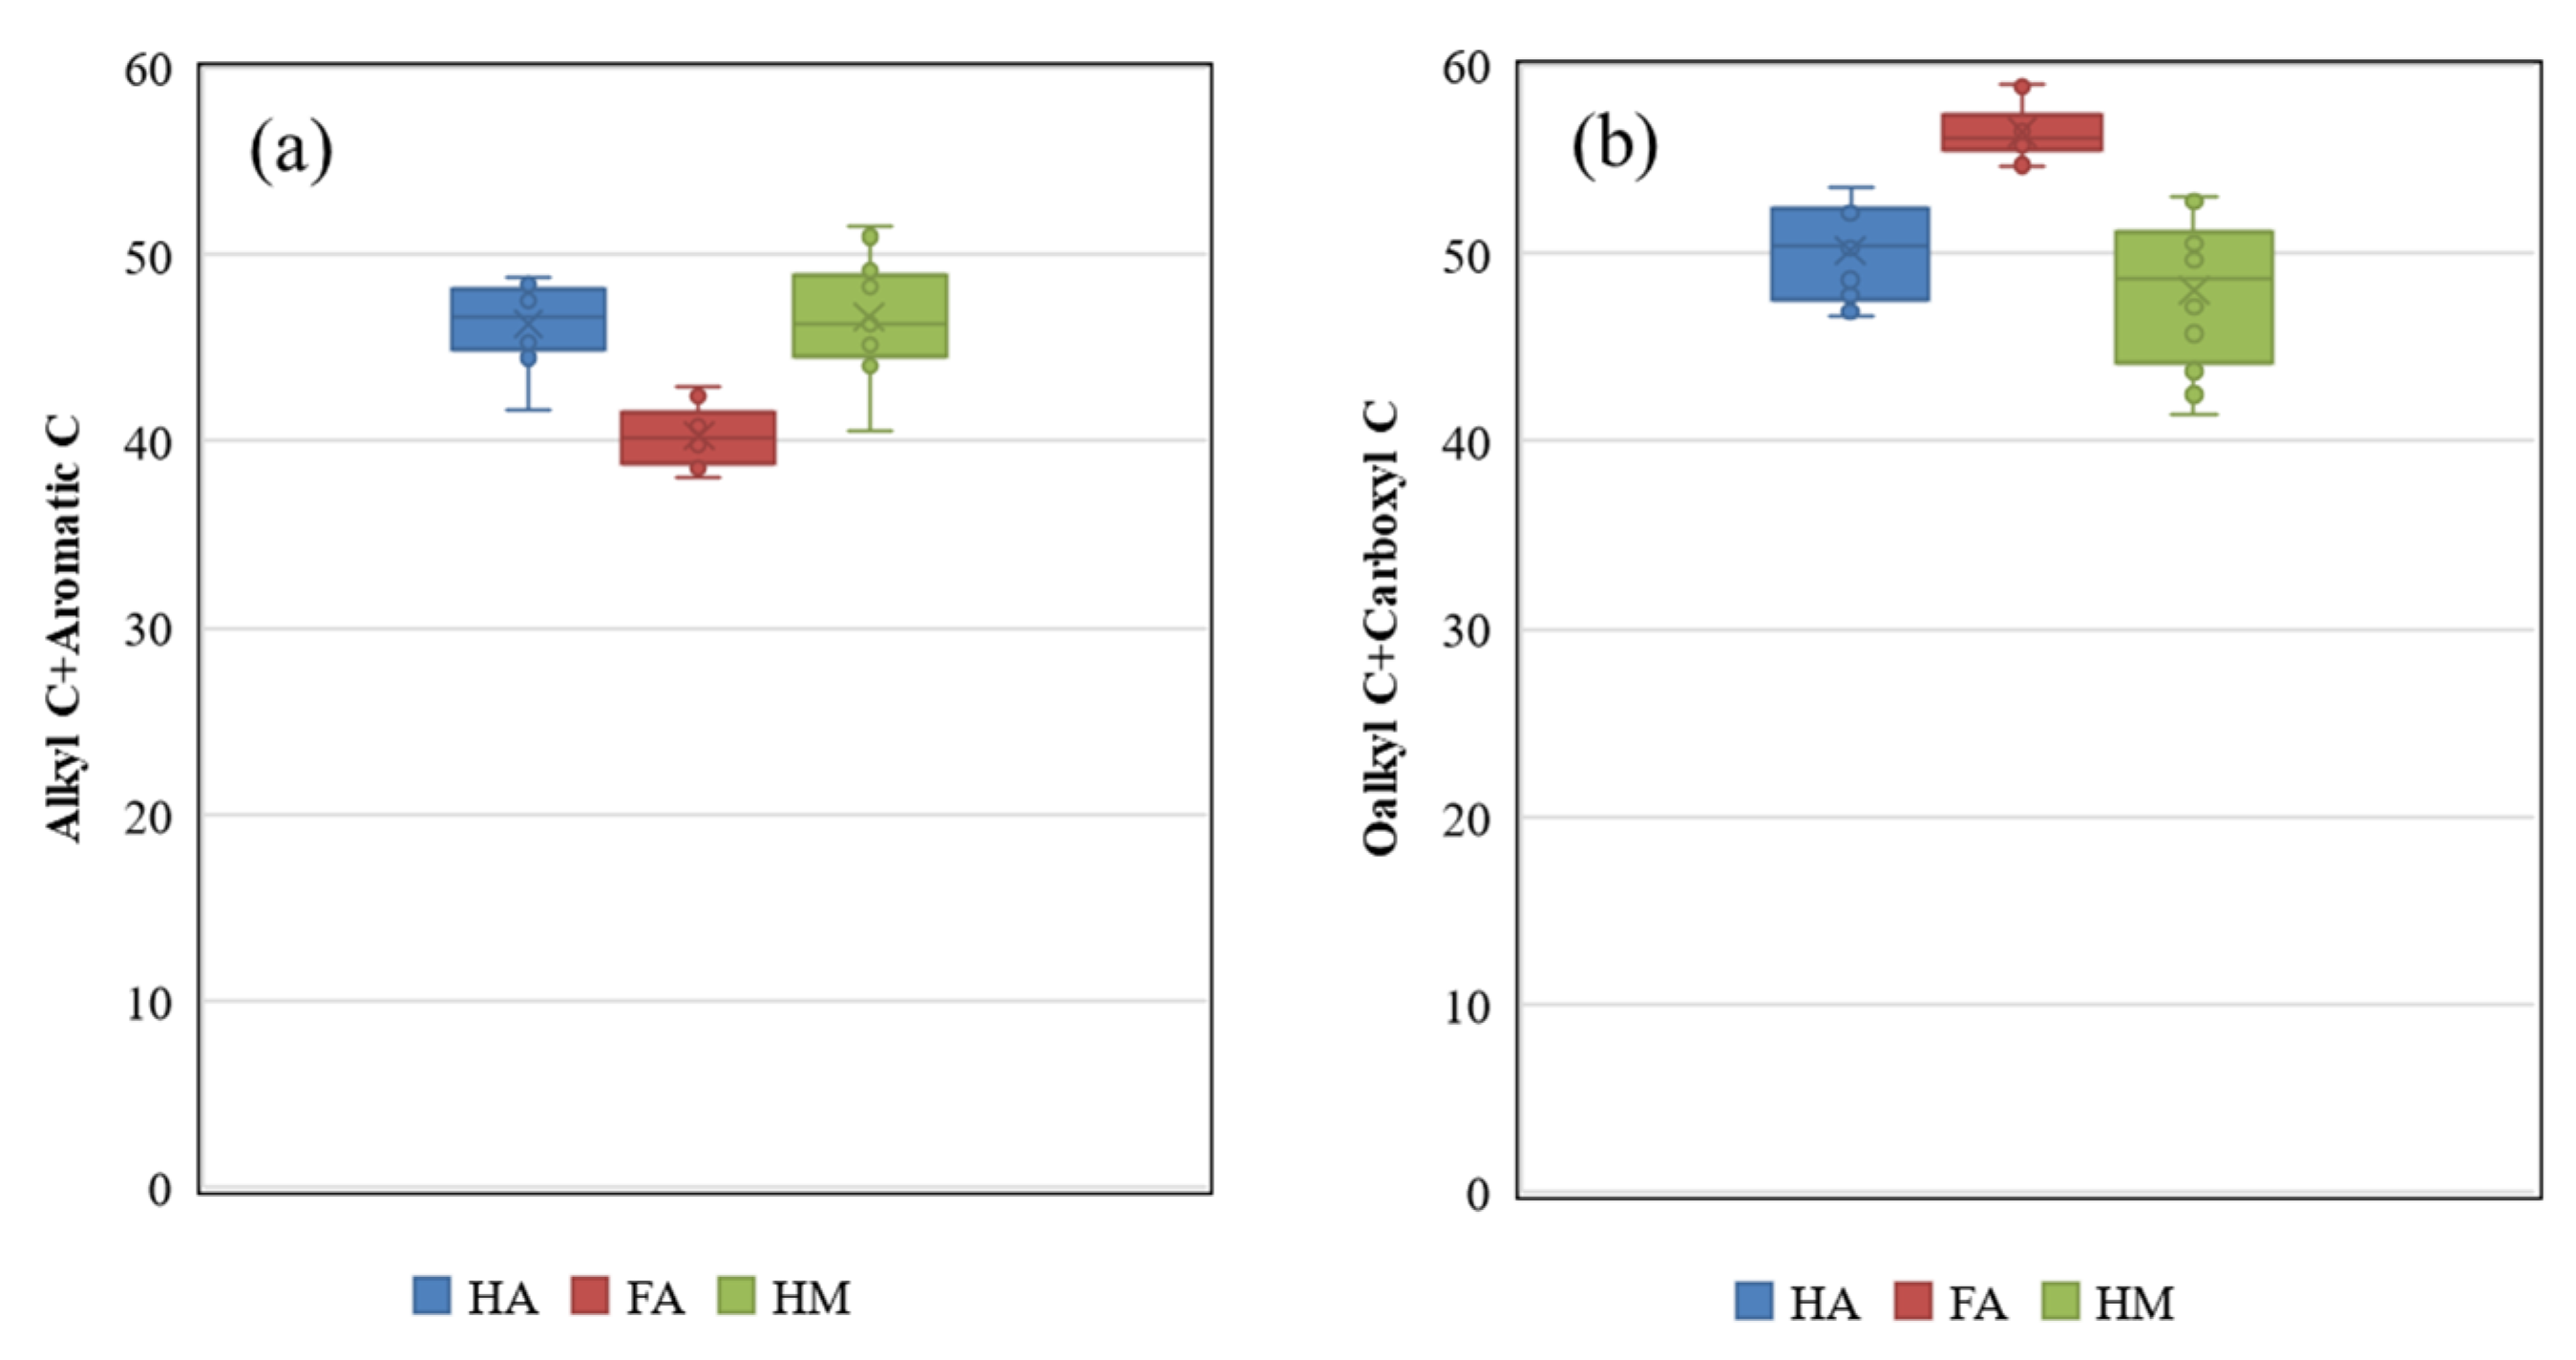
The content of Oalkyl C in HA samples was higher than that of Alkyl C. The FA exhibited higher Oalkyl C, however had higher Carboxyl C than Alkyl C, in contrast to HA and HM samples. The higher Carboxyl C content of FA indicated that FA was more oxidizing than HA and HM, which was consistent with the results of elemental content analysis. The unsaturated degree and aromatization of FA was higher, and mainly reflected in the higher Carboxyl C content and lower Alkyl C content of FA. The Alkyl C content of HM was higher than that of Carboxyl C, but the Alkyl C content of HM was higher than that of Aromatic C, which was different from HA. Comprehensive analysis showed that HA, FA, and HM samples from the two groups showed high Oalkyl C content.The aliphatic properties of various components in soil humus were as follows: HM > HA > FA, while the aromatic properties were as follows: FA > HA > HM. Soil HA, FA and HM showed a consistent trend of increasing aromatic properties with increasing soil depth.
(3)
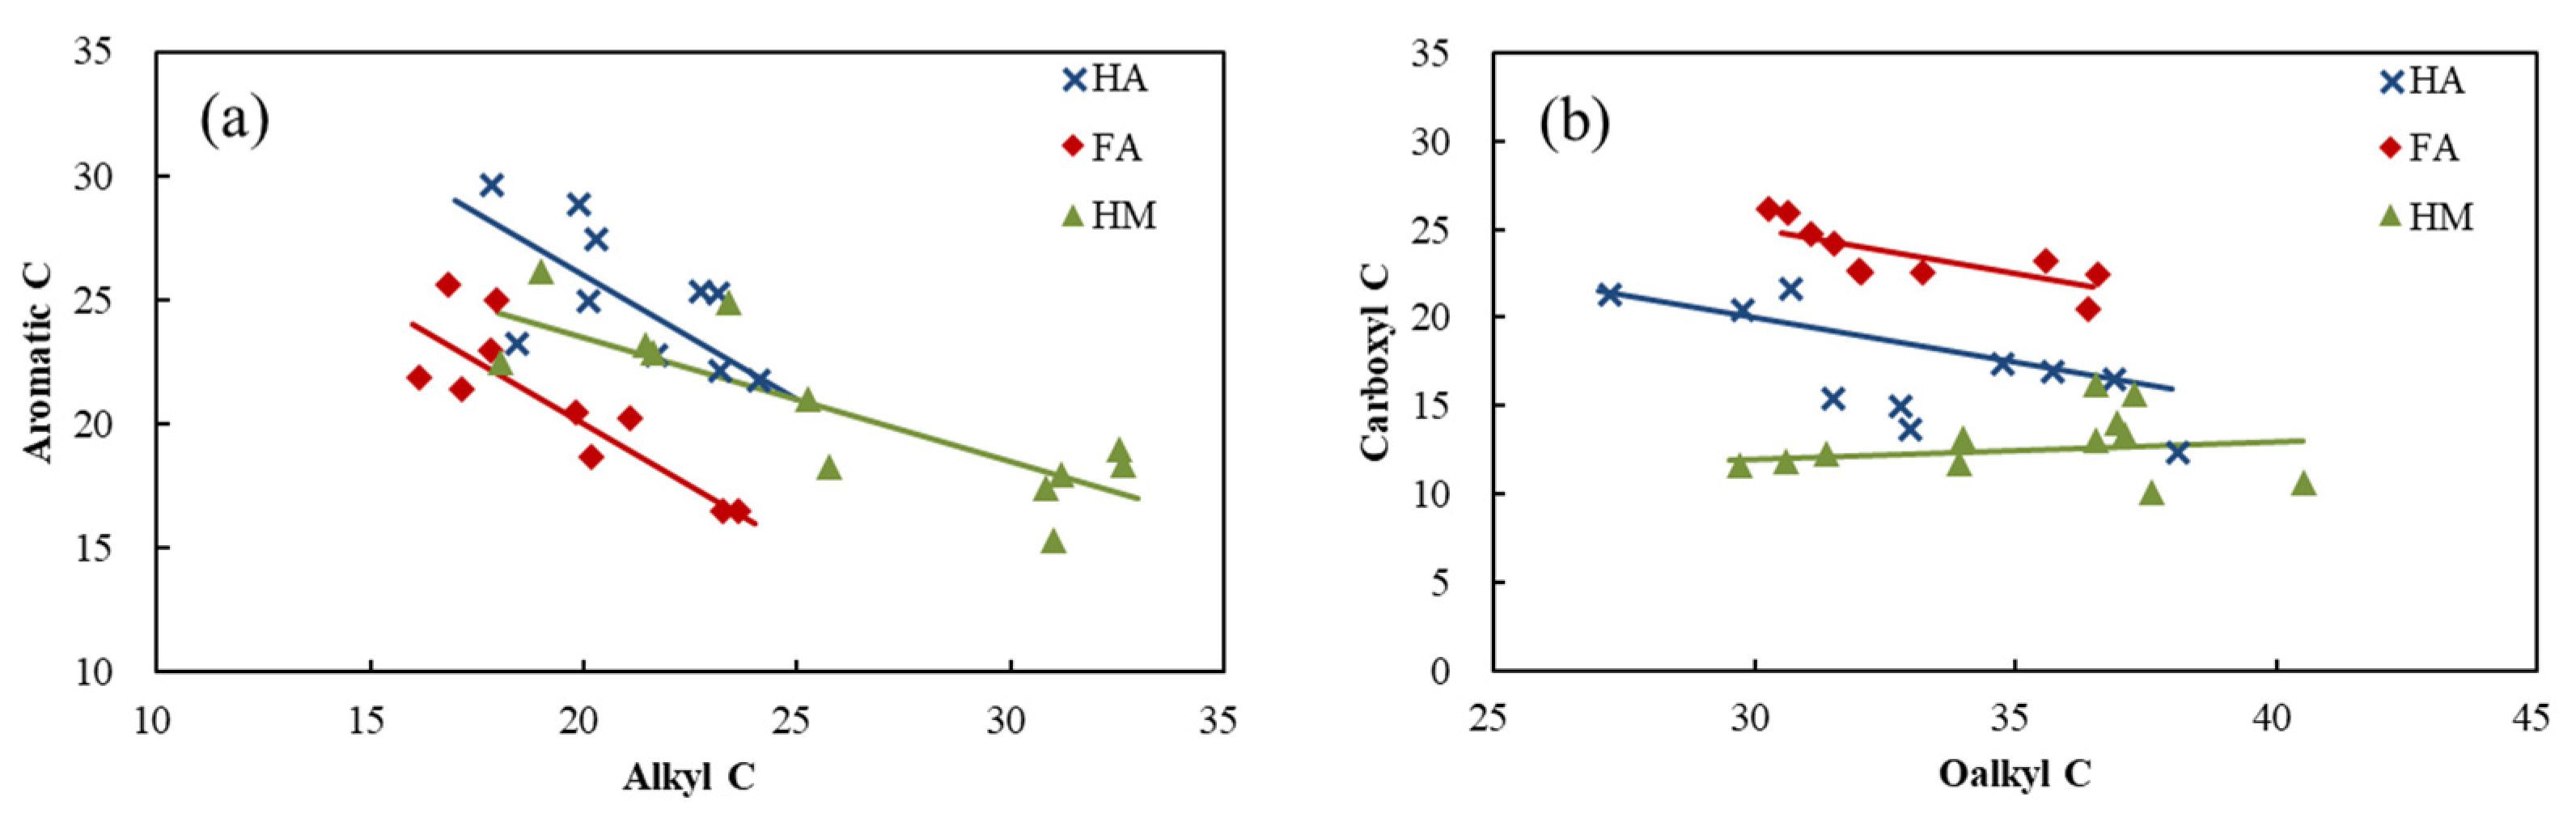
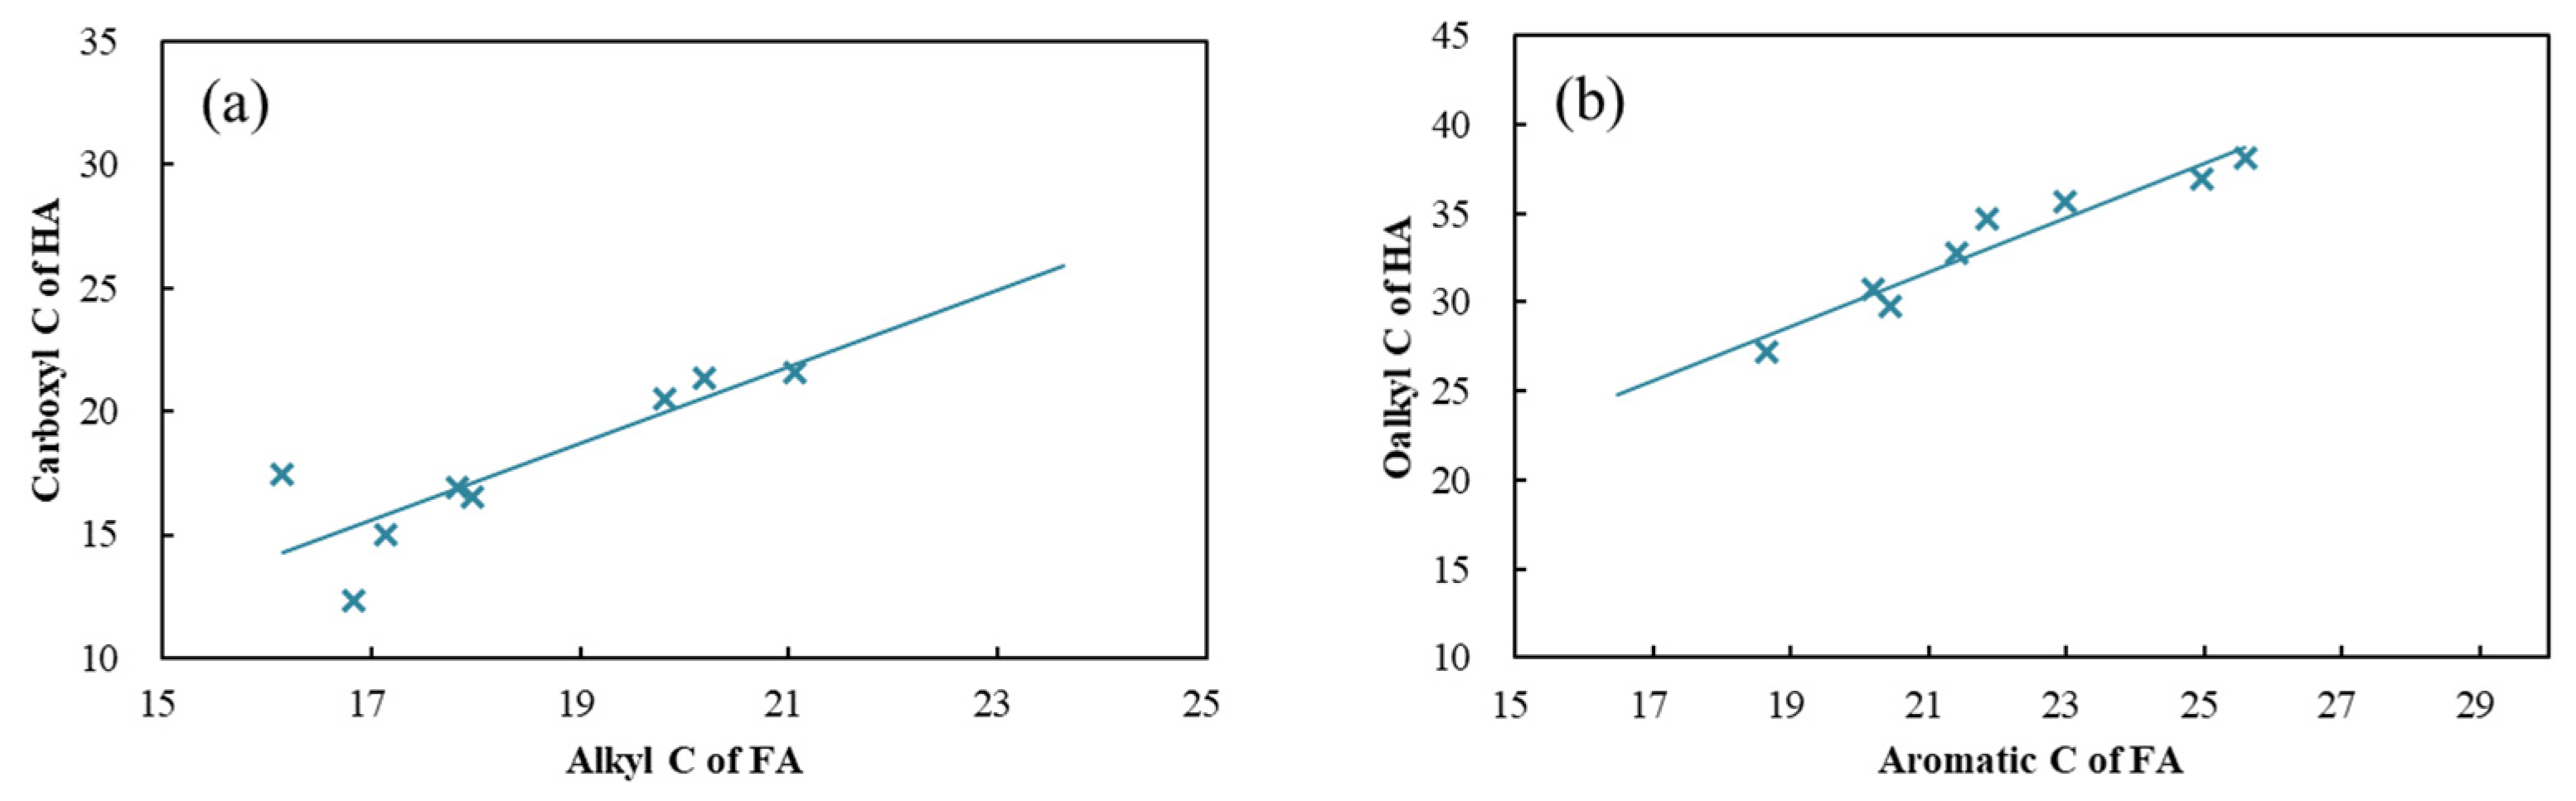
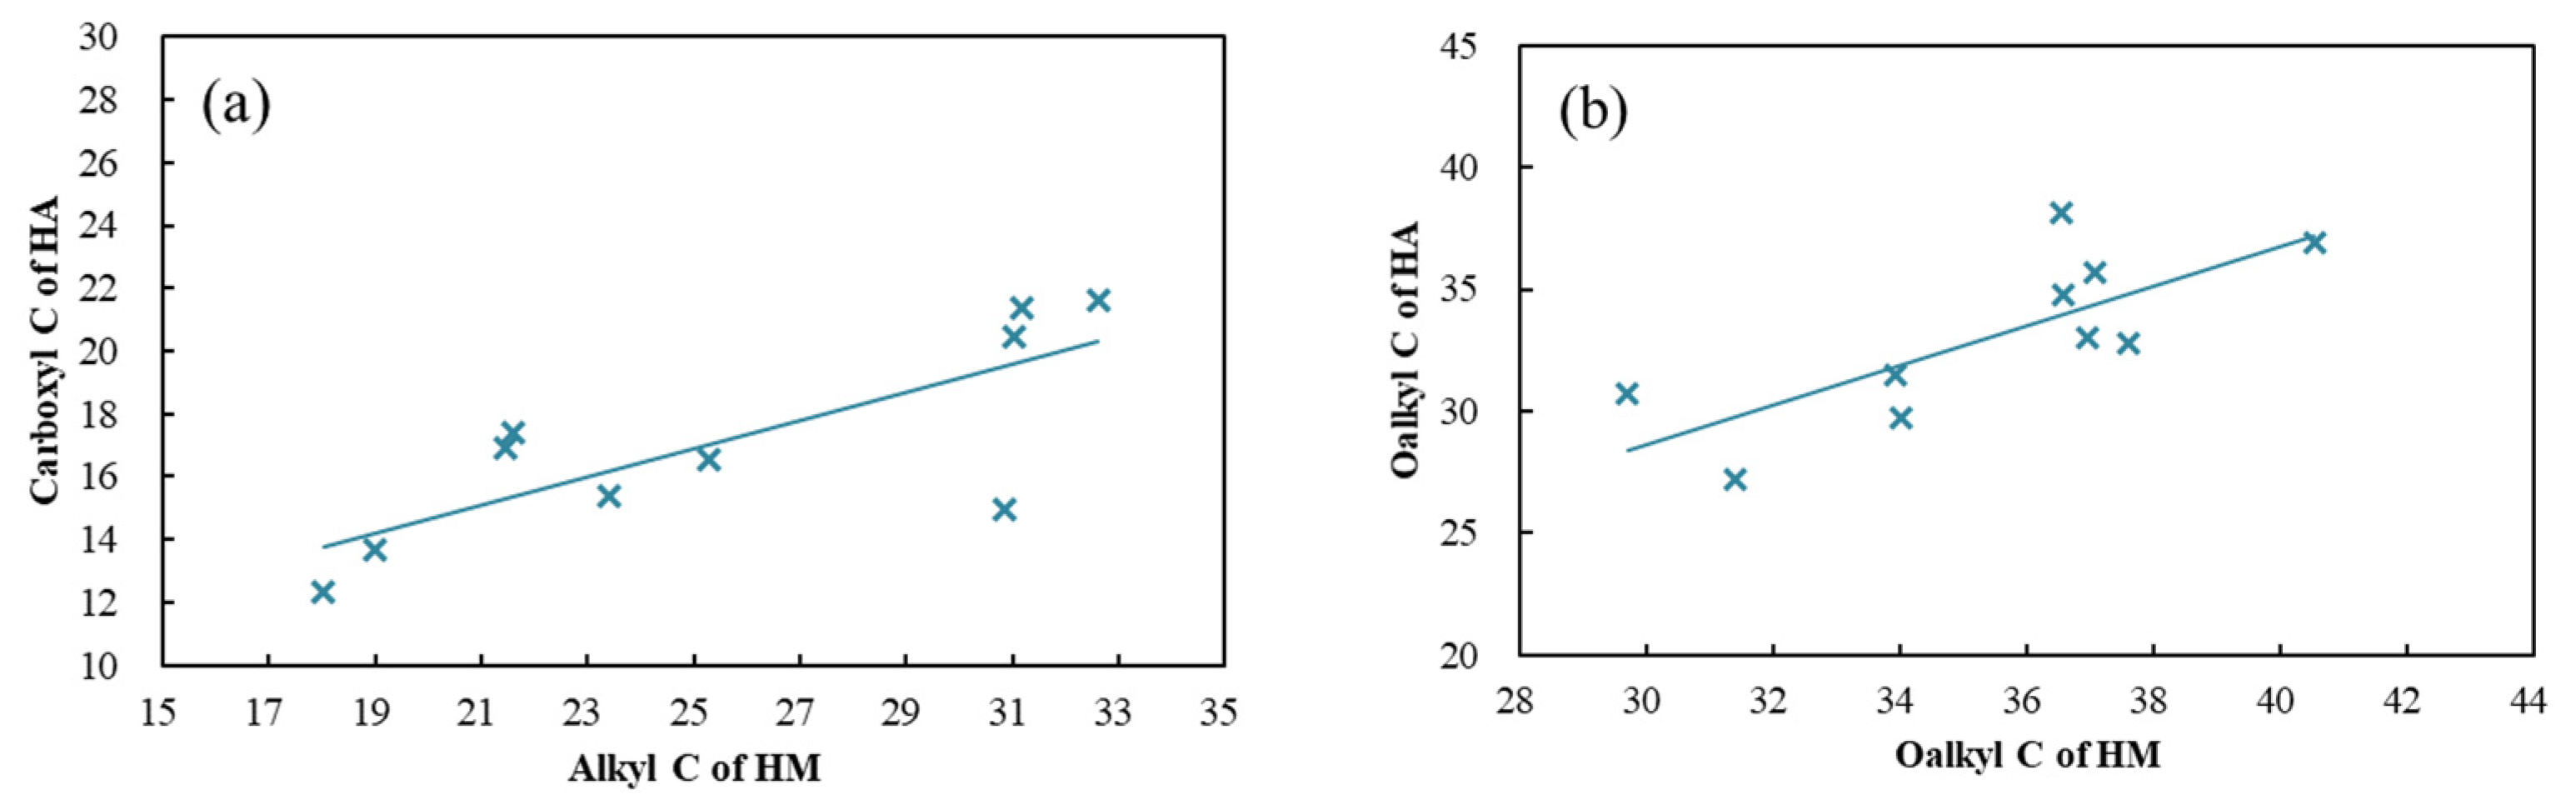
Aliphatic C was negatively correlated with Aromatic C, aliphatic C was negatively correlated with Carboxyl C. It could be concluded that during the formation and transformation of functional groups in the same group of humus, aliphatic C and Aromatic C, aliphatic C and Carboxyl C had a decreasing relationship. There may be some genetic relationship between Aliphatic C and Aromatic C, aliphatic C and Carboxyl C in the same group of humus.
(4)
In the phylogenetic relationship between HA, FA, and HM, more transformations exist between HA and FA, and between HA and HM, while the transformations between FA and HM was very rare. Based on the “lignin theory”, it could be considered that HA and HM are formed in the first stage of humification, and there are a mutual transformation mechanisms between HA and FA, and then HA was split into FA in the second stage under the action of microorganisms. Based on the “polyphenol theory”, it could be inferred that FA was formed in the first stage of humification, and FA was further condensed into HA, and then transformed from HA to HM.

Author Contributions

Methodology, J.-J.L. and H.-B.J.; writing—original draft preparation, J.-J.L. and F.D.; writing—review and editing, W.-J.W.; experiment, C.Y., L.Z., R.L. and J.G. All authors have read and agreed to the published version of the manuscript.

Funding

This research was funded by the National Key Research and Development Program of China (No. 2019YFD1100205), the National Natural Science Foundation of China (NSFC) grants (No. 41473122, 41073096).

Institutional Review Board Statement

Not applicable.

Informed Consent Statement

Not applicable.

Data Availability Statement

The data presented in this study are openly available in reference.

Conflicts of Interest

The authors declare no conflict of interest.

References

  1. Ozdoba, D.M.; Blyth, J.C.; Engler, R.F.; Dinel, H.; Schnitzer, M. Leonardite and Humified Organic Matter, 5th ed.; Humic Substances Seminar: Boston, MA, USA, 2007; pp. 309–314. [Google Scholar]
  2. Preston, C.M.; Hempfling, R.; Schulten, H.-R.; Schnitzer, M.; Trofymow, J.A.; Axelson, D.E. Characterization of organic matter in a forest soil of coastal British Columbia by NMR and pyrolysis-field ionization mass spectrometry. Plant Soil 1994, 158, 69–82. [Google Scholar] [CrossRef]
  3. Hayes, M.H.B. Studies on Soil Humic Substances. J. Sci. Food Agric. 1985, 36, 272–274. [Google Scholar]
  4. Rice, J.A. Humin. Soil Sci. 2001, 166, 848–857. [Google Scholar] [CrossRef]
  5. Banach-Szott, M.; Kondratowicz-Maciejewska, K.; Kobierski, M. Humic substances in Fluvisols of the Lower Vistula floodplain, North Poland. Environ. Sci. Pollut. Res. 2018, 25, 23992–24002. [Google Scholar] [CrossRef] [PubMed]
  6. Hayes, M.H.; Clapp, C.E. Humic substances: Considerations of compositions, aspects of structure, and environmental influences. Soil Sci. 2001, 166, 723–737. [Google Scholar] [CrossRef] [Green Version]
  7. Zavarzina, A.G.; Danchenko, N.N.; Demin, V.V.; Artemyeva, Z.S.; Kogut, B.M. Humic Substances: Hypotheses and Reality (A Review). Eurasian Soil Sci. 2021, 54, 1826–1854. [Google Scholar] [CrossRef]
  8. Xu, J.; Zhao, B.; Li, Z.; Chu, W.; Mao, J.; Olk, D.C.; Zhang, J.; Xin, X.; Wei, W. Demonstration of Chemical Distinction among Soil Humic Fractions Using Quantitative Solid-State 13C NMR. J. Agric. Food Chem. 2019, 67, 8107–8118. [Google Scholar] [CrossRef]
  9. Luo, L.; Lv, J.-T.; Xu, C.; Guo, Z.; Zhang, S.-Z. Study on C-Functional Groups of Soil Humus Fractions Affected by Phosphate Using C 1s Near-edge X-ray Absorption Fine Structure Spectroscopy. Chin. J. Anal. Chem. 2013, 41, 1279–1282. [Google Scholar] [CrossRef]
  10. Li, J.M.; Wu, J.G. Effects of the Different Organic Materials on the Structure and Elemental Composition of Humus in Black Soil. Adv. Mater. Res. 2011, 356–360, 8–13. [Google Scholar] [CrossRef]
  11. Collado, S.; Oulego, P.; Suárez-Iglesias, O.; Díaz, M. Biodegradation of dissolved humic substances by fungi. Appl. Microbiol. Biotechnol. 2018, 102, 3497–3511. [Google Scholar] [CrossRef]
  12. Chagas, J.K.M.; de Figueiredo, C.C.; Ramos, M.L.G. Biochar increases soil carbon pools: Evidence from a global meta-analysis. J. Environ. Manag. 2022, 305, 114403. [Google Scholar] [CrossRef] [PubMed]
  13. Fan, C.; Song, X.; Chang, J.; Wang, Y.; Zhang, J. Chemical compositions and copper(II) adsorption properties of sequentially extracted humic substances, including different humin fractions. Fresenius Environ. Bull. 2018, 27, 6485–6499. [Google Scholar]
  14. Leal, O.d.A.; Vargas Castilhos, R.M.; Pauletto, E.A.; Spinelli Pinto, L.F.; Fernandes, F.F.; Penning, L.H.; da Rosa, C.M. Organic matter fractions and quality of the surface layer of a constructed and vegetated soil after coal mining. I—Humic substances and chemical characterization. Rev. Bras. Cienc. Solo 2015, 39, 886–894. [Google Scholar] [CrossRef]
  15. Hayes, M.H.B.; Swift, R.S. An appreciation of the contribution of Frank Stevenson to the advancement of studies of soil organic matter and humic substances. J. Soils Sediments 2017, 18, 1212–1231. [Google Scholar] [CrossRef]
  16. Ukalska-Jaruga, A.; Bejger, R.; Debaene, G.; Smreczak, B. Characterization of Soil Organic Matter Individual Fractions (Fulvic Acids, Humic Acids, and Humins) by Spectroscopic and Electrochemical Techniques in Agricultural Soils. Agronomy 2021, 11, 1067. [Google Scholar] [CrossRef]
  17. Aiken, G.; Leenheer, J. Isolation and Chemical Characterization of Dissolved and Colloidal Organic Matter. Chem. Ecol. 1993, 8, 135–151. [Google Scholar] [CrossRef]
  18. Kononova, M.A. Soil Organic Matter: Its Nature, Its Role in Soil Formation and in Soil Fertility. Pergamon 1966, 544. [Google Scholar]
  19. Mengchang, H.E.; Yehong, S.H.I.; Chunye, L.I.N. Characterization of humic acids extracted from the sediments of the various rivers and lakes in China. J. Environ. Sci. 2008, 20, 1294–1299. [Google Scholar]
  20. da Silva, C.F.; Loss, A.; do Carmo, E.R.; Pereira, M.G.; Ribeiro da Silva, E.M.; Martins, M.A. Soil fertility and humic substances in an area of clay extraction revegetated with eucalypt and legumes in the north of Rio De Janeiro state. Cienc. Florest. 2015, 25, 547–561. [Google Scholar]
  21. Antunes, R.M.; Leal, O.D.A.; Castilhos, R.M.V.; Castilhos, D.D.; Andreazza, R.; Schwalbert, R.A. Humic Substances and Chemical Properties of an Acrisol Amended with Vermicomposted Vegetal and Animal Residues. Rev. Bras. Ciência Solo 2019, 43, 1–17. [Google Scholar] [CrossRef] [Green Version]
  22. Rice, J.A.; MacCarthy, P. Statistical evaluation of the elemental composition of humic substances. Org. Geochem. 1991, 17, 635–648. [Google Scholar] [CrossRef]
  23. Baldock, J.A.; Preston, C.M. Chemistry of carbon decomposition processes in forests as revealed by solid-state 13C NMR. Carbon Forms Funct. Forest Soils 1995, 89–117. [Google Scholar]
  24. Greenland, D.J. Soil Organic Matter: Developments in Soil Science; Schnitzer, M., Khan, S.U., Eds.; Elsevier: Amsterdam, The Netherlands, 1980; Volume 8, ISBN 0-444-41610. [Google Scholar]
  25. Knicker, H.; Hilscher, A.; Martín, G.A.; Gonzálezvila, F.; Gonzálezpérez, J.; Polvillo, O. Characteristic Alterations of Quantity and Quality of Humic Substances in Forest Soils Caused by Wild-Fires; Universitaät Karlsruhe, International Humic Substances Society: Karlsruhe, Germany, 2006. [Google Scholar]
  26. Chen, R.; Yu, S.; Zhao, T.; Lin, S. NMR spectroscopy studies of humic acid:The T_1 values and the relative contents of various types of carbons in methylated humic acids. Henan Sci. 1986, 23–30. [Google Scholar]
  27. Keeler, C.; Maciel, G.E. Quantitation in the Solid-State 13C NMR Analysis of Soil and Organic Soil Fractions. Anal. Chem. 2003, 75, 2421–2432. [Google Scholar] [CrossRef]
  28. Jiang, T.; Kaal, J.; Liang, J.; Zhang, Y.; Wei, S.; Wang, D.; Green, N.W. Composition of dissolved organic matter (DOM) from periodically submerged soils in the Three Gorges Reservoir areas as determined by elemental and optical analysis, infrared spectroscopy, pyrolysis-GC–MS and thermally assisted hydrolysis and methylation. Sci. Total Environ. 2017, 603–604, 461–471. [Google Scholar] [CrossRef]
  29. Zaccheo, P.; Ricca, G.; Crippa, L. Organic Matter Characterization of Composts From Different Feedstocks. Compos. Sci. Util. 2002, 10, 29–38. [Google Scholar] [CrossRef]
  30. Zhang, J.; Cai, H.; Zhang, C.; Ren, J.; Wang, L. First characterization of humic-like substances isolated from maize straw biochar. Fresenius Environ. Bull. 2015, 24, 1815–1821. [Google Scholar]
  31. Hatcher, P.G.; Schnitzer, M.; Dennis, L.W.; Maciel, G.E. Aromaticity of Humic Substances in Soils. Soil Sci. Soc. Am. J. 1981, 45, 1089–1094. [Google Scholar] [CrossRef]
  32. Chung, T.-L.; Chen, J.-S.; Chiu, C.-Y.; Tian, G. 13C-NMR spectroscopy studies of humic substances in subtropical perhumid montane forest soil. J. For. Res. 2012, 17, 458–467. [Google Scholar] [CrossRef]
Figure 1. Location of sampling points.
Sustainability 14 06145 g001
Figure 2. Profile distribution of Humic Acids and Fulvic Acids in soil (a) Vertical variation of HA and FA, (b) vertical variation of HA/FA ratio.
Sustainability 14 06145 g002
Figure 3. CP-MAS 13C NMR spectra of Humic Acids, Fulvic Acids and Humin in soil. (a) XP1, (b) XP2.
Sustainability 14 06145 g003
Figure 4. CP-MAS 13C NMR spectra of Humic Acids, Fulvic Acids and Humin at different depths. (a) XP1, (b) XP2.
Sustainability 14 06145 g004
Figure 5. Vertical variation of different functional groups in soil Humic Acids, Fulvic Acids and Humin.
Sustainability 14 06145 g005
Figure 6. Correlation of different functional group of Humic Acids, Fulvic Acids and Humin in soil samples.
Sustainability 14 06145 g006
Figure 7. (a) Relationship between Alkyl C and Aromatic (b) The relationship between Oalkyl C and Carboxyl C in soil Humic Acids, Fulvic Acids and Humin.
Sustainability 14 06145 g007
Figure 8. Statistics of Alkyl C + Aromatic C (a) and Oalkyl C + Carboxyl C (b) in soil Humic Acids, Fulvic Acids and Humin.
Sustainability 14 06145 g008
Figure 9. Relationship between Humic Acids and Fulvic Acids functional groups in soil. (a) Relationship between Alkyl C of Fulvic Acids and Carboxyl C of Humic Acids, (b) Relationship between Aromatic C of Fulvic Acids and Oalkyl C of Humic Acids.
Sustainability 14 06145 g009
Figure 10. Relationship between Humic Acids and Humin functional groups in soil. (a) Relationship between Alkyl C of Humin and Carboxyl C of Humic Acids, (b) Relationship between Oalkyl C of Humin and Oalkyl C of Humic Acids.
Sustainability 14 06145 g010
Table 1. Description of soil sample properties.
SampleDepth (cm)Geographic
Coordinates
Land
Vegetation
ColourSoil
Classification
pH
XP1-10–5N 27°40.417′
E 107°01.138′
H 947 m
coniferous forestblack brownyellow brown soil6.23
XP1-25–107.27
XP1-310–157.34
XP1-415–207.16
XP1-520–256.87
XP1-625–306.82
XP2-10–5N 27°40.412′
E 107°01.112′
H 918 m
shrubyellowyellow soil3.83
XP2-25–103.70
XP2-310–153.66
XP2-415–203.68
XP2-520–253.70
XP2-625–303.68
Table 2. Humic Acids and Fulvic Acids contents in soil samples.
SampleHA (mg/g)FA (mg/g)HA/FA
XP1-10.201.670.12
XP1-20.111.570.07
XP1-30.121.260.10
XP1-40.081.690.05
XP1-50.111.520.07
XP1-60.281.260.22
XP2-10.542.230.24
XP2-20.432.350.18
XP2-30.291.930.15
XP2-40.301.860.16
XP2-50.081.470.06
XP2-60.101.140.09
Table 3. Composition of organic elements in soil Humic Acids, Fulvic Acids and Humin (%).
SampleHAFAHM
NCHSNCHSNCHS
XP1-13.3237.383.540.31.9540.623.660.360.8712.161.30.03
XP1-23.1136.993.610.41.8440.314.050.340.679.140.860.03
XP1-33.0136.963.740.362.1440.173.590.380.456.040.590.02
XP1-42.9435.123.70.322.0339.973.530.40.354.820.460.01
XP1-52.4735.783.310.291.6337.084.290.320.263.780.340.01
XP1-62.3335.793.30.242.0839.323.530.330.172.410.290.01
XP2-14.3337.964.080.381.1228.752.730.270.182.980.330.01
XP2-24.2536.73.760.331.0227.172.660.220.182.970.320.02
XP2-34.4237.383.960.281.5739.283.680.330.152.930.310.02
XP2-44.1437.333.650.261.639.893.670.290.132.210.250.02
XP2-54.1436.713.650.221.4740.433.610.30.11.550.180.02
XP2-6----1.3240.63.720.290.132.050.210.03
Table 4. Elemental ratios of soil Humic Acids, Fulvic Acids and Humin.
SampleHAFAHM
C/NH/CC/NH/CC/NH/C
XP1-113.131.1424.351.0816.351.29
XP1-213.881.1725.61.2116.031.13
XP1-314.321.2121.921.0715.71.17
XP1-413.941.2622.981.0616.171.14
XP1-516.921.1126.491.3916.851.08
XP1-617.91.1122.11.0816.551.43
XP2-110.231.2929.841.1419.391.31
XP2-210.071.2330.971.1719.121.29
XP2-39.871.2729.261.1222.451.27
XP2-410.511.1729.171.119.961.37
XP2-510.351.1932.061.0718.131.42
XP2-6--35.971.118.051.25
Table 5. Distribution of Humification index (HI) and AromaticsV(fa) of soil Humic Acids, Fulvic Acids and Humin.
HumusSampleHI aFa b73/10573/130172/13056/130
HAXP1-10.590.284.081.661.190.75
XP1-20.580.313.361.171.140.52
XP1-30.520.302.791.200.850.49
XP1-40.610.271.620.680.730.26
XP1-50.630.362.710.580.460.19
XP1-60.540.372.080.540.480.24
XP2-10.710.312.000.790.790.36
XP2-20.760.332.951.201.270.73
XP2-30.790.281.420.771.150.48
XP2-40.750.371.890.440.730.21
XP2-5------
XP2-6------
FAXP1-10.560.331.910.670.940.07
XP1-20.440.293.041.211.080.02
XP1-30.560.321.160.701.100.18
XP1-40.530.352.290.711.040.12
XP1-5------
XP1-6------
XP2-10.480.291.891.111.390.15
XP2-20.540.272.471.141.210.03
XP2-30.630.273.571.111.340.04
XP2-40.660.272.990.931.670.05
XP2-50.750.233.031.261.940.19
XP2-60.780.233.611.101.860.06
HMXP1-10.620.242.301.290.640.34
XP1-20.590.282.110.900.590.13
XP1-30.580.283.211.010.670.69
XP1-40.490.292.150.780.510.50
XP1-50.690.302.720.720.550.09
XP1-60.510.323.770.870.410.24
XP2-10.820.201.871.450.630.17
XP2-20.910.192.811.440.950.05
XP2-31.100.234.182.051.080.40
XP2-40.990.222.191.100.970.14
XP2-51.060.232.100.980.750.35
XP2-60.690.222.111.010.760.06
a HI = Alkyl C/Oalkyl C; b Fa = Aromatic C/(Alkyl C + Oalkyl C + Aromatic C).
Publisher’s Note: MDPI stays neutral with regard to jurisdictional claims in published maps and institutional affiliations.

