Article

Carbon Emission Prediction Model and Analysis in the Yellow River Basin Based on a Machine Learning Method

1
School of Water Conservancy Science and Engineering, Zhengzhou University, Zhengzhou 450001, China
2
Key Laboratory of Building Structure of Anhui Higher Education Institutes, Anhui Xinhua University, Hefei 230088, China
3
School of Computer, Northeast Electric Power University, Jilin 132012, China
*
Author to whom correspondence should be addressed.
Sustainability 2022, 14(10), 6153; https://0-doi-org.brum.beds.ac.uk/10.3390/su14106153
Submission received: 16 April 2022 / Revised: 17 May 2022 / Accepted: 18 May 2022 / Published: 18 May 2022
(This article belongs to the Topic Climate Change and Environmental Sustainability)

Abstract

:
Excessive carbon emissions seriously threaten the sustainable development of society and the environment and have attracted the attention of the international community. The Yellow River Basin is an important ecological barrier and economic development zone in China. Studying the influencing factors of carbon emissions in the Yellow River Basin is of great significance to help China achieve carbon peaking. In this study, quadratic assignment procedure regression analysis was used to analyze the factors influencing carbon emissions in the Yellow River Basin from the perspective of regional differences. Accurate carbon emission prediction models can guide the formulation of emission reduction policies. We propose a machine learning prediction model, namely, the long short-term memory network optimized by the sparrow search algorithm, and apply it to carbon emission prediction in the Yellow River Basin. The results show an increasing trend in carbon emissions in the Yellow River Basin, with significant inter-provincial differences. The carbon emission intensity of the Yellow River Basin decreased from 5.187 t/10,000 RMB in 2000 to 1.672 t/10,000 RMB in 2019, showing a gradually decreasing trend. The carbon emissions of Qinghai are less than one-tenth of those in Shandong, the highest carbon emitter. The main factor contributing to carbon emissions in the Yellow River Basin from 2000 to 2010 was GDP per capita; after 2010, the main factor was population. Compared to the single long short-term memory network, the mean absolute percentage error of the proposed model is reduced by 44.38%.

1. Introduction

Global warming is an issue that has gained worldwide attention. Many signs, such as enhanced radiation, rising sea levels, and decreasing snow cover, indicate an increasing trend of global warming [1]. Global warming not only affects the balance of the ecosystem, but also brings irreversible damage to the development of human society and the economy [2]. Controlling greenhouse gas emissions and suppressing the greenhouse effect are both a prerequisite for the sustainable development of human society and a guarantee of the continuous improvement of human productivity [3].
The Yellow River Basin is an important region for China’s economic development, and the area and resident population of the Yellow River Basin provinces account for 44.21% and 57.72% of China’s northern provinces, respectively. The Yellow River Basin has experienced rapid economic development in recent years, and its economic strength has increased significantly, playing an important supporting role in China’s economic development. The Yellow River Basin is the main source of supply of energy such as oil and coal in China, and coal production accounts for about 70% of the coal production of China. The development of energy resources supports the construction of energy-intensive heavy industries, and the proportion of resource extraction and its processing industries in the Yellow River Basin is as high as 36.34%. In 2019, the ecological protection and high-quality development of the Yellow River Basin became a major regional strategy in China, which clearly emphasized the need for the simultaneous promotion of ecological protection and high-quality development. Energy conservation and emission reduction is an important part of achieving high-quality development, and carbon emission reduction is not only consistent with the goal of ecological protection, but also closely related to improving the quality of economic and social development. Therefore, scientific measurement of the spatial and temporal differences and influencing factors of carbon emissions in the Yellow River Basin is of great significance to achieving ecological protection and quality development in the Yellow River Basin.
Existing studies have mainly used structural decomposition analysis and index decomposition analysis in the analysis of carbon emission impact factors. By sorting out the relationship between production inputs and economic outputs, structural decomposition analysis decomposes the relevant factors that lead to change in the research object and identifies the contribution of each influencing factor in the change in the dependent variable. De Vries and Ferrarini [4] applied structural decomposition analysis to examine the driving force of increased carbon emissions in developed and emerging economies, and their findings suggest that rising levels of domestic consumption make a significant contribution to carbon emissions in both developed and emerging economies. Even in countries that are closely involved in global trade, such as China, domestic consumption accounts for a significant portion of the increase in carbon emissions. Jiang et al. [5] decomposed global carbon emissions into domestic input structure, international input structure, carbon emission intensity, consumption pattern, consumption, and population, based on structural decomposition analysis, and the results showed that domestic input structure has been the main driver for reducing global carbon emissions in recent years. Changes in international input structure are the main factor in the increase in carbon emissions in Japan and Germany. Some studies have used decomposition analysis to study specific sector carbon emissions. Lian et al. [6] analysed the driving factors of the transport sector in China and found that total output and energy intensity were the main influences on the transport sector in China, with energy intensity showing a facilitative or inhibitory effect on the increase of carbon emissions in the transport sector over time. Index decomposition analysis more easily handles the data compared to structural decomposition analysis, and is also widely used in analyzing the factors influencing carbon emissions. Rosita et al. [7] explored the main drivers of CO2 change in manufacturing in Indonesia using the logarithmic mean Divisia index (LMDI) and the results of the study showed that industrial economic activity and industrial energy intensity have the greatest impact in Indonesia. In another study, Zhang et al. [8] investigated the factors influencing carbon emissions in 29 Chinese provinces from 1995 to 2012 based on LMDI, and the results obtained showed that the decrease in the proportion of energy consumption in the secondary and tertiary sectors was an important reason for the decrease in carbon intensity. When using decomposition methods for analysis, it is assumed that the factors influencing carbon emissions are independent of each other; however, a large number of studies have shown that the factors influencing carbon emissions are not completely independent [9]. Unlike general statistical methods, quadratic assignment procedure (QAP) is based on matrix permutation, which does not require the assumption of complete independence of variables, and is more robust; therefore, QAP is used in this study to analyze the factors influencing carbon emissions in the Yellow River Basin.
Prediction of carbon emissions based on influencing factors is also a hot research topic in the field of carbon emissions. The establishment of carbon emission prediction models can provide technical support for decision makers to formulate emission reduction plans and help reduce carbon emissions from source. Ge et al. [10] developed a prediction model for industrial carbon emissions in Tianjin based on industrial carbon emission data from 2003–2012 using the logistic model and the STIRPAT model, and compared the results. Perez-Suarez and Lopez-Menendez [11] predicted carbon emissions for several countries using the extended environmental Kuznets curve and environmental logistic curve, and the percentage error of their proposed model fluctuated between 2.5 and 6.8 percent. Carbon emission data are nonlinear and traditional linear regression methods encounter difficulties in achieving high accuracy. Recently, much of the energy and environmental literature started to use machine learning methods [12]. Machine learning outperforms traditional statistical methods in many problems and has high prediction accuracy and robustness [13]. Javanmard et al. [14] employed 12 favorite machine learning algorithms used by recent studies for prediction in the building, energy, and water domains. Chai et al. [15] used a genetic algorithm (GA) combined with neural networks to establish a carbon emission prediction model for Xinjiang after analyzing the influencing factors of carbon emissions in Xinjiang. Jena et al. [16] used artificial neural networks to model the carbon emissions of 17 major global carbon emitting countries, which used GDP, urbanization rate, and trade openness as inputs to the model, and the average accuracy of carbon emission prediction for 17 countries was 96%. Javanmard and Ghaderi [17] proposed a machine learning combined with mathematical programming approach to predict CO2, N2O, CH4, and fluorinated gases in Iran, which exhibited high accuracy.
Scant existing literature has studied carbon emissions in the Yellow River Basin. Yuan et al. [18] used social network analysis to identify important industries in the carbon footprint of the Yellow River Basin and the results showed that petroleum, coking, nuclear fuel, and chemical product manufacturing were the highest emitting sectors. Zhang and Xu [19] conducted a study from the perspective of carbon emission efficiency and found that the carbon emission efficiency of the Yellow River Basin provinces showed a fluctuating upward trend.
Carbon emissions have caused great damage to the environment and seriously affected the survival and development of human beings. Therefore, from the perspective of environmental protection and sustainable development, studying carbon emissions is beneficial to the country in effectively controlling carbon emissions, reducing environmental pollution, and maintaining economic development while reducing greenhouse gas emissions. Predicting carbon emissions can provide technical support for sustainable development paths and provide a scientific basis for formulating emission reduction plans. The Yellow River Basin is an important region in China, and the high quality of the Yellow River Basin has resulted in it being selected as part of a major strategy in China’s regional development. Analyzing the drivers of carbon emissions in the Yellow River Basin and establishing an accurate carbon emission prediction model is important for policy makers to formulate emission reduction policies, and Yellow River Basin carbon emission reduction will also help China’s carbon peaking and carbon neutrality.
As an important region in the development of China, there are few studies on the factors influencing carbon emissions and prediction models in the Yellow River Basin, which is detrimental to the implementation of emission reduction measures in the Yellow River Basin. Our study will fill the gap in carbon emission research in the Yellow River Basin. The main contributions and innovations of this study include the following concepts. We account for carbon emissions in the Yellow River Basin and analyze the spatial and temporal variation of carbon emissions in the Yellow River Basin. QAP analysis is used to analyze the influencing factors in the Yellow River Basin at different time periods. In the methodology, we propose a hybrid machine learning algorithm and apply it to the prediction of carbon emissions in the Yellow River Basin. The proposed model is able to predict carbon emissions in the Yellow River Basin with a small error rate, which verifies the accuracy of the model.

2. Methodology

Global climate change, especially carbon dioxide emissions, has become a common environmental concern for all countries around the world. The Yellow River Basin is rich in coal and oil resources, and as China’s energy supply base, the contradiction between economic and ecological protection in the Yellow River Basin is extremely prominent. China has set ecological protection and high-quality development of the Yellow River Basin as a major regional strategy, and energy saving and emission reduction is an important part of achieving ecological protection and high-quality development. The scientific measurement of carbon emissions and analysis of the influencing factors are important bases for the development of carbon emission reduction plans. The carbon emission prediction model is an emerging hot issue in recent years, and an accurate carbon emission prediction model can provide support for the study of low-carbon development.
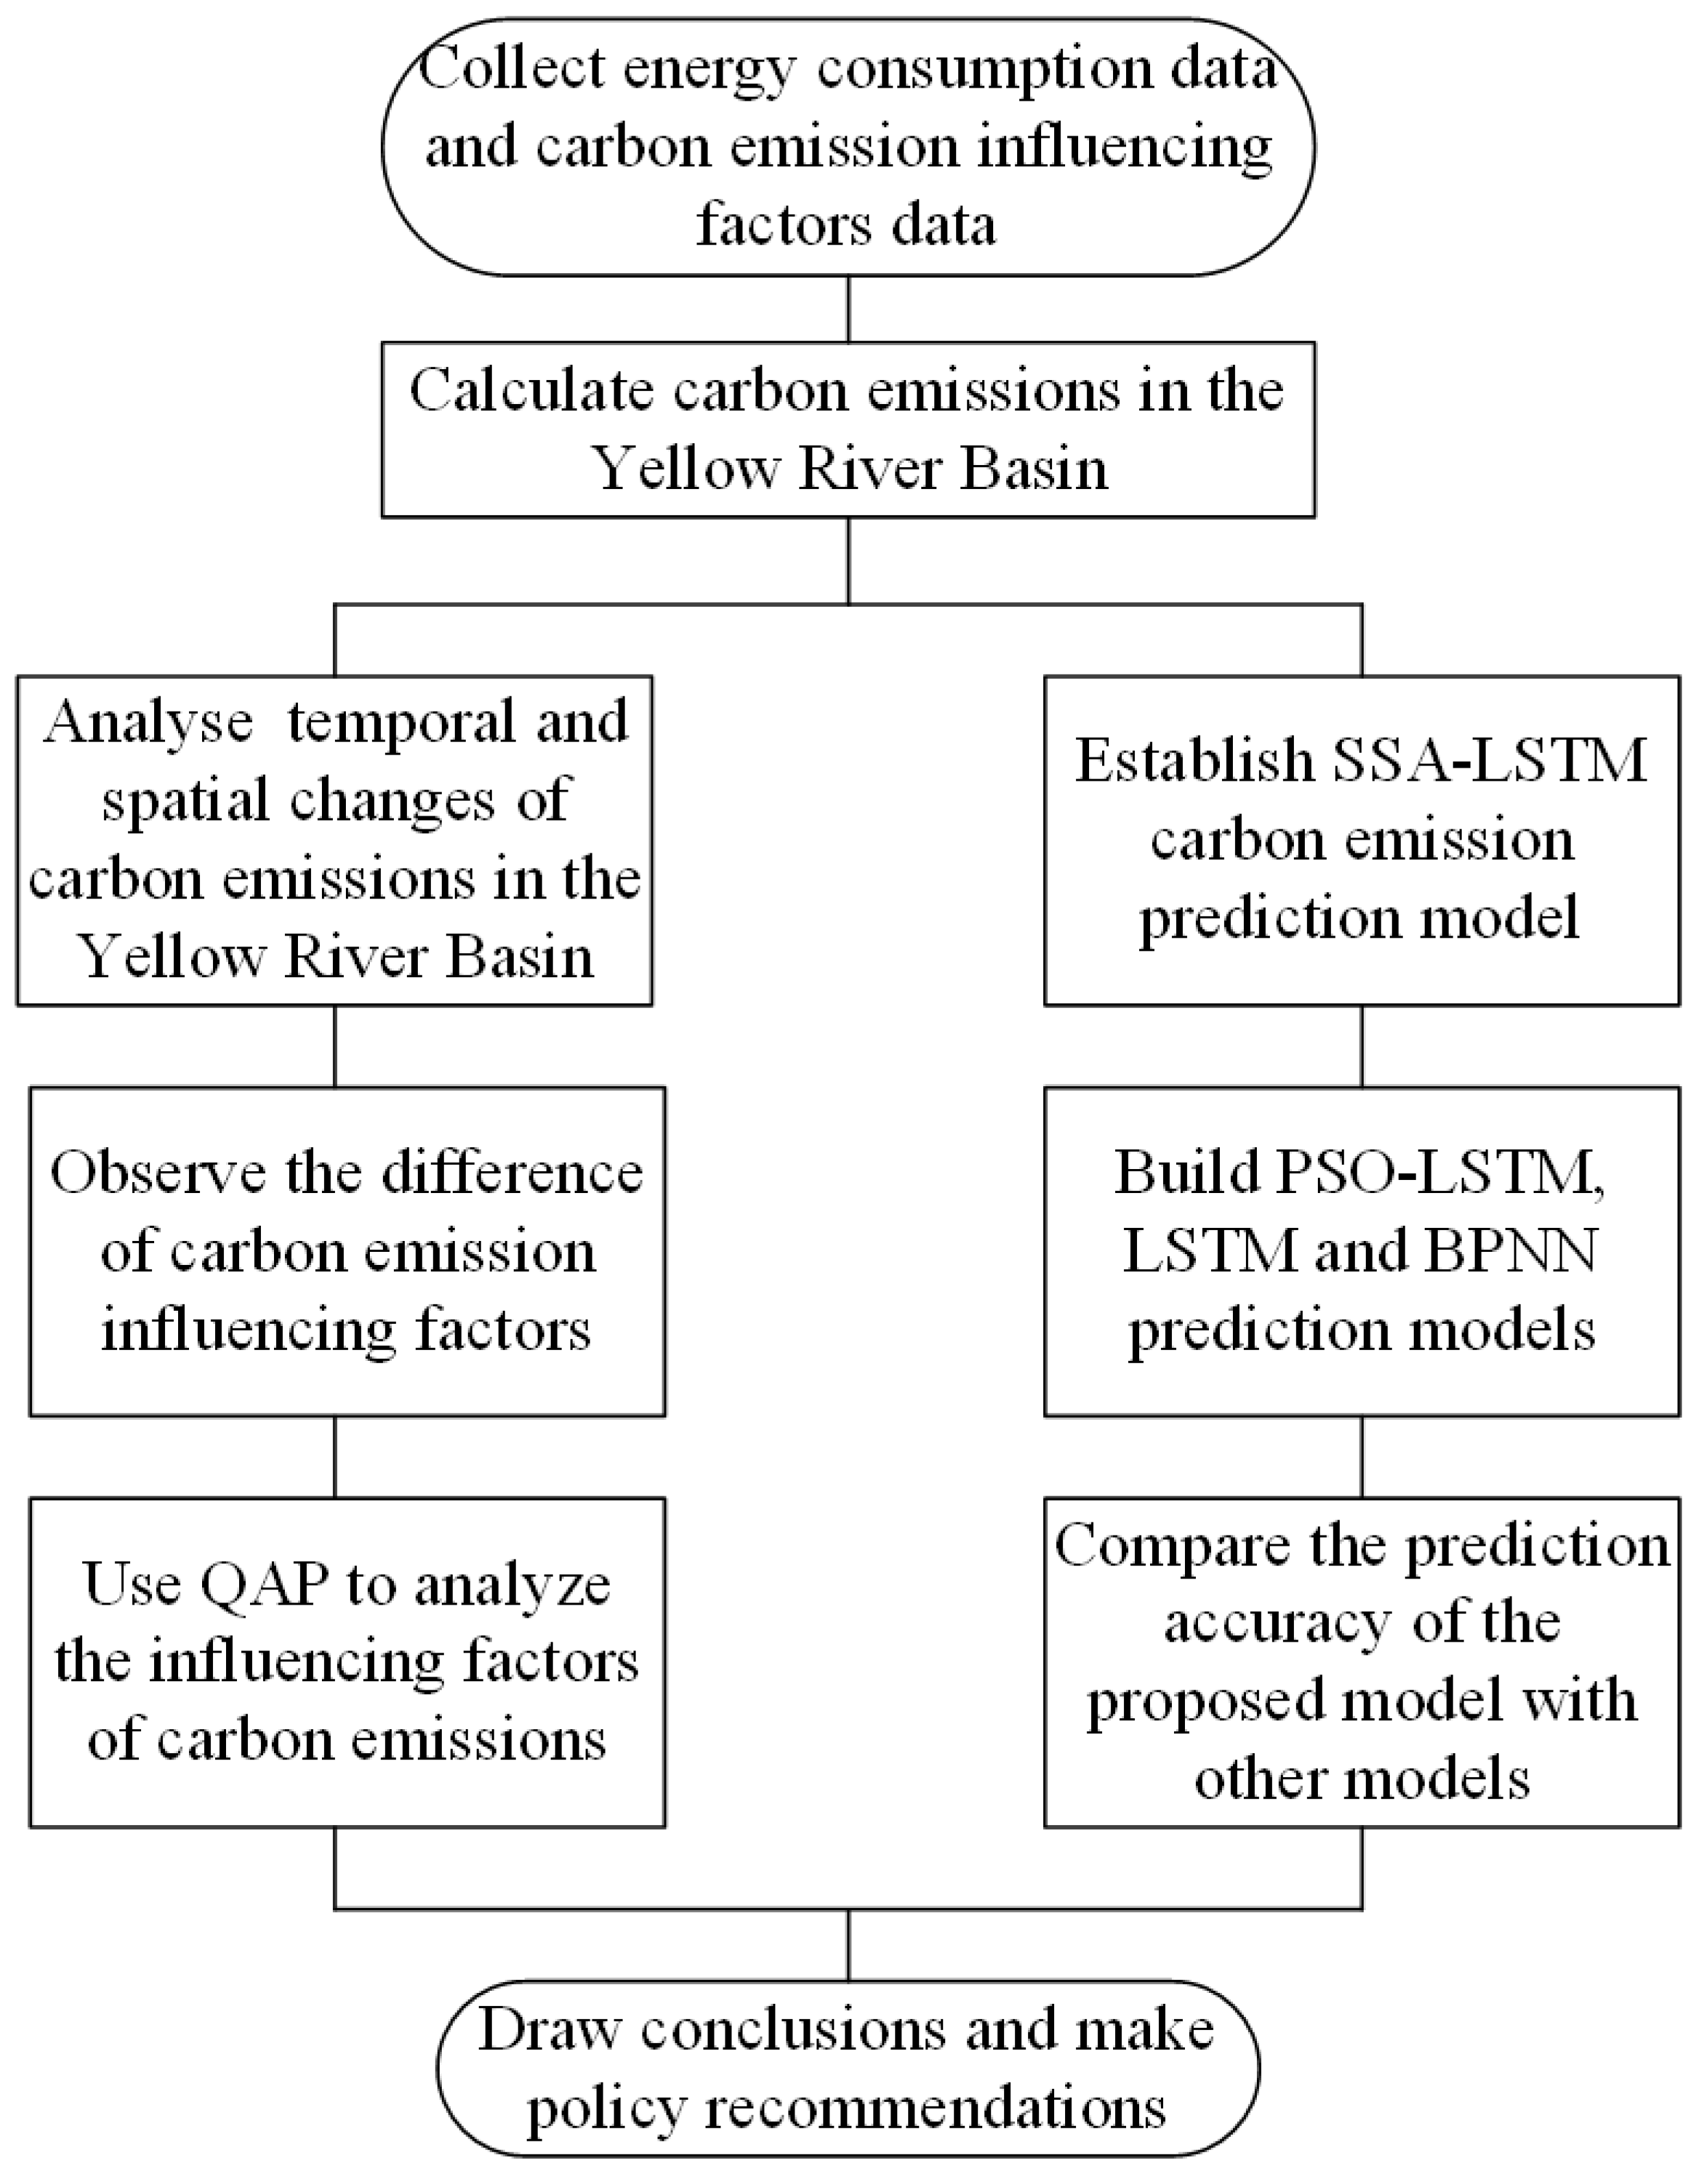
The main objective of this study is to reveal the main factors affecting carbon emissions in the Yellow River Basin and to develop an accurate carbon emission prediction model to guide the development of energy saving and emission reduction measures. The research framework of this paper includes the following steps. 1. Collect data on energy consumption and factors influencing carbon emissions 2. Account for carbon emissions in the Yellow River Basin and analyze the spatial and temporal variation in carbon emissions 3. Use the QAP method to study the factors influencing the difference of carbon emissions in different periods 4. Build a machine learning prediction model and compare the accuracy of different machine learning prediction models. Figure 1 shows the methodology framework of this study.

2.1. Carbon Emissions Accounting

Carbon dioxide is the most important greenhouse gas and its main source is the combustion of fossil fuels. Therefore, this paper estimates carbon dioxide emissions by energy consumption. The energy data of the Yellow River Basin provinces are obtained from the China Energy Statistical Yearbook. The estimation method of carbon emission is recommended by the IPCC and widely used by many scholars. The formula of the calculation method is as follows.
C E = E g i N C V i C C i O 44 / 12
CE is the total carbon emission. Egi is the consumption of fossil fuel i. NCVi and CCi are the net caloric value and carbon content of fuel i. The CEADS database is based on an extensive survey and provides a carbon emission factor more in line with the national conditions of China [20]. In order to accurately measure carbon emissions in the Yellow River Basin, the carbon emission factors in this paper are taken from CEADS [21]. O is the oxidation efficiency and it is assumed to be 1.

2.2. Quadratic Assignment Procedure

QAP analysis has a wide application in analyzing the influencing factors. He et al. [22] studied the influencing factors of carbon emissions in China’s power sector using QAP analysis. Yang and Liu [23] explored the influence of industrial structure and foreign investment level on regional low carbon innovation based on QAP analysis. Duan et al. [24] used the QAP model to test the effects of geographical location, economic disparities, and regional free trade agreements on food trade. QAP regression analysis is based on the principle of multiple regression analysis using the dependent and independent variable matrices, followed by simultaneous random permutation of the elements of the dependent and independent variable matrices. The calculation was repeated several times to obtain the regression coefficient results and the coefficient of determination.
Regional carbon emissions are influenced by many factors, such as population and GDP [25]. According to the literature, GDP per capita and energy intensity promote the growth of carbon emissions [26]. The level of urbanization can also influence regional carbon emissions, and the effect of urbanization on carbon emissions varies at different levels of urbanization [27]. Based on the industrial transformation of developing countries, Yang et al. [
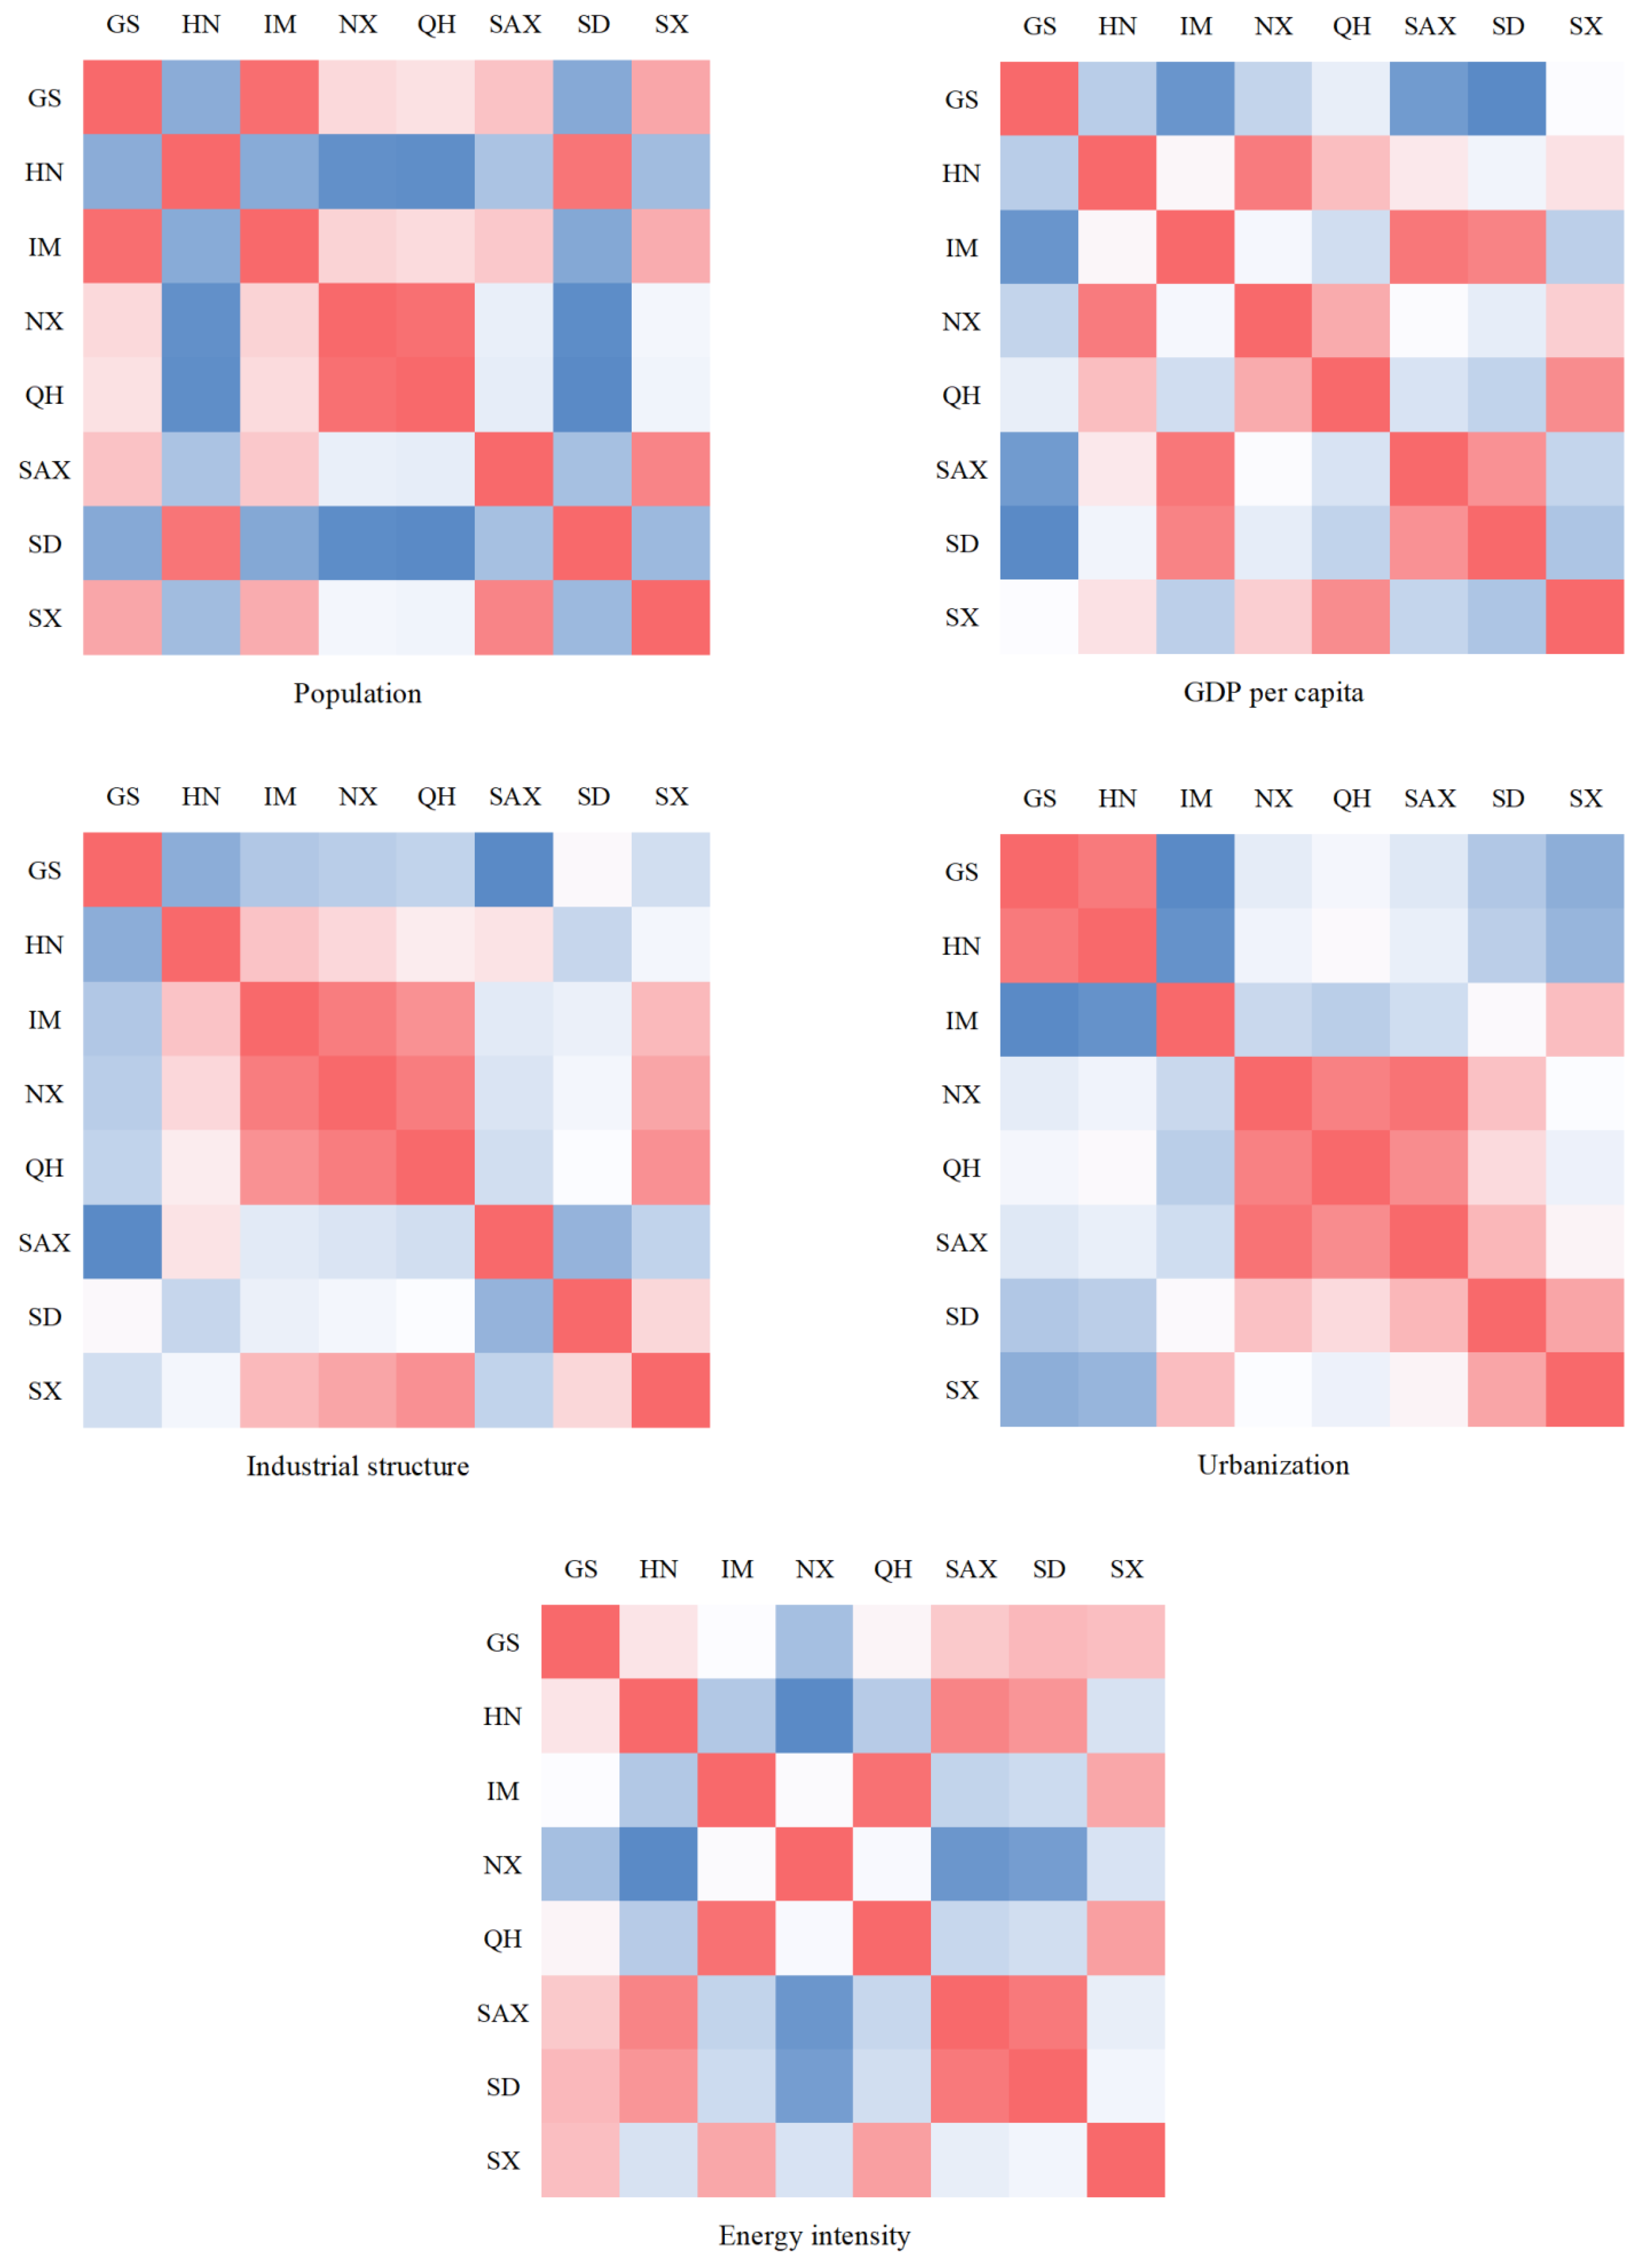
28] reported that the industrial structure showed a promotion and then suppression in carbon emissions. Based on the above analysis, we selected population, GDP, industrial structure, urbanization rate, and energy intensity as the factors influencing carbon emissions in the Yellow River Basin and were able to establish the following QAP model.
C E D = f ( P , G , I , U , E )  
where CED represents the regional carbon emission difference matrix, P is the regional population difference matrix, G is the regional GDP difference matrix, I is the regional industrial structure (tertiary industry proportion) difference matrix, and U and E are the regional urbanization rate and energy intensity difference matrices, respectively.

2.3. Long Short-Term Memory Network

The long short-term memory (LSTM) model is an improved recurrent neural network (RNN) model for the gradient disappearance or explosion problem caused by error transmission in traditional RNN. The LSTM model controls the information transmission by way of introducing input gates, forgetting gates, and output gates, effectively avoiding the gradient disappearance and gradient explosion problems and achieving effective processing of long time series information, which is widely used in the processing of problems related to time series data [29]. 
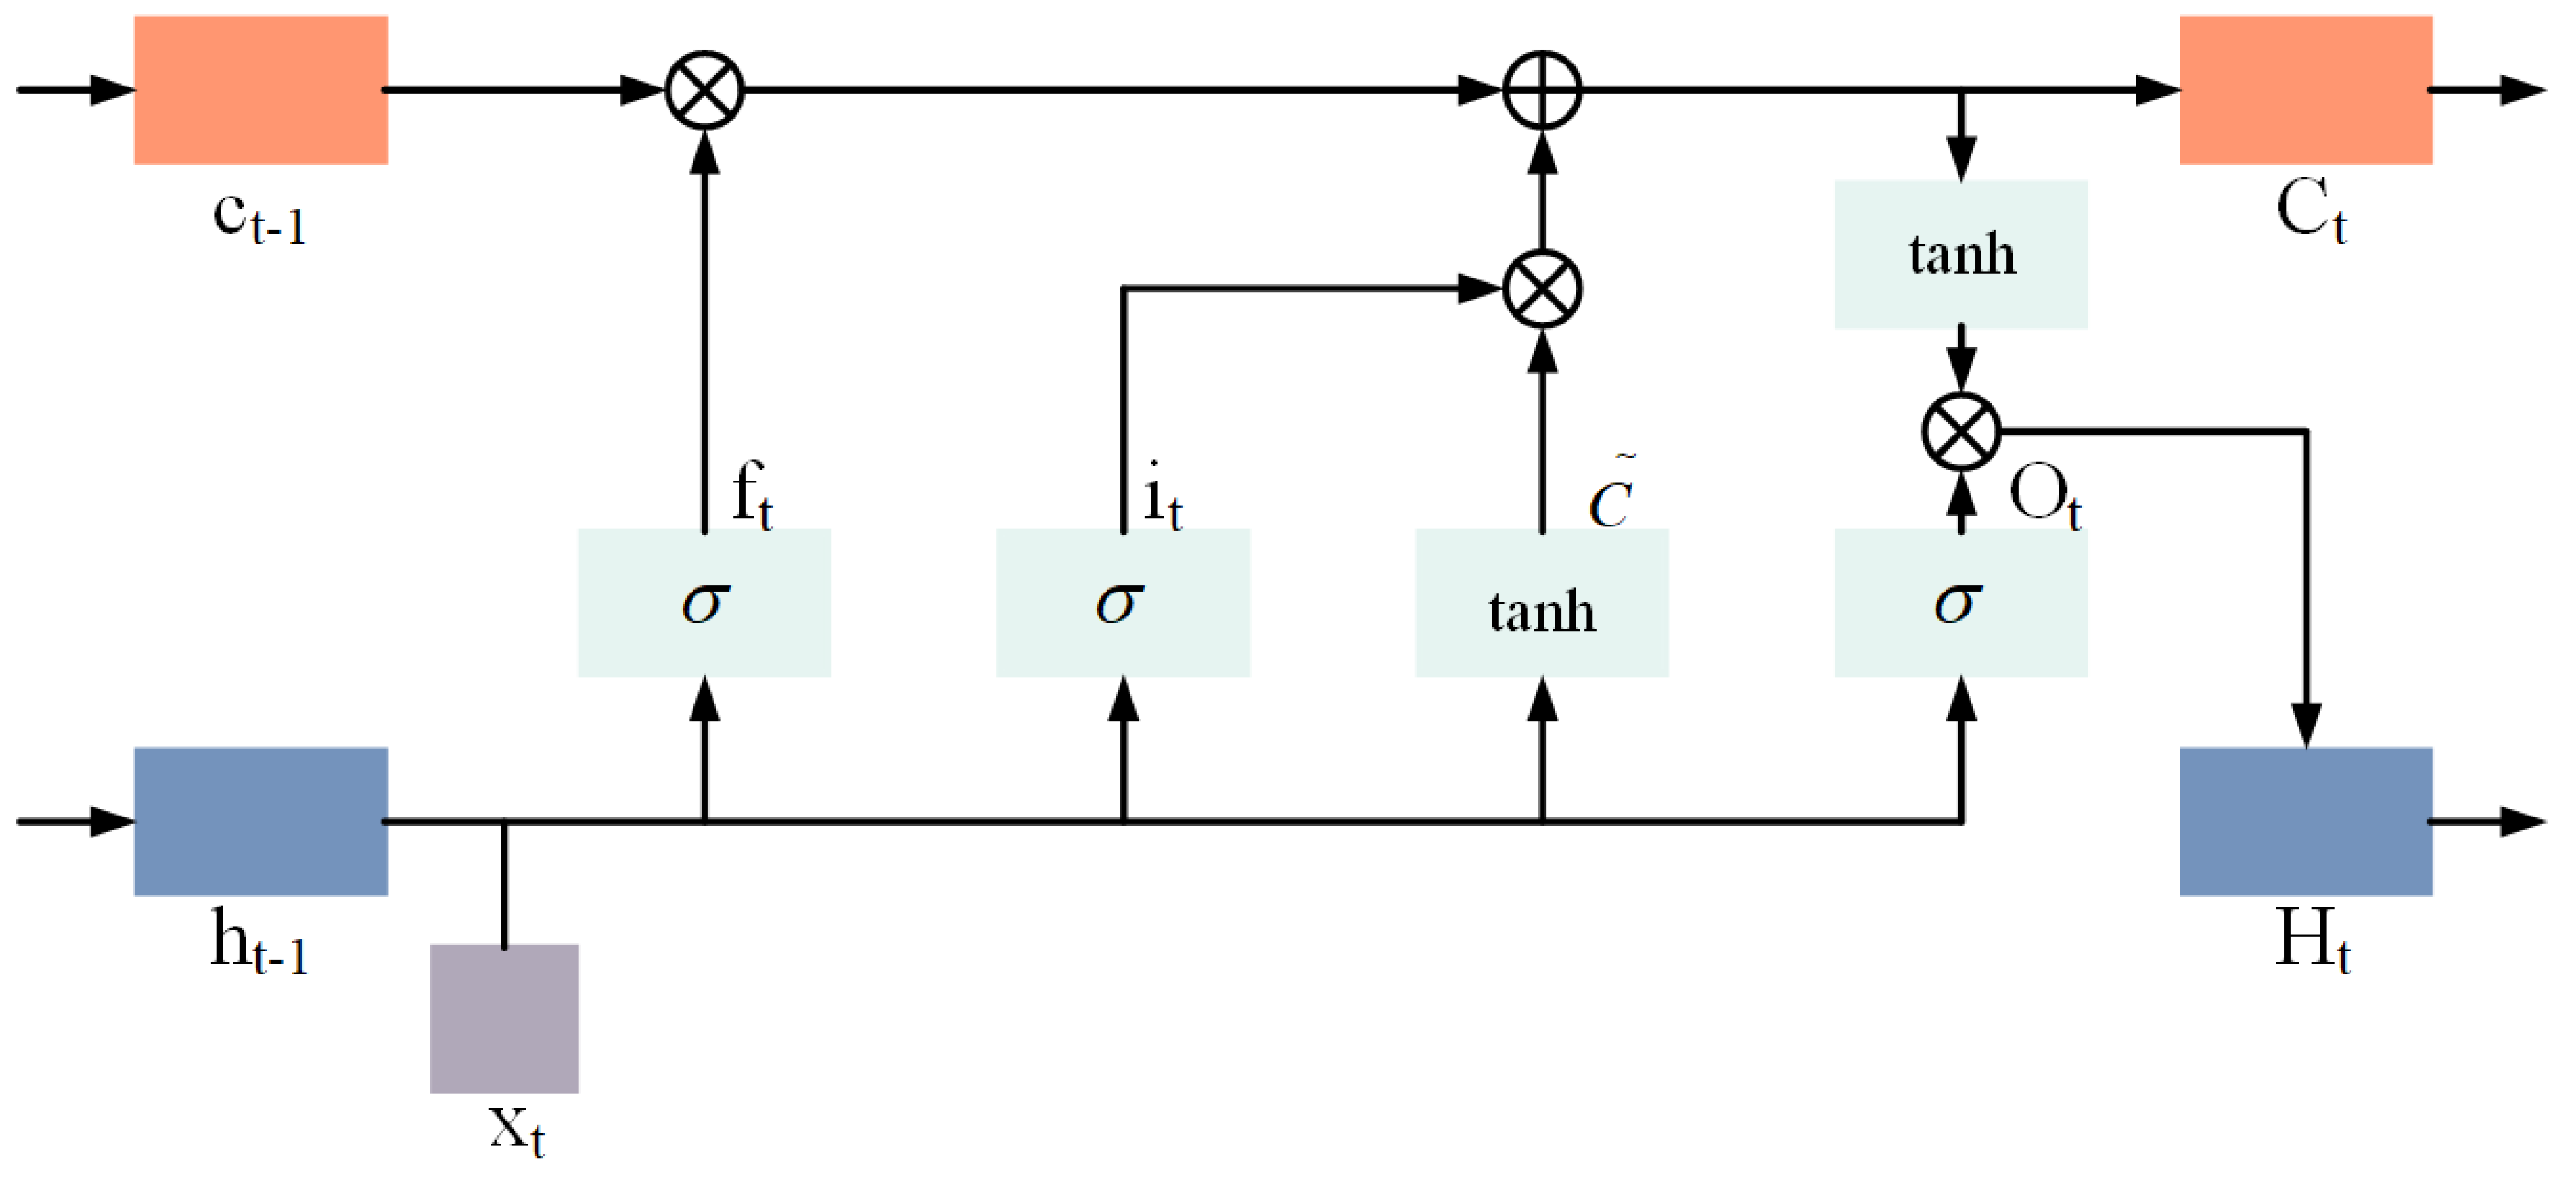
Figure 2 illustrates the structure of the hidden layer neuron of the LSTM. At a given moment, the input to a neuron in the LSTM consists mainly of the sequence input Xt, the previous moment state ht−1 of the hidden layer, and the previous moment state ct−1 of the memory unit. Firstly, the useless information is filtered out through the forgetting gate:
f t = σ ( W f [ h t 1 , x t ] + b f )  
where ft, Wf, and bf are the calculated results, weight matrix, and bias term of the forgetting gate, respectively. σ denotes the sigmoid activation function.
The Input gate update status is as follows:
i t = σ ( W i [ h t 1 , x t ] + b i )  
C t = tanh ( W c [ h t 1 , x t ] + b c ]  
C t = f t c t 1 + i t C t  
where it, Wi, and bi are the calculated results, weight matrix, and bias term of the input gate, respectively. C is the intermediate cell state, and Wc and bc are the corresponding weight matrices and bias terms, respectively. tanh is the activation function and denotes the dot product.
Finally, the output is determined by the output gate:
O t = σ ( W o [ h t 1 , x t ] + b o ]  
H t = O t tanh ( C t )  
Ot, Wo, and bo are the computed results, weight matrix, and bias term of the output gate, respectively.

2.4. Sparrow Search Algorithm

The sparrow search algorithm (SSA) is a new swarm optimization algorithm proposed by Xue and Shen [30]. The inspiration for the SSA comes from the foraging behavior and anti-predation behavior of sparrows. The sparrow population can be generally divided into discoverers and joiners, and there are n sparrows in a population. Putting the population into a d-dimensional search space, the position of the i sparrow is Xi = [xi1, xi2, …,xid] and the fitness of the i sparrow is Fi = f([xi1, xi2, …, xid]). The fitness of all n sparrows can be expressed as:
F x = [ f ( [ x 11 , x 12 ,   , x 1 d ] ) f ( [ x 21 , x 22 ,   , x 2 d ] ) f ( [ x n 1 , x n 2 ,   , x n d ] ) ]  
The discoverers determine the direction and area of the entire population, and its position is updated as described by the following equation.
x i j t + 1 = { x i j t exp ( i α i t e r max ) R 2 < S T x i j t + Q L R 2 S T
where t denotes the number of current iterations, itermax denotes the maximum number of iterations, α is a random number within 0–1, R2 ∈ [0, 1] and ST ∈ [0.5, 1] denote the warning value and safety value, respectively, with the position update strategy determined according to the relationship between them, Q is a random number obeying the standard normal distribution, and L is a 1 × d-dimensional all-1 matrix. In the alert state, the discoverers signal the population to move to the safe area. In the safe state, the discoverers expand the search area. The remaining sparrows are joiners and receive food through the discoverers, whose position is updated as described by the following equation.
x i j t + 1 = { Q exp ( x w o r s t t x i j t i 2 ) i > n / 2 x p t + 1 + | x i j t x p t + 1 | A + L otherwise
Xworst is the worst position and xp is the optimal position of the discoverers. A+ = AT(AAT)−1, A is a 1 × d-dimensional matrix with elements of 1 or −1. When the i joiner has a low fitness value, it will go to other locations to forage. In the rest of the cases, the joiners forage around the optimal position. There are also 10–20% of vigilantes in the population, whose positions are updated as described in the following equation.
x i j t + 1 = { x b e s t t + β | x i j t x b e s t t | f i > f g x i j t + K ( | x i j t x w o r s t t | ( f i f w ) + ε ) f i = f g  
x b e s t t is the current global best position, β is the step control parameter, which is a random number obeying standard normal distribution, K is a random number in the range of −1 to 1, fi is the current adaptation of sparrows, fg is the global best adaptation, fw is the global worst adaptation, and ε is a very small number to ensure that the denominator is not 0. fi > fg signifies that the sparrow is at the edge and has a high probability of being attacked. fi = fg, indicates that the sparrow in the middle of the population is aware of the danger and needs to move closer to other sparrows to reduce the risk of being predated.

2.5. SSA-LSTM

Figure 3 shows the process framework of the SSA-LSTM carbon emission prediction model, which consists of three main parts: a pre-processing module, an optimization module and a prediction module, and is described in detail as follows.
Step 1: Normalize the data to a range of 0–1. Due to the different scale of carbon emission impact factor data, in order to reduce the computing time, the data need to be normalized. The normalization formula is shown in Equation (13). Data normalization can also eliminate well the influence of magnitude on the prediction results.
Y = Y Y min Y max Y min  
Y is the normalized data and Y is the original data. Ymin and Ymax are the minimum and maximum values of the original data, respectively.
Step 2: Set the parameters of SSA, such as the number of populations and the maximum number of iterations of populations. Set the parameter search range of the LSTM model.
Step 3: Calculate the initial fitness value and update the position of the sparrow in SSA.
Step 4: Determine whether the iteration condition (reach the maximum number of iterations of SSA) is satisfied, and if the iteration condition is satisfied, output the optimal parameters of the LSTM model.
Step 5: Substitute the output optimal parameters into the LSTM model, train the model, and calculate the model prediction error.

3. Results and Discussion

3.1. Spatial and Temporal Evolution Characteristics of Carbon Emissions in the Yellow River Basin

Considering that Sichuan province belongs to the Yangtze River Economic Zone, the study area of this paper is determined as eight provinces in the Yellow River Basin, except Sichuan province, namely, Gansu, Henan, Inner Mongolia, Ningxia, Qinghai, Shaanxi, Shandong, and Shanxi. The carbon emissions of all provinces in the Yellow River Basin from 2000 to 2019 were summed to obtain the total carbon emissions in the basin, as shown in Figure 4. Carbon emissions in the Yellow River Basin show a continuous increase from 2000 to 2019. The period 2000–2010 was one of rapid growth, with total carbon emissions increasing from 768.91 million tons to 2443.85 million tons. This period was during an important stage of China’s rapid economic development, and the landing of heavy industrialization projects led to a rapid increase in carbon emissions. After 2010, the growth rate gradually became slower, and the total carbon emissions in the Yellow River Basin was 3336.99 million tons in 2019. The province with the highest carbon emissions is Shandong province, which is a large population province. The energy structure of Shandong province is dominated by coal, and the proportion of natural gas is much lower than the national average. The rough economic growth pattern also leads to Shandong having the highest carbon emissions [31]. Inner Mongolia and Shanxi also emit a large amount of CO2. Shanxi province has been the industrial base of China, and heavy industry is the pillar industry of Shanxi; therefore, Shanxi province has been at the forefront of carbon emissions with a large increase. Inner Mongolia is rich in coal resources, resulting in a local economy heavily dependent on energy and a single industrial structure. The province with the lowest carbon emissions is Qinghai, whose carbon emissions in 2019 were less than one-tenth of Shandong’s carbon emissions. At the level of the entire basin, carbon emissions are highest in the middle reaches of the basin, followed by the lower reaches, and the smallest in the upper reaches.
The carbon emission intensity of the Yellow River Basin can be obtained by quotienting the carbon emissions with GDP, as shown in Figure 5. The carbon emission intensity of the Yellow River Basin decreases from 5.187 t/10,000 RMB in 2000 to 1.672 t/10,000 RMB in 2019, showing a gradually decreasing trend. The highest point of carbon emission intensity in the Yellow River Basin was 5.529 t/10,000 RMB in 2001, and the carbon emission intensity in the Yellow River Basin was maintained at a high level until 2005, which reflects the low quality of economic development at that stage and the neglect of environmental management at the same time of economic development. After 2006, the carbon emission intensity of the Yellow River Basin has been steadily decreasing. The carbon emission intensity of Ningxia is the largest among the eight provinces. Although the carbon emission of Ningxia is small, its low GDP leads to its high carbon emission intensity. While developing its economy, Ningxia should focus on the quality of economic development, adjust the structure and mode of economic development, change the disordered economic development mode of high input and high consumption, and increase the proportion of low-carbon economy. Next is Inner Mongolia, which has a similar economic development approach to Ningxia. At the level of the whole basin, the carbon emission intensity gradually becomes smaller from upstream to downstream. Upstream provinces should actively learn from advanced technologies and change their economic development methods to promote sustainable economic and social development.

3.2. QAP Analysis Results

The huge differences in regional carbon emissions in the Yellow River Basin lead to inevitable conflicts of interest in designating and assigning emission reduction tasks. Analyzing the main factors of regional differences in carbon emissions in the Yellow River Basin is of great significance for the basin to coordinate emission reduction tasks and help achieve carbon peaks. According to previous studies, regional carbon emissions are mainly influenced by population, GDP per capita, industrial structure, urbanization, and energy intensity. Therefore, we chose these factors as the influencing factors of carbon emissions in the Yellow River Basin. Figure 6 shows the differences between provinces in the Yellow River Basin in 2019 in terms of population, GDP per capita, industrial structure, urbanization, and energy intensity, with the bluer the color, the greater the difference between the two provinces. The redder the color, the smaller the difference between the two provinces. It can be seen that the factors influencing carbon emissions differ significantly between different provinces in the basin. The difference between the population of Shandong and Henan provinces and that of Ningxia and Qinghai is obvious, which is consistent with the difference in carbon emissions. The difference in GDP per capita between Shandong and Gansu is the largest. There is a huge difference in industrial structure between Shaanxi and Gansu. The largest difference in urbanization rate is between Gansu and Inner Mongolia. There is also a great difference in energy intensity between Shaanxi and Ningxia, but the difference in carbon emissions between them is not significant. In Section 3.1, there is a huge difference in carbon emissions between Shandong and Qinghai, and the carbon emissions of Qinghai are less than 1/10 of the carbon emissions of Shandong. In the diagram of the difference in influencing factors, we can clearly see the difference between Qinghai and Shandong in population, GDP, and energy intensity; the difference between the two in GDP and energy intensity may be important factors of the difference in carbon emissions.
After analyzing the differences in carbon emission impacts among different provinces in the basin, we explored the effects of population, energy intensity, GDP per capita, urbanization rate, and industrial structure on regional differences in carbon emissions in the Yellow River basin, based on the established QAP analytical model.
Table 1 and Table 2 show the results of the QAP regression analysis for the Yellow River Basin from 2000–2009 and 2010–2019. The regression analysis shows the influence level of different factors on the regional differences in carbon emission. From the results of QAP analysis, it can be seen that the factors affecting the regional differences in carbon emissions in different periods are different, and the factors affecting carbon emissions from 2000–2009 were GDP per capita, population, and industrial structure. The impact of GDP per capita on carbon emission is the largest in that period, and the regression coefficient of GDP per capita difference is positive, indicating that the difference in GDP per capita exacerbates the regional differences in carbon emission, and the carbon emission in Yellow River Basin is influenced by economic development in that period. The regression coefficient of population differences is also positive, indicating that uneven distribution of population aggravates the regional differences in carbon emission. The regression coefficients of energy intensity differences and urbanization differences do not pass the significance test, indicating that the carbon emission regions in the Yellow River Basin are less influenced by them at this stage. The regression coefficient of industrial structure difference is negative, implying that the industrial structure difference has a negative impact on the carbon emission differences in the Yellow River Basin. The factors affecting carbon emissions in 2010–2019 were population, GDP per capita, industrial structure, and urbanization. The regression coefficients of energy intensity differences do not pass the significance test, indicating that they have a small impact on influencing carbon emissions in the Yellow River Basin region. Unlike the results of the analysis from 2000–2009, the factor that has the greatest impact on carbon emissions in the 2010–2019 period was population, which has a significant positive effect on regional differences in carbon emission. The continuous increase in population leads to the need to consume a large amount of resources, which leads to the deterioration of the environment. From the perspective of reducing carbon emissions, densely populated regions should strictly control their populations, actively promote low-carbon lifestyles, strengthen carbon emission management, and strive to reduce carbon emissions per capita. GDP per capita is no longer the dominant factor influencing carbon emissions in the period, but its regression coefficient on carbon emissions gradually increases, indicating that its influence on carbon emission differences gradually increases and is positive. Economic growth has been considered to be an important factor in the continued growth of carbon emissions [32]. Considering the important impact of GDP on carbon emissions, low-carbon technologies should be actively adopted when developing the economy, which can promote sustainable economic and environmental development. Urbanization started to have an impact on carbon emission differences after 2010 and is as positive as population and GDP per capita. The process of urbanization inevitably increases carbon emissions, and urban expansion should learn from previous experiences, actively adopt low-carbon construction technologies for new urban areas, strengthen carbon emission management, and make efforts to reduce the impact of urbanization on carbon emissions.

3.3. SSA-LSTM Forecasting Results

We chose population, GDP per capita, industrial structure, energy intensity, and urbanization rate as the input variables of the proposed model, and carbon emissions are the output variables of the model. Due to the small amount of data on carbon emissions in the Yellow River Basin, we chose the samples from 2000–2016 as the training set and the samples from 2015–2019 as the test set. The SSA was used to find the optimal parameters of the LSTM, and the parameter search range is shown in Table 3. To obtain the best results from the model, the range of values of the model parameters was based on previous studies and our iterative experiments [33,34].
The sample data were substituted into the proposed SSA-LSTM model. The model prediction results are shown in Figure 7. The SSA-LSTM predicted results and the actual carbon emission curve basically overlap, and the percentage error between the model prediction results and the actual value in 2018 is only 0.4%. The maximum percentage error is only 1% in the whole test sample. The prediction accuracy of the LSTM model is unsatisfactory, with the maximum percentage error being 3%. The SSA-LSTM model is better than the LSTM, and it proves that SSA has a significant effect on the improvement of the LSTM model. The long short-term memory network optimized by particle swarm optimization (PSO-LSTM) and a back propagation neural network (BPNN), as compared to the SSA-LSTM models, can also predict the trend in carbon emissions, but the deviation from the actual value is relatively large, and they cannot make accurate predictions of carbon emissions in the Yellow River basin. In order to analyze the prediction accuracy of the four models intuitively, from the perspective of quantification, we chose the mean absolute error (MAE), root mean squared error (RMSE), and mean absolute percentage error (MAPE) as the evaluation index of the models.
M A E = 1 N i = 1 N | E p E a |  
R M S E = 1 N i = 1 N ( E p E a ) 2  
M A P E = 1 N i = 1 N | E p E a E a |  
Ep is the predicted value of carbon emission and Ea is the actual value of carbon emission.
Table 4 demonstrates the evaluation metrics of several models. It can be seen that the SSA-LSTM model has the best results for both metrics, followed by the PSO-LSTM. Compared to the LSTM model, the MAE, RMSE, and MAPE of the SSA-LSTM model are reduced by 45.80%, 43.68%, and 44.38%, respectively, which indicate that the SSA can improve the carbon emission prediction accuracy of the model well. The BPNN and LSTM models have the worst results.

3.4. Discussion

An important topic of carbon emission research is the accounting and prediction of carbon emissions, which is directly related to the formulation of emission reduction measures and implementation of the measures. Many studies have been conducted in the past to account for China’s overall carbon emissions, and the factors influencing China’s carbon emissions have been well analyzed. Many studies also exist for China’s high carbon emission industries, and these studies have advanced the field of carbon emission research in China and provided guidance for the development of China’s emission reduction policies [35]. Some scholars have studied carbon emissions in specific Chinese provinces, but few studies have been conducted for a specific region of China.
The Yellow River Basin is of great importance for China’s economic development and ecological security. The study of carbon emissions in the Yellow River Basin is important for the precise formulation of emission reduction measures in the region. Previous studies on influencing factors have focused on decomposition analysis, which provides a good opportunity for us to analyze the influencing factors of carbon emissions in the Yellow River Basin from the perspective of differences. The results of the analysis of carbon emission influencing factors using QAP show that the main factors affecting carbon emissions in the Yellow River Basin are not invariable, and the influence of population and GDP per capita on carbon emissions should be fully considered when formulating policies. The feasibility of machine learning prediction has been well proven in many research areas [36,37,38], and we applied machine learning algorithms to build a carbon emission prediction model for the Yellow River basin. In building the model, we used a new, recently proposed swarm optimization algorithm, SSA, which is different from the already widely used algorithms, such as PSO and GA. This is a new attempt to use SSA on carbon emission prediction models, and the prediction results of the model show that SSA can significantly improve the prediction accuracy of the models. In recent years, China has made many efforts to achieve carbon peaking, and the Yellow River Basin, as an important region, should take active measures to reduce carbon emissions. An accurate carbon emission model is necessary to guide the policy making.

4. Conclusions and Policy Recommendations

4.1. Conclusions

This study accounts for the carbon emissions in the Yellow River Basin from 2000 to 2019. QAP analysis was used to analyze the effects of population, GDP per capita, industrial structure, urbanization rate, and energy intensity on carbon emissions in the Yellow River Basin from the perspective of differences. In this paper, we proposed a machine learning prediction model, namely, the long short-term memory network optimized by the sparrow search algorithm. We applied the proposed model to the prediction of carbon emissions in the Yellow River Basin. The results of the study can provide guidance for the development of emission reduction measures in the Yellow River Basin.
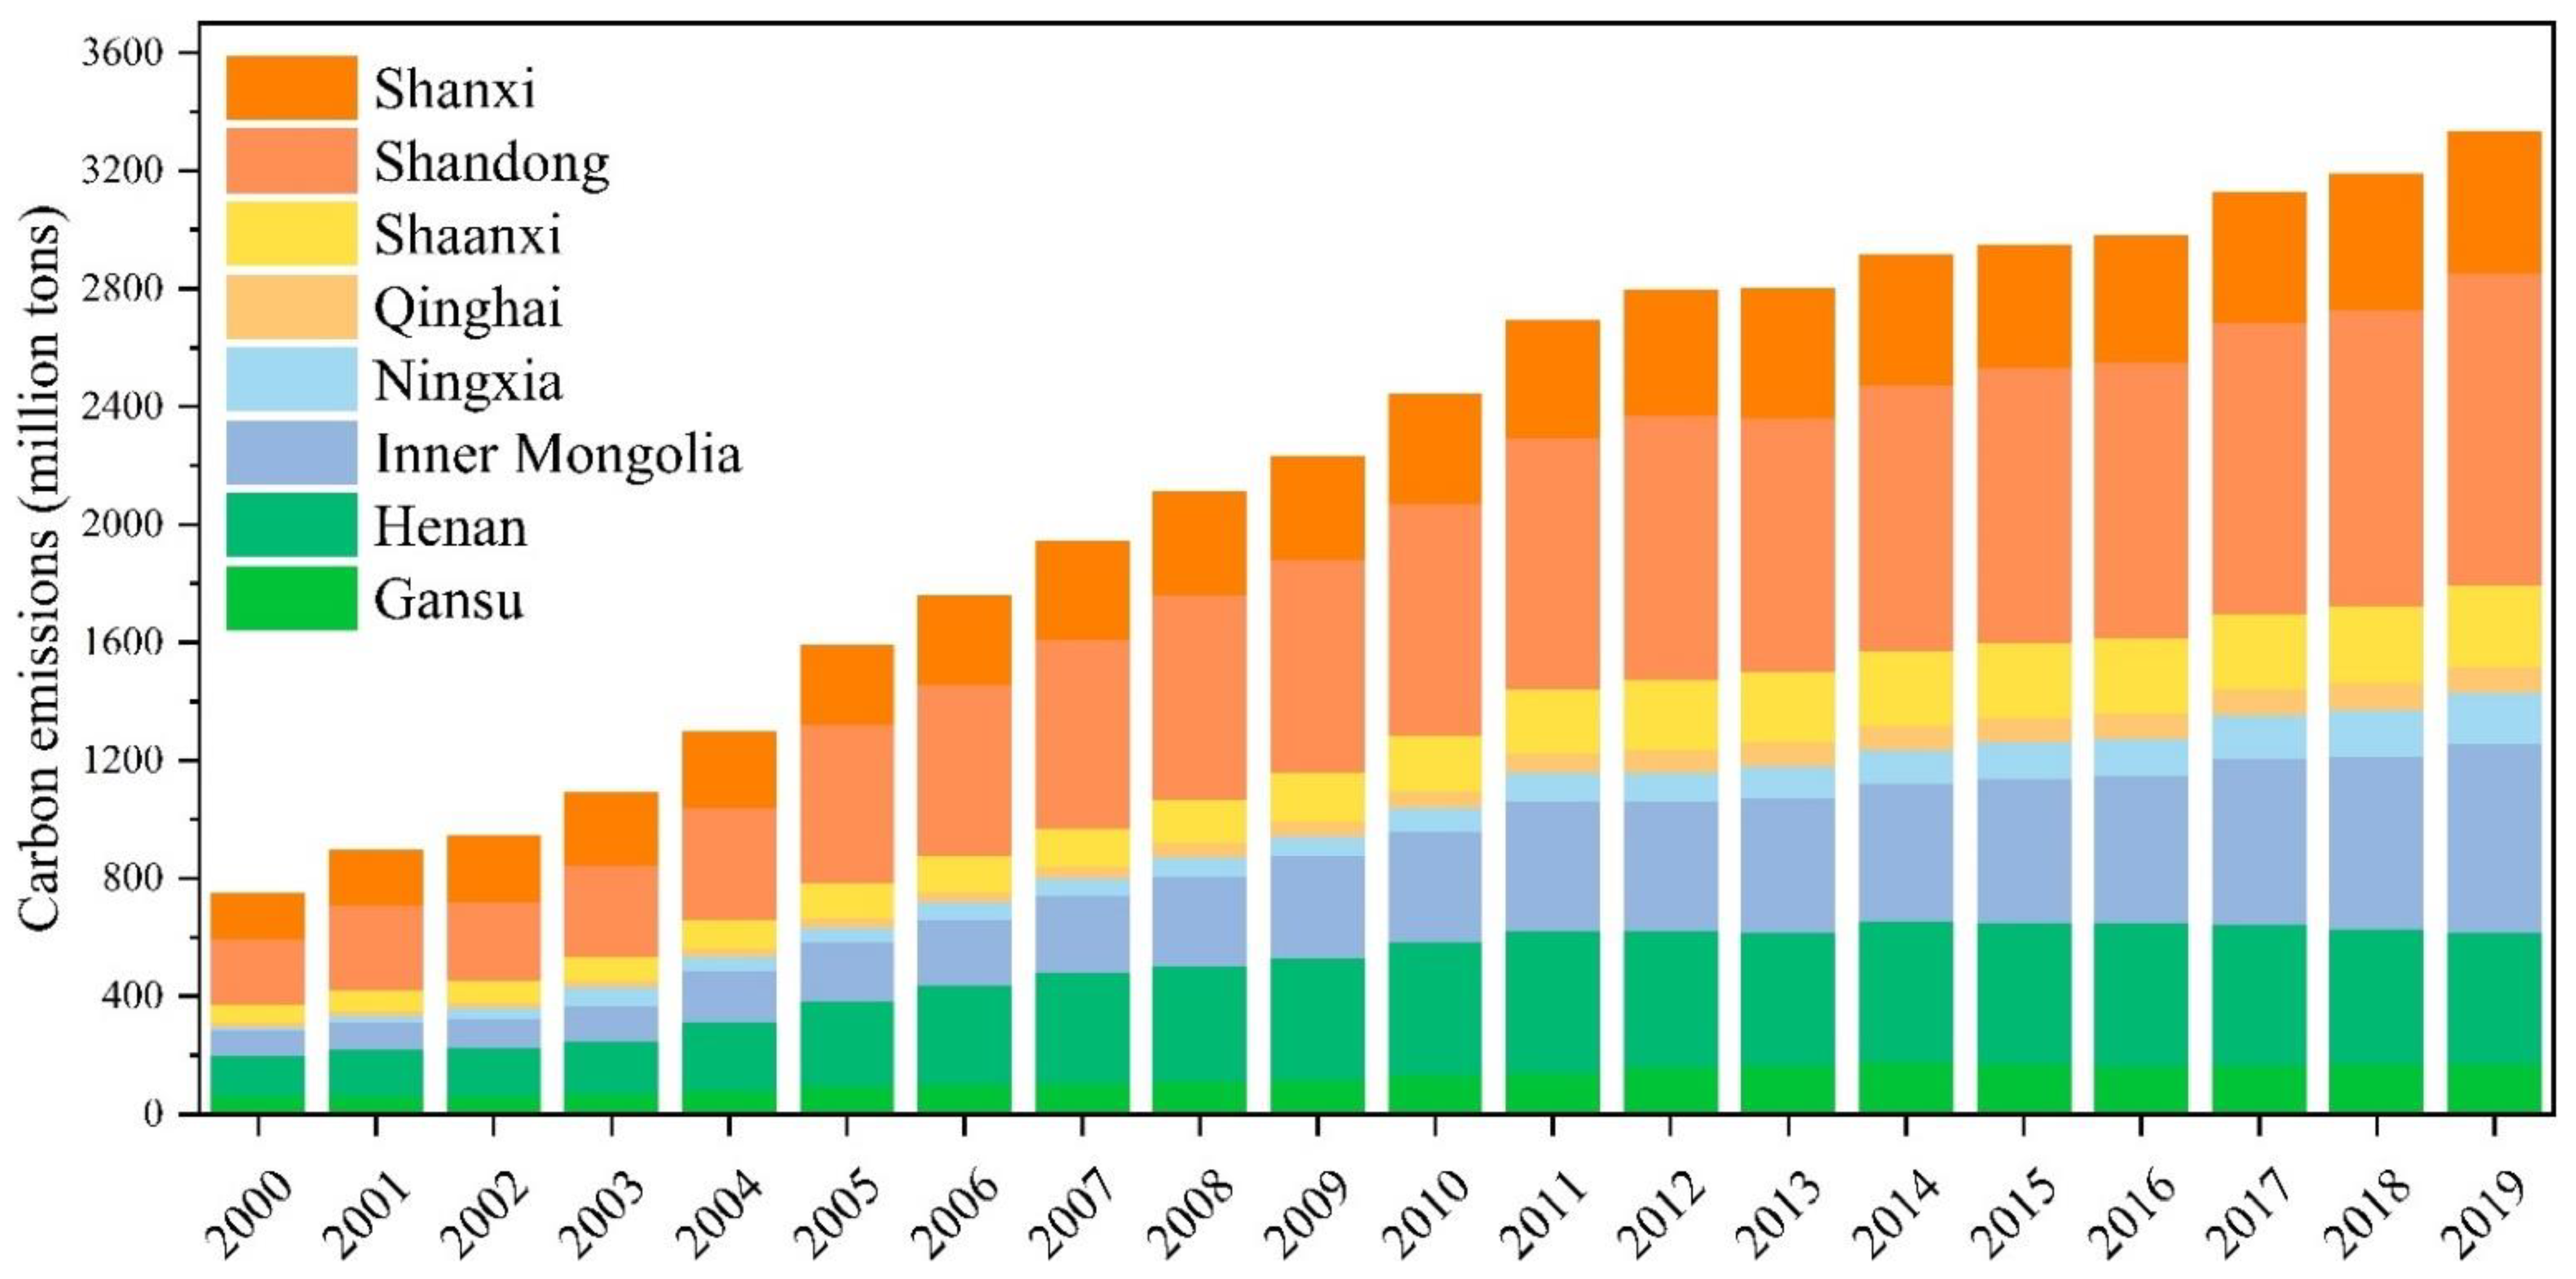
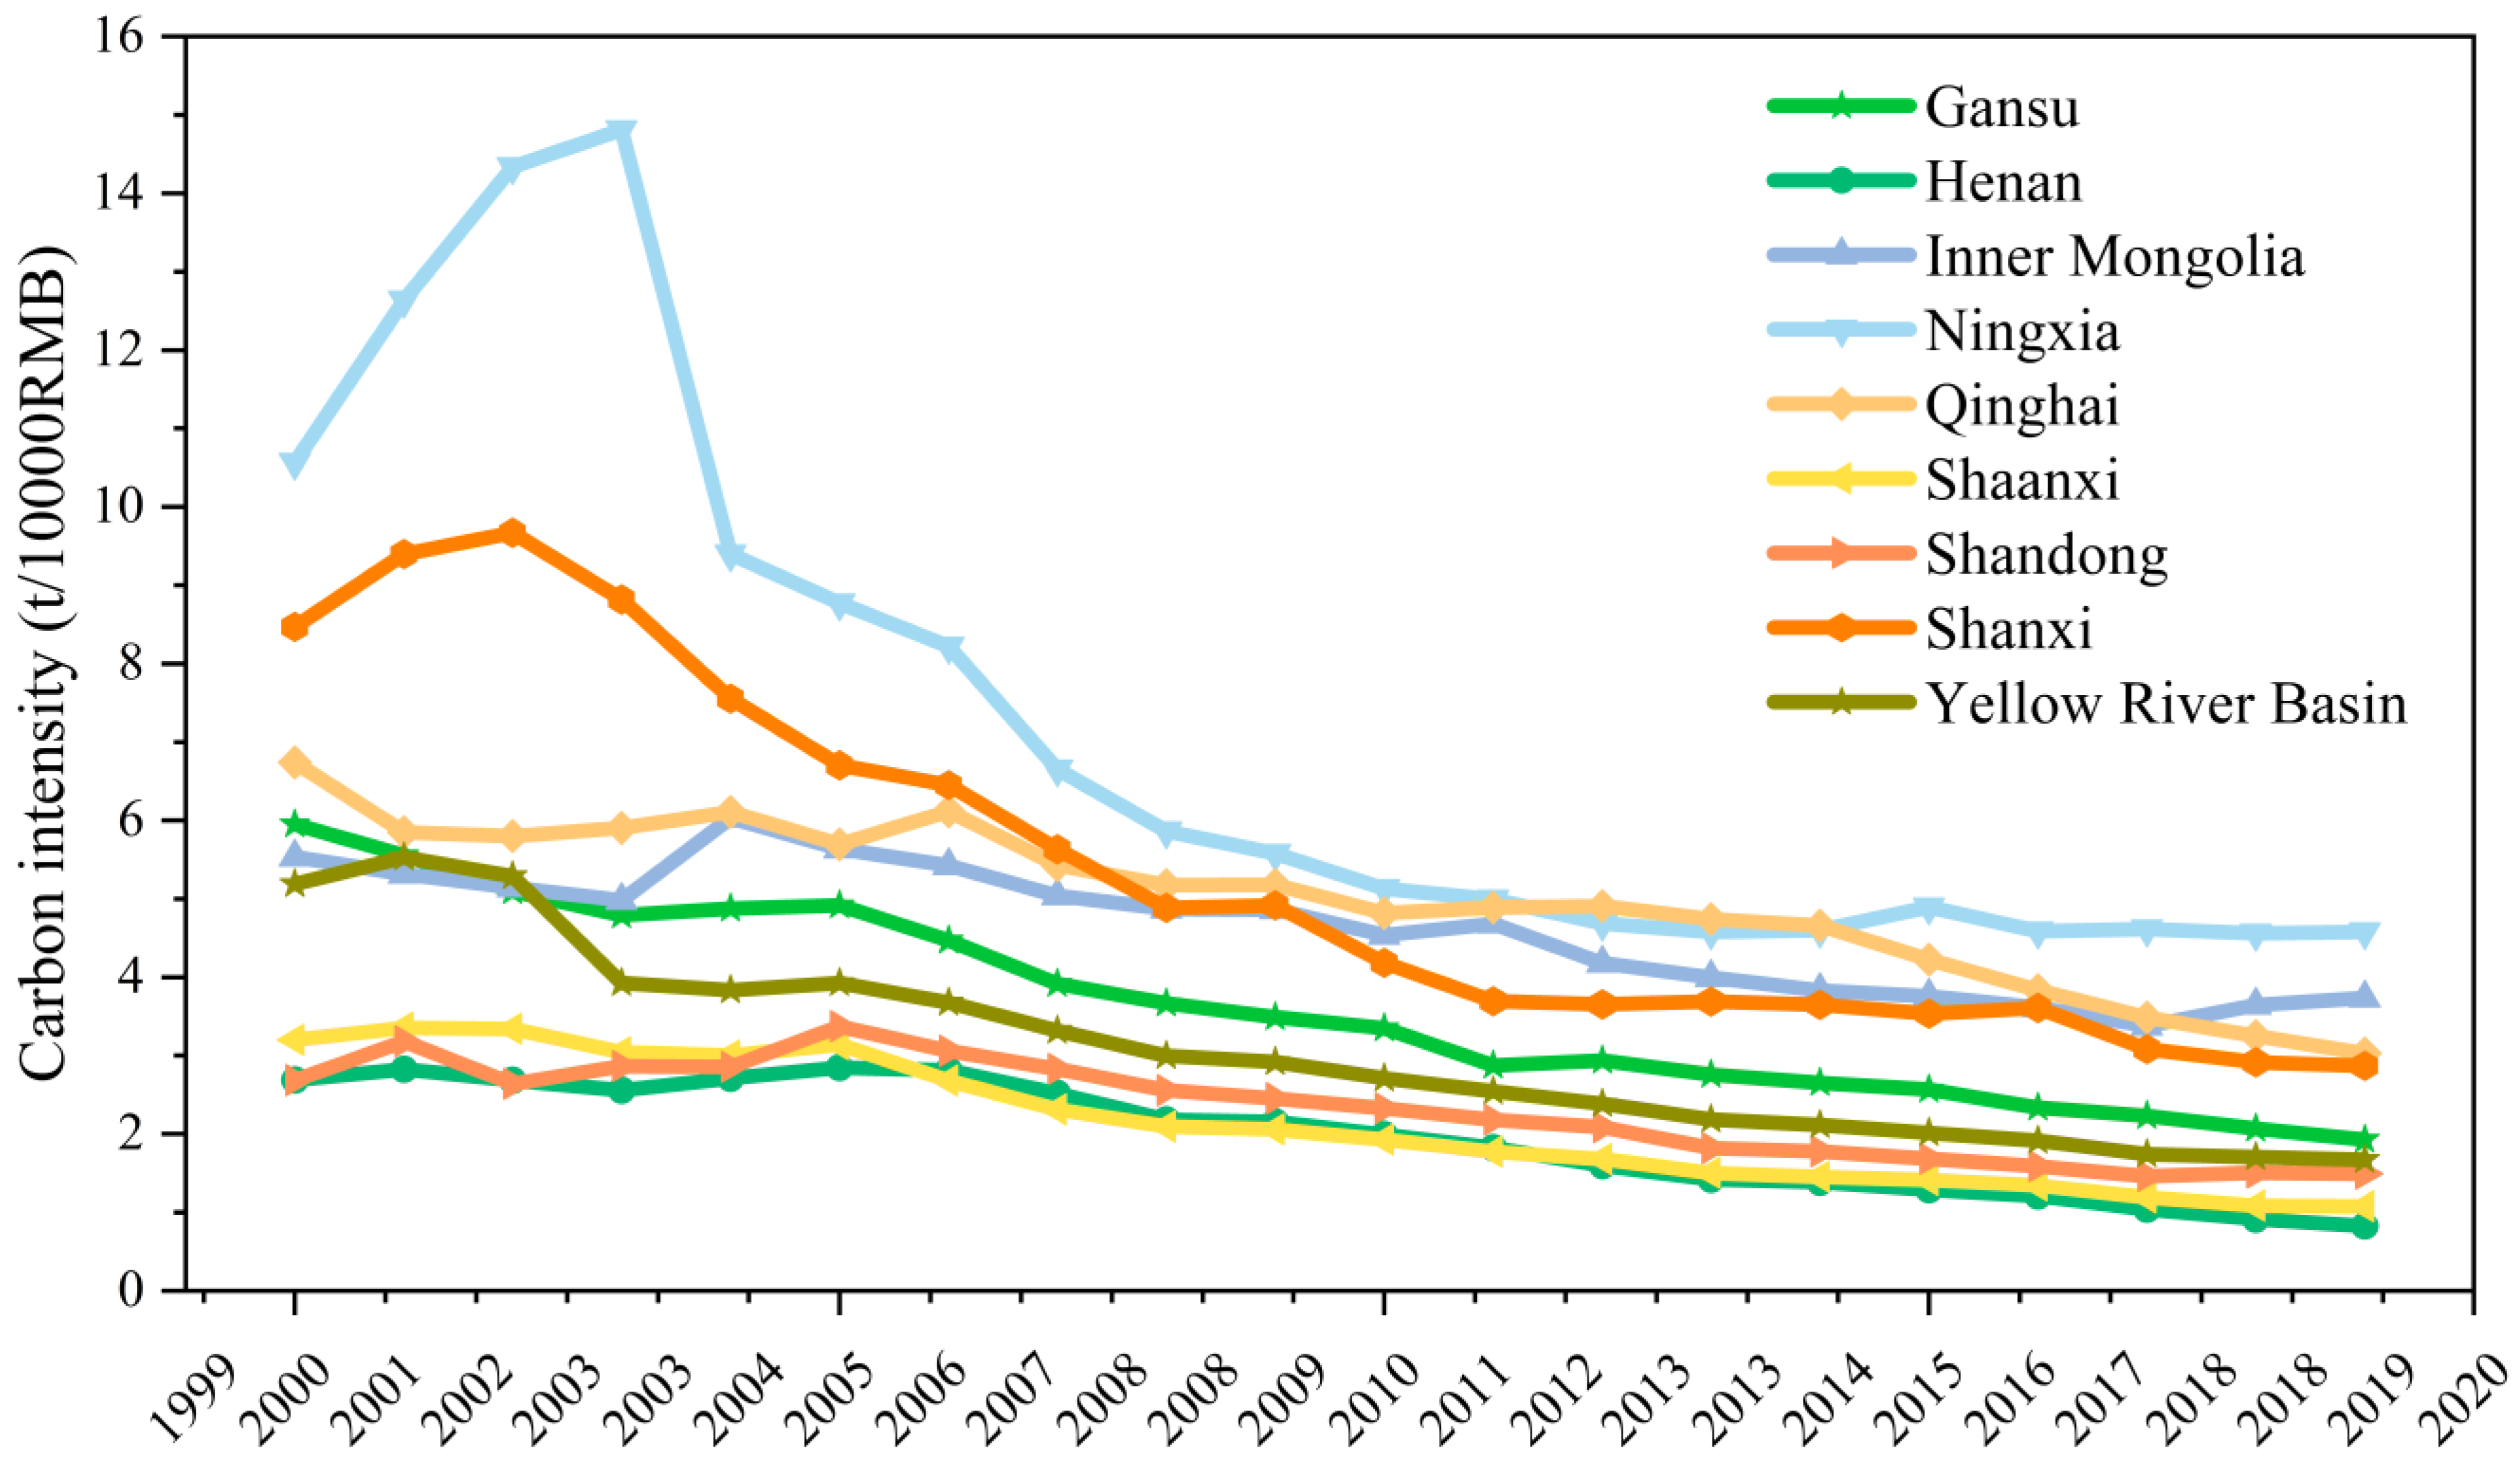
Carbon emissions in the Yellow River Basin showed a continuous increasing trend from 2000 to 2019, and the total carbon emissions increased from 768.91 million tons to 3336.99 million tons, with significant inter-provincial differences. The carbon emissions of Qinghai are less than one-tenth that of Shandong, the highest carbon emitter. The carbon emission intensity of the Yellow River Basin decreased from 5.187 t/10,000 RMB in 2000 to 1.672 t/10,000 RMB in 2019, showing a gradually decreasing trend. Qinghai has the highest carbon emission intensity at 4.577 t/10,000 RMB; although its carbon emissions are small, its low GDP leads to its very high carbon emission intensity.
The results of the QAP regression analysis show that the influence level of factors on carbon emissions in the Yellow River Basin is different in different periods, and the dominant factor of the carbon emission difference in the Yellow River Basin from 2000 to 2010 was GDP per capita. After 2010, the dominant factor affecting carbon emissions in the Yellow River Basin was population.
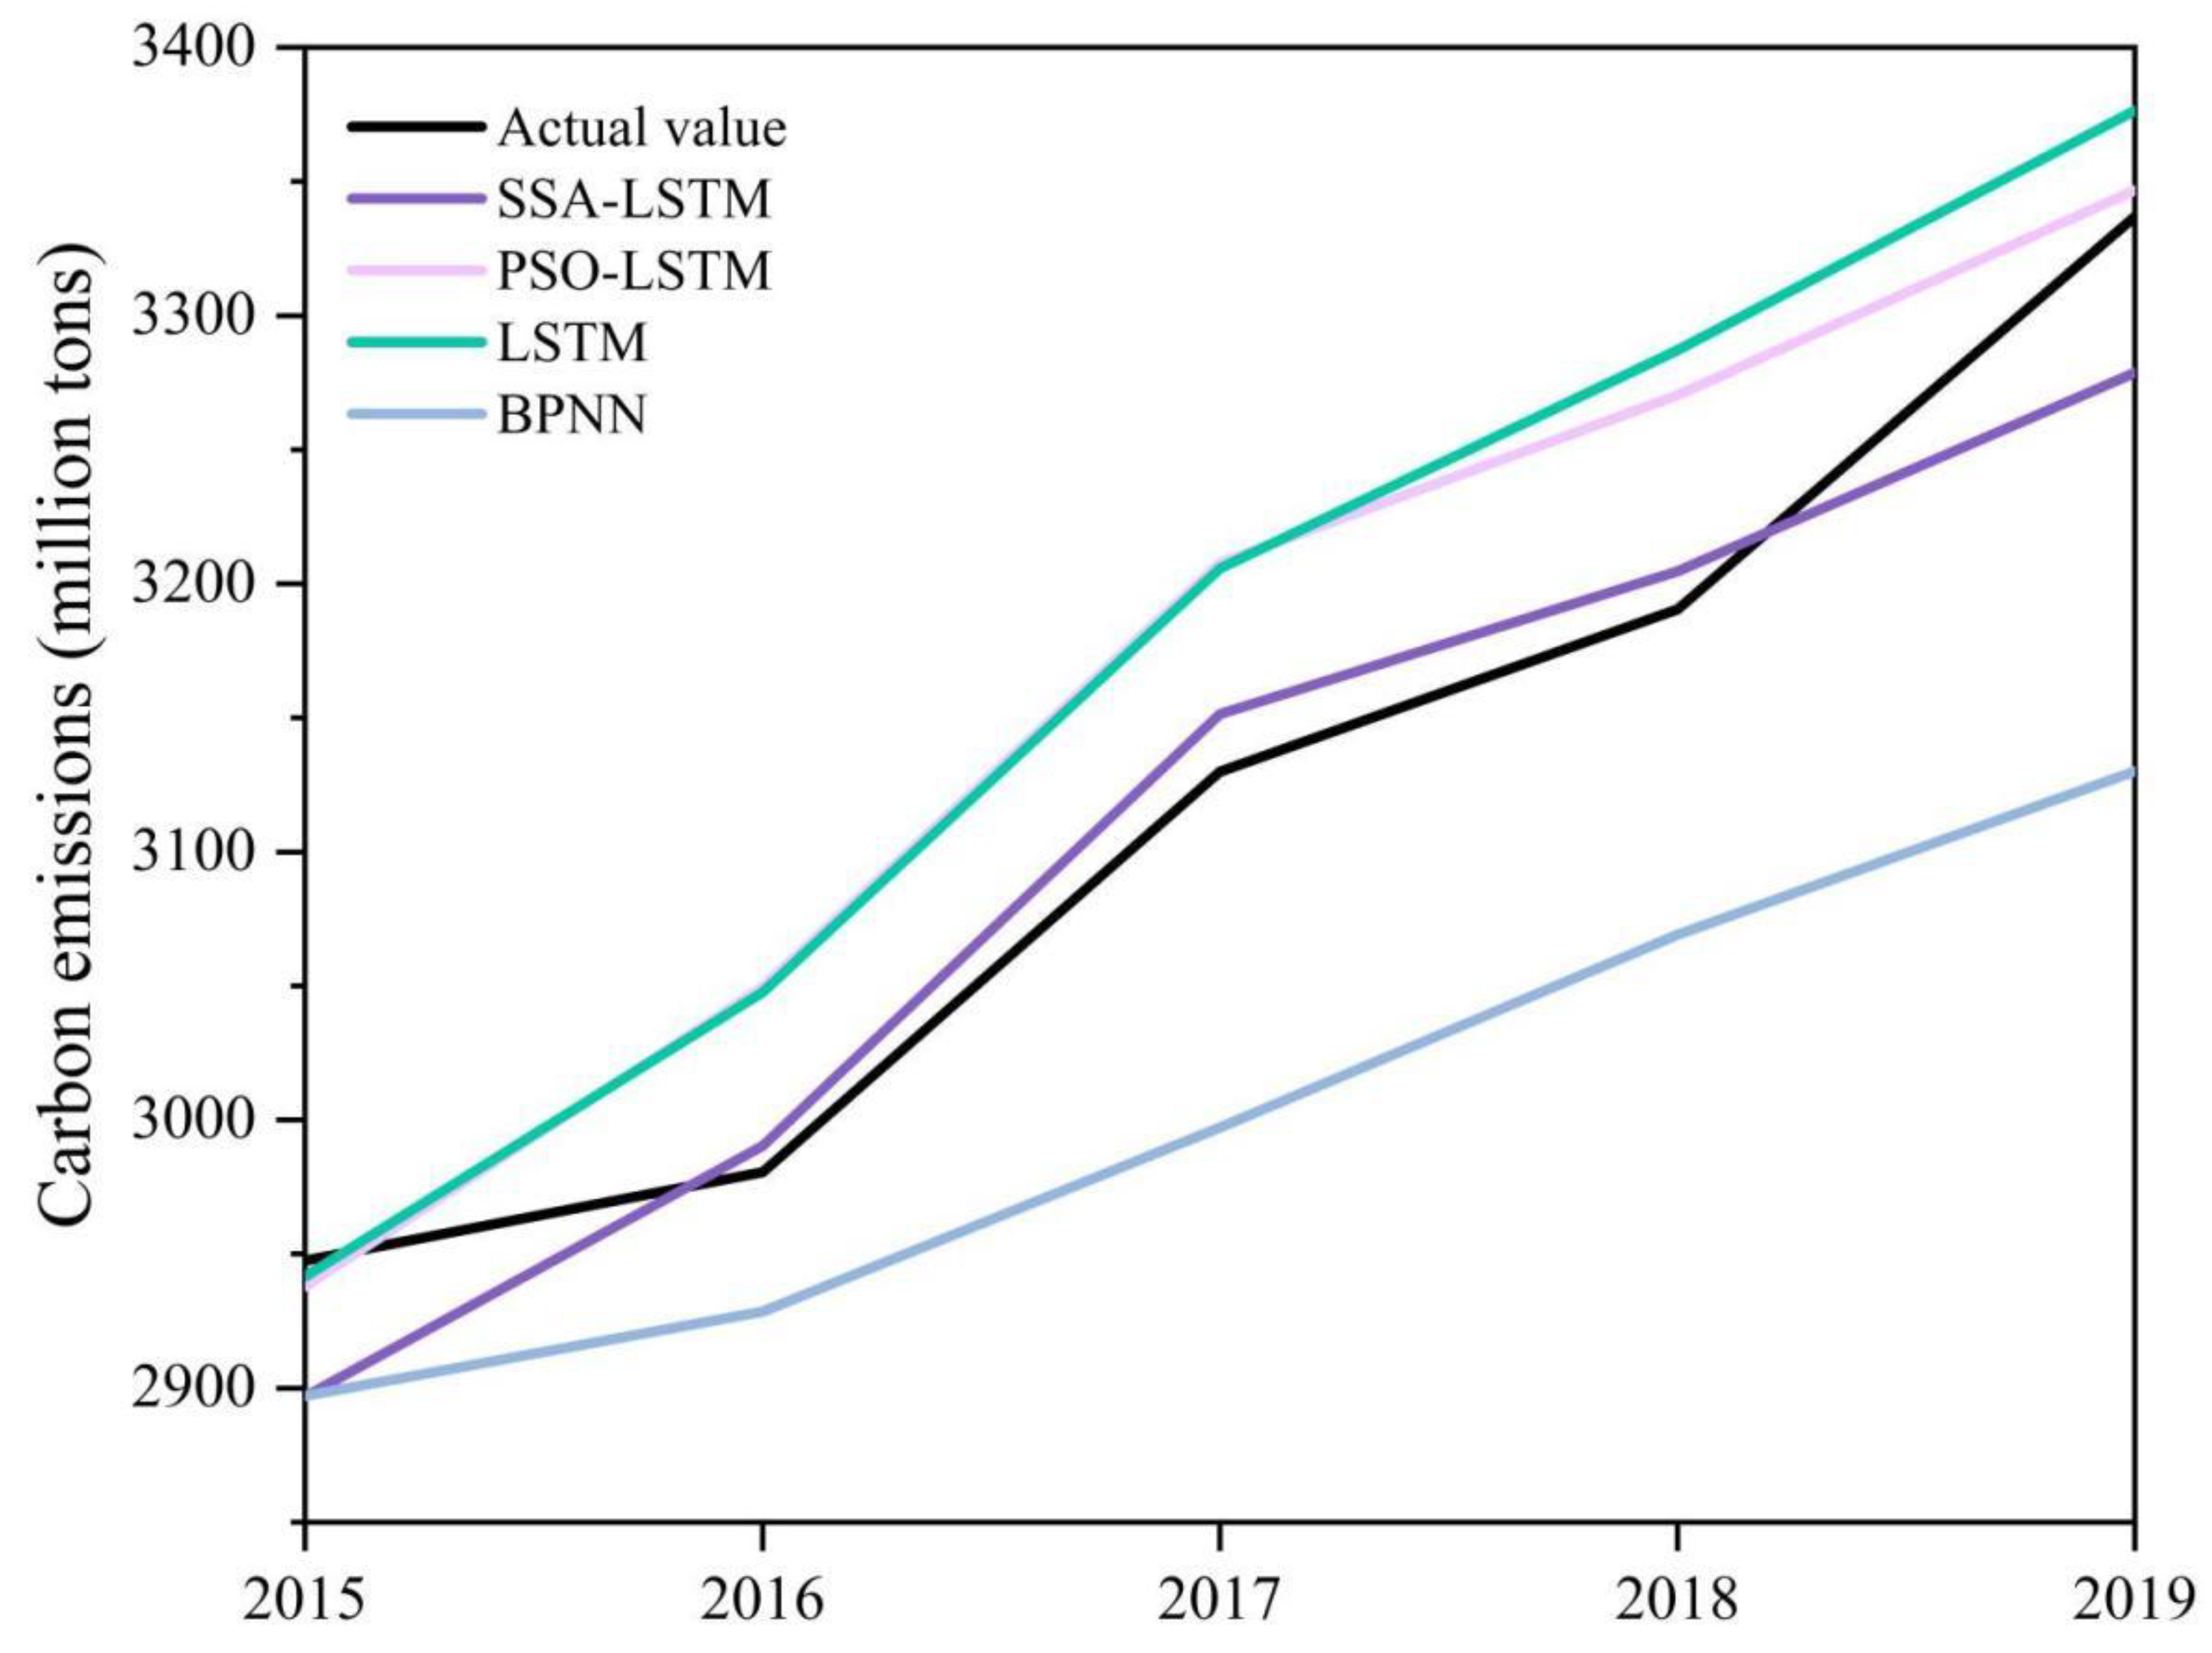
The SSA-LSTM model can accurately predict carbon emissions in the Yellow River basin, and the MAPE of the proposed model is only 0.0099. Compared with the single LSTM model, the MAE, MSE and MAPE of the SSA-LSTM model were reduced by 45.80%, 43.68% and 44.38%, respectively, indicating that SSA can significantly improve the prediction accuracy of the LSTM model. The MAPE of the PSO-LSTM and BPNN models are 0.0155 and 0.0370, respectively, which validate the advantages of the proposed models.

4.2. Policy Implications

Considering the inter-provincial differences in carbon emissions in the Yellow River Basin, it is important to pay attention to not only high carbon emission areas such as Shandong, Inner Mongolia and Shaanxi, but also high carbon emission intensity areas such as Ningxia and Inner Mongolia in formulating emission reduction policies. The factors affecting the carbon emission differences in the Yellow River Basin are mainly population and GDP per capita. When planning carbon emission reduction tasks, inter-provincial differences should be fully considered and reasonable carbon emission reduction tasks should be assigned according to the basic conditions of each province. For example, Shandong is not only a region with large carbon emissions, but also a province with a large population. The carbon emission potential of Shandong can be fully explored according to the influence of population on the province.
Inter-regional synergy should be paid attention to in the Yellow River basin and the direction, goals, and programs for overall carbon reduction in the basin should be formulated. The division of labor and cooperation among different provinces should be actively guided to improve the efficient use of resources by building regional industrial chains and supply chains to build a new pattern of high-quality ecological and economic development. Provinces with high carbon emission intensity (such as Ningxia and Qinghai) should actively learn from the technologies of developed regions in the Yellow River basin (such as Shaanxi) to promote the development of a low-carbon economy. The basin as a whole should also learn from the experience of low-carbon development outside the basin to establish and improve carbon emission reduction mechanisms. For example, it can strengthen cooperation with the Yangtze River Economic Zone, formulate relevant preferential policies, and promote cooperation with access to low-carbon technologies.

Author Contributions

Funding acquisition, X.H.; Methodology, H.W. and C.L.; Supervision, Z.X.; Writing—original draft, J.Z.; Writing—review and editing, L.K. and H.C. All authors have read and agreed to the published version of the manuscript.

Funding

This work was supported by the Provincial quality project of Anhui Provincial Department of Education (2016tszy042) and the National Natural Science Foundation of China (grant no. 52079128).

Institutional Review Board Statement

Not applicable.

Informed Consent Statement

Not applicable.

Data Availability Statement

The dataset is available on request.

Conflicts of Interest

The authors declare no conflict of interest.

Nomenclature and Abbreviations

LMDIlogarithmic mean divisia indexPSO particle swarm optimization
QAPquadratic assignment procedureBPNN back propagation neural network
GA genetic algorithmMAE mean absolute error
LSTMlong short-term memoryRMSE root mean squared error
RNNrecurrent neural networkMAPE mean absolute percentage error
SSAsparrow search algorithm

References

  1. Williams, R.G.; Roussenov, V.; Goodwin, P.; Resplandy, L.; Bopp, L. Sensitivity of Global Warming to Carbon Emissions: Effects of Heat and Carbon Uptake in a Suite of Earth System Models. J. Clim. 2017, 30, 9343–9363. [Google Scholar] [CrossRef] [Green Version]
  2. Wang, X.; Zhang, Y. Carbon Footprint of the Agricultural Sector in Qinghai Province, China. Appl. Sci. 2019, 9, 2047. [Google Scholar] [CrossRef] [Green Version]
  3. Sun, H.; Park, Y. CO2 Emission Calculation Method during Construction Process for Developing BIM-Based Performance Evaluation System. Appl. Sci. 2020, 10, 5587. [Google Scholar] [CrossRef]
  4. de Vries, G.J.; Ferrarini, B. What Accounts for the Growth of Carbon Dioxide Emissions in Advanced and Emerging Economies? The Role of Consumption, Technology and Global Supply Chain Participation. Ecol. Econ. 2017, 132, 213–223. [Google Scholar] [CrossRef]
  5. Jiang, M.H.; An, H.Z.; Gao, X.Y.; Jia, N.A.; Liu, S.Y.; Zheng, H.L. Structural decomposition analysis of global carbon emissions: The contributions of domestic and international input changes. J. Environ. Manag. 2021, 294, 112942. [Google Scholar] [CrossRef]
  6. Lian, L.; Lin, J.; Yao, R.; Tian, W. The CO2 emission changes in China’s transportation sector during 1992–2015: A structural decomposition analysis. Environ. Sci. Pollut. Res. 2020, 27, 9085–9098. [Google Scholar] [CrossRef]
  7. Rosita, T.; Estuningsih, R.D.; Ningsih, D.P.; Zaekhan; Nachrowi, N.D. Exploring the mitigation poten-tial for carbon dioxide emissions in Indonesia’s manufacturing industry: An analysis of firm characteristics. Carbon Manag. 2022, 13, 17–41. [Google Scholar] [CrossRef]
  8. Zhang, W.; Li, K.; Zhou, D.Q.; Zhang, W.R.; Gao, H. Decomposition of intensity of energy-related CO2 emission in Chinese provinces using the LMDI method. Energy Policy 2016, 92, 369–381. [Google Scholar] [CrossRef]
  9. Jiang, X.-T.; Wang, Q.; Li, R.R. Investigating factors affecting carbon emission in China and the USA: A perspective of stratified heterogeneity. J. Clean. Prod. 2018, 199, 85–92. [Google Scholar] [CrossRef]
  10. Ge, X.; Wang, Y.; Zhu, H.; Ding, Z. Analysis and forecast of the Tianjin industrial carbon dioxide emissions resulted from energy consumption. Int. J. Sustain. Energy 2017, 36, 637–653. [Google Scholar] [CrossRef]
  11. Perez-Suarez, R.; Lopez-Menendez, A.J. Growing green? Forecasting CO2 emissions with Environmental Kuznets Curves and Logistic Growth Models. Environ. Sci. Policy 2015, 54, 428–437. [Google Scholar] [CrossRef]
  12. Magazzino, C.; Mele, M.; Schneider, N. A machine learning approach on the relationship among solar and wind energy production, coal consumption, GDP, and CO2 emissions. Renew. Energy 2021, 167, 99–115. [Google Scholar] [CrossRef]
  13. Deng, C.; Hu, H.X.; Zhang, T.L.; Chen, J.L. Rock slope stability analysis and charts based on hybrid online sequential extreme learning machine model. Earth Sci. Inform. 2020, 13, 729–746. [Google Scholar] [CrossRef]
  14. Javanmard, M.E.; Ghaderi, S.; Hoseinzadeh, M. Data mining with 12 machine learning algorithms for predict costs and carbon dioxide emission in integrated energy-water optimization model in buildings. Energy Convers. Manag. 2021, 238, 114153. [Google Scholar] [CrossRef]
  15. Chai, Z.Y.; Yan, Y.B.; Simayi, Z.; Yang, S.T.; Abulimiti, M.; Wang, Y.Q. Carbon emissions index decom-position and carbon emissions prediction in Xinjiang from the perspective of population-related factors, based on the combination of STIRPAT model and neural network. Environ. Sci. Pollut. Res. 2022, 29, 31781–31796. [Google Scholar]
  16. Jena, P.R.; Managi, S.; Majhi, B. Forecasting the CO2 Emissions at the Global Level: A Multilayer Artificial Neural Network. Model. Energ. 2021, 14, 6336. [Google Scholar] [CrossRef]
  17. Javanmard, M.E.; Ghaderi, S. A Hybrid Model with Applying Machine Learning Algorithms and Optimization Model to Forecast Greenhouse Gas Emissions with Energy Market Data. Sustain. Cities Soc. 2022, 82, 103886. [Google Scholar] [CrossRef]
  18. Yuan, X.; Sheng, X.; Chen, L.; Tang, Y.; Li, Y.; Jia, Y.; Qu, D.; Wang, Q.; Ma, Q.; Zuo, J. Carbon footprint and embodied carbon transfer at the provincial level of the Yellow River Basin. Sci. Total Environ. 2022, 803, 149993. [Google Scholar] [CrossRef]
  19. Zhang, Y.; Xu, X.Y. Carbon emission efficiency measurement and influencing factor analysis of nine provinces in the Yellow River basin: Based on SBM-DDF model and Tobit-CCD model. Environ. Sci. Pollut. Res. 2022, 29, 33263–33280. [Google Scholar] [CrossRef]
  20. Liu, Z.; Guan, D.B.; Wei, W.; Davis, S.J.; Ciais, P.; Bai, J.; Peng, S.S.; Zhang, Q.; Hubacek, K.; Marland, G.; et al. Reduced carbon emission estimates from fossil fuel combustion and cement production in China. Nature 2015, 524, 335–338. [Google Scholar] [CrossRef] [Green Version]
  21. Shan, Y.L.; Guan, D.B.; Zheng, H.R.; Ou, J.M.; Li, Y.; Meng, J.; Mi, Z.F.; Liu, Z.; Zhang, Q. Data Descriptor: China CO2 emission accounts 1997–2015. Sci. Data 2018, 5, 170201. [Google Scholar] [CrossRef] [Green Version]
  22. He, Y.-Y.; Wei, Z.-X.; Liu, G.-Q.; Zhou, P. Spatial network analysis of carbon emissions from the electricity sector in China. J. Clean. Prod. 2020, 262, 121193. [Google Scholar] [CrossRef]
  23. Yang, C.; Liu, S. Spatial correlation analysis of low-carbon innovation: A case study of manufacturing patents in China. J. Clean. Prod. 2020, 273, 122893. [Google Scholar] [CrossRef]
  24. Duan, J.; Nie, C.; Wang, Y.; Yan, D.; Xiong, W. Research on Global Grain Trade Network Pattern and Its Driving Factors. Sustainability 2022, 14, 245. [Google Scholar] [CrossRef]
  25. Zhang, C.; Tan, Z. The relationships between population factors and China’s carbon emissions: Does population aging matter? Renew. Sustain. Energy Rev. 2016, 65, 1018–1025. [Google Scholar] [CrossRef]
  26. Wu, L.; Jia, X.; Gao, L.; Zhou, Y. Effects of population flow on regional carbon emissions: Evidence from China. Environ. Sci. Pollut. Res. 2021, 28, 62628–62639. [Google Scholar] [CrossRef]
  27. Wang, F.; Gao, M.; Liu, J.; Qin, Y.; Wang, G.; Fan, W.; Ji, L. An empirical study on the impact path of ur-banization to carbon emissions in the China Yangtze River delta urban agglomeration. Appl. Sci. 2019, 9, 1116. [Google Scholar] [CrossRef] [Green Version]
  28. Yang, Y.; Wei, X.; Wei, J.; Gao, X. Industrial Structure Upgrading, Green Total Factor Productivity and Carbon Emissions. Sustainability 2022, 14, 1009. [Google Scholar] [CrossRef]
  29. Pai, P.F.; Wang, W.C. Using machine learning models and actual transaction data for predicting real estate prices. Appl. Sci. 2020, 10, 5832. [Google Scholar] [CrossRef]
  30. Xue, J.; Shen, B. A novel swarm intelligence optimization approach: Sparrow search algorithm. Syst. Sci. Control Eng. 2020, 8, 22–34. [Google Scholar] [CrossRef]
  31. Zhang, H.; Sun, X.; Wang, W. Study on the spatial and temporal differentiation and influencing factors of carbon emissions in Shandong province. Nat. Hazards 2017, 87, 973–988. [Google Scholar] [CrossRef]
  32. Zhang, Y.L.; Zhang, Q.Y.; Pan, B.B. Impact of affluence and fossil energy on China carbon emissions using STIRPAT model. Environ. Sci. Pollut. Res. 2019, 26, 18814–18824. [Google Scholar] [CrossRef] [PubMed]
  33. Qian, L.; Zheng, Y.; Li, L.; Ma, Y.; Zhou, C.; Zhang, D. A New Method of Inland Water Ship Trajectory Prediction Based on Long Short-Term Memory Network Optimized by Genetic Algorithm. Appl. Sci. 2022, 12, 4073. [Google Scholar] [CrossRef]
  34. Saidani, I.; Ouni, A.; Mkaouer, M.W. Improving the prediction of continuous integration build failures using deep learning. Autom. Softw. Eng. 2022, 29, 21. [Google Scholar] [CrossRef]
  35. Liu, D. Convergence of energy carbon emission efficiency: Evidence from manufacturing subsectors in China. Environ. Sci. Pollut. Res. 2022, 29, 31133–31147. [Google Scholar] [CrossRef]
  36. Liang, Z.; Nie, Z.; An, A.; Gong, J.; Wang, X. A particle shape extraction and evaluation method using a deep convolutional neural network and digital image processing. Powder Technol. 2019, 353, 156–170. [Google Scholar] [CrossRef]
  37. Yang, D.; Wang, X.; Zhang, H.; Yin, Z.-Y.; Su, D.; Xu, J. A Mask R-CNN based particle identification for quantitative shape evaluation of granular materials. Powder Technol. 2021, 392, 296–305. [Google Scholar] [CrossRef]
  38. Liu, G.; Chen, L.; Qian, Z.; Zhang, Y.; Ren, H. Rutting prediction models for asphalt pavements with different base types based on RIOHTrack full-scale track. Constr. Build. Mater. 2021, 305, 124793. [Google Scholar] [CrossRef]
Figure 1. The methodology framework of this study.
Sustainability 14 06153 g001
Figure 2. The hidden layer neuron structure of LSTM.
Sustainability 14 06153 g002
Figure 3. The flowchart of SSA−LSTM.
Sustainability 14 06153 g003
Figure 4. Carbon Emissions in the Yellow River Basin.
Sustainability 14 06153 g004
Figure 5. Carbon intensity in the Yellow River Basin.
Sustainability 14 06153 g005
Figure 6. Differences between provinces in carbon emission influencing factors. (GS, HN, IM, NX, QH, SAX, SD, and SX are the abbreviations of Gansu, Henan, Inner Mongolia, Ningxia, Qinghai, Shaanxi, Shandong and Shanxi, respectively).
Sustainability 14 06153 g006
Figure 7. Comparison of model prediction results.
Sustainability 14 06153 g007
Table 1. Regression analysis results from 2000 to 2009 in the Yellow River Basin.
2000200120022003200420052006200720082009
P0.314 *0.497 **0.463 **0.1790.2380.395 *0.376 *0.546 ***0.500 **0.360
E0.013−0.089−0.144−0.1180.0170.1090.0850.0830.0880.127
G0.370 **0.355 **0.339 **0.328 **0.420 ***0.425 ***0.409 ***0.347 **0.388 **0.215
U−0.0090.1330.1500.0910.053−0.0030.0150.0320.0110.116
I−0.314 *−0.182−0.193−0.491 *−0.408 **−0.286 * −0.291 *−0.194 *−0.212−0.447 **
Notes: *, **, and *** indicate significance levels at 0.1, 0.05, and 0.001, respectively.
Table 2. Regression analysis results from 2010 to 2019 in the Yellow River Basin.
2010201120122013201420152016201720182019
P0.628 ***0.687 ***0.565 ***0.473 **0.541 ***0.427 **0.422 **0.495 ***0.395 **0.302 **
E0.0710.1430.261 *0.007−0.040−0.177−0.262 *−0.187−0.065−0.076
G0.0410.1170.1390.270 **0.1660.292 **0.363 **0.239 **0.288 **0.379 **
U0.219 *0.224 *0.209 *0.2210.2050.291 **0.309 **0.295 *0.382 **0.444 **
I−0.243 *−0.125−0.438 *−0.108−0.1240.0040.1800.1440.273 **0.248 **
Notes: *, **, and *** indicate significance levels at 0.1, 0.05, and 0.001, respectively.
Table 3. Parameter optimization range of LSTM.
ParameterRange
Learning rate(1 × 10⁻³, 1 × 10⁻²)
Number of iterations(50, 200)
Number of neurons(1, 200)
Table 4. Prediction model evaluation index results.
SSA-LSTMPSO-LSTMLSTMBPNN
MAE30.9049.2957.01126.77
RMSE36.6759.0465.11112.64
MAPE0.00990.01550.01780.0370
Publisher’s Note: MDPI stays neutral with regard to jurisdictional claims in published maps and institutional affiliations.

