
GIS-Based Modeling for Vegetated Land Fire Prediction in Qaradagh Area, Kurdistan Region, Iraq

 ,
,  ,
, 

Abstract
:1. Introduction
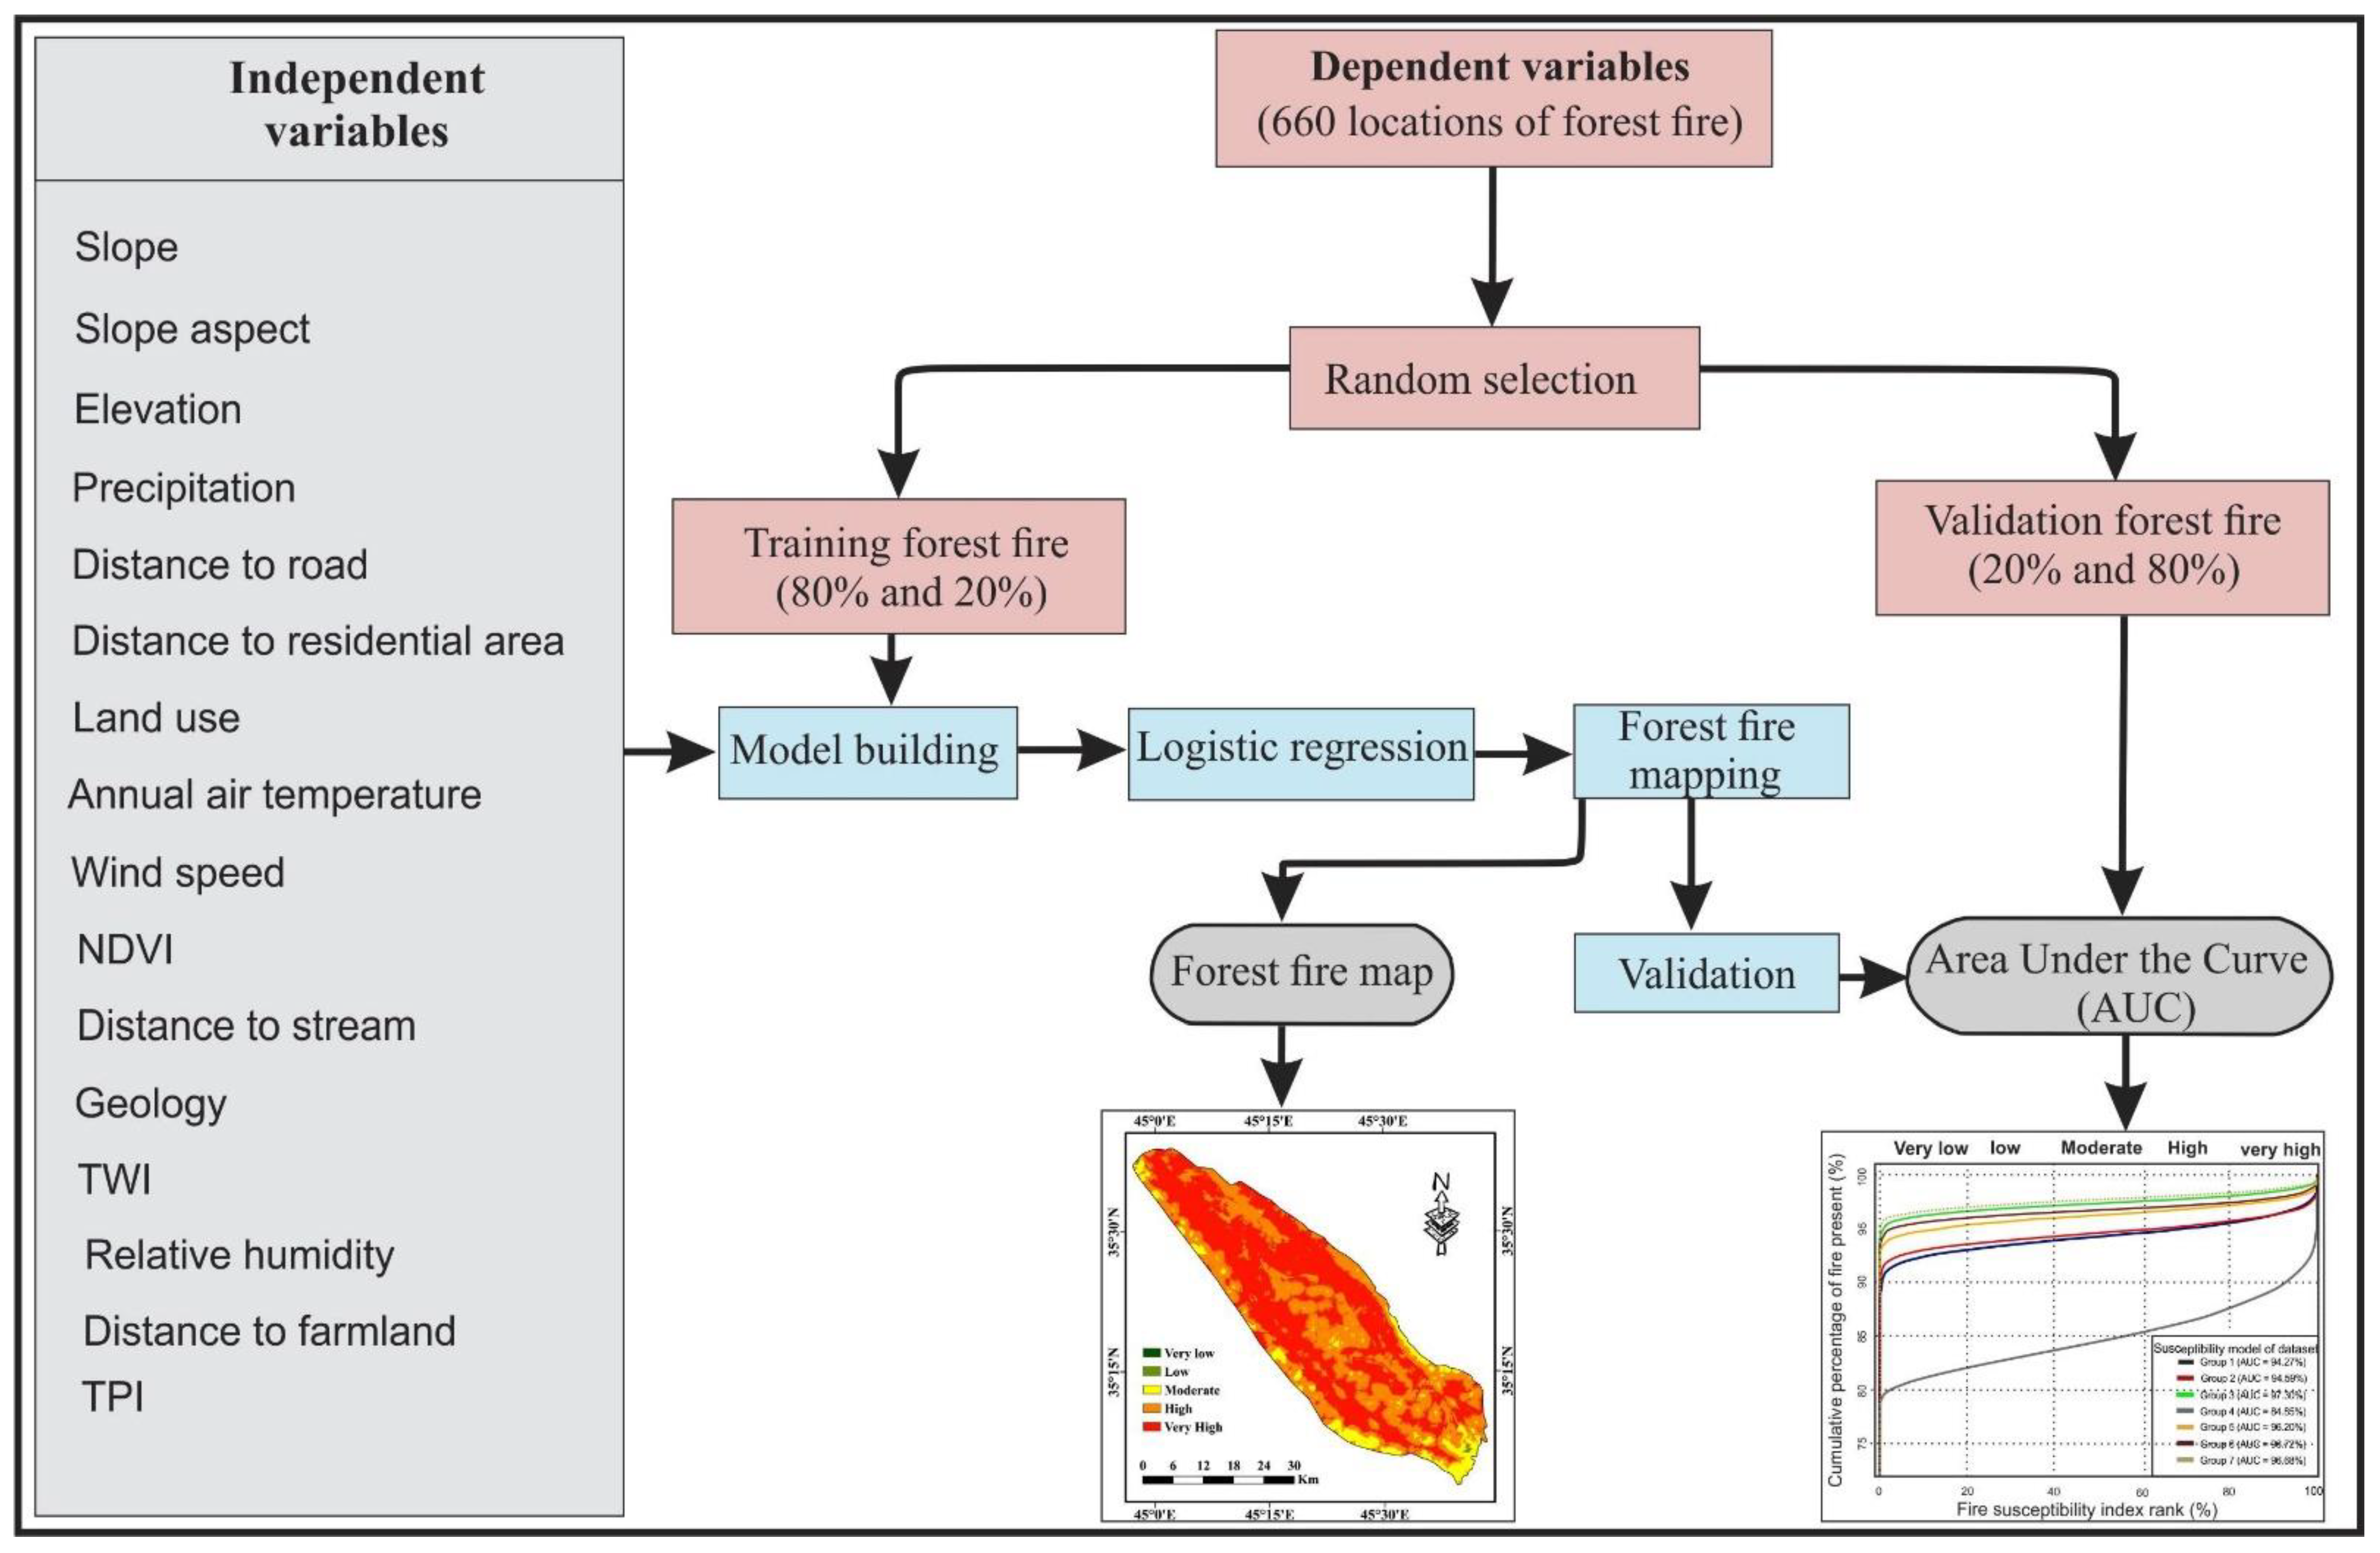
2. Materials and Methods
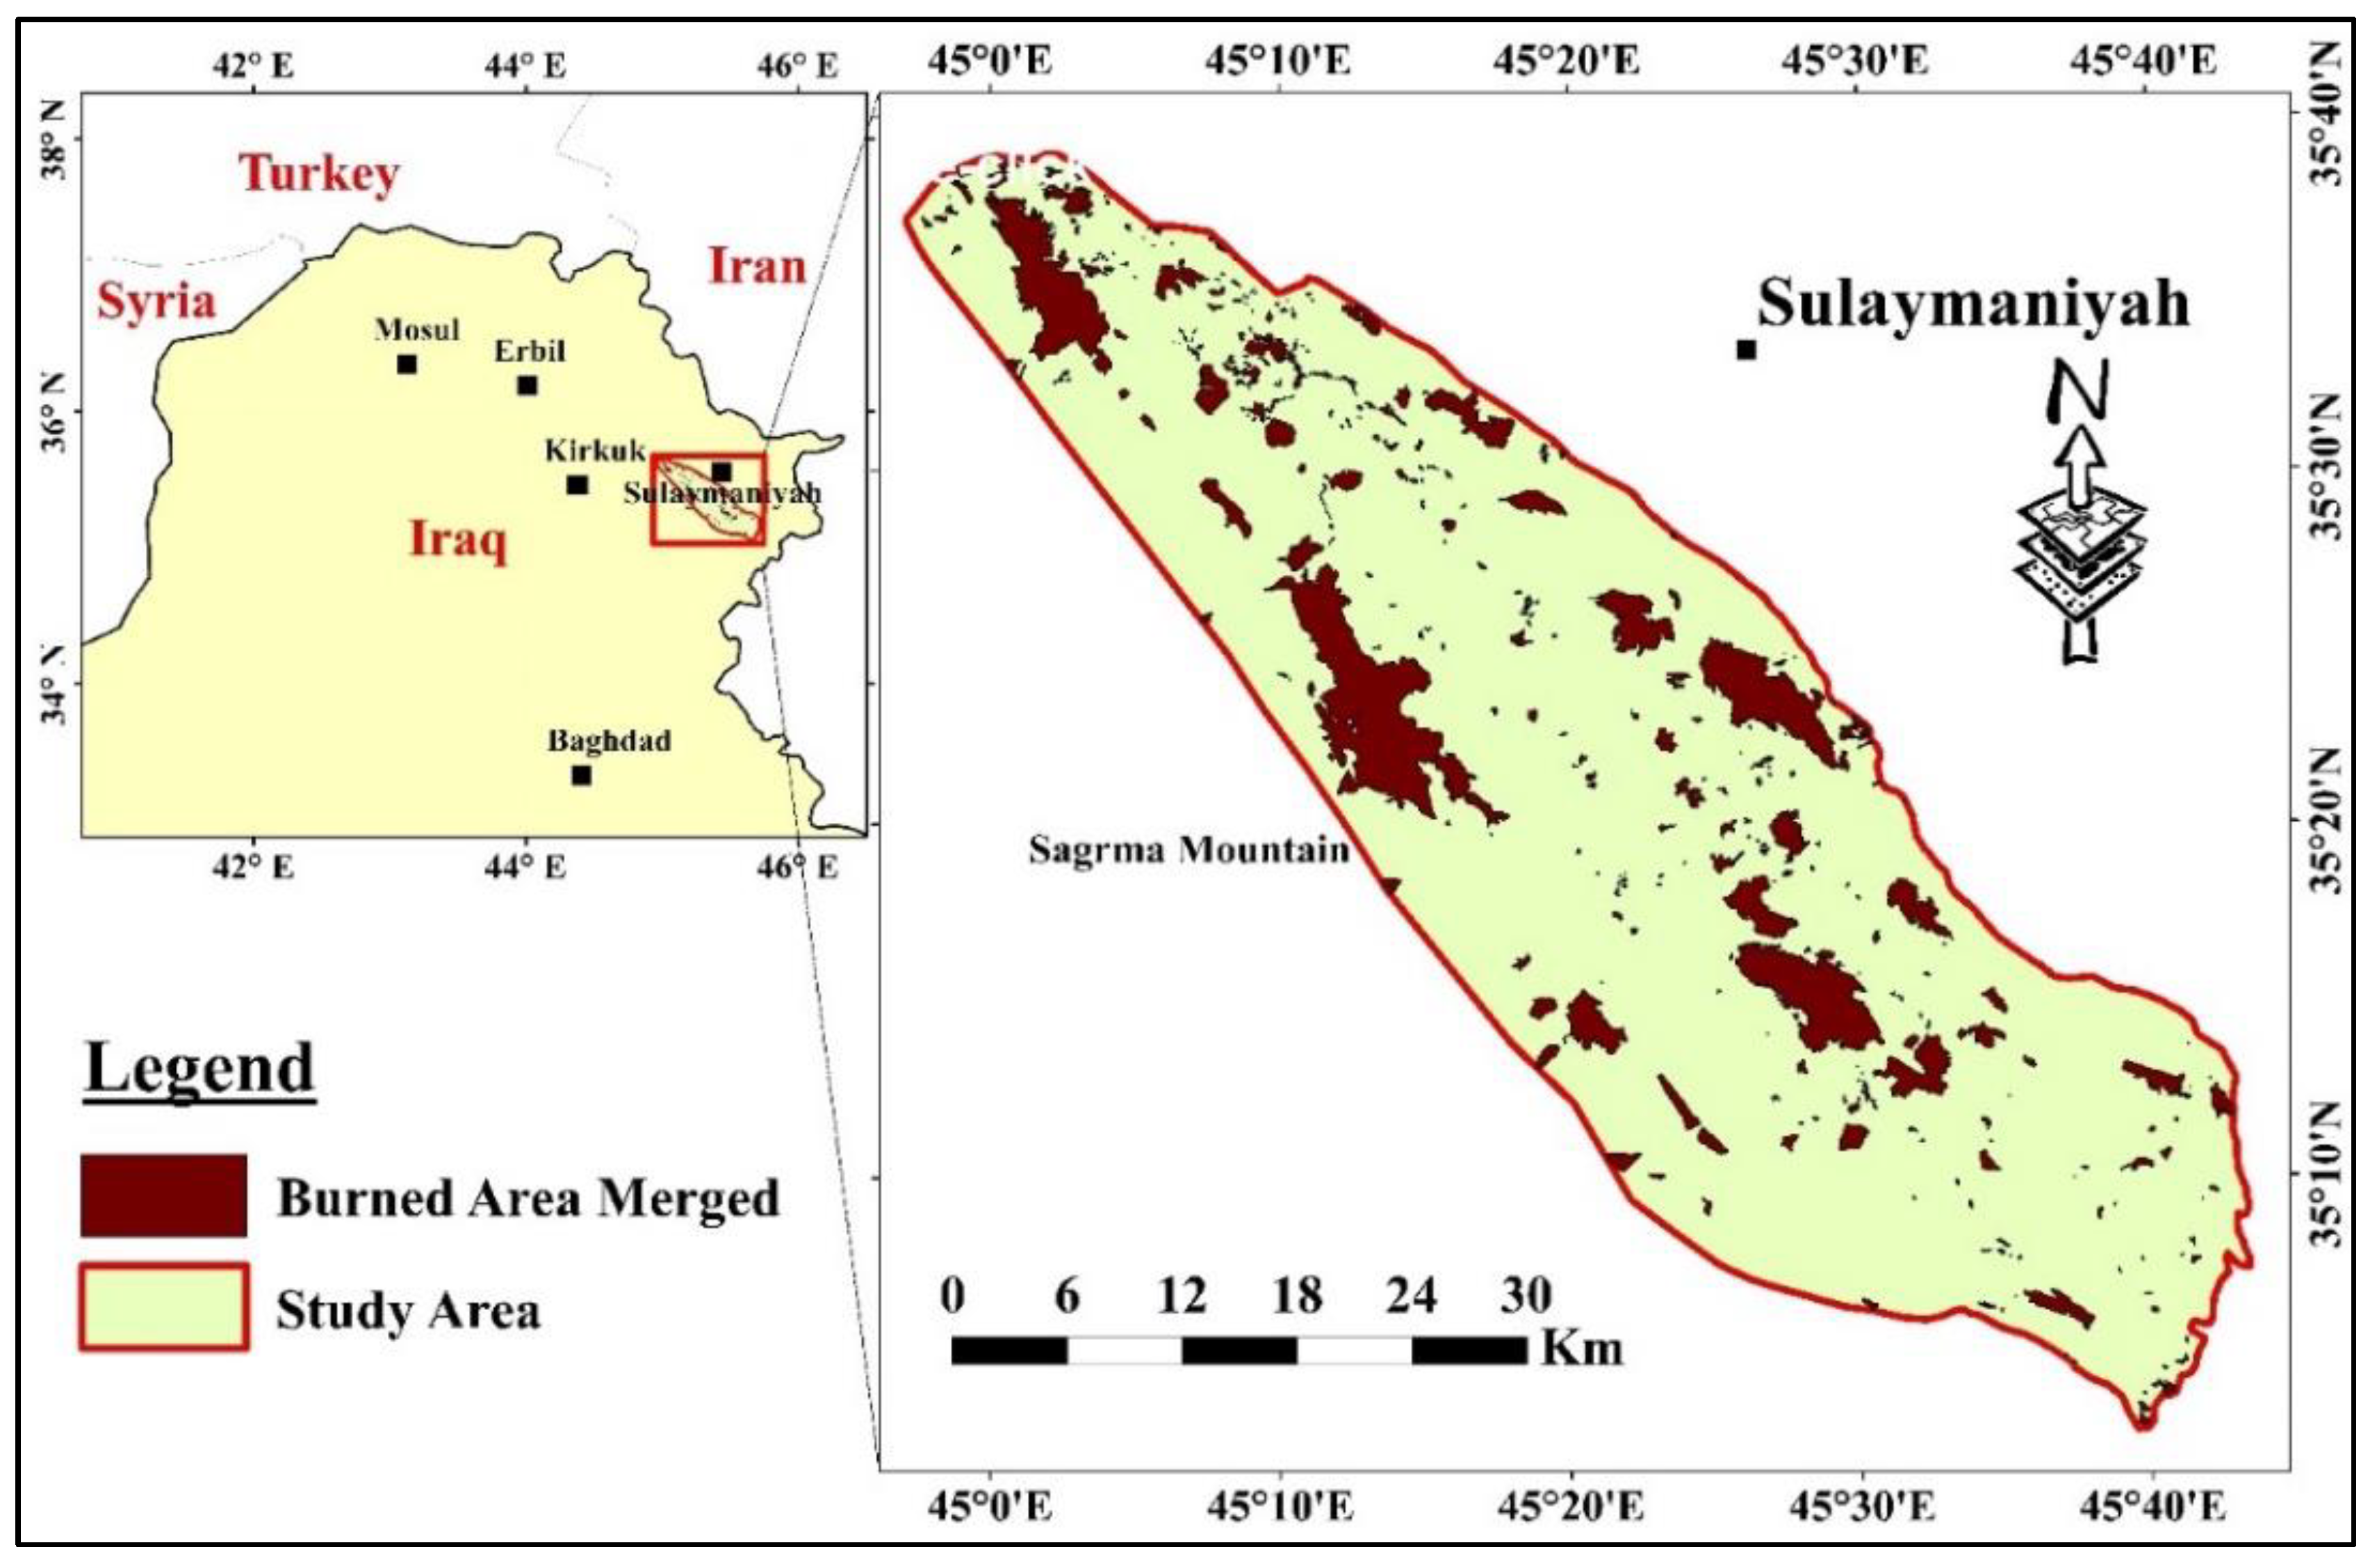
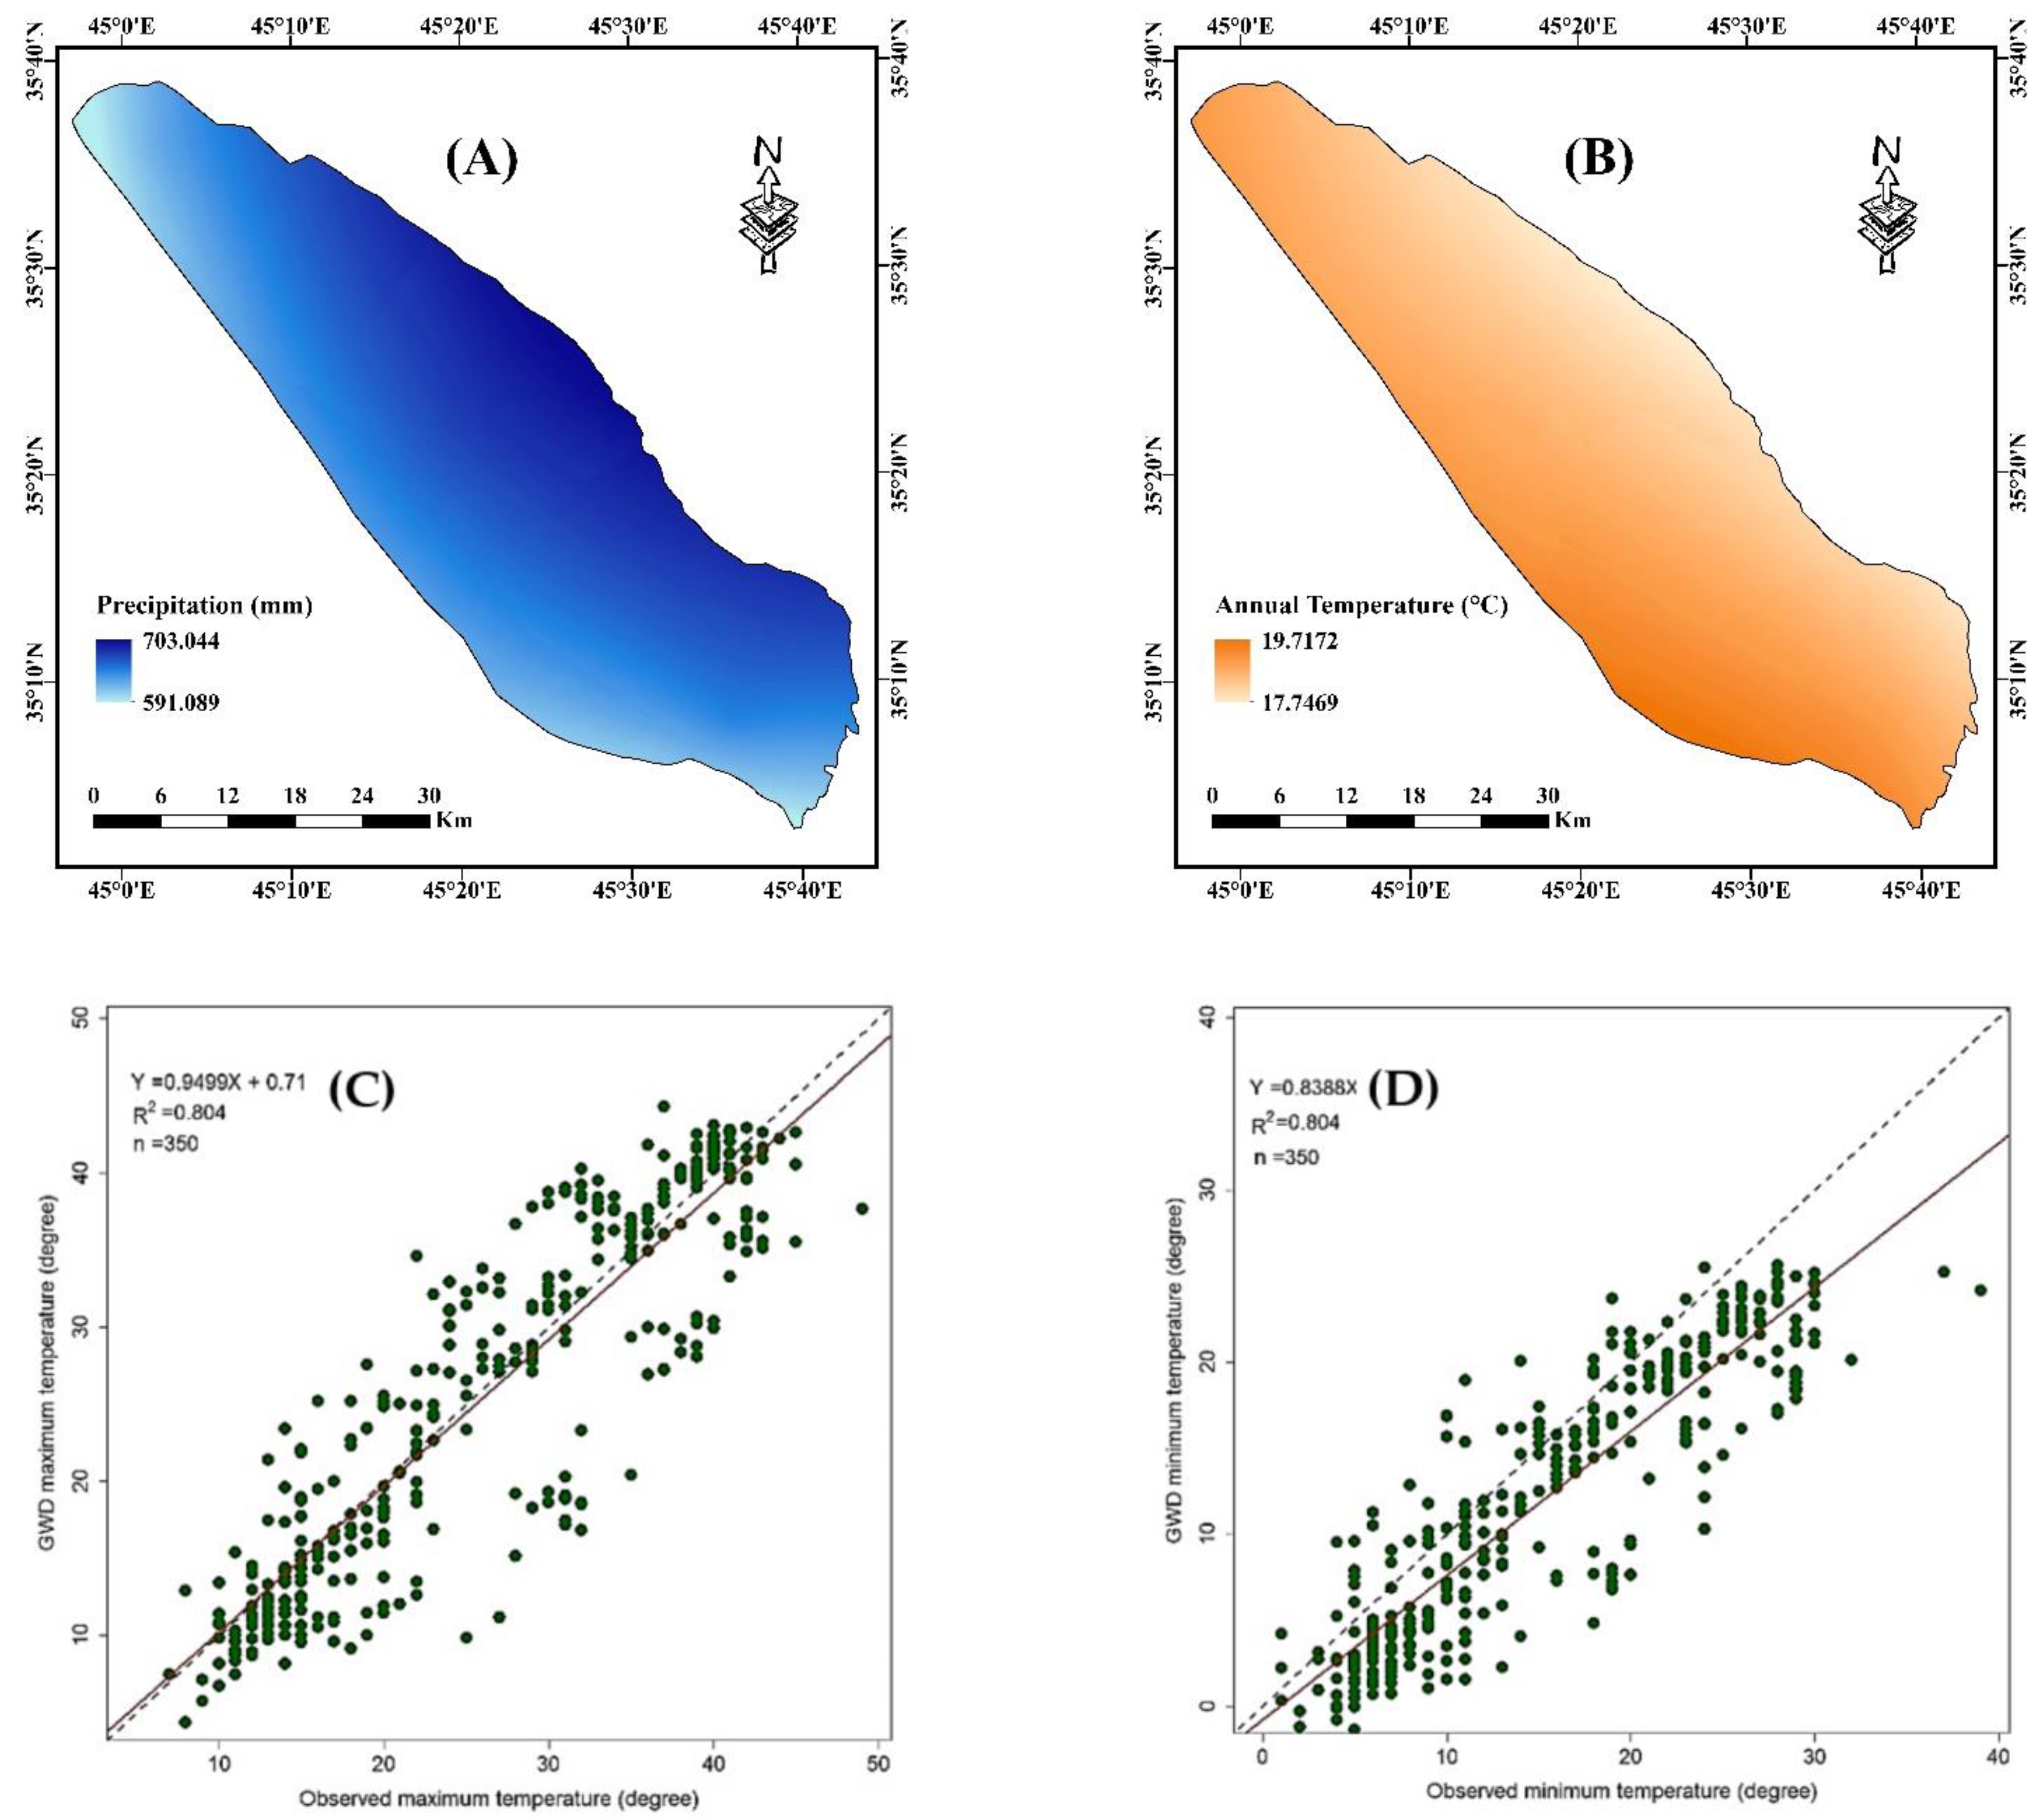
2.1. Study Area
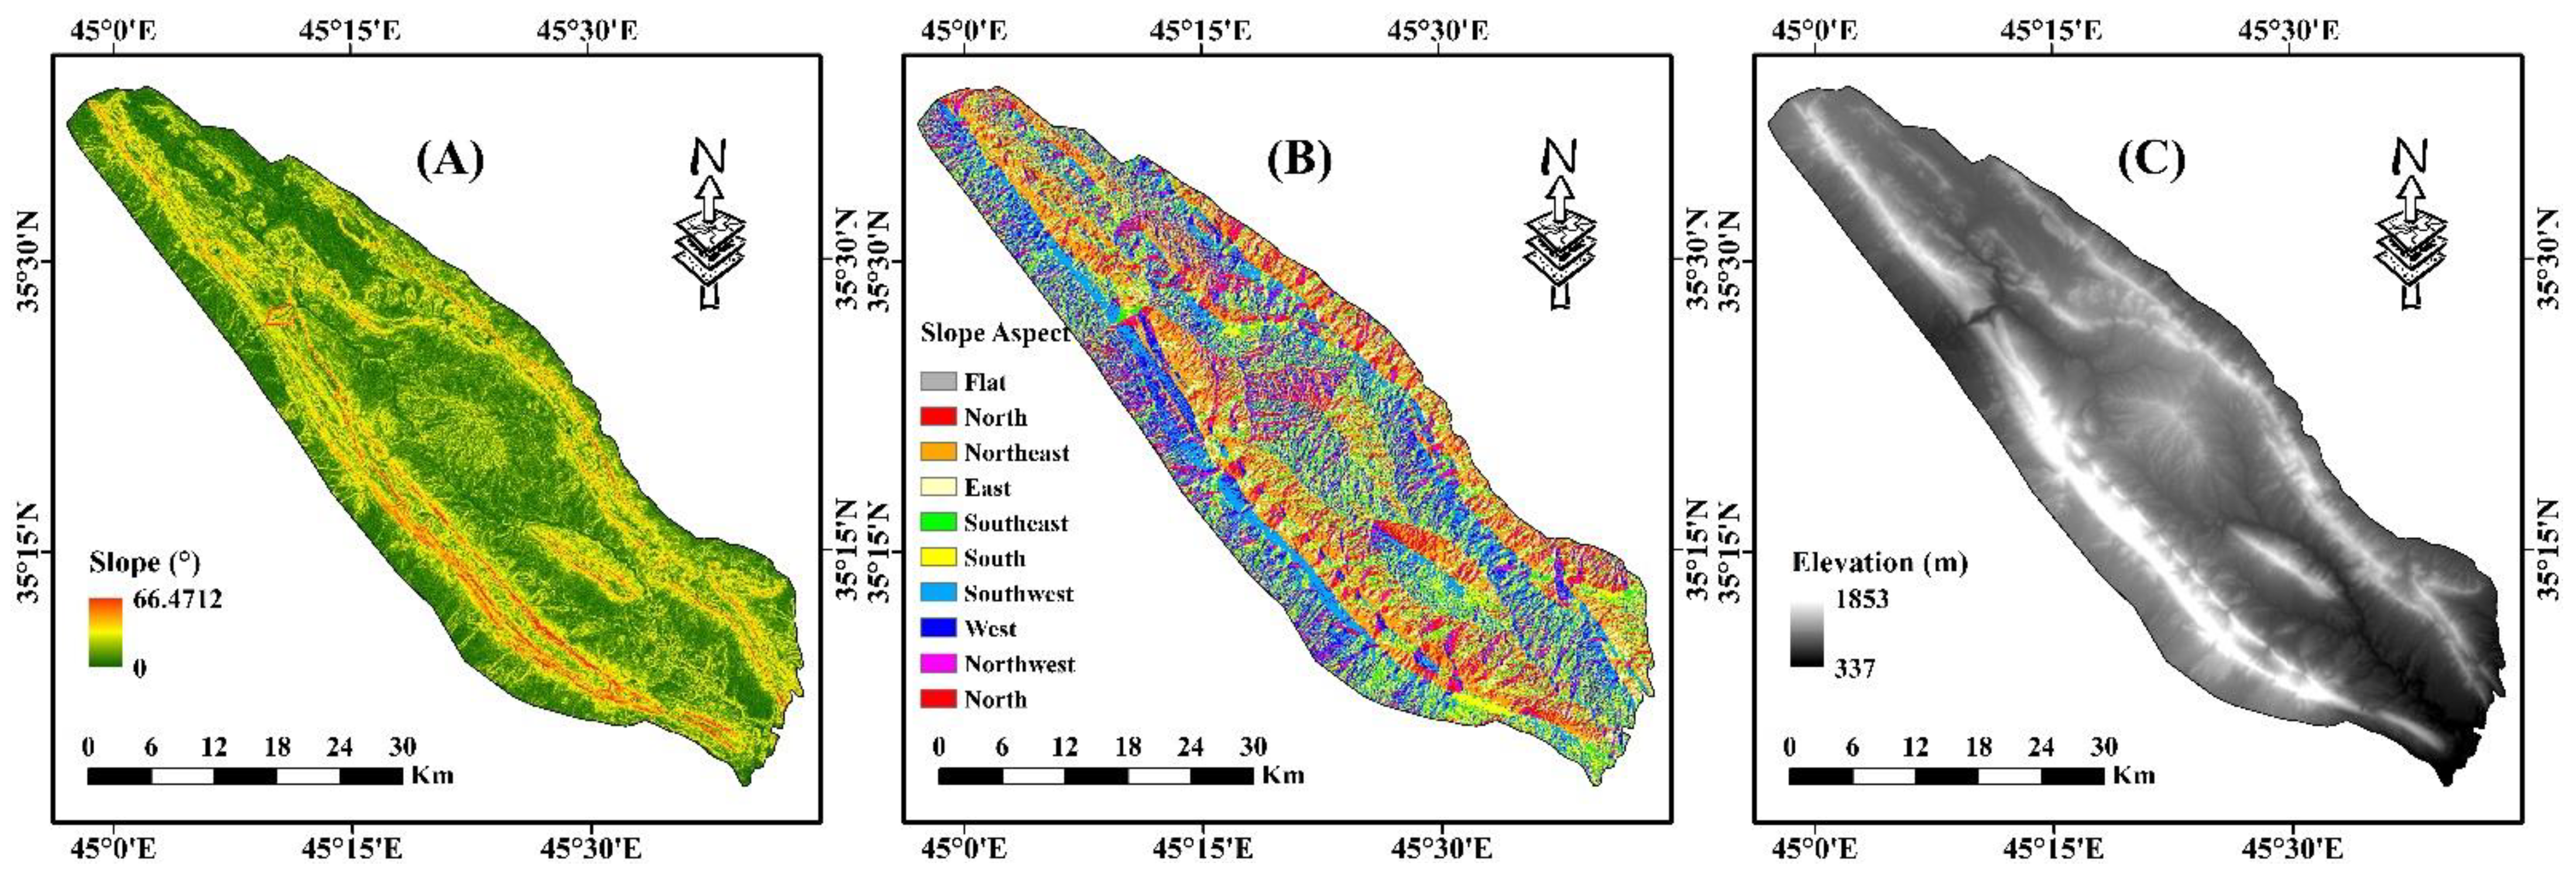
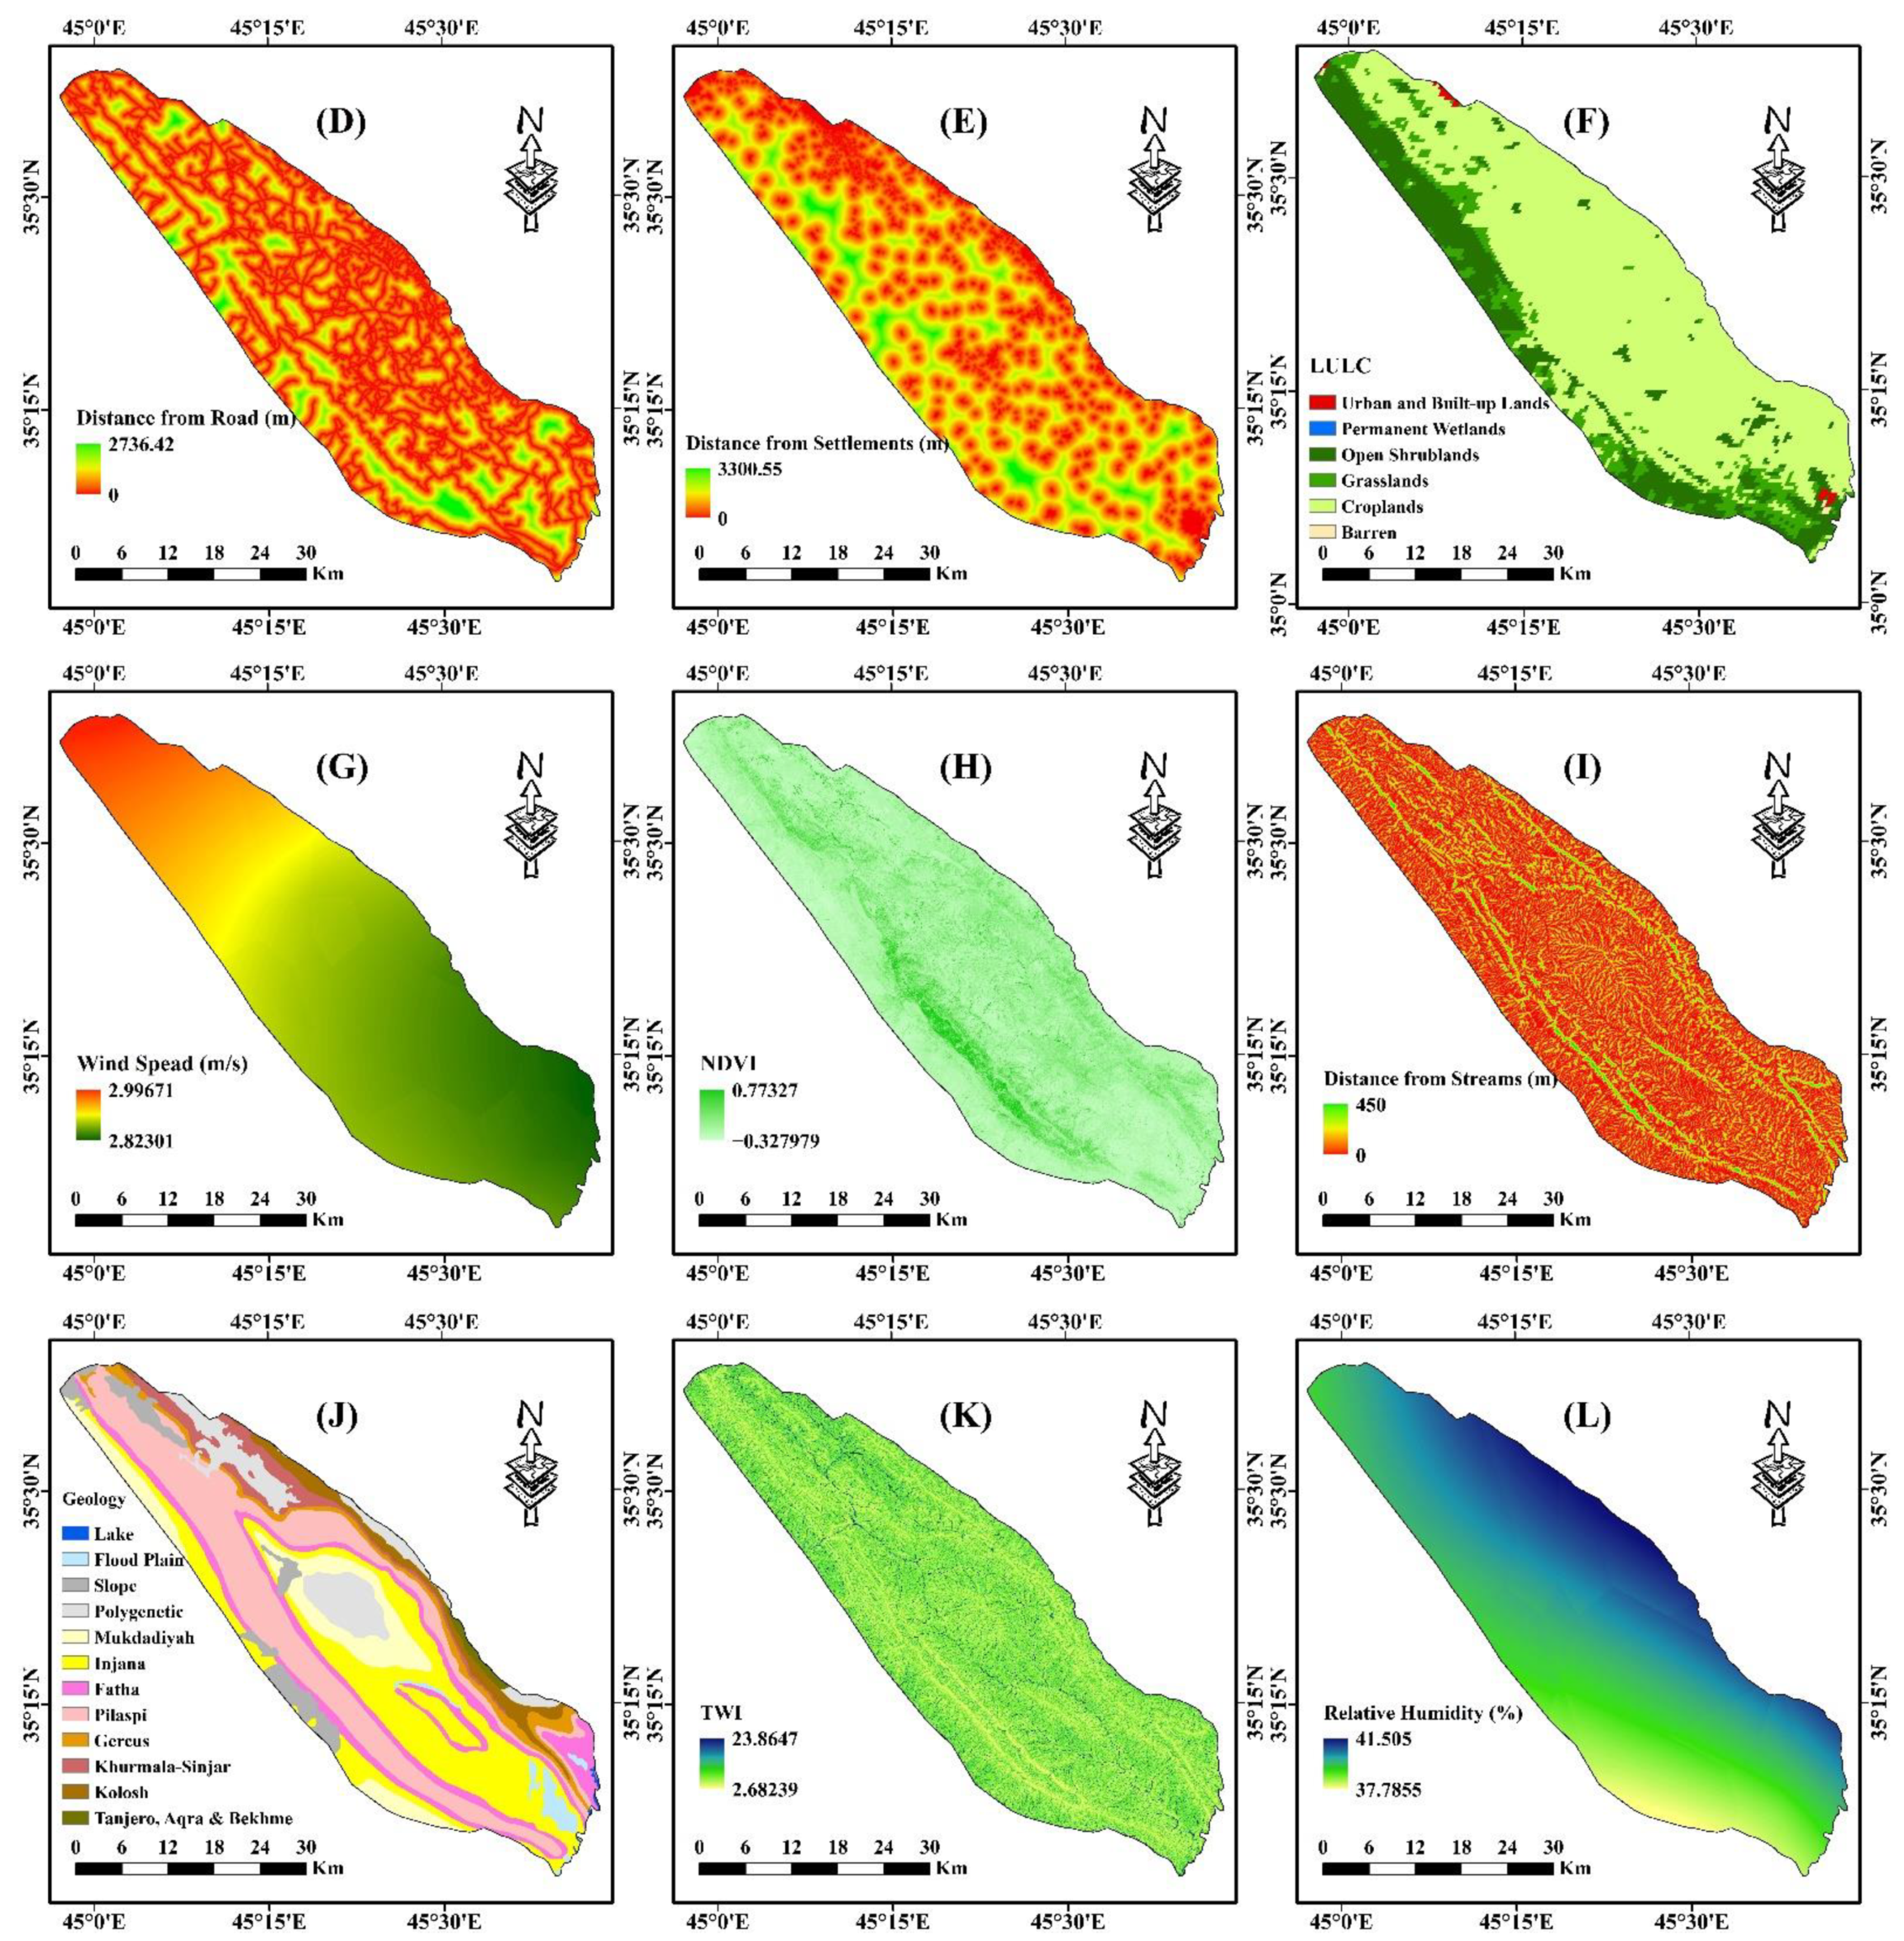
2.2. Material and Factors Affecting Fire Susceptibility
2.3. Burn Scar Inventory
2.4. Data Analysis by Logistic Regression
2.5. Preparation of Training and Validation Dataset
2.6. Omission of the Factors Less Effective in Fire Occurrence to Map Fire-Susceptible Areas
2.7. Validation
3. Results
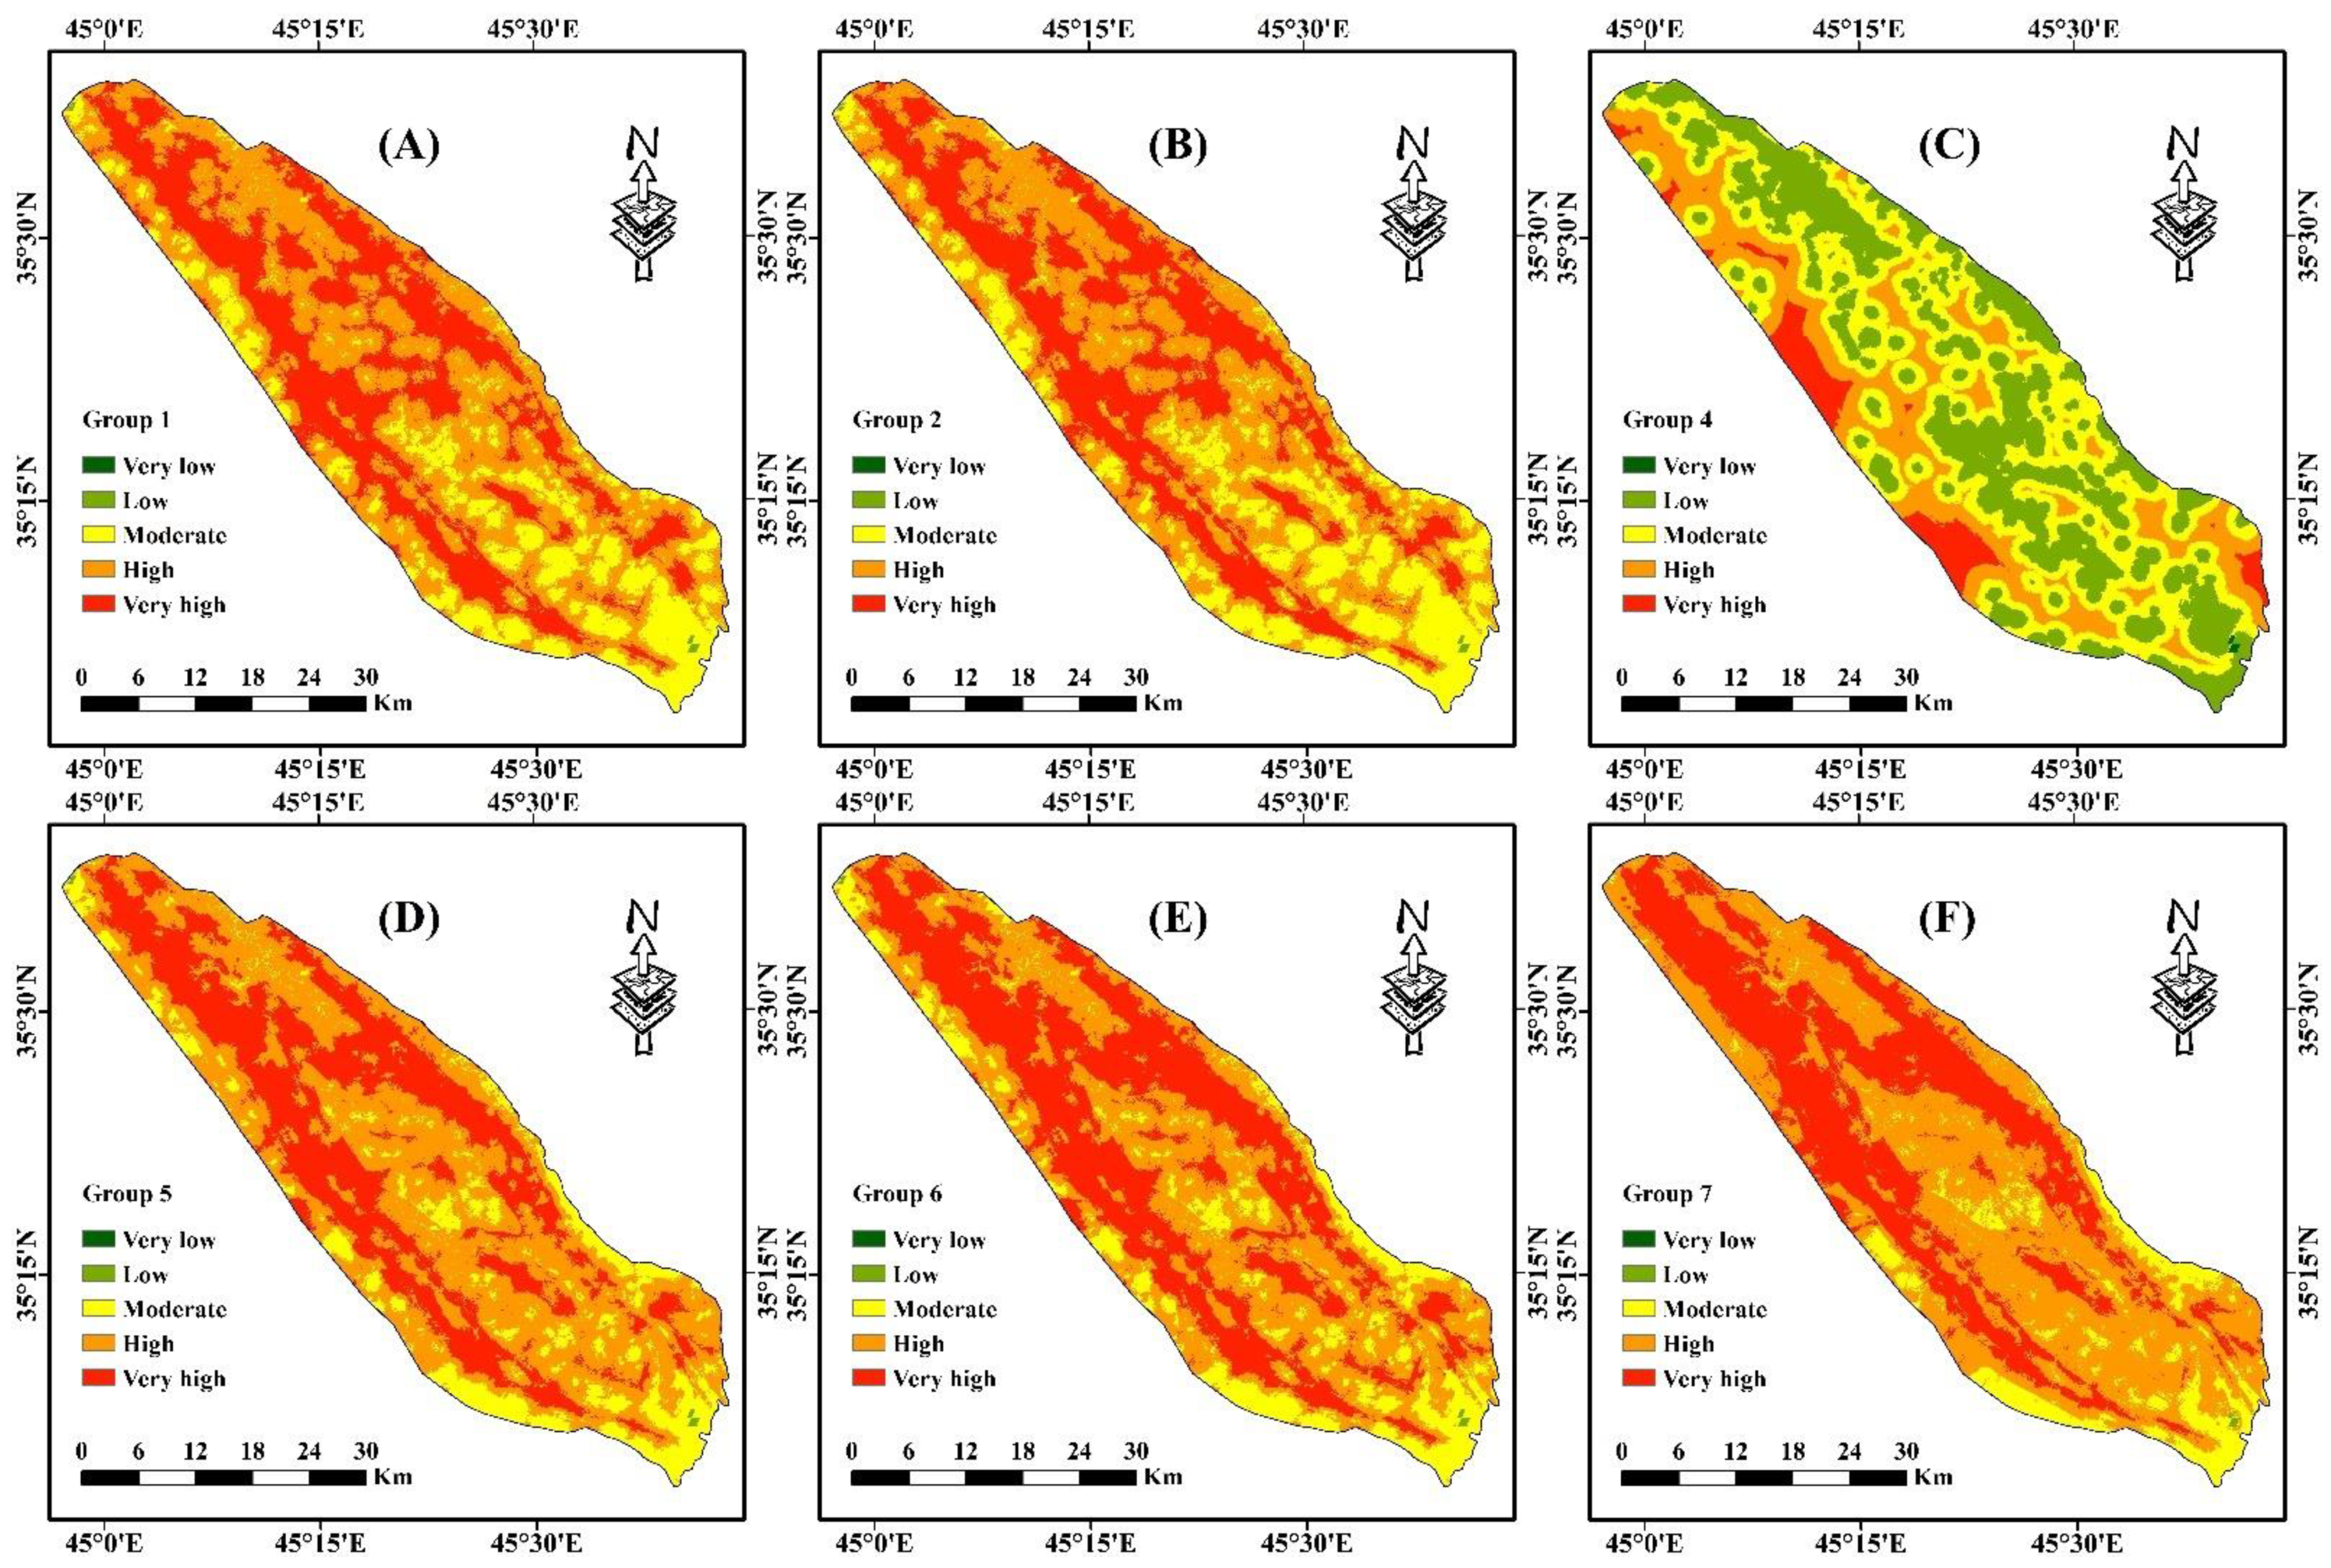
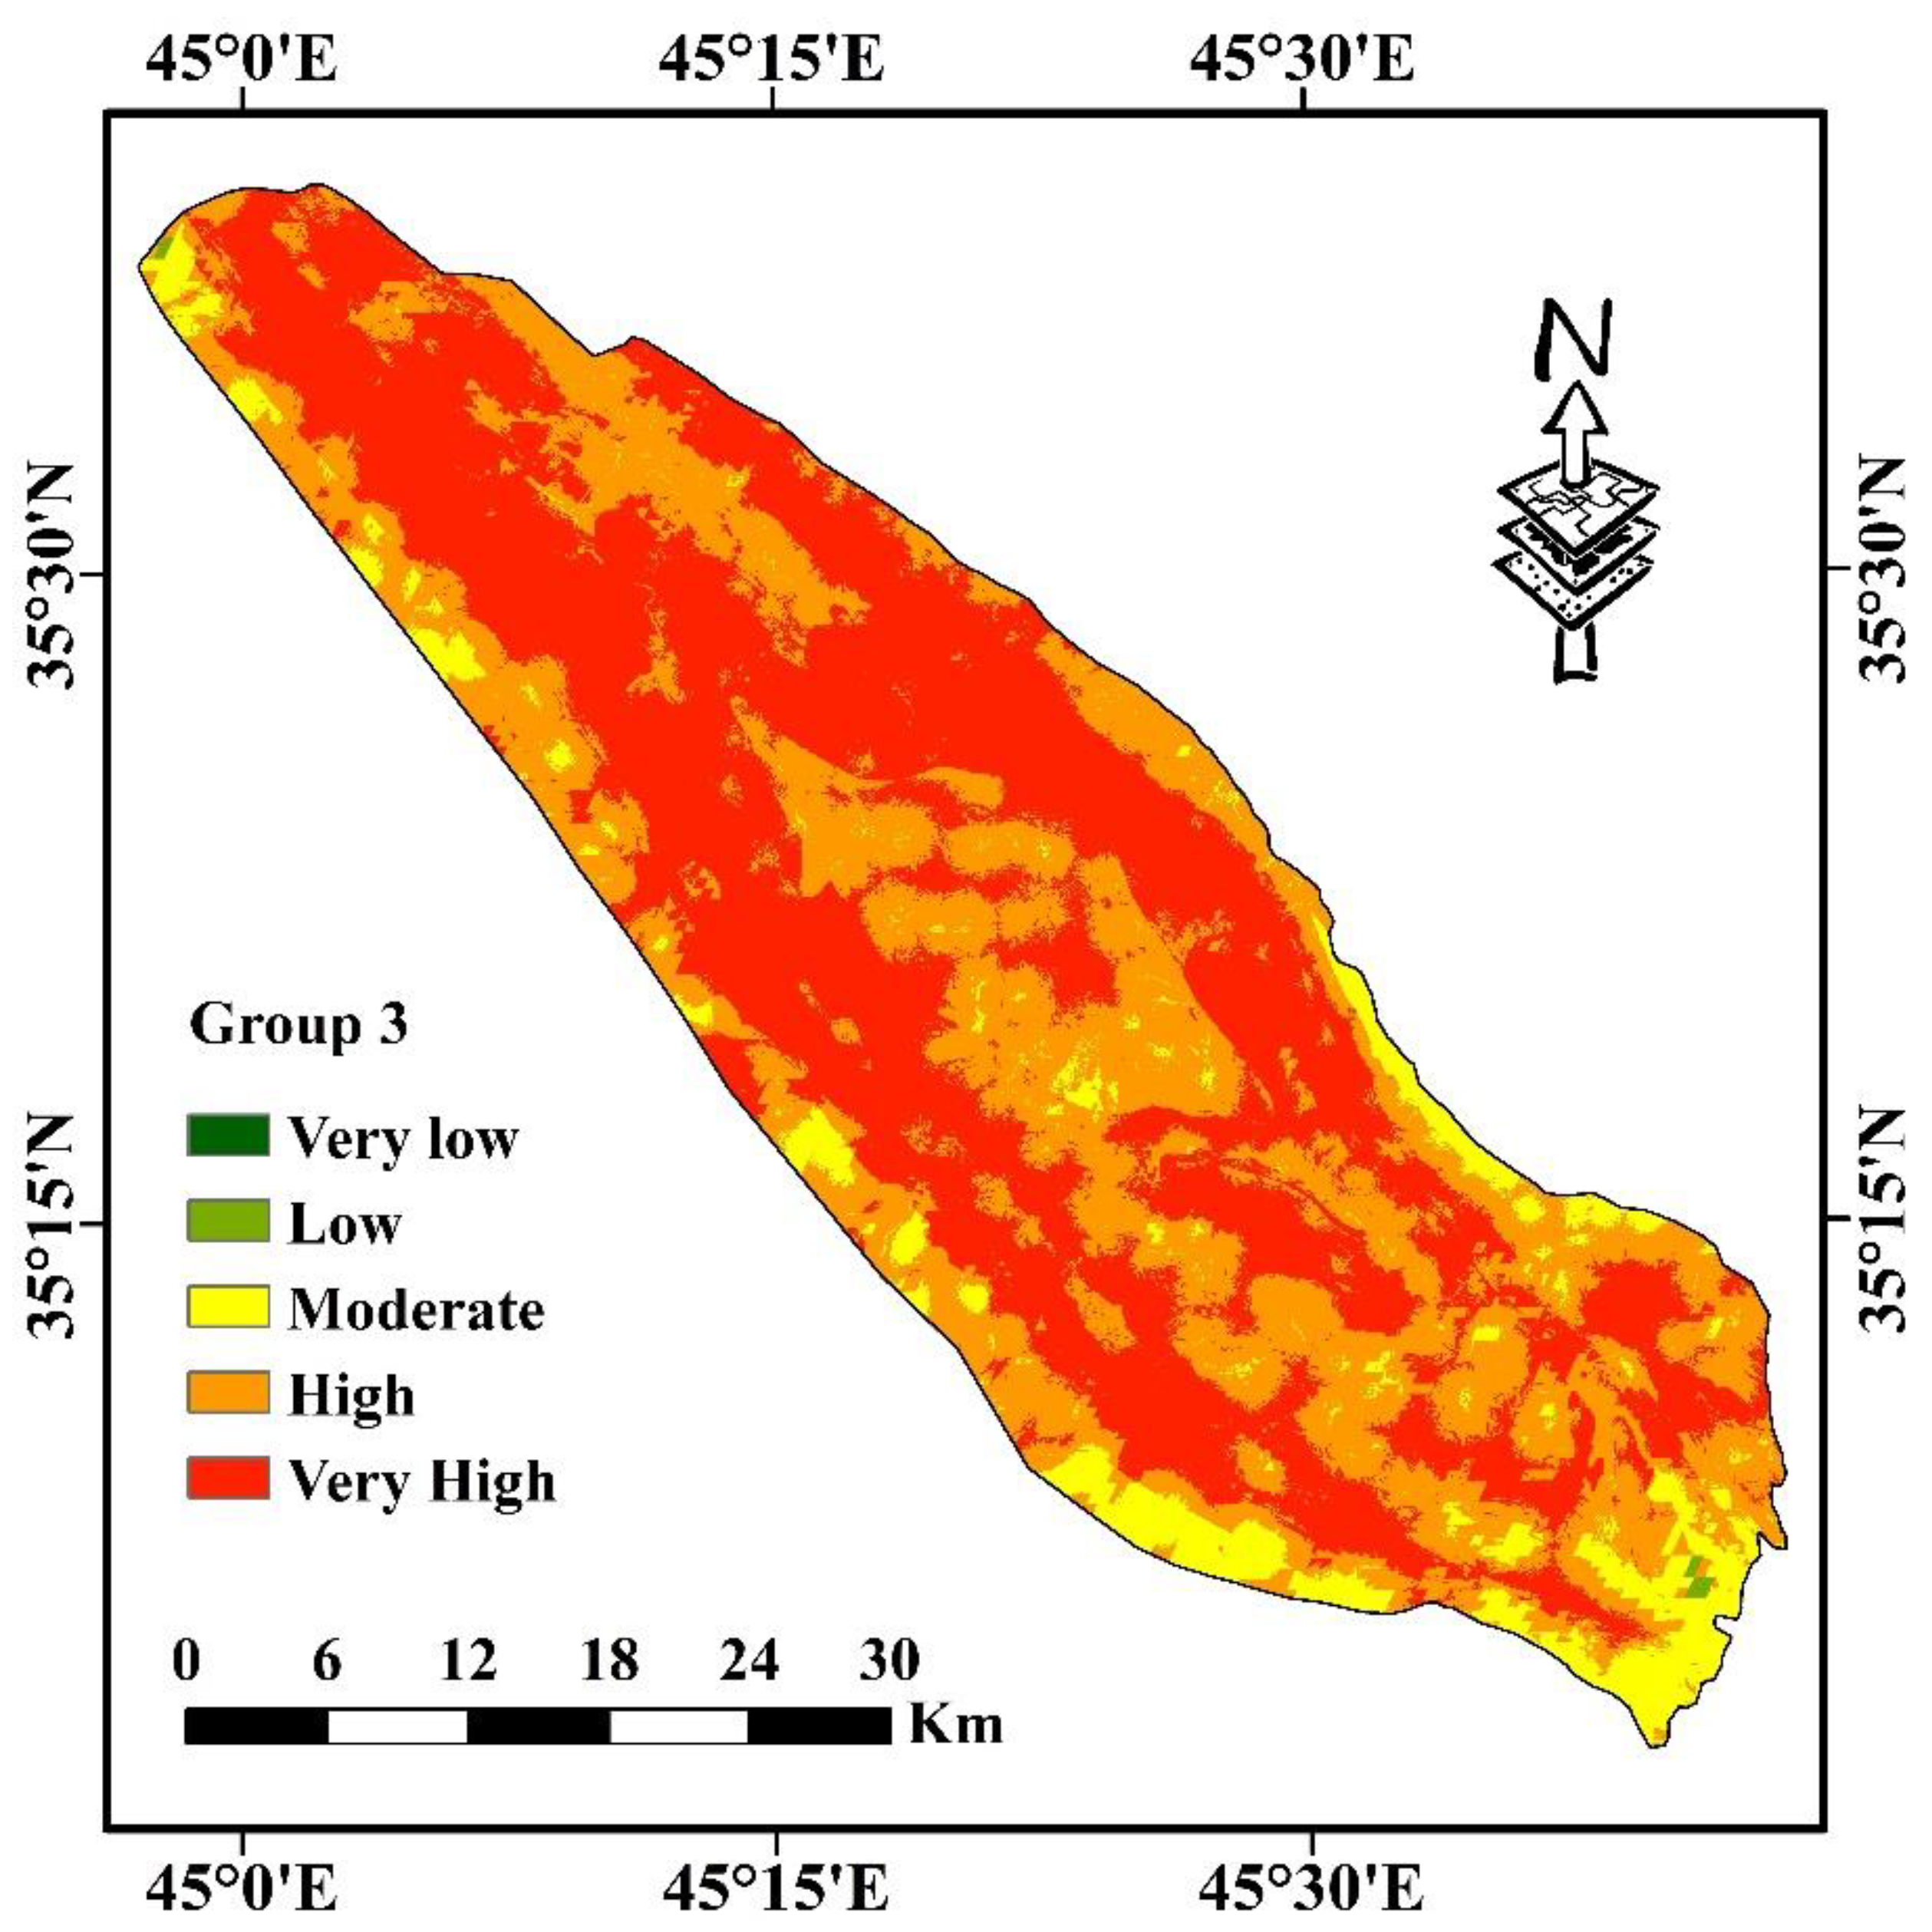
3.1. Vegetation Fire Susceptibility Mapping
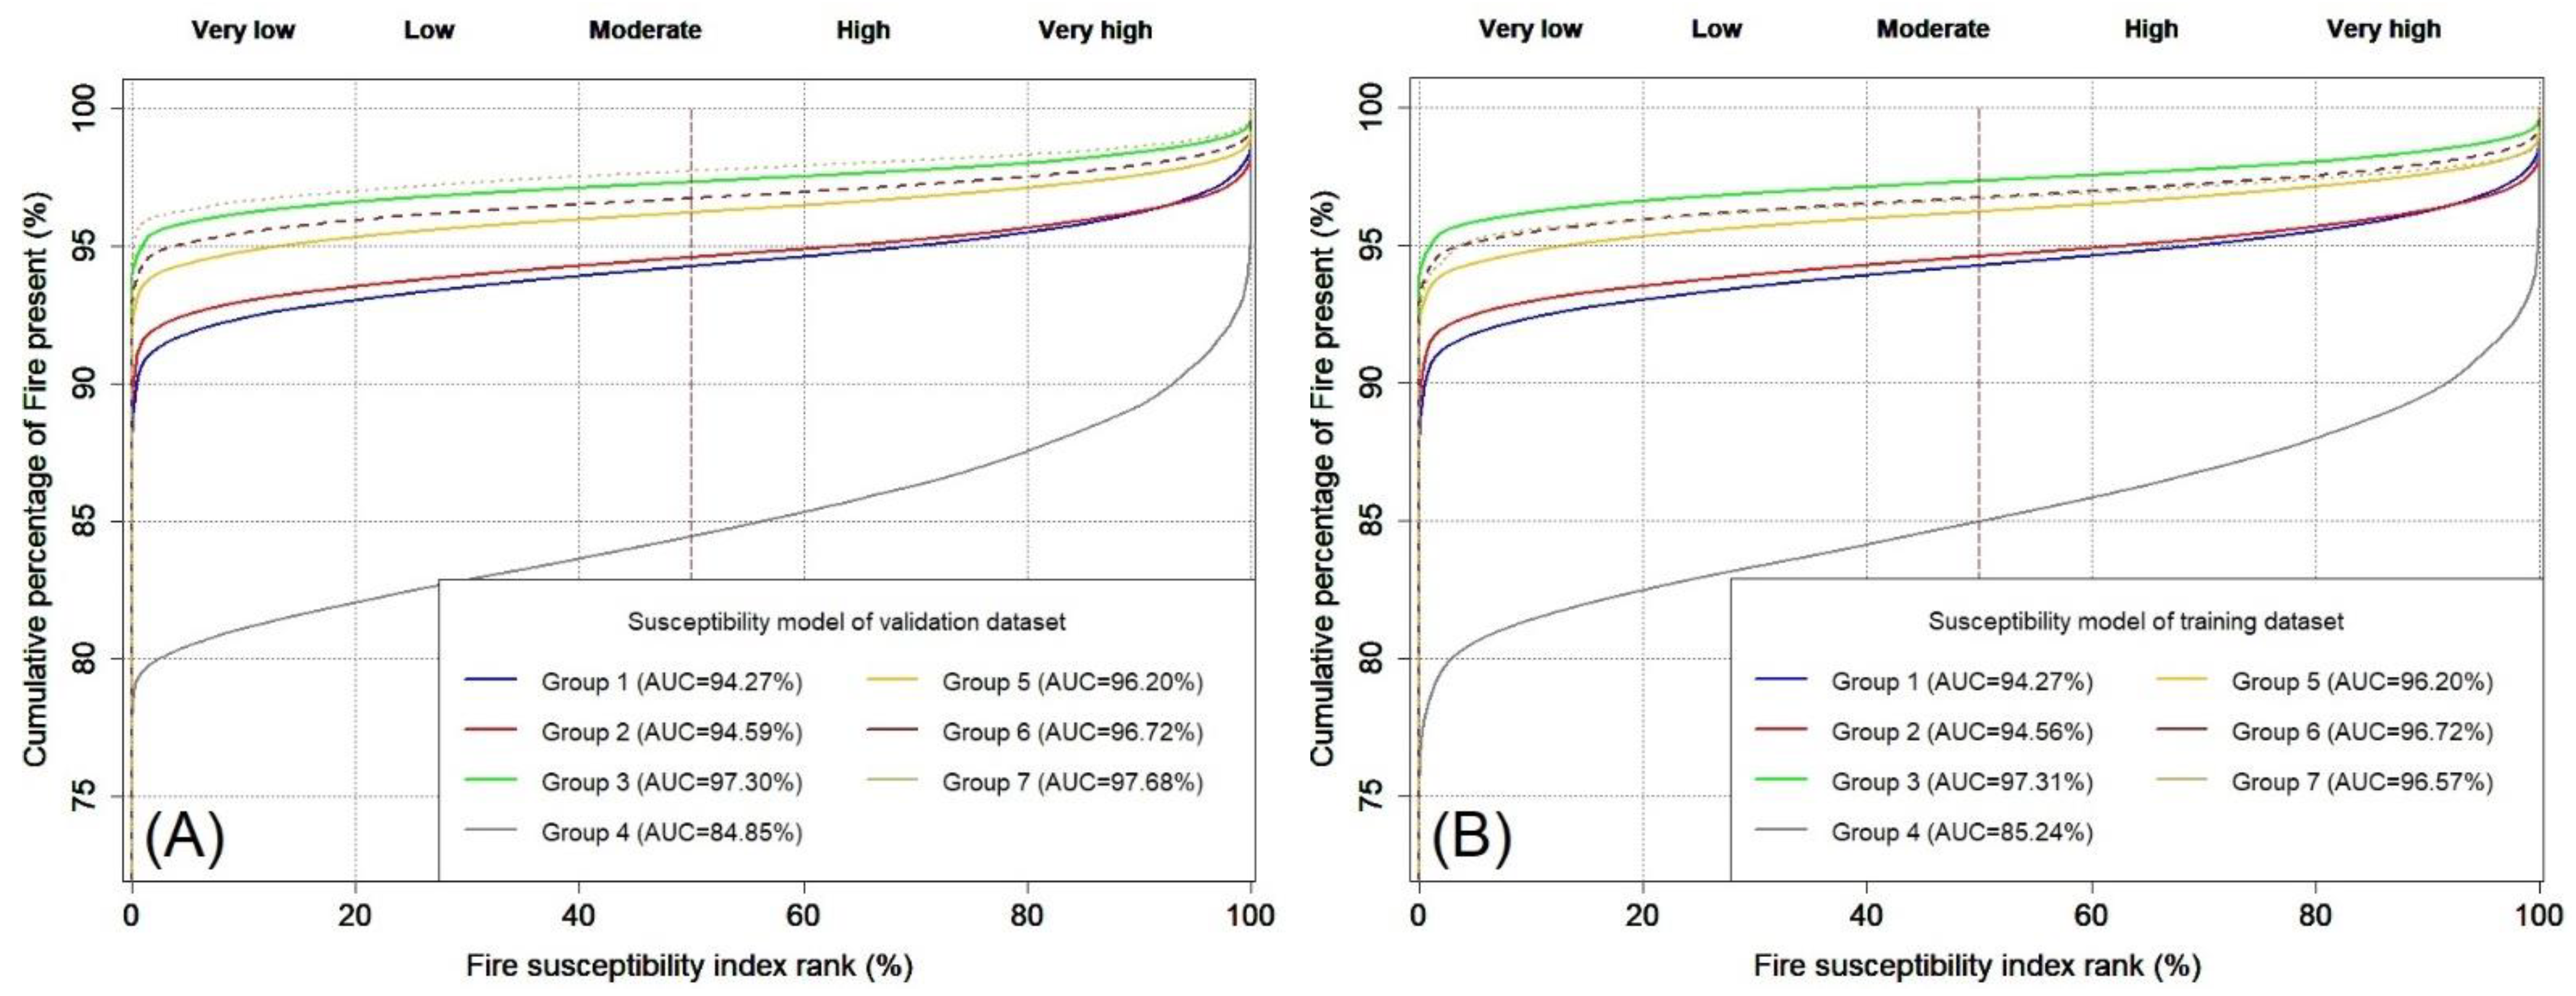
3.2. Validation and Comparison of the Maps
3.3. Key Factor
4. Discussion
4.1. Model Comparison
4.2. Factors Impacting Vegetation Fire
4.3. Advantages and Disadvantages
5. Conclusions
Author Contributions
Funding
Institutional Review Board Statement
Informed Consent Statement
Data Availability Statement
Acknowledgments
Conflicts of Interest
Appendix A. Dependable Factors

| References | Slope | Slope Aspect | Elevation or Altitude | Distance from the Residential or Urban Area | Precipitation | Distance from Road | Land Use and Land Cover | Vegetation Cover | Annual Air Temperature | Wind Speed | NDVI | Burned Pixels | Distance from Streams | Soil Type | Plan Curvature | Topographic Wetness Index (TWI) | Relative Humidity | Distance from Agriculture Land | TPI |
|---|---|---|---|---|---|---|---|---|---|---|---|---|---|---|---|---|---|---|---|
| [2] | * | * | * | * | * | * | * | * | |||||||||||
| [4] | * | * | * | * | * | * | * | * | * | * | * | * | * | * | * | ||||
| [5] | * | * | * | * | * | * | * | * | * | ||||||||||
| [9] | * | ||||||||||||||||||
| [12] | * | * | * | * | * | ||||||||||||||
| [13] | * | * | * | * | * | ||||||||||||||
| [14] | * | * | * | * | * | * | * | ||||||||||||
| [15] | * | * | * | * | * | * | * | * | * | * | * | * | * | * | |||||
| [19] | * | * | * | * | * | * | * | * | * | * | * | * | * | * | * | * | |||
| [21] | * | * | * | * | * | * | * | * | * | * | * | * | * | * | * | ||||
| [22] | * | * | * | * | * | * | * | * | * | * | * | * | * | ||||||
| [23] | * | * | * | * | * | * | * | * | * | * | |||||||||
| [26] | * | * | * | * | * | * | * | * | * | * | |||||||||
| [34] | * | * | * | * | * | * | * | * | * | * | * | * | * | * | * | ||||
| [35] | * | * | * | * | * | * | * | * | |||||||||||
| [42] | * | * | * | * | * | ||||||||||||||
| [43] | * | ||||||||||||||||||
| [45] | * | * | * | * | * | * | * | ||||||||||||
| [48] | * | * | * | * | * | * | * | * | * | * | |||||||||
| [50] | * | * | * | * | * | * | * | * | * | * | |||||||||
| [53] | * | * | * | * | * | * | |||||||||||||
| [54] | * | * | * | * | * | * | * | * | * | ||||||||||
| [56] | * | * | * | * | * | * | |||||||||||||
| [58] | * | * | * | * | * | * | |||||||||||||
| [99] | * | * | * | ||||||||||||||||
| [100] | * | ||||||||||||||||||
| [101] | * | ||||||||||||||||||
| [102] | * | ||||||||||||||||||
| [103] | * | ||||||||||||||||||
| [104] | * | ||||||||||||||||||
| [105] | * | * | * | * | * | * | * | * | * | * | * | ||||||||
| [106] | * | ||||||||||||||||||
| [107] | * | ||||||||||||||||||
| [108] | * | * | * | * | * | * | |||||||||||||
| [109] | * | * | * | ||||||||||||||||
| [110] | * | * | |||||||||||||||||
| [111] | * | * | |||||||||||||||||
| [112] | * | ||||||||||||||||||
| [113] | * | ||||||||||||||||||
| [114] | * | * | |||||||||||||||||
| [115] | * | * | * | * | * | * | * | * | * | * | * | * | * | ||||||
| [116] | * | * | * | * | * | * | * | ||||||||||||
| [117] | * | ||||||||||||||||||
| [118] | * | * | * | * | * | * | * | * | * | * | * | ||||||||
| [119] | * | * | |||||||||||||||||
| [120] | * | ||||||||||||||||||
| [121] | * | * | * | ||||||||||||||||
| [122] | * | ||||||||||||||||||
| [123] | * | * | * | * | * | * | * | * | * | * | |||||||||
| [124] | * | * | * | * | |||||||||||||||
| [125] | * | * | * | * | * | * | |||||||||||||
| [126] | * | * | * | * | * | * | * | ||||||||||||
| [127] | * | * | * | * | * | * | * | * | * | * | * | * | * | ||||||
| [128] | * | * | |||||||||||||||||
| [129] | * | ||||||||||||||||||
| [130] | * | ||||||||||||||||||
| [131] | * | * | * | * | * | * | * | * | * | * | |||||||||
| Sum | 31 | 30 | 29 | 24 | 23 | 23 | 23 | 23 | 22 | 18 | 16 | 16 | 13 | 10 | 10 | 10 | 8 | 7 | 6 |
| Average rate | 54.24 | 52.54 | 50.85 | 40.68 | 40.68 | 40.68 | 38.98 | 38.98 | 38.98 | 32.20 | 28.81 | 27.12 | 23.73 | 16.95 | 16.95 | 16.95 | 13.56 | 11.86 | 10.17 |
Appendix B. Recorded Vegetation Fires during the Period (May 2015 to October 2020)
| No. | Year | Month | Day | Date | Imagery | Area (m2) | No. | Year | Month | Day | Date | Imagery | Area (m2) |
|---|---|---|---|---|---|---|---|---|---|---|---|---|---|
| 1 | 2015 | 5 | 21 | 21052015 | Landsat-7 | 27,270 | 331 | 2017 | 9 | 26 | 26092017 | Sentinel-2 | 762,500 |
| 2 | 2015 | 5 | 21 | 21052015 | Landsat-7 | 2816 | 332 | 2017 | 9 | 26 | 26092017 | Sentinel-2 | 50,670 |
| 3 | 2015 | 5 | 21 | 21052015 | Landsat-7 | 52,620 | 333 | 2017 | 9 | 26 | 26092017 | Sentinel-2 | 32,170 |
| 4 | 2015 | 5 | 21 | 21052015 | Landsat-7 | 22,320 | 334 | 2017 | 10 | 11 | 11102017 | Sentinel-2 | 24,900 |
| 5 | 2015 | 5 | 21 | 21052015 | Landsat-7 | 63,680 | 335 | 2017 | 11 | 11 | 11102017 | Sentinel-2 | 387,900 |
| 6 | 2015 | 5 | 21 | 21052015 | Landsat-7 | 17,650 | 336 | 2017 | 11 | 11 | 11102017 | Sentinel-2 | 1,534,000 |
| 7 | 2015 | 5 | 21 | 21052015 | Landsat-7 | 18,490 | 337 | 2017 | 11 | 11 | 11102017 | Sentinel-2 | 3992 |
| 8 | 2015 | 5 | 21 | 21052015 | Landsat-7 | 7165 | 338 | 2017 | 11 | 11 | 11102017 | Sentinel-2 | 4350 |
| 9 | 2015 | 5 | 21 | 21052015 | Landsat-7 | 7007 | 339 | 2017 | 11 | 11 | 11102017 | Sentinel-2 | 989.6 |
| 10 | 2015 | 5 | 21 | 21052015 | Landsat-7 | 13,970 | 340 | 2018 | 6 | 13 | 13062018 | Sentinel-2 | 118,000 |
| 11 | 2015 | 5 | 21 | 21052015 | Landsat-7 | 32,250 | 341 | 2018 | 6 | 13 | 13062018 | Sentinel-2 | 1,723,000 |
| 12 | 2015 | 5 | 21 | 21052015 | Landsat-7 | 10,980 | 342 | 2018 | 6 | 13 | 13062018 | Sentinel-2 | 5774 |
| 13 | 2015 | 5 | 21 | 21052015 | Landsat-7 | 5936 | 343 | 2018 | 6 | 13 | 13062018 | Sentinel-2 | 9821 |
| 14 | 2015 | 6 | 6 | 6062015 | Landsat-7 | 42,470 | 344 | 2018 | 6 | 16 | 16062018 | Sentinel-2 | 2742 |
| 15 | 2015 | 6 | 6 | 6062015 | Landsat-7 | 3,587,000 | 345 | 2018 | 6 | 16 | 16062018 | Sentinel-2 | 4328 |
| 16 | 2015 | 6 | 14 | 14062015 | Landsat-8 | 5524 | 346 | 2018 | 6 | 18 | 18062018 | Sentinel-2 | 17,240 |
| 17 | 2015 | 6 | 14 | 14062015 | Landsat-8 | 383,400 | 347 | 2018 | 6 | 18 | 18062018 | Sentinel-2 | 11,090 |
| 18 | 2015 | 6 | 14 | 14062015 | Landsat-8 | 94,130 | 348 | 2018 | 6 | 18 | 18062018 | Sentinel-2 | 13,350 |
| 19 | 2015 | 6 | 14 | 14062015 | Landsat-8 | 128,600 | 349 | 2018 | 6 | 18 | 18062018 | Sentinel-2 | 13,620 |
| 20 | 2015 | 6 | 14 | 14062015 | Landsat-8 | 5757 | 350 | 2018 | 6 | 18 | 18062018 | Sentinel-2 | 25,740 |
| 21 | 2015 | 6 | 14 | 14062015 | Landsat-8 | 129,000 | 351 | 2018 | 6 | 21 | 21062018 | Sentinel-2 | 11,070 |
| 22 | 2015 | 6 | 14 | 14062015 | Landsat-8 | 7679 | 352 | 2018 | 6 | 23 | 23062018 | Sentinel-2 | 85,820 |
| 23 | 2015 | 6 | 14 | 14062015 | Landsat-8 | 1,021,000 | 353 | 2018 | 6 | 23 | 23062018 | Sentinel-2 | 20,690 |
| 24 | 2015 | 6 | 14 | 14062015 | Landsat-8 | 758,00 | 354 | 2018 | 6 | 23 | 23062018 | Sentinel-2 | 42,380 |
| 25 | 2015 | 6 | 14 | 14062015 | Landsat-8 | 148,600 | 355 | 2018 | 6 | 23 | 23062018 | Sentinel-2 | 17,320 |
| 26 | 2015 | 6 | 30 | 30062015 | Landsat-8 | 5,338,000 | 356 | 2018 | 6 | 28 | 28062018 | Sentinel-2 | 122,200 |
| 27 | 2015 | 6 | 30 | 30062015 | Landsat-8 | 169,200 | 357 | 2018 | 6 | 28 | 28062018 | Sentinel-2 | 6324 |
| 28 | 2015 | 6 | 30 | 30062015 | Landsat-8 | 15,230 | 358 | 2018 | 7 | 1 | 1072018 | Sentinel-2 | 6329 |
| 29 | 2015 | 6 | 30 | 30062015 | Landsat-8 | 22,040 | 359 | 2018 | 7 | 3 | 3072018 | Sentinel-2 | 878,000 |
| 30 | 2015 | 6 | 30 | 30062015 | Landsat-8 | 96,980 | 360 | 2018 | 7 | 3 | 3072018 | Sentinel-2 | 65,790 |
| 31 | 2015 | 6 | 30 | 30062015 | Landsat-8 | 1,430,000 | 361 | 2018 | 7 | 6 | 6072018 | Sentinel-2 | 2,348,000 |
| 32 | 2015 | 6 | 30 | 30062015 | Landsat-8 | 106,900 | 362 | 2018 | 7 | 8 | 8072018 | Sentinel-2 | 305,300 |
| 33 | 2015 | 6 | 30 | 30062015 | Landsat-8 | 31,680 | 363 | 2018 | 7 | 8 | 8072018 | Sentinel-2 | 534,800 |
| 34 | 2015 | 6 | 30 | 30062015 | Landsat-8 | 5,050,000 | 364 | 2018 | 7 | 8 | 8072018 | Sentinel-2 | 15,860 |
| 35 | 2015 | 6 | 30 | 30062015 | Landsat-8 | 37,950,000 | 365 | 2018 | 7 | 13 | 13072018 | Sentinel-2 | 150,700 |
| 36 | 2015 | 6 | 30 | 30062015 | Landsat-8 | 774,700 | 366 | 2018 | 7 | 13 | 13072018 | Sentinel-2 | 37,080 |
| 37 | 2015 | 7 | 16 | 16072015 | Landsat-8 | 20,260,000 | 367 | 2018 | 7 | 13 | 13072018 | Sentinel-2 | 80,570 |
| 38 | 2015 | 7 | 16 | 16072015 | Landsat-8 | 31,120 | 368 | 2018 | 7 | 13 | 13072018 | Sentinel-2 | 7072 |
| 39 | 2015 | 7 | 16 | 16072015 | Landsat-8 | 201,900 | 369 | 2018 | 7 | 13 | 13072018 | Sentinel-2 | 18,240 |
| 40 | 2015 | 7 | 16 | 16072015 | Landsat-8 | 17,850 | 370 | 2018 | 7 | 16 | 16072018 | Sentinel-2 | 14,810 |
| 41 | 2015 | 7 | 16 | 16072015 | Landsat-8 | 5852 | 371 | 2018 | 7 | 18 | 18072018 | Sentinel-2 | 30,930 |
| 42 | 2015 | 7 | 16 | 16072015 | Landsat-8 | 5,139,000 | 372 | 2018 | 7 | 18 | 18072018 | Sentinel-2 | 14,110 |
| 43 | 2015 | 8 | 17 | 17082015 | Landsat-8 | 5,744 | 373 | 2018 | 7 | 18 | 18072018 | Sentinel-2 | 24,300 |
| 44 | 2015 | 8 | 17 | 17082015 | Landsat-8 | 570,000 | 374 | 2018 | 7 | 18 | 18072018 | Sentinel-2 | 32,030 |
| 45 | 2015 | 8 | 17 | 17082015 | Landsat-8 | 29,520 | 375 | 2018 | 7 | 21 | 21072018 | Sentinel-2 | 2570 |
| 46 | 2015 | 8 | 17 | 17082015 | Landsat-8 | 425,100 | 376 | 2018 | 7 | 21 | 21072018 | Sentinel-2 | 18,520 |
| 47 | 2015 | 8 | 17 | 17082015 | Landsat-8 | 14,340 | 377 | 2018 | 7 | 23 | 23072018 | Sentinel-2 | 12,020 |
| 48 | 2015 | 8 | 17 | 17082015 | Landsat-8 | 30,870 | 378 | 2018 | 7 | 28 | 28072018 | Sentinel-2 | 22,140 |
| 49 | 2015 | 8 | 17 | 17082015 | Landsat-8 | 22,340 | 379 | 2018 | 8 | 2 | 2082018 | Sentinel-2 | 18,320 |
| 50 | 2015 | 8 | 17 | 17082015 | Landsat-8 | 85,680 | 380 | 2018 | 8 | 2 | 2082018 | Sentinel-2 | 20,130 |
| 51 | 2015 | 8 | 17 | 17082015 | Landsat-8 | 81,850 | 381 | 2018 | 8 | 2 | 2082018 | Sentinel-2 | 1439 |
| 52 | 2015 | 8 | 17 | 17082015 | Landsat-8 | 10,690,000 | 382 | 2018 | 8 | 2 | 2082018 | Sentinel-2 | 16,770 |
| 53 | 2015 | 8 | 17 | 17082015 | Landsat-8 | 163,600 | 383 | 2018 | 8 | 2 | 2082018 | Sentinel-2 | 30,940 |
| 54 | 2015 | 8 | 17 | 17082015 | Landsat-8 | 1,174,000 | 384 | 2018 | 8 | 7 | 7082018 | Sentinel-2 | 329,800 |
| 55 | 2015 | 8 | 17 | 17082015 | Landsat-8 | 32,340 | 385 | 2018 | 8 | 7 | 7082018 | Sentinel-2 | 73,950 |
| 56 | 2015 | 8 | 17 | 17082015 | Landsat-8 | 504,100 | 386 | 2018 | 8 | 12 | 12082018 | Sentinel-2 | 31,160 |
| 57 | 2015 | 8 | 17 | 17082015 | Landsat-8 | 18,910 | 387 | 2018 | 8 | 15 | 15082018 | Sentinel-2 | 51,780 |
| 58 | 2015 | 8 | 17 | 17082015 | Landsat-8 | 15,570 | 388 | 2018 | 8 | 15 | 15082018 | Sentinel-2 | 186,900 |
| 59 | 2015 | 8 | 17 | 17082015 | Landsat-8 | 6939 | 389 | 2018 | 8 | 17 | 17082018 | Sentinel-2 | 70,270 |
| 60 | 2015 | 8 | 17 | 17082015 | Landsat-8 | 1,029,000 | 390 | 2018 | 8 | 17 | 17082018 | Sentinel-2 | 1312 |
| 61 | 2015 | 8 | 17 | 17082015 | Landsat-8 | 40,340 | 391 | 2018 | 8 | 17 | 17082018 | Sentinel-2 | 13,390 |
| 62 | 2015 | 8 | 21 | 21082015 | Sentinel-2 | 1,231,000 | 392 | 2018 | 8 | 22 | 22082018 | Sentinel-2 | 43,870 |
| 63 | 2015 | 8 | 21 | 21082015 | Sentinel-2 | 57,210 | 393 | 2018 | 8 | 22 | 22082018 | Sentinel-2 | 47,230 |
| 64 | 2015 | 9 | 2 | 2092015 | Landsat-8 | 473,800 | 394 | 2018 | 8 | 25 | 25082018 | Sentinel-2 | 710,500 |
| 65 | 2015 | 9 | 2 | 2092015 | Landsat-8 | 66,060 | 395 | 2018 | 8 | 27 | 27082018 | Sentinel-2 | 6,754,000 |
| 66 | 2015 | 9 | 2 | 2092015 | Landsat-8 | 71,790 | 396 | 2018 | 9 | 9 | 19092018 | Sentinel-2 | 59,990 |
| 67 | 2015 | 9 | 2 | 2092015 | Landsat-8 | 373,200 | 397 | 2018 | 9 | 9 | 9092018 | Sentinel-2 | 222,100 |
| 68 | 2015 | 9 | 2 | 2092015 | Landsat-8 | 6230 | 398 | 2018 | 9 | 9 | 9092018 | Sentinel-2 | 15,700 |
| 69 | 2015 | 9 | 2 | 2092015 | Landsat-8 | 5183 | 399 | 2018 | 9 | 21 | 21092018 | Sentinel-2 | 27,820 |
| 70 | 2015 | 9 | 2 | 2092015 | Landsat-8 | 8226 | 400 | 2018 | 9 | 29 | 29092018 | Sentinel-2 | 266,400 |
| 71 | 2015 | 9 | 2 | 2092015 | Landsat-8 | 7894 | 401 | 2018 | 10 | 6 | 6102018 | Sentinel-2 | 4,619,000 |
| 72 | 2015 | 9 | 18 | 18092015 | Landsat-8 | 176,300 | 402 | 2019 | 4 | 29 | 29042019 | Sentinel-2 | 18,330 |
| 73 | 2015 | 9 | 18 | 18092015 | Landsat-8 | 70,460 | 403 | 2019 | 5 | 7 | 7052019 | Sentinel-2 | 23,560 |
| 74 | 2015 | 10 | 12 | 12102015 | Landsat-7 | 303,800 | 404 | 2019 | 5 | 17 | 17052019 | Sentinel-2 | 8492 |
| 75 | 2015 | 10 | 12 | 12102015 | Landsat-7 | 329,500 | 405 | 2019 | 5 | 19 | 19052019 | Sentinel-2 | 5064 |
| 76 | 2016 | 6 | 13 | 13062016 | Sentinel-2 | 554,200 | 406 | 2019 | 5 | 22 | 22052019 | Sentinel-2 | 4721 |
| 77 | 2016 | 6 | 13 | 13062016 | Sentinel-2 | 204,500 | 407 | 2019 | 5 | 22 | 22052019 | Sentinel-2 | 7206 |
| 78 | 2016 | 6 | 13 | 13062016 | Sentinel-2 | 65,400 | 408 | 2019 | 5 | 24 | 24052019 | Sentinel-2 | 5133 |
| 79 | 2016 | 6 | 13 | 13062016 | Sentinel-2 | 92,880 | 409 | 2019 | 5 | 24 | 24052019 | Sentinel-2 | 1989 |
| 80 | 2016 | 6 | 13 | 13062016 | Sentinel-2 | 94,020 | 410 | 2019 | 5 | 24 | 24052019 | Sentinel-2 | 29,080 |
| 81 | 2016 | 6 | 13 | 13062016 | Sentinel-2 | 93,330 | 411 | 2019 | 5 | 27 | 27052019 | Sentinel-2 | 9199 |
| 82 | 2016 | 6 | 13 | 13062016 | Sentinel-2 | 51,230 | 412 | 2019 | 5 | 27 | 27052019 | Sentinel-2 | 2695 |
| 83 | 2016 | 6 | 13 | 13062016 | Sentinel-2 | 63,120 | 413 | 2019 | 5 | 29 | 29052019 | Sentinel-2 | 37,140 |
| 84 | 2016 | 6 | 13 | 13062016 | Sentinel-2 | 19,170 | 414 | 2019 | 5 | 29 | 29052019 | Sentinel-2 | 56,290 |
| 85 | 2016 | 6 | 13 | 13062016 | Sentinel-2 | 51,950 | 415 | 2019 | 5 | 29 | 29052019 | Sentinel-2 | 5268 |
| 86 | 2016 | 6 | 13 | 13062016 | Sentinel-2 | 52,380 | 416 | 2019 | 5 | 29 | 29052019 | Sentinel-2 | 6547 |
| 87 | 2016 | 6 | 13 | 13062016 | Sentinel-2 | 5987 | 417 | 2019 | 5 | 29 | 29052019 | Sentinel-2 | 12,360 |
| 88 | 2016 | 6 | 13 | 13062016 | Sentinel-2 | 4187 | 418 | 2019 | 5 | 29 | 29052019 | Sentinel-2 | 12,600 |
| 89 | 2016 | 6 | 13 | 13062016 | Sentinel-2 | 10,980 | 419 | 2019 | 5 | 29 | 29052019 | Sentinel-2 | 9172 |
| 90 | 2016 | 6 | 13 | 13062016 | Sentinel-2 | 9773 | 420 | 2019 | 5 | 29 | 29052019 | Sentinel-2 | 19,130 |
| 91 | 2016 | 6 | 13 | 13062016 | Sentinel-2 | 18,890 | 421 | 2019 | 5 | 29 | 29052019 | Sentinel-2 | 23,230 |
| 92 | 2016 | 6 | 13 | 13062016 | Sentinel-2 | 14,860 | 422 | 2019 | 5 | 29 | 29052019 | Sentinel-2 | 10,570 |
| 93 | 2016 | 6 | 13 | 13062016 | Sentinel-2 | 13,040 | 423 | 2019 | 5 | 29 | 29052019 | Sentinel-2 | 12,020 |
| 94 | 2016 | 6 | 13 | 13062016 | Sentinel-2 | 35,750 | 424 | 2019 | 5 | 29 | 29052019 | Sentinel-2 | 9245 |
| 95 | 2016 | 6 | 13 | 13062016 | Sentinel-2 | 22,730 | 425 | 2019 | 5 | 29 | 29052019 | Sentinel-2 | 5655 |
| 96 | 2016 | 6 | 13 | 13062016 | Sentinel-2 | 10,230 | 426 | 2019 | 6 | 1 | 1062019 | Sentinel-2 | 5789 |
| 97 | 2016 | 6 | 13 | 13062016 | Sentinel-2 | 2073 | 427 | 2019 | 6 | 1 | 1062019 | Sentinel-2 | 9754 |
| 98 | 2016 | 6 | 13 | 13062016 | Sentinel-2 | 6431 | 428 | 2019 | 6 | 1 | 1062019 | Sentinel-2 | 9351 |
| 99 | 2016 | 6 | 13 | 13062016 | Sentinel-2 | 6260 | 429 | 2019 | 6 | 1 | 1062019 | Sentinel-2 | 3766 |
| 100 | 2016 | 6 | 13 | 13062016 | Sentinel-2 | 9379 | 430 | 2019 | 6 | 1 | 1062019 | Sentinel-2 | 5845 |
| 101 | 2016 | 6 | 13 | 13062016 | Sentinel-2 | 5558 | 431 | 2019 | 6 | 1 | 1062019 | Sentinel-2 | 5484 |
| 102 | 2016 | 6 | 13 | 13062016 | Sentinel-2 | 20,580 | 432 | 2019 | 6 | 1 | 1062019 | Sentinel-2 | 2018 |
| 103 | 2016 | 6 | 13 | 13062016 | Sentinel-2 | 6165 | 433 | 2019 | 6 | 3 | 3062019 | Sentinel-2 | 283,100 |
| 104 | 2016 | 6 | 13 | 13062016 | Sentinel-2 | 22,410 | 434 | 2019 | 6 | 3 | 3062019 | Sentinel-2 | 5181 |
| 105 | 2016 | 6 | 13 | 13062016 | Sentinel-2 | 17,170 | 435 | 2019 | 6 | 3 | 3062019 | Sentinel-2 | 78,140 |
| 106 | 2016 | 6 | 13 | 13062016 | Sentinel-2 | 2872 | 436 | 2019 | 6 | 3 | 3062019 | Sentinel-2 | 21,100 |
| 107 | 2016 | 6 | 13 | 13062016 | Sentinel-2 | 17,040 | 437 | 2019 | 6 | 3 | 3062019 | Sentinel-2 | 8376 |
| 108 | 2016 | 6 | 13 | 13062016 | Sentinel-2 | 3433 | 438 | 2019 | 6 | 6 | 6062019 | Sentinel-2 | 6335 |
| 109 | 2016 | 6 | 13 | 13062016 | Sentinel-2 | 2833 | 439 | 2019 | 6 | 8 | 8062019 | Sentinel-2 | 16,510 |
| 110 | 2016 | 6 | 26 | 26062016 | Sentinel-2 | 7,536,000 | 440 | 2019 | 6 | 8 | 8062019 | Sentinel-2 | 12,400 |
| 111 | 2016 | 6 | 26 | 26062016 | Sentinel-2 | 1,304,000 | 441 | 2019 | 6 | 8 | 8062019 | Sentinel-2 | 37,900 |
| 112 | 2016 | 6 | 26 | 26062016 | Sentinel-2 | 280,800 | 442 | 2019 | 6 | 8 | 8062019 | Sentinel-2 | 26,980 |
| 113 | 2016 | 6 | 26 | 26062016 | Sentinel-2 | 488,300 | 443 | 2019 | 6 | 8 | 8062019 | Sentinel-2 | 11,840 |
| 114 | 2016 | 6 | 26 | 26062016 | Sentinel-2 | 63,250 | 444 | 2019 | 6 | 11 | 11062019 | Sentinel-2 | 52,760 |
| 115 | 2016 | 6 | 26 | 26062016 | Sentinel-2 | 36,640 | 445 | 2019 | 6 | 11 | 11072019 | Sentinel-2 | 157,400 |
| 116 | 2016 | 6 | 26 | 26062016 | Sentinel-2 | 91,530 | 446 | 2019 | 6 | 11 | 11072019 | Sentinel-2 | 236,700 |
| 117 | 2016 | 6 | 26 | 26062016 | Sentinel-2 | 66,310 | 447 | 2019 | 6 | 13 | 13062019 | Sentinel-2 | 303,000 |
| 118 | 2016 | 6 | 26 | 26062016 | Sentinel-2 | 5005 | 448 | 2019 | 6 | 13 | 13062019 | Sentinel-2 | 58,870 |
| 119 | 2016 | 6 | 26 | 26062016 | Sentinel-2 | 25,710 | 449 | 2019 | 6 | 13 | 13062019 | Sentinel-2 | 15,500 |
| 120 | 2016 | 6 | 26 | 26062016 | Sentinel-2 | 252,400 | 450 | 2019 | 6 | 13 | 13062019 | Sentinel-2 | 47,520 |
| 121 | 2016 | 6 | 26 | 26062016 | Sentinel-2 | 29,010 | 451 | 2019 | 6 | 13 | 13062019 | Sentinel-2 | 3789 |
| 122 | 2016 | 7 | 3 | 3072016 | Sentinel-2 | 168,200 | 452 | 2019 | 6 | 13 | 13062019 | Sentinel-2 | 4943 |
| 123 | 2016 | 7 | 3 | 3072016 | Sentinel-2 | 50,910 | 453 | 2019 | 6 | 13 | 13062019 | Sentinel-2 | 17,630 |
| 124 | 2016 | 7 | 3 | 3072016 | Sentinel-2 | 22,700 | 454 | 2019 | 6 | 13 | 13062019 | Sentinel-2 | 1962 |
| 125 | 2016 | 7 | 3 | 3072016 | Sentinel-2 | 36,420 | 455 | 2019 | 6 | 13 | 13062019 | Sentinel-2 | 4811 |
| 126 | 2016 | 7 | 3 | 3072016 | Sentinel-2 | 21,480 | 456 | 2019 | 6 | 18 | 18062019 | Sentinel-2 | 20,380 |
| 127 | 2016 | 7 | 3 | 3072016 | Sentinel-2 | 53,180 | 457 | 2019 | 6 | 18 | 18062019 | Sentinel-2 | 45,740 |
| 128 | 2016 | 7 | 3 | 3072016 | Sentinel-2 | 48,910 | 458 | 2019 | 6 | 18 | 18062019 | Sentinel-2 | 15,340 |
| 129 | 2016 | 7 | 3 | 3072016 | Sentinel-2 | 45,660 | 459 | 2019 | 6 | 18 | 18062019 | Sentinel-2 | 9706 |
| 130 | 2016 | 7 | 3 | 3072016 | Sentinel-2 | 21,640 | 460 | 2019 | 6 | 18 | 18062019 | Sentinel-2 | 7033 |
| 131 | 2016 | 7 | 3 | 3072016 | Sentinel-2 | 328,700 | 461 | 2019 | 6 | 18 | 18062019 | Sentinel-2 | 7621 |
| 132 | 2016 | 7 | 3 | 3072016 | Sentinel-2 | 315,300 | 462 | 2019 | 6 | 18 | 18062019 | Sentinel-2 | 2,261,000 |
| 133 | 2016 | 7 | 3 | 3072016 | Sentinel-2 | 114,600 | 463 | 2019 | 6 | 18 | 18062019 | Sentinel-2 | 188,600 |
| 134 | 2016 | 7 | 3 | 3072016 | Sentinel-2 | 8185 | 464 | 2019 | 6 | 23 | 23062019 | Sentinel-2 | 169,300 |
| 135 | 2016 | 7 | 3 | 3072016 | Sentinel-2 | 16,380 | 465 | 2019 | 6 | 23 | 23062019 | Sentinel-2 | 193,200 |
| 136 | 2016 | 7 | 3 | 3072016 | Sentinel-2 | 13,850 | 466 | 2019 | 6 | 23 | 23062019 | Sentinel-2 | 827,800 |
| 137 | 2016 | 7 | 3 | 3072016 | Sentinel-2 | 17,550 | 467 | 2019 | 6 | 23 | 23062019 | Sentinel-2 | 33,610 |
| 138 | 2016 | 7 | 3 | 3072016 | Sentinel-2 | 30,480 | 468 | 2019 | 6 | 23 | 23062019 | Sentinel-2 | 9397 |
| 139 | 2016 | 7 | 3 | 3072016 | Sentinel-2 | 20,500 | 469 | 2019 | 6 | 28 | 28062019 | Sentinel-2 | 20,640 |
| 140 | 2016 | 7 | 3 | 3072016 | Sentinel-2 | 7337 | 470 | 2019 | 6 | 28 | 28062019 | Sentinel-2 | 11,670 |
| 141 | 2016 | 7 | 3 | 3072016 | Sentinel-2 | 12,400 | 471 | 2019 | 6 | 28 | 28062019 | Sentinel-2 | 400,700 |
| 142 | 2016 | 7 | 3 | 3072016 | Sentinel-2 | 7921 | 472 | 2019 | 6 | 28 | 28062019 | Sentinel-2 | 31,680 |
| 143 | 2016 | 7 | 3 | 3072016 | Sentinel-2 | 4858 | 473 | 2019 | 6 | 28 | 28062019 | Sentinel-2 | 2599 |
| 144 | 2016 | 7 | 3 | 3072016 | Sentinel-2 | 13,790 | 474 | 2019 | 6 | 28 | 28062019 | Sentinel-2 | 39,200 |
| 145 | 2016 | 7 | 3 | 3072016 | Sentinel-2 | 5691 | 475 | 2019 | 7 | 1 | 1072019 | Sentinel-2 | 5961 |
| 146 | 2016 | 7 | 3 | 3072016 | Sentinel-2 | 2234 | 476 | 2019 | 7 | 1 | 1072019 | Sentinel-2 | 5371 |
| 147 | 2016 | 7 | 3 | 3072016 | Sentinel-2 | 9517 | 477 | 2019 | 7 | 3 | 3072019 | Sentinel-2 | 68,200 |
| 148 | 2016 | 7 | 3 | 3072016 | Sentinel-2 | 27,420 | 478 | 2019 | 7 | 3 | 3072019 | Sentinel-2 | 12,410 |
| 149 | 2016 | 7 | 16 | 16072016 | Sentinel-2 | 10,580,000 | 479 | 2019 | 7 | 3 | 3072019 | Sentinel-2 | 127,800 |
| 150 | 2016 | 7 | 16 | 16072016 | Sentinel-2 | 294,700 | 480 | 2019 | 7 | 3 | 3072019 | Sentinel-2 | 83,930 |
| 151 | 2016 | 7 | 16 | 16072016 | Sentinel-2 | 1,651,000 | 481 | 2019 | 7 | 3 | 3072019 | Sentinel-2 | 33,420 |
| 152 | 2016 | 7 | 16 | 16072016 | Sentinel-2 | 8215 | 482 | 2019 | 7 | 3 | 3072019 | Sentinel-2 | 4297 |
| 153 | 2016 | 7 | 16 | 16072016 | Sentinel-2 | 2,646,000 | 483 | 2019 | 7 | 3 | 3072019 | Sentinel-2 | 29,800 |
| 154 | 2016 | 7 | 16 | 16072016 | Sentinel-2 | 6052 | 484 | 2019 | 7 | 3 | 3072019 | Sentinel-2 | 10,410 |
| 155 | 2016 | 7 | 16 | 16072016 | Sentinel-2 | 36,440 | 485 | 2019 | 7 | 6 | 6072019 | Sentinel-2 | 3221 |
| 156 | 2016 | 7 | 16 | 16072016 | Sentinel-2 | 17,340 | 486 | 2019 | 7 | 8 | 8072019 | Sentinel-2 | 31,720 |
| 157 | 2016 | 7 | 16 | 16072016 | Sentinel-2 | 7591 | 487 | 2019 | 7 | 8 | 8072019 | Sentinel-2 | 7330 |
| 158 | 2016 | 7 | 16 | 16072016 | Sentinel-2 | 113,500 | 488 | 2019 | 7 | 8 | 8072019 | Sentinel-2 | 605,900 |
| 159 | 2016 | 7 | 16 | 16072016 | Sentinel-2 | 10,480 | 489 | 2019 | 7 | 8 | 8072019 | Sentinel-2 | 5203 |
| 160 | 2016 | 7 | 16 | 16072016 | Sentinel-2 | 5788 | 490 | 2019 | 7 | 8 | 8072019 | Sentinel-2 | 15,210 |
| 161 | 2016 | 7 | 16 | 16072016 | Sentinel-2 | 6107 | 491 | 2019 | 7 | 8 | 8072019 | Sentinel-2 | 17,080 |
| 162 | 2016 | 7 | 16 | 16072016 | Sentinel-2 | 2623 | 492 | 2019 | 7 | 13 | 13072019 | Sentinel-2 | 11,430 |
| 163 | 2016 | 7 | 16 | 16072016 | Sentinel-2 | 11,340 | 493 | 2019 | 7 | 13 | 13072019 | Sentinel-2 | 26,720 |
| 164 | 2016 | 7 | 16 | 16072016 | Sentinel-2 | 24,420 | 494 | 2019 | 7 | 14 | 14052019 | Sentinel-2 | 10,360 |
| 165 | 2016 | 7 | 16 | 16072016 | Sentinel-2 | 1178 | 495 | 2019 | 7 | 16 | 16072019 | Sentinel-2 | 84,870 |
| 166 | 2016 | 7 | 16 | 16072016 | Sentinel-2 | 14,990 | 496 | 2019 | 7 | 16 | 16072019 | Sentinel-2 | 56,510 |
| 167 | 2016 | 7 | 16 | 16072016 | Sentinel-2 | 15,330 | 497 | 2019 | 7 | 18 | 18072019 | Sentinel-2 | 6161 |
| 168 | 2016 | 7 | 16 | 16072016 | Sentinel-2 | 348,700 | 498 | 2019 | 7 | 23 | 23072019 | Sentinel-2 | 13,120 |
| 169 | 2016 | 7 | 16 | 16072016 | Sentinel-2 | 16,630 | 499 | 2019 | 7 | 23 | 23072019 | Sentinel-2 | 15,820 |
| 170 | 2016 | 7 | 16 | 16072016 | Sentinel-2 | 6034 | 500 | 2019 | 7 | 23 | 23072019 | Sentinel-2 | 32,250 |
| 171 | 2016 | 7 | 16 | 16072016 | Sentinel-2 | 3501 | 501 | 2019 | 7 | 28 | 28072019 | Sentinel-2 | 65,860 |
| 172 | 2016 | 7 | 16 | 16072016 | Sentinel-2 | 7033 | 502 | 2019 | 7 | 28 | 28072019 | Sentinel-2 | 60,370 |
| 173 | 2016 | 7 | 16 | 16072016 | Sentinel-2 | 6112 | 503 | 2019 | 7 | 31 | 31072019 | Sentinel-2 | 10,880,000 |
| 174 | 2016 | 7 | 16 | 16072016 | Sentinel-2 | 1992 | 504 | 2019 | 7 | 31 | 31072019 | Sentinel-2 | 150,400 |
| 175 | 2016 | 7 | 16 | 16072016 | Sentinel-2 | 854.9 | 505 | 2019 | 7 | 31 | 31072019 | Sentinel-2 | 60,240 |
| 176 | 2016 | 7 | 16 | 16072016 | Sentinel-2 | 243,100 | 506 | 2019 | 7 | 31 | 31072019 | Sentinel-2 | 2749 |
| 177 | 2016 | 7 | 23 | 23072016 | Sentinel-2 | 79,710 | 507 | 2019 | 8 | 5 | 5082019 | Sentinel-2 | 9158 |
| 178 | 2016 | 7 | 23 | 23072016 | Sentinel-2 | 5622 | 508 | 2019 | 8 | 7 | 7082019 | Sentinel-2 | 530,800 |
| 179 | 2016 | 7 | 23 | 23072016 | Sentinel-2 | 4053 | 509 | 2019 | 8 | 7 | 7082019 | Sentinel-2 | 266,100 |
| 180 | 2016 | 7 | 23 | 23072016 | Sentinel-2 | 15,120 | 510 | 2019 | 8 | 7 | 7082019 | Sentinel-2 | 13,530,000 |
| 181 | 2016 | 7 | 23 | 23072016 | Sentinel-2 | 5374 | 511 | 2019 | 8 | 7 | 7082019 | Sentinel-2 | 105,500 |
| 182 | 2016 | 7 | 23 | 23072016 | Sentinel-2 | 386.8 | 512 | 2019 | 8 | 17 | 17082019 | Sentinel-2 | 1,737,000 |
| 183 | 2016 | 7 | 23 | 23072016 | Sentinel-2 | 479.5 | 513 | 2019 | 8 | 17 | 17082019 | Sentinel-2 | 95,000 |
| 184 | 2016 | 7 | 23 | 23072016 | Sentinel-2 | 3878 | 514 | 2019 | 8 | 17 | 17082019 | Sentinel-2 | 289,000 |
| 185 | 2016 | 7 | 23 | 23072016 | Sentinel-2 | 3388 | 515 | 2019 | 8 | 17 | 17082019 | Sentinel-2 | 34,110 |
| 186 | 2016 | 7 | 23 | 23072016 | Sentinel-2 | 11,770 | 516 | 2019 | 8 | 20 | 20082019 | Sentinel-2 | 57,440 |
| 187 | 2016 | 7 | 23 | 23072016 | Sentinel-2 | 1466 | 517 | 2019 | 8 | 22 | 22082019 | Sentinel-2 | 61,490 |
| 188 | 2016 | 7 | 23 | 23072016 | Sentinel-2 | 1515 | 518 | 2019 | 8 | 22 | 22082019 | Sentinel-2 | 3327 |
| 189 | 2016 | 7 | 23 | 23072016 | Sentinel-2 | 3239 | 519 | 2019 | 8 | 30 | 30082019 | Sentinel-2 | 8,957,000 |
| 190 | 2016 | 7 | 23 | 23072016 | Sentinel-2 | 388,900 | 520 | 2019 | 8 | 30 | 30082019 | Sentinel-2 | 23,200 |
| 191 | 2016 | 7 | 23 | 23072016 | Sentinel-2 | 9926 | 521 | 2019 | 9 | 1 | 1092019 | Sentinel-2 | 2,280,000 |
| 192 | 2016 | 7 | 23 | 23072016 | Sentinel-2 | 3390 | 522 | 2019 | 9 | 1 | 1092019 | Sentinel-2 | 1,438,000 |
| 193 | 2016 | 7 | 23 | 23072016 | Sentinel-2 | 219,500 | 523 | 2019 | 9 | 1 | 1092019 | Sentinel-2 | 9084 |
| 194 | 2016 | 7 | 23 | 23072016 | Sentinel-2 | 8915 | 524 | 2019 | 9 | 1 | 1092019 | Sentinel-2 | 150,700 |
| 195 | 2016 | 7 | 23 | 23072016 | Sentinel-2 | 52,410 | 525 | 2019 | 9 | 1 | 1092019 | Sentinel-2 | 2,810,000 |
| 196 | 2016 | 7 | 23 | 23072016 | Sentinel-2 | 39,210 | 526 | 2019 | 9 | 1 | 1092019 | Sentinel-2 | 44,940 |
| 197 | 2016 | 7 | 23 | 23072016 | Sentinel-2 | 19,710 | 527 | 2019 | 9 | 1 | 1092019 | Sentinel-2 | 26,510 |
| 198 | 2016 | 7 | 23 | 23072016 | Sentinel-2 | 25,620 | 528 | 2019 | 9 | 1 | 1092019 | Sentinel-2 | 2835 |
| 199 | 2016 | 7 | 23 | 23072016 | Sentinel-2 | 18,450 | 529 | 2019 | 9 | 1 | 1092019 | Sentinel-2 | 106,400 |
| 200 | 2016 | 7 | 23 | 23072016 | Sentinel-2 | 67,460 | 530 | 2019 | 9 | 1 | 1092019 | Sentinel-2 | 7332 |
| 201 | 2016 | 7 | 23 | 23072016 | Sentinel-2 | 4843 | 531 | 2019 | 9 | 6 | 6092019 | Sentinel-2 | 12,650 |
| 202 | 2016 | 7 | 23 | 23072016 | Sentinel-2 | 97,420 | 532 | 2019 | 9 | 6 | 6092019 | Sentinel-2 | 179,500 |
| 203 | 2016 | 7 | 23 | 23072016 | Sentinel-2 | 23,450 | 533 | 2019 | 9 | 6 | 6092019 | Sentinel-2 | 12,040 |
| 204 | 2016 | 7 | 23 | 23072016 | Sentinel-2 | 20,230 | 534 | 2019 | 9 | 6 | 6092019 | Sentinel-2 | 67,160 |
| 205 | 2016 | 7 | 23 | 23072016 | Sentinel-2 | 5118 | 535 | 2019 | 9 | 11 | 11092019 | Sentinel-2 | 1,058,000 |
| 206 | 2016 | 7 | 23 | 23072016 | Sentinel-2 | 2605 | 536 | 2019 | 9 | 21 | 21092019 | Sentinel-2 | 64,710 |
| 207 | 2016 | 7 | 26 | 26072016 | Sentinel-2 | 88,380 | 537 | 2019 | 9 | 24 | 24092019 | Sentinel-2 | 27,290 |
| 208 | 2016 | 7 | 26 | 26072016 | Sentinel-2 | 22,470 | 538 | 2019 | 9 | 24 | 24092019 | Sentinel-2 | 44,440 |
| 209 | 2016 | 7 | 26 | 26072016 | Sentinel-2 | 6720 | 539 | 2019 | 10 | 4 | 4102019 | Sentinel-2 | 13,200 |
| 210 | 2016 | 7 | 26 | 26072016 | Sentinel-2 | 11,980 | 540 | 2019 | 10 | 6 | 6102019 | Sentinel-2 | 62,150 |
| 211 | 2016 | 7 | 26 | 26072016 | Sentinel-2 | 4417 | 541 | 2019 | 10 | 6 | 6102019 | Sentinel-2 | 70,370 |
| 212 | 2016 | 7 | 26 | 26072016 | Sentinel-2 | 7437 | 542 | 2019 | 10 | 6 | 6102019 | Sentinel-2 | 48,690 |
| 213 | 2016 | 7 | 26 | 26072016 | Sentinel-2 | 11,370 | 543 | 2019 | 10 | 6 | 6102019 | Sentinel-2 | 24,760 |
| 214 | 2016 | 8 | 26 | 6072016 | Sentinel-2 | 8876 | 544 | 2019 | 10 | 6 | 6102019 | Sentinel-2 | 10,610 |
| 215 | 2016 | 8 | 5 | 5082016 | Sentinel-2 | 13,670 | 545 | 2019 | 10 | 6 | 6102019 | Sentinel-2 | 18,430 |
| 216 | 2016 | 8 | 5 | 5082016 | Sentinel-2 | 31,270 | 546 | 2019 | 10 | 6 | 6102019 | Sentinel-2 | 93,260 |
| 217 | 2016 | 8 | 5 | 5082016 | Sentinel-2 | 10,000 | 547 | 2019 | 10 | 11 | 11102019 | Sentinel-2 | 51,390 |
| 218 | 2016 | 8 | 5 | 5082016 | Sentinel-2 | 18,930 | 548 | 2019 | 10 | 11 | 11102019 | Sentinel-2 | 69,020 |
| 219 | 2016 | 8 | 5 | 5082016 | Sentinel-2 | 26,190 | 549 | 2019 | 10 | 16 | 16102019 | Sentinel-2 | 317,100 |
| 220 | 2016 | 8 | 12 | 12082016 | Sentinel-2 | 6405 | 550 | 2019 | 10 | 16 | 16102019 | Sentinel-2 | 22,580 |
| 221 | 2016 | 8 | 12 | 12082016 | Sentinel-2 | 4811 | 551 | 2020 | 4 | 21 | 21042020 | Sentinel-2 | 21,670 |
| 222 | 2016 | 8 | 12 | 12082016 | Sentinel-2 | 22,930 | 552 | 2020 | 5 | 1 | 1052020 | Sentinel-2 | 121,700 |
| 223 | 2016 | 8 | 12 | 12082016 | Sentinel-2 | 24,830 | 553 | 2020 | 5 | 1 | 1052020 | Sentinel-2 | 19,810 |
| 224 | 2016 | 8 | 12 | 12082016 | Sentinel-2 | 63,220 | 554 | 2020 | 5 | 13 | 13052020 | Sentinel-2 | 19,930 |
| 225 | 2016 | 8 | 12 | 12082016 | Sentinel-2 | 10,610 | 555 | 2020 | 5 | 23 | 23052020 | Sentinel-2 | 887,700 |
| 226 | 2016 | 8 | 12 | 12082016 | Sentinel-2 | 24,650 | 556 | 2020 | 5 | 23 | 23052020 | Sentinel-2 | 23,840 |
| 227 | 2016 | 8 | 12 | 12082016 | Sentinel-2 | 15,390 | 557 | 2020 | 5 | 31 | 31052020 | Sentinel-2 | 1,312,000 |
| 228 | 2016 | 8 | 15 | 15082016 | Sentinel-2 | 75,710 | 558 | 2020 | 5 | 31 | 31052020 | Sentinel-2 | 2,885,000 |
| 229 | 2016 | 8 | 15 | 15082016 | Sentinel-2 | 18,650 | 559 | 2020 | 5 | 31 | 31052020 | Sentinel-2 | 91,550 |
| 230 | 2016 | 8 | 25 | 25082016 | Sentinel-2 | 75,080 | 560 | 2020 | 5 | 31 | 31052020 | Sentinel-2 | 15,290 |
| 231 | 2016 | 8 | 25 | 25082016 | Sentinel-2 | 30,690 | 561 | 2020 | 6 | 2 | 2062020 | Sentinel-2 | 26,690 |
| 232 | 2016 | 8 | 25 | 25082016 | Sentinel-2 | 18,470 | 562 | 2020 | 6 | 2 | 2062020 | Sentinel-2 | 115,600 |
| 233 | 2016 | 8 | 25 | 25082016 | Sentinel-2 | 25,320 | 563 | 2020 | 6 | 2 | 2062020 | Sentinel-2 | 61,700 |
| 234 | 2016 | 8 | 25 | 25082016 | Sentinel-2 | 4354 | 564 | 2020 | 6 | 2 | 2062020 | Sentinel-2 | 26,580 |
| 235 | 2016 | 8 | 25 | 25082016 | Sentinel-2 | 4900 | 565 | 2020 | 6 | 2 | 2062020 | Sentinel-2 | 8253 |
| 236 | 2016 | 8 | 25 | 25082016 | Sentinel-2 | 42,380 | 566 | 2020 | 6 | 2 | 2062020 | Sentinel-2 | 101,300 |
| 237 | 2016 | 9 | 1 | 1092016 | Sentinel-2 | 2,469,000 | 567 | 2020 | 6 | 5 | 5062020 | Sentinel-2 | 161,800 |
| 238 | 2016 | 9 | 1 | 1092016 | Sentinel-2 | 12,790,000 | 568 | 2020 | 6 | 5 | 5062020 | Sentinel-2 | 10,270 |
| 239 | 2016 | 9 | 1 | 1092016 | Sentinel-2 | 32,740 | 569 | 2020 | 6 | 5 | 5062020 | Sentinel-2 | 46,650 |
| 240 | 2016 | 9 | 1 | 1092016 | Sentinel-2 | 227,100 | 570 | 2020 | 6 | 5 | 5062020 | Sentinel-2 | 78,100 |
| 241 | 2016 | 9 | 1 | 1092016 | Sentinel-2 | 40,910 | 571 | 2020 | 6 | 5 | 5062020 | Sentinel-2 | 13,910 |
| 242 | 2016 | 9 | 1 | 1092016 | Sentinel-2 | 22,590 | 572 | 2020 | 6 | 7 | 7062020 | Sentinel-2 | 12,770 |
| 243 | 2016 | 9 | 1 | 1092016 | Sentinel-2 | 11,440 | 573 | 2020 | 6 | 7 | 7062020 | Sentinel-2 | 7744 |
| 244 | 2017 | 5 | 9 | 9052017 | Sentinel-2 | 18,140 | 574 | 2020 | 6 | 7 | 7062020 | Sentinel-2 | 2224 |
| 245 | 2017 | 5 | 9 | 9052017 | Sentinel-2 | 1764 | 575 | 2020 | 6 | 7 | 7062020 | Sentinel-2 | 39,130 |
| 246 | 2017 | 5 | 9 | 9052017 | Sentinel-2 | 6671 | 576 | 2020 | 6 | 7 | 7062020 | Sentinel-2 | 101,400 |
| 247 | 2017 | 5 | 9 | 9052017 | Sentinel-2 | 23,640 | 577 | 2020 | 6 | 7 | 7062020 | Sentinel-2 | 2534 |
| 248 | 2017 | 5 | 9 | 9052017 | Sentinel-2 | 9006 | 578 | 2020 | 6 | 7 | 7062020 | Sentinel-2 | 38,610 |
| 249 | 2017 | 5 | 9 | 9052017 | Sentinel-2 | 7851 | 579 | 2020 | 6 | 7 | 7062020 | Sentinel-2 | 13,470 |
| 250 | 2017 | 5 | 12 | 12052017 | Sentinel-2 | 27,370 | 580 | 2020 | 6 | 7 | 7062020 | Sentinel-2 | 38,620 |
| 251 | 2017 | 5 | 22 | 22052017 | Sentinel-2 | 60,670 | 581 | 2020 | 6 | 7 | 7062020 | Sentinel-2 | 3642 |
| 252 | 2017 | 5 | 22 | 22052017 | Sentinel-2 | 50,050 | 582 | 2020 | 6 | 7 | 7062020 | Sentinel-2 | 5200 |
| 253 | 2017 | 5 | 22 | 22052017 | Sentinel-2 | 83,490 | 583 | 2020 | 6 | 7 | 7062020 | Sentinel-2 | 5954 |
| 254 | 2017 | 5 | 22 | 22052017 | Sentinel-2 | 18,550 | 584 | 2020 | 6 | 10 | 10062020 | Sentinel-2 | 132,800 |
| 255 | 2017 | 5 | 22 | 22052017 | Sentinel-2 | 16,510 | 585 | 2020 | 6 | 12 | 12062020 | Sentinel-2 | 35,480 |
| 256 | 2017 | 5 | 22 | 22052017 | Sentinel-2 | 1706 | 586 | 2020 | 6 | 12 | 12062020 | Sentinel-2 | 216,000 |
| 257 | 2017 | 5 | 22 | 22052017 | Sentinel-2 | 32,730 | 587 | 2020 | 6 | 12 | 12062020 | Sentinel-2 | 36,830 |
| 258 | 2017 | 5 | 22 | 22052017 | Sentinel-2 | 205,600 | 588 | 2020 | 6 | 12 | 12062020 | Sentinel-2 | 13,670 |
| 259 | 2017 | 5 | 22 | 22052017 | Sentinel-2 | 5801 | 589 | 2020 | 6 | 12 | 12062020 | Sentinel-2 | 116,800 |
| 260 | 2017 | 5 | 22 | 22052017 | Sentinel-2 | 34,290 | 590 | 2020 | 6 | 12 | 12062020 | Sentinel-2 | 20,480 |
| 261 | 2017 | 5 | 22 | 22052017 | Sentinel-2 | 26,930 | 591 | 2020 | 6 | 17 | 17062020 | Sentinel-2 | 262,300 |
| 262 | 2017 | 5 | 29 | 29052017 | Sentinel-2 | 12,960 | 592 | 2020 | 6 | 17 | 17062020 | Sentinel-2 | 27,250 |
| 263 | 2017 | 5 | 29 | 29052017 | Sentinel-2 | 51,440 | 593 | 2020 | 6 | 17 | 17062020 | Sentinel-2 | 58,620 |
| 264 | 2017 | 5 | 29 | 29052017 | Sentinel-2 | 42,960 | 594 | 2020 | 6 | 22 | 22062020 | Sentinel-2 | 38,590 |
| 265 | 2017 | 5 | 29 | 29052017 | Sentinel-2 | 73,730 | 595 | 2020 | 6 | 22 | 22062020 | Sentinel-2 | 12,970 |
| 266 | 2017 | 5 | 29 | 29052017 | Sentinel-2 | 4667 | 596 | 2020 | 6 | 25 | 25062020 | Sentinel-2 | 642,900 |
| 267 | 2017 | 5 | 29 | 29052017 | Sentinel-2 | 2779 | 597 | 2020 | 6 | 25 | 25062020 | Sentinel-2 | 7354 |
| 268 | 2017 | 5 | 29 | 29052017 | Sentinel-2 | 5866 | 598 | 2020 | 6 | 25 | 25062020 | Sentinel-2 | 569,400 |
| 269 | 2017 | 5 | 29 | 29052017 | Sentinel-2 | 20,300 | 599 | 2020 | 6 | 27 | 27062020 | Sentinel-2 | 381,700 |
| 270 | 2017 | 5 | 29 | 29052017 | Sentinel-2 | 5799 | 600 | 2020 | 6 | 27 | 27062020 | Sentinel-2 | 122,400 |
| 271 | 2017 | 5 | 29 | 29052017 | Sentinel-2 | 16,910 | 601 | 2020 | 6 | 27 | 27062020 | Sentinel-2 | 9,103,000 |
| 272 | 2017 | 5 | 29 | 29052017 | Sentinel-2 | 5432 | 602 | 2020 | 6 | 27 | 27062020 | Sentinel-2 | 7893 |
| 273 | 2017 | 5 | 29 | 29052017 | Sentinel-2 | 4607 | 603 | 2020 | 6 | 27 | 27062020 | Sentinel-2 | 4949 |
| 274 | 2017 | 5 | 29 | 29052017 | Sentinel-2 | 49,690 | 604 | 2020 | 6 | 27 | 27062020 | Sentinel-2 | 11,370 |
| 275 | 2017 | 6 | 1 | 1062017 | Sentinel-2 | 1,105,000 | 605 | 2020 | 6 | 27 | 27062020 | Sentinel-2 | 3730 |
| 276 | 2017 | 6 | 11 | 11062017 | Sentinel-2 | 76,350 | 606 | 2020 | 6 | 30 | 30062020 | Sentinel-2 | 17,380 |
| 277 | 2017 | 6 | 11 | 11062017 | Sentinel-2 | 12,840 | 607 | 2020 | 6 | 30 | 30062020 | Sentinel-2 | 8559 |
| 278 | 2017 | 7 | 1 | 1072017 | Sentinel-2 | 169,000 | 608 | 2020 | 7 | 2 | 2072020 | Sentinel-2 | 1,105,000 |
| 279 | 2017 | 7 | 1 | 1072017 | Sentinel-2 | 293,00 | 609 | 2020 | 7 | 2 | 2072020 | Sentinel-2 | 6,691,000 |
| 280 | 2017 | 7 | 1 | 1072017 | Sentinel-2 | 440,600 | 610 | 2020 | 7 | 2 | 2072020 | Sentinel-2 | 33,270 |
| 281 | 2017 | 7 | 1 | 1072017 | Sentinel-2 | 2,732,000 | 611 | 2020 | 7 | 2 | 2072020 | Sentinel-2 | 1,209,000 |
| 282 | 2017 | 7 | 1 | 1072017 | Sentinel-2 | 11,550 | 612 | 2020 | 7 | 2 | 2072020 | Sentinel-2 | 55,370 |
| 283 | 2017 | 7 | 1 | 1072017 | Sentinel-2 | 8572 | 613 | 2020 | 7 | 2 | 2072020 | Sentinel-2 | 49,600 |
| 284 | 2017 | 7 | 1 | 1072017 | Sentinel-2 | 6875 | 614 | 2020 | 7 | 2 | 2072020 | Sentinel-2 | 24,310 |
| 285 | 2017 | 7 | 1 | 1072017 | Sentinel-2 | 17,300 | 615 | 2020 | 7 | 2 | 2072020 | Sentinel-2 | 89,960 |
| 286 | 2017 | 7 | 3 | 3072017 | Sentinel-2 | 54,790 | 616 | 2020 | 7 | 2 | 2072020 | Sentinel-2 | 19,590 |
| 287 | 2017 | 7 | 3 | 3072017 | Sentinel-2 | 16,890 | 617 | 2020 | 7 | 2 | 2072020 | Sentinel-2 | 6726 |
| 288 | 2017 | 7 | 6 | 6072017 | Sentinel-2 | 497,600 | 618 | 2020 | 7 | 5 | 5072020 | Sentinel-2 | 61,330 |
| 289 | 2017 | 7 | 11 | 11072017 | Sentinel-2 | 134,100 | 619 | 2020 | 7 | 5 | 5072020 | Sentinel-2 | 328,500 |
| 290 | 2017 | 7 | 11 | 11072017 | Sentinel-2 | 918,300 | 620 | 2020 | 7 | 31 | 31072018 | Sentinel-2 | 7608 |
| 291 | 2017 | 7 | 11 | 11072017 | Sentinel-2 | 18,570 | 621 | 2020 | 7 | 7 | 7072020 | Sentinel-2 | 4874 |
| 292 | 2017 | 7 | 11 | 11072017 | Sentinel-2 | 6539 | 622 | 2020 | 7 | 7 | 7072020 | Sentinel-2 | 18,690 |
| 293 | 2017 | 7 | 11 | 11072017 | Sentinel-2 | 14,830 | 623 | 2020 | 7 | 7 | 7072020 | Sentinel-2 | 19,190 |
| 294 | 2017 | 7 | 23 | 23072017 | Sentinel-2 | 172,600 | 624 | 2020 | 7 | 7 | 7072020 | Sentinel-2 | 3615 |
| 295 | 2017 | 7 | 23 | 23072017 | Sentinel-2 | 31,660 | 625 | 2020 | 7 | 7 | 7072020 | Sentinel-2 | 108,600 |
| 296 | 2017 | 7 | 23 | 23072017 | Sentinel-2 | 169,000 | 626 | 2020 | 7 | 7 | 7072020 | Sentinel-2 | 10,350 |
| 297 | 2017 | 7 | 23 | 23072017 | Sentinel-2 | 2053 | 627 | 2020 | 7 | 12 | 12072020 | Sentinel-2 | 20,180 |
| 298 | 2017 | 7 | 23 | 23072017 | Sentinel-2 | 10,480 | 628 | 2020 | 7 | 15 | 15072020 | Sentinel-2 | 230,700 |
| 299 | 2017 | 7 | 23 | 23072017 | Sentinel-2 | 10,980,000 | 629 | 2020 | 7 | 15 | 15072020 | Sentinel-2 | 13,790 |
| 300 | 2017 | 7 | 23 | 23072017 | Sentinel-2 | 5,090,000 | 630 | 2020 | 7 | 15 | 15072020 | Sentinel-2 | 897,900 |
| 301 | 2017 | 7 | 23 | 23072017 | Sentinel-2 | 180,800 | 631 | 2020 | 7 | 15 | 15072020 | Sentinel-2 | 1,517,000 |
| 302 | 2017 | 7 | 28 | 28072017 | Sentinel-2 | 27,240 | 632 | 2020 | 7 | 17 | 17072020 | Sentinel-2 | 1,579,000 |
| 303 | 2017 | 7 | 28 | 28072017 | Sentinel-2 | 400,900 | 633 | 2020 | 7 | 17 | 17072020 | Sentinel-2 | 929,500 |
| 304 | 2017 | 7 | 28 | 28072017 | Sentinel-2 | 187,700 | 634 | 2020 | 7 | 17 | 17072020 | Sentinel-2 | 126,200 |
| 305 | 2017 | 8 | 12 | 12082017 | Sentinel-2 | 213,800 | 635 | 2020 | 7 | 17 | 17072020 | Sentinel-2 | 2,455,000 |
| 306 | 2017 | 8 | 12 | 12082017 | Sentinel-2 | 451,400 | 636 | 2020 | 7 | 22 | 22072020 | Sentinel-2 | 1,013,000 |
| 307 | 2017 | 8 | 12 | 12082017 | Sentinel-2 | 17,280 | 637 | 2020 | 7 | 22 | 22072020 | Sentinel-2 | 453,700 |
| 308 | 2017 | 8 | 12 | 12082017 | Sentinel-2 | 4320 | 638 | 2020 | 7 | 22 | 22072020 | Sentinel-2 | 2,366,000 |
| 309 | 2017 | 8 | 12 | 12082017 | Sentinel-2 | 50,260 | 639 | 2020 | 7 | 27 | 27072020 | Sentinel-2 | 73,270 |
| 310 | 2017 | 8 | 12 | 12082017 | Sentinel-2 | 37,790 | 640 | 2020 | 7 | 27 | 27072020 | Sentinel-2 | 1,127,000 |
| 311 | 2017 | 8 | 12 | 12082017 | Sentinel-2 | 187,400 | 641 | 2020 | 7 | 30 | 30072020 | Sentinel-2 | 416,600 |
| 312 | 2017 | 8 | 12 | 12082017 | Sentinel-2 | 786,300 | 642 | 2020 | 8 | 1 | 1082020 | Sentinel-2 | 4773 |
| 313 | 2017 | 8 | 12 | 12082017 | Sentinel-2 | 30,950 | 643 | 2020 | 8 | 6 | 6082020 | Sentinel-2 | 3468 |
| 314 | 2017 | 8 | 12 | 12082017 | Sentinel-2 | 4952 | 644 | 2020 | 8 | 6 | 6082020 | Sentinel-2 | 59,090 |
| 315 | 2017 | 8 | 20 | 20082017 | Sentinel-2 | 74,950 | 645 | 2020 | 8 | 11 | 11082020 | Sentinel-2 | 3476 |
| 316 | 2017 | 8 | 20 | 20082017 | Sentinel-2 | 23,410 | 646 | 2020 | 8 | 11 | 11082020 | Sentinel-2 | 178,900 |
| 317 | 2017 | 8 | 20 | 20082017 | Sentinel-2 | 10,850 | 647 | 2020 | 8 | 11 | 11082020 | Sentinel-2 | 568,300 |
| 318 | 2017 | 9 | 1 | 1092017 | Sentinel-2 | 688,400 | 648 | 2020 | 8 | 11 | 11082020 | Sentinel-2 | 9427 |
| 319 | 2017 | 9 | 1 | 1092017 | Sentinel-2 | 110,500 | 649 | 2020 | 8 | 11 | 11082020 | Sentinel-2 | 17,940 |
| 320 | 2017 | 9 | 1 | 1092017 | Sentinel-2 | 23,360 | 650 | 2020 | 8 | 11 | 11082020 | Sentinel-2 | 91,750 |
| 321 | 2017 | 9 | 6 | 6092017 | Sentinel-2 | 2,563,000 | 651 | 2020 | 8 | 11 | 11082020 | Sentinel-2 | 70,120 |
| 322 | 2017 | 9 | 24 | 24092017 | Sentinel-2 | 25,980 | 652 | 2020 | 8 | 14 | 14082020 | Sentinel-2 | 22,120 |
| 323 | 2017 | 9 | 24 | 24092017 | Sentinel-2 | 11,490 | 653 | 2020 | 8 | 16 | 16082020 | Sentinel-2 | 342,500 |
| 324 | 2017 | 9 | 26 | 26072017 | Sentinel-2 | 26,630 | 654 | 2020 | 8 | 16 | 16082020 | Sentinel-2 | 196,800 |
| 325 | 2017 | 9 | 26 | 26092017 | Sentinel-2 | 26,070 | 655 | 2020 | 8 | 19 | 19082020 | Sentinel-2 | 45,260 |
| 326 | 2017 | 9 | 26 | 26092017 | Sentinel-2 | 57,440 | 656 | 2020 | 8 | 21 | 21082020 | Sentinel-2 | 59,790 |
| 327 | 2017 | 9 | 26 | 26092017 | Sentinel-2 | 151,800 | 657 | 2020 | 8 | 26 | 26082020 | Sentinel-2 | 533,100 |
| 328 | 2017 | 9 | 26 | 26092017 | Sentinel-2 | 47,720 | 658 | 2020 | 8 | 31 | 31082020 | Sentinel-2 | 95,980 |
| 329 | 2017 | 9 | 26 | 26092017 | Sentinel-2 | 1555 | 659 | 2020 | 9 | 15 | 15092020 | Sentinel-2 | 2,568,000 |
| 330 | 2017 | 9 | 26 | 26092017 | Sentinel-2 | 20,590 | 660 | 2020 | 9 | 15 | 15092020 | Sentinel-2 | 76,720 |
Appendix C. The Range of Estimation for Each Factor by Logistic Regression Results of Training Dataset for Each Group
| Factor | Group1 | Group2 | Group3 | Group4 | Group5 | Group6 | Group7 |
|---|---|---|---|---|---|---|---|
| Intercept | −86.1 | −118.0 | −125.0 | −160.000 | −162.0 | −171.0 | −160 |
| Slope | 0.031 | 0.034 | 0.025 | 0.025 | 0.026 | 0.027 | 0.0264 |
| Aspect -N | 0.106 | 0.094 | 0.171 | 0.149 | 0.143 | 0.149 | 0.149 |
| Aspect -NE | 0.080 | 0.092 | 0.125 | 0.119 | 0.102 | 0.117 | 0.119 |
| Aspect -E | −0.106 | −0.093 | −0.050 | −0.050 | −0.065 | −0.053 | −0.0502 |
| Aspect -SE | −0.146 | −0.138 | −0.127 | −0.118 | −0.115 | −0.116 | −0.116 |
| Aspect -S | −0.017 | −0.009 | −0.084 | −0.065 | −0.056 | −0.061 | −0.0658 |
| Aspect -SW | 0.026 | 0.029 | −0.066 | −0.054 | −0.050 | −0.052 | −0.0557 |
| Aspect -W | 0.124 | 0.110 | 0.069 | 0.066 | 0.076 | 0.064 | 0.0659 |
| Aspect -NW | −0.073 | −0.089 | −0.042 | −0.051 | −0.038 | −0.051 | −0.0487 |
| Elevation | 0.002 | 0.002 | 0.002 | 0.002 | 0.002 | 0.002 | 0.00193 |
| Precipitation | 0.006 | 0.010 | 0.026 | 0.027 | 0.016 | 0.021 | 0.0268 |
| Distance to Road | 0.000 | 0.000 | 0.000 | 0.000 | 0.000 | 0.000 | −0.00036 |
| Distance to Settlements | 0.001 | 0.001 | 0.001 | 0.001 | 0.001 | 0.001 | 0.000581 |
| LULC1-Open Shrub | 57.300 | 73.400 | 115.000 | 122.000 | 95.100 | 110.000 | 122 |
| LULC2-Grassland | 58.100 | 74.100 | 116.000 | 122.000 | 95.800 | 111.000 | 122 |
| LULC4-Cropland | 58.200 | 74.300 | 116.000 | 122.000 | 96.000 | 111.000 | 122 |
| LULC5-Urban Area | 57.500 | 73.500 | 116.000 | 122.000 | 95.600 | 110.000 | 122 |
| LULC6-Barren | 47.200 | 63.200 | 105.000 | 111.000 | 84.700 | 99.400 | 111 |
| Annual Air Temperature | −0.316 | 0.000 | −1.700 | −0.922 | 0.156 | −0.166 | −0.909 |
| Wind Speed | 9.500 | 10.800 | 19.400 | 18.900 | 13.800 | 16.100 | 18.8 |
| NDVI | −2.110 | −1.800 | −2.440 | −2.200 | −2.360 | −2.230 | −2.22 |
| Distance to streams | −0.001 | −0.002 | 0.000 | −0.002 | −0.002 | −0.002 | −0.00182 |
| Geology-Flood Plain | / | / | 1.850 | 1.810 | 1.700 | 1.800 | 1.81 |
| Geology-Slope | / | / | −0.295 | −0.313 | −0.290 | −0.326 | −0.315 |
| Geology-Polygenetic | / | / | −0.595 | −0.606 | −0.586 | −0.596 | −0.607 |
| Geology-Mukdadiyah | / | / | −0.164 | −0.232 | −0.295 | −0.257 | −0.231 |
| Geology-Injana | / | / | 0.806 | 0.747 | 0.716 | 0.742 | 0.748 |
| Geology-Fatha | / | / | 0.961 | 0.991 | 1.010 | 0.985 | 0.992 |
| Geology-Pilaspi | / | / | 0.571 | 0.595 | 0.566 | 0.582 | 0.594 |
| Geology-Gercus | / | / | 0.042 | 0.070 | 0.090 | 0.084 | 0.069 |
| Geology-Khurmala and Sinjar | / | / | −0.138 | −0.109 | −0.052 | −0.074 | −0.11 |
| Geology-Kolosh | / | / | −0.434 | −0.365 | −0.314 | −0.339 | −0.363 |
| Geology-Tanjero, Aqra, and Bekhme | / | / | −2.610 | −2.590 | −2.550 | −2.610 | −2.59 |
| TWI | / | 0.010 | 0.012 | / | 0.012 | 0.012 | 0.012 |
| Relative Humidity | / | 0.102 | −0.890 | −0.517 | 0.248 | / | −0.51 |
| Distance to Farmland | / | 0.000 | 0.0002 | 0.004 | / | 0.00013 | 0.000149 |
| TPI | / | 0.004 | / | 0.0043 | 0.004 | 0.004 | 0.00426 |
Appendix D. The Range of Estimation for Each Factor by Logistic Regression Results of Validation Dataset for Each Group
| Factor | Group1 | Group2 | Group3 | Group4 | Group5 | Group6 | Group7 |
|---|---|---|---|---|---|---|---|
| Intercept | −305 | −22.31 | 104.5 | 11.36 | −142 | −371.2 | 8.71 |
| Slope | 0.02825 | 0.03329 | 0.02862 | 0.02837 | 0.02904 | 0.03551 | 0.03116 |
| Aspect-N | 0.3124 | 0.2489 | 0.2423 | 0.2105 | 0.222 | 0.2304 | 0.2112 |
| Aspect-NE | 0.06258 | 0.001159 | −0.05362 | −0.05304 | −0.05112 | 0.01329 | −0.05428 |
| Aspect-E | −0.4681 | −0.4903 | −0.5028 | −0.5033 | −0.5134 | −0.481 | −0.506 |
| Aspect-SE | −0.1643 | −0.1617 | −0.1732 | −0.1629 | −0.1421 | −0.1555 | −0.1593 |
| Aspect-S | 0.1507 | 0.2201 | 0.2219 | 0.2596 | 0.2413 | 0.2304 | 0.2552 |
| Aspect-SW | 0.1 | 0.1835 | 0.187 | 0.2197 | 0.1928 | 0.1802 | 0.2158 |
| Aspect-W | 0.01248 | −0.00756 | 0.03013 | 0.01171 | 0.02498 | −0.00135 | 0.01194 |
| Aspect-NW | −0.01185 | 0.00039 | 0.04304 | 0.01228 | 0.02091 | −0.02414 | 0.01988 |
| Elevation | 0.00023 | 0.000224 | 0.001738 | 0.000562 | 0.000136 | −0.00099 | 0.000541 |
| Precipitation | 0.1367 | 0.2364 | 0.2615 | 0.2539 | 0.1956 | 0.1615 | 0.2537 |
| Distance to Road | −0.00028 | −0.00048 | −0.0005856 | −0.00062 | −0.0006 | −0.00044 | −0.00062 |
| Distance to Settlements | 0.000117 | −4.3 × 10⁻⁵ | 4.081 × 10⁻⁵ | 4.77 × 10⁻⁵ | 0.000187 | 9.28 × 10⁻⁵ | 4.66 × 10⁻⁵ |
| LULC1-Open Shrub | 10.65 | 9.839 | 9.451 | 9.454 | 9.966 | 10.41 | 9.5 |
| LULC2-Grassland | 11.58 | 10.73 | 10.33 | 10.36 | 10.8 | 11.38 | 10.41 |
| LULC4-Cropland | 11.34 | 10.46 | 9.966 | 9.995 | 10.39 | 11.12 | 10.04 |
| LULC5-Urban Area | 12.03 | 11.93 | 11.71 | 11.73 | 11.56 | 12.33 | 11.78 |
| LULC6-Barren | 1.405 | 1.33 | 1.435 | 1.353 | 1.237 | 1.837 | 1.387 |
| Annual Air Temperature | −0.3361 | −11.91 | −16.66 | −13.64 | −7.492 | 0.6016 | −13.58 |
| Wind Speed | 73.28 | 137.2 | 157.9 | 149.9 | 117.1 | 84.91 | 149.9 |
| NDVI | −3.157 | −2.026 | −2.708 | −2.052 | −2.248 | −2.108 | −2.069 |
| Distance to streams | 0.001483 | −0.00143 | 0.000881 | −0.00194 | −0.00169 | −0.0019 | −0.00157 |
| Geology-Flood Plain | / | / | −0.2976 | −0.4112 | −0.7447 | −0.4617 | −0.4108 |
| Geology-Slope | / | / | −0.8035 | −0.9317 | −1.242 | −1.355 | −0.9299 |
| Geology-Polygenetic | / | / | 1.521 | 1.513 | 2.038 | 1.638 | 1.501 |
| Geology-Mukdadiyah | / | / | 1.687 | 1.493 | 0.9022 | 1.117 | 1.498 |
| Geology-Injana | / | / | −0.3107 | −0.4829 | −0.6287 | −0.4022 | −0.479 |
| Geology-Fatha | / | / | 0.443 | 0.4752 | 0.4789 | 0.4702 | 0.4813 |
| Geology-Pilaspi | / | / | −0.7157 | −0.6053 | −0.6636 | −0.4154 | −0.6063 |
| Geology-Gercus | / | / | −0.9819 | −0.8063 | −0.8455 | −0.3796 | −0.8063 |
| Geology-Khurmala and Sinjar | / | / | 2.499 | 2.612 | 3.026 | 2.542 | 2.583 |
| Geology-Kolosh | / | / | −0.7934 | −0.5782 | −0.7149 | −0.2305 | −0.5707 |
| Geology-Tanjero, Aqra, and Bekhme | / | / | −2.256 | −2.287 | −1.617 | −2.532 | −2.27 |
| TWI | / | 0.03229 | 0.03427 | / | 0.03874 | 0.04388 | 0.03755 |
| Relative Humidity | / | −7.941 | −10.84 | −9.169 | −4.852 | / | −9.132 |
| Distance to Farmland | / | 0.000445 | 0.0004533 | 0.000418 | / | 0.00021 | 0.000418 |
| TPI | / | 0.006574 | / | 0.0072 | 0.008614 | 0.01052 | 0.007242 |
References
- Ziadé, R.; Abdallah, C.; Baghdadi, N. The effect of forest fire on mass movement in Lebanese mountainous areas. Int. J. Wildl. Fire 2014, 23, 845–859. [Google Scholar] [CrossRef]
- Salar, S.G. Identification of Forest Fire Risk Zones in the Sartak Watershed, Kurdistan Region, Iraq: Gis and Remote Sensing Applications. Iraqi Bull. Geol. Min. 2019, 15, 105–122. [Google Scholar]
- Pourghasemi, H.R.; Gayen, A.; Panahi, M.; Rezaie, F.; Blaschke, T. Multi-hazard probability assessment and mapping in Iran. Sci. Total Environ. 2019, 692, 556–571. [Google Scholar] [CrossRef] [PubMed]
- Pourtaghi, Z.S.; Pourghasemi, H.R.; Rossi, M. Forest fire susceptibility mapping in the Minudasht forests, Golestan province, Iran. Environ. Earth Sci. 2015, 73, 1515–1533. [Google Scholar]
- Kayet, N.; Chakrabarty, A.; Pathak, K.; Sahoo, S.; Dutta, T.; Hatai, B.K. Comparative analysis of multi-criteria probabilistic FR and AHP models for forest fire risk (FFR) mapping in Melghat Tiger Reserve (MTR) forest. J. For. Res. 2020, 31, 565–579. [Google Scholar] [CrossRef]
- Zanini, G.D.; Sbrissia, A.F. Prescribed burning of pastures: A management tool? Rev. Ciências Agroveterinárias 2014, 12, 94–103. [Google Scholar]
- Jahdi, R.; Salis, M.; Darvishsefat, A.A.; Mostafavi, M.A.; Alcasena, F.; Etemad, V.; Lozano, O.; Spano, D. Calibration of FARSITE simulator in northern Iranian forests. Nat. Hazards Earth Syst. Sci. 2015, 15, 443–459. [Google Scholar] [CrossRef] [Green Version]
- Glasa, J.; Halada, L. On elliptical model for forest fire spread modeling and simulation. Math. Comput. Simul. 2008, 78, 76–88. [Google Scholar] [CrossRef]
- Ashiagbor, G.; Oduro, W.; Gyiele, L.; Siaw, D.; Barnes, V.R.; Agbenyega, O.; Twum-Ampofo, K.; Partey, S.; Thevathasan, N.; Gordon, A.; et al. Toward sustainable land resources management with agroforestry: Empirical evidence from the Sunyani west district of Ghana. Agrofor. Syst. 2020, 94, 527–537. [Google Scholar] [CrossRef]
- Esmaeili Sharif, M.; Jalilvand, H.; Amoozad, M.; Jafari, A.; Sayed Mahale, S.M. The effect of ecological factors on fire in Hyrcanian forests (Case study: Forest areas of Neka, Mazandaran, Iran). J. For. Res. Dev. 2018, 4, 113–129. [Google Scholar]
- Sowmya, S.V.; Somashekar, R.K. Application of remote sensing and geographical information system in mapping forest fire risk zone at Bhadra wildlife sanctuary, India. J. Environ. Biol. 2010, 31, 969. [Google Scholar] [PubMed]
- Adab, H.; Kanniah, K.D.; Solaimani, K. Modeling forest fire risk in the northeast of Iran using remote sensing and GIS techniques. Nat. Hazards 2013, 65, 1723–1743. [Google Scholar] [CrossRef]
- Jung, J.; Kim, C.; Jayakumar, S.; Kim, S.; Han, S.; Kim, D.H.; Heo, J. Forest fire risk mapping of Kolli Hills, India, considering subjectivity and inconsistency issues. Nat. Hazards 2013, 65, 2129–2146. [Google Scholar] [CrossRef]
- Amalina, P.; Prasetyo, L.B.; Rushayati, S.B. Forest Fire Vulnerability Mapping in Way Kambas National Park. Procedia Environ. Sci. 2016, 33, 239–252. [Google Scholar] [CrossRef] [Green Version]
- Gigović, L.; Pourghasemi, H.R.; Drobnjak, S.; Bai, S. Testing a new ensemble model based on SVM and random forest in forest fire susceptibility assessment and its mapping in Serbia’s Tara National Park. Forests 2019, 10, 408. [Google Scholar] [CrossRef] [Green Version]
- Rasooli, S.B.; Rashidi, S.; Shabanian, N. Fire sensitivity of broadleaf tree species in plantations of Kurdistan, Iran. J. For. Res. 2021, 32, 1167–1176. [Google Scholar] [CrossRef]
- Vadrevu, K.P.; Eaturu, A.; Badarinath, K.V.S. Fire risk evaluation using multicriteria analysis-a case study. Environ. Monit. Assess. 2010, 166, 223–239. [Google Scholar] [CrossRef]
- Santiago, I.T.; Kheladze, N. GIS Wildland fire Hazard Modeling in Georgia. Matra Project Report, Caucasus Environmental NGO Network. 2011. Available online: http://drm.cenn.org/Local_Case_studies/GIS%20Wildland%20Fire%20Hazard%20Modeling%20in%20Georgia1.pdf (accessed on 17 July 2021).
- Sachdeva, S.; Bhatia, T.; Verma, A.K. GIS-based evolutionary optimized Gradient Boosted Decision Trees for forest fire susceptibility mapping. Nat. Hazards 2018, 92, 1399–1418. [Google Scholar] [CrossRef]
- Zhang, G.; Wang, M.; Liu, K. Forest Fire Susceptibility Modeling Using a Convolutional Neural Network for Yunnan Province of China. Int. J. Disaster Risk Sci. 2019, 10, 386–403. [Google Scholar] [CrossRef] [Green Version]
- Moayedi, H.; Mehrabi, M.; Bui, D.T.; Pradhan, B.; Foong, L.K. Fuzzy-metaheuristic ensembles for spatial assessment of forest fire susceptibility. J. Environ. Manag. 2020, 260, 109867. [Google Scholar] [CrossRef]
- Hong, H.; Naghibi, S.A.; Dashtpagerdi, M.M.; Pourghasemi, H.R.; Chen, W. A comparative assessment between linear and quadratic discriminant analyses (LDA-QDA) with frequency ratio and weights-of-evidence models for forest fire susceptibility mapping in China. Arab. J. Geosci. 2017, 10, 167. [Google Scholar] [CrossRef]
- Bui, D.T.; Hoang, N.-D.; Samui, P. Spatial pattern analysis and prediction of forest fire using new machine learning approach of Multivariate Adaptive Regression Splines and Differential Flower Pollination optimization: A case study at Lao Cai province (Viet Nam). J. Environ. Manag. 2019, 237, 476–487. [Google Scholar]
- Stolzenburg, W. Fire in the Rain Forest; National Emergency Training Center: Emmitsburg, MD, USA, 2001.
- Food and Agriculture Organization. Fire Management: Global Assessment 2006. FAO For. Pap. 2007, 151, 135. [Google Scholar]
- Pourghasemi, H.R.; Gayen, A.; Lasaponara, R.; Tiefenbacher, J.P. Application of learning vector quantization and different machine learning techniques to assessing forest fire influence factors and spatial modelling. Environ. Res. 2020, 184, 109321. [Google Scholar] [CrossRef] [PubMed]
- Razavi-Termeh, S.V.; Sadeghi-Niaraki, A.; Choi, S.-M. Ubiquitous GIS-based forest fire susceptibility mapping using artificial intelligence methods. Remote Sens. 2020, 12, 1689. [Google Scholar] [CrossRef]
- Stolle, F.; Chomitz, K.M.; Lambin, E.F.; Tomich, T.P. Human ecological intervention and the role of forest fires in human ecology. For. Ecol. Manag. 2003, 179, 277–292. [Google Scholar] [CrossRef] [Green Version]
- de Alvino-Rayol, F.O.; Rayol, B.P. Effect of fire in weeds of agroforestry system, Pará, Brazil. Rev. Ciências Agroveterinárias 2020, 19, 1–7. [Google Scholar] [CrossRef] [Green Version]
- de Alvino-Rayol, F.O.; Rayol, B.P. Effect of fire in seed banks of agroforestry systems, Pará, Brazil. Rev. Ciências Agroveterinárias 2019, 18, 489–498. [Google Scholar] [CrossRef] [Green Version]
- Minnich, R.A. An integrated model of two fire regimes. Conserv. Biol. 2001, 15, 1549–1553. [Google Scholar] [CrossRef]
- Broncano, M.J.; Retana, J. Topography and pre-fire vegetation affecting the spatial heterogeneity generated after a large forest wildfire in the Mediterranean Basin. Int. J. Wildl. Fire 2004, 13, 209–216. [Google Scholar] [CrossRef]
- Dlamini, W.M. A Bayesian belief network analysis of factors influencing wildfire occurrence in Swaziland. Environ. Model. Softw. 2010, 25, 199–208. [Google Scholar] [CrossRef]
- Pourtaghi, Z.S.; Pourghasemi, H.R.; Aretano, R.; Semeraro, T. Investigation of general indicators influencing on forest fire and its susceptibility modeling using different data mining techniques. Ecol. Indic. 2016, 64, 72–84. [Google Scholar] [CrossRef]
- Ghorbanzadeh, O.; Blaschke, T.; Gholamnia, K.; Aryal, J. Forest fire susceptibility and risk mapping using social/infrastructural vulnerability and environmental variables. Fire 2019, 2, 50. [Google Scholar] [CrossRef] [Green Version]
- Vázquez, A.; Moreno, J.M. Spatial distribution of forest fires in Sierra de Gredos (Central Spain). For. Ecol. Manag. 2001, 147, 55–65. [Google Scholar] [CrossRef]
- Lozano, F.J.; Suárez-Seoane, S.; Kelly, M.; Luis, E. A multi-scale approach for modeling fire occurrence probability using satellite data and classification trees: A case study in a mountainous Mediterranean region. Remote Sens. Environ. 2008, 112, 708–719. [Google Scholar] [CrossRef]
- Zumbrunnen, T.; Pezzatti, G.B.; Menéndez, P.; Bugmann, H.; Bürgi, M.; Conedera, M. Weather and human impacts on forest fires: 100 years of fire history in two climatic regions of Switzerland. For. Ecol. Manag. 2011, 261, 2188–2199. [Google Scholar] [CrossRef]
- Justus, J. A case study in concept determination: Ecological diversity. In Philosophy of Ecology; Elsevier: Amsterdam, The Netherlands, 2011; pp. 147–168. [Google Scholar]
- Jaiswal, R.K.; Mukherjee, S.; Raju, K.D.; Saxena, R. Forest fire risk zone mapping from satellite imagery and GIS. Int. J. Appl. Earth Obs. Geoinf. 2002, 4, 1–10. [Google Scholar] [CrossRef]
- Dong, X.U.; Li-min, D.A.I.; Guo-fan, S.; Lei, T.; Hui, W. Forest fire risk zone mapping from satellite images and GIS for Baihe Forestry Bureau, Jilin, China. J. For. Res. 2005, 16, 169–174. [Google Scholar] [CrossRef]
- Keane, R.E.; Drury, S.A.; Karau, E.C.; Hessburg, P.F.; Reynolds, K.M. A method for mapping fire hazard and risk across multiple scales and its application in fire management. Ecol. Modell. 2010, 221, 2–18. [Google Scholar] [CrossRef]
- Paz, S.; Carmel, Y.; Jahshan, F.; Shoshany, M. Post-fire analysis of pre-fire mapping of fire-risk: A recent case study from Mt. Carmel (Israel). For. Ecol. Manag. 2011, 262, 1184–1188. [Google Scholar] [CrossRef]
- Eskandari, S.; Ghadikolaei, J.O.; Jalilvand, H.; Saradjian, M.R. Detection of fire high-risk areas in northern forests of Iran using Dong model. World Appl. Sci. J. 2013, 27, 770–773. [Google Scholar]
- Rasooli, S.B.; Bonyad, A.E. Evaluating the efficiency of the Dong model in determining fire vulnerability in Iran’s Zagros forests. J. For. Res. 2019, 30, 1447–1458. [Google Scholar] [CrossRef]
- Mahdavi, A. Forests and rangelands? wildfire risk zoning using GIS and AHP techniques. Casp. J. Environ. Sci. 2012, 10, 43–52. [Google Scholar]
- Rasooli, S.B.; Bonyad, A.E.; Pir Bavaghar, M. Forest fire vulnerability map using remote sensing data, GIS and AHP analysis (Case study: Zarivar Lake surrounding area). Casp. J. Environ. Sci. 2018, 16, 369–377. [Google Scholar]
- Zarekar, A.; Zamani, B.K.; Ghorbani, S.; Moalla, M.A.; Jafari, H. Mapping spatial distribution of forest fire using MCDM and GIS (case study: Three forest zones in Guilan Province). Iran. J. For. Poplar Res. 2013, 21, 218–230. [Google Scholar]
- Bui, D.T.; Bui, Q.-T.; Nguyen, Q.-P.; Pradhan, B.; Nampak, H.; Trinh, P.T. A hybrid artificial intelligence approach using GIS-based neural-fuzzy inference system and particle swarm optimization for forest fire susceptibility modeling at a tropical area. Agric. For. Meteorol. 2017, 233, 32–44. [Google Scholar]
- Gheshlaghi, H.A. Using GIS to develop a model for forest fire risk mapping. J. Indian Soc. Remote Sens. 2019, 47, 1173–1185. [Google Scholar] [CrossRef]
- Martínez, J.; Vega-Garcia, C.; Chuvieco, E. Human-caused wildfire risk rating for prevention planning in Spain. J. Environ. Manag. 2009, 90, 1241–1252. [Google Scholar] [CrossRef]
- Jurdao, S.; Chuvieco, E.; Arevalillo, J.M. Modelling fire ignition probability from satellite estimates of live fuel moisture content. Fire Ecol. 2012, 8, 77–97. [Google Scholar] [CrossRef]
- Mohammadi, F.; Bavaghar, M.P.; Shabanian, N. Forest Fire Risk Zone Modeling Using Logistic Regression and GIS: An Iranian Case Study. Small-Scale For. 2014, 13, 117–125. [Google Scholar] [CrossRef]
- Tien Bui, D.; Le, K.-T.T.; Nguyen, V.C.; Le, H.D.; Revhaug, I. Tropical forest fire susceptibility mapping at the Cat Ba National Park Area, Hai Phong City, Vietnam, using GIS-based kernel logistic regression. Remote Sens. 2016, 8, 347. [Google Scholar] [CrossRef] [Green Version]
- Vasilakos, C.; Kalabokidis, K.; Hatzopoulos, J.; Matsinos, I. Identifying wildland fire ignition factors through sensitivity analysis of a neural network. Nat. Hazards 2009, 50, 125–143. [Google Scholar] [CrossRef]
- Pierce, A.D.; Farris, C.A.; Taylor, A.H. Use of random forests for modeling and mapping forest canopy fuels for fire behavior analysis in Lassen Volcanic National Park, California, USA. For. Ecol. Manag. 2012, 279, 77–89. [Google Scholar] [CrossRef]
- Mirdeilami, T.; Shataee, S.H.; Kavoosi, M.R. Forest fire risk zone mapping in the Golestan national park using regression logistic method. J. Wood For. Sci. Technol. 2015, 22, 1–16. [Google Scholar]
- Srivastava, P.K.; Petropoulos, G.P.; Gupta, M.; Singh, S.K.; Islam, T.; Loka, D. Deriving forest fire probability maps from the fusion of visible/infrared satellite data and geospatial data mining. Model. Earth Syst. Environ. 2019, 5, 627–643. [Google Scholar] [CrossRef]
- Salar, S.G. Geomorphic Analysis for Water Harvesting Using GIS Technique in Selected Basins/Garmiyan Iraqi Kurdistan Region; University of Sulaimani: Sulaymaniyah, Iraq, 2013. [Google Scholar]
- Salar, S.G.; Othman, A.A.; Hasan, S.E. Identification of suitable sites for groundwater recharge in Awaspi watershed using GIS and remote sensing techniques. Environ. Earth Sci. 2018, 77, 701. [Google Scholar] [CrossRef]
- Kummerow, C.; Barnes, W.; Kozu, T.; Shiue, J.; Simpson, J. The Tropical Rainfall Measuring Mission (TRMM) sensor package. J. Atmos. Ocean. Technol. 1998, 15, 809–817. [Google Scholar] [CrossRef]
- NCEP Climate Forecast System Reanalysis (CFSR) Global Weather Data. Available online: https://swat.tamu.edu/data/cfsr (accessed on 13 August 2021).
- Rouse, J.W.; Haas, R.H.; Schelle, J.A.; Deering, D.W.; NASA/GSFC. Monitoring the Vernal Advancement or Retrogradation of Natural Vegetation; NASA: Greenbelt, MD, USA, 1974.
- Moore, I.D.; Grayson, R.B.; Ladson, A.R. Digital terrain modelling: A review of hydrological, geomorphological, and biological applications. Hydrol. Process. 1991, 5, 3–30. [Google Scholar] [CrossRef]
- Weiss, A. Topographic position and landforms analysis, Poster presentation. In Proceedings of the ESRI user conference, San Diego, CA, USA, 9–13 July 2001; pp. 9–13. [Google Scholar]
- Zeng, T.; Hudson, J.; Kay, S.; Laginestra, E.; Authority, S.O.P. A fuzzy GIS approach to fire risk assessment: A case study of Sydney Olympic Park, Australia. In Proceedings of the Spatial Sciences Conferences, Sydney, Australia, January 2003; Volume 18. [Google Scholar]
- Sayad, Y.O.; Mousannif, H.; Al Moatassime, H. Predictive modeling of wildfires: A new dataset and machine learning approach. Fire Saf. J. 2019, 104, 130–146. [Google Scholar] [CrossRef]
- Koutsias, N.; Xanthopoulos, G.; Founda, D.; Xystrakis, F.; Nioti, F.; Pleniou, M.; Mallinis, G.; Arianoutsou, M. On the relationships between forest fires and weather conditions in Greece from long-term national observations (1894–2010). Int. J. Wildl. Fire 2012, 22, 493–507. [Google Scholar] [CrossRef] [Green Version]
- Faramarzi, H.; Hosseini, S.M.; Gholamalifard, M. Fire hazard zoning in national golestan park using logistic regression and GIS. J. Geogr. Environ. Hazards 2014, 3, 73–90. [Google Scholar]
- Sakr, G.E.; Elhajj, I.H.; Mitri, G. Efficient forest fire occurrence prediction for developing countries using two weather parameters. Eng. Appl. Artif. Intell. 2011, 24, 888–894. [Google Scholar] [CrossRef]
- Rajabi, M.; Alesheikh, A.; Chehreghan, A.; Gazmeh, H. An innovative method for forest fire risk zoning map using fuzzy inference system and GIS. Int. J. Sci. Technol. Res. 2013, 2, 57–64. [Google Scholar]
- Saklani, P. Forest Fire Risk Zonation: A Case Study Pauri Garhwal; ITC: Uttrakhand, India, 2008.
- Behzadi, H.; Mohtashamnia, S.; Gharedaghi, H. Rangelands and forests fire risk zoning using GIS and AHP model (case study: Bamu National Park, Fars province). Iran. J. Range Desert Res. 2019, 25, fa817–fa827. [Google Scholar]
- Jenness, J.S. The Effects of Fire on Mexican Spotted Owls in Arizona and New Mexico. 2000. Available online: http://www.jennessent.com/Literature/Thesis/literature_review.htm#Forest%20Service%20Management%20Plans (accessed on 3 February 2022).
- Othman, A.A.; Al-Maamar, A.F.; Al-Manmi, D.A.M.; Veraldo, L.; Hasan, S.E.; Obaid, A.K.; Al-Quraishi, A.M.F. GIS-based modeling for selection of dam sites in the Kurdistan Region, Iraq. ISPRS Int. J. Geo-Inf. 2020, 9, 244. [Google Scholar] [CrossRef] [Green Version]
- Othman, A.A.; Obaid, A.K.; Amin Al-Manmi, D.A.M.; Al-Maamar, A.F.; Hasan, S.E.; Liesenberg, V.; Shihab, A.T.; Al-Saady, Y.I. New insight on soil loss estimation in the northwestern region of the Zagros fold and Thrust Belt. ISPRS Int. J. Geo-Inf. 2021, 10, 59. [Google Scholar] [CrossRef]
- Saha, S.; Moorthi, S.; Pan, H.-L.; Wu, X.; Wang, J.; Nadiga, S.; Tripp, P.; Kistler, R.; Woollen, J.; Behringer, D. The NCEP climate forecast system reanalysis. Bull. Am. Meteorol. Soc. 2010, 91, 1015–1058. [Google Scholar] [CrossRef]
- Sissakian, V.K.; Fouad, S.F.A. The Geology of Sulaimaniya Quadrangle Sheet No. NI-38-3, Scale 1:250,000; GEOSURV: Baghdad, Iraq, 2008. [Google Scholar]
- Al-Rubaiay, A.T.; Al-Dulaimi, T.Y. Series of Land Use Land Cover Maps of Iraq Scale 1:250,000, Sulaimaniya Quadrangle Sheet NI–38–3 (LULCM 10); GEOSURV: Baghdad, Iraq, 2012. [Google Scholar]
- Heydari, M.; Poorbabaei, H.; Esmaaelzade, O. Indicator plant species in monitoring forest soil conditions using logistic regression model in Zagros Oak (Quercus brantii var. persica) forest ecosystems, Ilam city. J. Plant Res. 2015, 27, 811–828. [Google Scholar]
- Eastman, J.R. IDRISI Taiga Guide to GIS and Image Processing; Clark Labs Clark University: Worcester, MA, USA, 2009. [Google Scholar]
- Pontius, R.G., Jr.; Schneider, L.C. Land-cover change model validation by an ROC method for the Ipswich watershed, Massachusetts, USA. Agric. Ecosyst. Environ. 2001, 85, 239–248. [Google Scholar] [CrossRef]
- Othman, A.A.; Gloaguen, R.; Andreani, L.; Rahnama, M. Improving landslide susceptibility mapping using morphometric features in the Mawat area, Kurdistan Region, NE Iraq: Comparison of different statistical models. Geomorphology 2018, 319, 147–160. [Google Scholar] [CrossRef]
- Youssef, A.M.; Pourghasemi, H.R.; Pourtaghi, Z.S.; Al-Katheeri, M.M. Landslide susceptibility mapping using random forest, boosted regression tree, classification and regression tree, and general linear models and comparison of their performance at Wadi Tayyah Basin, Asir Region, Saudi Arabia. Landslides 2016, 13, 839–856. [Google Scholar] [CrossRef]
- Jaafari, A.; Najafi, A.; Rezaeian, J.; Sattarian, A.; Ghajar, I. Planning road networks in landslide-prone areas: A case study from the northern forests of Iran. Land Use Policy 2015, 47, 198–208. [Google Scholar] [CrossRef]
- Shrestha, R.; Di, L.; Yu, E.G.; Kang, L.; SHAO, Y.; BAI, Y. Regression model to estimate flood impact on corn yield using MODIS NDVI and USDA cropland data layer. J. Integr. Agric. 2017, 16, 398–407. [Google Scholar] [CrossRef] [Green Version]
- Loveridge, M.; Rahman, A. Effects of Probability-Distributed Losses on Flood Estimates Using Event-Based Rainfall-Runoff Models. Water 2021, 13, 2049. [Google Scholar] [CrossRef]
- Bergmeir, C.; Benítez, J.M. On the use of cross-validation for time series predictor evaluation. Inf. Sci. 2012, 191, 192–213. [Google Scholar] [CrossRef]
- Bennett, M.; Fitzgerald, S.A.; Parker, B.; Main, M.L.; Perleberg, A.; Schnepf, C.; Mahoney, R.L. Reducing Fire Risk on Your Forest Property; Oregon State University: Corvallis, OR, USA, 2010. [Google Scholar]
- Lecina-Diaz, J.; Alvarez, A.; Retana, J. Extreme fire severity patterns in topographic, convective and wind-driven historical wildfires of Mediterranean pine forests. PLoS ONE 2014, 9, e85127. [Google Scholar] [CrossRef] [Green Version]
- Oliveira, S.; Pereira, J.M.C.; San-Miguel-Ayanz, J.; Lourenço, L. Exploring the spatial patterns of fire density in Southern Europe using Geographically Weighted Regression. Appl. Geogr. 2014, 51, 143–157. [Google Scholar] [CrossRef]
- Adab, H.; Kanniah, K.D.; Solaimani, K. Modelling static fire hazard in a semi-arid region using frequency analysis. Int. J. Wildl. Fire 2015, 24, 763–777. [Google Scholar] [CrossRef]
- Li, R.; Wang, N. Landslide susceptibility mapping for the Muchuan county (China): A comparison between bivariate statistical models (woe, ebf, and ioe) and their ensembles with logistic regression. Symmetry 2019, 11, 762. [Google Scholar] [CrossRef] [Green Version]
- Gholami, P.; Ghorbani, J.; Abbasi, H. Effect of fire vegetation on some properties of soil in rangelands of Bamo national park in Shiraz. Nat. Ecosyst. Iran 2014, 5, 41–50. [Google Scholar]
- Rafiee, F.; Jankju, M.; Ejtehadi, H. Investigation on tolerant, adapted and sensitive plant traits to chronological wildfires in a semiarid rangeland. Iran. J. Range Desert Res. 2015, 22, Pe73–Pe84. [Google Scholar]
- Oliveira, C.; Ferreira, R.; da Silva, J.; Lima, R.; Silva, E.; Silva, A.; Lucena, J.; dos Santos, N.; Lopes, I.; Pessoa, M.; et al. Modeling and Spatialization of Biomass and Carbon Stock Using LiDAR Metrics in Tropical Dry Forest, Brazil. Forests 2021, 12, 473. [Google Scholar] [CrossRef]
- Fernández-Guisuraga, J.M.; Calvo, L.; Fernandes, P.M.; Suárez-Seoane, S. Short-Term Recovery of the Aboveground Carbon Stock in Iberian Shrublands at the Extremes of an Environmental Gradient and as a Function of Burn Severity. Forests 2022, 13, 145. [Google Scholar] [CrossRef]
- Zhang, F.; Zhou, G. Estimation of vegetation water content using hyperspectral vegetation indices: A comparison of crop water indicators in response to water stress treatments for summer maize. BMC Ecol. 2019, 19, 18. [Google Scholar] [CrossRef] [Green Version]
- González-Olabarria, J.-R.; Rodriguez, F.; Fernández-Landa, A.; Mola-Yudego, B. Mapping fire risk in the Model Forest of Urbión (Spain) based on airborne LiDAR measurements. For. Ecol. Manag. 2012, 282, 149–156. [Google Scholar] [CrossRef]
- Reddy, C.S.; Bird, N.G.; Sreelakshmi, S.; Manikandan, T.M.; Asra, M.; Krishna, P.H.; Jha, C.S.; Rao, P.V.N.; Diwakar, P.G. Identification and characterization of spatio-temporal hotspots of forest fires in South Asia. Environ. Monit. Assess. 2019, 191, 791. [Google Scholar] [CrossRef]
- Avitabile, S.C.; Callister, K.E.; Kelly, L.T.; Haslem, A.; Fraser, L.; Nimmo, D.G.; Watson, S.J.; Kenny, S.A.; Taylor, R.S.; Spence-Bailey, L.M.; et al. Systematic fire mapping is critical for fire ecology, planning and management: A case study in the semi-arid Murray Mallee, south-eastern Australia. Landsc. Urban Plan. 2013, 117, 81–91. [Google Scholar] [CrossRef]
- Bernier, P.Y.; Gauthier, S.; Jean, P.-O.; Manka, F.; Boulanger, Y.; Beaudoin, A.; Guindon, L. Mapping Local Effects of Forest Properties on Fire Risk across Canada. Forests 2016, 7, 157. [Google Scholar] [CrossRef]
- Carvalheiro, L.C.; Bernardo, S.O.; Orgaz, M.D.M.; Yamazaki, Y. Forest Fires Mapping and Monitoring of current and past forest fire activity from Meteosat Second Generation Data. Environ. Model. Softw. 2010, 25, 1909–1914. [Google Scholar] [CrossRef]
- Chen, D.; Pereira, J.M.C.; Masiero, A.; Pirotti, F. Mapping fire regimes in China using MODIS active fire and burned area data. Appl. Geogr. 2017, 85, 14–26. [Google Scholar] [CrossRef]
- Dlamini, W.M. Application of Bayesian networks for fire risk mapping using GIS and remote sensing data. GeoJournal 2011, 76, 283–296. [Google Scholar] [CrossRef]
- Duarte, L.; Teododo, A.C. An easy, accurate and efficient procedure to create forest fire risk maps using the SEXTANTE plugin Modeler. J. For. Res. 2016, 27, 1361–1372. [Google Scholar] [CrossRef]
- Hudak, A.T.; Bright, B.C.; Pokswinski, S.M.; Loudermilk, E.L.; O’Brien, J.J.; Hornsby, B.S.; Klauberg, C.; Silva, C.A. Mappingforest structure and composition from low-density LiDAR for informed forest, fuel, and fire management at Eglin Air Force Base, Florida, USA. Can. J. Remote Sens. 2016, 42, 411–427. [Google Scholar] [CrossRef]
- Kumar, S.; Das Bairagi, G.; Kumar, A. Identifying triggers for forest fire and assessing fire susceptibility of forests in Indian western Himalaya using geospatial techniques. Nat. Hazards 2015, 78, 203–217. [Google Scholar] [CrossRef]
- Lampin-Maillet, C.; Jappiot, M.; Long, M.; Bouillon, C.; Morge, D.; Ferrier, J.-P. Mapping wildland-urban interfaces at large scales integrating housing density and vegetation aggregation for fire prevention in the South of France. J. Environ. Manag. 2010, 91, 732–741. [Google Scholar] [CrossRef] [PubMed] [Green Version]
- Merino-de-Miguel, S.; Huesca, M.; González-Alonso, F. Modis reflectance and active fire data for burn mapping and assessment at regional level. Ecol. Modell. 2010, 221, 67–74. [Google Scholar] [CrossRef]
- Mitri, G.H.; Gitas, I.Z. Mapping post-fire forest regeneration and vegetation recovery using a combination of very high spatial resolution and hyperspectral satellite imagery. Int. J. Appl. Earth Obs. Geoinf. 2013, 20, 60–66. [Google Scholar] [CrossRef]
- Molina, J.R.; González-Cabán, A.; y Silva, F.R. Wildfires impact on the economic susceptibility of recreation activities: Application in a Mediterranean protected area. J. Environ. Manag. 2019, 245, 454–463. [Google Scholar] [CrossRef]
- Ruiz, J.A.M.; Riaño, D.; Arbelo, M.; French, N.H.F.; Ustin, S.L.; Whiting, M.L. Burned area mapping time series in Canada (1984--1999) from NOAA-AVHRR LTDR: A comparison with other remote sensing products and fire perimeters. Remote Sens. Environ. 2012, 117, 407–414. [Google Scholar] [CrossRef]
- Morton, D.C.; DeFries, R.S.; Nagol, J.; Souza, C.M., Jr.; Kasischke, E.S.; Hurtt, G.C.; Dubayah, R. Mapping canopy damage from understory fires in Amazon forests using annual time series of Landsat and MODIS data. Remote Sens. Environ. 2011, 115, 1706–1720. [Google Scholar] [CrossRef] [Green Version]
- Naderpour, M.; Rizeei, H.M.; Khakzad, N.; Pradhan, B. Forest fire induced Natech risk assessment: A survey of geospatial technologies. Reliab. Eng. Syst. Saf. 2019, 191, 106558. [Google Scholar] [CrossRef]
- Nandy, S.; Singh, C.; Das, K.K.; Kingma, N.C.; Kushwaha, S.P.S. Environmental vulnerability assessment of eco-development zone of Great himalayan National Park, himachal Pradesh, India. Ecol. Indic. 2015, 57, 182–195. [Google Scholar] [CrossRef]
- Potapov, P.; Turubanova, S.; Hansen, M.C. Regional-scale boreal forest cover and change mapping using Landsat data composites for European Russia. Remote Sens. Environ. 2011, 115, 548–561. [Google Scholar] [CrossRef]
- Sahana, M.; Ganaie, T.A. GIS-based landscape vulnerability assessment to forest fire susceptibility of Rudraprayag district, Uttarakhand, India. Environ. Earth Sci. 2017, 76, 676. [Google Scholar] [CrossRef]
- Saranya, K.R.L.; Reddy, C.S.; Rao, P.V.V.P.; Jha, C.S. Decadal time-scale monitoring of forest fires in Similipal Biosphere Reserve, India using remote sensing and GIS. Environ. Monit. Assess 2014, 186, 3283–3296. [Google Scholar] [CrossRef]
- Weisberg, P.J.; Ko, D.; Py, C.; Bauer, J.M. Modeling fire and landform influences on the distribution of old-growth pinyon-juniper woodland. Landsc. Ecol. 2008, 23, 931–943. [Google Scholar] [CrossRef]
- Whitman, E.; Rapaport, E.; Sherren, K. Modeling fire susceptibility to delineate wildland--urban interface for municipal-scale fire risk management. Environ. Manag. 2013, 52, 1427–1439. [Google Scholar] [CrossRef]
- Yang, W.; Zhang, S.; Tang, J.; Bu, K.; Yang, J.; Chang, L. A MODIS time series data based algorithm for mapping forest fire burned area. Chin. Geogr. Sci. 2013, 23, 344–352. [Google Scholar] [CrossRef]
- You, W.; Lin, L.; Wu, L.; Ji, Z.; Zhu, J.; Fan, Y.; He, D. Geographical information system-based forest fire risk assessment integrating national forest inventory data and analysis of its spatiotemporal variability. Ecol. Indic. 2017, 77, 176–184. [Google Scholar] [CrossRef]
- Ziccardi, L.G.; Thiersch, C.R.; Yanai, A.M.; Fearnside, P.M.; Ferreira-Filho, P.J. Forest fire risk indices and zoning of hazardous areas in Sorocaba, São Paulo state, Brazil. J. For. Res. 2020, 31, 581–590. [Google Scholar] [CrossRef]
- Cao, Y.; Wang, M.; Liu, K. Wildfire susceptibility assessment in Southern China: A comparison of multiple methods. Int. J. Disaster Risk Sci. 2017, 8, 164–181. [Google Scholar] [CrossRef] [Green Version]
- Pourghasemi, H.R.; Beheshtirad, M.; Pradhan, B. A comparative assessment of prediction capabilities of modified analytical hierarchy process (M-AHP) and Mamdani fuzzy logic models using Netcad-GIS for forest fire susceptibility mapping. Geomat. Nat. Hazards Risk 2016, 7, 861–885. [Google Scholar] [CrossRef] [Green Version]
- Eskandari, S. A new approach for forest fire risk modeling using fuzzy AHP and GIS in Hyrcanian forests of Iran. Arab. J. Geosci. 2017, 10, 190. [Google Scholar] [CrossRef]
- Li, X.; Lanorte, A.; Telesca, L.; Song, W.; Lasaponara, R. Assessment of MODIS-Based NDVI-Derived Index for Fire Susceptibility Estimation in Northern China. In Proceedings of the International Conference on Computational Science and Its Applications, Banff, AB, Canada, 22–25 June 2015; pp. 193–203. [Google Scholar]
- Liu, W.; Wang, S.; Zhou, Y.; Wang, L.; Zhu, J.; Wang, F. Lightning-caused forest fire risk rating assessment based on case-based reasoning: A case study in DaXingAn Mountains of China. Nat. Hazards 2016, 81, 347–363. [Google Scholar] [CrossRef]
- Liu, Q.; Shan, Y.; Shu, L.; Sun, P.; Du, S. Spatial and temporal distribution of forest fire frequency and forest area burnt in Jilin Province, Northeast China. J. For. Res. 2018, 29, 1233–1239. [Google Scholar] [CrossRef]
- Tehrany, M.S.; Jones, S.; Shabani, F.; Martínez-Álvarez, F.; Bui, D.T. A novel ensemble modeling approach for the spatial prediction of tropical forest fire susceptibility using LogitBoost machine learning classifier and multi-source geospatial data. Arch. Meteorol. Geophys. Bioclimatol. Ser. B 2018, 137, 637–653. [Google Scholar] [CrossRef]


| Bands | Central Wavelength (µm) | Resolution (m) |
|---|---|---|
| Band 4—Red | 0.665 | 10 |
| Band 8—NIR | 0.842 | 10 |
| Factors | The Method of Affecting Fires | Factors Used by Experts (%) | Source | |
|---|---|---|---|---|
| 1. | Slope gradient | Fire spread is higher on steep slopes, so that with a 10-degree increase in the slope angle, the propagation speed doubles [66]. | 54.24 | DEM-30 m https://earthexplorer.usgs.gov/ (accessed on 13 August 2021) |
| 2. | Slope aspect | Since southward slopes are warmer and drier than other areas, fire risks are higher on these slopes [67]. | 52.54 | DEM-30 m https://earthexplorer.usgs.gov/ (accessed on 13 August 2021) |
| 3. | Elevation | Under normal conditions, at lower and middle altitudes of an area, fires are much more probable to occur than at higher altitudes because of relatively higher temperatures, lower humidity, and ease of human access [12]. Besides, by an increase in the altitude, damage caused by fires is reduced due to the slower growth of trees compared to lands of lower altitudes and the lower accumulation of resin under the bark [68]. | 50.85 | DEM-30 m https://earthexplorer.usgs.gov/ (accessed on 13 August 2021) |
| 4. | Precipitation | Precipitation is an important factor contributing to the high humidity of fuels, so it is considered a negative indicator of fire spread. In fact, the higher the moisture content in a species’ tissue, the more heat and the longer time it will need to evaporate the moisture content, so the higher fire resistance will be. Therefore, the moisture content of the burnable matter is one of the major factors effective in fire occurrence [16]. Besides, rising precipitation in spring increases vegetation growth. This vegetation dries in summer and makes fire occurrence possible [53]. Thus, it is required to pay attention to the amount of precipitation, the precipitation season, and the system creating it. This is because precipitation accompanied by strong lightning can cause fires. | 40.68 | TRMM-NASA |
| 5. | Distance from roads | When the distance from roads increases, fire risks decrease because of less traffic and human activity [47]. | 40.68 | World Imagery-GIS base map |
| 6. | Distance from settlements | There is a higher fire occurrence risk in the vicinity of settlements involving human activity [58]. | 40.68 | World Imagery-GIS base map |
| 7. | LULC | The effects of LULC are exerted by human activity. Thus, it uses in which there is more human activity with suitable conditions for fire, it is more probable to occur [69]. | 38.98 | LULC https://earthexplorer.usgs.gov/ (accessed on 13 August 2021) |
| 8. | Annual temperature | Temperature rises increase evaporation and transpiration, thereby drying combustible materials, which is considered one of the factors effective in fire occurrence [70]. | 38.98 | Climate Data https://globalweather.tamu.edu/ (accessed on 13 August 2021) |
| 9. | Wind speed | The higher the wind speed is, the higher the fire intensity will be. This is because when the wind moves the air, more oxygen is transferred to the burning environment [22]. In this respect, if the wind blows from the land, it will have a greater effect on fire intensity. | 32.2 | Climate Data https://globalweather.tamu.edu/ (accessed on 13 August 2021) |
| 10. | NDVI | Since vegetation is the fuel itself, and NDVI shows the condition of vegetation, this factor has a strong effect on fire ignition and the spread of fire [23]. | 28.81 | Sentinel-2 A https://earthexplorer.usgs.gov/ (accessed on 13 August 2021) |
| 11. | Distance from streams | Human activity (particularly, camping along rivers and springs in summer, monitoring cropland, and, sometimes, visiting by tourists to this area, due to the river and the good weather), could affect vegetation fires. Thus, the increase in people’s presence along rivers is one of the serious threats [71]. | 23.73 | World Imagery-GIS base map |
| 12. | Geology | The parent rock determines the soil type. Soil is considered one of the major parameters in describing vegetation fires. Besides, it, indirectly, affects the entire environment of a given region [72]. The soil type demonstrates the effects of the texture and composition of soil substances on fire occurrence [15]. | 16.95 | Iraqi Geological Survey (Scale 1: 250,000) GEOSURV-IRAQ |
| 13. | TWI | The TWI shows the size of saturated areas of runoff generation and the effects of topography on the location. Thus, upon an increase in the value of this index, fire risks decrease [15]. | 16.95 | DEM-30 m https://earthexplorer.usgs.gov/ (accessed on 13 August 2021) |
| 14. | Relative humidity | In dry seasons, with an increase in the temperature as well as a decrease in relative humidity and dryness of vegetation, the probability of fire occurrence and spread increases [73]. | 13.56 | Climate Data https://globalweather.tamu.edu/ (accessed on 13 August 2021) |
| 15. | Distance from farmlands | Since many fires are created for clearing agricultural lands off crop residues or developing them, fire risks are greater near agricultural lands [28]. Traditionally, farmers used the above-mentioned method, which is not seen as a harmful method. On the contrary, it is viewed as a method that increases soil fertility. Nevertheless, the fire sometimes gets out of control, unintentionally. | 11.86 | World Imagery-GIS base map |
| 16. | TPI | It displays the difference in height between a focal cell and all cells in the neighborhood [74]. In addition, TPI shows that flat areas are not as favorable for fire occurrence as ridges and gentle slopes [5]. Besides, the more positive or negative the curvature is, the more likely the vegetation-fire occurrence will be [4]. | 10.17 | DEM-30 mhttps://earthexplorer.usgs.gov/ (accessed on 13 August 2021) |
| Validation Method | Group 1 | Group 2 | Group 3 | Group 4 | Group 5 | Group 6 | Group 7 |
|---|---|---|---|---|---|---|---|
| Mean Absolute Error (MAE)% | 1.19 | 1.01 | 0.68 | 2.54 | 0.86 | 0.76 | 0.62 |
| Relative Error (RE)% | 5.73 | 5.41 | 2.69 | 15.15 | 3.80 | 3.28 | 2.32 |
| Percentage Error (PE)% | 1.26 | 1.07 | 0.70 | 2.99 | 0.89 | 0.79 | 0.64 |
Publisher’s Note: MDPI stays neutral with regard to jurisdictional claims in published maps and institutional affiliations. |
© 2022 by the authors. Licensee MDPI, Basel, Switzerland. This article is an open access article distributed under the terms and conditions of the Creative Commons Attribution (CC BY) license (https://creativecommons.org/licenses/by/4.0/).
Share and Cite
Salar, S.G.; Othman, A.A.; Rasooli, S.; Ali, S.S.; Al-Attar, Z.T.; Liesenberg, V. GIS-Based Modeling for Vegetated Land Fire Prediction in Qaradagh Area, Kurdistan Region, Iraq. Sustainability 2022, 14, 6194. https://0-doi-org.brum.beds.ac.uk/10.3390/su14106194
Salar SG, Othman AA, Rasooli S, Ali SS, Al-Attar ZT, Liesenberg V. GIS-Based Modeling for Vegetated Land Fire Prediction in Qaradagh Area, Kurdistan Region, Iraq. Sustainability. 2022; 14(10):6194. https://0-doi-org.brum.beds.ac.uk/10.3390/su14106194
Chicago/Turabian StyleSalar, Sarkawt G., Arsalan Ahmed Othman, Sabri Rasooli, Salahalddin S. Ali, Zaid T. Al-Attar, and Veraldo Liesenberg. 2022. "GIS-Based Modeling for Vegetated Land Fire Prediction in Qaradagh Area, Kurdistan Region, Iraq" Sustainability 14, no. 10: 6194. https://0-doi-org.brum.beds.ac.uk/10.3390/su14106194