
The Research on the Damping of Prestressed Membrane Structure Subjected to the Impact Load


1
School of Architecture and Civil Engineering, Jiangsu University of Science and Technology, Zhenjiang 212100, China
2
School of Civil Engineering, Southeast University, Nanjing 210096, China
*
Author to whom correspondence should be addressed.
Sustainability 2022, 14(10), 6196; https://0-doi-org.brum.beds.ac.uk/10.3390/su14106196
Submission received: 17 April 2022
/
Revised: 12 May 2022
/
Accepted: 18 May 2022
/
Published: 19 May 2022
(This article belongs to the Special Issue Sustainability-Based Structural Design and Assessement under Independent and Interacting Hazards: Emphasis on Earthquake, Shock and Corrosion)
Abstract
:The damping ratio plays a main role in the vibration of membrane structures. In order to study the damping force of air application to membrane structures, this present paper investigated the vibration response of a membrane structure subjected to impact loads. Eight experiments with the application of different tension forces to a tension membrane structure were conducted, and the impact load was simulated using a rigid bullet with a certain velocity. The displacement data were obtained using a laser displacement meter. FEM was used to simulate the vibration, and the results had good agreement. The results show that the effect of air applied to a prestressed membrane was equivalent to viscous damping, and the damping force was determined using the air. The damping ratio was proportional to the density of the air over the density of the membrane. The parameter of the coefficient could be determined using the geometry of the structure.
1. Introduction
Prestressed membrane structures are widely used by architects due to their beautiful shape, small ratio of weight over strength and other advantages [1,2,3]. Being different to traditional structures, their stiffness is mainly provided by tension force and geometry curvature, which leads to prestressed membrane structures being very sensitive to dynamic loads, such as wind, rain, hail and other loads [4,5,6,7]. Prestressed membranes are sensitive to shock loads. If the large displacement under the dynamic load of a prestressed membrane structure is not controlled well, the membrane structure will be damaged.
At present, there are some studies that have considered the vibration of prestressed membrane structures via analytical methods, numerical simulations and experiments [8,9,10]. Many researchers have derived theoretical formulas for membrane structures subject to dynamic loads. Zheng Zhoulian et al. [11,12] used the large deflection theory of thin shells to derive the free vibration control equation of orthogonal anisotropic thin membranes. Zhang Lin et al. [13,14] established a new method for the study of orthogonal heterosexual rectangular membrane structures under impact loads, and they obtained an analytical solution which was verified through an experiment. However, these theoretical methods often fail to account for complicated conditions. Liu Chang jiang et al. [15,16,17,18] studied the nonlinear vibration response of an orthogonal anisotropic plane and a curved prestressed membrane under a concentrated impact load. Kapoor et al. [19] studied the dynamic response of highly flexible membrane structures under explosive loads and established an FEM model with a square chamber structure. Meanwhile, they calculated the response of displacement and stress. After a discussion, they revealed that as the Young’s modulus increases, deflection decreases. Furthermore, damping is crucial for vibration, and membrane structures are sensitive to wind load. The question of how to analyze the response of membrane structures under wind loads or other dynamic loads is very important, and the damping ratio is the key parameter for conducting this analysis. Liu Ping [20,21,22], etc., proposed a new analytical method to obtain some rules on the damping force of air applied to a membrane structure on the basis of no vortex assumption.
The present paper considered the damping force of air applied to a membrane structure which can enhance the sustainability of the structure, and it is the first study to discuss the influence of a damping ratio applied to a membrane structure via both a numerical simulation and experiment.
2. Test Settings
2.1. Experiment Characteristic
The membrane material used in the experiment was PVDF-1050P, which was manufactured by Shanghai Weibo Advanced Membrane company [23]. It was composed of a base and yarns, and there were 12 yarns in each warp and weft direction. The density of these yarns was called fabric density, and the total mass of the fabric and base was called the membrane density; both are shown in Table 1. The ultimate strength of it in the warp direction was 4200 N/5 cm (84 kN/m) and 4500 N/5 cm (90 kN/m) in the weft direction. The density of the fabric and the membrane was 270 g/m2 and 1050 g/m2, respectively.
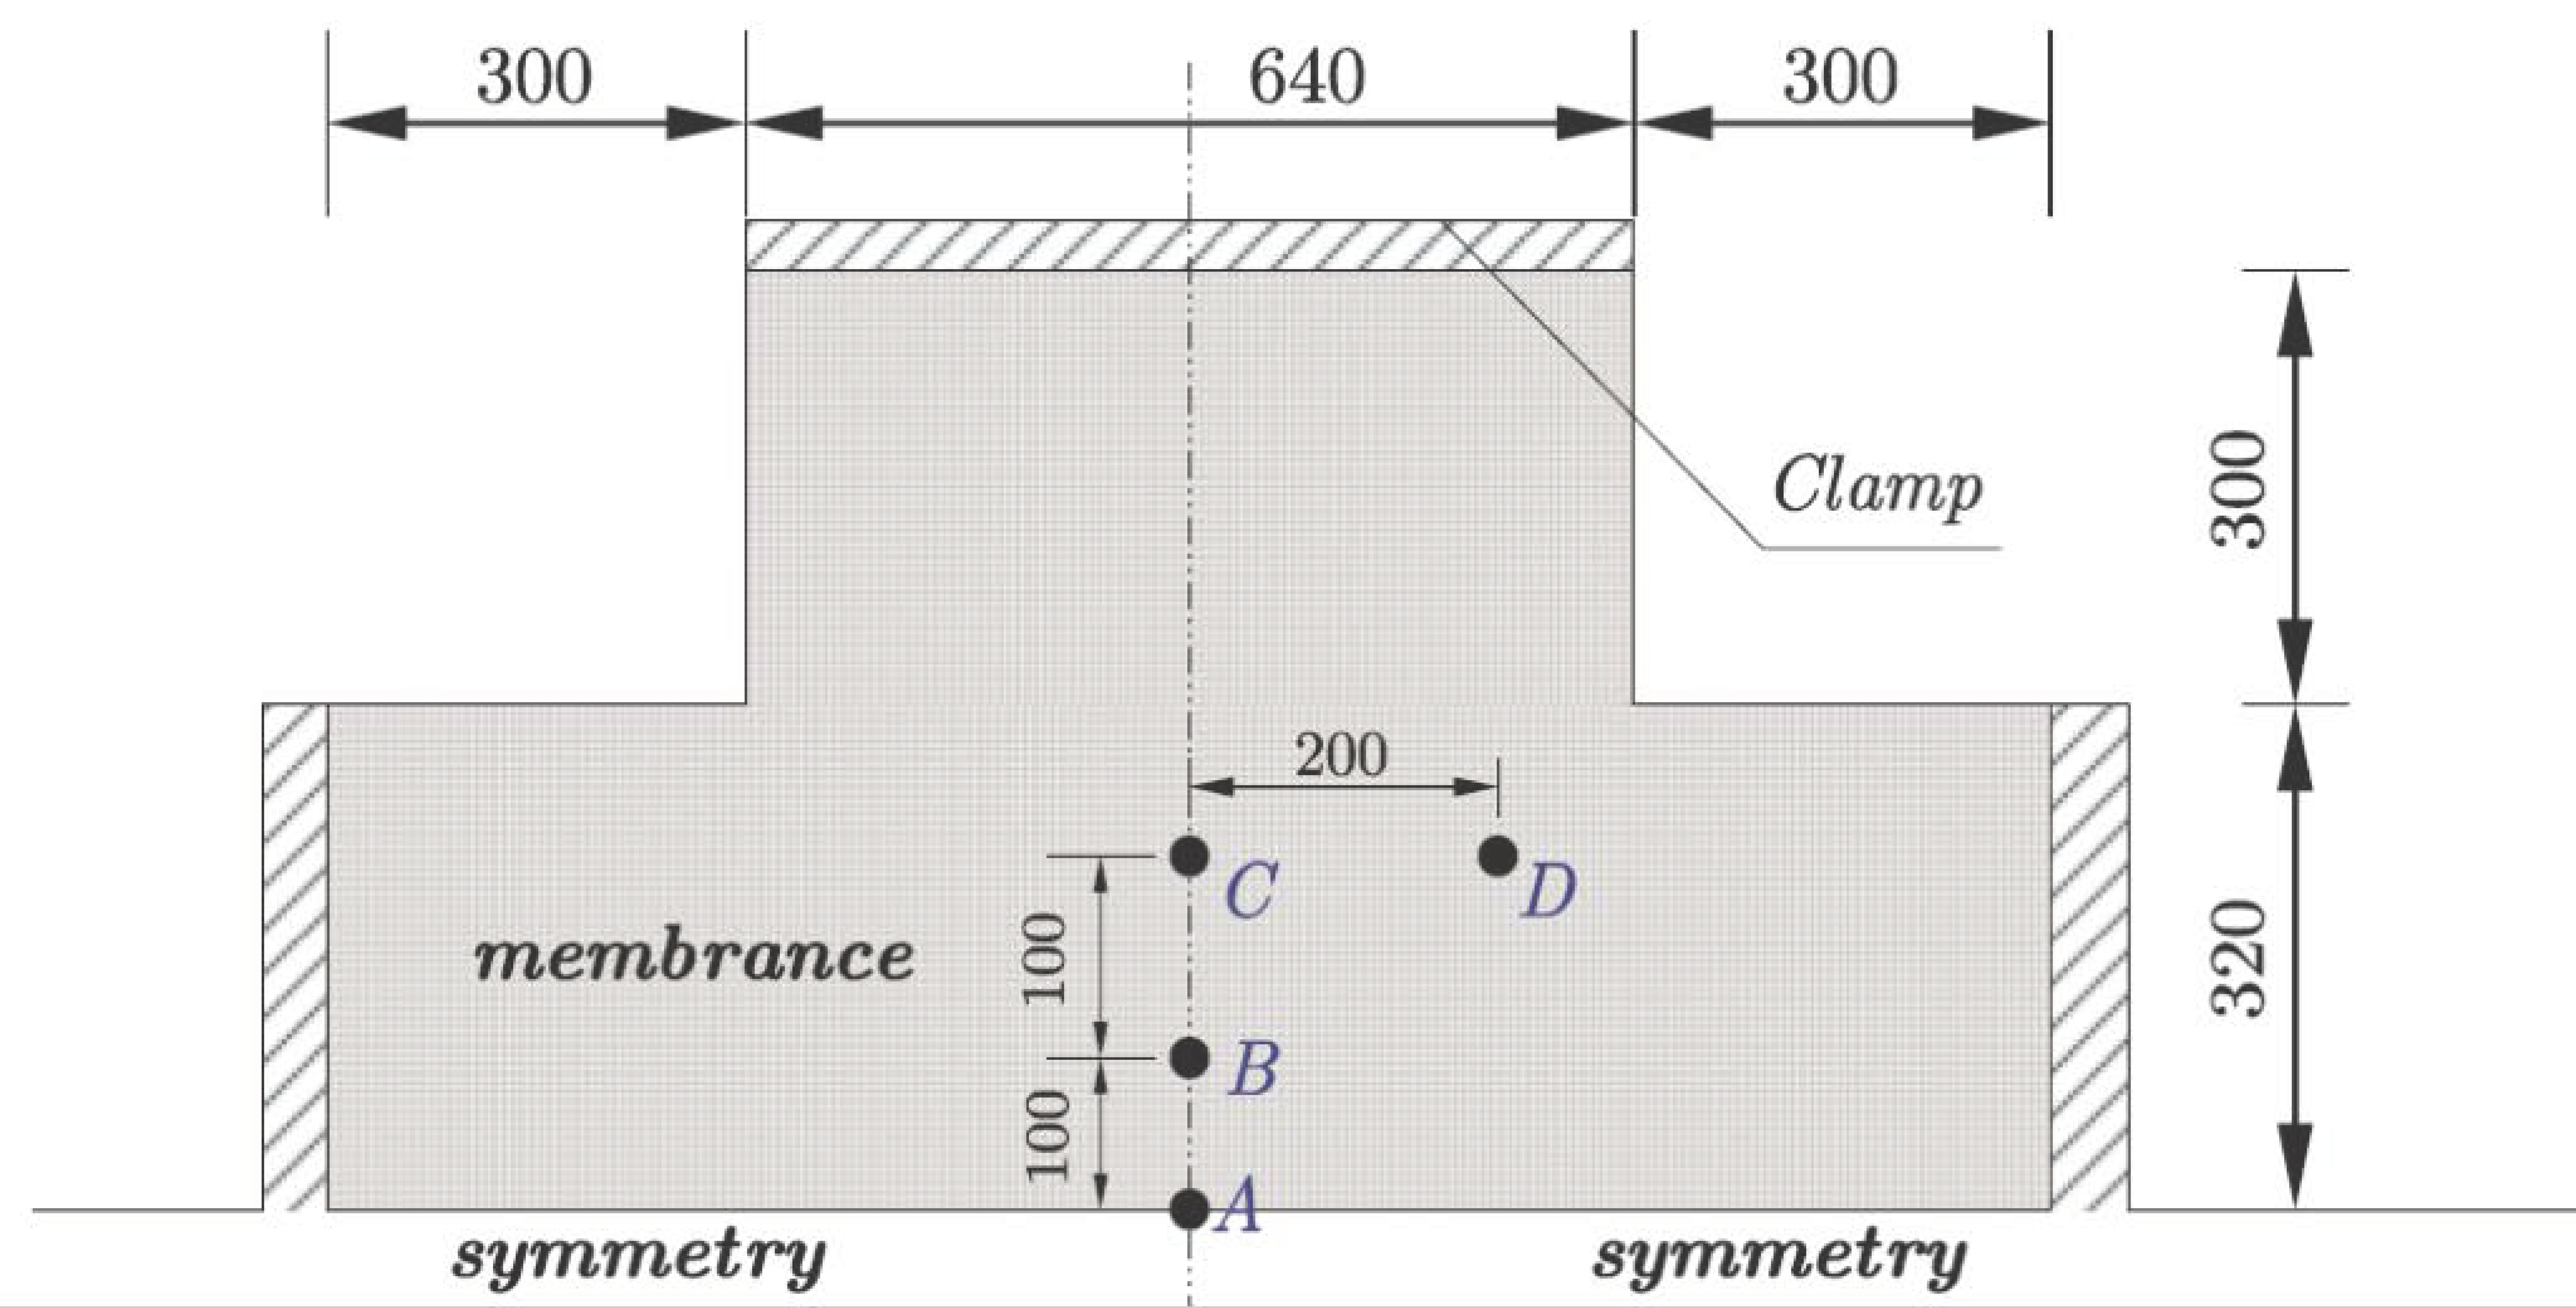
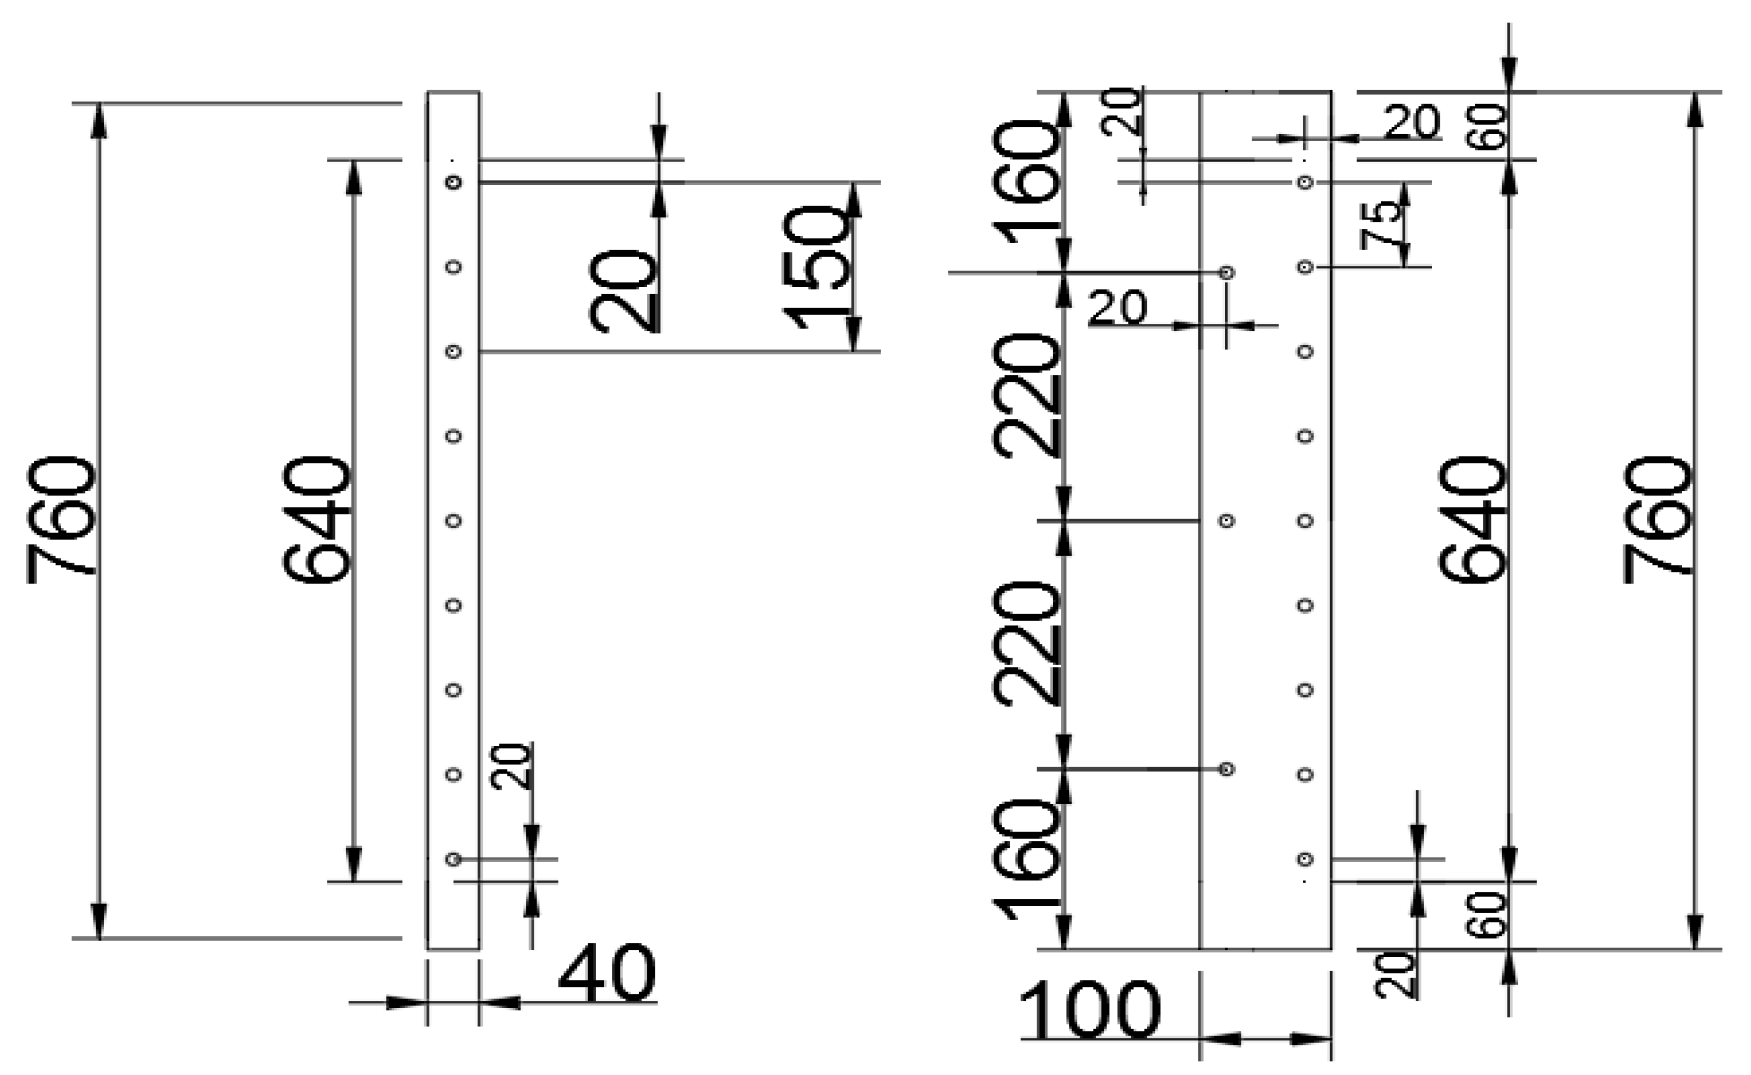
The membrane in the test was a square shape with the size of 1320 mm width and 1320 mm length. The details are shown in Figure 1. Each end of the specimen was clamped with rope so that it could be fixed with a steel clamping panel, and the bolt used was M10 × 1.50 × 50. The details are shown in Figure 2.
Due to different geometry stiffnesses, the tension force was applied along both the warp and weft directions. The tension force was set to 1.0, 2.0, 3.0, 4.0, 5.0, 6.0, 7.0 and 8.0 kN/m, all of which were no more than the 10% of the ultimate strength according to the methods of Ying Xiao-Ming [24,25]. To simulate the impact load, a small steel ball with a mass of 30 g was launched by a catapult. Additionally, we tested the velocity of the small ball using a speedometer near the membrane, which is illustrated in Figure 3b, and the velocity of the ball is listed in Table 2.
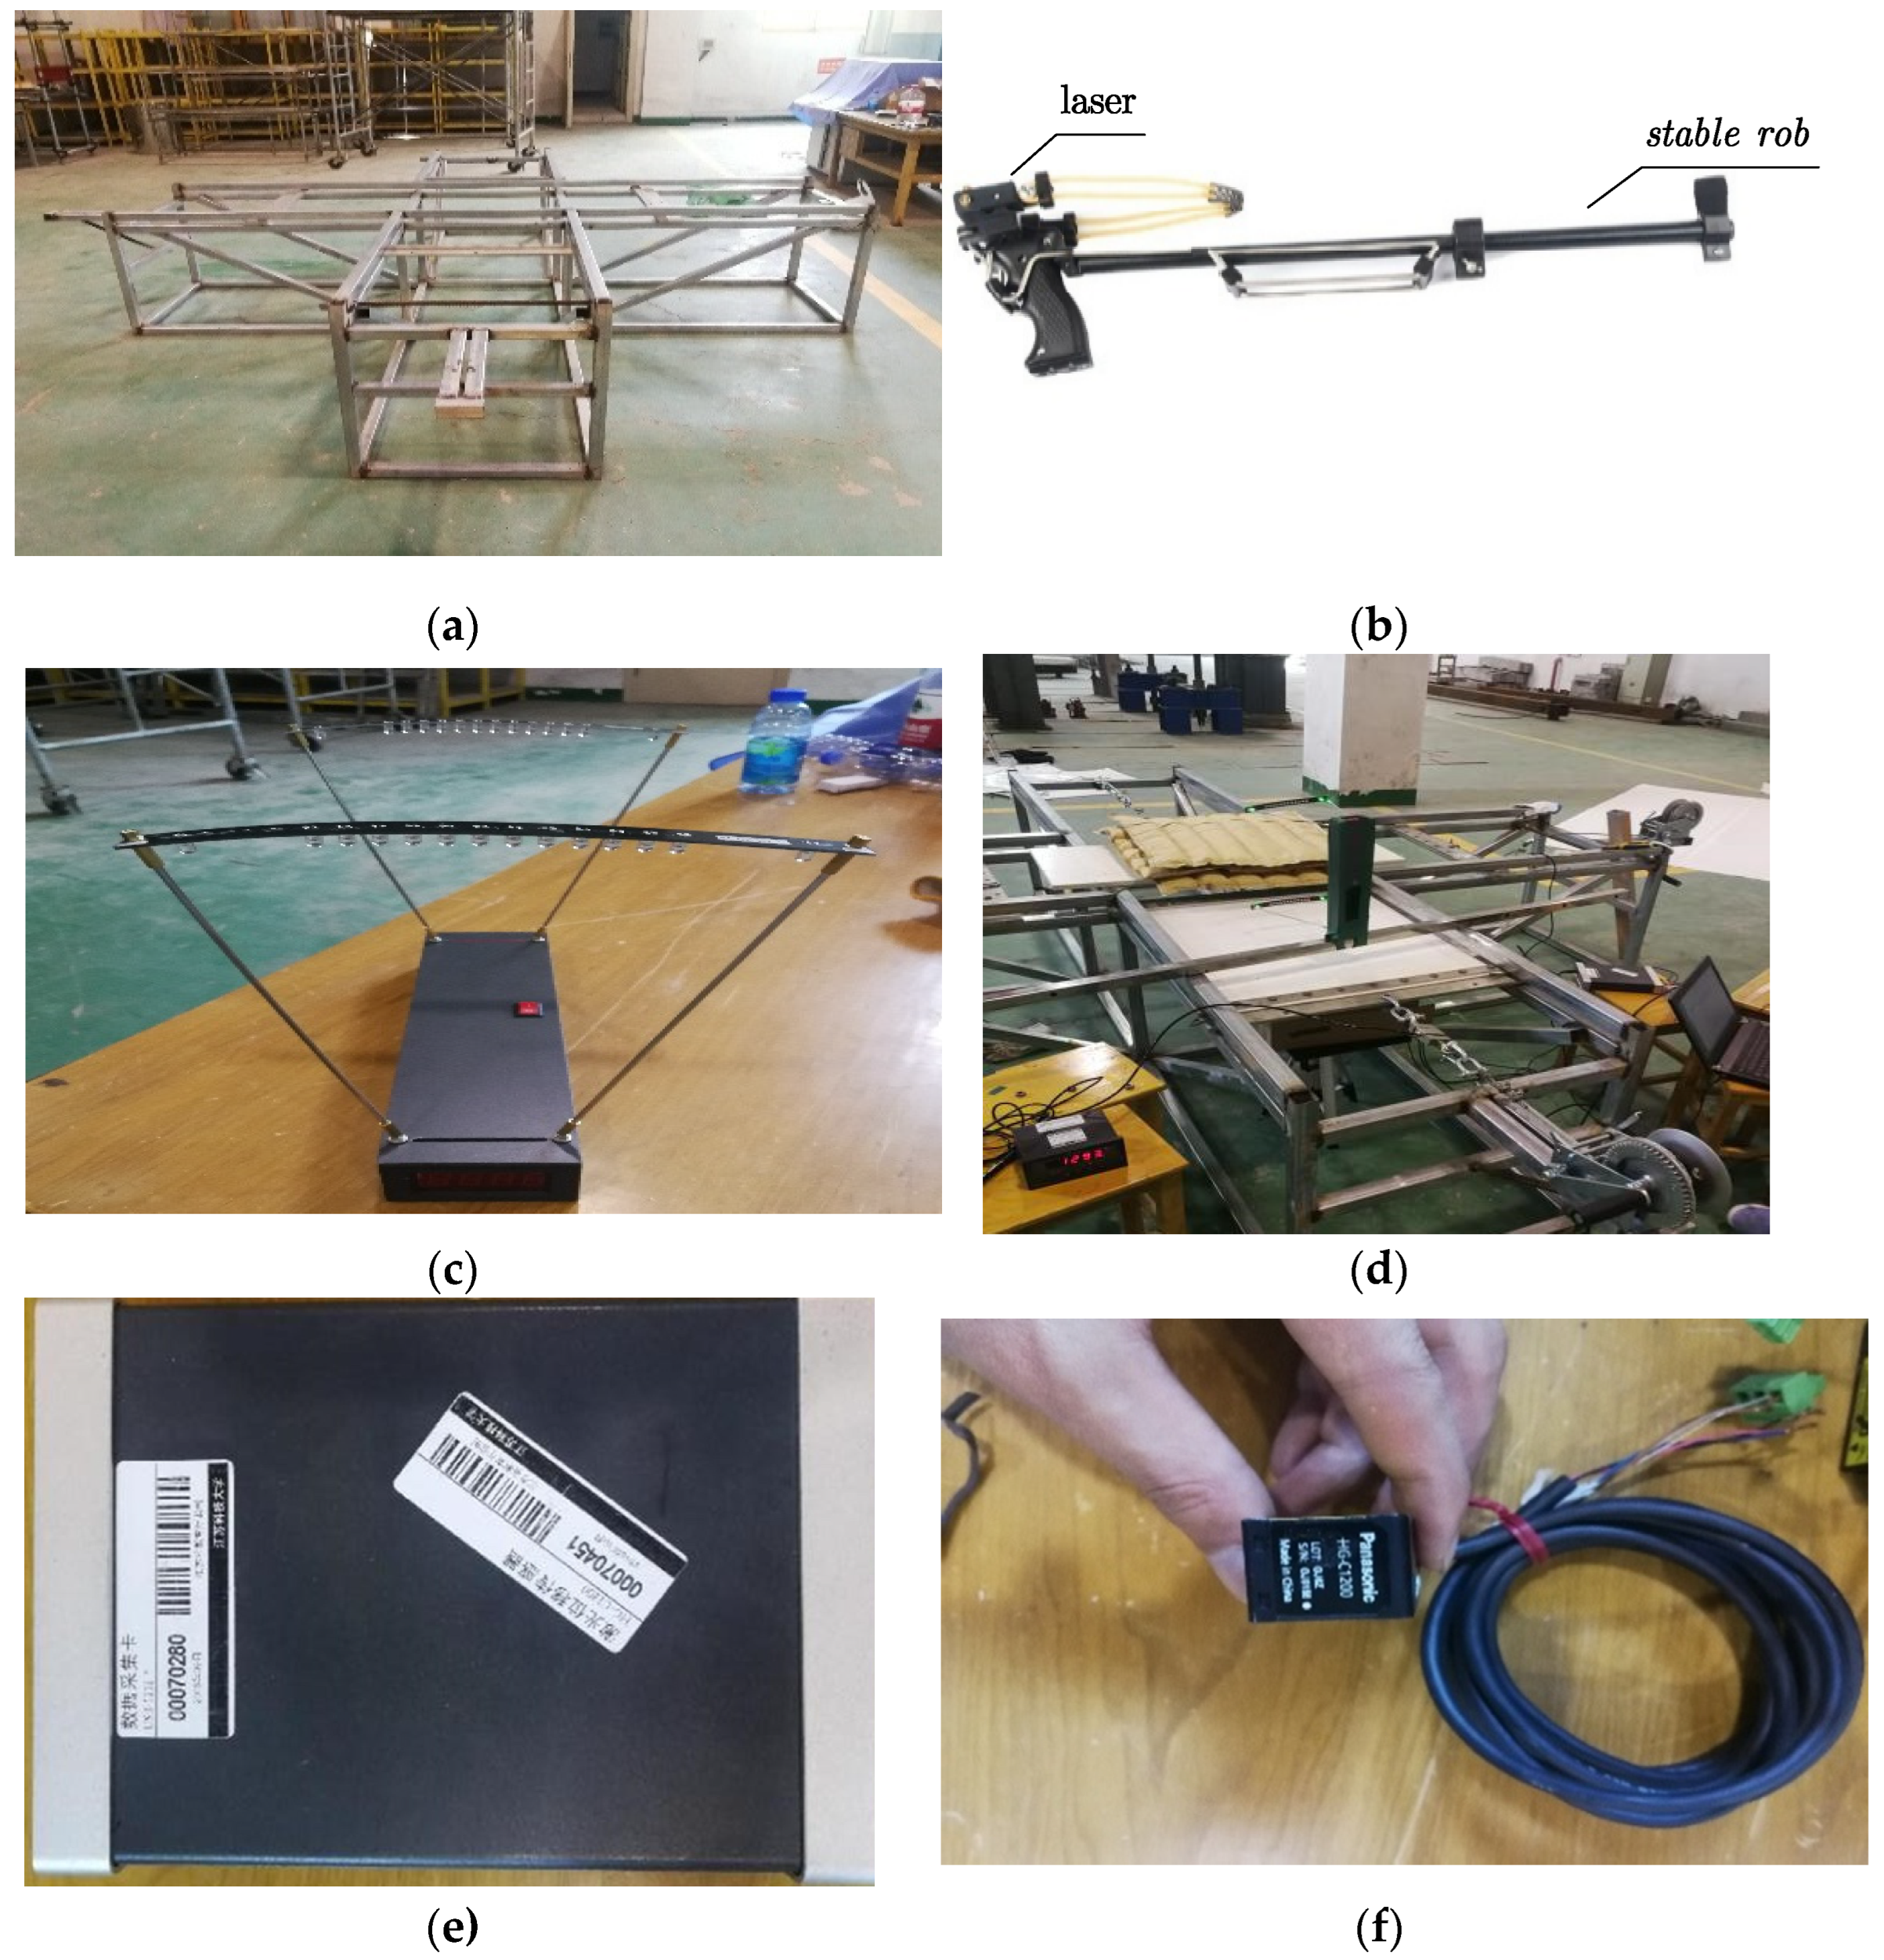
2.2. Equipment of the Test
The present experiments were carried out in the Structure Lab of Jiangsu University of Science and Technology, and the equipment made by our research group was 700 mm in height, 3080 mm in width and 3080 mm in length. The core area that the specimen was fixed to was 640 mm in width and 640 mm in length. To produce the impact load, a small steel ball was shot via a calibrated catapult into a specific place. The details of the equipment are shown in Figure 3a,b. To verify the velocity of the small ball, a speedometer, shown in Figure 3c, was set up beneath the equipment. The equipment used to enforce the tension force is shown in Figure 3d. In the test, the tension force in both the warp and weft directions was set to the same value. The data acquisition equipment used was USB-1212, manufactured by the Beijing SMACQ company. The displacement data were collected using the HG-C1200 laser displacement meter, which was manufactured by the Panasonic entrepreneur. The range of displacement was 200 ± 80 mm, and the sampling rate and resolution ratio was 100 k/s and 12 bit, respectively. The data acquisition equipment and laser displacement meter are shown in Figure 3e,f.
3. FEM Model
3.1. The Simulation Model without Air
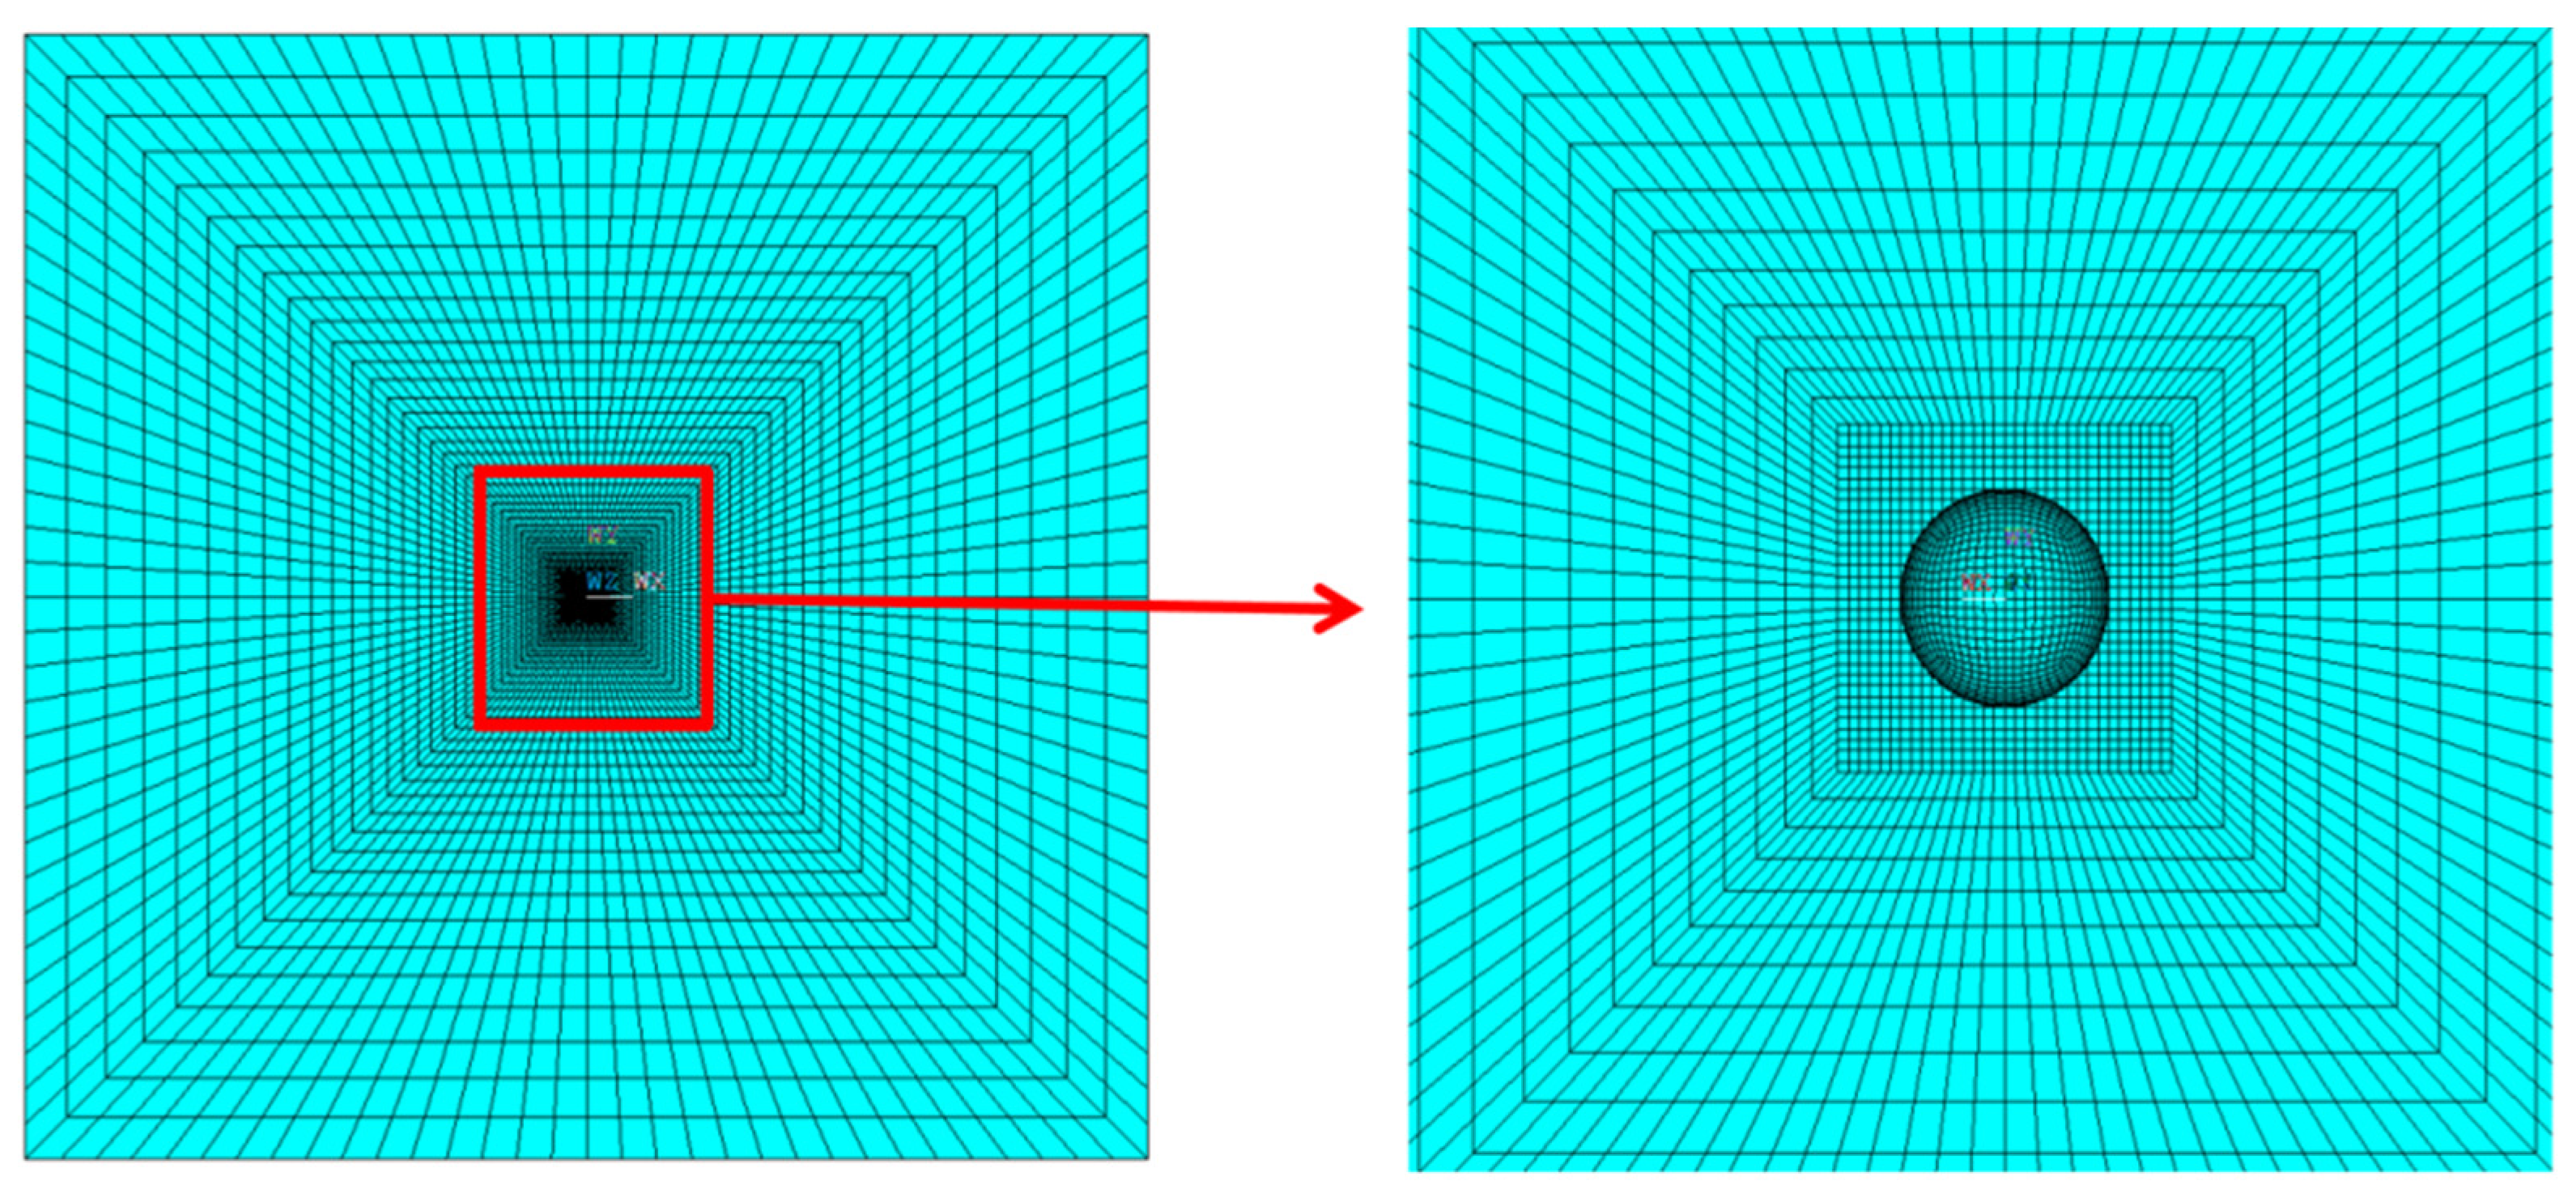
In this paper, LS-DYNA nonlinear finite element software was used to simulate the vibration process of a prestressed membrane structure subjected to an impact load considering air damping. The membrane was simulated with SHELL163 element, and the bullet was simulated with a small rigid ball to reduce the calculating time. It should be noted that the bullet had the same mass as the ball in the test. In order to improve the calculation efficiency, the ball was set as a rigid body. Based on the fact that the ball could not be deformed, the ball was simulated with a shell element. The interaction between the small ball and the membrane was set as an Automatic Surface to Surface model. The mesh is shown in Figure 4.
The membrane was simulated as a linear elastic material, the mechanical properties of which [20] are shown in Table 3. The distance between the center of the ball to the membrane was 20 mm. The mesh size of the sphere was 0.5 mm. The mesh in the collision area was refined, and the mesh is shown in Figure 4. In the experiment, the damping of the prestressed membrane structure was not considered a constant value of material but was related to the tension force. The damping coefficient obtained from the experiment was applied to the membrane without air, and the damping parameters are shown in Table 4.
3.2. The Simulation including Air
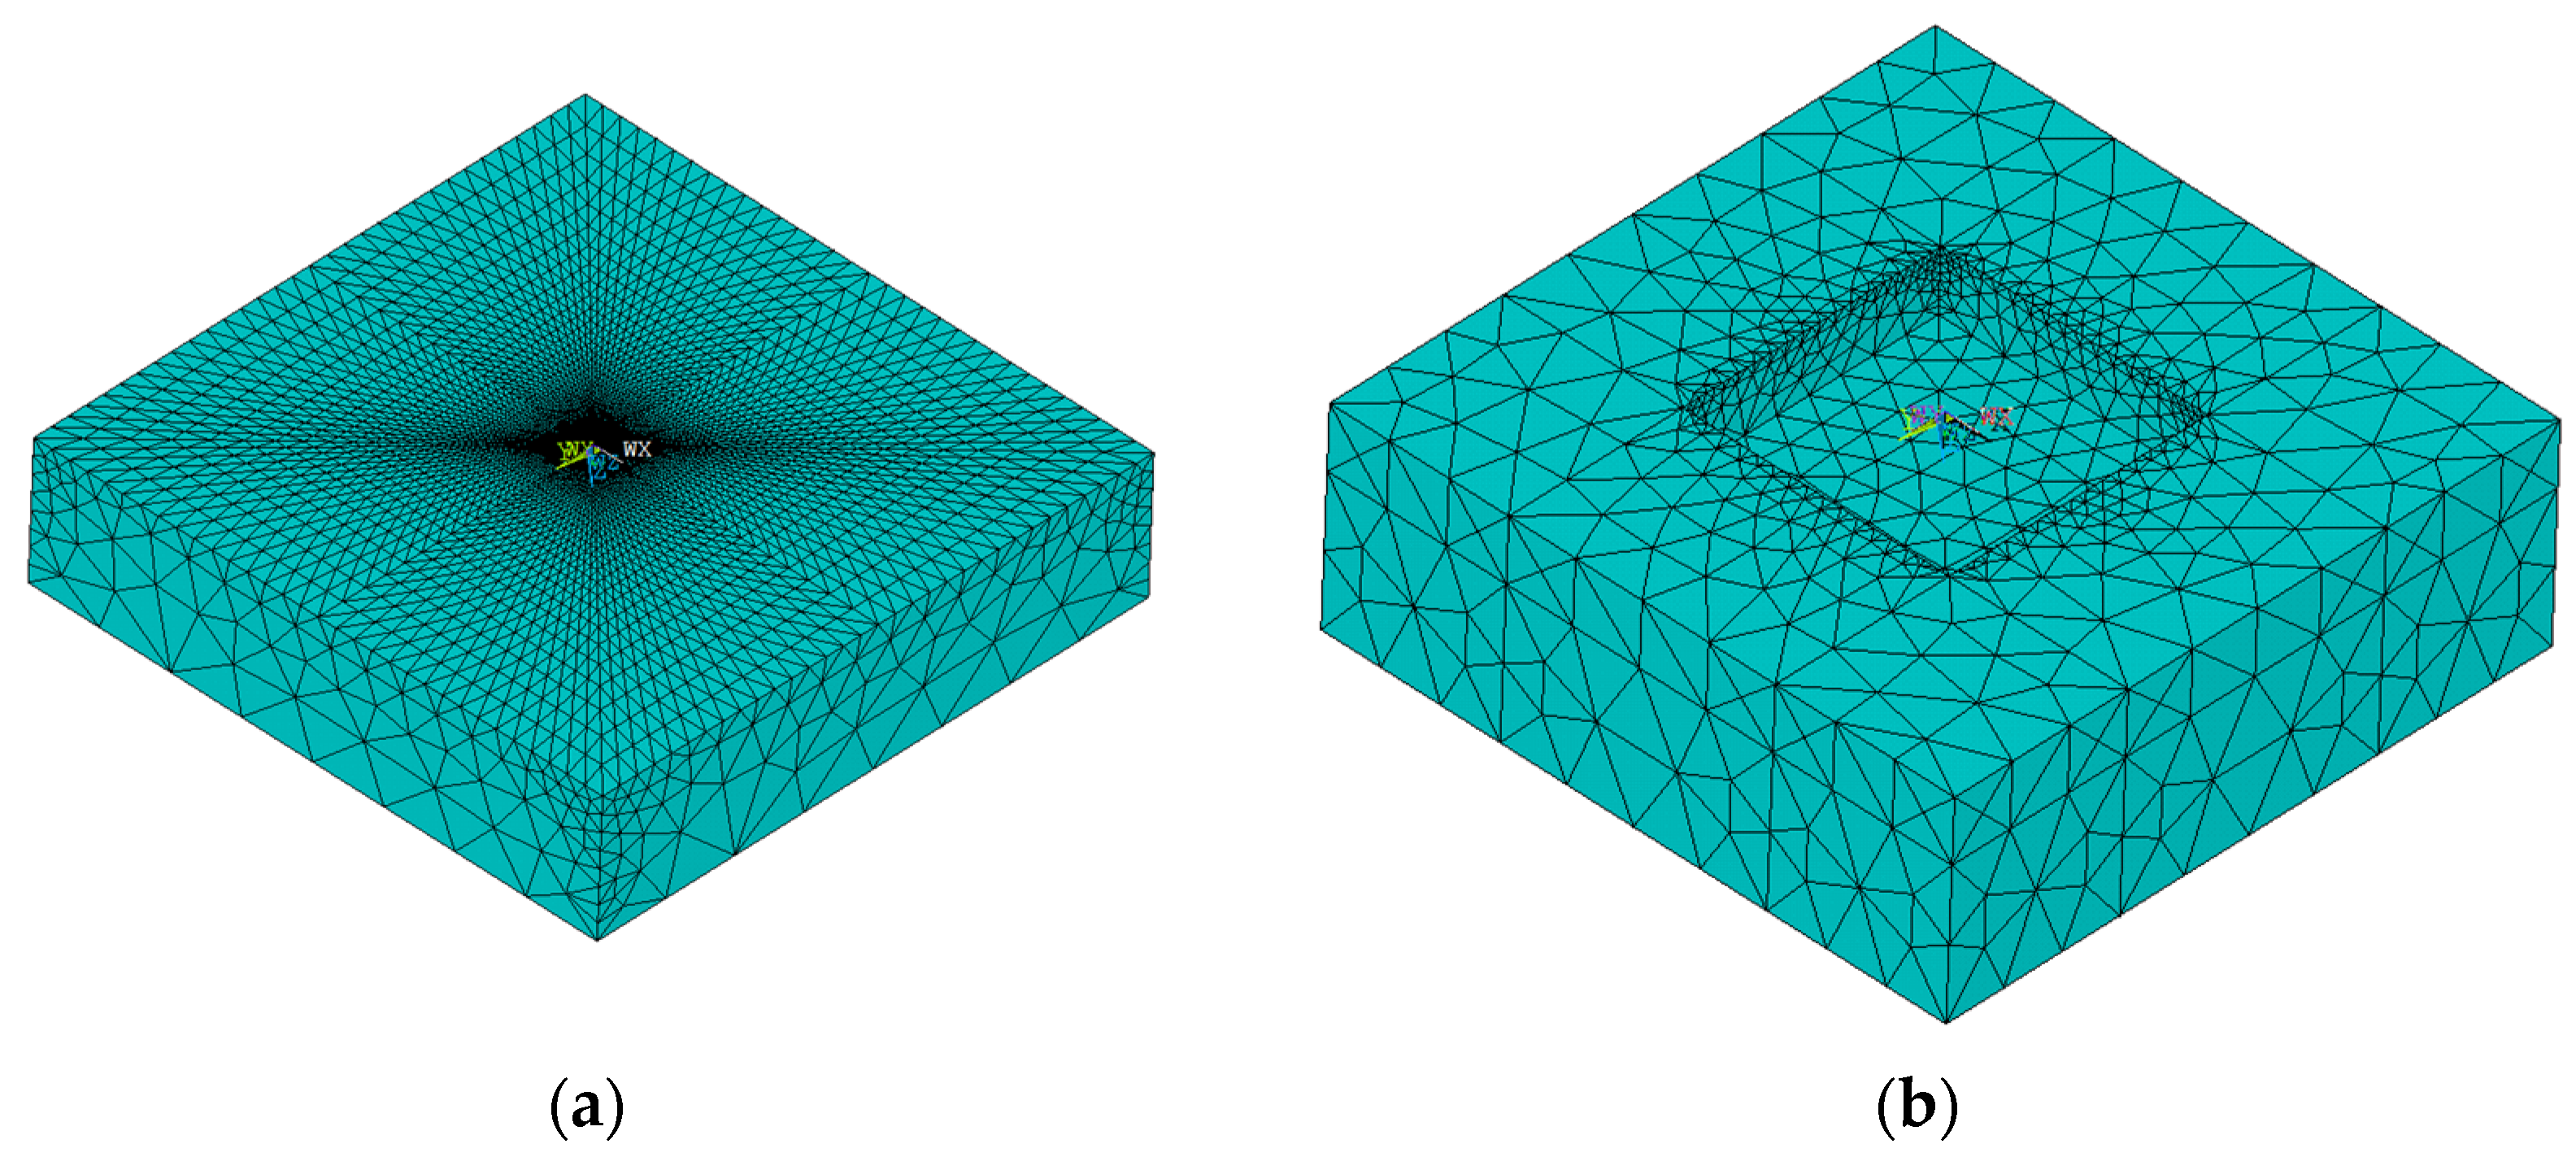
Our research team believes that the vibration response of membrane structures is significantly influenced by air, and the damping force comes from the interaction between the membrane and air, which is different to other structures. Additionally, it plays a main role in the damping force. In the present paper, it was assumed that air was an elastic body, and the fluid–solid coupling problem between the membrane and air was transformed into an interaction problem between structures, which not only simplified the numerical model, but also obtained effective results. The Z degree of both the membrane and air was coupled within the simulation, and the other degrees were free. In Figure 5, the green part of the diagram is the coupling node. The material parameters of air are shown in Table 4 [20]. Air was an elastic fluid constitution, and the mesh of air is shown in Figure 5a. The surface on which air was in contact with the prestressed membrane was meshed in the same manner as the prestressed membrane, and the air as a whole was a free mesh. This paper shows one half of the air grid, with the other half being symmetrical with the air grid on display.
In order to simulate the effect of air, in the first model, we set the damping ratio to simulate it. In the other model, the air was included in the FEM model directly. The air model was simplified as an elastic material based on the small velocity of membrane vibration. Thus, the FSI problem became a structure problem. Additionally, the mesh is shown in Figure 4. The material properties are shown in Table 3. We assumed that the fluid could not transfer from one side to another side, so we used half of the model to simulate this problem.
Finally, the boundary was set as the same as the experiment, and the tension force was generated using the temperature method. The temperature value was calculated as shown in Equation (1).
where is the temperature, is the tension force and is the thermal coefficient of the membrane.
4. Results
4.1. Vibration Results
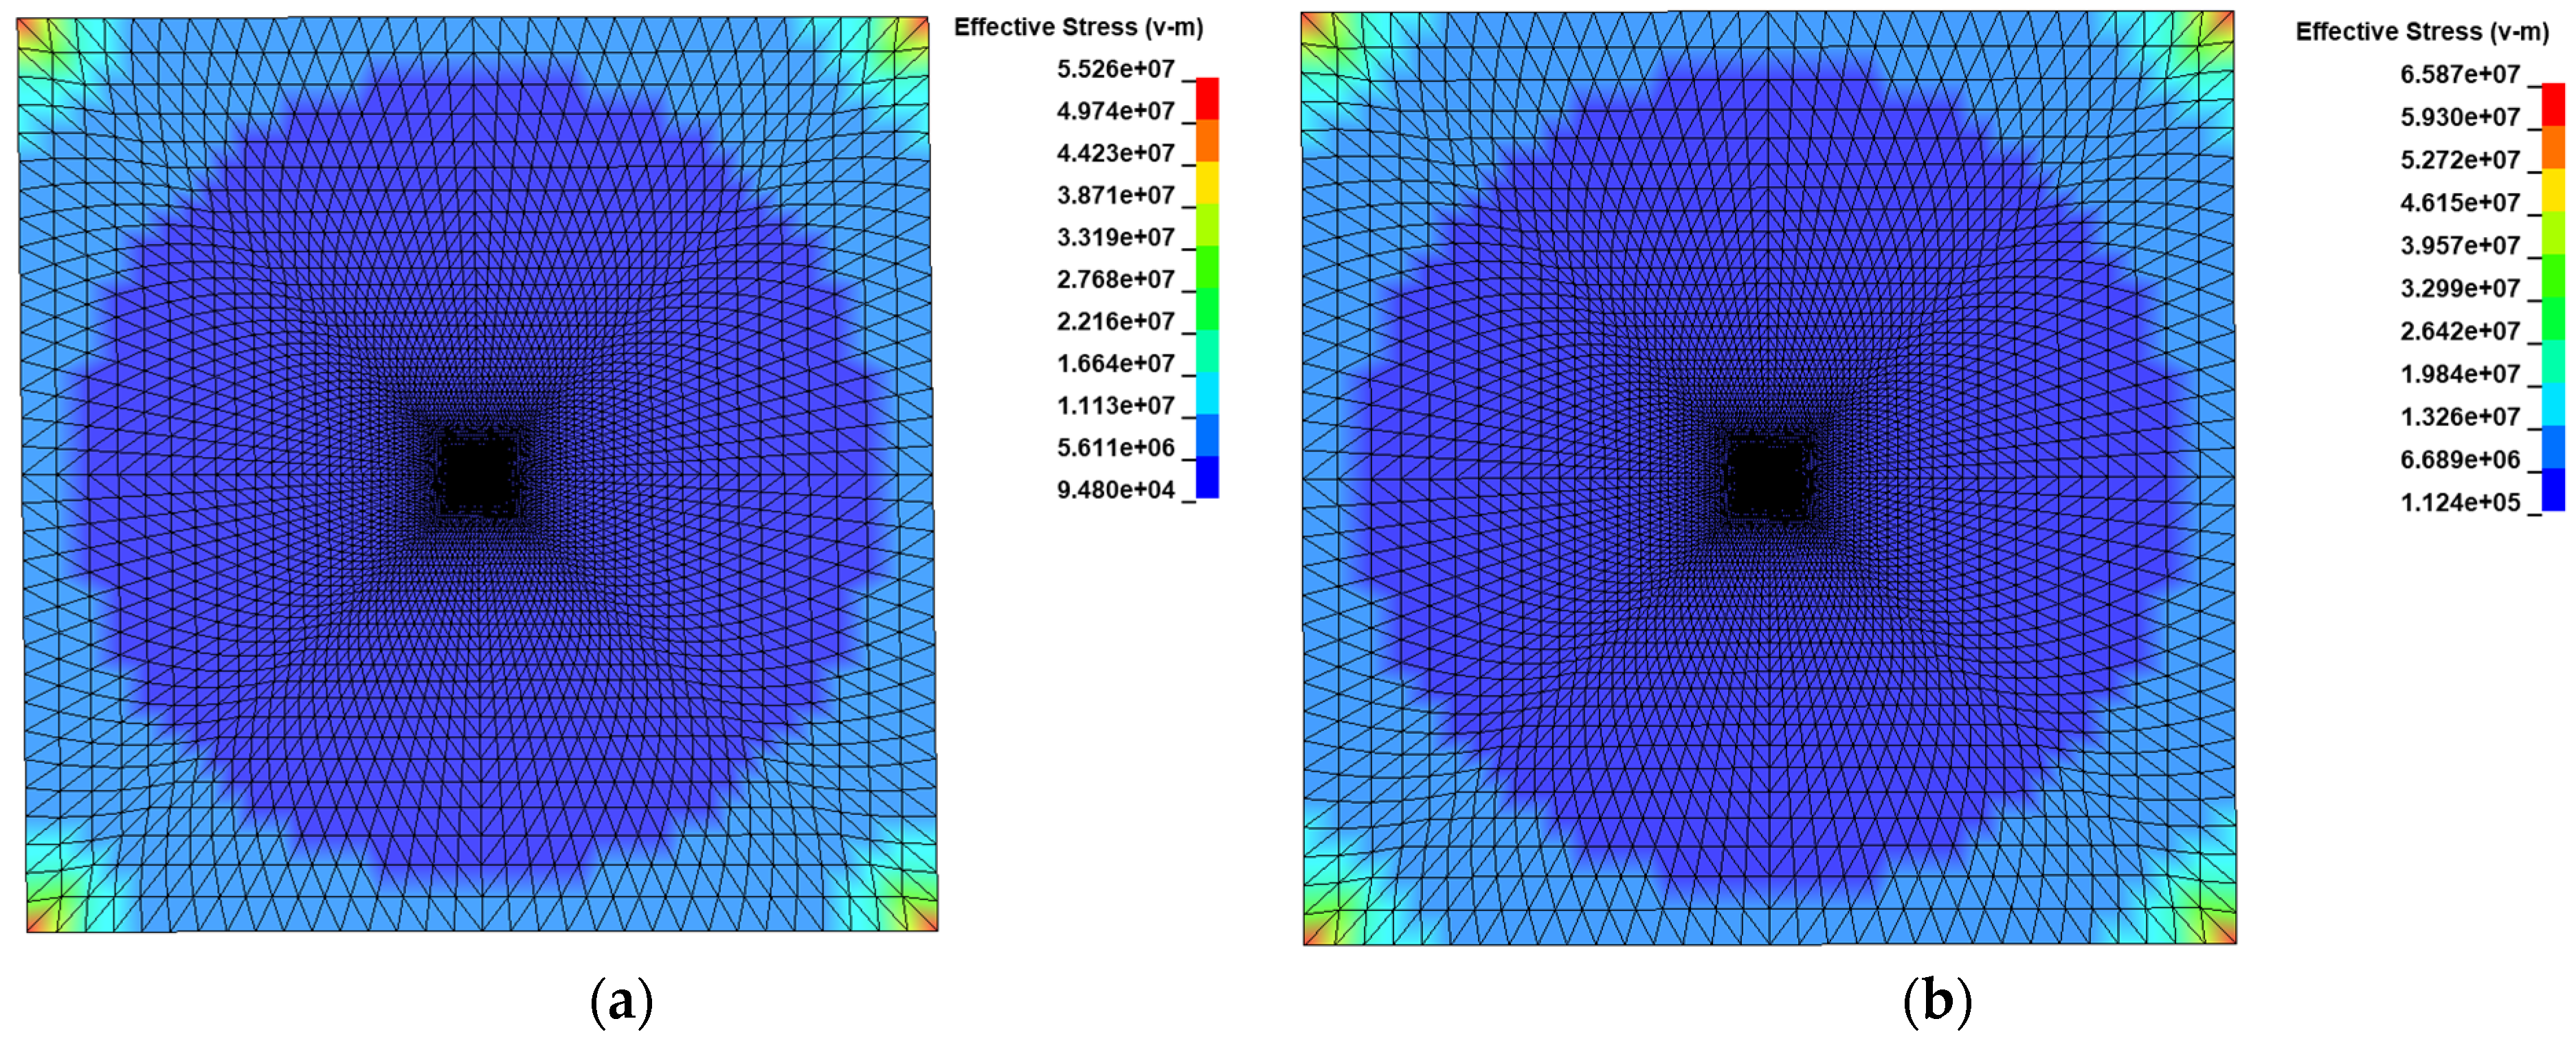
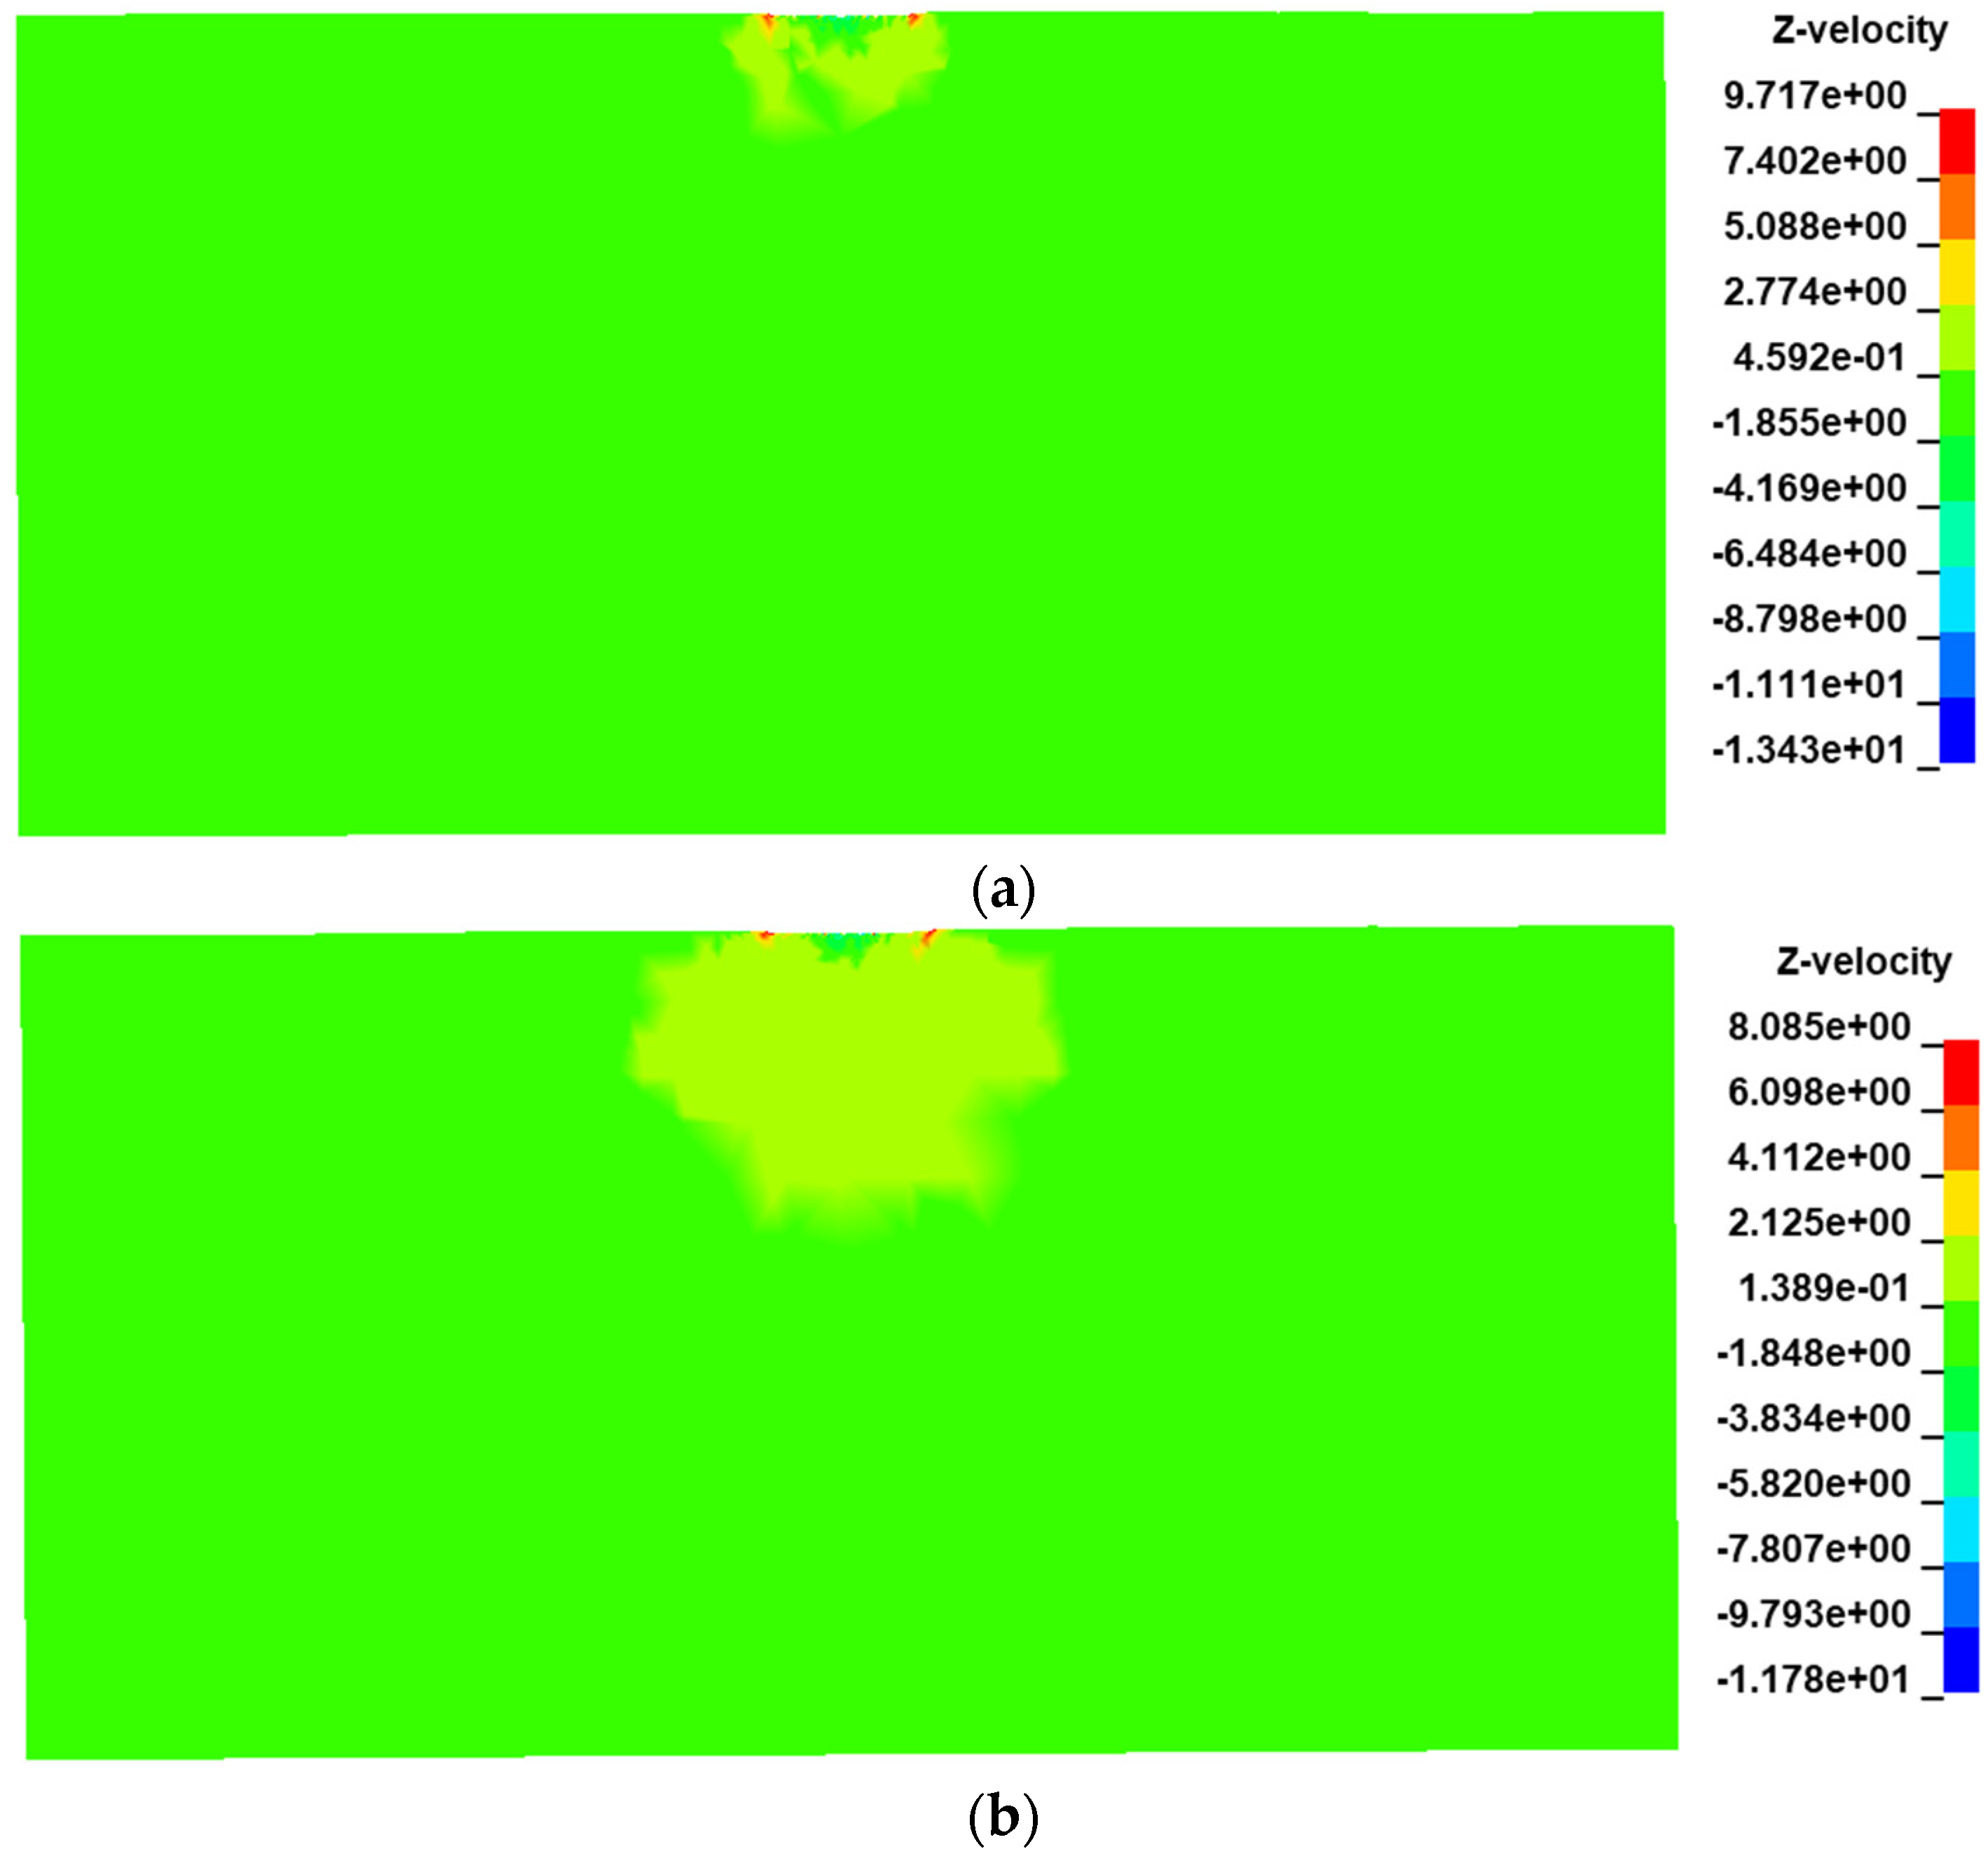
Eight prestressed membrane specimens with different tension forces were simulated and analyzed in a numerical simulation, and the results were obtained using LS-PREPOST. The initial stress of the prestressed membrane is shown in Figure 6. It can be seen that the highest stress was at the corners, which is the typical effect of stress concentration. Figure 7 shows the velocity contour of the air when the ball impacted the membrane. It can be seen that the higher the prestress was, the lower the membrane velocity was, indicating that the pretension force was a key factor in the energy transfer between the ball and the membrane.
Eight experiments with different tension forces were carried out. The effective stress contours of the membrane subjected to the tension force are plotted in Figure 6. It is shown that the max effective stress was located on the four corners, and the effective stresses are shown in a circular shape. Figure 7 shows the velocity contour of the air when t = 0.02 s. It can be seen that the max velocity was about 9.7 m/s and 8.1 m/s with respect to the tension forces of 6 kN/m and 7 kN/m. This is because the membrane could absorb more energy when the tension force was higher. Additionally, we can see that the velocities that appeared on the membrane were at impact points, and there were no responses to the other fields.
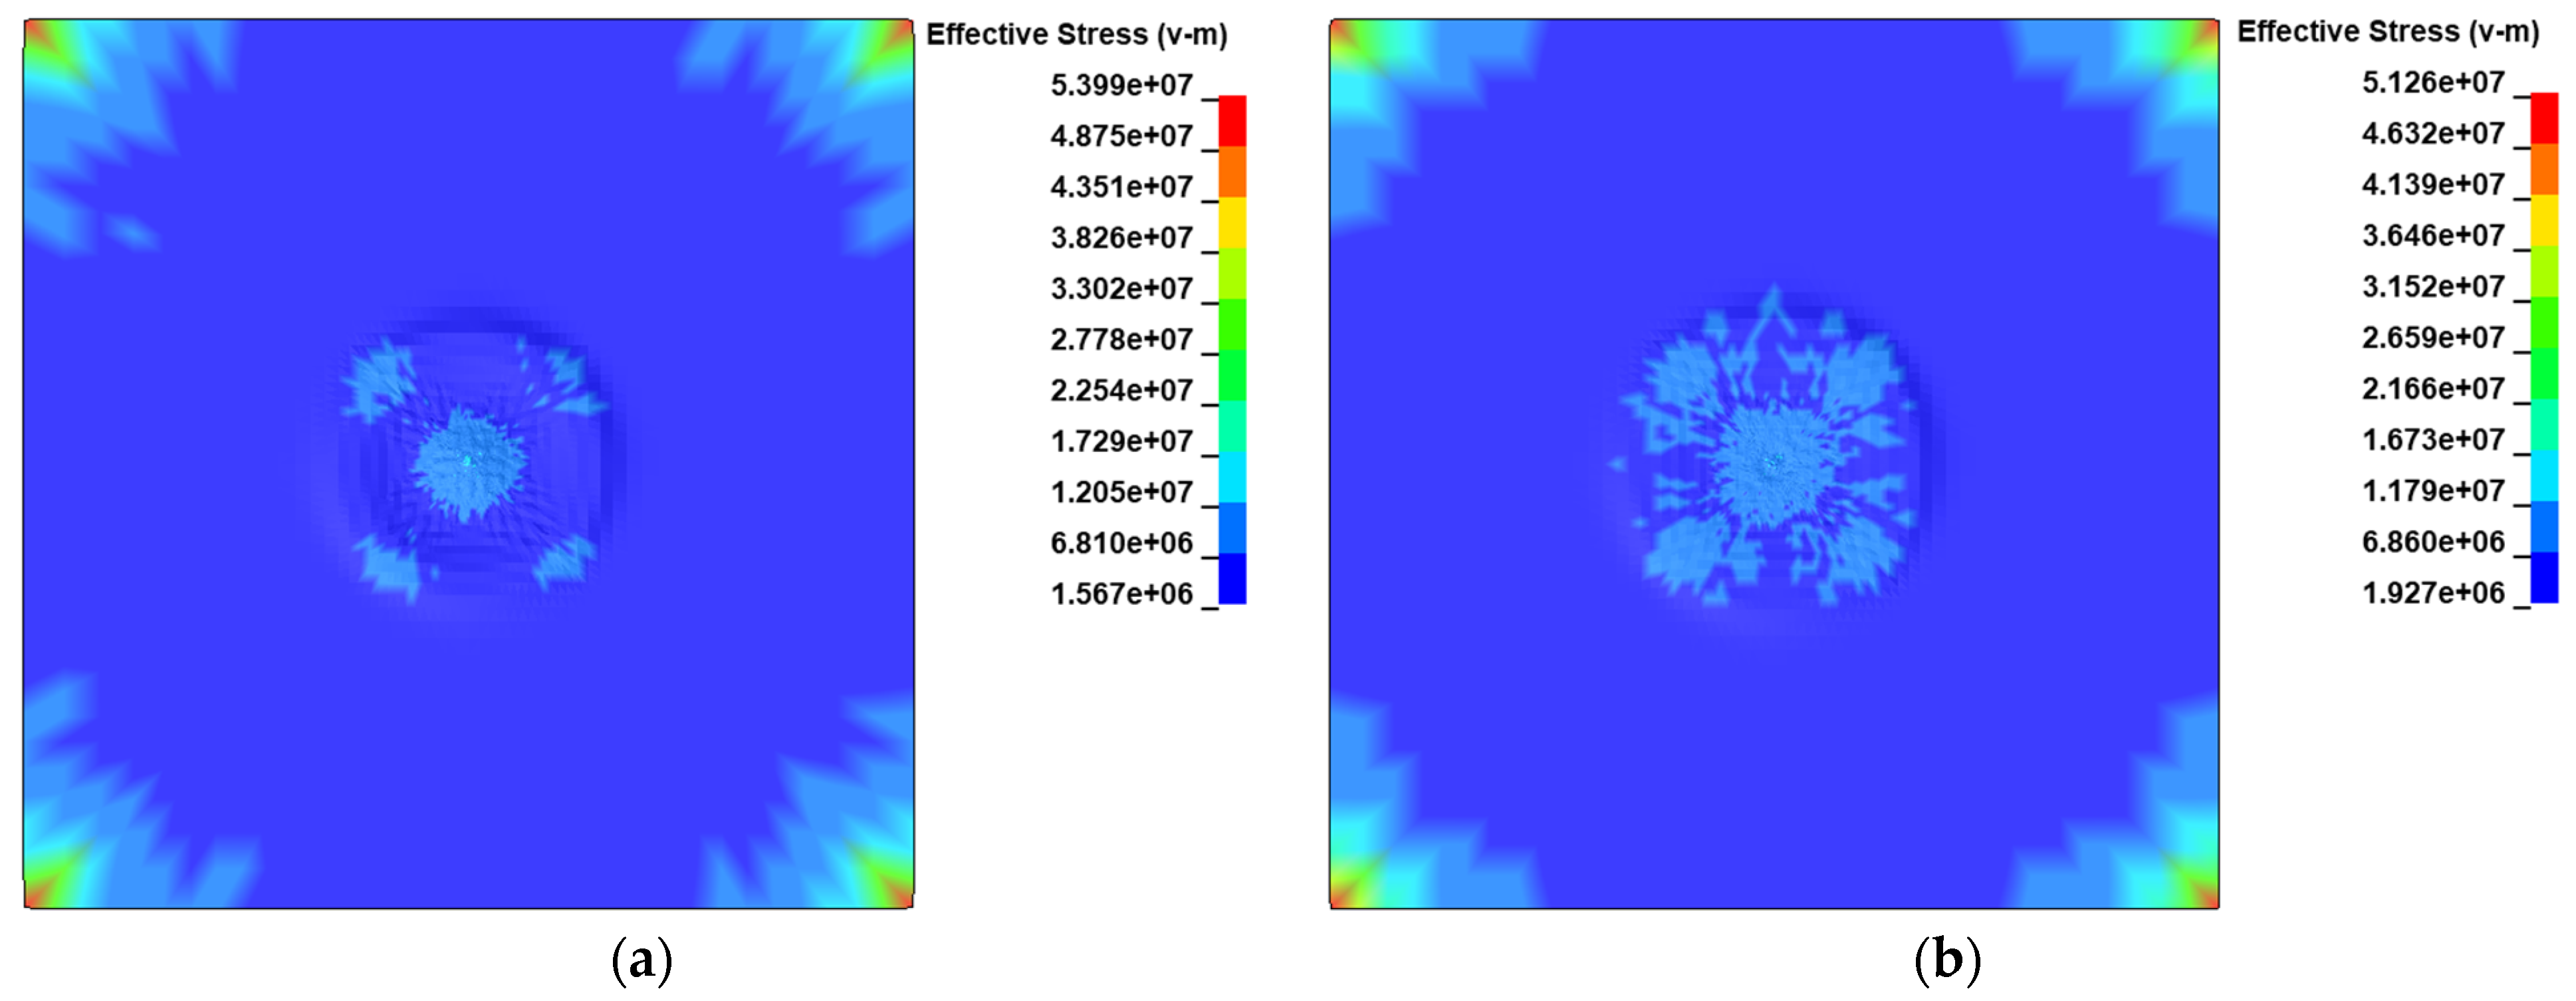
Figure 8a shows a stress contour with air when the small ball impacted the membrane at 0.04 s. It can be seen from the diagram that when comparing the stress of the blue area in the figure, the result in the simulation with no air was greater than that when air was present, because when the model vibrated, the presence of air lowered the stress. The difference in stress in other regions is due to the software calculation.
Figure 8b shows the effective stress contour of a membrane respective to the simulation without air and including air. The present results show that the stress in the case with no air was higher than that with air. This is because in the model including air, air had an effect. When the membrane vibrated, the air would apply some pressure on the surface of the membrane, which would reduce the inner stress in the membrane.
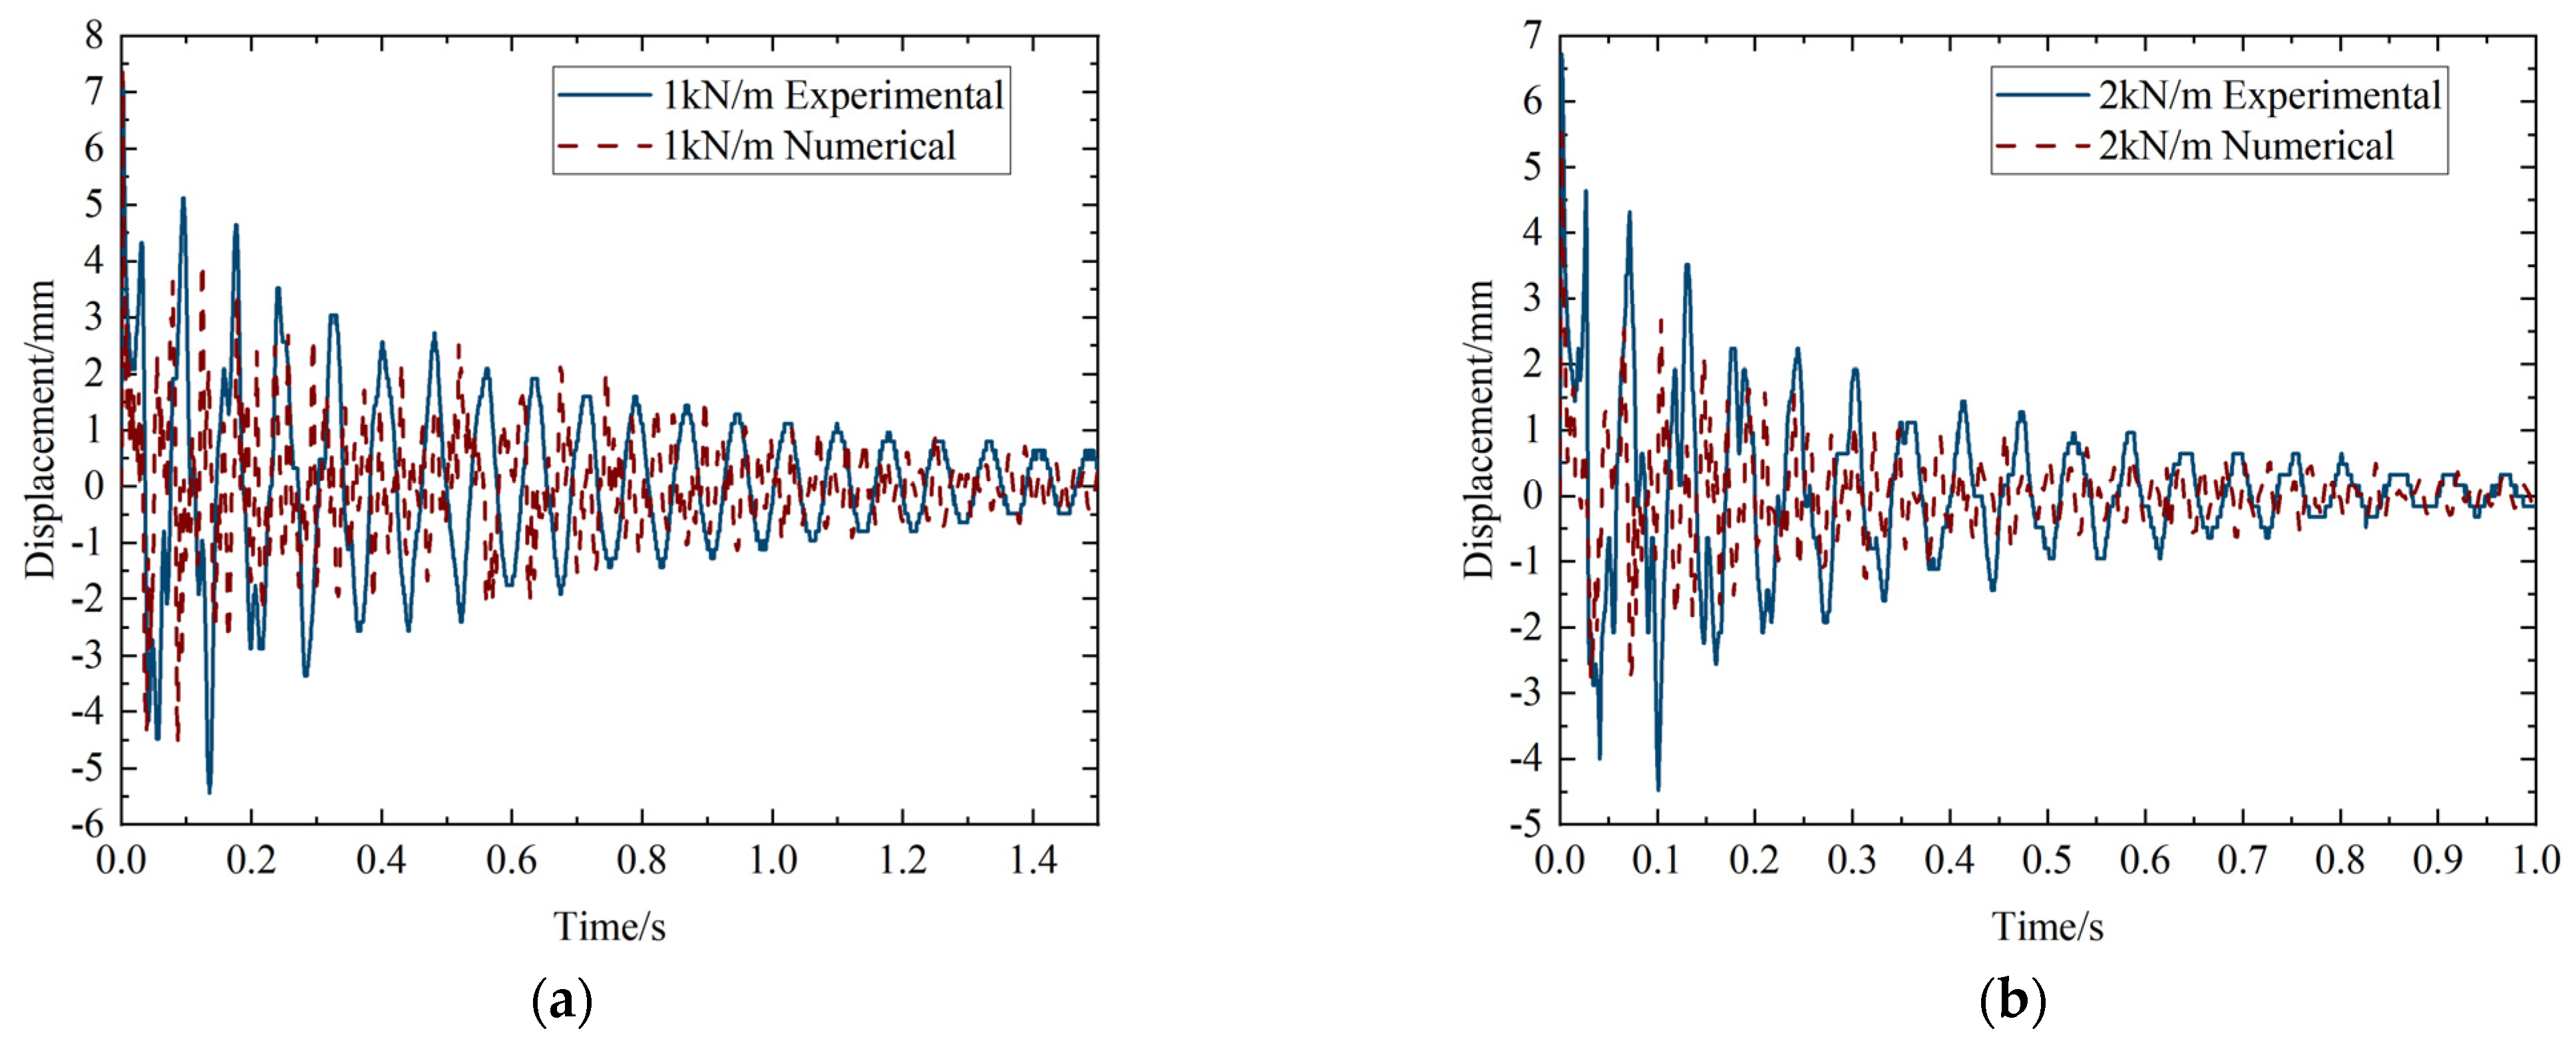
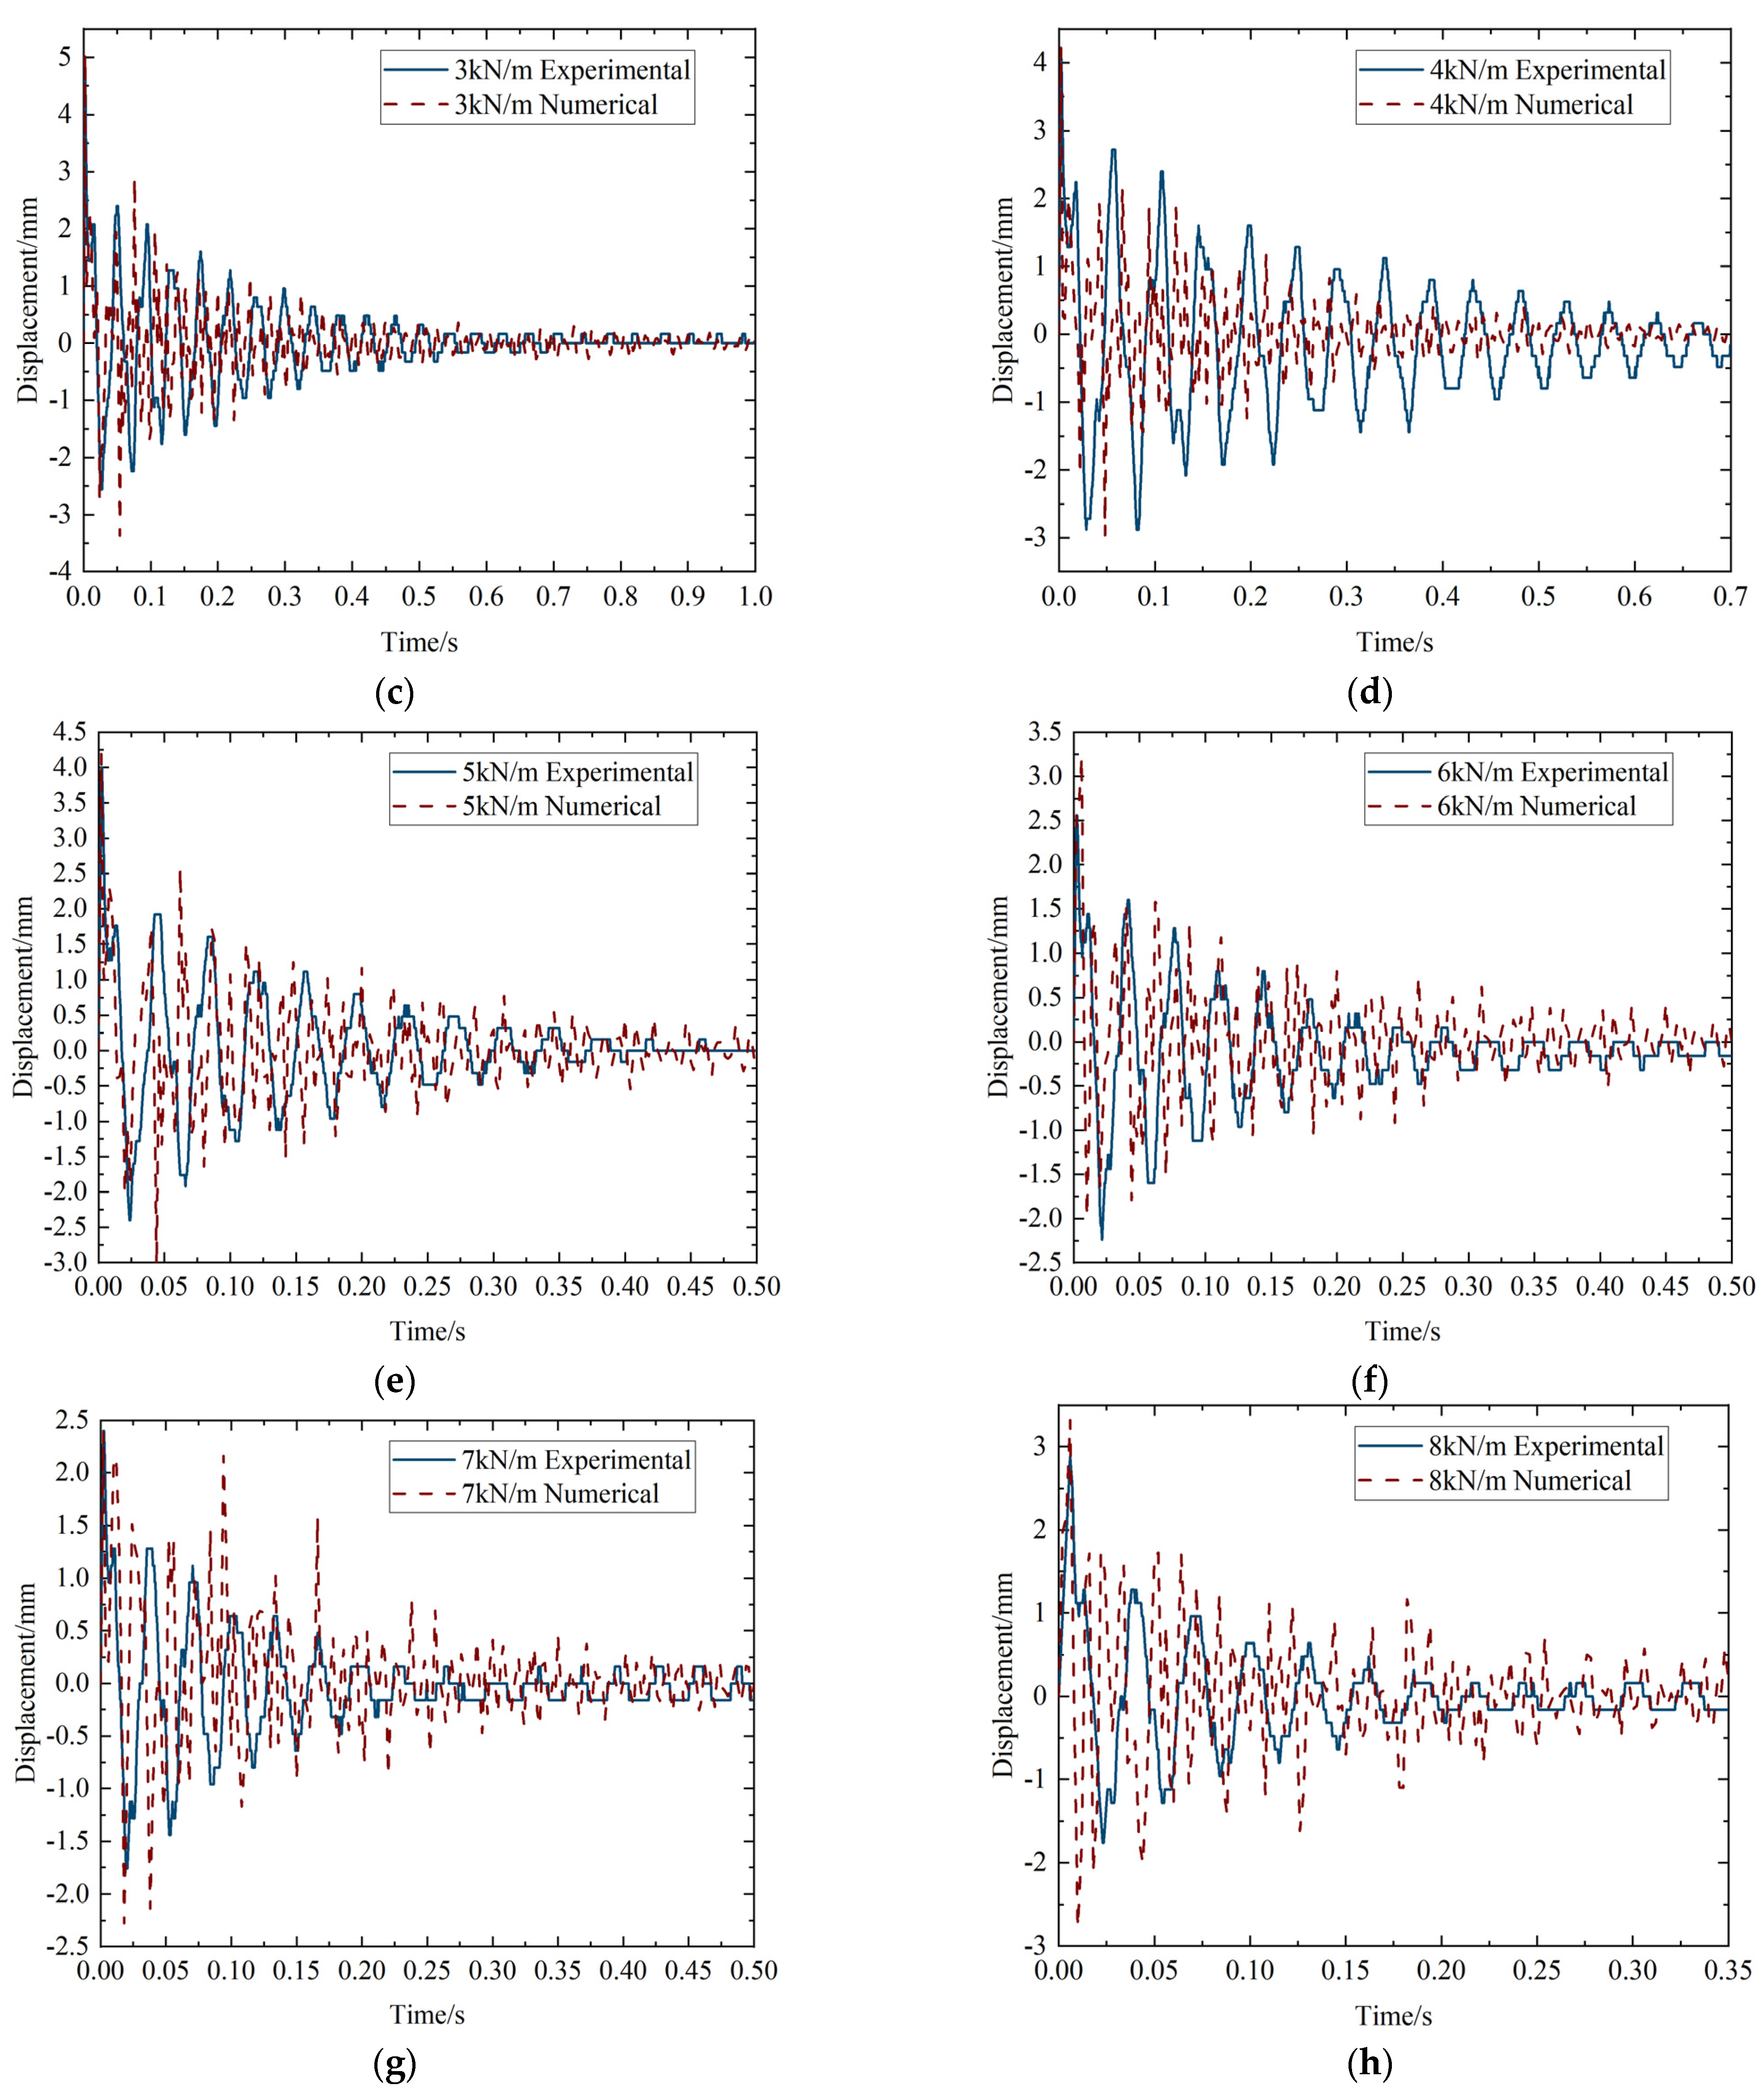
4.2. The Results of Displacement in Case 1
The displacement data of the impact points under different tension forces are shown in Figure 9. It can be seen that the numerical results of the displacement data are in good agreement with the experimental results. When the ball collided with different prestressed membranes, the displacement vibrations at the point of impact were significantly different. With the increase in tension force, the displacement and vibration time was shortened, as shown in Table 5. This is because higher tension force produced higher frequencies, and the energy of vibration would disperse faster. So, the speed of vibration attenuation was accelerated, and the maximum displacement of the impact point was decreased, as shown in Table 6.
We compared the displacement results of the simulation to the results of the test. Figure 9 shows the comparison of displacements with respect to the experiments with tension forces of 1 kN/m, 2 kN/m, 3 kN/m, 4 kN/m, 5 kN/m, 6 kN/m, 7 kN/m and 8 kN/m.
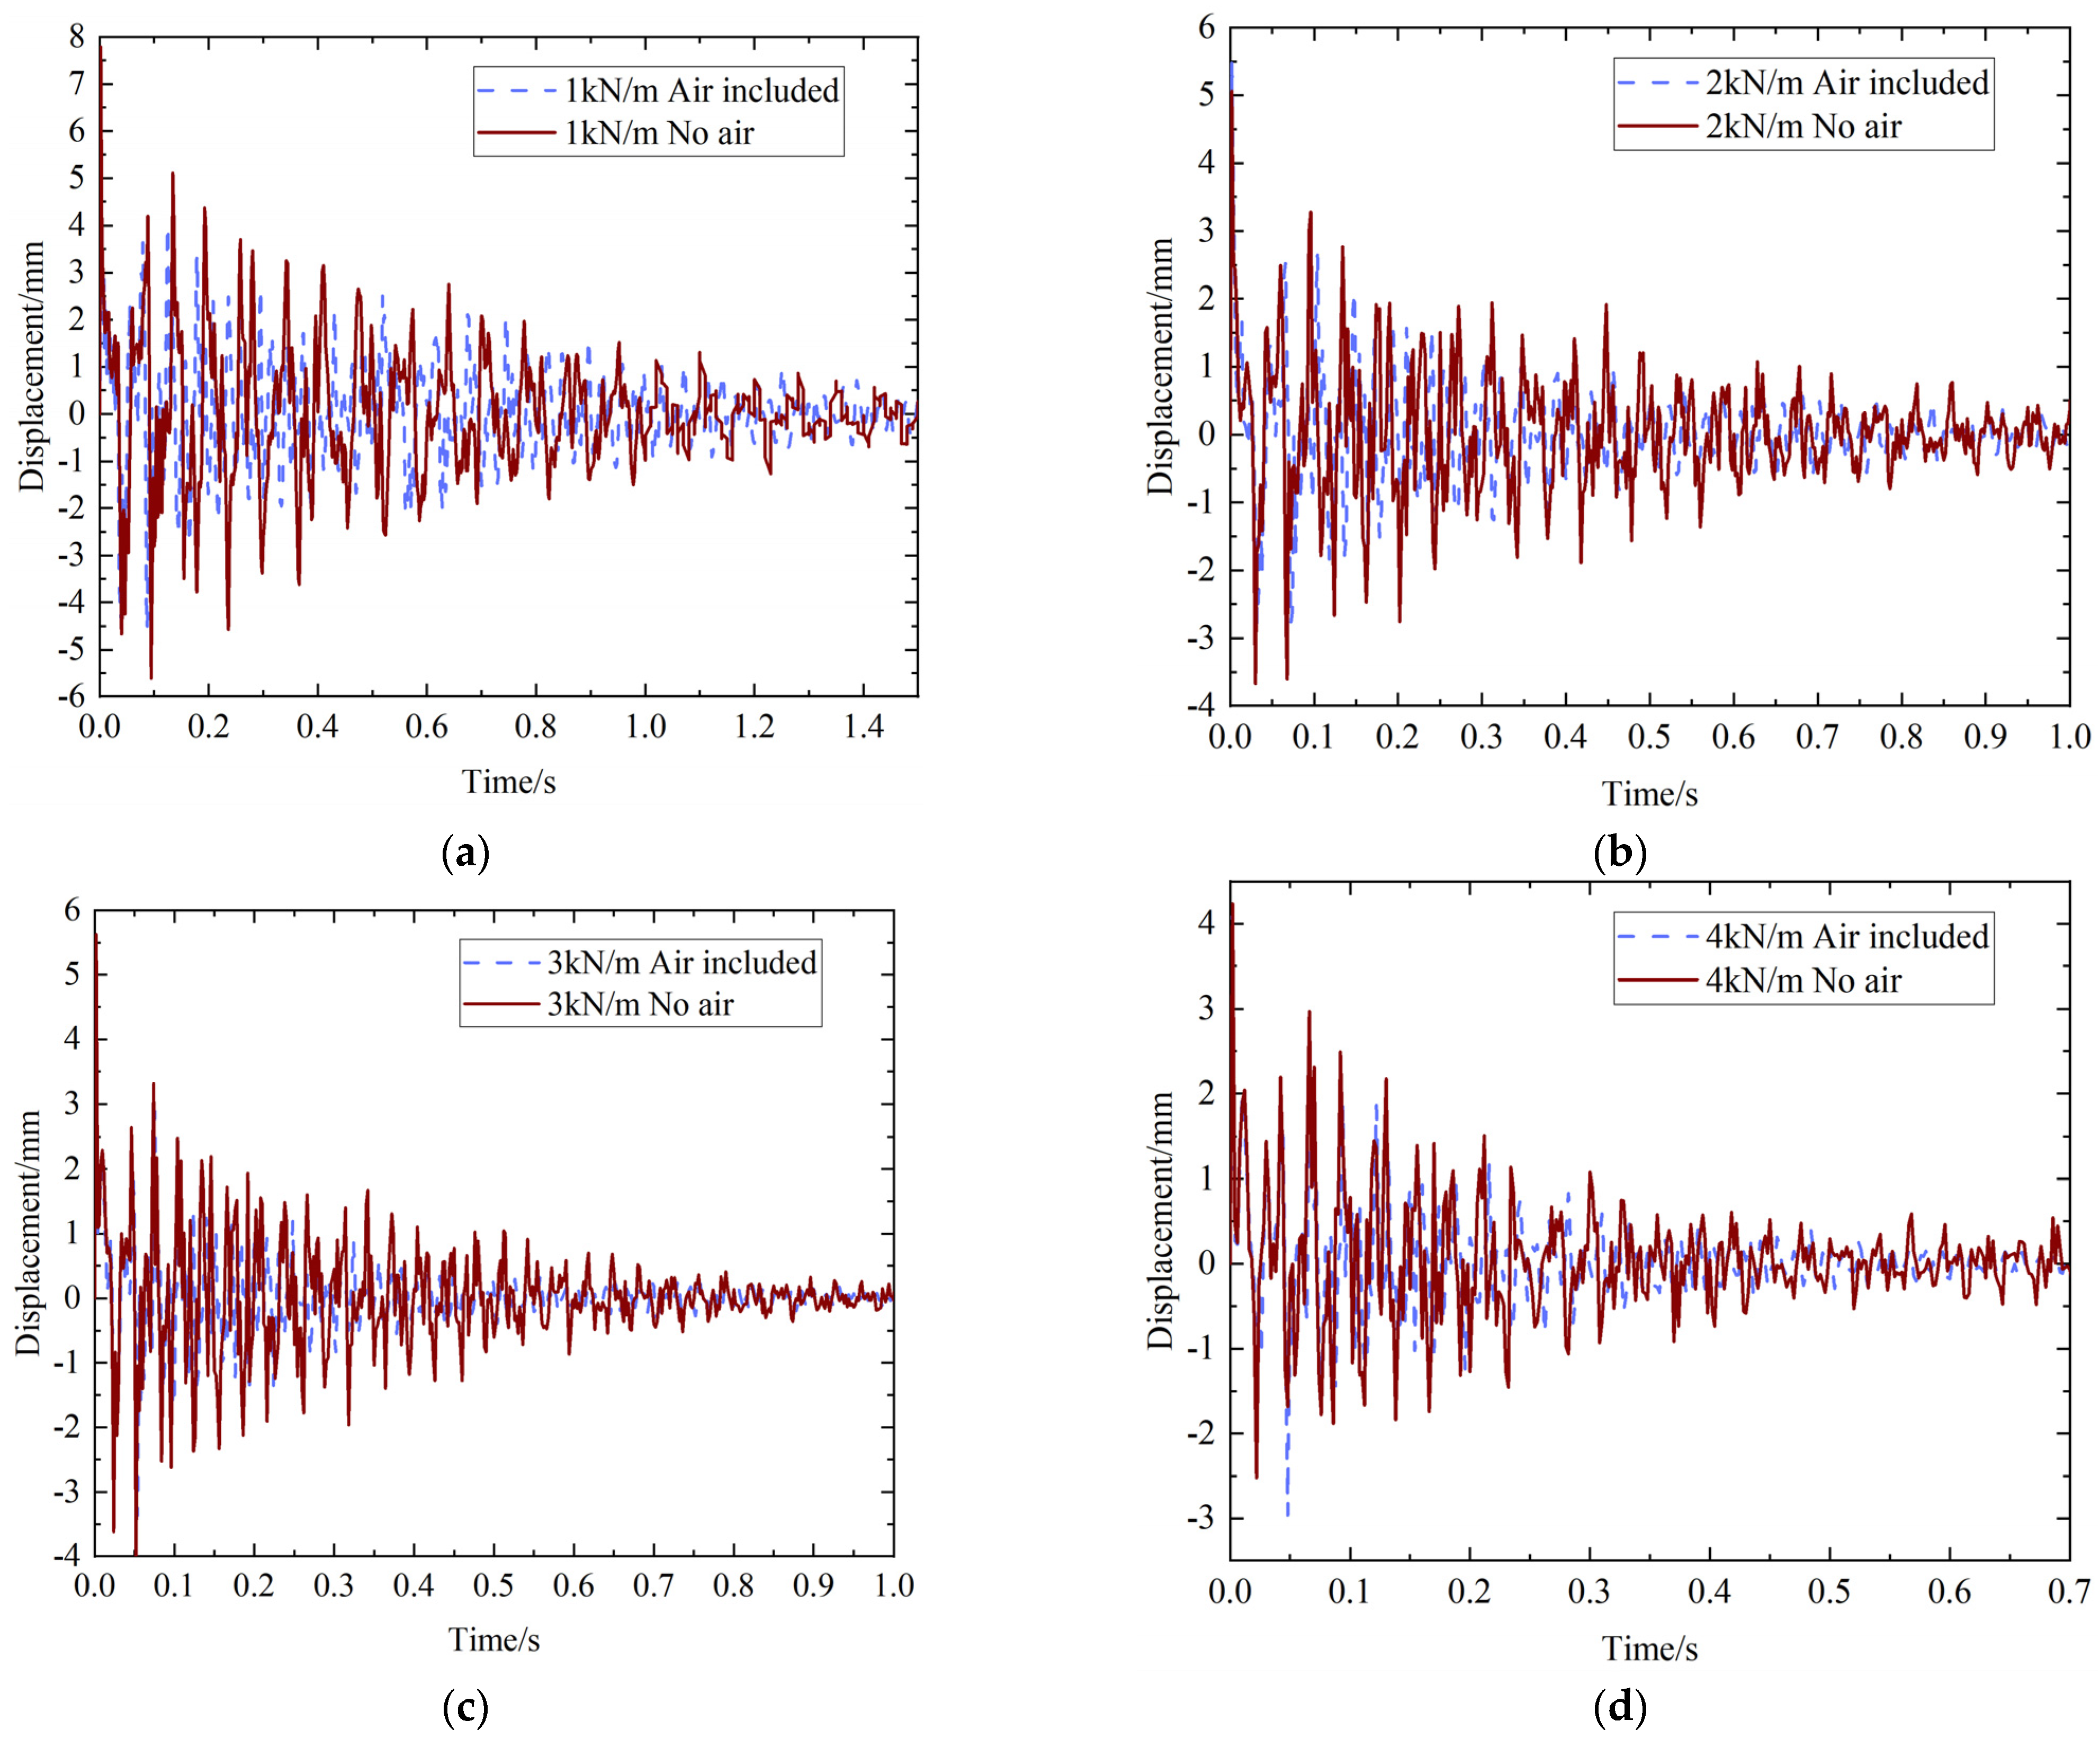
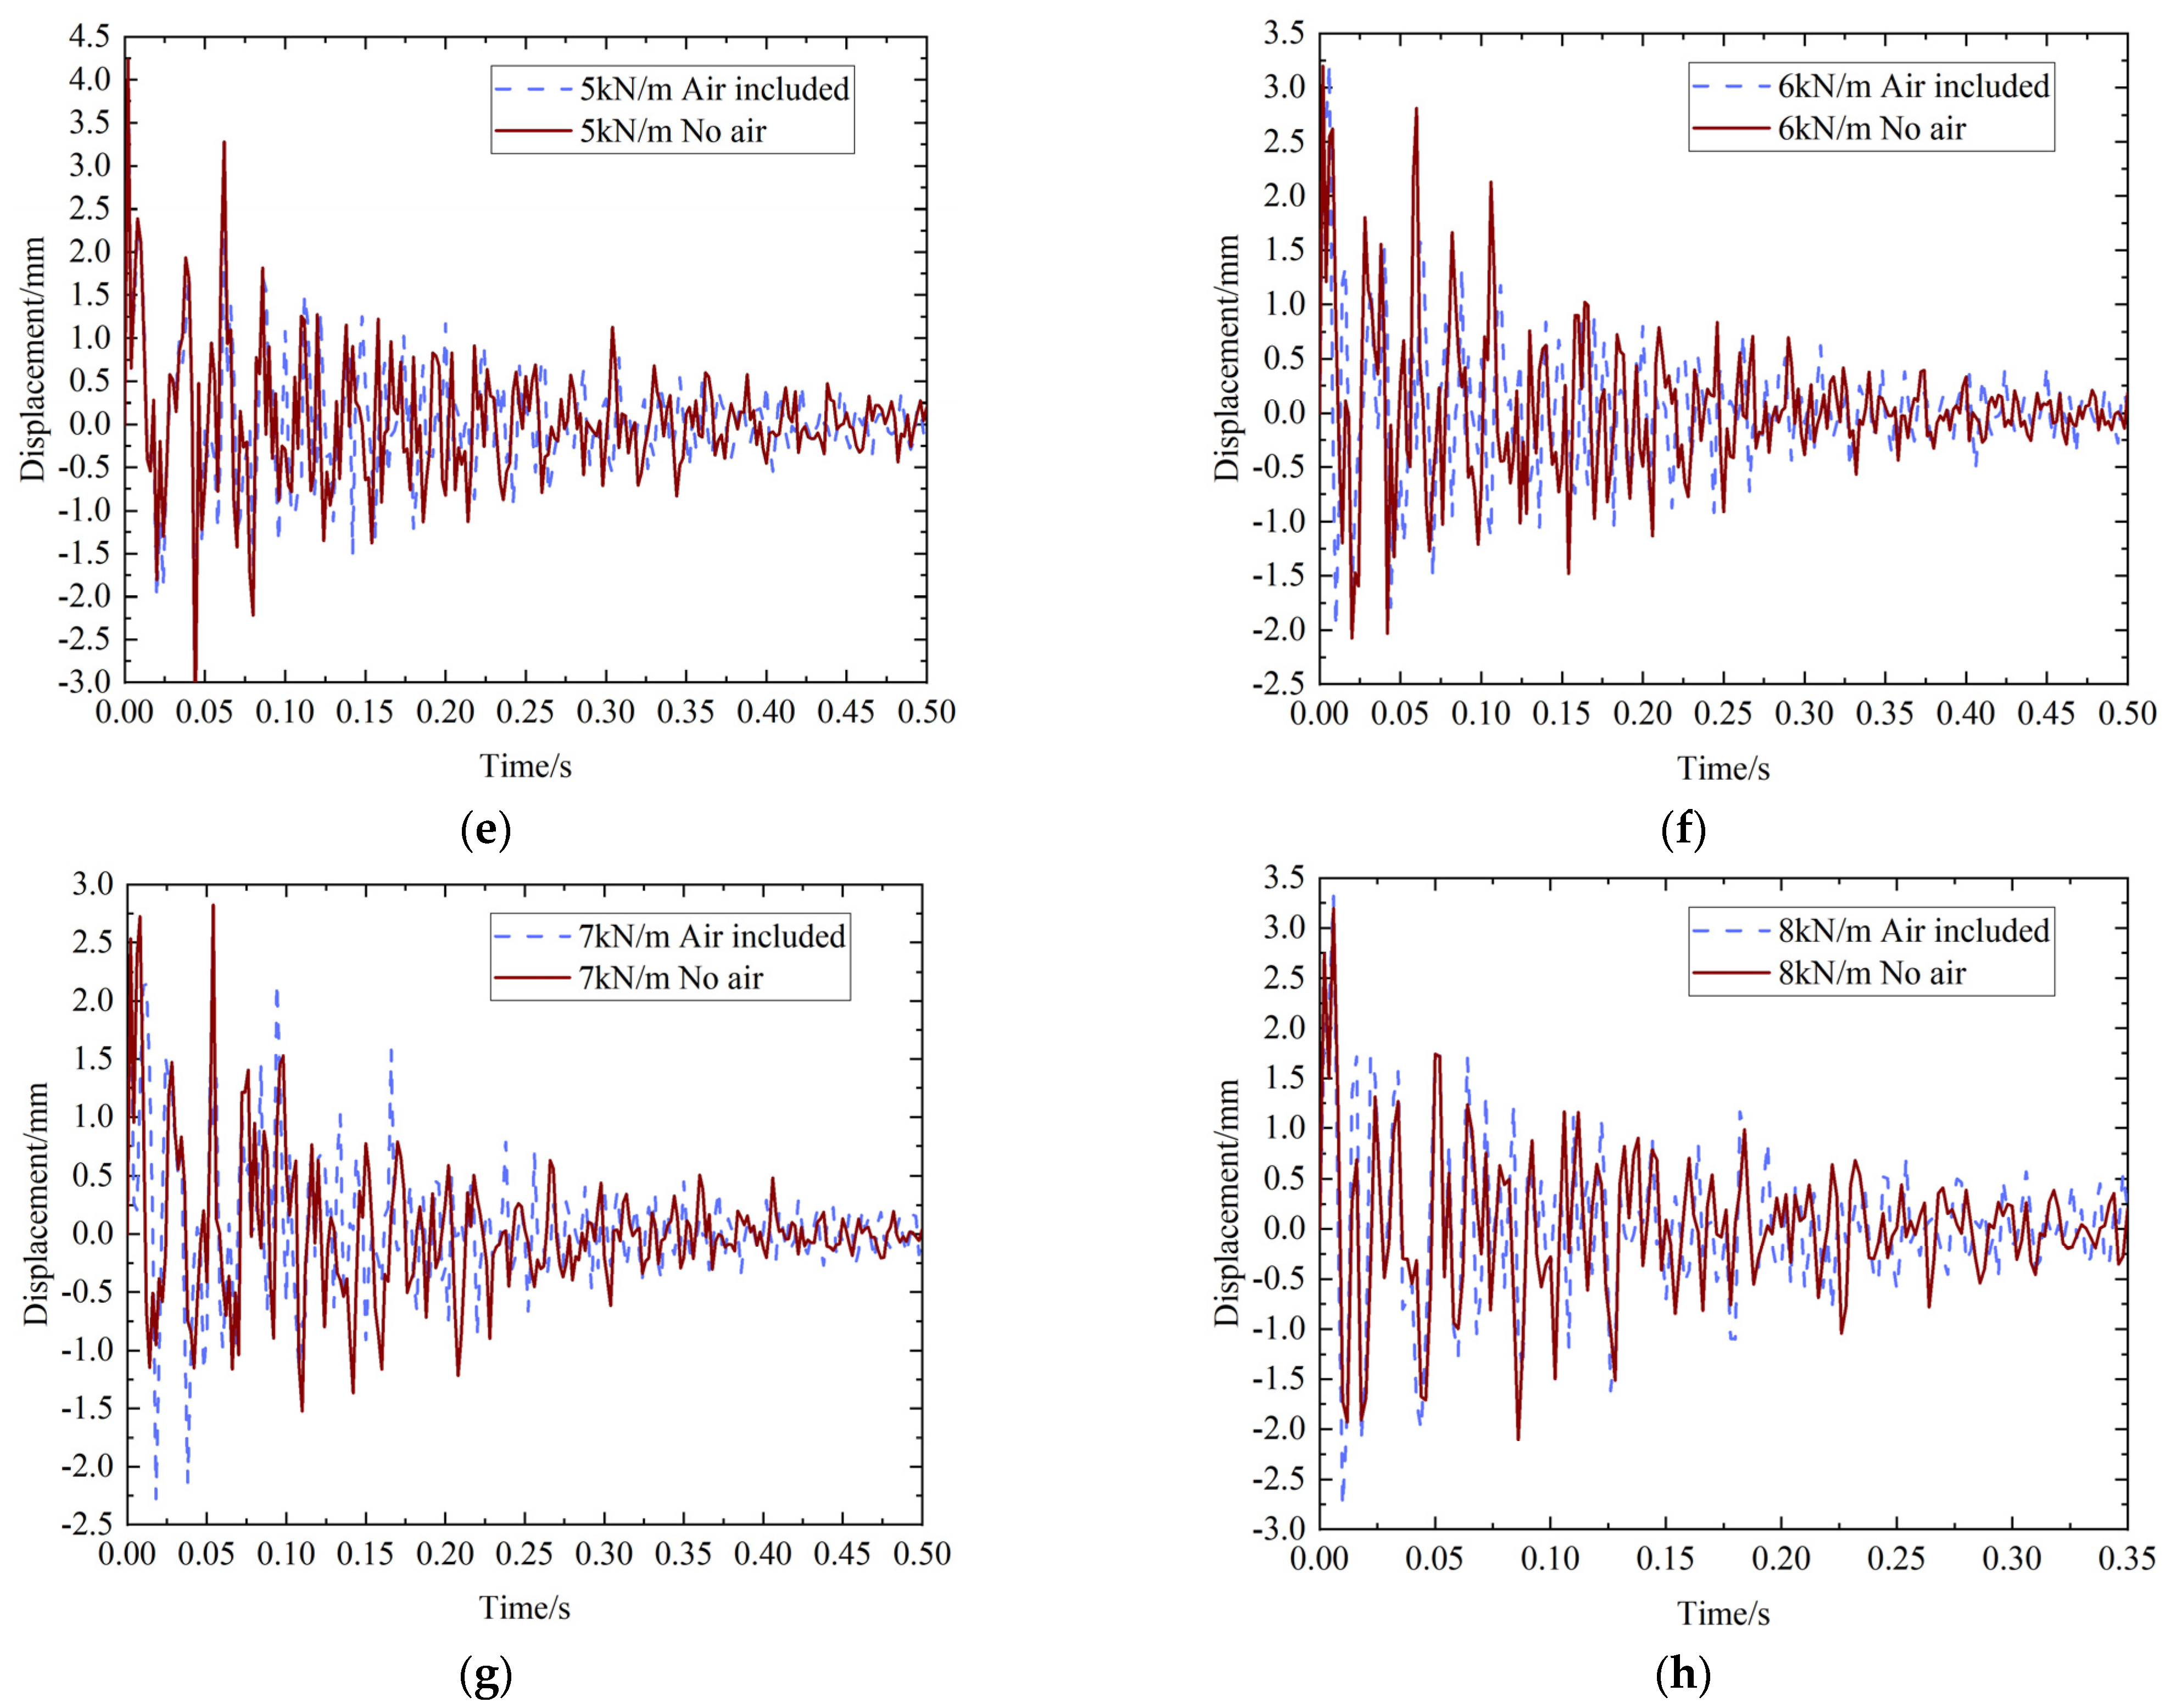
4.3. The results of Displacement in Case 2
Based on the numerical model of case 1, the model of case 2 was obtained by removing the air mesh in case 1. On the basis of the damping coefficient obtained from the above test results, the damping coefficient was added to the model. Additionally, the other parameters were the same as in case 1. The results of displacement are shown in Figure 10. Figure 10 shows the comparison of the displacement of case 1 and case 2. It can be seen that the comparison of the numerical simulation results is basically in agreement.
Table 7 shows the numerical and experimental results of the vibration frequencies of prestressed membranes under impact loads. It can be seen from Table 7 that the frequencies were almost the same. The experimental and numerical results show the same trend, and the vibration frequency increased with the increase in tension force.
5. Discussion
The wave peak was obtained from the displacement data. The frequency of each wave peak was calculated to obtain the average value, and then, the damping ratio formula could be obtained, as shown in Formula (2):
where is the main frequency of the vibrating membrane and is the function of the displacement to the position of the membrane. Thus, the total energy of the membrane is the kinetic energy at the beginning (t = 0). So,
Additionally, after some time, the energy transferred to the air, so, the vibration of air deduced by the membrane propagated to a far field using the rule of Equation (4), where we assumed the damping ratio was very small, so we did not consider the first term in the velocity expression of Equation (2).
Thus, the total energy of air after vibrating time is shown as Equation (5),
Therefore, the total energy is equal to when time ts is infinite, which means the vibration lasted for a long time and all energy from the membrane was transferred to the air. Additionally, also we know that
Thus,
From Equation (7), we can obtain the expression of shown as Equation (8),
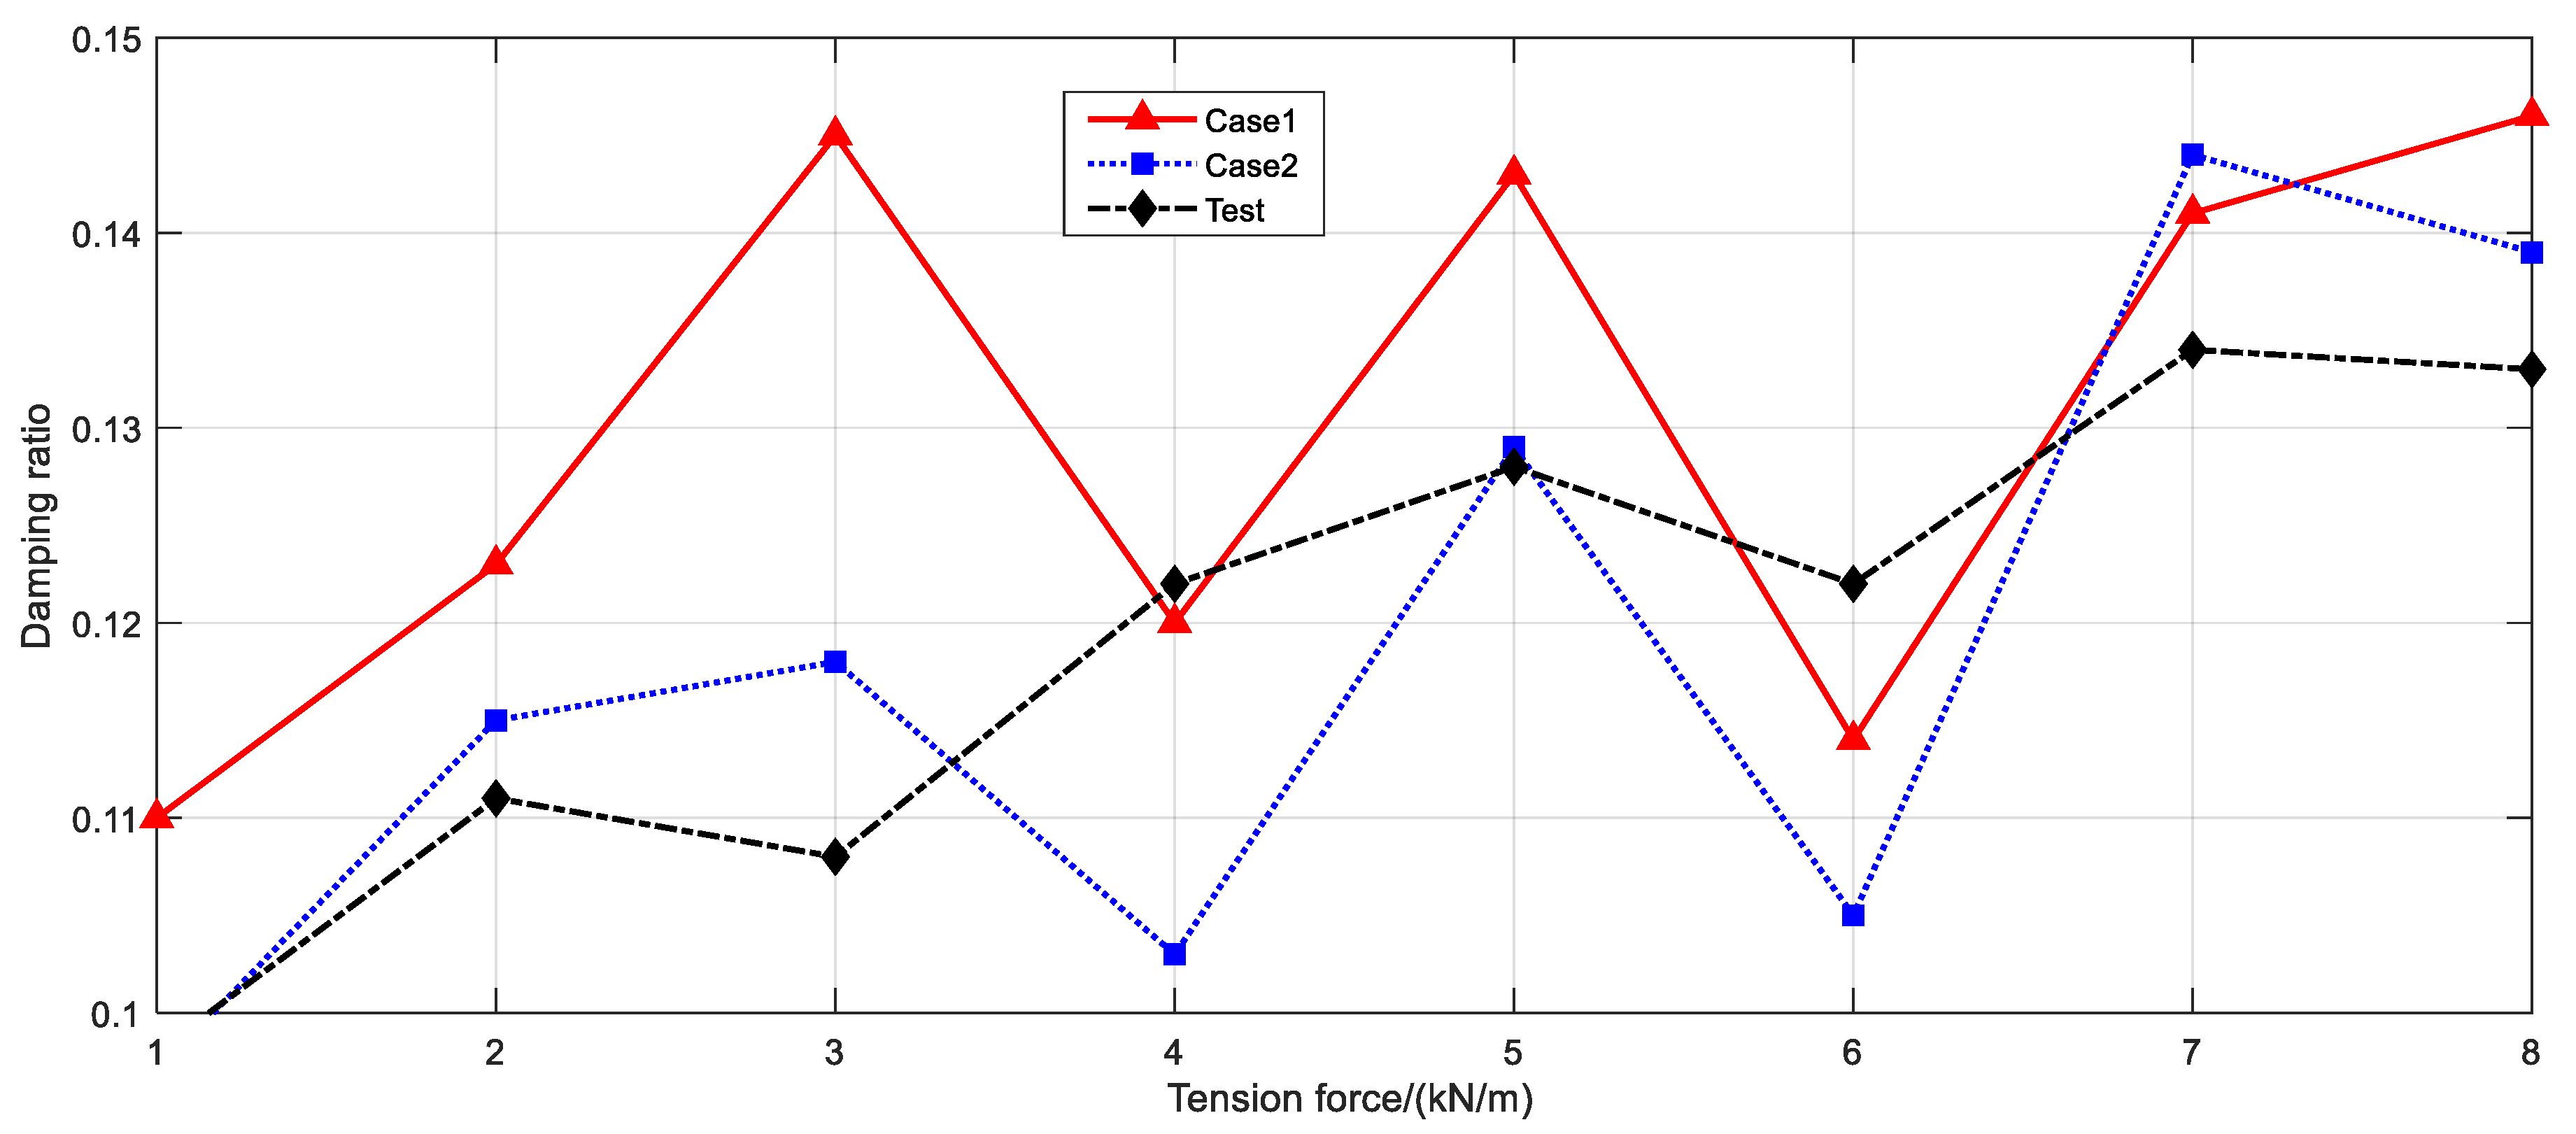
Table 8 shows the numerical and experimental results of the damping ratio of prestressed membranes under impact loads. It can be seen from Table 8 that the damping ratio increased with the increase in tension force, and the damping ratio of the numerical simulation is basically consistent with the experimental results.
Figure 11 shows the results of the damping ratio vs. tension force. The damping coefficient method could be used to simulate the vibration response of a prestressed membrane under an impact load in air. The corresponding damping coefficient can range from 0.1 to 0.15.
Because of the error of the assumption of the real motion of air and Equation (4), the coefficient of the damping ratio, expressed as Equation (7), can be expressed as Equation (8), where the coefficient of should be determined as the geometry of the membrane structure, including the shape, dimension, materials, etc. If no more experiment data are used, it can be accepted as 0.10–0.15, as shown in Equation (9) in this paper.
6. Conclusions
ANSYS-LSDYNA was used to establish a vibration numerical model considering air damping under an impact load. Through the comparative analysis of numerical results and test results concerning the frequency and damping ratio, the present paper found that the experimental results are in good agreement with the numerical model, which verifies the validity of the numerical model with air and shows that the fluid–structure interaction between a membrane and air can be replaced by damping force.
In addition, the vibration response of a prestressed membrane subjected to a shock load in air can be simplified by the method of setting the damping ratio between 0.10 and 0.15, and it is proportional to the density of air over the density of a membrane. The parameter of the coefficient can be determined by the geometry of a membrane’s structure.
Author Contributions
Data curation, Z.-F.S.; Formal analysis, Y.M.; Methodology, A.Z.; Project administration, P.L. All authors have read and agreed to the published version of the manuscript.
Funding
The research was funded by Postgraduate Research & Practice Innovation Program of Jiangsu Province, grant number [KYCX21_3494].
Institutional Review Board Statement
Not applicable.
Informed Consent Statement
Not applicable.
Data Availability Statement
Not applicable.
Conflicts of Interest
The authors declare no conflict of interest.
References
- Li, X.; Zhang, Y.; Xu, J.; Zhang, L.; Wu, M.; Zhao, Q. Central tearing behavior of PVDF coated fabrics with multiple initial notches. Polym. Compos. 2021, 42, 1049–1058. [Google Scholar] [CrossRef]
- Liu, C.; Fang, D.; Zhao, L. Reflection on earthquake damage of buildings in 2015 Nepal earthquake and seismic measures for post-earthquake reconstruction. Structures 2021, 30, 647–658. [Google Scholar] [CrossRef]
- Kamal, M.A. An investigation into tensile structure system: Construction morphology and architectural interventions. J. Build. Mater. Struct. 2020, 7, 236. [Google Scholar] [CrossRef]
- Zhao, B.; Liu, C.; Yao, Z.; Cai, Y. Capacity Difference of Circular Hollow Section X-joints Under Brace Axial Compression and Tension. Int. J. Steel Struct. 2020, 20, 1443–1453. [Google Scholar] [CrossRef]
- Shi, T.; Hu, J.; Chen, W.; Gao, C. Biaxial tensile behavior and strength of architectural composite fabric membranes. Polym. Test. 2020, 82, 192–203. [Google Scholar] [CrossRef]
- Xue, S.D.; Lu, J.; Li, X.Y.; Liu, R.J. Improved Force Iteration Method Based on Rational Shape Design Solving Self-Stress Modes of Cable-Truss Tensile Structure. Adv. Steel Constr. 2020, 2020, 170–180. [Google Scholar]
- Zulifqar, Z.; Adeel, K. Textile Mechanics: Fibers and Yarns. In Handbook of Fibrous Materials; Wiley Online Library: Hoboken, NJ, USA, 2020. [Google Scholar]
- Chen, W.; Gao, C.; Zhang, D.; Wang, L.; Qiu, Z. A new biaxial tensile shear test method to measure shear behaviour of coated fabrics for architectural use. Compos. Struct. 2018, 203, 943–951. [Google Scholar] [CrossRef]
- Zhang, Y.; Hiruta, T.; Kajiwara, I.; Hosoya, N. Active vibration suppression of membrane structures and evaluation with a non-contact laser excitation vibration test. J. Vib. Control. 2017, 23, 1681–1692. [Google Scholar] [CrossRef]
- Yousef, M.I.; Stylios, G.K. Investigating the challenges of measuring combination mechanics in textile fabrics. Text. Res. J. 2017, 88, 2741–2754. [Google Scholar] [CrossRef]
- Zheng, Z.-L.; Song, W.-J.; Liu, C.-J.; He, X.-T.; Sun, J.-Y.; Xu, Y.-P. Study on Dynamic Response of Rectangular Orthotropic Membranes Under Impact Loading. J. Adhes. Sci. Technol. 2012, 26, 1467–1479. [Google Scholar] [CrossRef]
- Zhou-Lian, Z.; Chang-Jiang, L.; Xiao-Ting, H.; Shan-Lin, C. Free Vibration Analysis of Rectangular Orthotropic Membranes in Large Deflection. Math. Probl. Eng. 2009, 2009, 1–9. [Google Scholar] [CrossRef] [Green Version]
- Zhang, Y.; Lu, Y.; Zhou, Y.; Zhang, Q. Resistance uncertainty and structural reliability of hypar tensioned membrane structures with PVC coated polyesters. Thin-Walled Struct. 2018, 124, 392–401. [Google Scholar] [CrossRef]
- Yingying, Z.; Junhao, X.; Qilin, Z. Advances in mechanical properties of coated fabrics in civil engineering. J. Ind. Text. 2018, 48, 255–271. [Google Scholar] [CrossRef] [Green Version]
- Liu, C.; Deng, X.; Liu, J.; Peng, T.; Yang, S.; Zheng, Z. Dynamic response of saddle membrane structure under hail impact. Eng. Struct. 2020, 214, 110597. [Google Scholar] [CrossRef]
- Liu, C.; Deng, X.; Liu, J.; Zheng, Z. Impact-induced nonlinear damped vibration of fabric membrane structure: Theory, analysis, experiment and parametric study. Compos. Part B Eng. 2019, 159, 389–404. [Google Scholar] [CrossRef]
- Liu, C.; Deng, X.; Zheng, Z. Nonlinear wind-induced aerodynamic stability of orthotropic saddle membrane structures. J. Wind. Eng. Ind. Aerodyn. 2017, 164, 119–127. [Google Scholar] [CrossRef]
- Liu, C.J.; Zheng, Z.L.; Jun, L.; Guo, J.J.; Wu, K.U.I. Dynamic analysis for nonlinear vibration of prestressed orthotropic membranes with viscous damping. Int. J. Struct. Stab. Dyn. 2013, 13, 1350018. [Google Scholar] [CrossRef]
- Kapoor, H.; Chun, S.; Motley, M.R.; Kapania, R.K.; Plaut, R.H. Nonlinear Response of Highly Flexible Structures to Air Blast Loads: Application Shelters. AIAA J. 2006, 44, 2034–2042. [Google Scholar] [CrossRef]
- Liu, P.; Yang, X.; Li, D. The experimental study on the vibration of membrane structure under impact load. Int. J. Space Struct. 2022, 37, 107–118. [Google Scholar] [CrossRef]
- Liu, P.; Tang, B.-J.; Kaewunruen, S. Vibration-Induced Pressures on a Cylindrical Structure Surface in Compressible Fluid. Appl. Sci. 2019, 9, 1403. [Google Scholar] [CrossRef] [Green Version]
- Liu, P.; Kaewunruen, S.; Tang, B.-J. Dynamic Pressure Analysis of Hemispherical Shell Vibrating in Unbounded Compressible Fluid. Appl. Sci. 2018, 8, 1938. [Google Scholar] [CrossRef] [Green Version]
- Ping, L.; Gang, W.; BaiJian, T. Experimental study on mechanical properties of PVDF textile. J. Southeast Univ. 2017, 11, 1195–1200. [Google Scholar]
- Yang, L.; Zhao, Q.; Chen, K.; Ma, Y.; Wu, Y.; Ji, H.; Qiu, J. PVDF-Based Composition-Gradient Multilayered Nanocomposites for Flexible High-Performance Piezoelectric Nanogenerators. ACS Appl. Mater. Interfaces 2020, 12, 1045–1054. [Google Scholar] [CrossRef] [PubMed]
- Yang, B.; Shang, Y.; Wu, M.; Yu, Z.; Qu, X. Statistical characteristics of naturally aged PVDF-coated fabrics’ mechanical properties and structural reliability index. Polym. Test. 2019, 80, 106143. [Google Scholar] [CrossRef]
Figure 1.
The details of the membrane material specimen (mm).

Figure 2.
The layout of clamping characteristics (mm).

Figure 3.
FEM model. (a) Structure of bracket. (b) The details of catapult. (c) The speedometer. (d) The manual windlass. (e) The data acquisition card. Non-English word in the figure mean the care belong to school (f) Laser displacement sensor. Non-English word in figure shows the sensor type.
Figure 3.
FEM model. (a) Structure of bracket. (b) The details of catapult. (c) The speedometer. (d) The manual windlass. (e) The data acquisition card. Non-English word in the figure mean the care belong to school (f) Laser displacement sensor. Non-English word in figure shows the sensor type.

Figure 4.
Mesh division of ball and membrane.

Figure 5.
The mesh details in different cases. (a) The mesh of case 1. (b) The mesh of case 2.

Figure 6.
Initial stress of prestressed membrane structure. (a) The initial effective stress at T = 6 kN/m. (b) The initial effective stress at T = 7 kN/m.
Figure 6.
Initial stress of prestressed membrane structure. (a) The initial effective stress at T = 6 kN/m. (b) The initial effective stress at T = 7 kN/m.

Figure 7.
The velocity contour of air velocity in case 1. (a) The velocity contour of air at T = 6 kN (time = 0.02 s). (b) The velocity contour of air at T = 7 kN (time = 0.02 s).
Figure 7.
The velocity contour of air velocity in case 1. (a) The velocity contour of air at T = 6 kN (time = 0.02 s). (b) The velocity contour of air at T = 7 kN (time = 0.02 s).

Figure 8.
The contour of effective stress of membrane at 0.04 s with case 1 and case 2. (a) The contour of effective stress in case 1 at time = 0.04 s. (b) The contour of effective stress in case 2 at time = 0.04 s.
Figure 8.
The contour of effective stress of membrane at 0.04 s with case 1 and case 2. (a) The contour of effective stress in case 1 at time = 0.04 s. (b) The contour of effective stress in case 2 at time = 0.04 s.

Figure 9.
Numerical and experimental displacement time history curves. (a) The displacement curve at 1 kN/m. (b) The displacement curve at 2 kN/m. (c) The displacement curve at 3 kN/m. (d) The displacement curve at 4 kN/m. (e) The displacement curve at 5 kN/m. (f) The displacement curve at 6 kN/m. (g) The displacement curve at 7 kN/m. (h) The displacement curve at 8 kN/m.


Figure 10.
The comparison of displacement in case 1 and case 2. (a) The displacement curve at 1 kN/m. (b) The displacement curve at 2 kN/m. (c) The displacement curve at 3 kN/m. (d) The displacement curve at 4 kN/m. (e) The displacement curve at 5 kN/m. (f) The displacement curve at 6 kN/m. (g) The displacement curve at 7 kN/m. (h) The displacement curve at 8 kN/m.


Figure 11.
Vibration damping ratio comparison.


Table 1.
PVDF-1050 membrane material parameters.
| Strength (N/dtex) | Warp Count (yarn/cm) | Density of Fabric (g/m2) | Density of Membrane (g/m2) | Tensile Strength (N/5 cm) | Tear Strength (N) | Seam Strength (N/cm) |
|---|---|---|---|---|---|---|
| 1100 | 1212 | 270 | 1050 | 4200/4500 | 550/500 | >120/5 |
Table 2.
The speed of the steel ball.
| Case 1 (m/s) | Case 2 (m/s) | Case 3 (m/s) | Average (m/s) | |
|---|---|---|---|---|
| Velocity | 10.21 | 9.95 | 10.35 | 10.17 |
| Velocity | 15.12 | 15.32 | 15.16 | 15.20 |
Table 3.
PVDF membrane and air material parameters.
| Membrane | Ball | Case 1 | Case 2 | |
|---|---|---|---|---|
| Young’s Modulus/Mpa | 200 | 2e6 | / | / |
| Density/(kg/m3) | 1050 | 7850 | 1.29 | 1.29 |
| Poisson’s ratio | 0.11 | 0.3 | / | / |
| Bulk modulus/Mpa | / | / | 0.101 | 0.101 |
Table 4.
Damping results of experiment.
| Tension Force (kN/m) | 1 | 2 | 3 | 4 | 5 | 6 | 7 | 8 |
|---|---|---|---|---|---|---|---|---|
| Damping | 3.34 | 4.39 | 6.02 | 7.73 | 8.77 | 9.99 | 10.86 | 11.89 |
| Damping ratio | 0.098 | 0.111 | 0.108 | 0.122 | 0.128 | 0.122 | 0.134 | 0.133 |
Table 5.
Numerical and experimental vibration duration.
| Tension Force (kN/m) | 1 | 2 | 3 | 4 | 5 | 6 | 7 | 8 |
|---|---|---|---|---|---|---|---|---|
| Case 1 | 1.390 | 0.836 | 0.558 | 0.438 | 0.334 | 0.411 | 0.228 | 0.226 |
| Experiment | 1.568 | 0.804 | 0.580 | 0.473 | 0.314 | 0.2500 | 0.236 | 0.245 |
Table 6.
Numerical and experimental maximum vibration displacement.
| Tension Force (kN/m) | 1 | 2 | 3 | 4 | 5 | 6 | 7 | 8 |
|---|---|---|---|---|---|---|---|---|
| Case 1 | 7.35 | 5.52 | 5.05 | 4.22 | 4.19 | 2.56 | 2.38 | 1.97 |
| Experiment | 7.20 | 4.96 | 4.80 | 4.16 | 4.00 | 2.56 | 2.40 | 2.88 |
Table 7.
The main vibration frequencies of numerical simulations and tests.
| Tension Force (kN/m) | 1 | 2 | 3 | 4 | 5 | 6 | 7 | 8 |
|---|---|---|---|---|---|---|---|---|
| Case 1 | 12.99 | 15.63 | 21.74 | 25.00 | 26.32 | 29.41 | 31.25 | 35.71 |
| Case 2 | 11.63 | 17.24 | 22.72 | 25.00 | 27.78 | 27.78 | 31.25 | 35.71 |
| Test | 12.87 | 15.10 | 21.37 | 24.15 | 26.28 | 29.76 | 31.15 | 34.33 |
| mean | 12.50 | 16.00 | 21.94 | 24.72 | 26.80 | 28.99 | 31.22 | 35.25 |
Table 8.
The damping ratio of numerical simulations and tests.
| Tension Force (kN/m) | 1 | 2 | 3 | 4 | 5 | 6 | 7 | 8 |
|---|---|---|---|---|---|---|---|---|
| Case 1 | 0.110 | 0.123 | 0.145 | 0.120 | 0.143 | 0.114 | 0.141 | 0.146 |
| Case 2 | 0.097 | 0.115 | 0.118 | 0.103 | 0.129 | 0.105 | 0.144 | 0.139 |
| Test | 0.098 | 0.111 | 0.108 | 0.122 | 0.128 | 0.122 | 0.134 | 0.133 |
| mean | 0.102 | 0.116 | 0.124 | 0.115 | 0.133 | 0.114 | 0.140 | 0.140 |
Publisher’s Note: MDPI stays neutral with regard to jurisdictional claims in published maps and institutional affiliations. |
© 2022 by the authors. Licensee MDPI, Basel, Switzerland. This article is an open access article distributed under the terms and conditions of the Creative Commons Attribution (CC BY) license (https://creativecommons.org/licenses/by/4.0/).
Share and Cite
MDPI and ACS Style
Shu, Z.-F.; Ma, Y.; Zhang, A.; Liu, P. The Research on the Damping of Prestressed Membrane Structure Subjected to the Impact Load. Sustainability 2022, 14, 6196. https://0-doi-org.brum.beds.ac.uk/10.3390/su14106196
AMA Style
Shu Z-F, Ma Y, Zhang A, Liu P. The Research on the Damping of Prestressed Membrane Structure Subjected to the Impact Load. Sustainability. 2022; 14(10):6196. https://0-doi-org.brum.beds.ac.uk/10.3390/su14106196
Chicago/Turabian StyleShu, Zhe-Feng, Yue Ma, Anqi Zhang, and Ping Liu. 2022. "The Research on the Damping of Prestressed Membrane Structure Subjected to the Impact Load" Sustainability 14, no. 10: 6196. https://0-doi-org.brum.beds.ac.uk/10.3390/su14106196
Note that from the first issue of 2016, this journal uses article numbers instead of page numbers. See further details here.