
The Impact of Fintech on Economic Growth: Evidence from China


School of Management and Economics, University of Electronic Science and Technology of China, Chengdu 610054, China
*
Author to whom correspondence should be addressed.
Sustainability 2022, 14(10), 6211; https://0-doi-org.brum.beds.ac.uk/10.3390/su14106211
Submission received: 8 April 2022
/
Revised: 5 May 2022
/
Accepted: 6 May 2022
/
Published: 20 May 2022
Abstract
:Financial technology (fintech) has seen fast development recently in China; however, studies exploring the contributions of fintech to China’s economic growth remain limited. Thus, this study motivated by the knowledge gaps and fast expansion of fintech examined: (i) the impact of fintech and the submeasures of third-party payment, credit, and insurance on China’s economic growth; (ii) the regional and provincial impact of fintech on China’s economic growth; (iii) the causality relationships between fintech and economic growth. By using a sample of 31 provinces in China and the instrumental variable generalized method of moments (IV–GMM) technique, the study established the following: (i) fintech and the submeasures of third-party payment, credit, and insurance have a statistically significant positive effect on China’s economic growth. Specifically, a 10% rise in fintech, third-party payment, credit, and insurance raises China’s economic growth by 8%, 4%, 5%, and 16%, respectively; (ii) the eastern region has the highest growth effect of fintech. Moreover, Zhejiang province has the highest growth effect of fintech at the provincial level; (iii) a unidirectional causality exists from third-party payment and credit to economic growth, and economic growth to insurance; a bidirectional causality exists between fintech and economic growth. This article explicitly suggests substantial institutional reforms to promote the healthy development of fintech in China.
1. Introduction
Fintech, otherwise called internet finance or digital financial inclusion, simply refers to an amalgamation of finance and information technology. It constitutes payment and settlement, risk management, networking channels, and resource allocation functions [1,2,3]. Fintech has expanded dramatically in the financial industry thanks to the rapid expansion of the Internet, information technology, mobile phones, and digital technologies. According to [4], global fintech investment stood at USD 55.3 billion in 2019. In the case of China, the Wind database reports an upsurge in the number of peer-to-peer (P2P) loan companies from 214 in 2011 to 1544 in the year 2014. The database also shows over RMB 252.8 billion outstanding loans from P2P. Again, third-party payment market size stood at RMB 190.5 trillion in 2018 and nonequity crowdfunding platforms raised RMB 2.9 billion in 2016. Finally, Internet insurance premium income increased from RMB 320,000 in 2011 to RMB 19.05 million in 2018, which represented an almost 5853% increase. Given these developments, these questions remain: (1) Does fintech contribute to China’s economic growth? (2) Does the measure of fintech matter? (3) Do regional and provincial heterogeneity matter? (4) Does fintech cause China’s economic growth?
Fintech eliminates the need for banks to act as a middleman between borrowers and lenders [5]. P2P lending involves leveraging the internet to link lenders and borrowers, with lenders assessing credit risk based on the information provided by borrowers and then making lending decisions [6]. Fintech increases the chances of small and medium-sized enterprises (SMEs) obtaining loans at a reasonable interest rate [7]. Furthermore, fintech streamlines the loan application process, allowing borrowers to obtain loans more quickly, perhaps improving SMEs’ ability to deploy cash at the right time [8]. Fintech also makes investment management advice to SMEs more accessible [8]. Conversely, fintech also carries some shortcomings such as platform, legal, and credit risks due to borrower default [9]. For instance, from 2014 to 2019, China recorded the collapse of 5433 P2P lending platforms involving over 2 million investors and RMB 117.21 billion (USD 26.9bn) in outstanding loans [10]. The development of fintech also disrupts deposit growth and liquidity of the traditional banking system [11]. This affects businesses, individuals, and industry growth [12], and hence it is expected to influence China’s economic growth; however, studies exploring the impact and the causality relationships between fintech and China’s economic growth are scarce. Accordingly, this study aims to bridge these knowledge gaps. Understanding this is critical given that policymakers, particularly in developing nations, are focused in achieving high and sustained economic growth [13,14,15]. Ref. [14] contends that high and long-term economic success spur investment, job creation, improved household consumption and welfare, poverty reduction, support for health care, education, and other sustainable development goals that policymakers want to attain.
This study makes the accompanying contributions to the literature: First, this study examined the impact of fintech and the submeasures of third-party payment, credit, and insurance on China’s economic growth. Extant studies on the impact of fintech on economic growth have mostly focused on the impact of aggregate fintech on economic growth with limited studies exploring the effect of the submeasures of fintech on economic growth. Moreover, we investigated the causal nexus between fintech and economic growth in China. Moreover, we examined the regional and provincial impact of fintech on China’s economic growth. Furthermore, we explored the impact of fintech on labor productivity in China. As argued by [16], a high level of productivity implies efficient resource utilization, a healthy labor force, highly skilled labor, rapid technological development, and increased per capita income. However, the labor productivity levels in China stay low as compared with other developed economies [17]. Thus, this study estimated the effect of fintech on labor productivity in China. This adds to the extensive literature on the determinants of labor productivity. Finally, we used for the first time the instrumental variable generalized method of moments (IV–GMM) model in fintech and economic growth studies. This model gives consistent results since it addresses the issues of endogeneity and omitted variables [18,19].
Our findings show that fintech, third-party payment, credit, and insurance significantly increase China’s economic growth. Specifically, a 10% rise in fintech, third-party payment, credit, and insurance raises China’s economic growth by 8%, 4%, 5%, and 16%, respectively. At the regional level, the eastern region has the highest growth effect of fintech. Moreover, Zhejiang province has the highest growth effect of fintech at the provincial level. The findings from the causality analysis showed a unidirectional causality running from third-party payment and credit to economic growth, economic growth to insurance, and a bidirectional causality between fintech and economic growth.
2. Literature Review and Hypothesis Development
2.1. Literature Review
In this section, we reviewed selected studies on fintech. The authors of [20] used a fintech index from 2003 to 2014 to assess the influence of fintech on banking sector discipline and discovered that fintech diminishes the positive association between bank deposit growth and capitalization. They also discovered that when fintech development increases, the unfavorable linkages between banks’ risky assets and deposit growth deteriorate. The authors of [21] investigated the influence of fintech on bank risk taking in China using data from 2003 to 2013 and discovered that fintech decreases banks’ risk and management costs in the initial phases of fintech development; nevertheless, banks’ risks and management costs increase in the growth phase of fintech. The authors of [22] estimated the effect of fintech on banks’ liquidity, profitability, growth, and security in China from 2006 to 2018 and found that fintech spurs banks’ growth, profitability, and security; however, it impedes banks’ liquidity. Ref. [23] examined the impact of third-party payment on commercial banks’ in China from 2007 to 2014 and found that third-party payment encouraged the expansion of the financial sector in China and increased the process of the industrial revolution.
Ref. [24] investigated the impact of fintech on household income in China from 2010 to 2014 and discovered that fintech raises household income, with the impact being greater for rural families. They also discovered that the wealthiest benefit less from fintech growth than the disadvantaged. Ref. [25] investigated the impact of fintech on rural farmers’ vulnerability to poverty in China and discovered that fintech improves rural farmers’ vulnerability to poverty. Ref. [3] also established that fintech reduces poverty in China. The authors of [26] found that fintech improves urbanization in China while using data from 2010 to 2016. Fintech is also documented to improve household consumption [27,28], entrepreneurship [29], and household welfare [30].
Ref. [31] studied the effect of fintech on China’s economic growth and found no relationship between fintech and economic growth using the vector autoregressive (VAR) technique. Contrarily, ref. [32] appraised the linear and nonlinear impact of P2P lending on sustainable economic growth in China and found a U-shaped relationship between P2P lending and sustainable economic growth. Recently, ref. [33,34,35,36] also established a positive association between fintech and economic growth in China.
From the literature review, it was found that most of the studies on fintech have focused on financial development, while few studies have explored the impact of fintech on economic growth. Moreover, the few studies on fintech and economic growth have all focused on aggregate economic growth with no study focusing on labor productivity. Furthermore, the studies on fintech and economic growth have focused on aggregate fintech, with no study exploring the contributions of the submeasures of third-party payment, credit, and Internet insurance to economic growth. Finally, most of the studies on fintech and economic growth ignored the causal linkages between fintech and economic growth. Thus, this study is conducted to bridge these knowledge gaps.
2.2. Hypothesis Development
The primary goal of the financial system is to move cash from surplus to deficit units [37]. This fosters economic growth by making saving and investing easier [37]. The financial system also connects borrowers and lenders, reducing the risks connected with money transfers [37]. As a result, the financial system minimizes transaction costs and information asymmetry [38]. Transaction costs include the time and money spent to connect borrowers and lenders, as well as legal fees. The uneven distribution of information between lenders and borrowers is referred to as information asymmetry. Financial institutions also offer oversight and corporate governance, which contribute to economic growth [37]. Nevertheless, the traditional financial system is frequently plagued by higher costs and risk taking, which results in financial crises [16]. The growth of fintech may effectively cut transaction costs and alleviate the problems of information asymmetry because additional complicated jobs such as customer testing, risk assessment, and information sharing are made much easier by fintech. This promotes entrepreneurship [29,39,40], trade [1,41,42], household consumption [27], financial development [23,43,44], financial inclusion [24,45], and household income [24], with these proxies widely documented to contribute to economic growth [38,46,47], thus, we hypothesize:
Hypothesis 1 (H1).
The impact of fintech on China’s economic growth is positive.
Fintech could also have a negative effect on economic growth. As fintech expands, funds move from the real economy to fintech platforms [31]. This might reduce banks’ capital via financial hoarding, translating into a reduction in domestic credit supply, an increase in financial crisis, and hinder economic growth through the reduction in investment and production [31]. For instance, [20] found that fintech decreases the positive association between bank deposit growth and capitalization. Ref. [22] also found that fintech impedes banks’ liquidity. Thus, we hypothesize:
Hypothesis 2 (H2).
The impact of fintech on China’s economic growth is negative.
The impact of fintech on economic growth could be heterogeneous among different regions and provinces in China. For instance, the eastern and central regions have advanced fintech development as compared with the western region [48]. This might boost the eastern and central regions’ economic growth via increased employment and investment, while the western region might obtain a lower impact of fintech on economic growth. Moreover, the growth effect of fintech depends on several factors, such as financial development, investment, and employment. These factors are more developed in the eastern and central regions as compared with the western region. These factors help to extend the spillover effect of fintech on economic growth. Thus, the eastern and central regions with high levels of financial development, investment, and employment might obtain higher economic growth as compared with the western region with relatively lower financial development, investment, and employment. Thus, the following hypothesis is obtained:
Hypothesis 3 (H3).
The impact of fintech on economic growth is heterogeneous across different regions and provinces.
3. Data and Methodology
3.1. Data
The study dataset comprises a sample of 31 provinces (Beijing, Tianjin, Hebei, Shanxi, Neimenggu, Liaoning, Jilin, Heilongjiang, Shanghai, Jiangsu, Zhejiang, Anhui, Fujian, Jiangxi, Shandong, Henan, Hubei, Hunan, Guangdong, Guangxi, Hainan, Chongqing, Sichuan, Guizhou, Yunnan, Xizang, Shaanxi, Gansu, Qinghai, Ningxia, and Xinjiang) in China spanning the 2011 to 2017 period. The provinces were further divided into the eastern region (Hebei, Liaoning, Jiangsu, Zhejiang, Fujian, Shandong, Guangdong, Hainan, Beijing, Tianjin, and Shanghai), central region (Shanxi, Jilin, Heilongjiang, Anhui, Jiangxi, Henan, Hubei, and Hunan), and western region (Neimmengu, Guangxi, Sichuan, Guizhou, Yunnan, Shaanxi, Gansu, Ningxia, Tibet, Qinghai, Xinjiang, and Chongqing). The period was driven by data availability. We used the variables of economic growth, investment, labor, and fintech. We obtained the data on economic growth, investment, and labor from the National Data (2021), National Bureau of Statistics (retrieved from http://data.stats.gov.cn/ (20 December 2021)), while we sourced the data on fintech from [48] (see [48] for the construction of the fintech index). Fintech simply refers to the marriage of financial activities and information technology. It is made up of payment and settlement functions (third-party payment platforms), risk management functions (insurance consumption), resource allocation functions (crowdfunding platforms), and networking channel functions (credit investigation, wealth management, and virtual currency). GDP per capita is used as a proxy for economic growth [13,49]. Labor force participation rate (labor) is used as a proxy for employment [13,49]. Gross fixed capital formation is used as a proxy for investment [13,49]. All variables are used in natural log form to represent the results as elasticities. Table 1 displays the variables, code, definition, and unit of measurement.
Table 2 presents the descriptive statistics of the variables. We observe that China’s economic growth has an average rate of 10.74% with a maximum of 13.41%. Investment has an average of 9.13% with a maximum of 10.56%. Similarly, labor has an average of 6.01% with a maximum of 7.59%. Fintech has an average of 4.973% with a maximum of 5.819%. With regards to the submeasures of fintech, insurance has the highest average (5.664%), followed by third-party payment (4.805%), while credit has the lowest average (4.547%).
Table 2 also shows that the Livin–Lin–Chu (LLC) (LLC tests the null hypothesis of all panels holding unit roots against the alternative hypothesis that some panels are stationary [13]) [52] unit-roots test, at the log levels and first difference, demonstrated the variables are stationary.
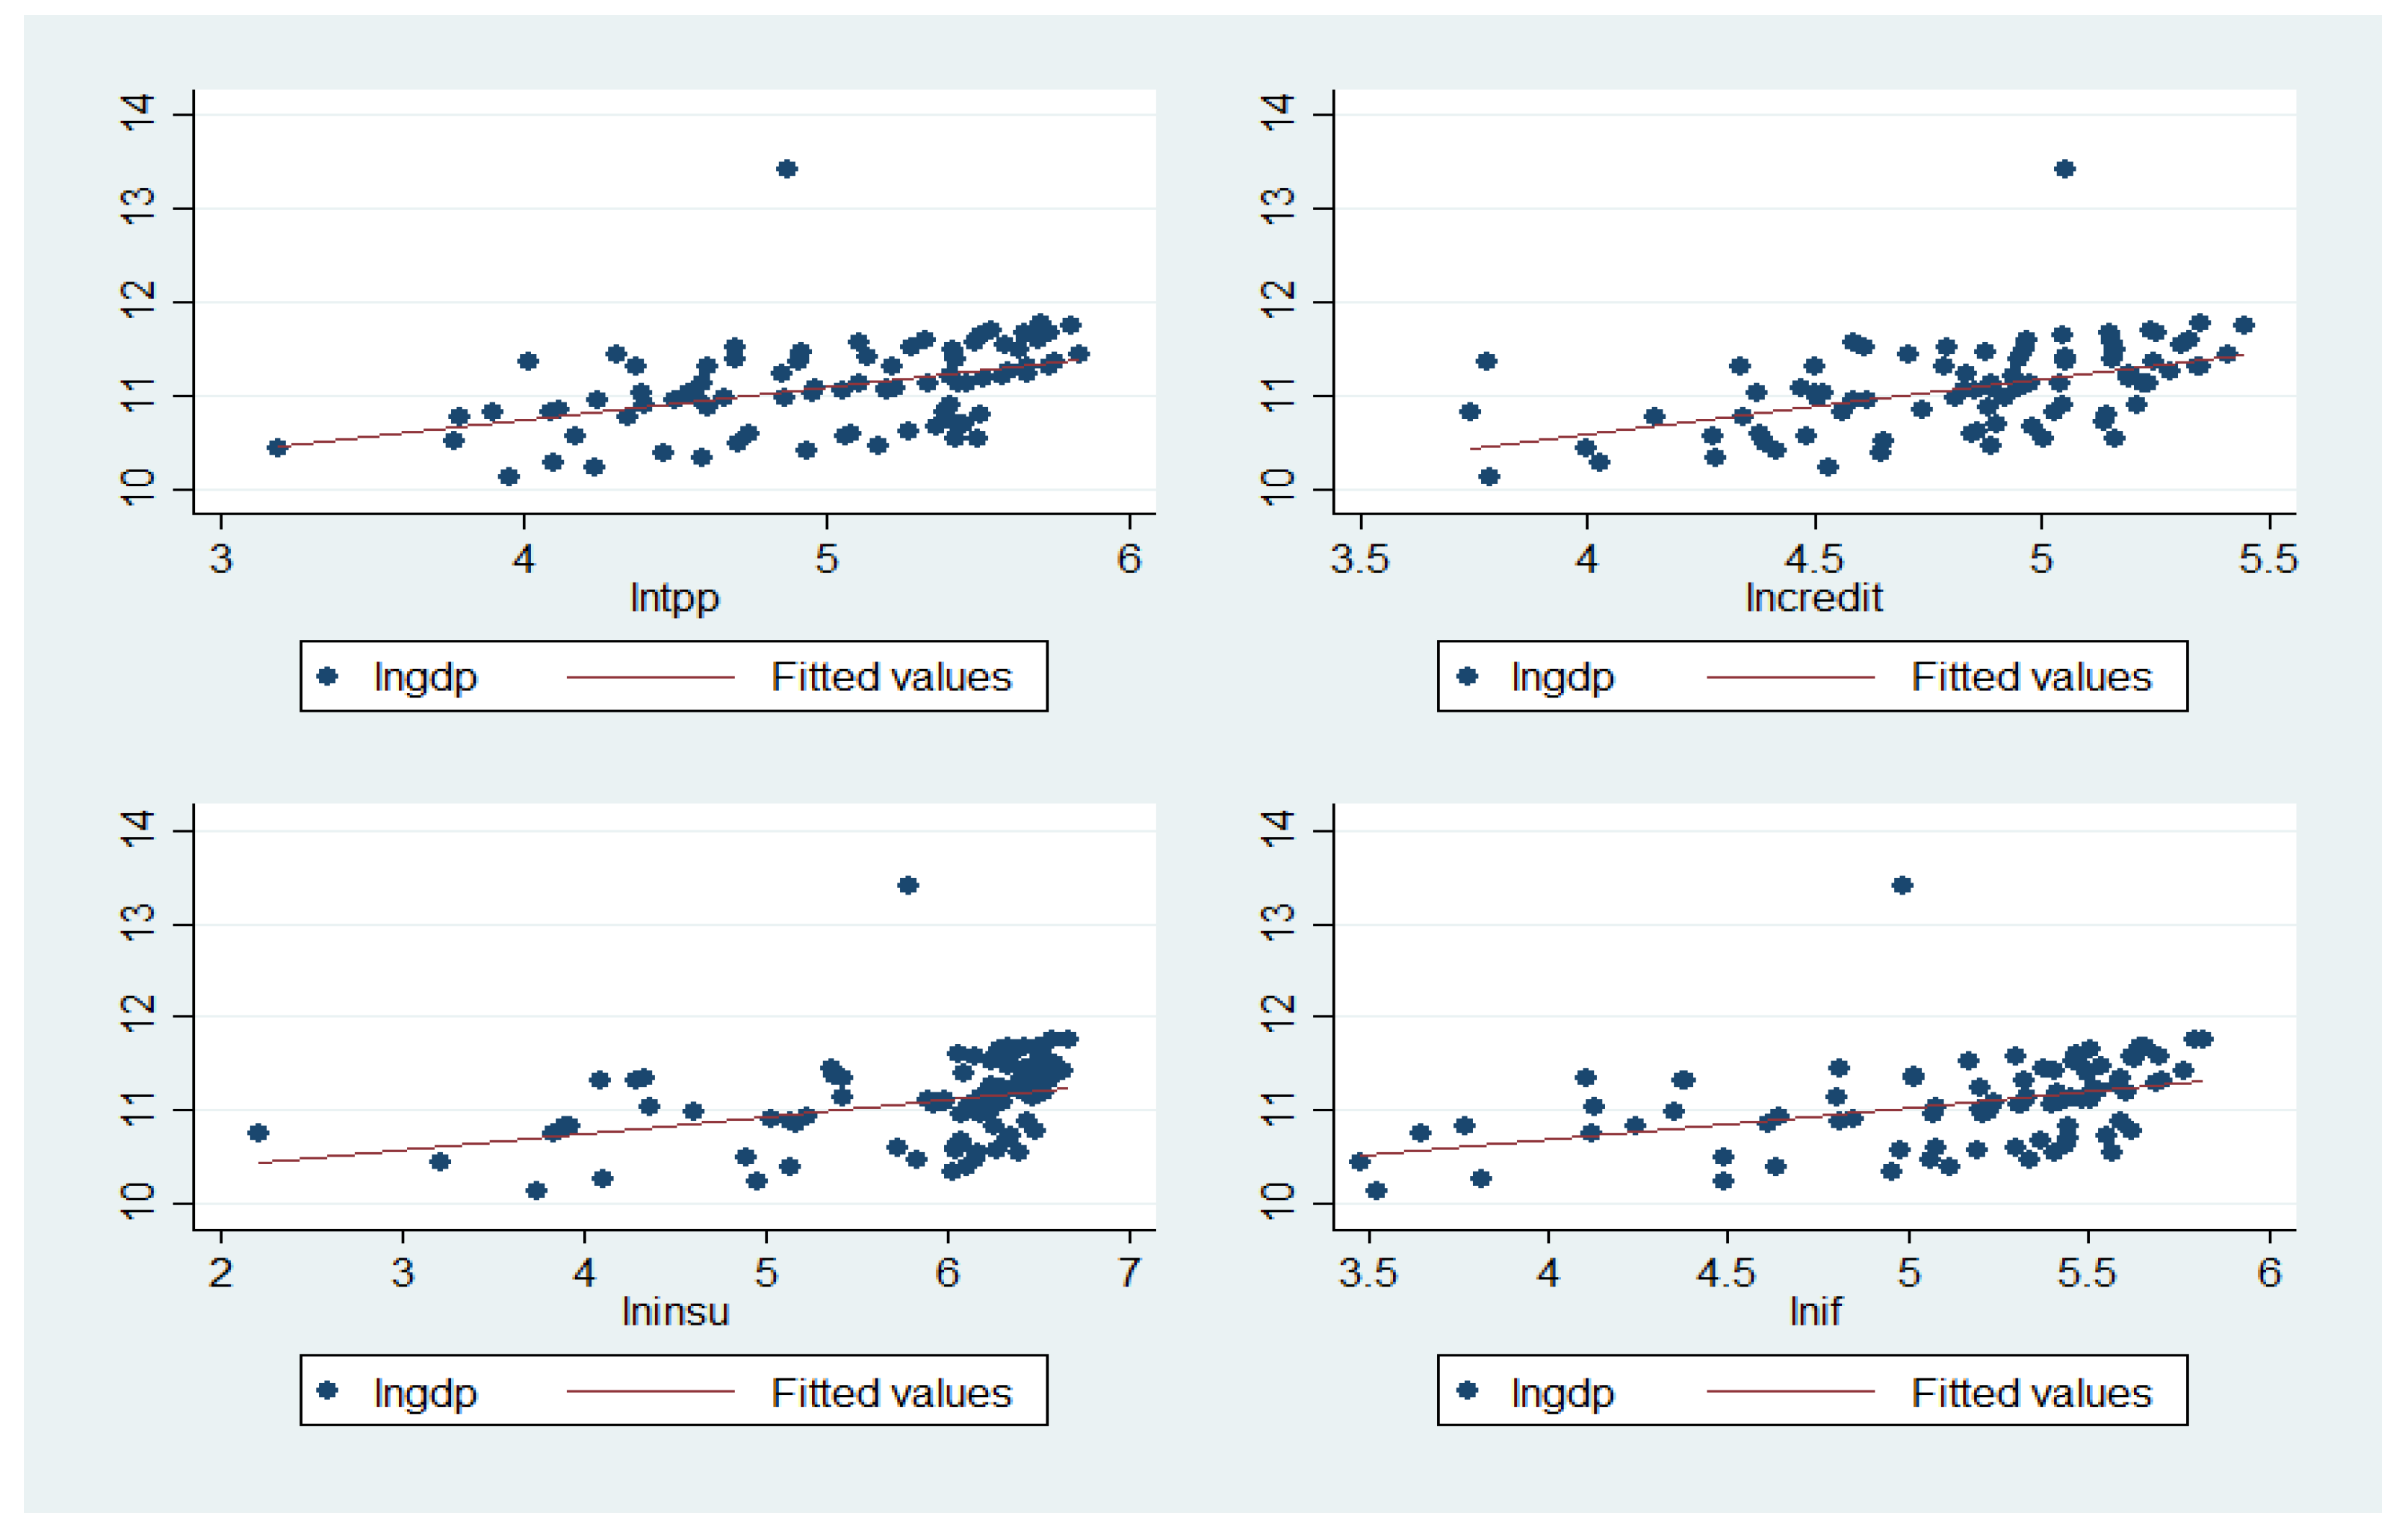
Figure 1 shows the correlation relationship between third-party payment, credit, insurance, fintech, and economic growth. The results show that there exists a positive correlation between third-party payment, credit, insurance, fintech, and economic growth.
3.2. Methodology
We build on the neoclassical aggregate production function (APF) following [53]. This theory examines the relationship between inputs and outputs in production [13,54].
The model is stated as Equation (1)
where denotes output, denotes capital, and denotes labor. denotes total factor productivity (TFP). i denotes province, and t denotes time. To examine fintech’s influence on economic growth, we substituted fintech into (see Equation (2))
Substituting Equation (2) into Equation (1) gives Equation (3)
Expressing Equation (3) in econometrics gives Equation (4)
Taking the log of either end gives Equation (5)
From Equation (5), we estimated the following growth equation: Equation (6)
where denotes the natural logarithm of economic growth, signifies natural logarithm of investment, signifies natural logarithm of labor while denotes the natural logarithm of fintech, which is further disaggregated into the natural logarithm of third-party payment (), the natural logarithm of credit (), and the natural logarithm of insurance (). The parameter represents the long-run elasticity estimates of fintech (third-party payment , credit , and insurance ). signifies the error term of each observation. The goal of this study is to compute . We anticipate to have either a positive or negative significant impact on China’s economic growth.
We used the IV–GMM technique for our empirical analysis following [13,18]. This model produces efficient outcomes since it addresses endogeneity and omitted variables problems [18]. Following [13,18], we employed the robust option. This option shows the Hansen test [55], which tests the null hypothesis of instrument overidentification; restriction should not be rejected in both models [55]. To solve endogeneity issues, we took the first and second lags of the fintech proxies as instruments.
For our robustness analysis, we used the ordinary least-squares estimator (OLS) and the random effects (RE) technique.
3.3. Causality Model
We used the Dumitrescu and Hurlin [56] causality test to examine the causal nexus between fintech, economic growth, and the other macroeconomic variables in China. The test is specified as follows: Equation (7)
We tested the following assumption: (null hypothesis) against the alternative: .
and are parameters. is the length of lags. is the number of provinces. denotes the dependent variables while denotes the independent variables. We tested the null hypothesis of no causal relationship against the alternative of a causal relationship among the variables.
4. Results and Discussion
4.1. Full Sample Results
Table 3 shows the full sample results. The results show that third-party payment, credit, insurance, and fintech have a positive and statistically significant effect on China’s economic growth in both models at the 1% level. The IV–GMM results show that a 1% rise in third-party payment increases China’s economic growth by 0.39%. This implies that a 10% rise in third-party payment increases China’s economic growth by approximately 4%. The findings also show that a 1% rise in credit increases China’s economic growth by 0.50%. This implies that a 10% rise in credit increases China’s economic growth by 5%. Third-party payment platforms and credit platforms propel general economic efficiency by reducing transaction costs and information asymmetry [8]. This generates liquidity, triggers savings, and advances capital accumulation, leading to increased production, trade, consumption, and reproduction purposes [31], thus a positive contribution to China’s economic growth. Our results also show that a 1% rise in insurance consumption increases China’s economic growth by 1.59%. This implies that a 10% rise in insurance consumption raises China’s economic growth by 16%. Internet insurance, just like traditional insurance sectors, provides risk management and financial intermediary services to businesses and individuals. This offers protection to firms and relieves pressure to cover damages, facilitates commercial transactions, and provides credit by mitigating losses; it promotes entrepreneurial attitude, investment, boosts technological innovation, ensures efficient capital allocation, and enables risk-averse individuals and entrepreneurs to undertake higher return activities, thus a positive contribution to China’s economic growth. A rise in fintech increases China’s economic growth by 0.79%. This implies that a 10% rise in fintech increases China’s economic growth by 8%. The significant positive effect of third-party payment, credit, insurance, and fintech on China’s economic growth supports our H1. This conflicts with the findings of [31], which found no relationship between fintech and economic growth. These differences in results could be attributed to differences in datasets. These results are robust using the OLS and RE models; however, the coefficients of the IV–GMM model are slightly higher than that of the OLS and RE models, indicating that the IV–GMM model addresses endogeneity and omitted-variable issues.
Investment significantly increases economic growth according to the RE models and the IV–GMM model (11). An increase in investment increases China’s economic growth by 0.3%. This supports the findings of [57] for 5 OPEC countries, [58] for 40 SSA countries, and [49] for 54 African countries, all of which found that investment increases economic growth. Labor has an insignificant effect on China’s economic growth in both models.
Turning to the stability of the model, the null hypothesis of instrument overidentification restriction was not rejected in most of the cases, except in Model 12; however, the Cragg–Donald Wald F test statistic showed that the instruments used are not weak. The variance inflation factors (VIF) of the OLS estimates are also below 10, demonstrating that our study does not suffer from multicollinearity issues.
4.2. Regional Analysis
Table 4 shows the regional effect of fintech and the submeasures on economic growth using the IV–GMM technique. The results show that third-party payment, credit, insurance, and fintech have a statistically significant positive effect on economic growth in both the eastern and central regions; however, only credit and fintech are significant drivers of economic growth in the western region. Precisely, a 1% increase in third-party payment, credit, insurance, and fintech increases economic growth by: 0.49%, 0.84%, 1.59%, and 0.94%, respectively, in the eastern region; 0.12%, 0.13%, 0.48%, and 0.19%, respectively, in the central region. Moreover, a 1% increase in credit and fintech increases economic growth by 0.17% and 0.31%, respectively, in the western region. The findings also show that the eastern region has the highest growth effect of fintech as compared with the western and central regions. This is in tandem with our H3.
The results further show that investment drives economic growth in the central and western regions, while it impedes economic growth in the eastern region. Labor drives economic growth in the eastern region, while it impedes economic growth in the western and central regions.
4.3. Causality Analysis
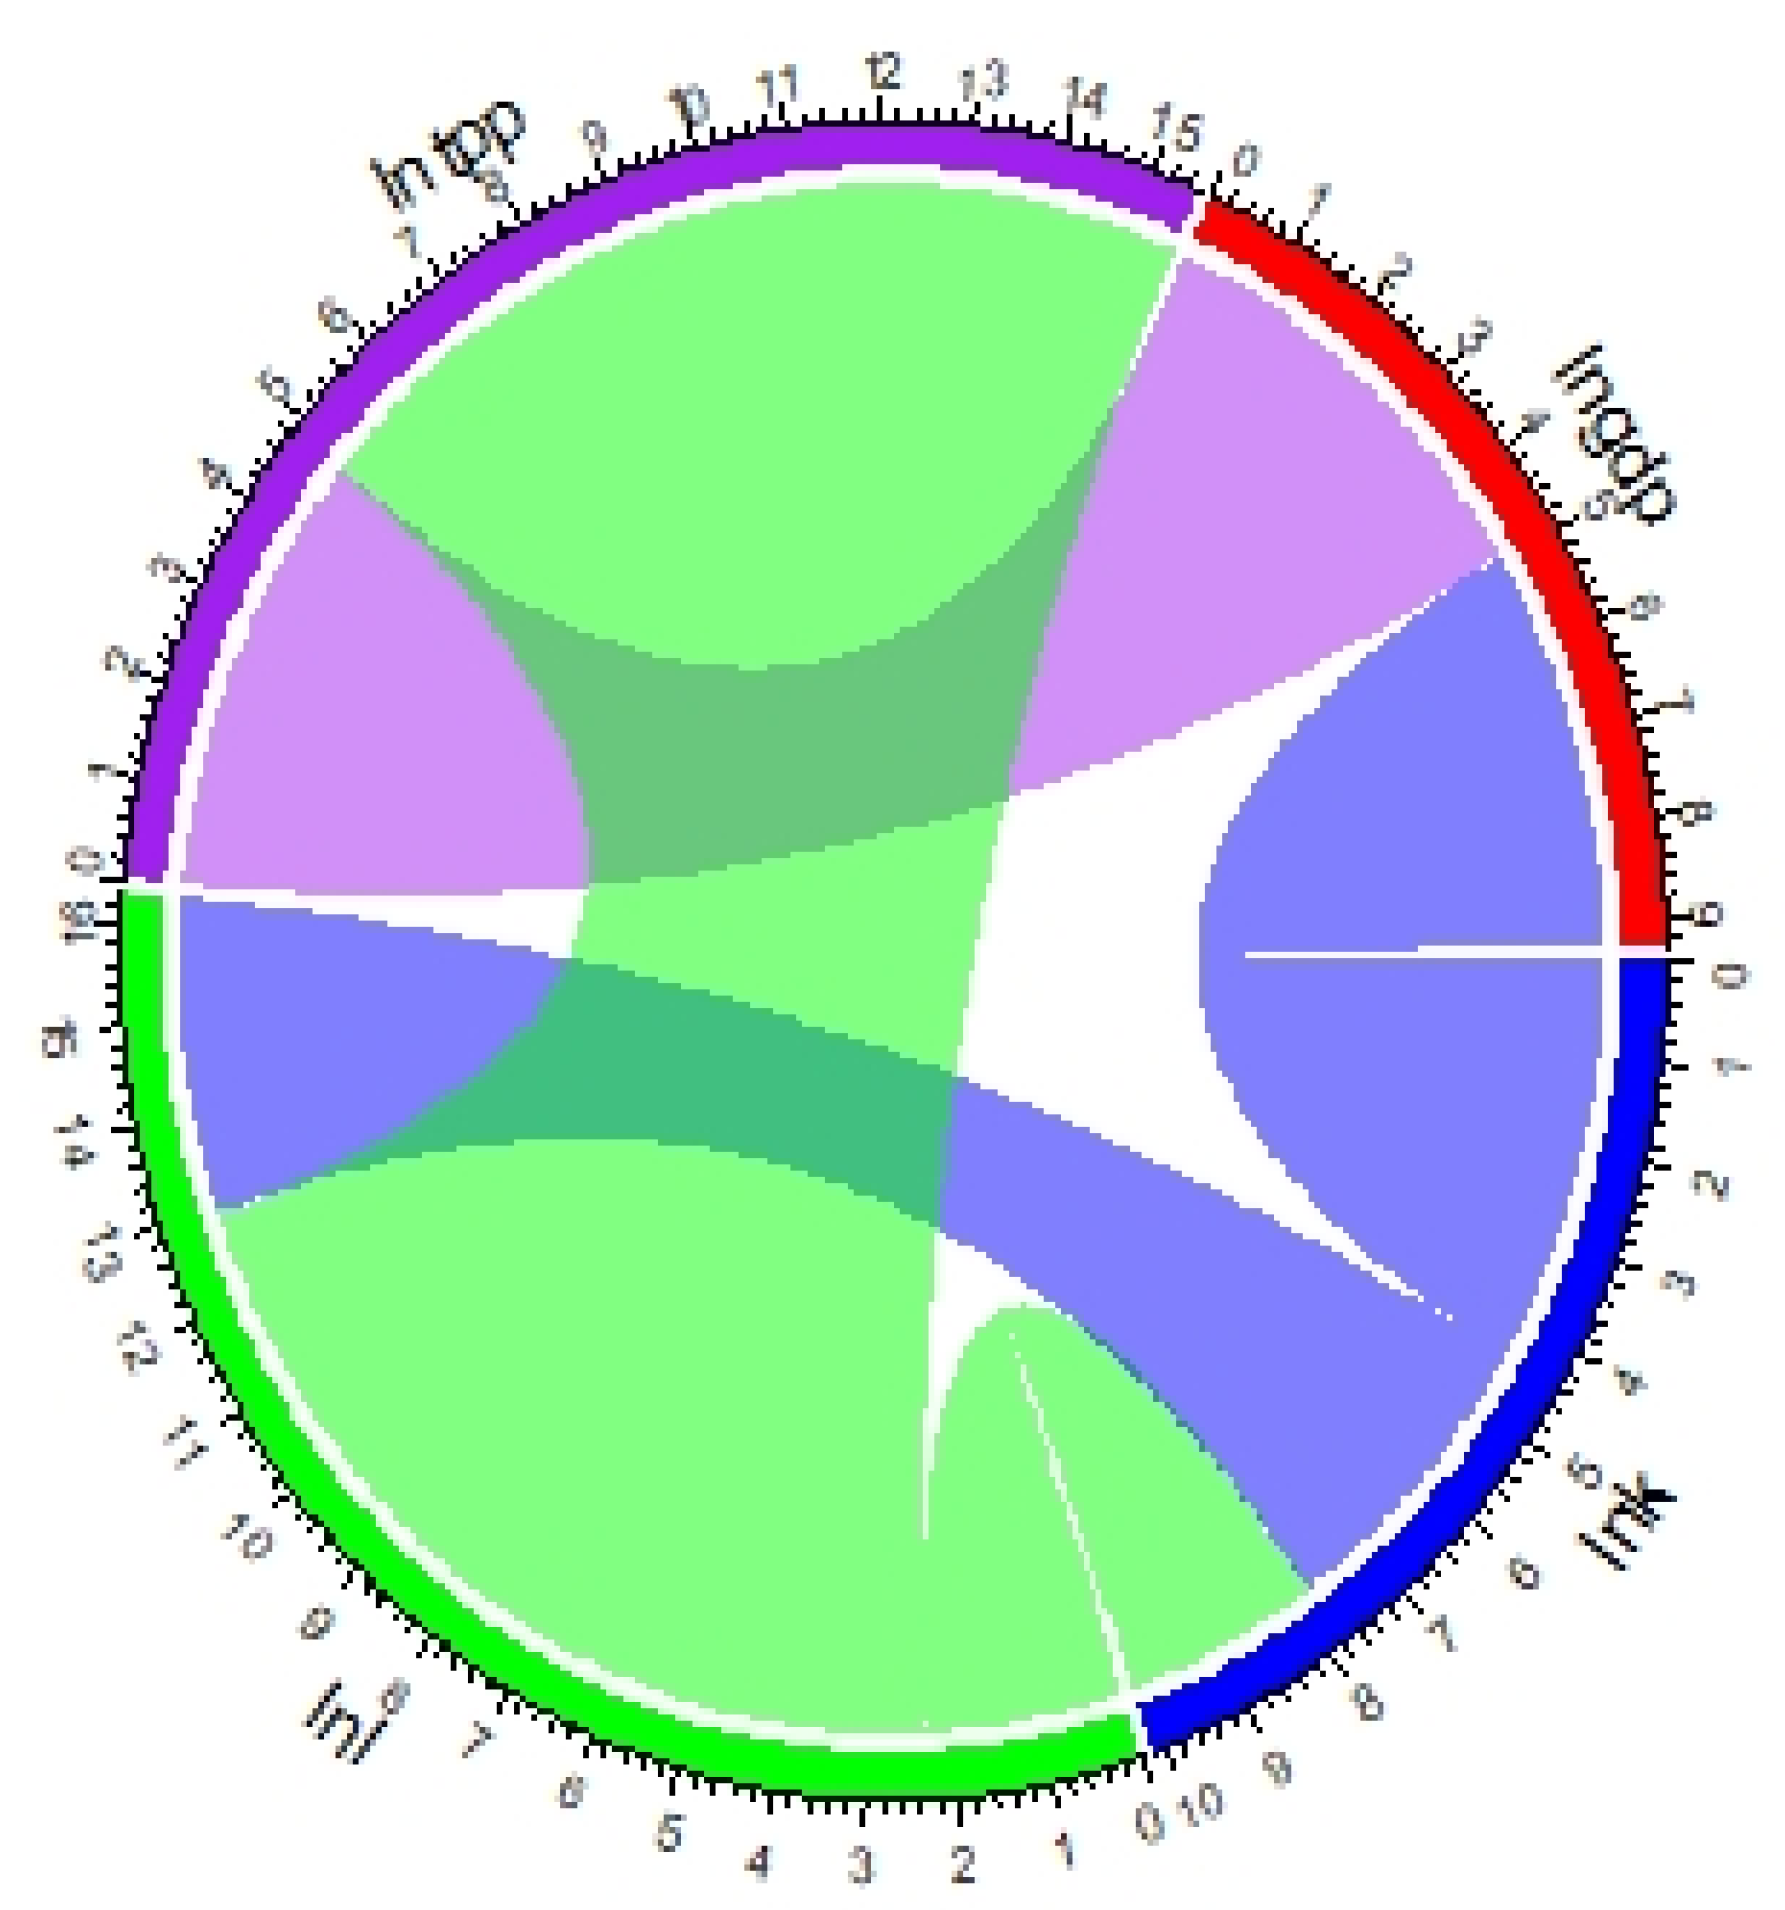
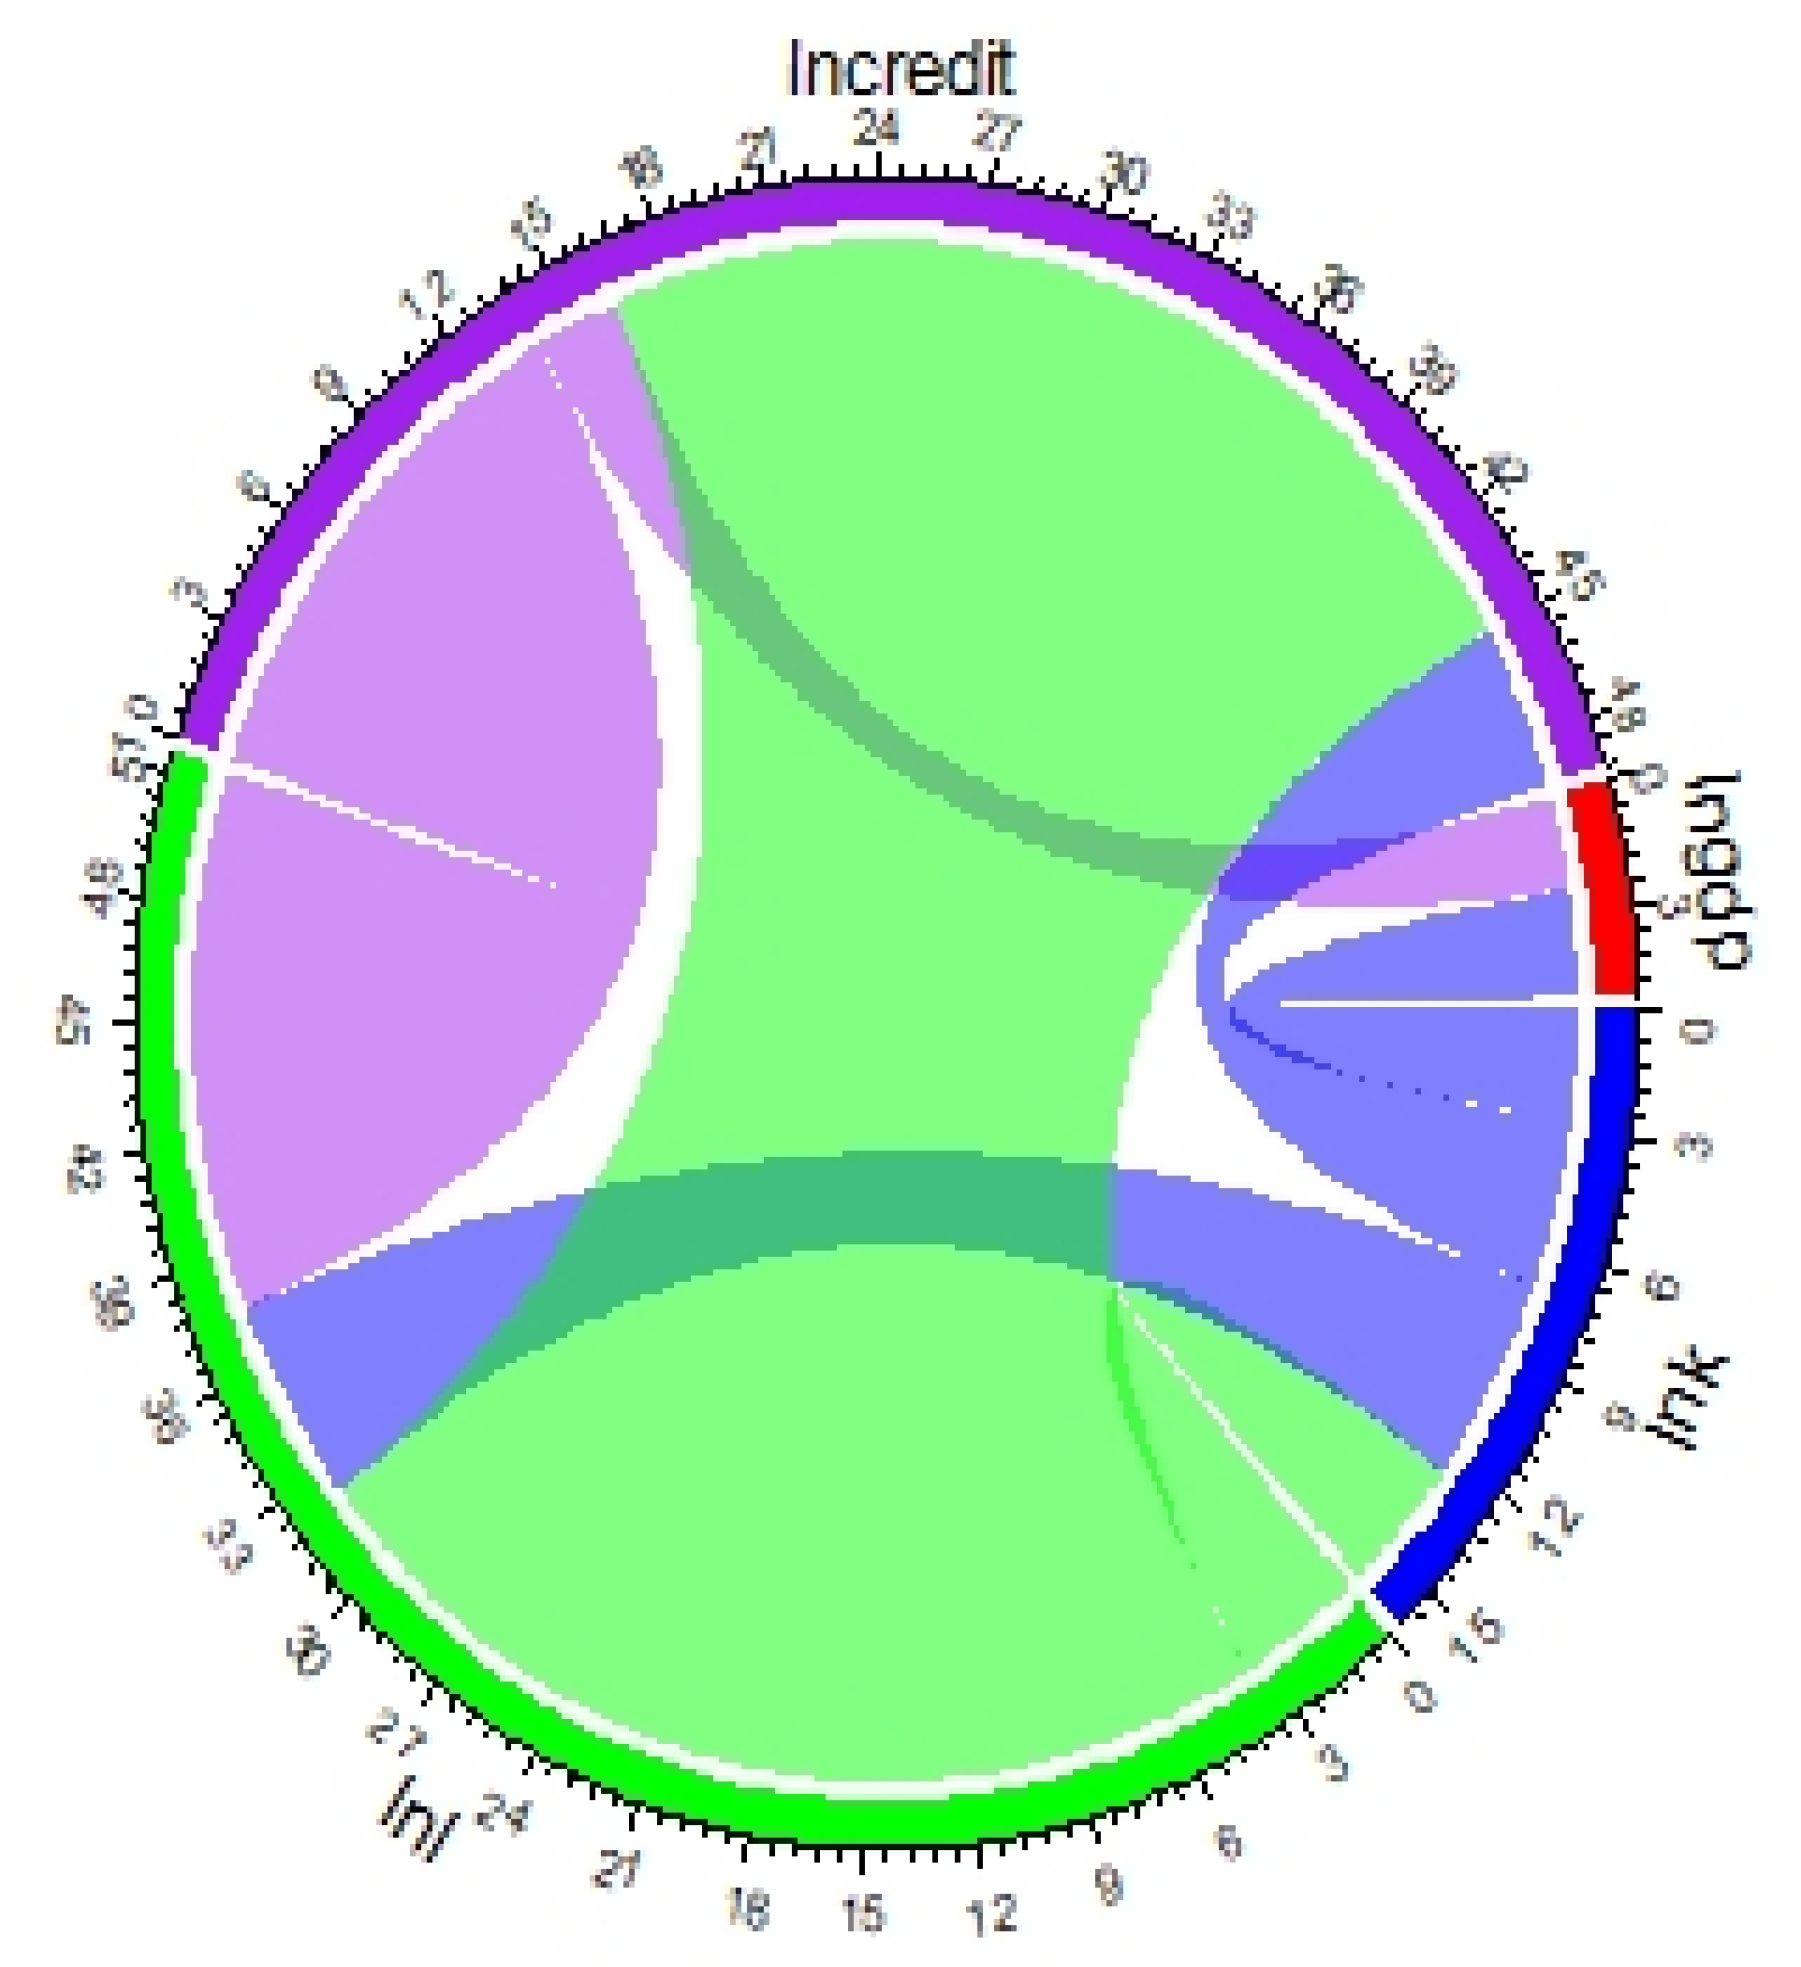
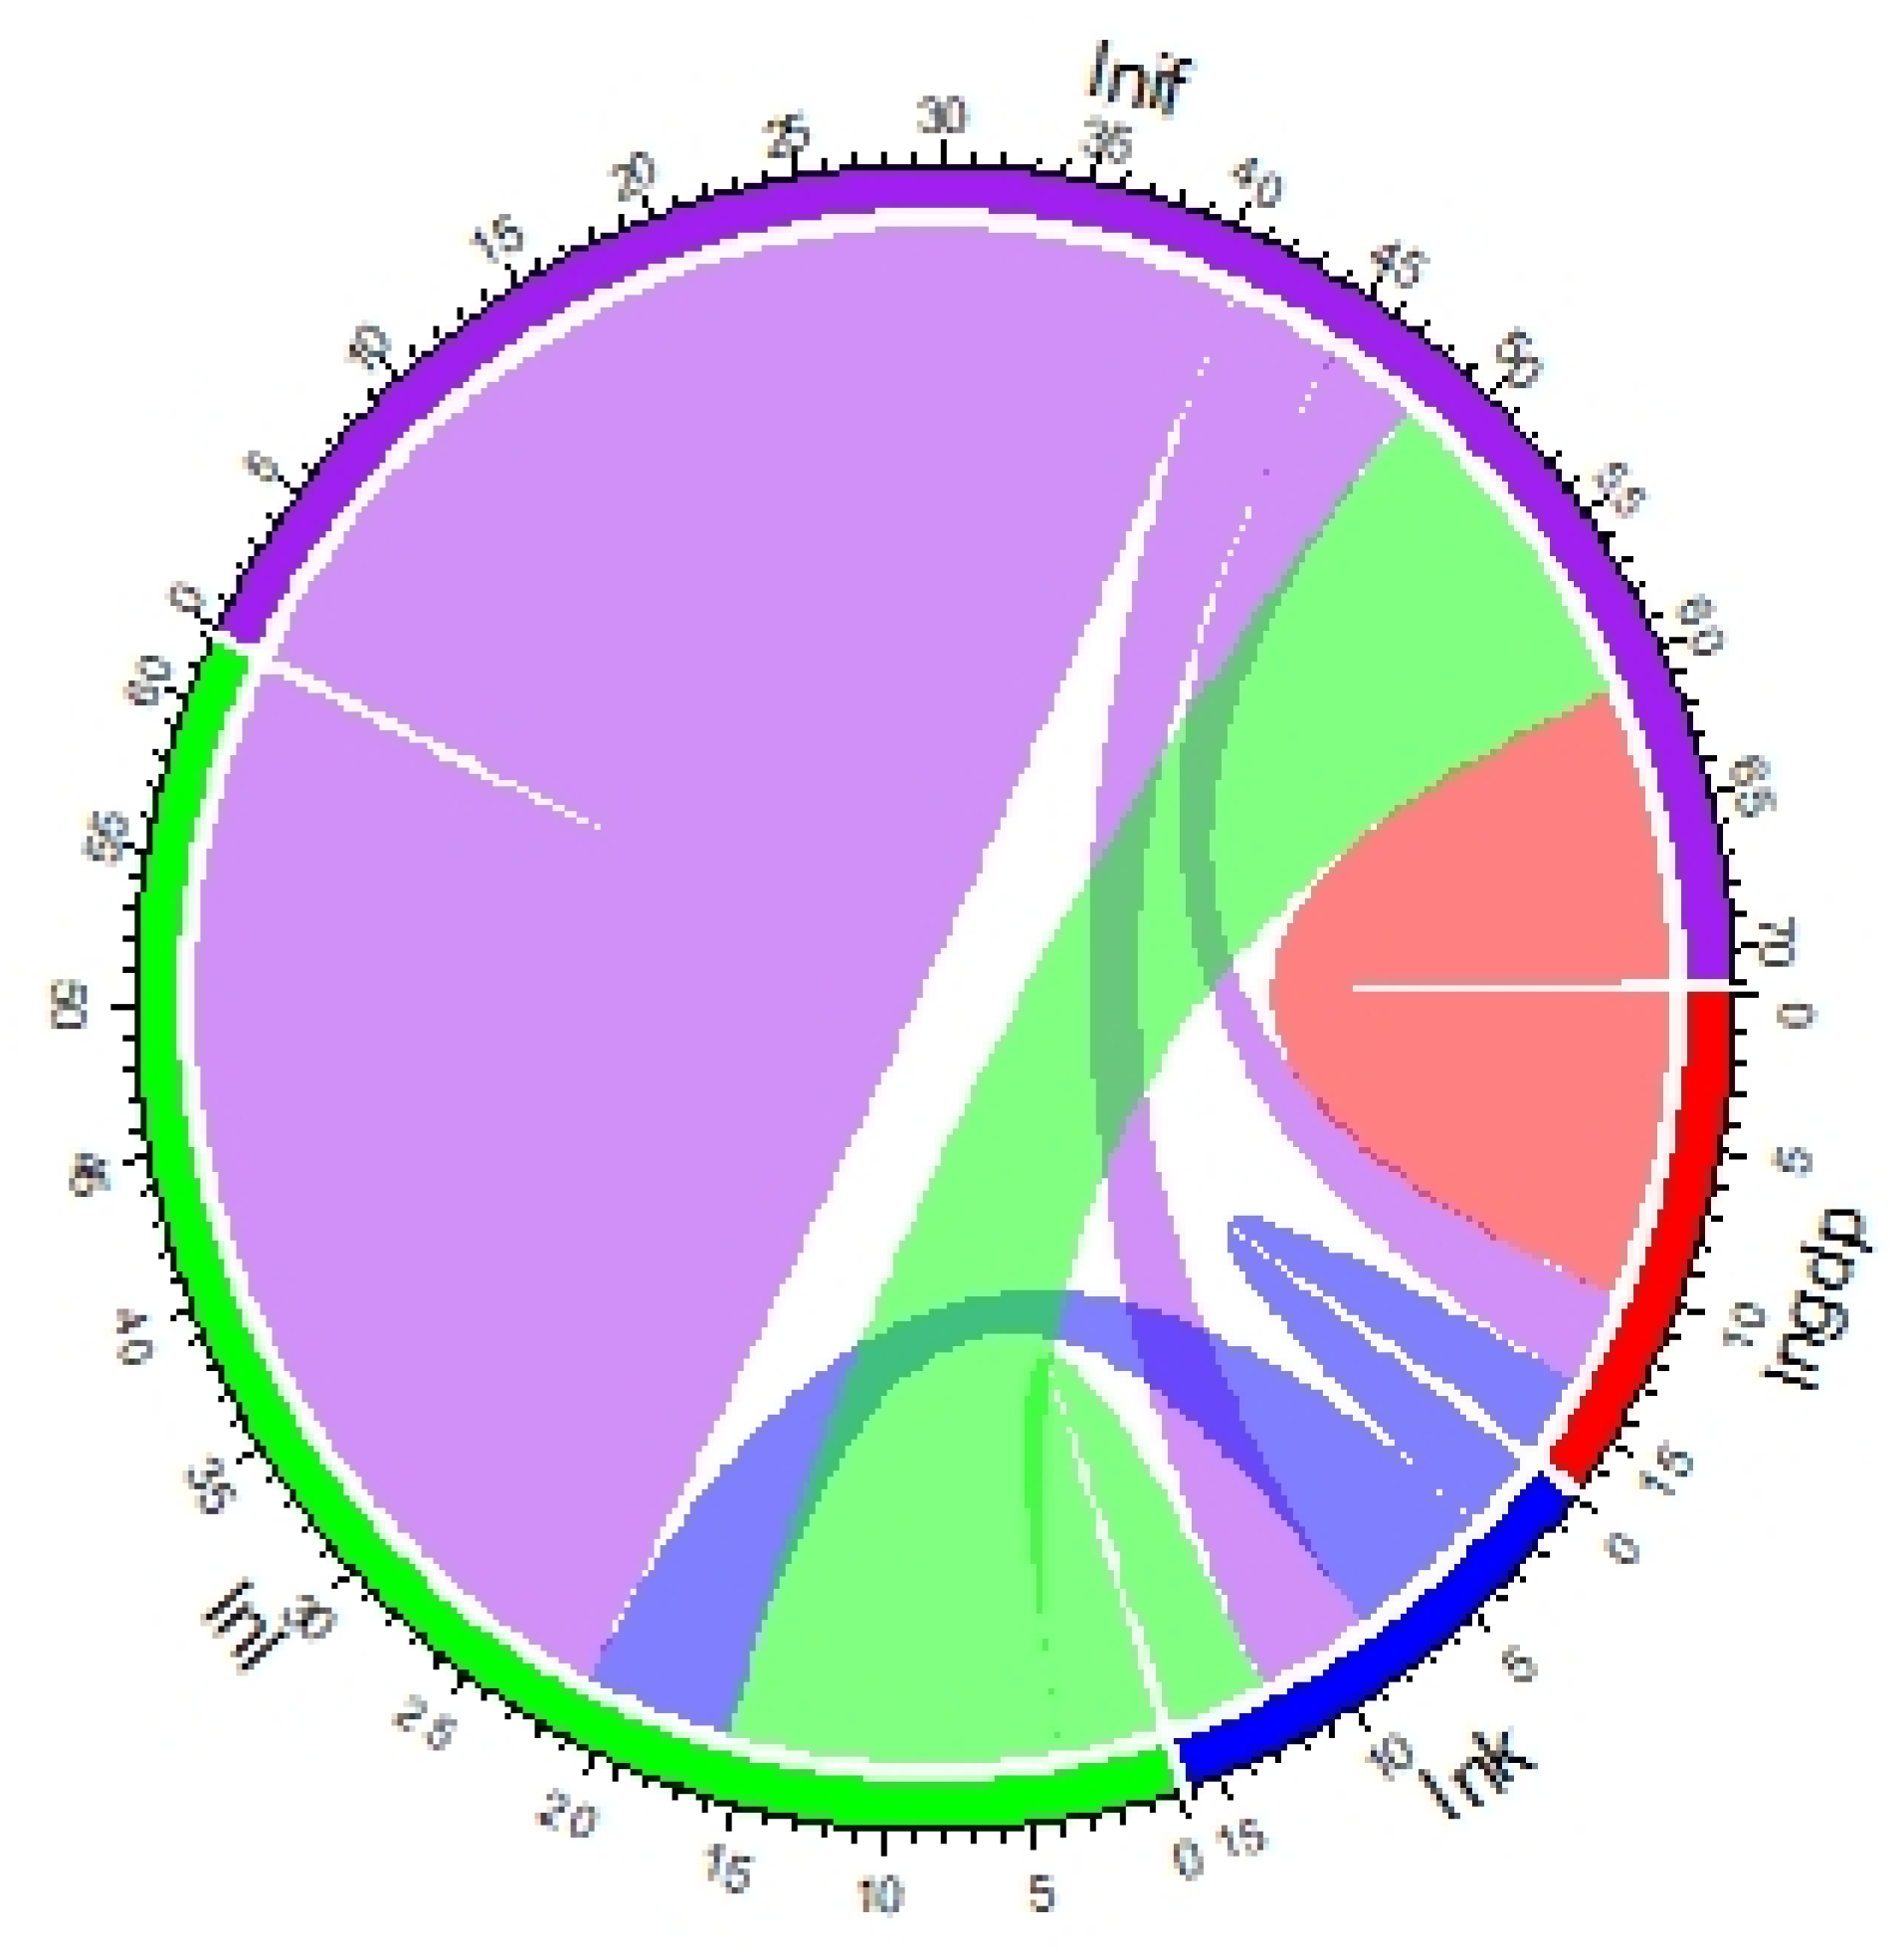
The Dumitrescu and Hurlin [56] causality analysis was also used in this study to examine the causality relationships among the variables. Chord diagrams are used to show the findings (see Figure 2, Figure 3, Figure 4 and Figure 5). The F-statistics produced by the Dumitrescu and Hurlin causality test are used to calculate a variable arc length in the chord diagram. The connection between any two variables defines causation between the variables. The results show that there exists a unidirectional causality running from third-party payment and credit to economic growth (see Figure 2 and Figure 3). There exists a unidirectional causality running from economic growth to insurance (see Figure 4). There also exists bidirectional causality between fintech and economic growth (see Figure 5). Thus, an increase in fintech will stimulate China’s economic growth and vice versa. The results further show that there exists a unidirectional causality running from investment to credit (see Figure 3), investment to insurance (see Figure 4), investment to labor (see Figure 4), and investment to economic growth (see Figure 2, Figure 3, Figure 4 and Figure 5). A unidirectional causality also exists from fintech to investment (see Figure 5). There exists bidirectional causality between investment and labor (see Figure 2, Figure 3 and Figure 5). Finally, there exists a unidirectional causality from labor to third-party payment, credit, and insurance, while there exists bidirectional causality between labor and fintech. These imply that further improvement in human capital and infrastructure investment in China will drive fintech development and vice versa.
4.4. Further Analysis
To provide further robustness to our previous findings, we used labor productivity (Labor productivity refers to output per worker) as a different measure of economic growth. The results are presented in Table 5. In consonance with our earlier findings, third-party payment, credit, insurance, and fintech retained their statistically significant positive effect. The IV–GMM model results show that a 1% rise in third-party payment raises labor productivity by 0.08%. This implies that a 10% rise in third-party payment increases labor productivity by 0.8%. A 1% rise in credit raises labor productivity by 0.09%. This implies that a 10% rise in credit raises labor productivity by 0.9%. A 1% rise in insurance raises labor productivity by 0.32%. This implies that a 10% rise in insurance consumption increases labor productivity by 3.2%. Finally, a 1% rise in fintech raises labor productivity by 0.14%. This implies that a 10% rise in fintech raises labor productivity by 1.4%. These are original findings. The statistically significant and positive effect of third-party payment, credit, insurance, and fintech on labor productivity supports our H1. These results are robust using the OLS and RE models.
The variance inflation factors (VIF) of the OLS estimates are below 10, showing that our study does not suffer from multicollinearity issues.
4.5. Province-Specific Analysis
Given the provincial differences in fintech development [48], the sample mean might be dissimilar from the individual provincial mean. Thus, we used the IV–GMM results in Table 3 to predict the individual provincial effect of fintech and the submeasures on China’s economic growth.
4.5.1. Province-Specific Effect of Third-Party Payment on Economic Growth
Figure 6 shows the province-specific effect of third-party payment on economic growth. The results show that the impact of third-party payment on economic growth is positive for all the provinces. The results further show that Zhejiang (10.9795), Jiangsu (10.9763), Guangdong (10.9242), Shanghai (10.8703), and Shandong (10.8521) have a high growth effect of third-party payment as compared with Hainan (10.4803), Gansu (10.3477), Qinghai (10.3259), Ningxia (10.2613), and Xizang (10.2011), which have a relatively low growth effect.
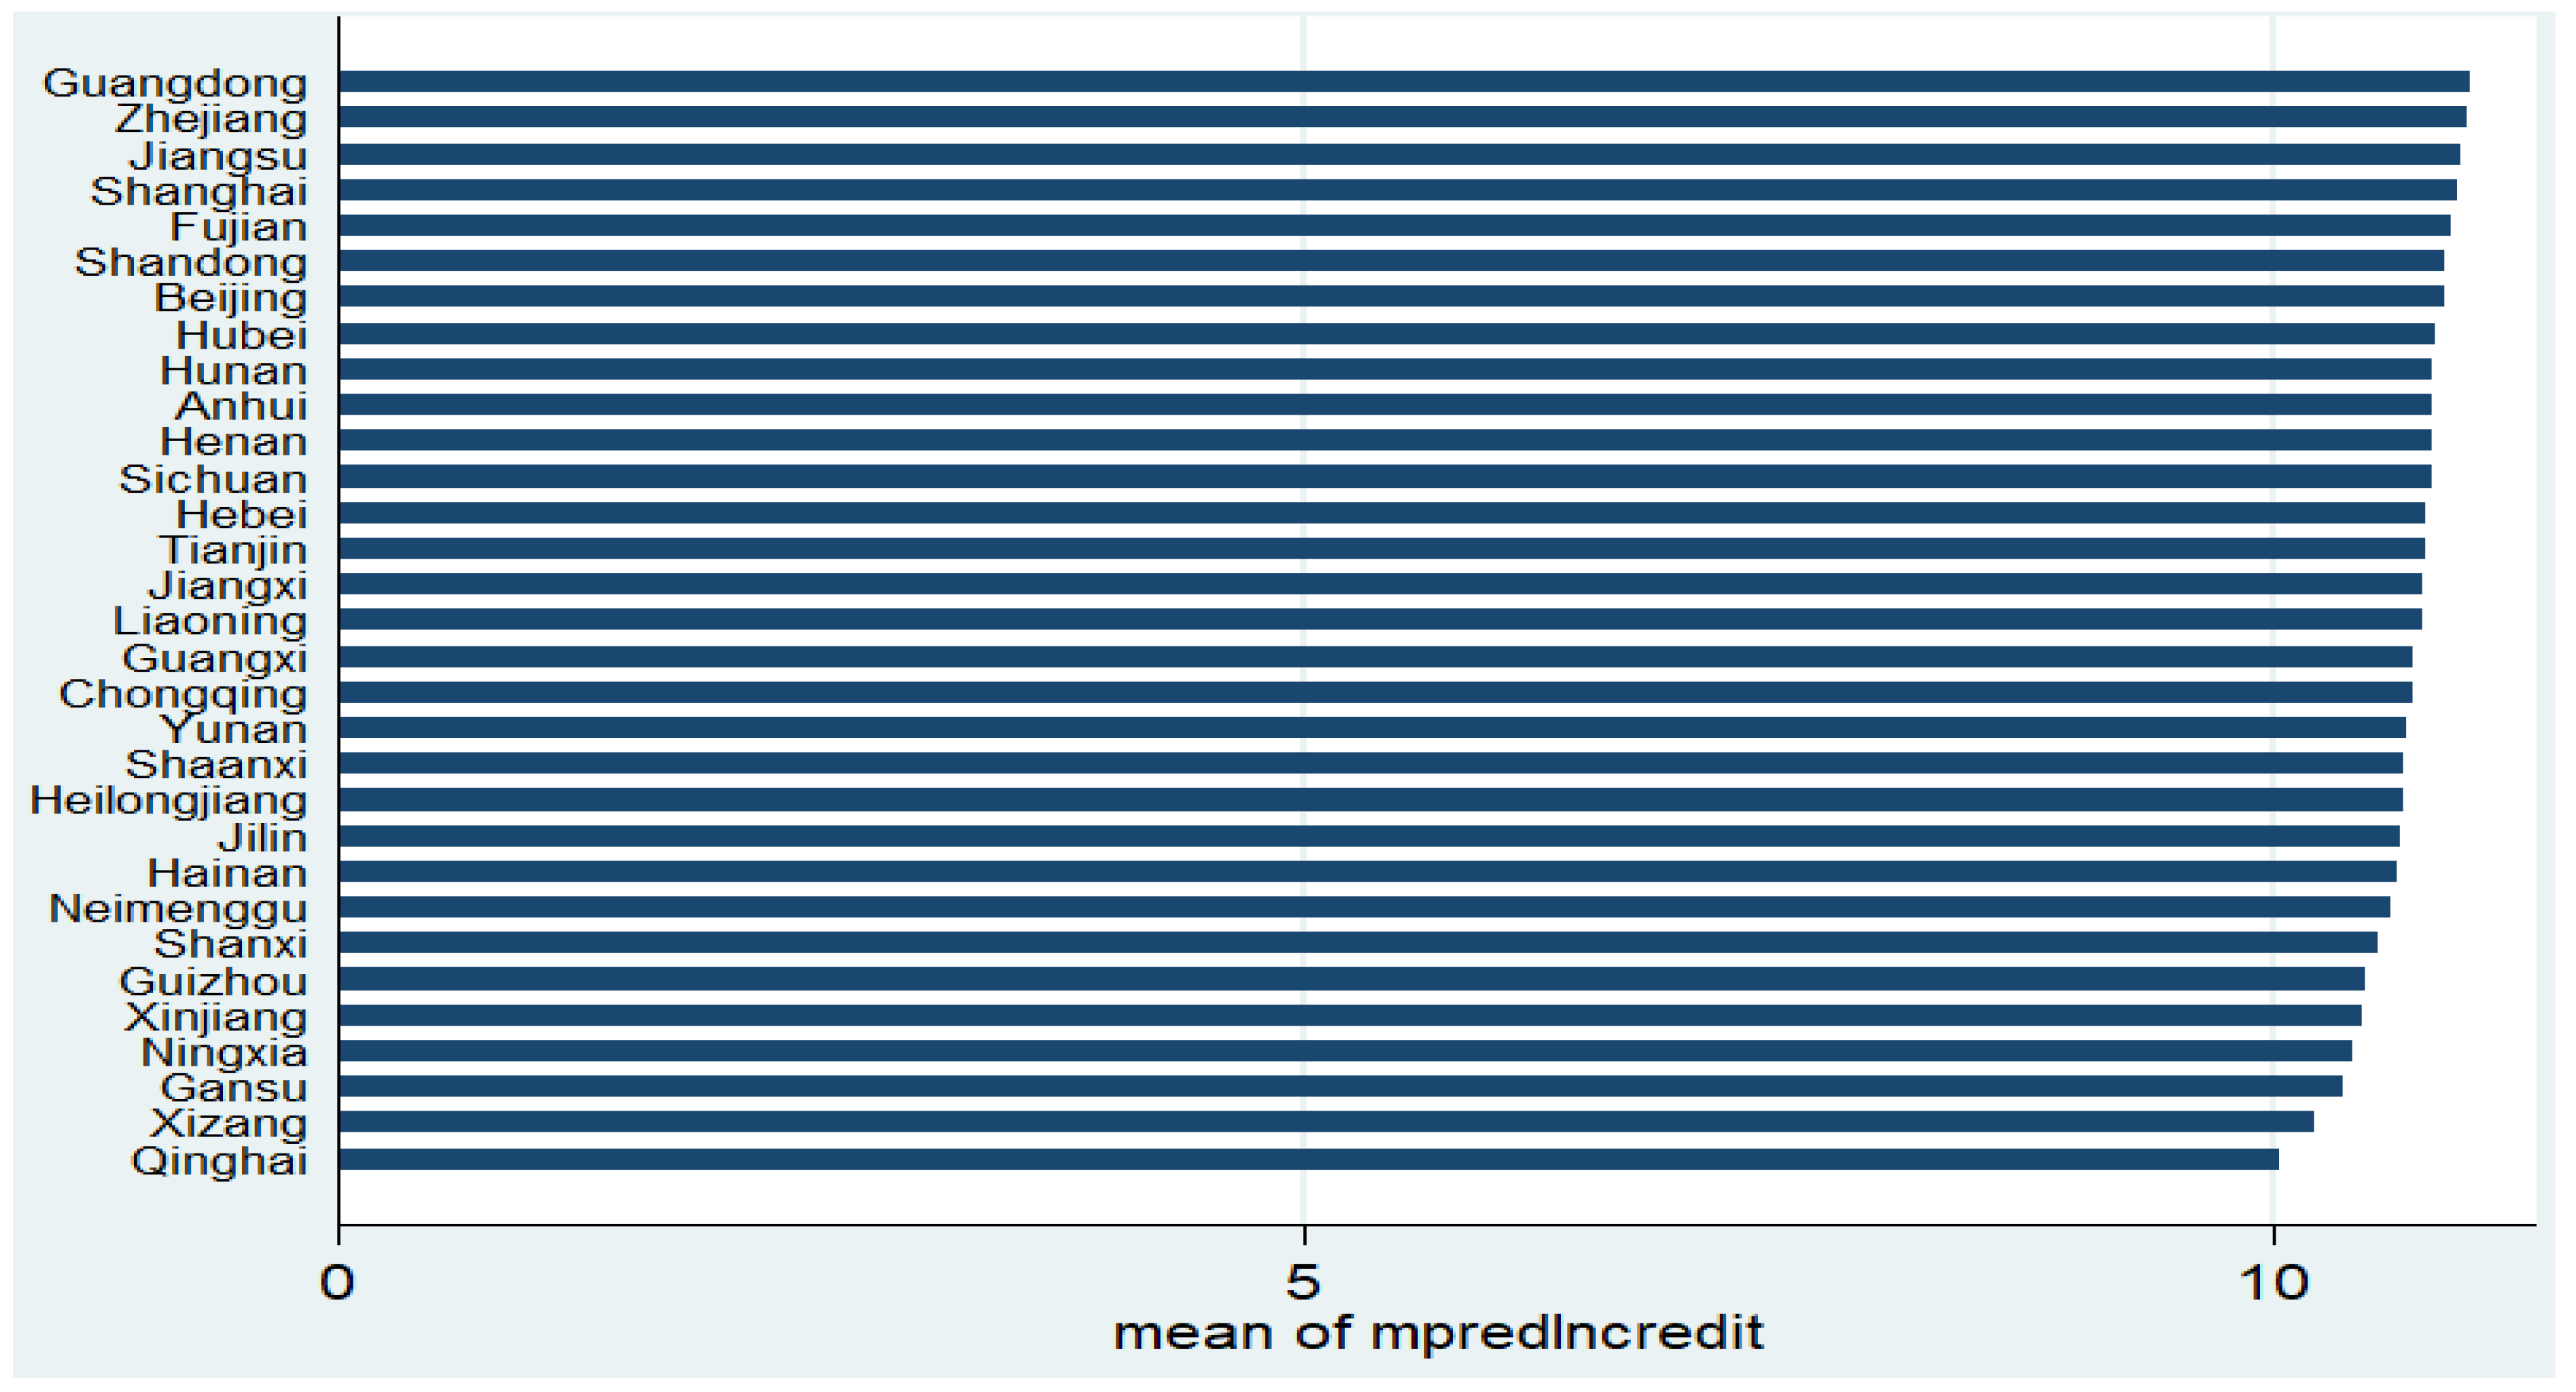
4.5.2. Province-Specific Effect of Credit on Economic Growth
Figure 7 shows the province-specific effect of credit on economic growth. We found that the impact of credit on economic growth is positive for all the provinces. The findings additionally display that Guangdong (11.0131), Zhejiang (10.9989), Jiangsu (10.9757), Shanghai (10.9598), and Fujian (10.9243) have a high growth effect of credit as compared with Xinjiang (10.4666), Ningxia (10.4085), Gansu (10.3609), Xizang (10.2164), and Qinghai (10.0406), which have a relatively low growth effect.
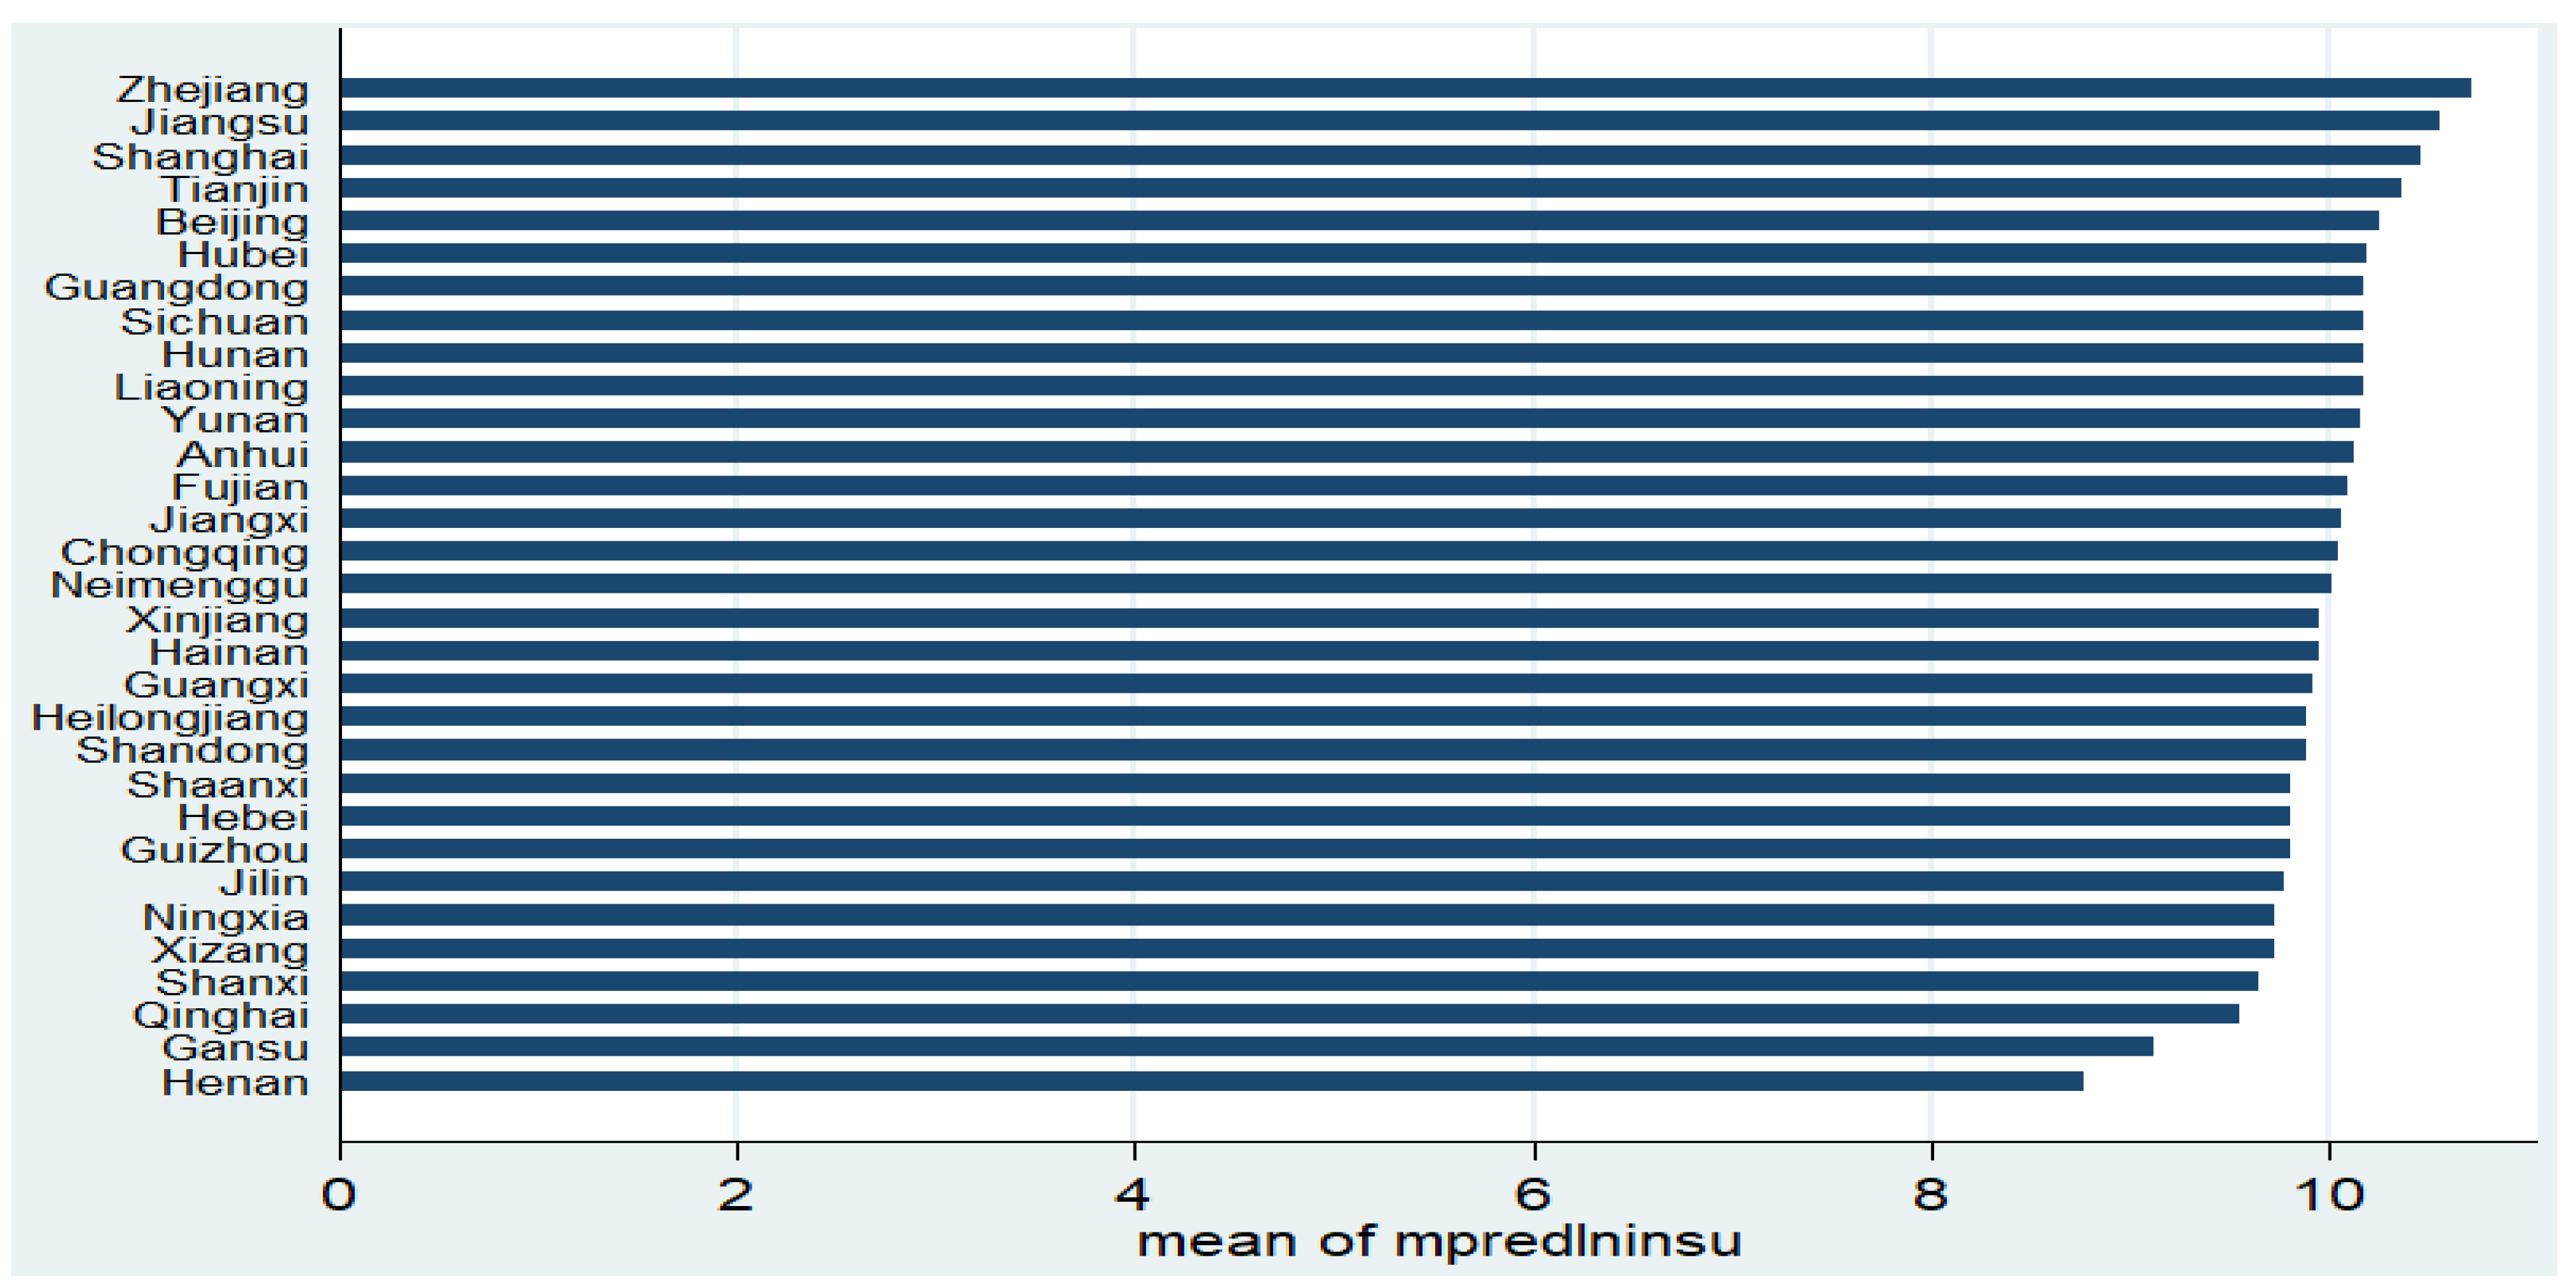
4.5.3. Province-Specific Effect of Insurance on Economic Growth
Figure 8 displays the province-specific effect of insurance on economic growth. The findings indicate that the impact of insurance on economic growth is positive for all the provinces. The findings further suggest that Zhejiang (10.7227), Jiangsu (10.5578), Shanghai (10.473), Tianjin (10.3458), and Beijing (10.2735) have a high growth effect of insurance as compared with Ningxia (9.7007), Shanxi (9.6307), Qinghai (9.5112), Gansu (9.0922), and Henan (8.7208), which have a relatively low growth effect.
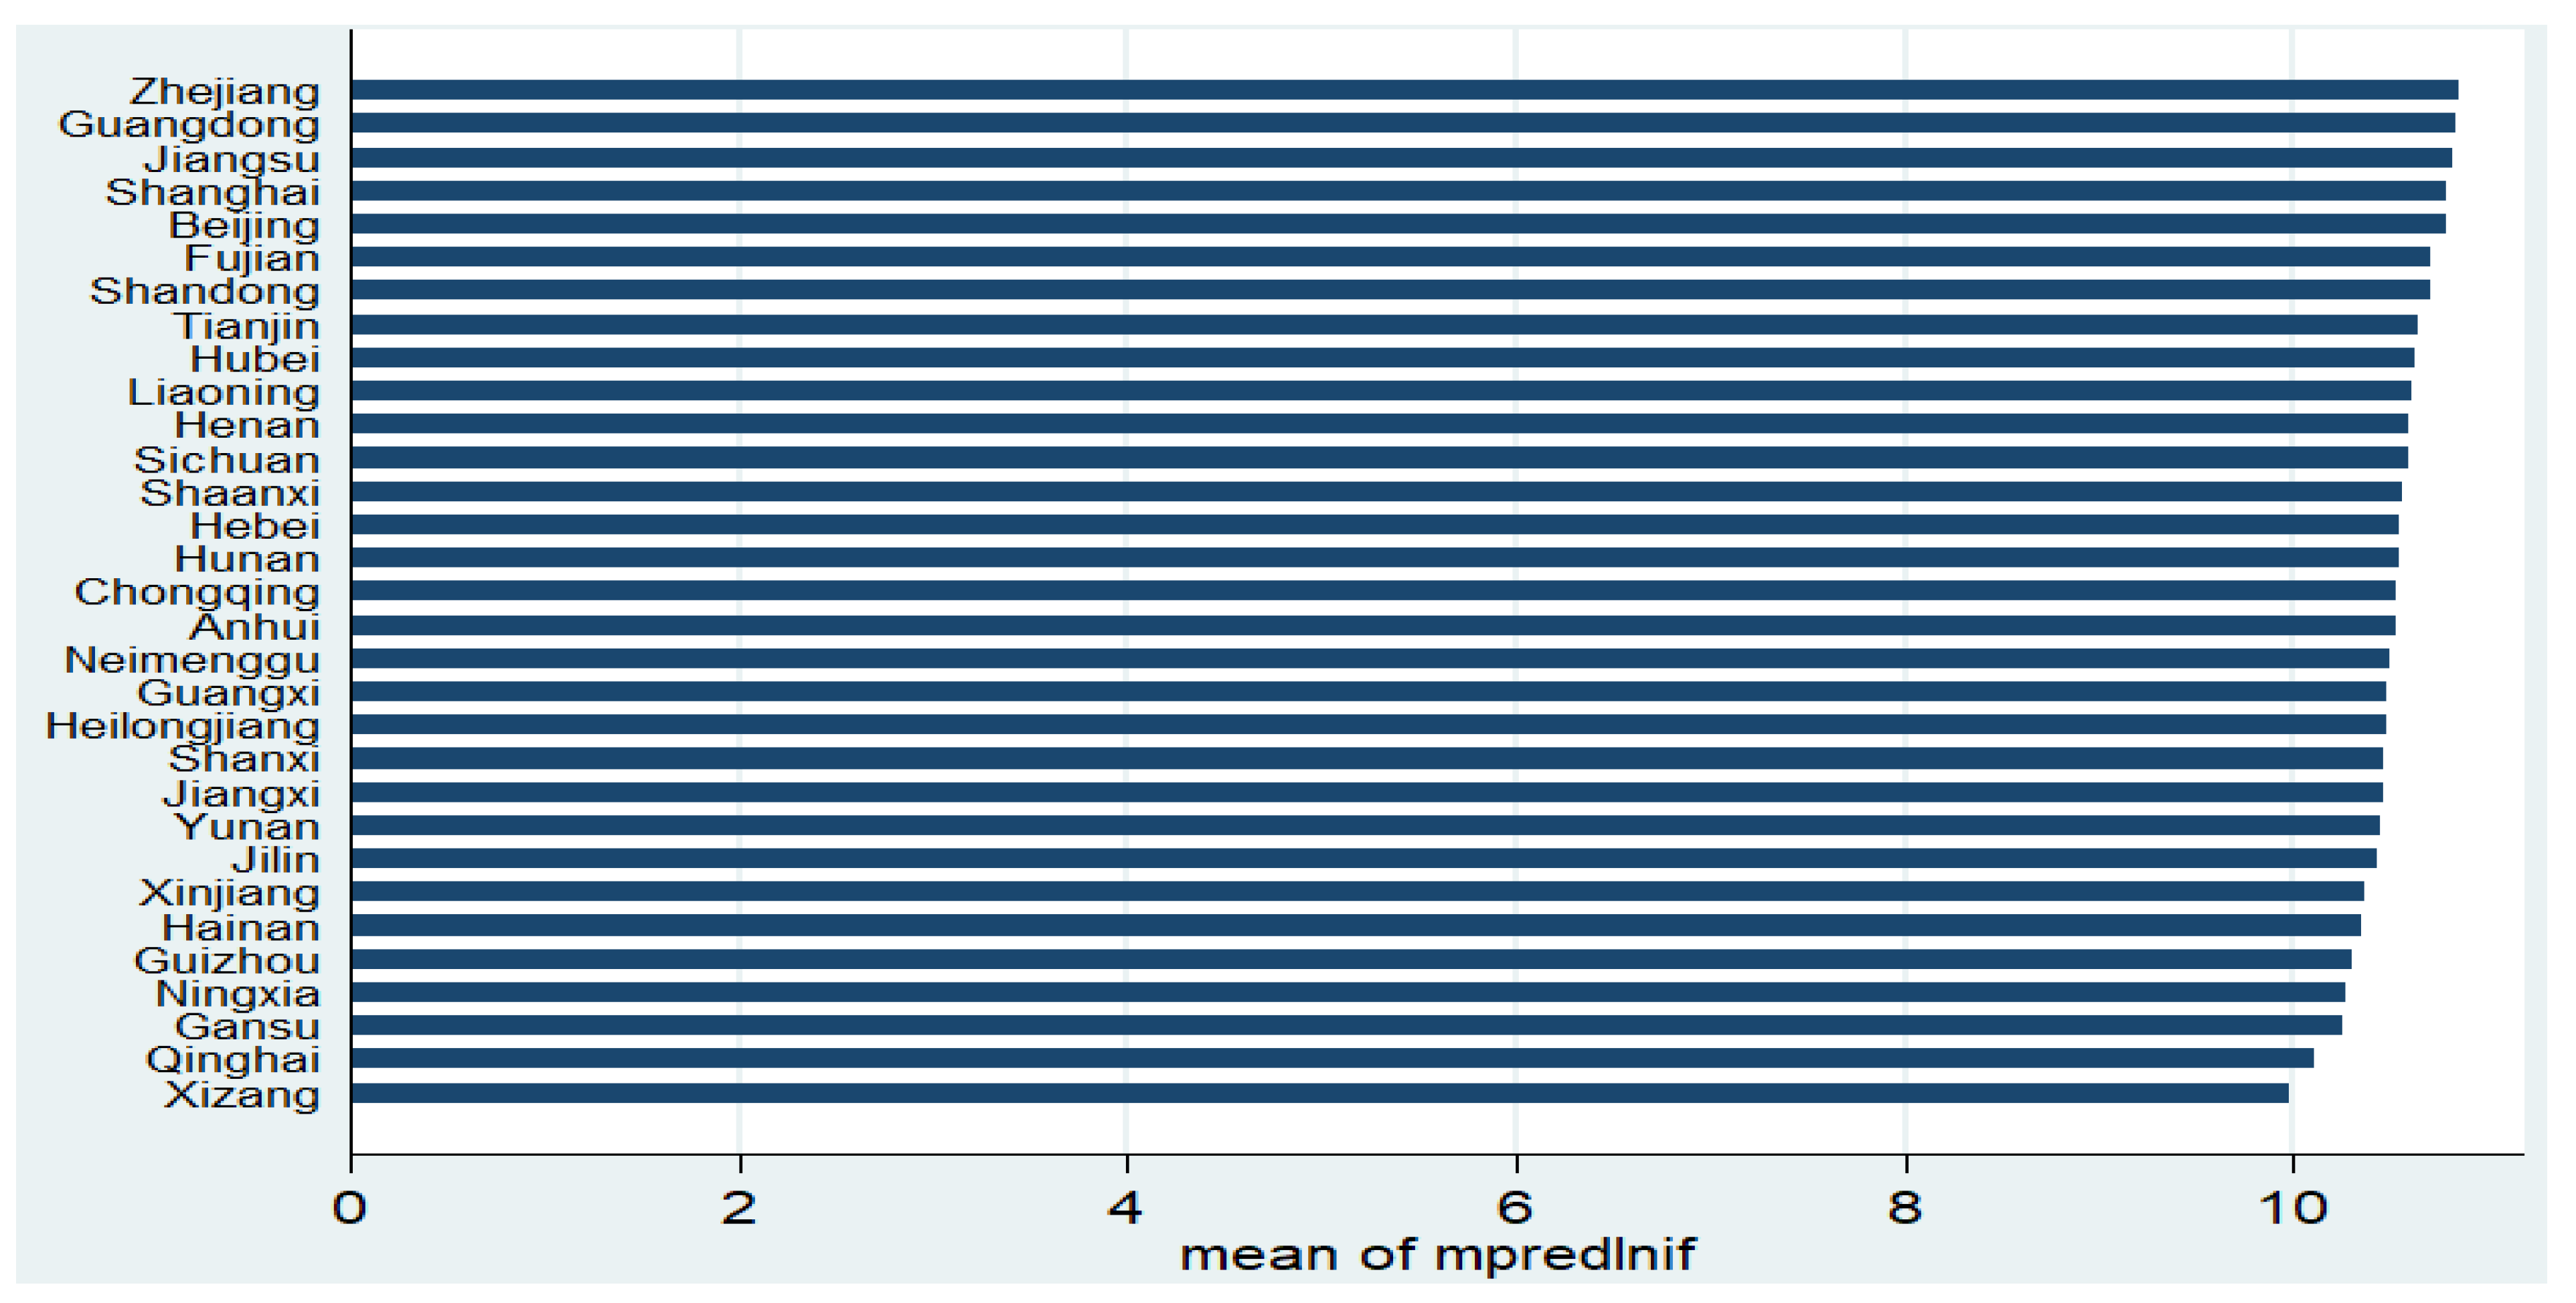
4.5.4. Province-Specific Effect of Fintech on Economic Growth
Figure 9 presents the province-specific effect of fintech on economic growth. The results demonstrate that the impact of fintech on economic growth is positive for all the provinces. The results further reveal that Zhejiang (10.8679), Guangdong (10.8553), Jiangsu (10.8356), Shanghai (10.8125), and Beijing (10.8082) have a high growth effect of fintech as compared with Guizhou (10.2709), Ningxia (10.2458), Gansu (10.2300), Qinghai (10.0824), and Xizang (9.9387), which have a relatively low growth effect. This collaborates with our H3. The reasons why Zhejiang, Guangdong, Jiangsu, Shanghai, and Beijing have the highest growth effect of fintech could be attributed to high levels of development and rapid information and communication technologies development. For instance, Alibaba’s head office is located in Hangzhou, which is in Zhejiang.
5. Conclusions and Policy Recommendations
The literature on fintech has received great attention among academicians and policymakers in recent times; however, studies assessing the contributions of fintech to economic growth are rare. Accordingly, this study contributes to the limited studies on fintech and economic growth by examining: (i) the effect of fintech on China’s economic growth, (ii) the regional and provincial effect of fintech on China’s economic growth, and (iii) the causality relationships between fintech and economic growth in China.
Using the IV–GMM technique, our findings indicated that: (i) Fintech, third-party payment, credit, and insurance are significant drivers of China’s economic growth. Specifically, a 10% rise in fintech, third-party payment, credit, and insurance raises China’s economic growth by 8%, 4%, 5%, and 16%, respectively. (ii) The eastern region has the highest growth effect of fintech. Moreover, Zhejiang province has the highest growth effect of fintech at the provincial level. (iii) A unidirectional causality exists from third-party payment and credit to economic growth, economic growth to insurance, and a bidirectional causality exists between fintech and economic growth.
The study’s conclusions have substantial practical consequences for Chinese policymakers. The findings indicate that fintech, as well as its submeasures of third-party payment, credit, and insurance, are key determinants of China’s economic growth. As a result, this study suggests that policymakers should encourage the growth of fintech in China. This article explicitly suggests substantial institutional reforms to promote the healthy development of fintech in China. Some of the reforms are: there should be restrictions on who to fund for a new project and the amount they fund because some projects fail; there should be a threshold on the amount of loans one can borrow from P2P platforms. Moreover, it was established that economic growth and labor explain fintech development; thus, this study suggests that policies that drive China’s economic growth and labor will drive fintech development. Furthermore, Guizhou, Ningxia, Gansu, Qinghai, and Xizang have a relatively low growth effect of fintech; thus, further development of fintech in these provinces is essential to enhance China’s economic growth.
This study has the following shortcomings that future studies can build upon: First, we focused on China, given data availability. However, fintech is a global phenomenon. Thus, future studies should employ more countries to examine the links between fintech and economic growth. Additionally, we examined the linear effect of fintech on economic growth. Thus, future studies should examine the nonlinear effect of fintech on economic growth. Moreover, we focused on aggregate economic growth; thus, future studies should explore the sectoral effect of fintech. Moreover, future studies should use change in economic growth as an alternative measure of economic growth to reassess these associations. Furthermore, given data management problems, we focused on fintech and the sumeasures of third-party payment, credit, and insurance. Thus, future studies should use alternative measures of fintech proxies such as the index of coverage breadth, credit investigation, monetary fund, investment, and the level of digitalization. Finally, due to the problem of multicollinearity, we considered fintech as the only influence factor of total factor productivity for the aggregate production function; thus, future studies should add more control variables by increasing the sample size.
Author Contributions
Conceptualization, N.S. and I.A.-O.; methodology, N.S. and I.A.-O.; software, N.S. and I.A.-O.; validation, N.S. and I.A.-O.; formal analysis, N.S. and I.A.-O.; investigation, N.S. and I.A.-O.; resources, N.S.; data curation, N.S. and I.A.-O.; writing—original draft preparation, N.S. and I.A.-O.; writing—review and editing, N.S. and I.A.-O.; visualization, N.S. and I.A.-O.; supervision, N.S.; project administration, N.S.; funding acquisition, N.S. All authors have read and agreed to the published version of the manuscript.
Funding
This research was funded by the Ministry of Education of Humanities and Social Science Grant of China (Grant Number: 17YJC790127).
Institutional Review Board Statement
Not applicable.
Informed Consent Statement
Not applicable.
Data Availability Statement
The data for this study are openly available at Feng. et. al [48] and the National Bureau of Statistics.
Conflicts of Interest
The authors declare no conflict of interest.
References
- Shim, Y.; Shin, D.-H. Analyzing China’s Fintech Industry from the Perspective of Actor—Network Theory. Telecomm. Policy 2016, 40, 168–181. [Google Scholar] [CrossRef]
- Xu, J. China’s Internet Finance: A Critical Review. China World Econ. 2017, 25, 78–92. [Google Scholar] [CrossRef]
- Appiah-Otoo, I.; Song, N. The impact of fintech on poverty reduction: Evidence from China. Sustainability 2021, 13, 5225. [Google Scholar] [CrossRef]
- Chen, T.; Chang, R. Using machine learning to evaluate the influence of FinTech patents: The case of Taiwan’ s financial industry. J. Comput. Appl. Math. 2021, 390, 113215. [Google Scholar] [CrossRef]
- Abbasi, K.; Alam, A.; Anna, M.; Luu, T.; Huynh, D. FinTech, SME efficiency and national culture: Evidence from OECD countries. Technol. Forecast. Soc. Change 2021, 163, 120454. [Google Scholar] [CrossRef]
- Guo, Y.; Zhou, W.; Luo, C.; Liu, C.; Xiong, H. Instance-based credit risk assessment for investment decisions in P2P lending. Eur. J. Oper. Res. 2016, 249, 417–426. [Google Scholar] [CrossRef]
- Odinet, C.K.; College, O. Consumer BitCredit and Fintech Lending. Ala. Law Rev. 2018, 69, 781–858. [Google Scholar]
- Abbasi, K.; Alam, A.; Noor, A.B.; Imtiaz, A.B.; Shahzad, N. P2P lending fintech’s and SME’s access to finance. Econ. Lett. 2021, 204, 109890. [Google Scholar] [CrossRef]
- Wei, S. Internet lending in China: Status quo, potential risks and regulatory options. Comput. Law Secur. Rev. Int. J. Technol. Law Pract. 2015, 31, 793–809. [Google Scholar] [CrossRef]
- Ding, C.; Kavuri, A.S.; Milne, A. Lessons from the rise and fall of Chinese peer-to-peer lending. J. Bank. Regul. 2021, 22, 133–143. [Google Scholar] [CrossRef]
- Zhongkai, T.; Hassan, A.F.S. Internet Finance and Its Potential Risks: The Case of China. Int. J. Account. Financ. Bus. 2019, 4, 45–51. [Google Scholar]
- Chen, R.; Yu, J.; Jin, C.; Bao, W. Internet finance investor sentiment and return comovement. Pacific Basin Financ. J. 2019, 56, 151–161. [Google Scholar] [CrossRef]
- Appiah-Otoo, I.; Song, N. The impact of ICT on economic growth-Comparing rich and poor countries. Telecomm. Policy 2021, 45, 102082. [Google Scholar] [CrossRef]
- Anyanwu, J.C. Factors Affecting Economic Growth in Africa: Are There any Lessons from China? Afr. Dev. Rev. 2014, 26, 468–493. [Google Scholar] [CrossRef]
- Asongu, S.A.; Odhiambo, N.M. Foreign direct investment, information technology and economic growth dynamics in Sub-Saharan Africa. Telecomm. Policy 2020, 44, 101838. [Google Scholar] [CrossRef]
- Maruta, A.A.; Banerjee, R.; Cavoli, T. Foreign aid, institutional quality and economic growth: Evidence from the developing world. Econ. Model. 2019, 89, 444–463. [Google Scholar] [CrossRef]
- Dai, X.; Sun, Z. Does firm innovation improve aggregate industry productivity? Evidence from Chinese manufacturing firms. Struct. Chang. Econ. Dyn. 2021, 56, 1–9. [Google Scholar] [CrossRef]
- Acheampong, A.O.; Adams, S.; Boateng, E. Do globalization and renewable energy contribute to carbon emissions mitigation in Sub-Saharan Africa? Sci. Total Environ. 2019, 677, 436–446. [Google Scholar] [CrossRef]
- Appiah-Otoo, I.; Song, N.; Acheampong, A.O.; Yao, X. Crowdfunding and renewable energy development: What does the data say? Int. J. Energy Res. 2022, 46, 1837–1852. [Google Scholar] [CrossRef]
- Hou, X.; Gao, Z.; Wang, Q. Internet finance development and banking market discipline: Evidence from China. J. Financ. Stab. 2016, 22, 88–100. [Google Scholar] [CrossRef]
- Guo, P.; Shen, Y. The impact of Internet finance on commercial banks’ risk taking: Evidence from China. China Financ. Econ. Rev. 2016, 4, 16. [Google Scholar] [CrossRef] [Green Version]
- Dong, J.; Yin, L.; Liu, X.; Hu, M.; Li, X. Impact of internet finance on the performance of commercial banks in China. Int. Rev. Financ. Anal. 2020, 72, 101579. [Google Scholar] [CrossRef]
- Meifang, Y.; He, D.; Xianrong, Z.; Xiaobo, X. Impact of payment technology innovations on the traditional financial industry: A focus on China. Technol. Forecast. Soc. Change 2018, 135, 199–207. [Google Scholar] [CrossRef]
- Zhang, X.; Zhang, J.; Wan, G.; Luo, Z. Fintech, Growth, and Inequality: Evidence from China’s Household Survey Data. Singap. Econ. Rev. 2020, 65, 75–93. [Google Scholar] [CrossRef]
- Wang, X.; He, G. Digital financial inclusion and farmers’ vulnerability to poverty: Evidence from rural China. Sustainability 2020, 12, 1668. [Google Scholar] [CrossRef] [Green Version]
- Zhang, X.; Tan, Y.; Hu, Z.; Wang, C.; Wan, G. The Trickle-down Effect of Fintech Development: From the Perspective of Urbanization. China World Econ. 2020, 28, 23–40. [Google Scholar] [CrossRef]
- Li, J.; Wu, Y.; Xiao, J.J. The impact of digital finance on household consumption: Evidence from China. Econ. Model. 2019, 86, 317–326. [Google Scholar] [CrossRef] [Green Version]
- Liu, T.; Pan, B.; Yin, Z. Pandemic, Mobile Payment, and Household Consumption: Micro-Evidence from China. Emerg. Mark. Financ. Trade 2020, 56, 2378–2389. [Google Scholar] [CrossRef]
- Yin, Z.; Gong, X.; Guo, P.; Wu, T. What Drives Entrepreneurship in Digital Economy? Evidence from China. Econ. Model. 2019, 82, 66–73. [Google Scholar] [CrossRef]
- Munyegera, G.K.; Matsumoto, T. Mobile Money, Remittances, and Household Welfare: Panel Evidence from Rural Uganda. World Dev. 2016, 79, 127–137. [Google Scholar] [CrossRef]
- Li, Y.; Jin, X.; Tian, W. Econometric analysis of disequilibrium relations between internet finance and real economy in China. Int. J. Comput. Intell. Syst. 2019, 12, 1454–1464. [Google Scholar] [CrossRef] [Green Version]
- Deng, X.; Huang, Z.; Cheng, X. FinTech and sustainable development: Evidence from China based on P2P data. Sustainability 2019, 11, 6434. [Google Scholar] [CrossRef] [Green Version]
- Ding, R.; Shi, F.; Hao, S. Digital Inclusive Finance, Environmental Regulation, and Regional Economic Growth: An Empirical Study Based on Spatial Spillover Effect and Panel Threshold Effect. Sustainability 2022, 14, 4340. [Google Scholar] [CrossRef]
- Liu, Y.; Luan, L.; Wu, W.; Zhang, Z.; Hsu, Y. Can digital financial inclusion promote China’s economic growth? Int. Rev. Financ. Anal. 2021, 78, 101889. [Google Scholar] [CrossRef]
- Ahmad, M.; Majeed, A.; Khan, M.A.; Sohaib, M.; Shehzad, K. Digital financial inclusion and economic growth: Provincial data analysis of China. China Econ. J. 2021, 14, 291–310. [Google Scholar] [CrossRef]
- Ye, B.; Yuan, J.; Guan, Y. Internet Finance, Financing of Small and Micro Enterprises and the Macroeconomy. Emerg. Mark. Financ. Trade 2022, 1–16. [Google Scholar] [CrossRef]
- Ang, J.B. A survey of recent developments in the literature of finance and growth. J. Econ. Surv. 2008, 22, 536–576. [Google Scholar] [CrossRef]
- Appiah-Otoo, I.; Song, N. Finance-growth nexus: New insight from Ghana. Int. J. Financ. Econ. 2020. [Google Scholar] [CrossRef]
- Sun, Y.; Liu, C. Research of Internet Finance Support for ‘Mass Entrepreneurship and Innovation’. Acad. Res. Int. 2016, 7, 168–174. [Google Scholar]
- Honglei, G. Internet Finance Innovation and Entrepreneurship Based on Classification Algorithm; Springer: Berlin/Heidelberg, Germany, 2021. [Google Scholar] [CrossRef]
- Shao, Z.; Zhang, L.; Li, X.; Guo, Y. Antecedents of trust and continuance intention in mobile payment platforms: The moderating effect of gender. Electron. Commer. Res. Appl. 2019, 33, 100823. [Google Scholar] [CrossRef]
- Fernandes, A.M.; Mattoo, A.; Nguyen, H.; Schiffbauer, M. The internet and Chinese exports in the pre-ali baba era. J. Dev. Econ. 2019, 138, 57–76. [Google Scholar] [CrossRef] [Green Version]
- Fu, J.; Liu, Y.; Chen, R.; Yu, X.; Tang, W. Trade openness, internet finance development and banking sector development in China. Econ. Model. 2020, 91, 670–678. [Google Scholar] [CrossRef]
- Wu, T.-P.; Wu, H.-C.; Liu, S.-B.; Hsueh, H.-P.; Wang, C.-M. Causality between peer-to-peer lending and bank lending in China: Evidence from a panel data approach. Singap. Econ. Rev. 2020, 65, 1537–1557. [Google Scholar] [CrossRef]
- Zhong, W.; Jiang, T. Can internet finance alleviate the exclusiveness of traditional finance? Evidence from Chinese P2P lending markets. Financ. Res. Lett. 2020, 40, 101731. [Google Scholar] [CrossRef]
- Peia, O.; Roszbach, K. Finance and growth: Time series evidence on causality. J. Financ. Stab. 2015, 19, 105–118. [Google Scholar] [CrossRef]
- Hook, S.; Singh, N. Does too much finance harm economic growth? J. Bank. Financ. 2014, 41, 36–44. [Google Scholar] [CrossRef] [Green Version]
- Feng, G.; Jingyi, W.; Zhiyun, C.; Yongguo, L.; Fang, W.; Aiyong, W. The Peking University Digital Financial Inclusion Index of China (2011–2018); Institute of Digital Finance at the Peking University: Beijing, China, 2019; pp. 1–72. [Google Scholar]
- Adeleye, N.; Eboagu, C. Evaluation of ICT development and economic growth in Africa. Netnomics Econ. Res. Electron. Netw. 2019, 20, 31–53. [Google Scholar] [CrossRef]
- Ordanini, A.; Miceli, L.; Pizzetti, M.; Parasuraman, A. Crowd-funding: Transforming customers into investors through innovative service platforms. J. Serv. Manag. 2011, 22, 443–470. [Google Scholar] [CrossRef]
- Laidroo, L.; Koroleva, E.; Kliber, A.; Rupeika-apoga, R. Business models of FinTechs—Difference in similarity? Electron. Commer. Res. Appl. 2021, 46, 101034. [Google Scholar] [CrossRef]
- Levin, A.; Lin, C.F.; Chu, C.S.J. Unit root tests in panel data: Asymptotic and finite-sample properties. J. Econom. 2002, 108, 1–24. [Google Scholar] [CrossRef]
- Solow, R.M. A contribution to the theory of economic growth. Q. J. Econ. 1956, 70, 65–94. [Google Scholar] [CrossRef]
- Peprah, J.A.; Ofori, I.K.; Asomani, A.N. Financial development, remittances and economic growth: A threshold analysis. Cogent. Econ. Financ. 2019, 7, 1625107. [Google Scholar] [CrossRef]
- Baum, C.F.; Schaffer, M.E.; Stillman, S. Instrumental variables and GMM: Estimation and testing. Stata J. 2003, 3, 1–31. [Google Scholar] [CrossRef] [Green Version]
- Dumitrescu, E.I.; Hurlin, C. Testing for Granger non-causality in heterogeneous panels. Econ. Model. 2012, 29, 1450–1460. [Google Scholar] [CrossRef] [Green Version]
- Sepehrdoust, H.; Ghorbanseresht, M. Impact of information and communication technology and financial development on economic growth of OPEC developing economies. Kasetsart J. Soc. Sci. 2019, 40, 546–551. [Google Scholar] [CrossRef]
- Haftu, G.G. Information communications technology and economic growth in Sub-Saharan Africa: A panel data approach. Telecomm. Policy 2019, 43, 88–99. [Google Scholar] [CrossRef]
Figure 1.
Correlation between third-party payment, credit, insurance, fintech, and economic growth.

Figure 2.
Third-party payment and economic growth.

Figure 3.
Credit and economic growth.

Figure 4.
Insurance and economic growth.

Figure 5.
Fintech and economic growth.

Figure 6.
Province-specific effect of third-party payment on economic growth.

Figure 7.
Province-specific effect of credit on economic growth.

Figure 8.
Province-specific effect of insurance on economic growth.

Figure 9.
Province-specific effect fintech on economic growth.


Table 1.
Variable definition.
| Variables | Code | Definition | Unit of Measurement |
|---|---|---|---|
| Economic growth | gdp | GDP per capita | Yuan |
| Fintech | if | Third-party payment, crowdfunding, P2P lending, insurance, blockchain, robotic investment advice, cryptocurrencies, and wealth management | Index |
| Third-party payment | tpp | Third-party payment denotes payment services offered on an unbiased payment platform other than banks that are connected to the bank payment and settlement systems of e-commerce firms and commercial banks [23] | Index |
| Credit | credit | In this study, credit is defined as crowdfunding. Crowdfunding is “a collective effort by consumers who network and pool their money together, usually via the Internet, to invest in and support efforts initiated by other people or organizations” [50] | Index |
| Internet insurance | insu | Internet insurance is the marriage of insurance services (brokerage and underwriting) and technology, and it is often termed as InsurTech [51] | Index |
| Labor force | l | Total employment | Yuan |
| Gross fixed capital formation | k | Investment | Yuan |
Table 2.
Descriptive statistics.
| Variables | Obs. | Mean | SD | Min | Max | LLC (0) | LLC (1) |
|---|---|---|---|---|---|---|---|
| lngdp | 217 | 10.740 | 0.463 | 9.706 | 13.405 | −9.585 *** | −11.700 *** |
| lnk | 217 | 9.126 | 0.797 | 6.305 | 10.556 | −7.449 *** | −7.849 *** |
| lnl | 217 | 6.008 | 0.897 | 3.149 | 7.587 | −12.261 *** | −70.036 *** |
| lntpp | 215 | 4.805 | 0.689 | 2.381 | 5.840 | −8.884 *** | −369.629 *** |
| lncredit | 217 | 4.547 | 0.662 | 0.148 | 5.446 | −29.353 *** | −28.144 *** |
| lninsu | 217 | 5.664 | 1.032 | −1.386 | 6.666 | −27.175 *** | −11.194 *** |
| lnif | 217 | 4.973 | 0.678 | 2.786 | 5.819 | −67.984 *** | −16.924 *** |
Note: *** p < 0.001.
Table 3.
Fintech and economic growth (full sample results).
| Variables | Model 1 | Model 2 | Model 3 | Model 4 | Model 5 | Model 6 | Model 7 | Model 8 | Model 9 | Model 10 | Model 11 | Model 12 |
|---|---|---|---|---|---|---|---|---|---|---|---|---|
| OLS | RE | IV-GMM | ||||||||||
| lnk | 0.120 | 0.116 | 0.153 | 0.084 | 0.253 ** | 0.300 ** | 0.381 *** | 0.177 | 0.123 | 0.079 | 0.256 ** | 0.102 |
| (0.110) | (0.109) | (0.109) | (0.109) | (0.110) | (0.123) | (0.092) | (0.143) | (0.124) | (0.122) | (0.113) | (0.115) | |
| lnl | 0.055 | 0.016 | 0.068 | 0.094 | 0.028 | 0.044 | −0.054 | 0.041 | 0.042 | −0.009 | −0.092 | 0.043 |
| (0.098) | (0.094) | (0.100) | (0.098) | (0.112) | (0.126) | (0.111) | (0.139) | (0.101) | (0.098) | (0.095) | (0.093) | |
| lntpp | 0.245 *** | 0.136 *** | 0.392 *** | |||||||||
| (0.037) | (0.020) | (0.074) | ||||||||||
| lncredit | 0.270 *** | 0.131 *** | 0.495 *** | |||||||||
| (0.066) | (0.043) | (0.091) | ||||||||||
| lninsu | 0.130 *** | 0.066 *** | 1.593 *** | |||||||||
| (0.022) | (0.011) | (0.351) | ||||||||||
| lnif | 0.260 *** | 0.165 *** | 0.792 *** | |||||||||
| (0.038) | (0.026) | (0.121) | ||||||||||
| Constant | 8.140 *** | 8.358 *** | 8.199 *** | 8.114 *** | 7.618 *** | 7.146 *** | 7.211 *** | 8.063 *** | 7.402 *** | 7.786 *** | −0.850 | 5.390 *** |
| (0.411) | (0.414) | (0.404) | (0.387) | (0.508) | (0.484) | (0.390) | (0.492) | (0.547) | (0.542) | (2.118) | (0.613) | |
| R2 | 0.290 | 0.294 | 0.266 | 0.313 | 0.303 | 0.294 | 0.251 | 0.399 | ||||
| R2_w | 0.417 | 0.414 | 0.411 | 0.432 | ||||||||
| R2_o | 0.255 | 0.244 | 0.234 | 0.297 | ||||||||
| R2_b | 0.220 | 0.216 | 0.196 | 0.265 | ||||||||
| Rho | 0.778 | 0.807 | 0.780 | 0.480 | ||||||||
| RMSE | 0.391 | 0.391 | 0.399 | 0.386 | 0.175 | 0.175 | 0.177 | 0.205 | 0.334 | 0.337 | 0.347 | 0.311 |
| F | 43.986 | 33.284 | 50.927 | 54.836 | 32.125 | 21.915 | 27.344 | 43.887 | ||||
| J | 0.024 | 0.016 | 3.375 | 25.005 | ||||||||
| JP | 0.876 | 0.900 | 0.066 | 0.000 | ||||||||
| VIF | 4.49 | 4.88 | 4.78 | 4.92 |
Notes: ( ) = Robust standard errors, J = Hansen J-statistics, JP = Hansen J-statistics p-value, F = F-statistics, RMSE = roots mean square error, VIF = variance inflation factor. ** p < 0.05, and *** p < 0.01.
Table 4.
Fintech and economic growth (regional sample results).
| Variables | Model 1 | Model 2 | Model 3 | Model 4 | Model 5 | Model 6 | Model 7 | Model 8 | Model 9 | Model 10 | Model 11 | Model 12 |
|---|---|---|---|---|---|---|---|---|---|---|---|---|
| Eastern Region | Central Region | Western Region | ||||||||||
| lnk | −0.215 | −0.151 | 0.079 | −0.254 * | 0.627 *** | 0.636 *** | 0.688 *** | 0.615 *** | 0.386 *** | 0.330 *** | 0.332 ** | 0.351 *** |
| (0.152) | (0.158) | (0.178) | (0.140) | (0.048) | (0.050) | (0.061) | (0.047) | (0.100) | (0.106) | (0.142) | (0.107) | |
| lnl | 0.337 ** | 0.196 | 0.088 | 0.381 *** | −0.725 *** | −0.726 *** | −0.761 *** | −0.707 *** | −0.275 *** | −0.263 *** | −0.238 ** | −0.257 *** |
| (0.158) | (0.166) | (0.174) | (0.147) | (0.042) | (0.047) | (0.058) | (0.042) | (0.070) | (0.072) | (0.100) | (0.076) | |
| lntpp | 0.492 *** | 0.123 *** | 0.116 | |||||||||
| (0.104) | (0.031) | (0.078) | ||||||||||
| lncredit | 0.843 *** | 0.134 *** | 0.173 ** | |||||||||
| (0.167) | (0.040) | (0.069) | ||||||||||
| lninsu | 1.592 *** | 0.477 * | 0.738 | |||||||||
| (0.502) | (0.248) | (0.537) | ||||||||||
| lnif | 0.941 *** | 0.188 *** | 0.309 ** | |||||||||
| (0.178) | (0.061) | (0.140) | ||||||||||
| Constant | 8.384 *** | 7.109 *** | −0.211 | 5.958 *** | 8.665 *** | 8.585 *** | 6.017 *** | 8.298 *** | 8.085 *** | 8.312 *** | 4.414 | 7.244 *** |
| (0.717) | (0.926) | (3.487) | (1.071) | (0.317) | (0.337) | (1.650) | (0.373) | (0.524) | (0.439) | (2.788) | (0.614) | |
| R2 | 0.362 | 0.321 | 0.270 | 0.426 | 0.824 | 0.812 | 0.760 | 0.831 | 0.304 | 0.342 | 0.314 | 0.388 |
| RMSE | 0.311 | 0.321 | 0.333 | 0.295 | 0.092 | 0.096 | 0.108 | 0.091 | 0.205 | 0.200 | 0.204 | 0.192 |
| F | 11.488 | 13.486 | 6.751 | 16.855 | 99.807 | 75.986 | 55.069 | 94.256 | 9.038 | 11.389 | 8.589 | 10.747 |
| J | 1.238 | 0.024 | 6.496 | 11.614 | 1.541 | 0.012 | 3.461 | 3.866 | 0.465 | 0.016 | 0.006 | 1.352 |
| JP | 0.266 | 0.877 | 0.011 | 0.001 | 0.214 | 0.914 | 0.063 | 0.049 | 0.495 | 0.899 | 0.939 | 0.245 |
Notes: ( ) = robust standard errors, J = Hansen J-statistics, JP = Hansen J-statistics p-value, F = F-statistics, RMSE = roots mean square error, * p < 0.1, ** p < 0.05, and *** p < 0.01.
Table 5.
Fintech and labor productivity.
| Variables | Model 1 | Model 2 | Model 3 | Model 4 | Model 5 | Model 6 | Model 7 | Model 8 | Model 9 | Model 10 | Model 11 | Model 12 |
|---|---|---|---|---|---|---|---|---|---|---|---|---|
| OLS | RE | IV-GMM | ||||||||||
| lnk | 0.029 | 0.020 | 0.027 | 0.014 | 0.040 * | 0.040 * | 0.053 *** | 0.026 | 0.031 | 0.017 | 0.050 * | 0.021 |
| (0.022) | (0.024) | (0.024) | (0.023) | (0.022) | (0.024) | (0.019) | (0.021) | (0.026) | (0.027) | (0.027) | (0.027) | |
| lnl | −0.377 *** | −0.384 *** | −0.373 *** | −0.369 *** | −0.312 *** | −0.297 *** | −0.332 *** | −0.330 *** | −0.372 *** | −0.381 *** | −0.399 *** | −0.372 *** |
| (0.020) | (0.020) | (0.021) | (0.020) | (0.046) | (0.048) | (0.049) | (0.045) | (0.022) | (0.021) | (0.023) | (0.021) | |
| lntpp | 0.051 *** | 0.023 *** | 0.081 *** | |||||||||
| (0.011) | (0.004) | (0.019) | ||||||||||
| lncredit | 0.055 *** | 0.023 *** | 0.086 *** | |||||||||
| (0.016) | (0.007) | (0.026) | ||||||||||
| lninsu | 0.027 *** | 0.014 *** | 0.324 *** | |||||||||
| (0.007) | (0.003) | (0.102) | ||||||||||
| lnif | 0.052 *** | 0.028 *** | 0.137 *** | |||||||||
| (0.012) | (0.004) | (0.037) | ||||||||||
| Constant | 3.584 *** | 3.714 *** | 3.679 *** | 3.665 *** | 3.237 *** | 3.149 *** | 3.265 *** | 3.440 *** | 3.378 *** | 3.574 *** | 1.788 *** | 3.160 *** |
| (0.144) | (0.147) | (0.145) | (0.152) | (0.260) | (0.312) | (0.317) | (0.291) | (0.177) | (0.191) | (0.659) | (0.245) | |
| R2 | 0.897 | 0.900 | 0.898 | 0.901 | 0.909 | 0.910 | 0.909 | 0.915 | ||||
| R2_w | 0.294 | 0.320 | 0.288 | 0.295 | ||||||||
| R2_o | 0.895 | 0.898 | 0.896 | 0.900 | ||||||||
| R2_b | 0.906 | 0.905 | 0.903 | 0.906 | ||||||||
| Rho | 0.925 | 0.932 | 0.931 | 0.903 | ||||||||
| RMSE | 0.103 | 0.106 | 0.107 | 0.105 | 0.029 | 0.030 | 0.030 | 0.030 | 0.094 | 0.098 | 0.099 | 0.096 |
| F | 247.071 | 268.224 | 256.077 | 280.100 | 192.891 | 225.434 | 230.168 | 229.000 | ||||
| J | 1.766 | 0.013 | 0.050 | 7.066 | ||||||||
| JP | 0.184 | 0.908 | 0.824 | 0.008 | ||||||||
| VIF | 4.49 | 4.88 | 4.78 | 4.92 |
Notes: ( ) = robust standard errors, J = Hansen J-statistics, JP = Hansen J-statistics p-value, F = F-statistics, RMSE = roots mean square error, VIF = variance Inflation Factor. * p < 0.1, and *** p < 0.01.
Publisher’s Note: MDPI stays neutral with regard to jurisdictional claims in published maps and institutional affiliations. |
© 2022 by the authors. Licensee MDPI, Basel, Switzerland. This article is an open access article distributed under the terms and conditions of the Creative Commons Attribution (CC BY) license (https://creativecommons.org/licenses/by/4.0/).
Share and Cite
MDPI and ACS Style
Song, N.; Appiah-Otoo, I. The Impact of Fintech on Economic Growth: Evidence from China. Sustainability 2022, 14, 6211. https://0-doi-org.brum.beds.ac.uk/10.3390/su14106211
AMA Style
Song N, Appiah-Otoo I. The Impact of Fintech on Economic Growth: Evidence from China. Sustainability. 2022; 14(10):6211. https://0-doi-org.brum.beds.ac.uk/10.3390/su14106211
Chicago/Turabian StyleSong, Na, and Isaac Appiah-Otoo. 2022. "The Impact of Fintech on Economic Growth: Evidence from China" Sustainability 14, no. 10: 6211. https://0-doi-org.brum.beds.ac.uk/10.3390/su14106211
Note that from the first issue of 2016, this journal uses article numbers instead of page numbers. See further details here.