Article

An Experimental Study on Geotechnical Properties and Micro-Structure of Expansive Soil Stabilized with Waste Granite Dust

by
Hassan A. M. Abdelkader
1,2,
Abdelaal S. A. Ahmed
3,
Mohamed M. A. Hussein
4,
Haiwang Ye
1,* and
Jianhua Zhang
1
1
School of Resources and Environmental Engineering, Wuhan University of Technology, Wuhan 430070, China
2
Mining and Petroleum Department, Faculty of Engineering, Al-Azhar University, Qena 83513, Egypt
3
Chemistry Department, Faculty of Science, Al-Azhar University, Assiut 71524, Egypt
4
Civil Engineering Department, Faculty of Engineering, Sohag University, Sohag 82524, Egypt
*
Author to whom correspondence should be addressed.
Sustainability 2022, 14(10), 6218; https://0-doi-org.brum.beds.ac.uk/10.3390/su14106218
Submission received: 30 March 2022 / Revised: 12 May 2022 / Accepted: 16 May 2022 / Published: 20 May 2022
(This article belongs to the Section Waste and Recycling)

Abstract

:
Mining industries around the world produce massive amounts of solid waste that has potential environmental impacts. Therefore, it is necessary to explore alternative solutions to this waste disposal problem and to obtain economic benefits from it. Up to now, no significant attempts have been made to use granite dust (GD) as a soil stabilizer. GD is a by-product produced in large amounts during the cutting and processing of granite rocks at manufacturing factories. Thus, an attempt has been made here to define the role of GD in enhancing the geotechnical behaviour of expansive soil in order to make it suitable for construction. Moreover, the aim of this study is to evaluate the micro-level alterations occurring in the soil to elucidate the stabilization mechanism of granite dust–soil interaction. Comprehensive geotechnical tests, such as Atterberg limits, compaction characteristics, unconfined compressive strength (UCS), California bearing ratio (CBR), and swelling percentage, as well as microstructural analysis, such as X-ray diffraction, scanning electron microscopy, energy, and Fourier transform infrared, have been performed on natural and stabilized expansive soils using different portions of GD ranges from 0% to 30% with an increment of 5%. The results showed that the GD can be effectively used to improve soil plasticity and to control the swelling behaviour. Additionally, the results indicated that both UCS and CBR increase with increasing the content of GD, and that this increase reaches the maximum value at 20% of GD, after which it decreases. Hence, this amount can be taken as the optimum value of GD. The micro-analyses confirmed that the apparent formation of some new peaks, changes in the soil morphology, and alterations in the parent elements are the major factors in controlling the interactive behaviour of soil-GD mixes.

1. Introduction

Expansive soil (ES) is soil that exhibits significant volume change owing to changes in moisture content. It swells significantly with the increase in moisture content and shrinks as the moisture content decreases. The swelling behaviour is caused by highly reactive clay minerals, such as montmorillonite (smectite-group minerals) or some types of illites. Severe damage occurs to buildings, roads, linings, canal beds, and other structures because of this type of behaviour. The previous research estimated that the cost of damage due to ES is much higher than the damage that is caused by earthquakes, tornadoes, hurricanes, and floods combined [1,2,3,4,5]. ES can be improved in a variety of ways, including boosting shear strength, and by minimizing swelling and shrinkage characteristics. Stabilizing ES with waste materials is a common method for improving expansive soil’s engineering properties. Solid wastes are typically generated as a result of industrial activity and have a detrimental influence on the environment [6,7,8]. During the last decades, great efforts have been devoted to stabilizing expansive soil by utilizing various industrial solid wastes [9,10,11,12,13,14,15,16,17]. Some of the solid waste materials that have been used for the improvement of problematic soils are suitable for use as construction materials, especially for road construction, embankments, earth dams, etc. [18,19,20]. Various researchers have used fly ash, lime, cement, and others as admixtures to improve the engineering properties of ES [21,22,23,24]. These agent additives are usually manufactured, and they improve the properties of various soils when added in the right amounts. However, using some of these stabilizers may have a negative impact on the environment, particularly during the production of these materials [25,26,27,28,29]. Thus, it is essential to use a material that is less harmful to the environment as a stabilizer.
Egypt produces over 50 different kinds of marble and granite, and ranks as the seventh country in the world in terms of volume after China, India, Italy, Spain, Turkey, and Brazil [30]. Figure 1 shows the marble and granite quarries and factories found in different locations all over the country [31]. After mining in the quarries, processing operations, such as sawing and polishing, are performed for the preparation of tiles and slabs for use in decorative purposes [32].
The Shaq El-Thouban region is considered the largest marble and granite industrial cluster in Egypt, as well as world’s fourth largest industrial zone. This area has the highest concentration of marble and granite factories in Egypt with 400 factories, constituting 70% of marble factories in the entire country [33,34,35,36]. Quarrymen first occupied this area in Katameya’s hills and mountains. Over time, interested investors were given approximately 10,000 m2 of land on which to establish their stone factories. Quarrymen who started out in the limestone hills eventually switched to marble and granite, which proved to be more profitable. Meanwhile, the amount of waste from the cutting and processing industry has also increased. Generally, there is waste connected with various phases of the extraction procedures and handling operations. Water is used in these operations to cool the blades and absorb the dust produced during the cutting operation. The dust streams with the water, resulting in aqueous sludge or slurry. The present common practice is that, after separation from water in open ponds or filter presses, these particles are collected and disposed in landfill places under poorly controlled conditions [37,38].
The scale of the stone industry has brought about major environmental concerns worldwide, due to waste generation at various stages of mining and processing operations [39]. In China, over 10 million tons of granite sludge are generated every year, while approximately 1 million tons of slurry is accumulated each year in Portugal [40,41]. The total amount of waste produced by the Brazilian decorative stone industry, from quarrying to manufacturing, can easily reach 40% of the total extracted volume, while the total waste produced during the sizing and polishing processes can easily reach 20–25% of the total block volume [42]. In Iran, about 50% of granite blocks become dust during the extraction, cutting, and polishing process [43]. According to El-Haggar [44], the total wastes produced from the mining to finishing of marble is 50–60% of the rock. In Egypt, based on the lowest estimates of waste percentage, it can be estimated that the Shaq Al-Thouban industrial cluster produces about 800,000 tons of waste each year [45].
Releasing these ornamental waste materials directly into the environment can cause economic and environmental harm. Therefore, recycling this waste has become a research topic to eliminate its negative environmental effects and contribute to the economy. Additionally, recycling ornamental waste will keep these wastes from ending up in landfills and consuming landfill space [46]. Several countries are developing ways to reuse the ornamental waste in different applications, such as in bricks, concrete aggregates and mixtures, building materials, clay products, and tiles [47,48,49,50,51,52].
Many researchers have recently concentrated on employing decorative waste materials to stabilize expansive soil. Sreekumar and Mary [53] observed an enhancement in the strength of expansive clay treated with marble dust (MD), whereas Parte and Yadav [54] and Abdulla and Majeed [55] proved a decrease in Atterberg’s limit and swelling with the addition of marble dust to a clay sample. Similar results have been observed by Oncu and Bilsel [56], Sabat and Nanda [57], Agrawal and Gupta [58], and Çimen et al. [59] when the expansive clay was improved by the marble dust. Furthermore, Saygili [60] reported that adding marble dust for stabilizing clayey soil has the benefit of decreasing the swell potential and enhancing the strength. Jain et al. [61] studied the influence of various percentages of marble dust (5% to 80% from the dry weight of soil) on the behaviour of black cotton soil. According to the test results, the optimum moisture content (OMC) and maximum dry density (MDD) of ES-MD mixtures decreased and increased, respectively. Additionally, the UCS increased up to the addition of 20% of MD, after which it decreased. Furthermore, the plasticity index (PI) and free swelling (FS) decrease with the increase of MD content. Abdelkader et al. [30] investigated the effect of marble waste, which was assembled from the Shaq Al-Thouban region of Egypt, on improving the geotechnical properties of expansive clay soil, and they concluded that employing marble waste to create a low-cost and stronger soil layer can assist civil engineers in ensuring the economy of infrastructure projects and addressing environmental deterioration. Sivrikaya et al. [62] found a reduction in the PI and an increment in the MDD when marble and granite powder were amended with clayey soil samples. Furthermore, Anupama et al. [63], Igwe and Adepehin [64], and Preethi et al. [65] pointed out an enhancement in the mechanical properties of expansive clay when granite waste was added. Moreover, Igwe and Illoabachie [66] reported that granite dust is cheap and widely available and, hence, can be used in large quantities to improve soils.
According to the above literature, limited studies have been conducted on the use of granite waste to stabilize ES for sustainable and eco-friendly construction. In this work, the focus is placed on investigating the possibility of using GD to improve the behaviour of ES and to elucidate the stabilization mechanism by performing detailed micro-analyses. The behaviour of ES/GD mixtures is examined in terms of the plasticity, compaction parameters, unconfined compressive strength (UCS), California bearing ratio (CBR), swelling potential, and linear shrinkage. The micro-level changes, which are responsible for alterations in the behaviour of ES mixed with GD, are investigated by applying X-ray diffraction (XRD), scanning electron microscopy (SEM), energy dispersive X-ray spectroscopy (EDAX), and Fourier transform infrared spectroscopy (FTIR) tests.

2. Material

2.1. Expansive Soil

The ES sample used in the present work is obtained from the village of El-Salheya, Qena, Egypt (latitude 26°07′11″ N and longitude 32°54′17″ E). The soil is collected by the open excavation method from a depth of 2.5 m below the ground surface. The particle size distribution of ES shows 37.12% clay, 59.88% silt, and 3% sand, as shown in Table 1. The liquid limit was 51.94% and its plasticity index was equal to 21.44%. The compaction characteristics show that the MDU and OMC are 18.05 kN/m3 and 15.80%, respectively. The XRD of the ES, as shown in Figure 2a, confirmed the presence of montmorillonite and quartz. The microstructural examination (Figure 3a) of ES illustrates the presence of several void spaces between particles, whereas the EDAX analysis shows the presence of a predominant amount of aluminium (Al) and silica (Si), with a small amount of magnesium (Mg) and calcium (Ca) (Figure 3b). The FTIR spectrum of the ES in the infrared region (IR) (400 to 4000 cm−1) is presented in Figure 4a. The hydroxyl group of montmorillonites have been observed in the IR band of 3616 cm−1. The band at 1634 cm−1 is assigned to the OH deformation mode of water. A peak near 1007 cm−1 is assigned to Si-O stretching, which confirms the existence of some kaolinite. Furthermore, the presence of quartz was indicated by the peaks at 433, 512, 785, and 1100 cm−1. The assignments were performed according to the published literature [67,68,69,70,71].

2.2. Granite Dust (GD)

GD was obtained from the Shaq Al-Thouban district in South Cairo, Egypt. The GD was dried in an oven at 110 °C for 24 h to remove moisture, then pulverised repeatedly with a plastic hammer to remove any agglomeration. The particle size analysis of GD shows 8% clay, 33% silt, and 59% sand, as shown in Table 1. The liquid limit was 19.11% and the specific gravity was equal to 2.79. The compaction characteristics of GD show that the MDU and OMC are 19.7 kN/m3 and 10.3%, respectively. The XRD study of the GD showed the presence of albite and quartz as the predominant minerals (Figure 2b). The SEM image indicated that the granite particles have irregular shapes of different sizes (Figure 3c), whereas the EDAX analysis shows the presence of Si and Al with high ratios of 17.46% and 8.33%, respectively, and with minor contents of Na and Ca (Figure 3d). Figure 4b exhibits the FTIR spectrum of GD. The assignments were performed according to Aroke et al. [72] and Medina et al. [73]. The peak at 1030.5 cm−1 can be attributed to characteristic bands of silicates, which are mostly related to stretching vibrations of Al-O or Si-O. Further, the peaks at 3400 and 3680 cm−1 are due to OH bond stretching for Si-OH and Al-OH. The bands at 949 and 690 cm−1, respectively, are an indication of the presence of quartz, and the band at 430 cm−1 was assigned to orthoclase and albite.

3. Methodology

GD was added to the expansive soil with various contents (5%, 10%, 15%, 20%, 25% and 30%) by the dry weight of the soil. Several laboratory tests were conducted on treated expansive soil (TES) and untreated expansive soil (UES) specimens to fulfil the goal of the study. Sieve analysis and specific gravity were carried out with ASTM D6913 (2017) and ASTM-D854 (2014) respectively [74,75]. The procedure of ASTM D4318 (2017) [76] was used for LL, PL, and PI, while BS 1377-2 (1990) [77] was used for linear shrinkage (LS). The OMC and MDU values of all the samples are determined as per ASTM D698 (2003) [78]. The standard compaction apparatus consists of a mould (10.16 cm in internal diameter and 11.64 cm in height) with a falling hammer having a weight of 2.44 kg, employing of 25 blows/layer in three layers. According to ASTM-D2166 (2003) [79], the UCS samples were tested. Initially, the mixtures were compacted in a standard Proctor mould at their optimum moisture content. The compacted samples were extracted from the mould by using a sample extractor. Then, the specimens of 38 mm diameter and 76 mm height used for the test were extruded with the help of a cutting ring. The specimens are placed in air–tight desiccators by wrapping in polyethylene bags, and were cured for 7, 14, and 28 days at laboratory conditions of (22 ± 5) °C before conducting the tests. The strain rate during UCS testes was 1 mm/min. CBR tests were performed on soaking specimens prepared at OMC and MDU according to ASTM D1883 (2016) [80]. The samples were cured for 7 days in the same conditions as in specimens for the UC test, and were submerged for 96 h in water before testing to simulate the worst possible condition on the field. The compacted specimen was then placed under the CBR machine and a load was applied at a penetration rate of 1.27 mm/min. The CBR value was obtained by dividing the test load by a standard load at the same depth of penetration. The swelling percent test was carried out according to ASTM D-2435 (2003) [81], where a consolidation ring was used to prepare the specimens (58 mm diameter and 20 mm height) at the MDU and OMC. After 7 days of curing time, the specimen was flooded with water and allowed to swell under a constant surcharge pressure of 6.89 KN/m2. Dial gauge readings were recorded at 0, 0.25, 0.5, 1, 2, 4, 8, 15, 30, 60, 120, and 1440 min. The measurement of the expansion of the specimens continued until equilibrium was reached. The swell percent was then calculated as the increase in sample height (Δh) divided by the original height (H).
To investigate the mechanism of variations in the behaviour of the ES altered with GD, the microstructure behaviour of samples was monitored using the XRD, SEM, EDAX, and FTIR tests. An XRD test was performed to identify the mineralogical changes that occurred in the soil after stabilization. Following the UCS tests, the samples were dried in an oven and subsequently powdered and sieved through a 0.075 mm sieve. XRD analysis was performed with a Bruker D8 advanced model diffractometer (Cu-ka radiation) at a scanning speed of 2°/min with a scanning step of 0.02°. The microstructures and chemical compositions of the specimens were determined using a SEM-EDS analysis. The specimens chosen for SEM analysis were first lyophilized for 24 h in an Alpha 1–4 LD plus freeze dryer, then broken into small pieces and cleaned with a hairbrush. The specimens were then gold-coated to achieve sufficient electrical conductivity. Finally, a Quanta FEG-250 with an EDAX technique is used to identify the morphology of ES and TES. FTIR analysis is used to detect functional groups in soil specimens by absorbing wavelengths that vibrate independently. For FTIR analysis, the ALPHA platinum-ATR Bruker apparatus is used. For the analysis, 2 mg of dry soil specimen passing through the 75 sieve is taken and pressed on the ATR (attenuated total reflection) crystal, which is used to measure the interface. The ATR crystal’s infrared radiation penetrates the soil surface slightly. The absorbance produced by the specimen is then measured by the IR detector in the FTIR machine.

4. Experimental Results and Discussion

4.1. Influence of GD on Atterberg’s Limits

To demonstrate the influence of GD content on the plasticity characteristics of ES, Atterberg’s limits, that is, liquid limit (LL), plastic limit (PL), and plasticity index (PI), were determined. Figure 5 depicts the test results for ES and TES.
The addition of GD from 0% to 30% causes a decrease in the capability of water absorption, which can be seen with the deduction of LL, PL, and PI. The value of the LL was reduced by 42.35%, the value of the PL was reduced by 29.2%, and the value of the PI was reduced by 66.2% when GD was added to the ES sample from 0% to 30%. Furthermore, it is clear that the rate of decline for Atterberg’s limits is higher until the percentage of added GD reaches 20%; after that, the rate is low. The fall in the degree of TES’s potential expansiveness is due to the reduction in LL. This is due to the GD particles’ non-plastic nature, which dominates a portion of plastic soil and causes a reduction in water absorption. These results agree with the results of the study of Igwe [66] that LL and PI were decreased by 34% and 43%, respectively, with the addition of GD to 20%. Additionally, the results agree with the outcomes of the study of Shah et al. [82] that LL and PI were reduced by 58.6% and 51%, respectively, with the addition of GD by 25% to the soil sample.
Figure 6 illustrates the positions of ES and TES on the plasticity chart based on their liquid limit and plasticity index. The increase in the GD content shifts plain soil from high-plasticity silt into low-plasticity clay according to the unified soil classification system (USCS). This result is consistent with the findings of a study conducted by [7].

4.2. Influence of GD on Compaction Parameters

The standard compaction tests were carried out to find the OMC and MDU for ES and TES with various GD contents (5%, 10%, 15%, 20%, 25%, and 30%). Figure 7 displays the outcomes of these tests. It can be seen that the Proctor compaction curves shifted upwards and towards the left with increasing GD content.
Figure 8 explains the variation of MDU with GD contents. According to the results, the MDU enhances from 18.05 kN/m3 to 19.4 kN/m3 as the percentage of GD increases up to 20%; after that point, it decreases with the addition of GD to the ES by 25% and 30%. The increase in MDU is due to the replacement of light soil particles (specific gravity, 2.67) by comparatively heavy particles of GD, which have a high specific gravity value (2.79). Additionally, the GD improves the resistance to compaction effort and, hence, increases MDU due to the significant improvement in the particle size distribution of ES. However, Igwe and Adepehin [64] concluded that the pozzolanic reaction and formation of the lime-like product [Ca(OH)2], which dissociates into Ca2+ and OH ions, is responsible for the increase in the MDU of mixed soil with GD. The observed fall in MDU after 20% GD content may be due to an excessive concentration of coarser granite particles, which is not mobilized in reaction and instead replace the fine clay with coarser particles, ultimately reducing the density of soil-GD mixtures.
Figure 9 shows a relation between OMC and the additional content of GD to the ES. The OMC value for the ES was 15.8%. As the percentage of GD increased from 0 to 30%, the OMC was gradually decreased to 12%. This reduction is due to the replacement of the fine particles in the ES with coarse particles of GD, which has a lower ability to absorb water compared to the ES. These results are compatible with studies [65,66,82].

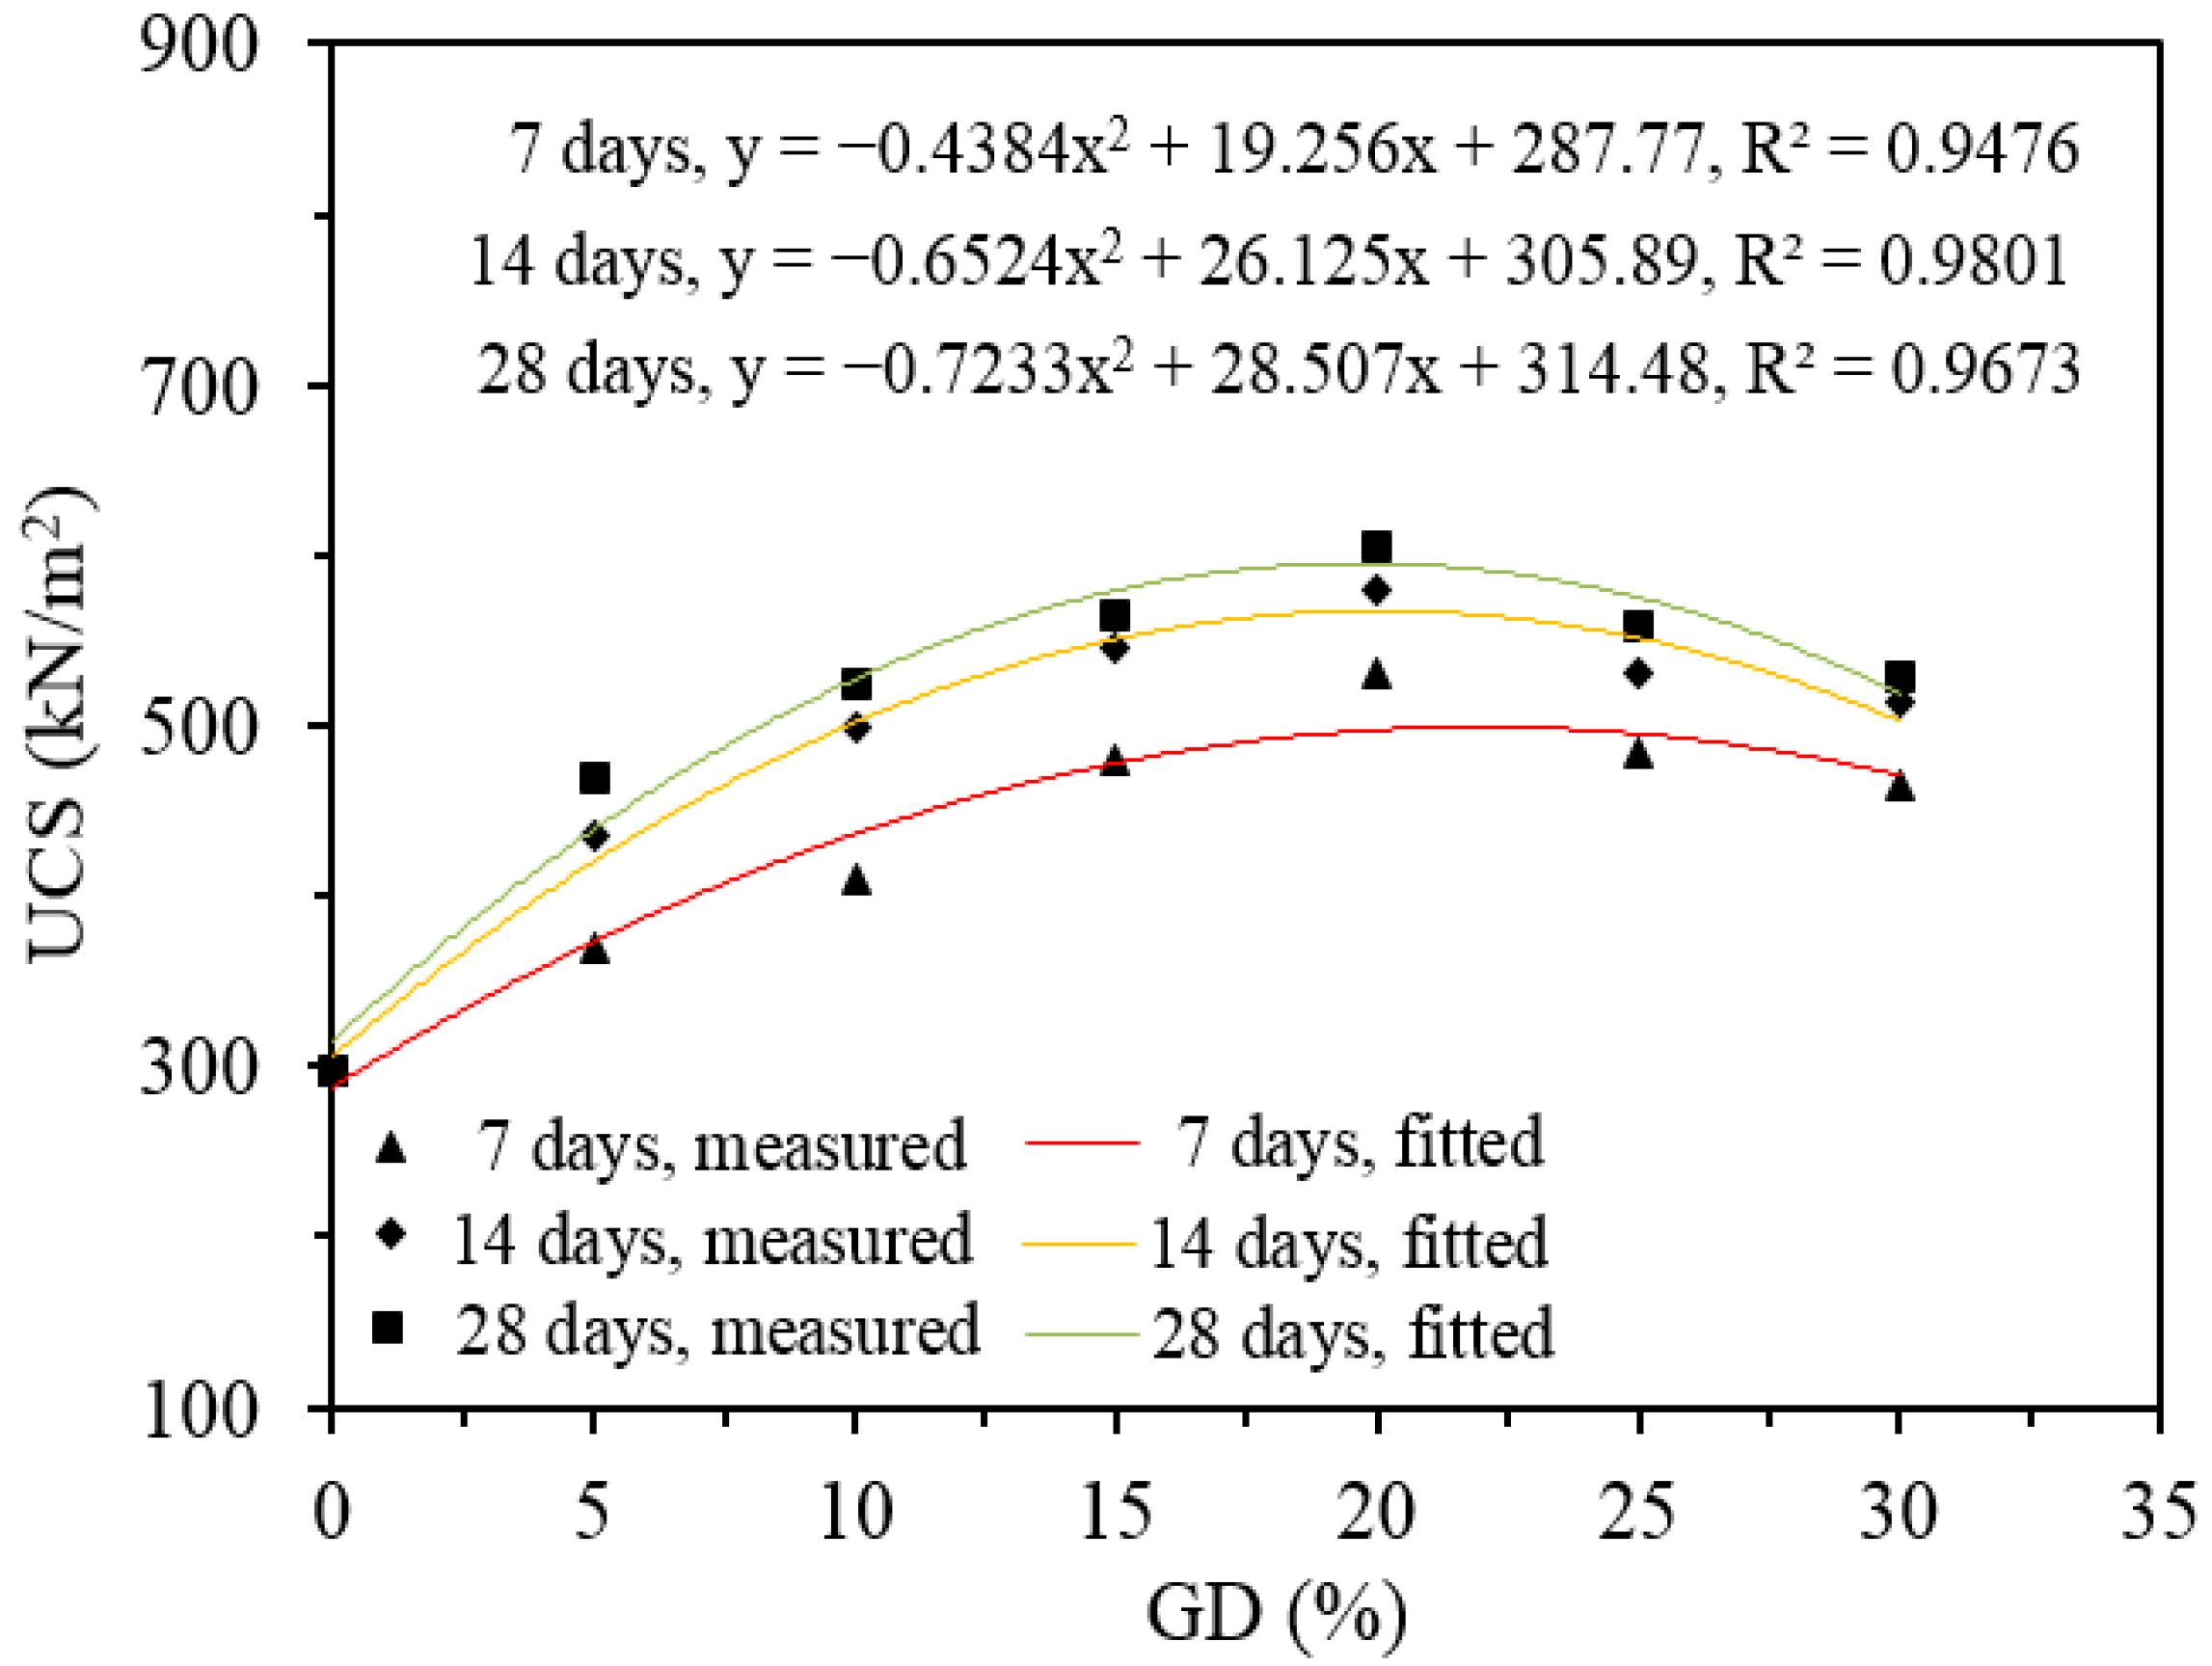
4.3. Influence of GD on Unconfined Compressive Strength

The unconfined compressive strength tests were performed for plain and stabilised ES with various percentages of GD at their OMC and MDU for different curing times. Figure 10 explains the stress-strain characteristics of ES and stabilized ES with varying GD contents. The data pertains to a curing period of 7 days. From Figure 10, it can be noticed that, as the percentage of GD increases, the failure strain of the specimen decreases, and the specimen shifts to ductile failure. The peak stress values of the specimens increase as the percentages of the GD increase up to 20%. However, beyond 20% of the GD, the UCS decreased due to the reduction of cohesion between the granite dust and plain soil. Furthermore, it could be related to a reduction in MDU, as shown in Figure 8. Similar improvement in UCS of expansive soil stabilized was reported by Blayi et al. [7], where an experimental study was performed using various contents (0%, 8%, 16%, 24%, and 32%) of rock powder to stabilize ES. The results revealed that there is a significant increase in UCS with an increase in the content of rock powder, and this increase reaches its maximum at 24% of rock powder, after which it decreases. Preethi et al. [65] conducted expansive soil stabilization utilizing GD in amounts of 10%, 20%, and 30% by weight of soil. The results indicated that GD is an efficacious additive for enhancing the UCS of tested clay samples, and the optimum GD content can be observed as 30%. The increase in UCS value is due to the addition of non-expansive material to ES specimens, which reduces the amount of clay minerals and the void spaces between the clay particles. Furthermore, because the specific gravity of the GD is higher than that of the ES, the modified specimen with GD is more capable of compression, resulting in higher UCS values.

4.4. Effect of the Curing Period on UCS Value of Treated and Untreated ES

The effect of the curing period on the unconfined compressive strength of the soil-granite dust mix is shown in Figure 11. The results of the UCS for 7, 14, and 28 days have been presented. The improvement in the UCS can be significantly observed. The UCS of soil after 7 days of curing time increases to 1.24, 1.37, 1.61, 1.78, 1.63, and 1.56 times the UCS value for plain soil upon the addition of 5, 10, 15, 20, 25, and 30% of GD, respectively. The increase in UCS for TES after a curing time of 14 days is 1.47, 1.68, 1.84, 1.95, 1.78, and 1.73 times the UCS value for plain soil upon the addition of 5, 10, 15, 20, 25, and 30% from GD, respectively. Upon the addition of 5, 10, 15, 20, 25 and 30% GD, the 28 day curing time UCS of soil increases to 1.58, 1.77, 1.90, 2.04, 1.88 and 1.78 times its strength without a stabilizer. With the increase in GD content, the UCS of ES increases by up to 20% and then decreases for all the curing periods. However, it is worth noting that, regardless of GD content, an increase in the curing period consistently improves the strength of the soil. As a result, a GD content of 20% can be considered the ideal GD content. It is reported that the increase in strength is attributed to long-term pozzolanic interactions between the Al and Si present in the soil with Ca in the presence of water, which is often regarded as a key factor in soil stabilization with lime [83]. Here, the amount of lime in the GD was minimal. However, the GD has high strength when compared to clay. Furthermore, because GD is dominated by sand-sized particles (see Table 1), the mineralogy of the particles has a considerable impact on the soil’s strength behaviour. As a result, the improved gradation, increased compactness of the soil matrix due to decreased porosity, and improved inter-particle bonding between the ES-GD mixes can all be linked to the increased strength of the expansive soil with an increasing addition ratio of GD to 20%. Another interesting observation has been encountered in Figure 11, namely that the strength of soil for all stabiliser contents diminishes with an increase in the curing period up to 28 days. This demonstrates that an increase in the strength of the ES is more prevalent at early curing times. Thus, it can be concluded that the addition of GD to the ES has the most beneficial impact on increasing early strength rather than on the late strength of the stabilised soil. It is common knowledge that long-term pozzolanic reactions enhance the strength of lime-stabilized soils. As a result, the current study demonstrates the superiority of GD versus lime stabilisation for achieving short-term strength.
A regression model has been established to predict UCS of the ES mixed with various percentages of GD. The models are as follows:
7 days, UCST (kN/m2) = −0.4384 UCSU2 + 19.256 UCSU + 287.77, R2 = 0.94
14 days, UCST (kN/m2) = −0.6524 UCSU2 + 26.125 UCSU + 305.89, R2 = 0.98
28 days, UCST (kN/m2) = −0.7233 UCSU2 + 28.507 UCSU + 314.48, R2 = 0.96
where UCST and UCSU are the unconfined compressive strength of treated and untreated expansive soil (kN/m2), respectively.

4.5. Influence of Curing Period on Failure Strain (ε)

To further study the failure patterns, the variation in the failure strain of soil samples with different curing periods (7, 14, and 28 days) is summarised in Figure 12. With the rise in GD content, the failure strain decreases from 4.15% to 2.87% (7 days), 4.15% to 2.40% (14 days), and 4.15% to 1.90% (28 days), respectively. This is because GD is similar to silty soil and it is non-plastic, thus leading to a reduction of plasticity in stabilized soil. In addition, an investigation of the microstructures of the ES treated with GD using SEM (In addition, adding GD to the untreated ES produces a mixture with a more compact structure than that observed in natural soil, as investigated by Jain et al. [61] in a comparison study of microstructures between the untreated ES and the soil with 20% marble dust using SEM analysis. A mixture with a highly compacted structure clearly produces a mixed specimen with a high density, leading in a high stiffness.) showed that a mixture with a highly compacted structure produces a mixed specimen with a high density, leading to high stiffness. This is consistent with the general trends observed in previous studies, such as Ibrahim et al. [6], and Blayi et al. [7]. A regression model has been established to predict failure strain (ε) of the ES mixed with various percentages of GD. The model is as follows:
εT (%) = 0.0037ε2 − 0.18εU + 4.0957, R2 = 0.98
where εT and εU are the failure strain (ε) of treated and untreated ES (%), respectively.

4.6. Influence of GD on California Bearing Ratio

The California bearing ratio test is an essential parameter to measure the subgrade strength of roads, organize sub-base components for elastic pavements, and to establish the thickness of layers of pavement. The soaking CBR tests were conducted out on ES and TES using MDU and OMC cured for 7 days with varying percentages of GD. The results of the tests are depicted in Figure 13. The GD percentages added up to 20% enhanced the CBR values of the specimens but, subsequently, there was a decline, as shown in this figure. For example, the CBR value for expansive soil was 5.70%, but it climbed to 17.3% when 20% GD was used in the sample, before then falling to 15.2% and 12.5%, respectively, when 25% and 30% GD was used. As shown, a 20% increase in CBR value translates to a more than 200% increase, indicating that GD addition has a considerable impact on the CBR performance of the specimens (Figure 13). This is due to GD additions changing the bearing capacity of the entire sample up to 20% GD content by filling voids between ES grains. The reason is also due to an increase in MDU due to the addition of GD content, which resulted in higher CBR and UCS. Igwe and Adepehin [64] explained that the cation exchange and agglomeration reactions that occur when rock dust is added to clay soils cause an increase in CBR. Samples with GD beyond transition content, on the other hand, had a CBR value of less than 17.3%, indicating that the GD grains controlled the majority of the overall behaviour. This is because of a reduction in the density of compositions or more solids being occupied in a given volume. A regression model has been established to predict the CBR of the ES mixed with various percentages of GD. The model is as follows:
CBRT (%) = −0.0253CBRU2 + 1.0564CBRU + 4.5857, R2 = 0.94
where CBRT and CBRU are the CBR of treated and untreated ES (%), respectively.
The thickness of sub-base pavement is governed by the CBR value of subgrade soils. Figure 14 presents the sub-base and capping thickness design details. The thickness of the sub-base is 150 mm for a subgrade with a CBR value greater than 15%. Conversely, there are two options for the subgrade with the performance of 2.5–15%; (1) 150 mm thickness of sub-base with various capping thickness, (2) a higher thickness of sub-base without capping [84]. As a result of the increased CBR values caused by GD, the thickness of the sub-base layer is reduced from 240 to 150 mm (Figure 15). Table 2 tabulates the pavement design alternatives based on the CBR performance of the specimens. Similar findings are provided by Blayi et al. [7], Cabalar et al. [18], and Ene and Okagbue [85], which support the authors’ results in this study. A regression model has been established to predict the sub-base thickness design of the ES mixed with various percentages of GD. The model is as follows:
STT (mm) = 0.1333 STU2 − 5.5 STU + 204.88, R2 = 0.99
where STT and STU are the sub-base thickness design of treated and untreated ES (mm), respectively.

4.7. Influence of GD on Swelling Potential

The variation of swell potential (S%) versus time was calculated using a one-dimensional swell test on an ES and TES with different percentages of GD at their OMC and MDU for 7 days of the curing period. The experiment was conducted on the samples by applying net vertical stress of 6.9 kN/m2. The heave of the soil samples was measured by using a dial gauge with a sensitivity of 0.01 mm. The swelling potential (S%) was computed using the following equation:
S   ( % ) = [   H p H o   H o ] × 100
where Hp is the maximum height of the soil specimen and Ho is the initial height of the soil specimen.
Figure 16 displays the swelling potential as a function of the percentage of GD added to the ES, up to 30%. It is clear that, by increasing the percentages of GD up to 30%, the swelling potential decreases from 6.63% to 1.54%. On the other hand, from Figure 17, it is evident that the rate of decrease in the value of swelling potential is large with the increase in the percentage of GD, and that this rate decreases after increasing this percentage greater than 20%. This behaviour can be explained by the fact that the addition of non-expansive material to the expansive soil reduces the clay-minerals content per unit mass of soil-GD mixes. Consequently, the total surface area of expansive clay particles decreases, and this can cause the values of the swelling percent to diminish. Moreover, this could be due to the GD, which produces a denser packed soil mixture for the pore water pressure, and this pack offers high resistance to swelling. A similar result was observed by various researchers with various stabilizer materials, such as Ogila [3], Blayi et al. [7], Abdelkader et al. [30], and Kalkan et al., [86]. A regression model has been established to predict the swelling potential of the ES mixed with various percentages of GD. The model is as follows:
ST (%) = 0.0077SU2 − 0.3934SU + 6.511, R2 = 0.99
where ST and SU are the swelling potential of treated and untreated ES (%), respectively.

4.8. Influence of GD on Linear Shrinkage

The one-dimensional shrinkage of stabilized ES samples in terms of GD percentage was determined using linear shrinkage (LS) tests. The test trough was filled with a stabilized sample at the LL state. The wet material trough was placed in a drying oven and dried for about 24 h at a temperature of 110 °C until all shrinking had ceased. Digital callipers were used to measure the length of the dry soil specimens, and the values of LS were calculated for the stabilized ES samples. Figure 18 depicts the outcomes of the testing. The LS of stabilized ES samples reduced from 10.80% to 3.9% when the GD was added up to 30% by dry weight of the soil. This means that the GD particles are responsible for this drop in LS value. When GD is mixed with soil, the particle size of the mixed sample increases. As particle size increases, the surface area of the particles decreases. Furthermore, the amount of clay mineral in soils decreases with the increase of GD content in the soil combination. As a result, the water-holding capacity of the soil mixture decreases and, as a result, the LS limit also decreases. These results agree with the results of the study of Blayi et al. [7], where LS was reduced from 9.07% to 2.61% with the addition of 24% rock powder to the ES samples. Additionally, the obtained results agree with Igwe and Illoabachie’s [66] study, where LS was reduced from 12% to 3.1% with the addition of 20% GD to the clay samples. A regression model has been established to predict the LS of the ES mixed with various percentages of GD. The model is as follows:
LST (%) = 0.0068 LSU2 − 0.4427 LSU + 11.013, R2 = 0.99
where LST and LSU are the LS of treated and untreated ES (%), respectively.

5. Analytical Analysis

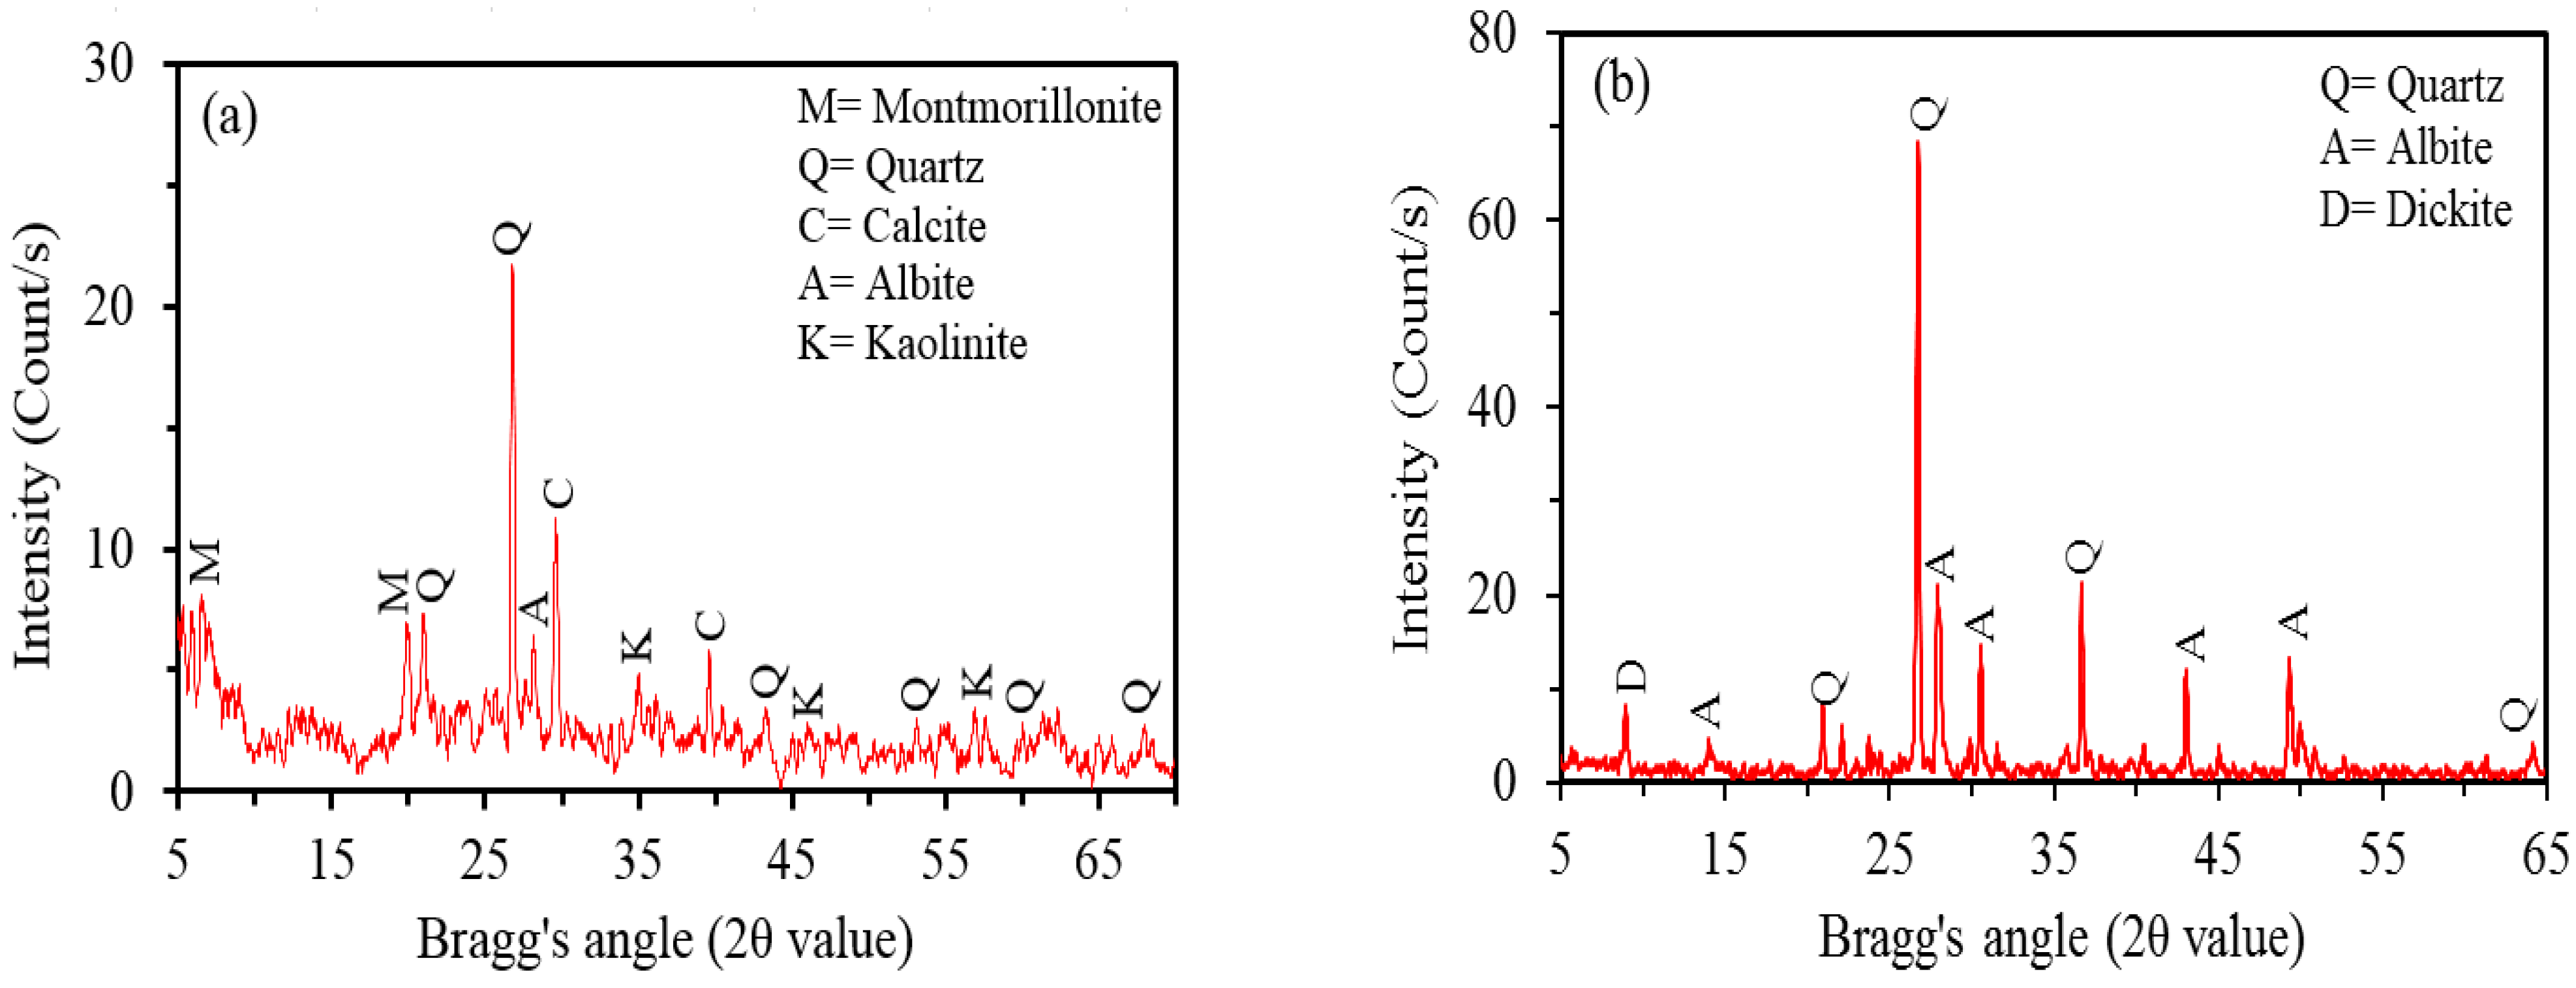
5.1. Mineralogical Analysis by XRD

The alteration in the geotechnical properties of the ES can be related to its mineralogical alterations after the addition of GD. Figure 19 shows the XRD analysis of the ES and TES with concentrations of 10, 20, and 30% with a 28 day curing period. The XRD analyses of the ES-GD mixes are compared with the mineralogical analyses of the plain materials (ES and GD) in order to characterise the alterations in mineral composition after the modifier was added. It is observed that the mineral composition of the plain soil was quartz, kaolinite, and montmorillonite, which are clay minerals as well as non-clay minerals of calcite. The GD contains minerals, such as albite and quartz. The XRD pattern is clearly different from that of the plain soil, and additional reflections have been introduced. After GD modification, the reflection peak intensities of all clay minerals were reduced. This explains why the swelling of the stabilized soil has decreased (see Figure 17). Furthermore, when the GD content was increased to a specific level, the results showed a growth in calcite, with a weakening aluminium peak and the appearance of new mineral peaks, such as gypsum and dolomite in the stabilized soil, indicating the formation of a compacted soil matrix and, thereby, an optimum increase in strength. Similar findings were provided by Kalkan et al. [86]. However, compared to the specimens having soil + 10% GD and soil + 20% GD, the specimen including soil + 30% GD shows an increase in the peak of quartz and a drop in the peak of calcite, which could be major contributors to the deterioration of strength beyond 20% of GD (see Figure 11 and Figure 13).

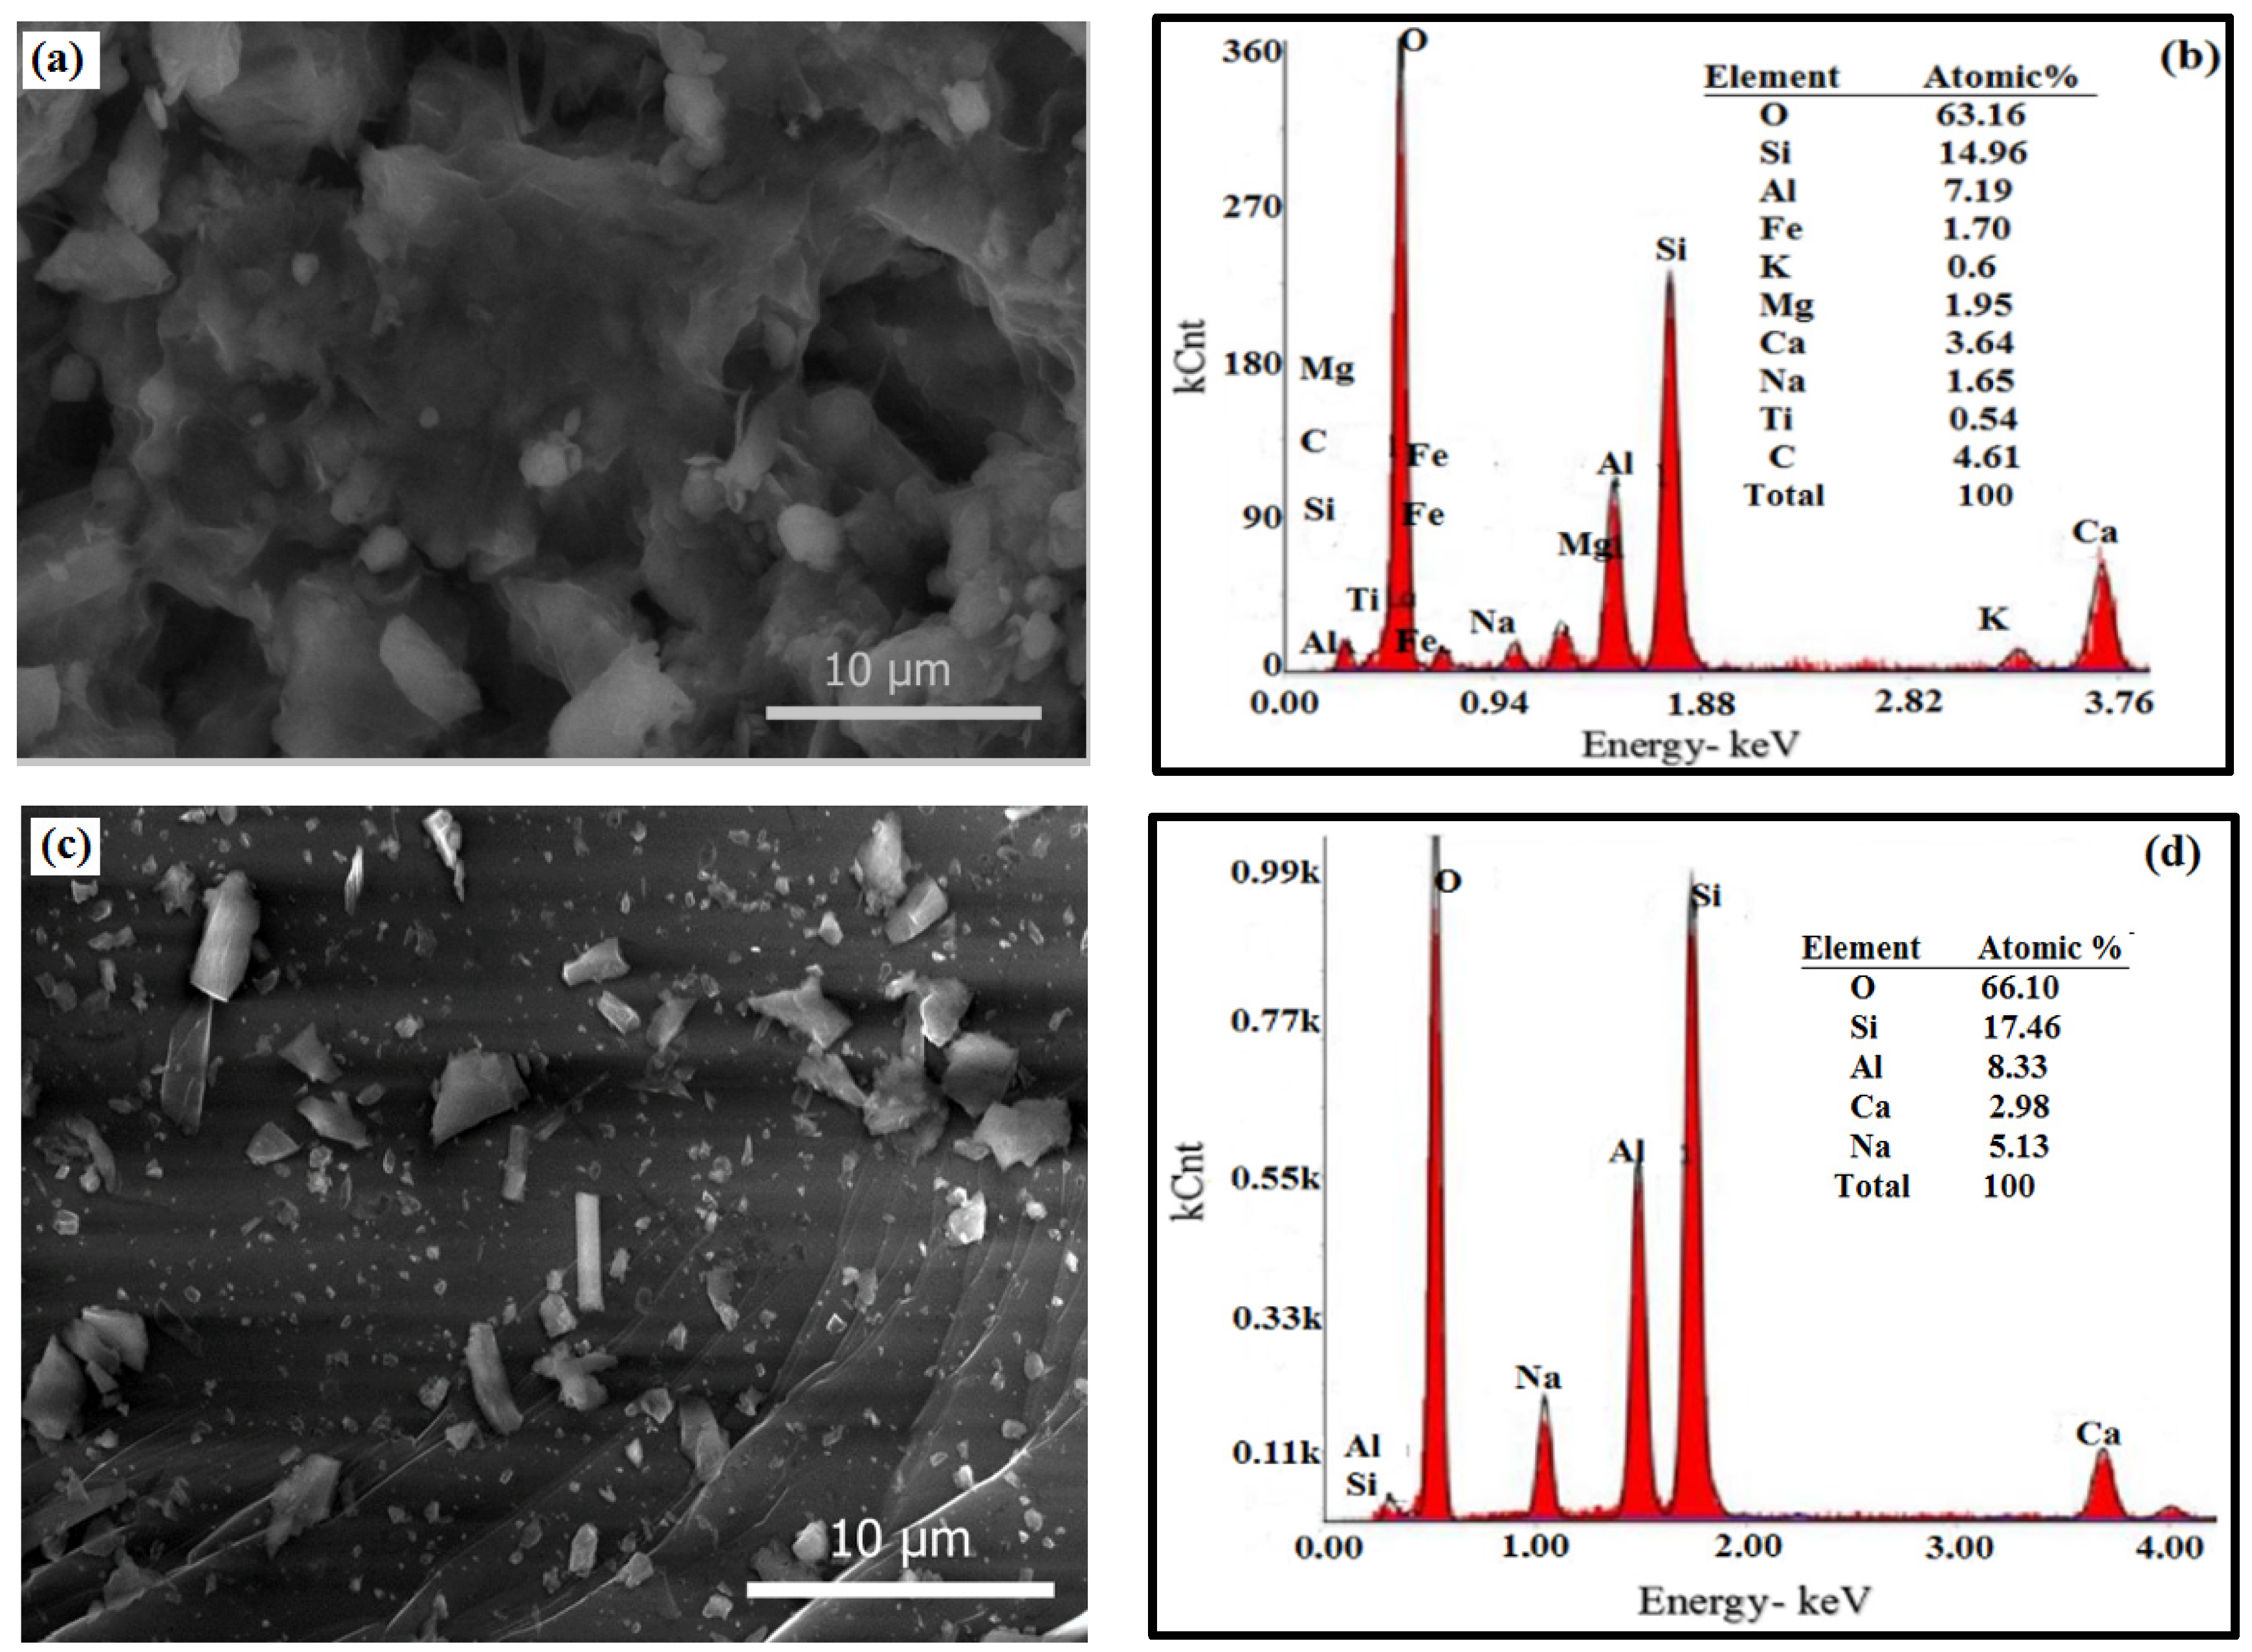
5.2. SEM and EDAX Analysis
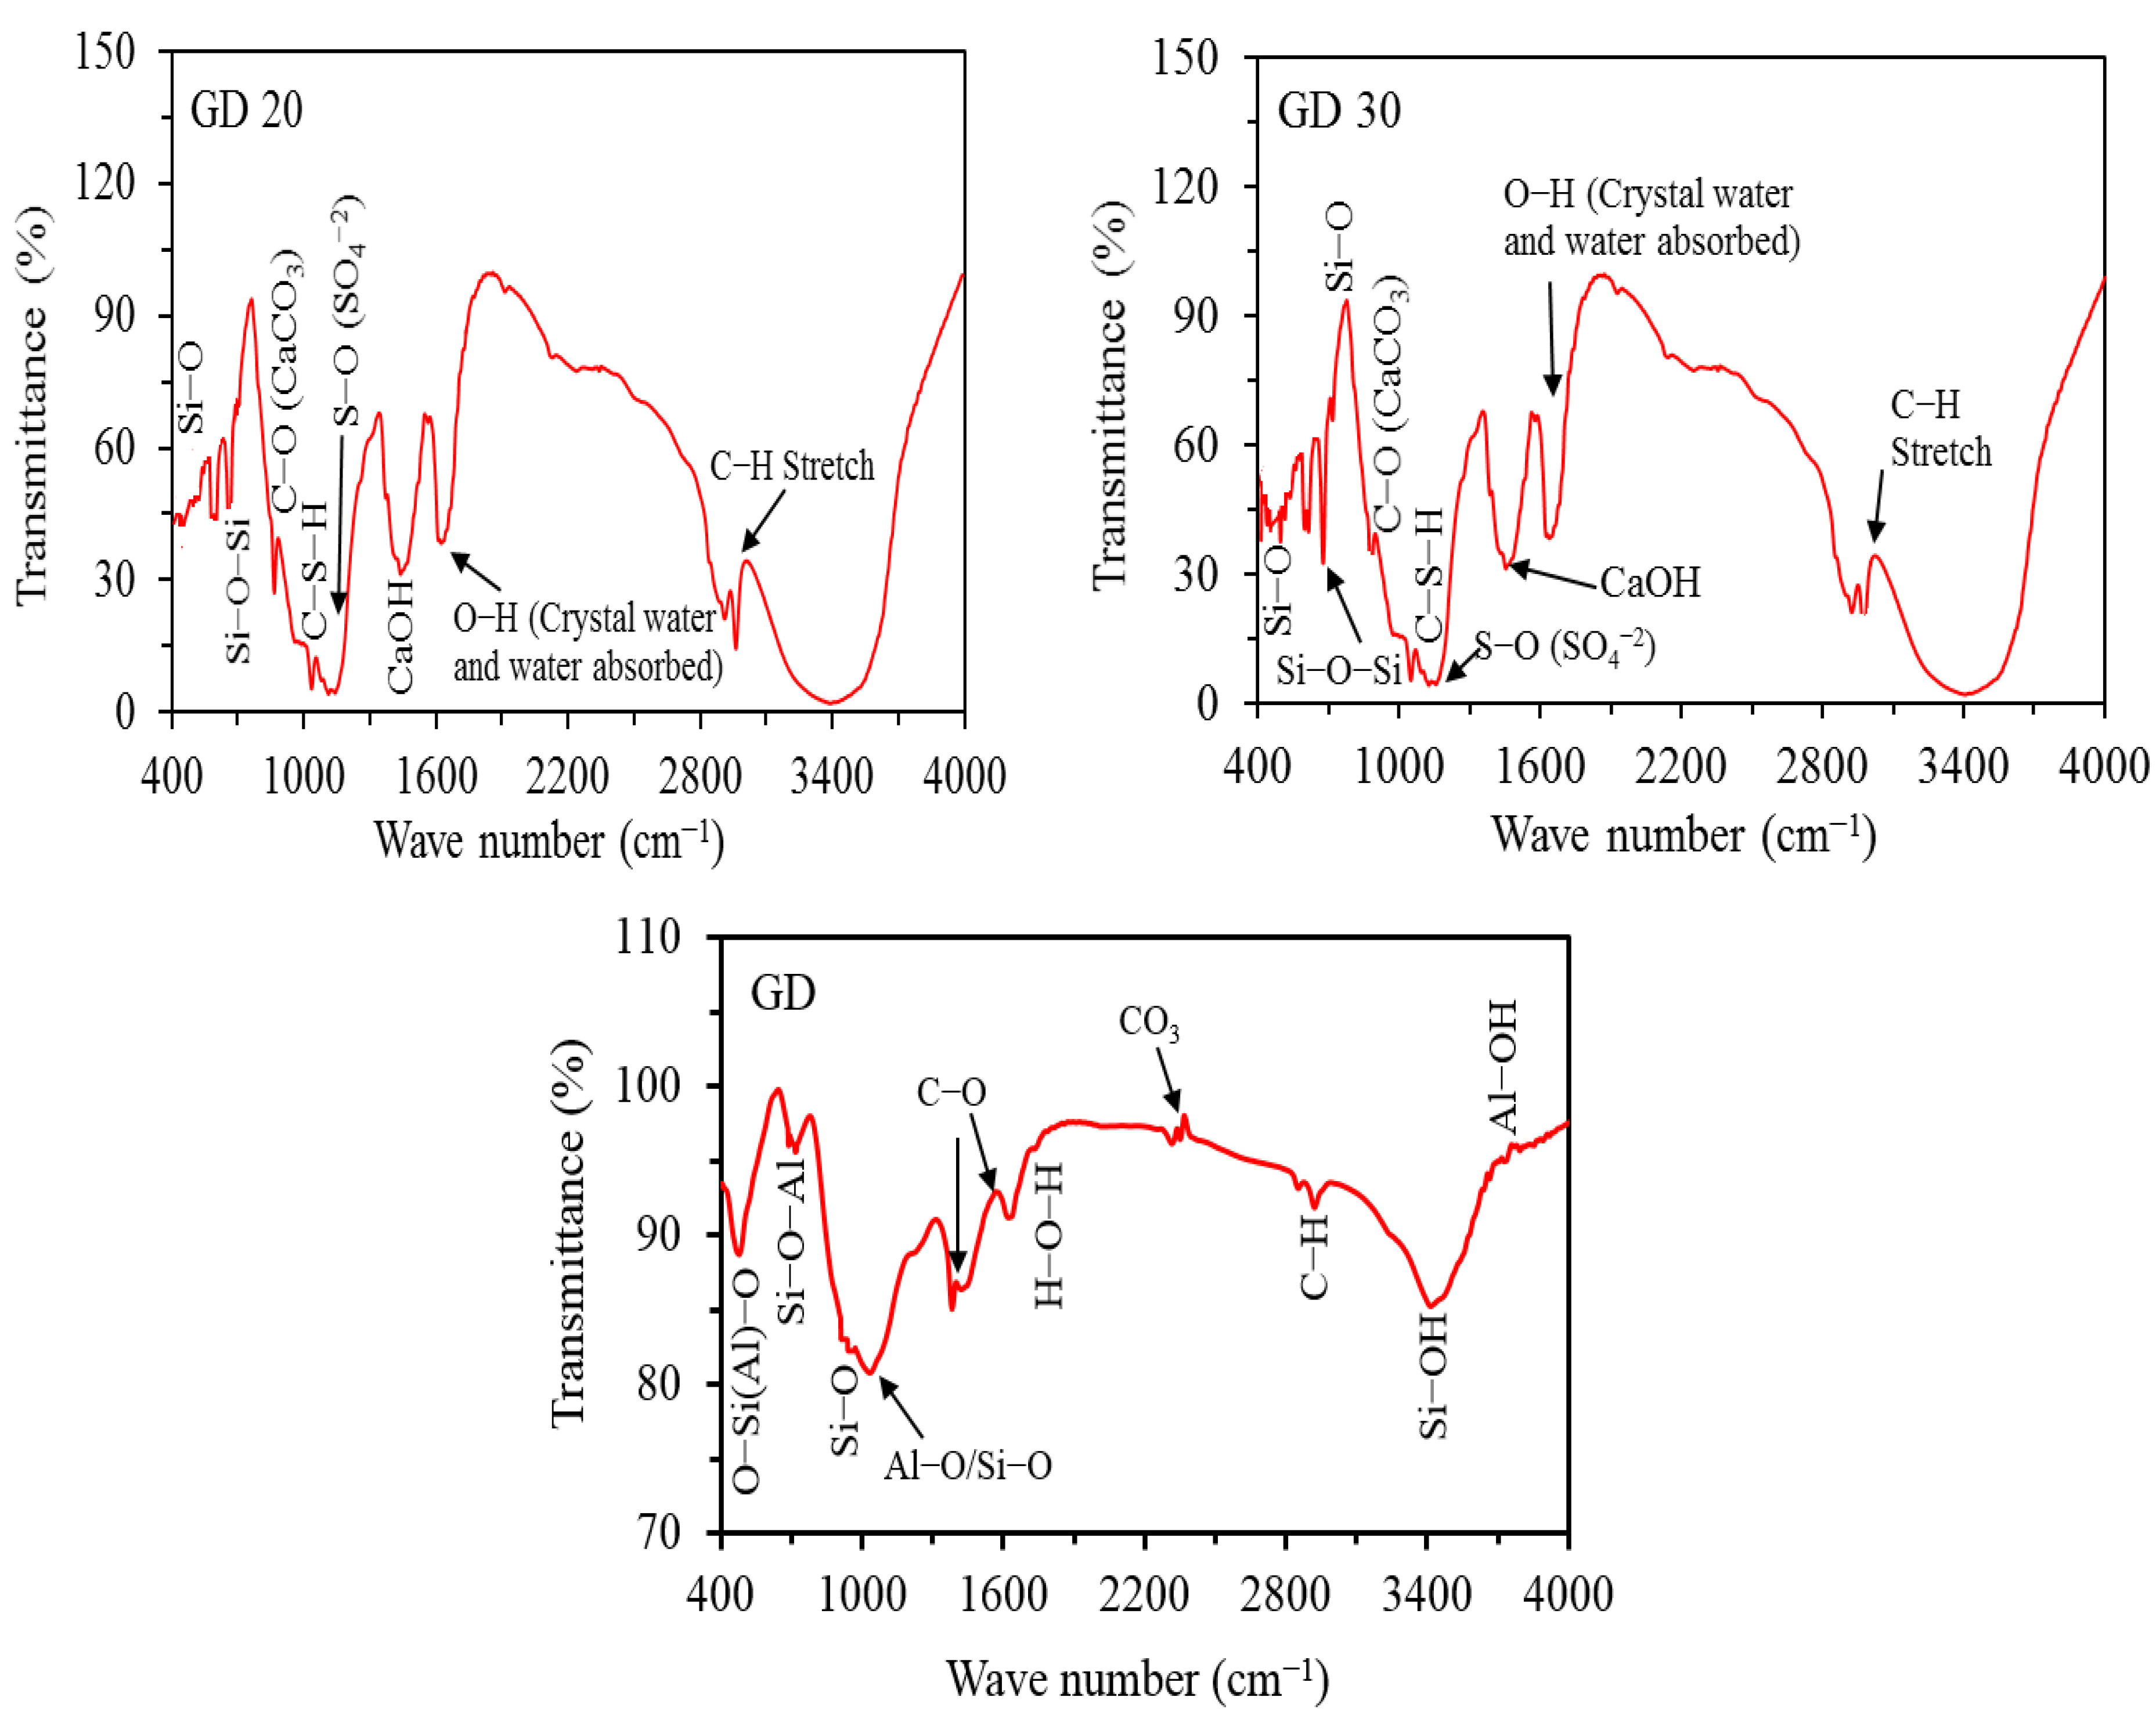
A series of SEM and EDAX images of soil amended with GD after a 28 day curing period were collected to better understand the alterations in microstructural and chemical compositions. Figure 20a,c,e,g shows the variance in the microstructure of unsterilized and granite stabilized expansive soil samples. The microstructural examination of ES illustrates the presence of several void spaces between particles (Figure 20a). The addition of granite to the ES leads to the structural shift of stabilized expansive soil, as seen in the photographs. Silt and clay grains of expansive soil demonstrated a compacted matrix having a decrease in pores with an improvement in the particle gradation, as in Figure 20c,e. This is because of the binding and interlocking between the soil and the GD particles, which is also one potential reason for the enhancement of the strength after granite treatment [83]. However, the SEM image of the ES mixed with 30% GD (Figure 20g) show a disrupted matrix having several internal pores, indicating a decrease in strength due to a lack of cohesion and the binding between ES particles. This confirms that the ES with more than 20% GD is not beneficial for enhancing the strength behaviour. A similar observation was made by Jain et al. [61] for the stabilization of expansive soil with marble dust.
Similarly, the changes in the elemental compositions of the untreated and treated soils with varying percentages of granite during the 28 day curing period are shown in Figure 20b,d,f,h. Relatively high intensities of Si, Al, K, and O peaks are observed in UES, which is consistent with its clayey nature [68]. For TES, the EDAX spectrum of granite-treated soil shows the increase of calcium (Ca). Moreover, the weight percentage of Si and Al in the treated soil was found to decrease. This confirms the possible formation of the cementitious compound in the treated samples, which is an important factor for enhancing the strength behaviour and reducing the swelling percentage of soil [87]. It is obvious that the decrease in the percentage of Ca and the increase in Si and Al of the ES + 30 GD mix (Figure 20h), rather than that of the ES + 10 GD and ES + 20 GD mixes (Figure 20d,f), leads to a reduction in cohesion, resulting in a decrease in the strength of the stabilised ES with greater than 20% GD. These trends are also consistent with the XRD results.

5.3. FTIR Analysis

Figure 21 shows the mineral characterization exercise using FTIR wavelengths of unmodified and GD changed soil within the absorption band of 400–4000 cm−1. Many scholars [67,68,69,70,71,72,73,88,89] have given their interpretations of the identified bands. The FTIR studies indicated that significant variations in the elements and ions cause changes in the mechanical properties of the ES mixed with GD content and cured for 28 days. The range of 500–1200 cm−1 shows the minerals, 1200–3000 cm−1 the organic matters, and 3500–4000 cm−1 the clay minerals. The hydroxyl group of kaolinite and illite is observed in the band of 3092–3717 cm−1. The stretching vibration of the O–H group in the H2O adsorbed on the specimens is responsible for the bands at 3400 and 1625 cm−1. With the mixed proportions, the fluctuations in the quartz band at 782 cm−1 and the Si-O and Al-O near 623 cm−1 are noted to be changed. The Si-O stretching vibration in GD is characterized by the existence of a band of about 880 cm−1. The CO3 functional group can also be related to the 1408.9 cm−1 band, which could imply the existence of CSH and CAH in the form of calcite. A considerable change in the broadness of the band at 1635 cm−1 was also noticed, which steadily increased with increasing GD content, possibly indicating the generation of pozzolanic reaction products. The peak observed at 3623 cm−1 was ascertained to be montmorillonite in the untreated ES. This peak has been reduced with the increasing GD content. This shows that the addition of the GD content controls the presence of hydrophobic minerals.

6. Conclusions

Expansive soil-GD mixes have been subjected to detailed experimental and micro-analysis to understand their geotechnical behaviour and interaction mechanisms, in the interest of using GD as a soil stabilizer. The following are some of the most important findings of this research:
1.
The LL decreases from 51.94% to 36.5%, the PL decreases from 30.5% to 23.6%, and the PI decreases from 21.44% to 12.9% with increasing the amount of GD up to 30%. Moreover, the increment of the GD ratio up to 30% improved the soil and shifted it from the MH group to be within the CL group.
2.
The OMC value decreased from 15.08% to 12.0% with increasing the amount of GD up to 30%, whereas the MDU increased from 18.05 kN/m3 to 19.40 kN/m3 with increasing GD up to 20%, after which it decreased.
3.
The UCS of the treated specimens increased by 78% with an increase in GD up to 20%, then decreased by 14% at 30% GD for the specimens tested after 7 days of curing period. Additionally, the UCS of the specimens tested after 14 and 28 days of curing increased by approximately 95% and 104%, respectively, with the addition of 20% GD. After that point, it decreased. On the other hand, failure strain shows a declining tendency as GD content increases, and similar behaviour was obtained with increasing curing periods.
4.
The CBR improved by 203.5%, with an increasing percentage of GD up to 20%, then decreased. This may lead to a reduction in the thickness of the sub-base layer of the roadway.
5.
Both swelling potential and LS were decreased considerably due to the addition of GD up to 30%.
6.
Micro-analyses revealed that the strength and swell behaviour of ES-GD mixes are controlled by the formation of new minerals, changes in the soil morphology, the enhancement of inter-particle bonding, and changes in the parent elements.

7. Limitations and Future Works

This study was carried out to investigate the effect of GD to improve the engineering properties of the ES. In the current study, laboratory-scale testing was carried out to understand the engineering behaviour of ES/GD mixture. However, to understand the actual behaviour of TES, large-scale testing is required. The present study does not deal with the effect of GD on the permeability, split tensile strength, shear strength, and consolidation characteristics of ES, so it will be necessary to study these properties in the future. In this study, only one expansive soil type was studied and, in order for these results to be applicable in field, it is necessary to conduct this study on a number of other expansive soils in the future.

Author Contributions

The authors state that this paper has been authored in equal contribution with the following details: Investigation, H.A.M.A.; Methodology, H.A.M.A. and M.M.A.H.; Resources, M.M.A.H.; data collection, H.A.M.A.; Validation, H.Y. and J.Z.; Writing—original draft, H.A.M.A.; Writing—review & editing, A.S.A.A.; Supervision, H.Y. and J.Z. All authors have read and agreed to the published version of the manuscript.

Funding

This research received no external funding.

Institutional Review Board Statement

Not applicable.

Informed Consent Statement

Not applicable.

Data Availability Statement

The corresponding author can provide the data used to support the findings of this study upon request.

Acknowledgments

The authors are thankful to the Faculty of Engineering at Al-Azhar University, Qena, Egypt, for facilitating the geotechnical engineering laboratory. Hassan Abdou appreciates the financial support from the Chinese Scholarship Council (CSC).

Conflicts of Interest

The authors declare no conflict of interest.

References

  1. Soltani, A.; Taheri, A.; Khatibi, M.; Estabragh, A.R. Swelling potential of a stabilized expansive soil: A comparative experimental study. Geotech. Geol. Eng. 2017, 35, 1717–1744. [Google Scholar] [CrossRef]
  2. Parhi, P.S.; Garanayak, L.; Mahamaya, M.; Das, S.K. Stabilization of an expansive soil using alkali activated fly ash based geopolymer. In Advances in Characterization and Analysis of Expansive Soils and Rocks; McCartney, J., Ed.; Springer: Cham, Switzerland, 2018; pp. 36–50. [Google Scholar]
  3. Ogila, W.A.M. The impact of natural ornamental limestone dust on swelling characteristics of high expansive soils. Environ. Earth Sci. 2016, 75, 1493. [Google Scholar] [CrossRef]
  4. Tiwari, N.; Satyam, N. Experimental study on the influence of polypropylene fiber on the swelling pressure expansion attributes of silica fume stabilized clayey soil. Geosciences 2019, 9, 377. [Google Scholar] [CrossRef] [Green Version]
  5. Sabat, A.K.; Mohanta, S. Performance of limestone dust stabilized expansive soil-fly ash mixes as construction material. Int. J. Civ. Eng. Technol. 2016, 7, 482–488. [Google Scholar]
  6. Ibrahim, H.H.; Alshkane, Y.M.; Mawlood, Y.I.; Noori, K.M.G.; Hasan, A.M. Improving the geotechnical properties of high expansive clay using limestone powder. Innov. Infrastruct. Solut. 2020, 5, 112. [Google Scholar] [CrossRef]
  7. Blayi, R.A.; Sherwani, A.F.H.; Mahmod, F.H.R.; Ibrahim, H.H. Infuence of Rock Powder on the Geotechnical Behaviour of Expansive Soil. Int. J. Geosynth. Ground Eng. 2021, 7, 14. [Google Scholar] [CrossRef]
  8. Tiwari, N.; Satyam, N.; Patva, J. Engineering Characteristics and Performance of Polypropylene Fibre and Silica Fume Treated Expansive Soil Subgrade. Int. J. Geosynth. Ground Eng. 2020, 6, 18. [Google Scholar] [CrossRef]
  9. Rahman, M.A.; Imteaz, M.A.; Arulrajah, A.; Piratheepan, J.; Disfani, M.M. Recycled construction and demolition materials in permeable pavement systems: Geotechnical and hydraulic characteristics. J. Clean. Prod. 2015, 90, 183–194. [Google Scholar] [CrossRef]
  10. Sabat, A.K.; Pati, S. A review of literature on stabilization of expansive soil using solid wastes. Electron. J. Geotech. Eng. 2014, 19, 6251–6267. [Google Scholar]
  11. Singh, P.; Dash, H.K.; Samantaray, S. Effect of silica fume on engineering properties of expansive soil. Mater. Today 2020, 33, 5035–5040. [Google Scholar] [CrossRef]
  12. Ikara, I.; Kundiri, A.; Mohammed, A. Effects of waste glass (WG) on the strength characteristics of cement stabilized expansive soil. Am. J. Eng. Res. 2015, 4, 33–41. [Google Scholar]
  13. Taha, R.; Al-Rawas, A.; Al-Jabri, K.; Al-Harthy, A.; Hassan, H.; Al-Oraimi, S. An overview of waste materials recycling in the Sultanate of Oman, resources. Conserv. Recycl. 2004, 41, 293–306. [Google Scholar] [CrossRef]
  14. Shalabi, F.I.; Asi, I.M.; Qasrawi, H.Y. Effect of by-product steel slag on the engineering properties of clay soils. J. King Saud Univ.-Eng. Sci. 2017, 29, 394–399. [Google Scholar] [CrossRef] [Green Version]
  15. Tiwari, N.; Satyam, N.; Puppala, A.J. Strength and durability assessment of expansive soil stabilized with recycled ash and natural fibers. Transp. Geotech. 2021, 29, 100556. [Google Scholar] [CrossRef]
  16. Sani, J.E.; Yohanna, P.; Chukwujama, I.A. Effect of rice husk ash admixed with treated sisal fibre on properties of lateritic soil as a road construction material. J. King Saud Univ.-Eng. Sci. 2020, 32, 11–18. [Google Scholar] [CrossRef]
  17. Palaniappan, K.A.; Stalin, V.K. Utility effect of solid wastes in problematic soils. Int. J. Eng. Res. Ind. Appl. 2009, 2, 313–321. [Google Scholar]
  18. Cabalar, A.F.; Hassan, D.I.; Abdulnafaa, M.D. Use of waste ceramic tiles for road pavement subgrade. Road Mater. Pavement Des. 2017, 18, 882–896. [Google Scholar] [CrossRef]
  19. Soosan, T.G.; Jose, B.T.; Abraham, B.M. Use of crusher dust in embankment and highway construction. In Proceedings of the Indian Geo-Technical Conference, Indore, India, 14–16 December 2001; pp. 274–277. [Google Scholar]
  20. Seco, A.; Ramrez, F.; Miqueleiz, L.; Garca, B. Stabilization of expansive soils for use in construction. Appl. Clay Sci. 2011, 51, 348–352. [Google Scholar] [CrossRef]
  21. Khemissa, M.; Mahamedi, A. Cement and lime mixture stabilization of an expansive overconsolidated clay. Appl. Clay Sci. 2014, 95, 104–110. [Google Scholar] [CrossRef]
  22. Kumar, B.R.P.; Sharma, R.S. Effect of fly ash on engineering properties of expansive soils. J. Geotech. Geoenviron. Eng. 2004, 130, 764–767. [Google Scholar] [CrossRef]
  23. Jha, A.K.; Sivapullaiah, P.V. Potential of fly ash to suppress the susceptible behavior of lime-treated gypseous soil. Soils Found. 2018, 58, 654–665. [Google Scholar] [CrossRef]
  24. Al-Mukhtar, M.; Khattab, S.; Alcover, J.F. Microstructure and geotechnical properties of lime-treated expansive clayey soil. Eng. Geol. 2012, 139, 17–27. [Google Scholar] [CrossRef]
  25. Nayaka, R.R.; Alengaram, U.J.; Jumaat, M.Z.; Yusoff, S.B.; Alnahhal, M.F. High volume cement replacement by environmental friendly industrial by-product palm oil clinker powder in cement—lime masonry mortar. J. Clean. Prod. 2018, 190, 272–284. [Google Scholar] [CrossRef]
  26. Ali, M.; Saidur, R.; Hossain, M. A review on emission analysis in cement industries. Renew. Sustain. Energy Rev. 2011, 15, 2252–2261. [Google Scholar] [CrossRef]
  27. Zhang, J.; Liu, G.; Chen, B.; Song, D.; Qi, J.; Liu, X. Analysis of CO2 Emission for the Cement Manufacturing with Alternative Raw Materials: A LCA-based Framework. Energy Procedia 2014, 61, 2541–2545. [Google Scholar] [CrossRef] [Green Version]
  28. Eujine, G.N.; Chandrakaran, S.; Sankar, N. Accelerated subgrade stabilization using enzymatic lime technique. J. Mater. Civ. Eng. 2017, 29, 04017085. [Google Scholar] [CrossRef]
  29. Firoozi, A.A.; Guney, O.C.; Firoozi, A.A.; Baghini, M.S. Fundamentals of soil stabilization. Int. J. Geo-Eng. 2017, 8, 26. [Google Scholar] [CrossRef] [Green Version]
  30. Abdelkader, H.A.M.; Hussein, M.M.A.; Ye, H. Influence of waste marble dust on the improvement of expansive clay soils. Adv. Civ. Eng. 2021, 2021, 3192122. [Google Scholar] [CrossRef]
  31. Selim, T.H.; Kandil, A.I. Characteristics of the marble industry in Egypt: Structure, conduct, and performance. Int. Bus. Econ. Res. J. 2006, 5, 25–34. [Google Scholar]
  32. Sadek, D.M.; El-Attar, M.M.; Ali, H.A. Reusing of marble and granite powders in self-compacting concrete for sustainable development. J. Clean. Prod. 2017, 121, 19–32. [Google Scholar] [CrossRef]
  33. Hamdy, A.E.; Farag, A.B.; Kandeel, A.M.; Younes, A.A.; Yousef, M.M. Characteristics of the marble processing powder waste at Shaq El-Thoaban industrial area, Egypt, and its suitability for cement manufacture. HBRC J. 2018, 14, 171–179. [Google Scholar]
  34. Hamza, R.A.; El-Haggar, S.; Khedr, S. Marble and granite waste: Characterization and utilization in concrete bricks. Int. J. Biosci. Biochem. Bioinform. 2011, 1, 286–291. [Google Scholar] [CrossRef]
  35. Aliabdo, A.A.; Abd Elmoaty, A.M.; Auda, E.M. Re-use of waste marble dust in the production of cement and concrete. Constr. Build. Mater. 2014, 50, 28–41. [Google Scholar] [CrossRef]
  36. Awad, A.H.; Abdellatif, M.H. Assessment of mechanical and physical properties of LDPE reinforced with marble dust. Compos. Part B 2019, 173, 106948. [Google Scholar] [CrossRef]
  37. Awad, A.H.; El-gamasy, R.; Abd El-Wahab, A.A.; Abdellatif, M.H. Mechanical behavior of PP reinforced with marble dust. Constr. Build. Mater. 2019, 228, 116766. [Google Scholar] [CrossRef]
  38. Awad, A.H.; Abdel-Ghany, A.W.; Abd El-Wahab, A.A.; El-Gamasy, R.; Abdellatif, M.H. The infuence of adding marble and granite dust on the mechanical and physical properties of PP composites. J. Therm. Anal. Calorim. 2020, 140, 2615–2623. [Google Scholar] [CrossRef]
  39. Karimi, D.; Crawford, B.; Milani, A.S. Manufacturing process and mechanical properties of a novel acrylonitrile butadiene styrene-based composite, with recycled natural granite micro particles. Manuf. Lett. 2020, 23, 79–84. [Google Scholar] [CrossRef]
  40. Li, H.; Huang, F.; Cheng, G.; Xie, Y.; Tan, Y.; Li, L.; Yi, Z. Effect of granite dust on mechanical and some durability properties of manufactured sand concrete. Constr. Build. Mater. 2016, 109, 41–46. [Google Scholar] [CrossRef]
  41. Rana, A.; Kalla, P.; Verma, H.K.; Mohnot, J.K. Recycling of dimensional stone waste in concrete: A review. J. Clean. Prod. 2016, 31, 231–250. [Google Scholar] [CrossRef]
  42. Saboya, F., Jr.; Xavier, G.C.; Alexandre, J. The use of the powder marble byproduct to enhance the properties of brick ceramic. Constr. Build. Mater. 2007, 21, 1950–1960. [Google Scholar] [CrossRef]
  43. Savadkoohi, M.S.; Reisi, M. Environmental protection based sustainable development by utilization of granite waste in Reactive Powder Concrete. J. Clean. Prod. 2022, 266, 121973. [Google Scholar] [CrossRef]
  44. El Haggar, S. Chapter 10 e Sustainability of Industrial Waste Management. In Sustainable Industrial Design and Waste Management: Cradle-to Cradle for Sustainable Development; Elsevier Academic Press: Cambridge, MA, USA, 2007; pp. 307–369. [Google Scholar]
  45. Mashaly, A.O.; El-Kaliouby, B.A.; Shalaby, B.N.; El-Gohary, A.M.; Rashwan, M.A. Effects of marble sludge incorporation on the properties of cement composites and concrete paving blocks. J. Clean. Prod. 2016, 112, 731–741. [Google Scholar] [CrossRef]
  46. Sivrikaya, O.; Uysal, F.; Yorulmaz, A.; Aydin, K. The Efciency of Waste Marble Powder in the Stabilization of Fine-Grained Soils in Terms of Volume Changes. Arab. J. Sci. Eng. 2020, 45, 8561–8576. [Google Scholar] [CrossRef]
  47. Dhanapandian, S.; Gnanavel, B.; Ramkumar, T. Utilization of granite and marble sawing powder wastes as brick materials. Carpathian J. Earth Environ. Sci. 2009, 4, 147–160. [Google Scholar]
  48. Binici, H.; Kaplan, H.; Yilmaz, S. Influence of marble and limestone dust as additives on some mechanical properties of concrete. Sci. Res. Essays 2007, 2, 372–379. [Google Scholar]
  49. Soomro, B.; Mangi, S.A.; Bajkani, R.A.; Junejo, A.Q. Recycling of ceramic tiles and marble powder waste as partial substitution in concrete. Neutron 2021, 20, 128–137. [Google Scholar] [CrossRef]
  50. Asokan, P.; Mohini, S.; Shyam, R.A. Solid wastes generation in India and their recycling potential in building materials. J. Build. Environ. 2007, 42, 2311–2320. [Google Scholar]
  51. Segadaes, A.M.; Carvalhob, M.A.; Accharc, W. Using marble and granite rejects to enhance the processing of clay products. Appl. Clay Sci. 2005, 30, 42–52. [Google Scholar] [CrossRef]
  52. Torres, P.; Fernandes, H.R.; Olhero, S.; Ferreira, J.M.F. Incorporation of wastes from granite rock cutting and polishing industries to produce roof tiles. J. Eur. Ceram. Soc. 2009, 29, 23–30. [Google Scholar] [CrossRef]
  53. Babu, S.V.; Sharmila, S.M.R. Soil stabilisation using marble dust. Int. J. Civ. Eng. Technol. 2017, 8, 1706–1713. [Google Scholar]
  54. Singh, P.S.; Yadav, R.K. Effect of marble dust on index properties of black cotton soil. Int. J. Eng. Res. Sci. Technol. 2014, 3, 158–163. [Google Scholar]
  55. Abdulla, R.S.; Majeed, N.N. Some physical properties treatment of expansive soil using marble waste powder. Int. J. Eng. Res. Technol. 2014, 3, 591–600. [Google Scholar]
  56. Oncu, S.; Bilsel, H. Utilization of waste marble to enhance volume change and strength characteristics of sand-stabilized expansive soil. Environ. Earth Sci. 2018, 77, 461. [Google Scholar] [CrossRef]
  57. Sabat, A.K.; Nanda, R.P. Effect of marble dust on strength and durability of rice husk ash stabilized expansive soil. Int. J. Civ. Struct. Eng. 2011, 1, 939–948. [Google Scholar]
  58. Agrawal, V.; Gupta, M. Expansive soil stabilization using marble dust. Int. J. Earth Sci. Eng. 2011, 4, 59–62. [Google Scholar]
  59. Çimen, Ö.; Keskin, S.N.; Seven, S.; Erişkin, E.; Güllü, D. The effect of waste marble pieces on swelling pressure at compacted clay. In Proceedings of the Fourth Geotechnical Symposium, Adana, Turkey, 1–2 December 2011; pp. 206–211. (In Turkish). [Google Scholar]
  60. Saygili, A. Use of waste marble dust for stabilization of clayey soil. Mater. Sci. 2015, 21, 601–606. [Google Scholar] [CrossRef] [Green Version]
  61. Jain, A.K.; Jha, A.K.; Shivanshi. Geotechnical behavior and micro-analyses of expansive soil amended with marble dust. Soils Found. 2020, 60, 737–751. [Google Scholar] [CrossRef]
  62. Sivrikaya, O.; Kıyıldı, K.R.; Karaca, Z. Recycling waste from natural stone processing plants to stabilise clayey soil. Environ. Earth Sci. 2014, 71, 4397–4407. [Google Scholar] [CrossRef] [Green Version]
  63. Anupama, K.; Kumar, K.S.; Srinivas, A.; Anjaneyula; Sastry, R.S.N. Improvisation of geotechnical properties of black cotton soils with granite waste An Environmental Approach. OSR J. Mech. Civ. Eng. 2018, 15, 43–51. [Google Scholar]
  64. Igwe, O.; Adepehin, E.J. Alternative approach to clay stabilization using granite and dolerite dusts. Geotech. Geol. Eng. 2017, 35, 1657–1664. [Google Scholar] [CrossRef]
  65. Preethi, A.; Mahesh, M.; Kumar, P.N.P.; Kumar, C.H.V.; Mohan, N.M. Stabilization of black cotton soil using granite waste. Int. J. Technol. Innov. Mod. Eng. Sci. 2018, 4, 40–45. [Google Scholar]
  66. Igwe, O.; Illoabachie, D.E. The potential effect of granite dust on the geotechnical properties of abakaliki clays. Cont. J. Earth Sci. 2011, 6, 23–30. [Google Scholar]
  67. Tiwari, N.; Satyam, N.; Shukla, S.K. An experimental study on micro-structural and geotechnical characteristics of expansive clay mixed with EPS granules. Soils Found. 2020, 60, 705–713. [Google Scholar] [CrossRef]
  68. Dhar, S.; Hussain, M. The strength and microstructural behavior of lime stabilized subgrade soil in road construction. Int. J. Geotech. Eng. 2021, 15, 471–483. [Google Scholar] [CrossRef]
  69. Tiwari, N.; Satyam, N. An experimental study on the behavior of lime and silica fume treated coir geotextile reinforced expansive soil subgrade. Eng. Sci. Technol. Int. J. 2020, 23, 1214–1222. [Google Scholar] [CrossRef]
  70. Souaibou; Antoine, E.; Raidandi, D. Influence of the colorless waste glass on the mineralogical, microstructural and mechanical properties of clay material from Wack (Adamawa, Cameroon). Adv. Mater. Phys. Chem. 2019, 9, 89–102. [Google Scholar] [CrossRef] [Green Version]
  71. Djowe, A.T.; Laminsi, S.; Njopwouo, D.; Acayanka, E.; Gaigneaux, E.M. Surface Modification of Smectite Clay Induced by Nonthermal Gliding Arc Plasma at Atmospheric Pressure. Plasma Chem. Plasma Process. 2013, 33, 707–723. [Google Scholar] [CrossRef]
  72. Aroke, U.O.; Abdulkarim, A.; Ogubunka, R.O. Fourier-transform infrared characterization of kaolin, granite, bentonite and barite. ATBU J. Environ. Technol. 2013, 3, 399–404. [Google Scholar]
  73. Medina, G.; Sáez del Bosque, I.F.; Frías, M.; Sánchez de Roja, M.I.; Medina, C. Mineralogical study of granite waste in a pozzolan/Ca(OH)2 system: Influence of the activation process. Appl. Clay Sci. 2017, 135, 362–371. [Google Scholar] [CrossRef]
  74. ASTM D6913; Standard Test Methods for Particle-Size Distribution (Gradation) of Soils Using Sieve Analysis, Annual Book of ASTM Standards. ASTM International: West Conshohocken, PA, USA, 2017.
  75. ASTM D854; Standard Test Methods for Specific Gravity of Soil Solids by Water Pycnometer, Annual Book of ASTM Standards. ASTM International: West Conshohocken, PA, USA, 2014.
  76. ASTM D4318; Standard Test Methods for Liquid Limit, Plastic Limit, and Plasticity Index of Soils, Annual Book of ASTM Standards. ASTM International: West Conshohocken, PA, USA, 2017.
  77. BS_1377-2; Methods of Test for Soils for Civil Engineering Purposes—Part 2: Classification Test. British Standards Institution: London, UK, 1990; p. 21.
  78. ASTM D 698-00a; Standard Test Methods for Laboratory Compaction Characteristics of Soil Using Standard Effort (12,400 ft-lbf/ft3 (600 kN-m/m3)), Annual Book of ASTM Standards. ASTM International: West Conshohocken, PA, USA, 2003.
  79. ASTM D 2166; Standard Test Method for Unconfined Compressive Strength of Cohesive Soil, Annual Book of ASTM Standards. ASTM International: West Conshohocken, PA, USA, 2003.
  80. ASTM D 1883; Standard Test Method for California Bearing Ratio (CBR) of Laboratory-Compacted Soils, Annual Book of ASTM Standards. ASTM International: West Conshohocken, PA, USA, 2016.
  81. ASTM_D4546; Standard Test Methods for One-Dimensional Swell or Collapse of Soils, Annual Book of ASTM Standards. ASTM International: West Conshohocken, PA, USA, 2014.
  82. Shah, S.H.A.; Arif, M.; Asif, M.E.; Safdar, M. Influence of granite cutting waste addition on the geotechnical parameters of cohesive soil. Int. J. Eng. Res. Adv. Technol. 2019, 5, 64–74. [Google Scholar] [CrossRef]
  83. Jha, A.K.; Sivapullaiah, P.V. Susceptibility of strength development by lime in gypsiferous soil—A micro mechanistic study. Appl. Clay Sci. 2015, 115, 39–50. [Google Scholar] [CrossRef]
  84. Stationery Office. Design Manual for Roads and Bridges: Pavement Design and Maintenance Foundations; Stationery Office: London, UK, 2006. [Google Scholar]
  85. Ene, E.; Okagbue, C. Some basic geotechnical properties of expansive soil modified using pyroclastic dust. Eng. Geol. 2009, 107, 61–65. [Google Scholar] [CrossRef]
  86. Kalkan, E.; Yarbaşı, N.; Bilici, Ö. The effects of quartzite on the swelling behaviors of compacted clayey soils. Int. J. Earth Sci. Knowl. Appl. 2020, 2, 92–101. [Google Scholar]
  87. Tiwari, N.; Satyam, N. Coupling effect of pond ash and polypropylene fiber on strength and durability of expansive soil subgrades: An integrated experimental and machine learning approach. J. Rock Mech. Geotech. Eng. 2021, 13, 1101–1112. [Google Scholar] [CrossRef]
  88. Tiwari, N.; Satyam, N.; Singh, K. Effect of curing on micro-physical performance of polypropylene fiber reinforced and silica fume stabilized expansive soil under freezing thawing cycles. Sci. Rep. 2020, 10, 7624. [Google Scholar] [CrossRef] [PubMed]
  89. Tiwari, N.; Satyam, N.; Sharm, M. Micro-mechanical performance evaluation of expansive soil biotreated with indigenous bacteria using MICP method. Sci. Rep. 2021, 11, 10324. [Google Scholar] [CrossRef]
Figure 1. Location of Egypt’s marble and granite quarries and factories [31].
Sustainability 14 06218 g001
Figure 2. XRD patterns of (a) ES and (b) GD.
Sustainability 14 06218 g002
Figure 3. Analysis of microstructural and chemical compositions of (a,b) ES and (c,d) GD.
Sustainability 14 06218 g003
Figure 4. FTIR analysis of (a) ES and (b) GD.
Sustainability 14 06218 g004
Figure 5. Variation of LL, PL, and PI with various percentages of GD.
Sustainability 14 06218 g005
Figure 6. Changes of ES in the plasticity chart due to the influence of GD.
Sustainability 14 06218 g006
Figure 7. Variation of maximum dry unit weight and optimum moisture content for ES and TES.
Sustainability 14 06218 g007
Figure 8. Variation of MDU with different percentages of GD.
Sustainability 14 06218 g008
Figure 9. Variation of OMC with different percentages of GD.
Sustainability 14 06218 g009
Figure 10. Stress-strain curves at different percentages of GD after a 28 day curing period.
Sustainability 14 06218 g010
Figure 11. UCS of ES-GD mixtures at different curing times.
Sustainability 14 06218 g011
Figure 12. Variation of failure strain with curing period.
Sustainability 14 06218 g012
Figure 13. Variation of CBR with different percentages of GD.
Sustainability 14 06218 g013
Figure 14. Capping and sub-base thickness design [84].
Sustainability 14 06218 g014
Figure 15. Variation of pavement thickness design with varying GD content.
Sustainability 14 06218 g015
Figure 16. Axial swelling potential versus time for various GD percentages.
Sustainability 14 06218 g016
Figure 17. Variation of swelling potential with varying GD percentages.
Sustainability 14 06218 g017
Figure 18. Results of linear shrinkage tests.
Sustainability 14 06218 g018
Figure 19. XRD analyses of untreated soil, soil-GD mixes, and GD.
Sustainability 14 06218 g019
Figure 20. Analysis of microstructural and EDAX of (a,b) ES, (c,d) 10 GD, (e,f) 20 GD, and (g,h) 30 GD.
Sustainability 14 06218 g020aSustainability 14 06218 g020b
Figure 21. FTIR spectrums of untreated soil, soil-GD mixes and GD.
Sustainability 14 06218 g021aSustainability 14 06218 g021b
Table 1. Geotechnical properties of ES and GD.
PropertiesESGD
Specific gravity2.672.79
Sand content, %3.0059
Silt content, %59.8833
Clay content, %37.128
Liquid limit, %51.9419.11
Plastic limit, %30.5-
Plasticity index, %21.44-
Shrinkage limit, %10.83-
Free swell index, %105-
Optimum moisture content (OMC), %15.8010.3
Maximum dry unit weight (MDU), kN/m318.0519.70
Unconfined compressive strength (UCS), kN/m2297.86-
pH10.328.27
Table 2. Summary of pavement design layers.
SamplesCBR (%)Pavement Design Alternatives
12
Subbase (mm)Capping (mm)Subbase (mm)
Plain soil5.70150235205
5% GD7.90150200180
10% GD11.30150180170
15% GD15.00150150150
20% GD17.30150150150
25% GD15.20150150150
30% GD12.50150170160
Publisher’s Note: MDPI stays neutral with regard to jurisdictional claims in published maps and institutional affiliations.

