Article

Drought Risk Assessment of Sugarcane-Based Electricity Generation in the Rio dos Patos Basin, Brazil

1
Bonn Alliance for Sustainability Research/Innovation Campus Bonn (ICB), University of Bonn, D-53113 Bonn, Germany
2
Institute for Environmental and Human Security (UNU EHS), United Nations University, D-53113 Bonn, Germany
3
Institute for Food and Resource Economics, Faculty of Agriculture, University of Bonn, D-53113 Bonn, Germany
4
Mundialis GmbH & Co. KG, D-53111 Bonn, Germany
5
Empresa Brasileira de Pesquisa Agropecuária, Embrapa Cerrados, Planaltina, Brasilia 70770-901, Brazil
*
Author to whom correspondence should be addressed.
Sustainability 2022, 14(10), 6219; https://0-doi-org.brum.beds.ac.uk/10.3390/su14106219
Submission received: 21 March 2022 / Revised: 14 May 2022 / Accepted: 16 May 2022 / Published: 20 May 2022

Abstract

:
Brazil has a large share of hydropower in its electricity matrix. Since hydropower depends on water availability, it is particularly vulnerable to drought events, making the Brazilian electricity matrix vulnerable to climate change. Starting in 2005, Brazil opened the matrix to new renewable sources, including sugarcane-based electricity. Sugarcane is known for its resilience to short dry spells. Over the last decades, its production area moved from the coastal plains of the Atlantic Forest biome to the savannahs of the Cerrado biome, which is characterised by a five- to six month-long dry season. The sugarcane-based electricity system is highly dynamic and complex due to the interlinkages, dependencies, and cascading impacts between its agricultural and industrial subsystems. This paper applies the risk framework proposed by the IPCC to assess climate-change-driven drought risks to sugarcane electricity generation systems to identify their strengths and weaknesses, considering the system dynamics and linkages. Our methodology aims to understand and characterize drought in the agriculture as well as industrial subsystems and offers a specific understanding of the system by using indicators tailored to sugarcane-based electricity generation. Our results underline the relevance of actions at different levels of management. Initiatives, such as regional weather forecasts specifically for agriculture, and measures to increase industrial water-use efficiency were identified to be essential to reduce the drought risk. Actions from farmers and mill owners, supported and guided by the government at different levels, have the potential to increase the resilience of the system. For example, the implementation of small dams was identified by local actors as a promising intervention to adapt to the long dry seasons; however, they need to be implemented based on a proper technical assessment in order to locate these dams in suitable places. Moreover, the results show that creating and maintaining small water reservoirs to enable the adoption of deficit-controlled irrigation technology contribute to reducing the overall drought risk of the sugarcane-based electricity generation system.

1. Introduction

1.1. Drought Events in Brazil

Brazil has often experienced drought events over the past few years [1]. However, their impacts are not evenly distributed throughout the country due to the spatial diversity of climatic and socioeconomic characteristics.
The Northeast Region of the country is mostly semiarid, prone to desertification due to overgrazing. It is also susceptible to drought events due to the strong influence of the El Niño phenomenon and the surface temperature of the Atlantic Ocean [2]. Drought impacts in the region are significant, with high losses of crops and livestock, as well as rising unemployment rates. In cases of severe drought, fatalities have also occurred [2].
In the rest of Brazil, drought events are not as frequent as in the northeast. However, drought events affected water availability for the population and navigation in the Amazon area in 1962, 1963, 2005, and 2010. The year 2005 was particularly dry, and the entire country was affected by a drought [2].
In Goiás state, where the case study site, the Rio dos Patos basin, is located, drought impacted the region severely in 2014 and 2015. These were, however, not the most severe events; the region was affected by stronger droughts between 1998 and 2004 [3].
Drought impacts in the country affected important sectors, such as agriculture in Central-West Brazil, water supply in the metropolitan region of Sao Paulo, and hydropower generation due to the low water levels in reservoirs [1,4].
In the Cerrado biome, where most Brazilian agricultural and sugarcane production are located [5], the duration, intensity, and frequency of droughts are expected to increase due to climate change [6,7].

1.2. Impacts on Electricity

Around 60% of the electricity matrix in Brazil relies on hydropower, meaning that electricity generation depends on the hydrologic regimes [8,9,10,11]. Therefore, drought events can strongly impact the electricity sector. For example, drought events in 2013 and 2014 impacted water resources, reducing the water levels in reservoirs, in some cases to below 5% of their capacity. As a result, hydropower generation was jeopardised; the population suffered from blackouts and was requested to reduce their electricity consumption [4,12,13,14].
Concerns about the vulnerability of the electricity sector to drought events were already raised twenty years ago [9]. Hunt et al. concluded that drought events that impact hydropower generation in Brazil occur approximately every 10 to 15 years. Their analysis showed that 70% of hydropower is concentrated in regions under similar climate conditions. Our case study area, the Rio dos Patos basin, is located in this region.
Under the current characteristics of the electricity system, and considering climate change projections, the system is highly vulnerable [4,14]; therefore, hydropower energy is no longer a reliable investment for Brazil [10]. Therefore, further diversification of the electricity matrix will be crucial to adapt the energy sector to future climatic uncertainties [11].
Sugarcane mills produce sugar, bioethanol, biogas, biomethane, and other bioproducts from the juice extracted from the crop stalk. The solid residue (bagasse) has historically been eliminated through burning. Only a small fraction of the generated heat was used to produce steam and cogenerate electricity to cover the mills’ energy demands. To eliminate the residue, the bagasse, the sugar mills purposely dimensioned low-efficiency burning and steam production systems, given that it was not possible to cogenerate and deliver the surplus energy to the national grid. However, mills have the potential to improve the Rankine cycle and generate surplus electricity that can be injected into the national grid [15,16]. To address this issue, after the drought in 2002, the Brazilian government opened the market to alternative sources of electricity generation, including sugarcane in 2005 [10]. Among other biomass sources, sugarcane biomass has the potential to cover part of the demand during the dry season when hydropower plants are not working at their full potential [11,13]. According to [14], an increase in temperature due to climate change will benefit sugarcane. In Goiás, where our case study is located, the crop yield can increase by 4%. On the other hand, the authors of [17] analysed the sugarcane sector’s vulnerability under the RCP8.5 projections via the eight general circulation models. Their results showed that more areas in Goiás will require irrigation in the future, and that some areas currently under irrigation will be under high climate risk.
This paper aims to understand and assess the risk of the sugarcane system to drought events in the Cerrado biome in Brazil from both technical and socioecological perspectives, closing a research gap in the risk assessment of energy systems based on biomass sources. In Section 1, we provide the context for the analysis; in Section 2, we describe the study area, the system under analysis, and the risk framework. Section 2.2 offers a detailed description of the risk indicators, Section 2.3 provides a detailed description of the methodology used to assess the drought risk. The results are presented in Section 3 and discussed in Section 4. Section 5 presents the conclusions.

2. Materials and Methods
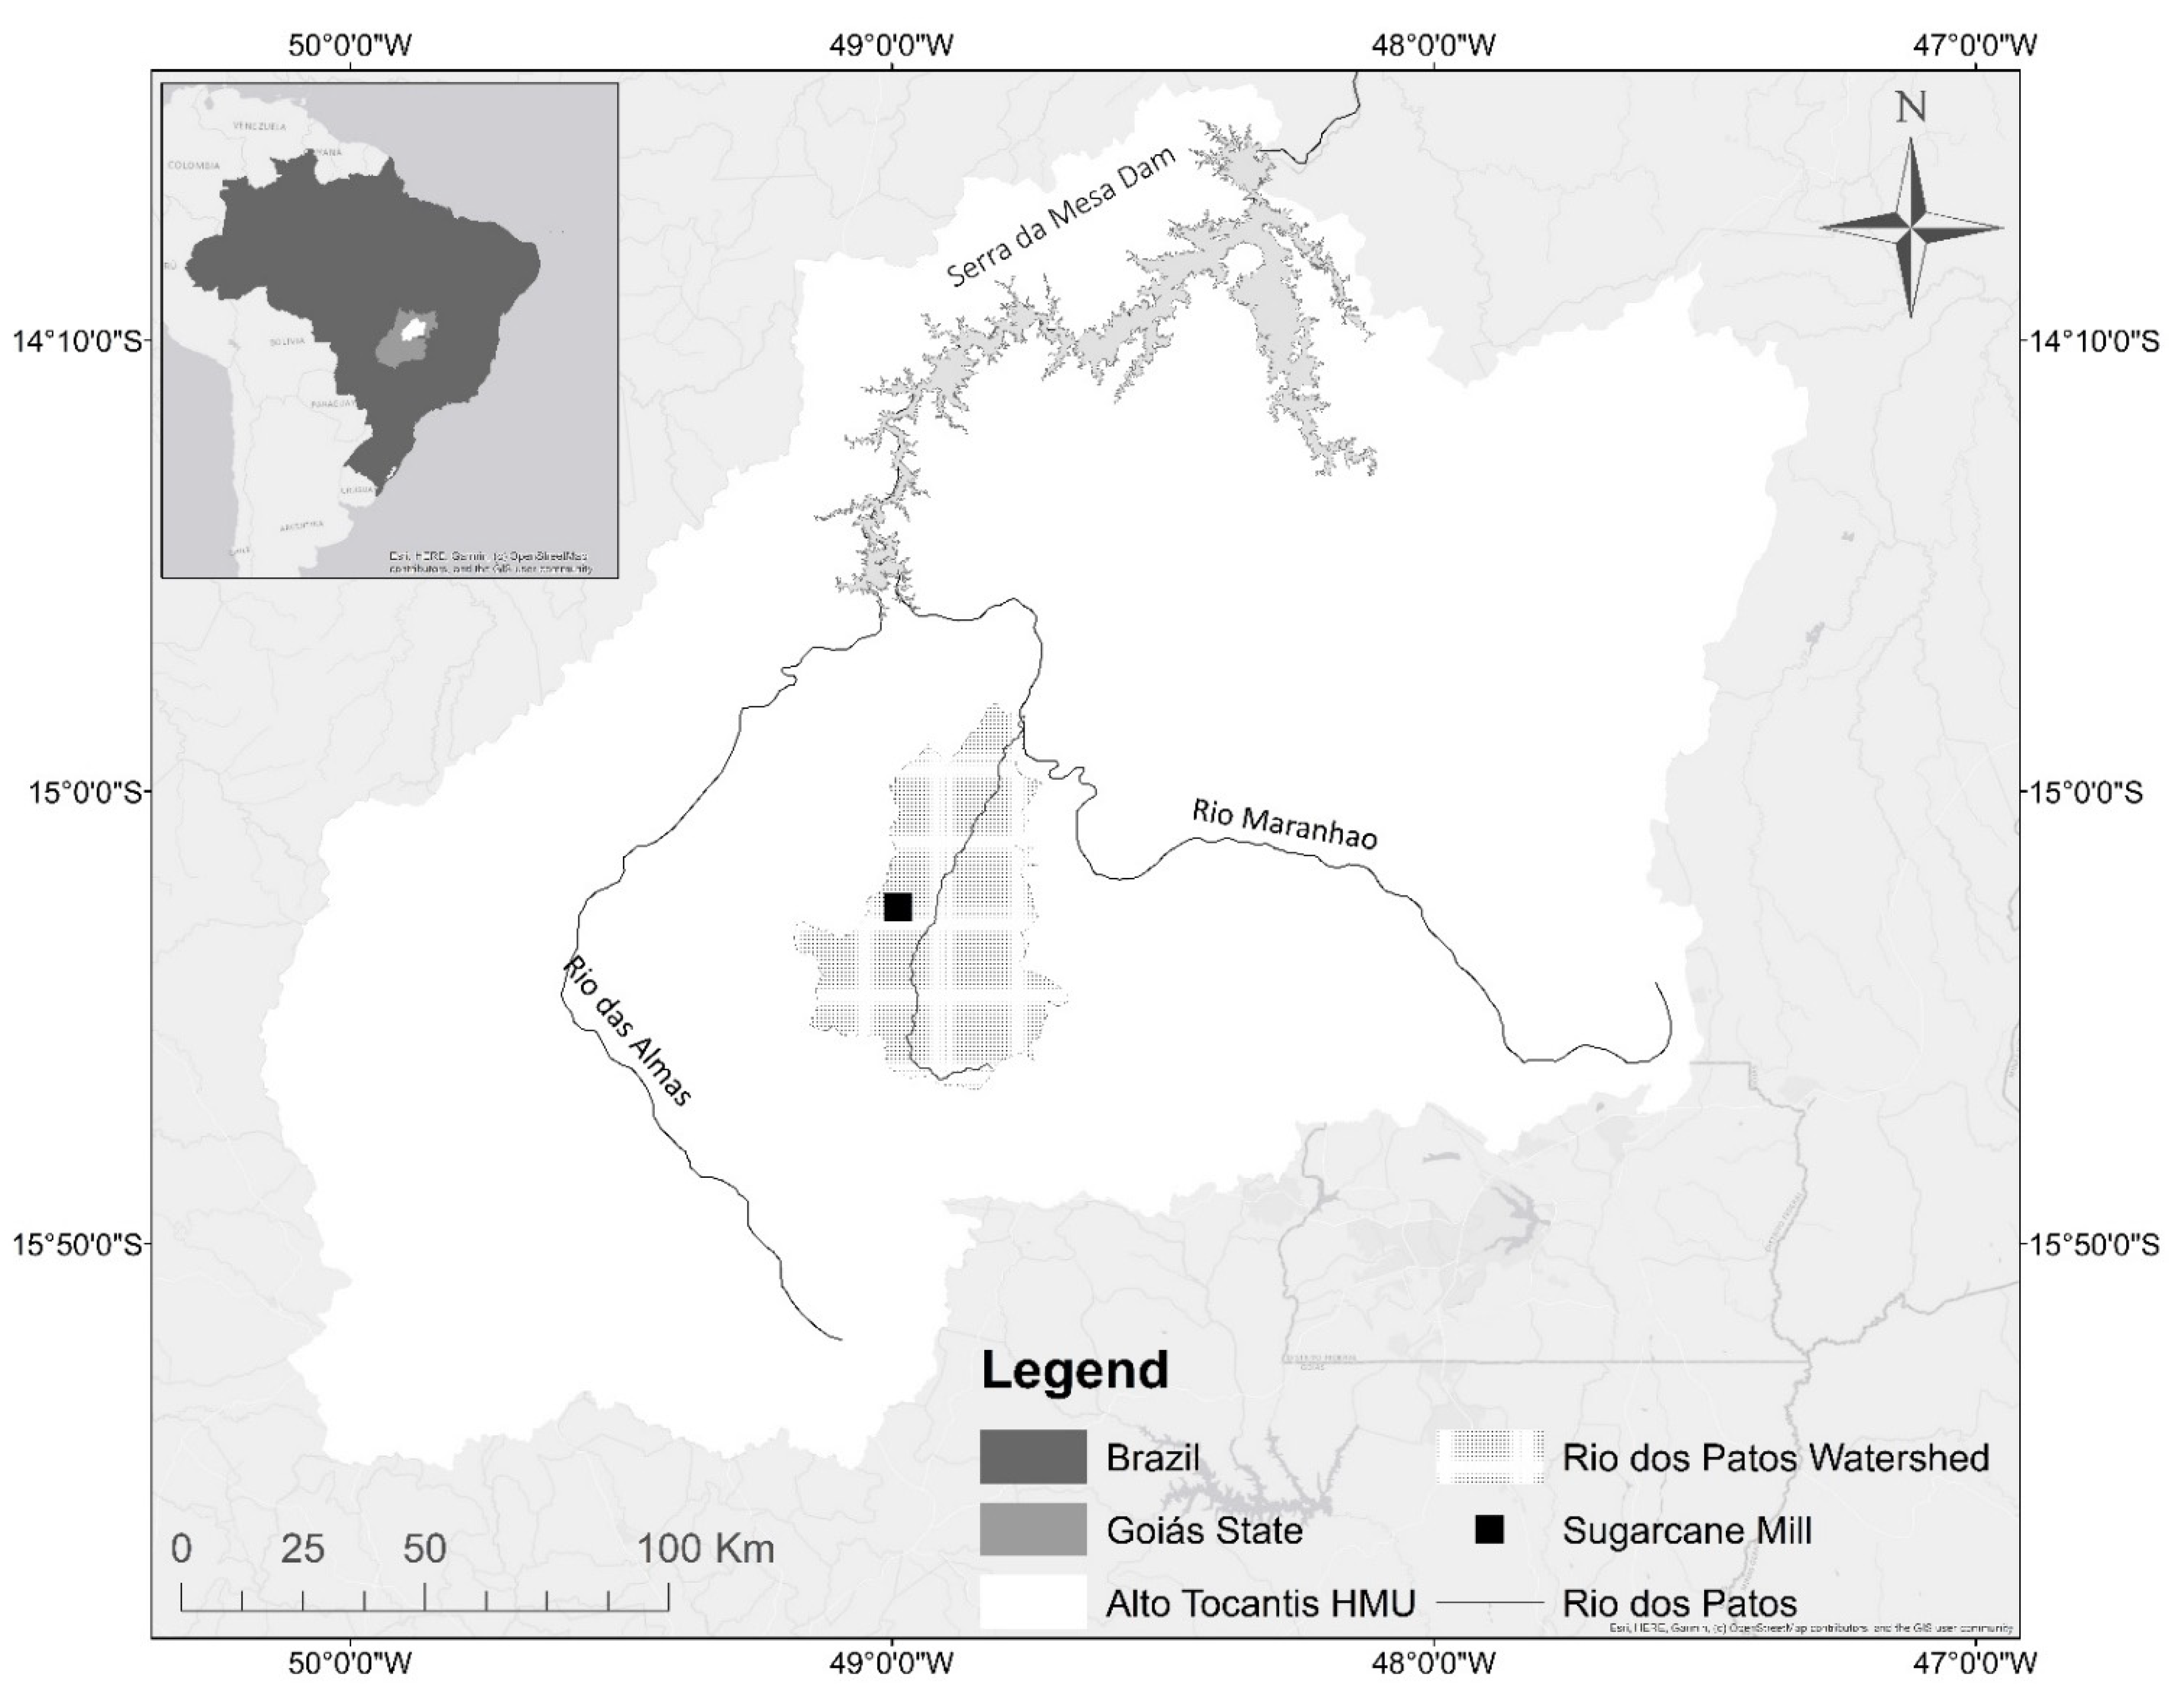
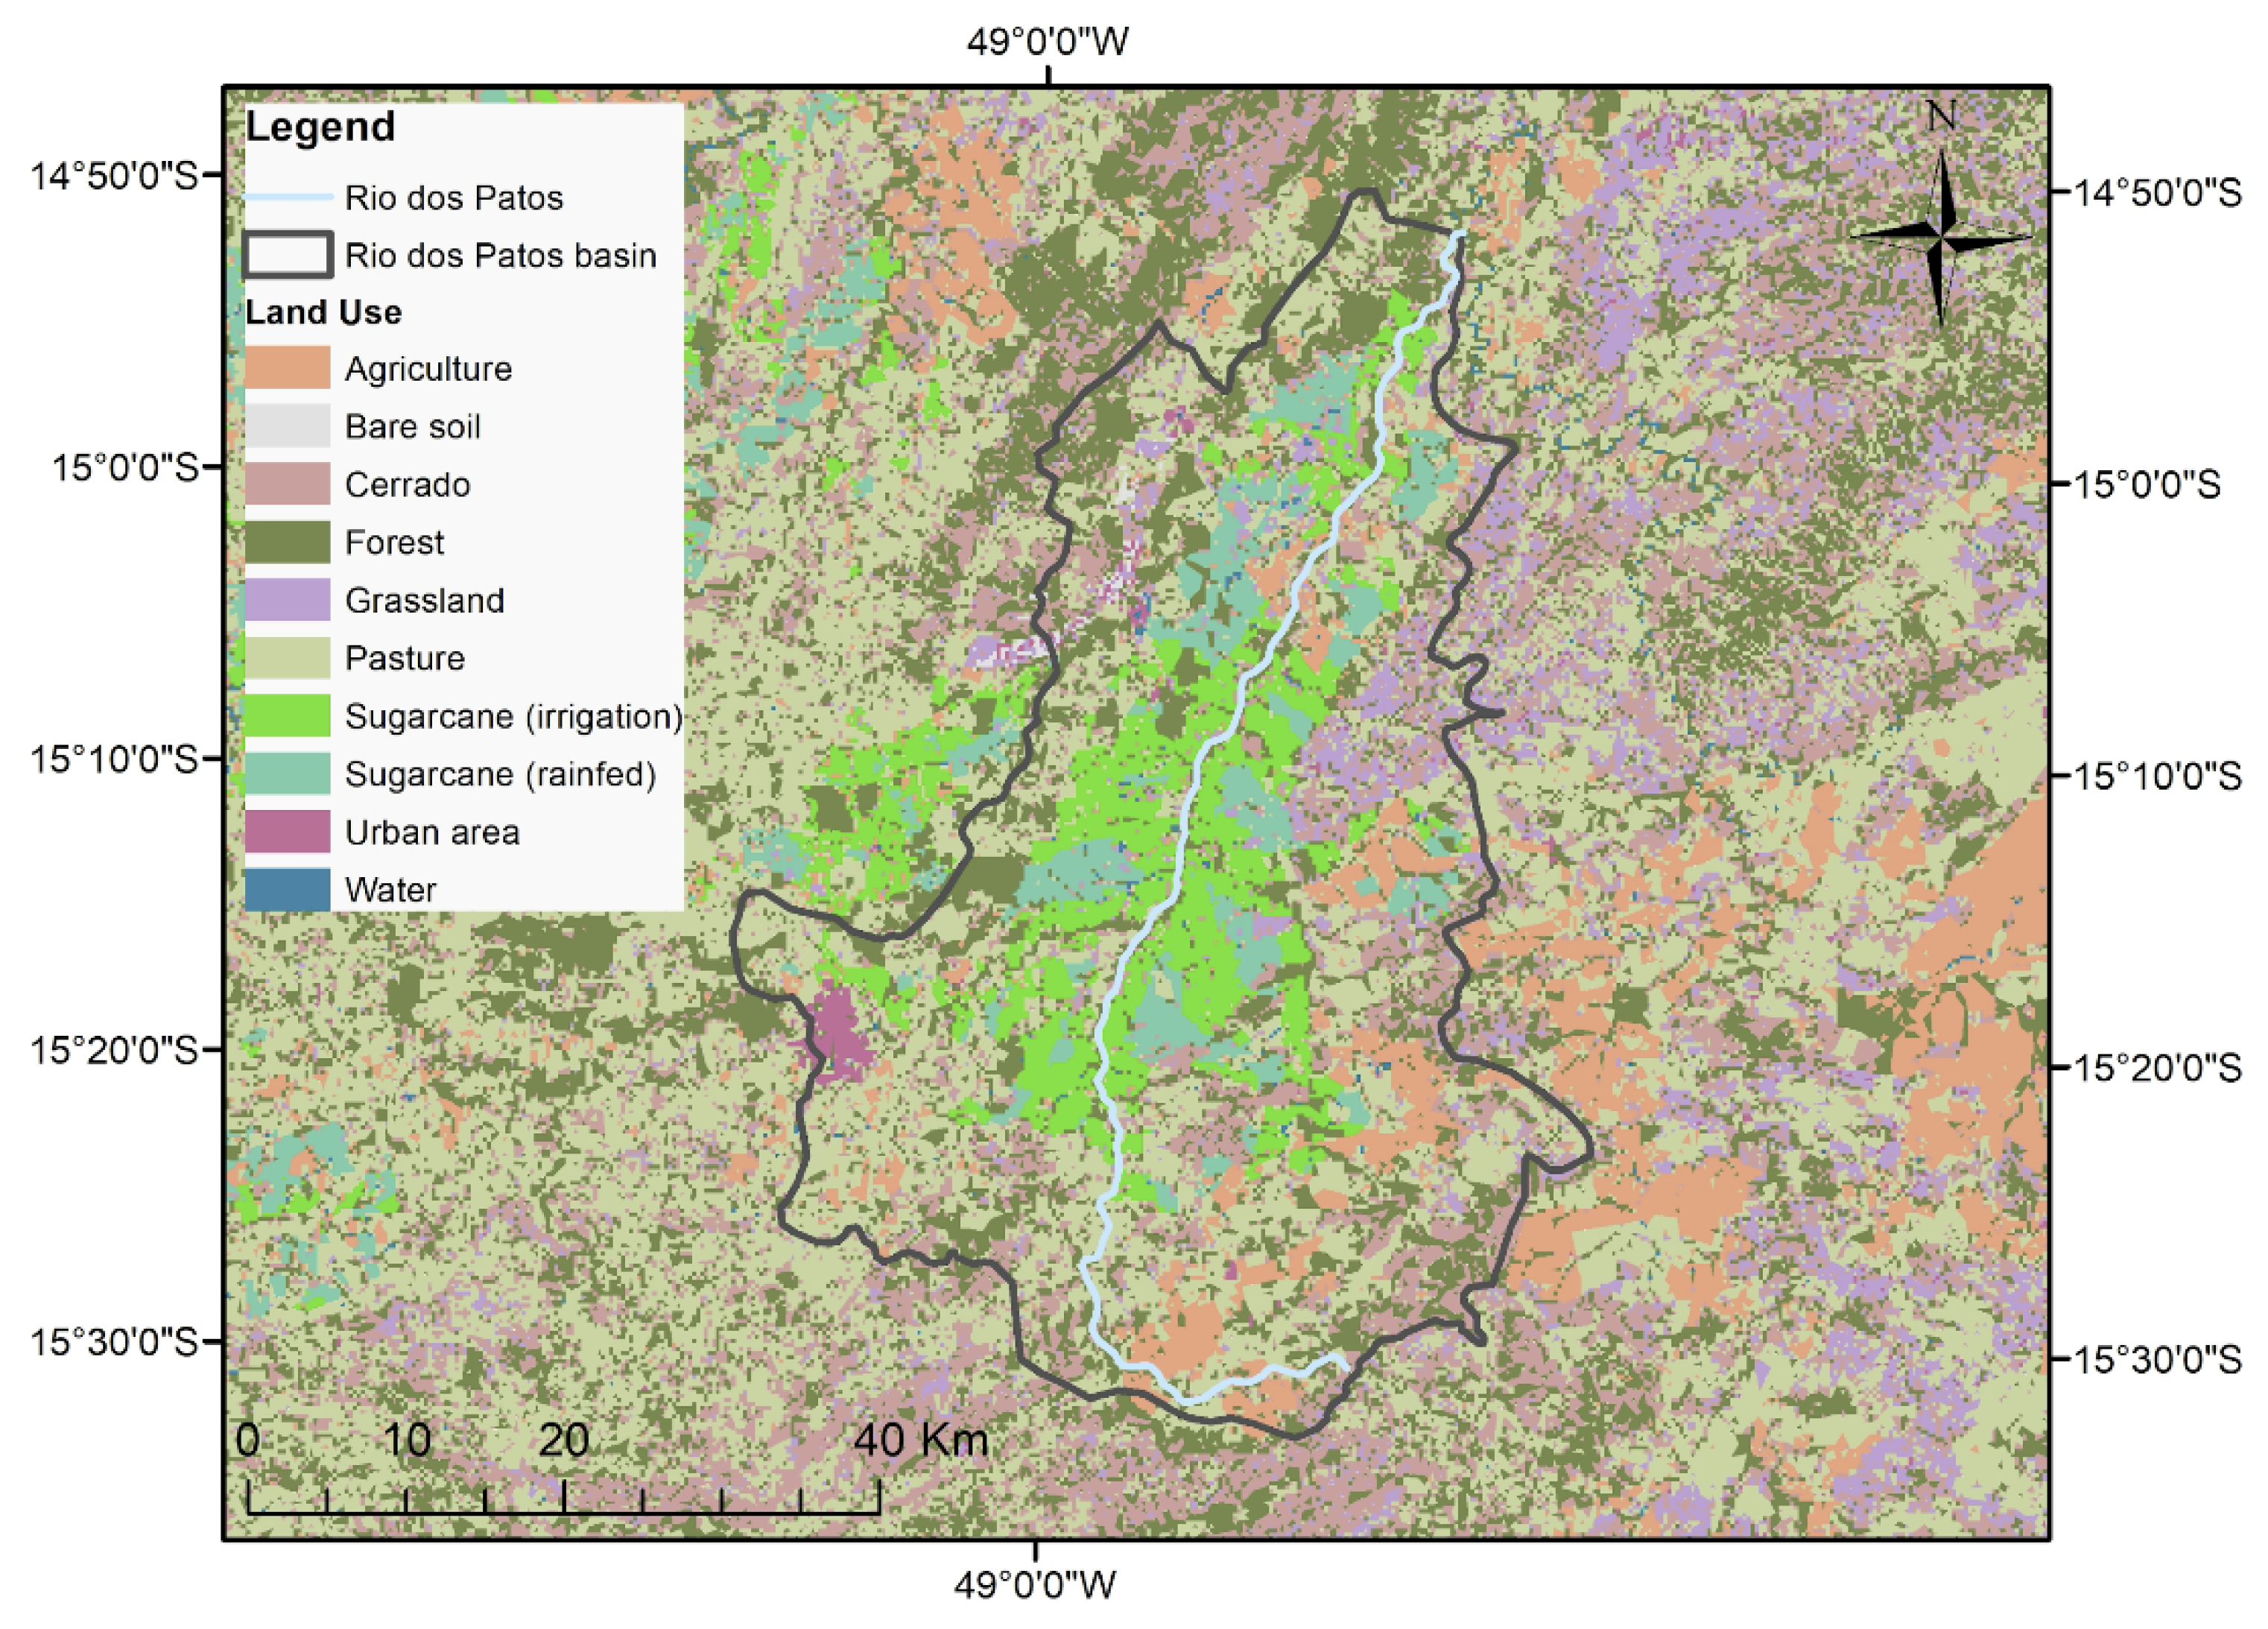
2.1. Study Site

To generate a comprehensive analysis of the sugarcane system and the risk of droughts, a case study region was selected. The Rio dos Patos basin is located in the Alto Tocantins hydrological management unit (HMU) in the Goiás state in central Brazil (Figure 1). It is located within the Cerrado biome, where sugarcane production expanded especially in the late 1990s [18]. The biome is home to half of the Brazilian sugarcane area, and has the highest sugarcane expansion rate across the country. The most important drivers of sugarcane expansion in the Cerrado biome are the availability of cheap pasture land, appropriate farm sizes for large-scale agriculture, and a flat topography, which supports mechanisation efficiency [18,19,20]. However, the climatological pattern is considerably different from that of the Atlantic Forest biome, where sugarcane production expanded from, especially regarding the precipitation distribution. The total yearly precipitation is similar, between 1200 and 2000 mm, between both biomes. Sugarcane’s 12-month potential evapotranspiration is also similar, ranging from 1500 to 3000 mm [20]. However, the precipitation distribution throughout the year is considerably more in the Atlantic Forest biome than in the Cerrado, a typical tropical savanna environment.
Consequently, effective rainfall in the Cerrado, i.e., the share of precipitation that turns into actual crop evapotranspiration, is rarely higher than 500–800 mm [20]. In the 1980s, sugarcane was introduced to the basin, taking advantage of the government’s incentives to occupy the Cerrado to create jobs for local people [21,22]. Since then, the sugarcane mill capacity has increased, and the sugarcane crop area has expanded.
Figure 1. Case study location. Database source: [23,24,25,26].
Sustainability 14 06219 g001

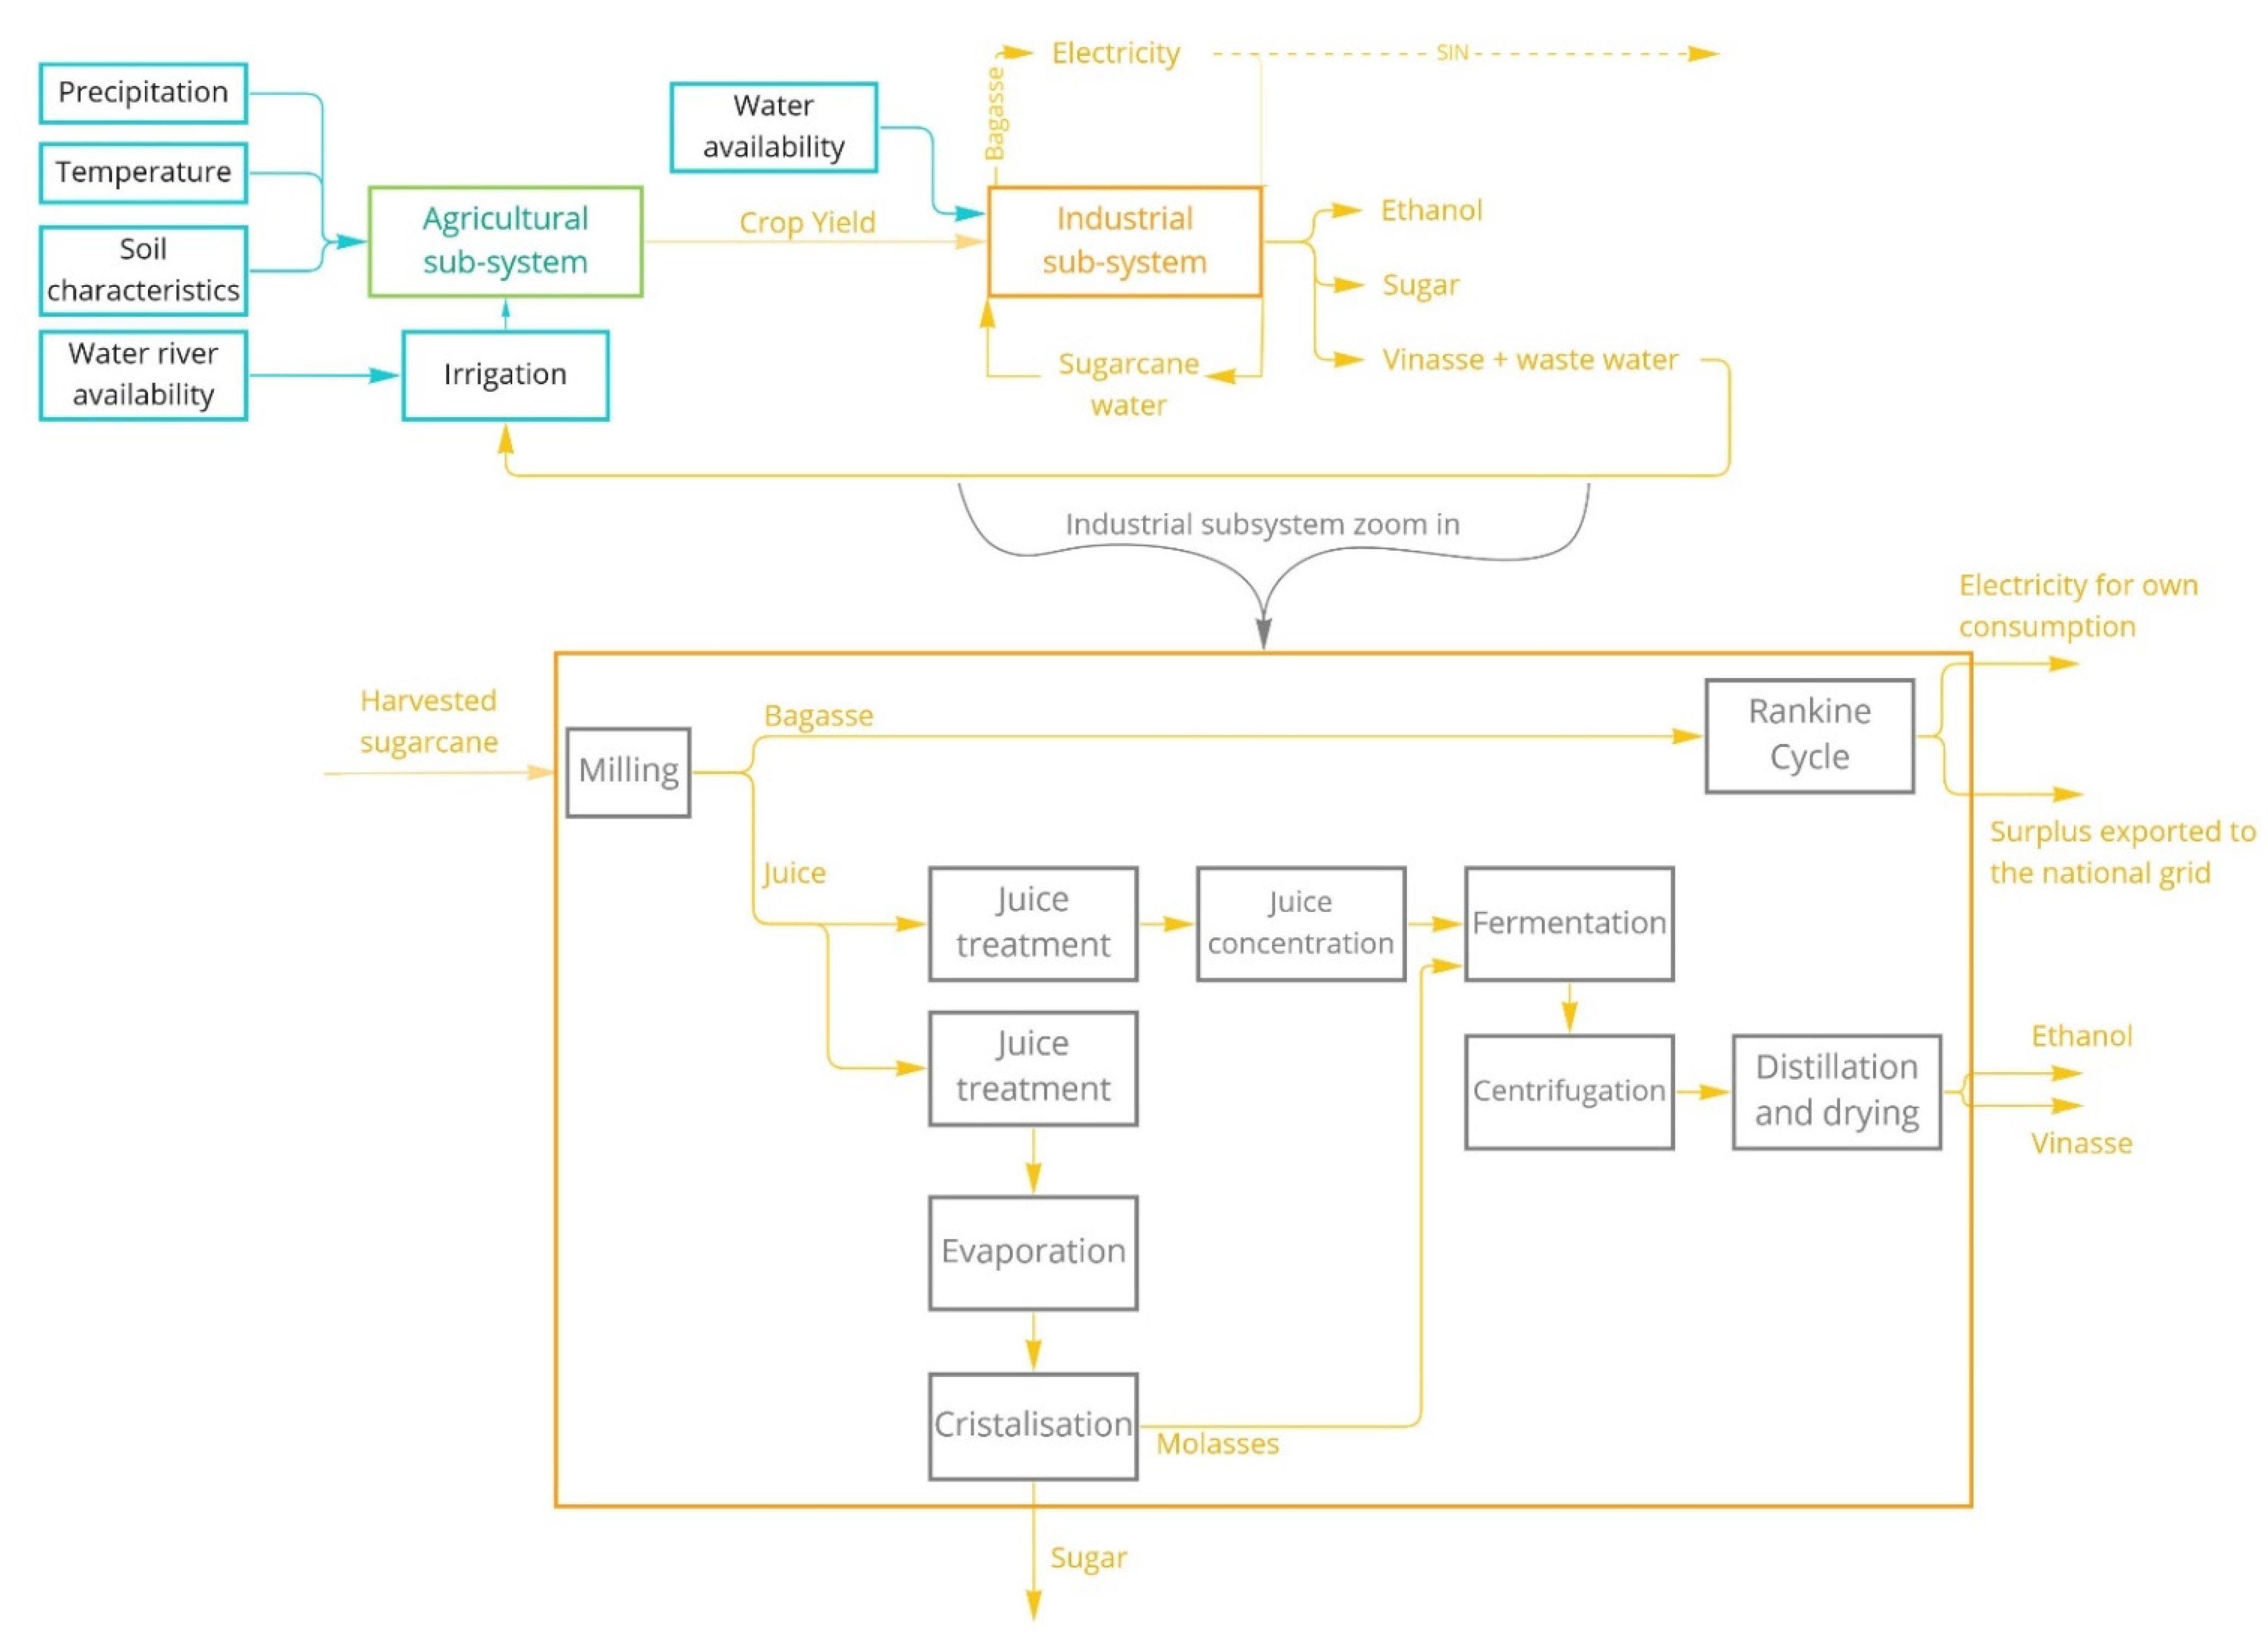
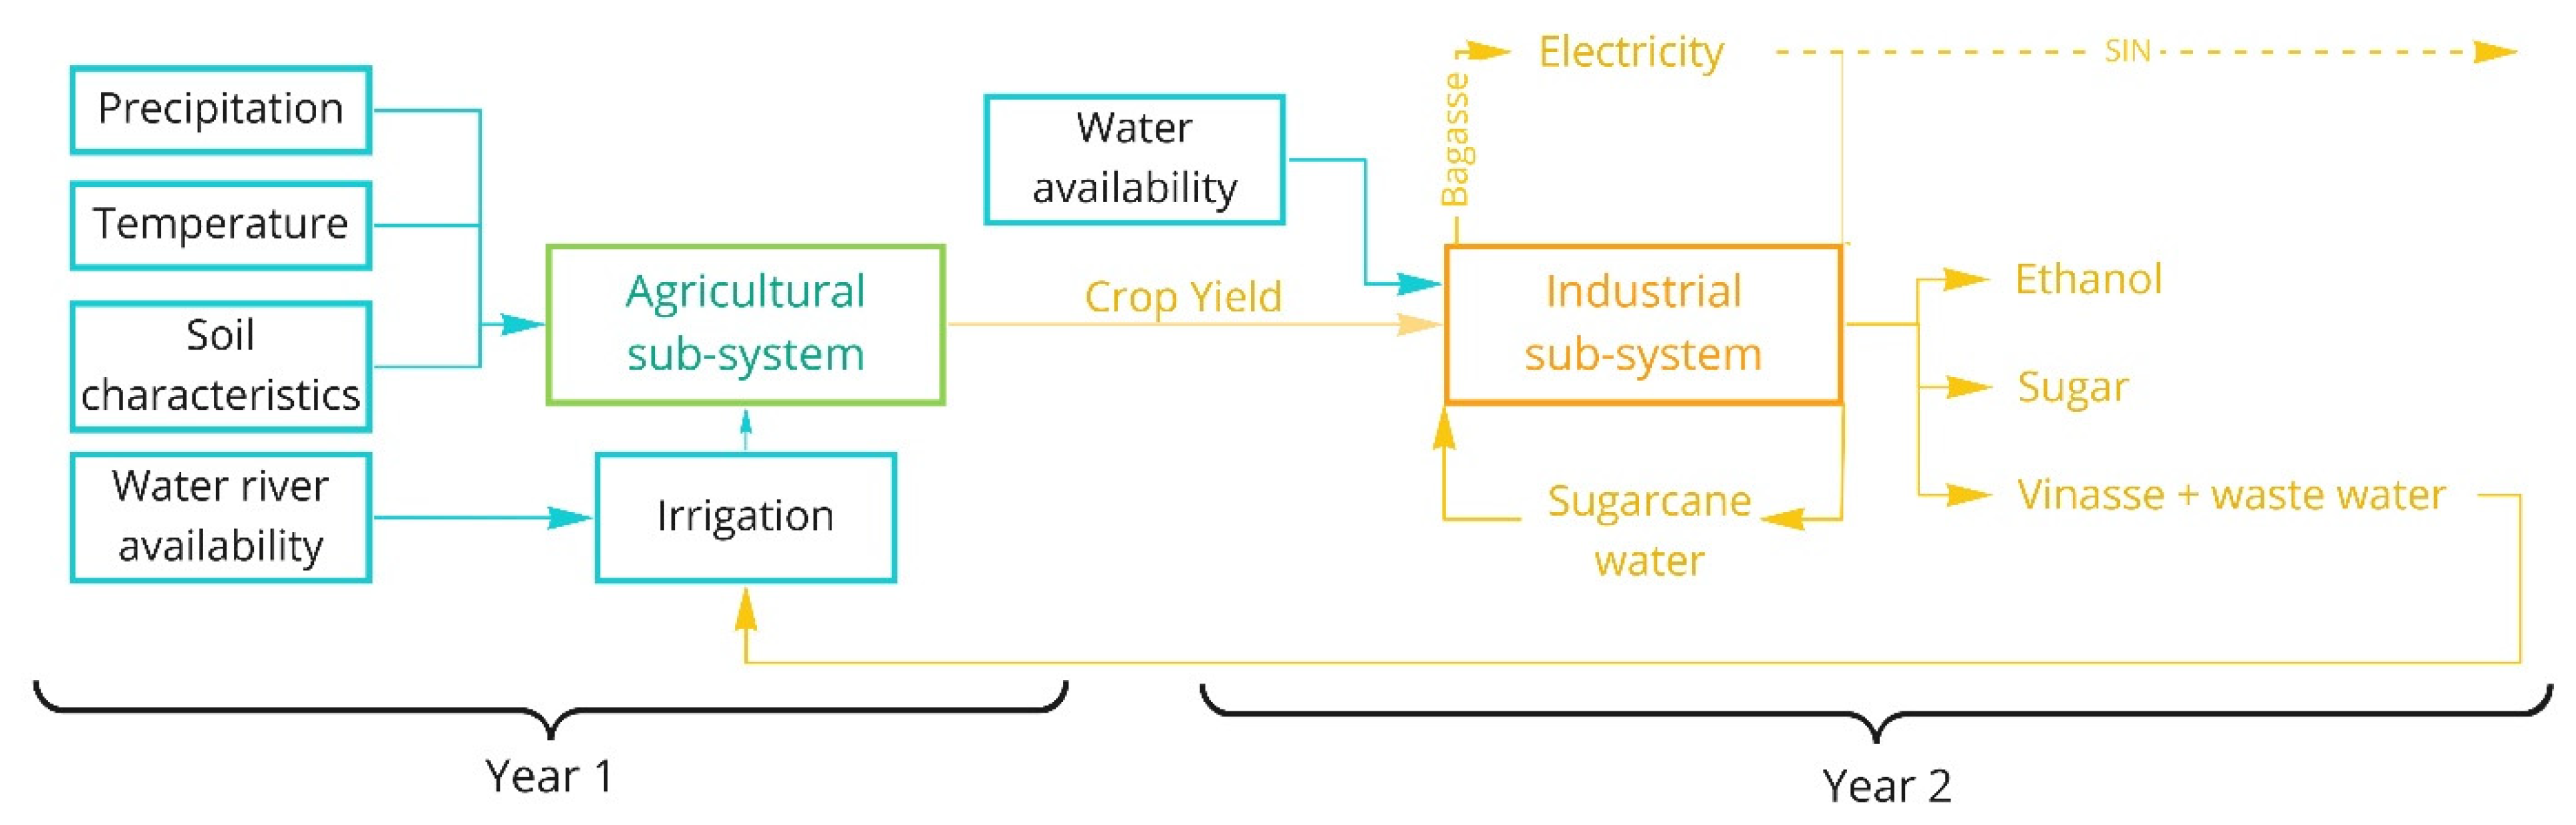
2.2. Sugarcane System Description

In the following section, the sugarcane electricity generation system is described to define the system’s boundaries and its major characteristics. In our case study, the system is composed of two subsystems, the agricultural and the industrial, which are interconnected and interdependent.
The agricultural subsystem determines the crop yield and the quality of the sugarcane for its further processing. The industrial subsystem determines the amount of electricity produced that can be sold to the grid. Figure 2 illustrates the sugarcane system and subsystem flows, as well as the direction of the cascading effects if a component fails to function.
The design of sugarcane industrial subsystem flows and directions requires a proper understanding of historical steam and electricity production trends in sugarcane mills before and after government regulations allowed surplus produced electricity to be sold to the national grid. Before 2005, sugarcane mills produced steam and electricity to cover their electricity demands only. Therefore, the mills were deliberately designed with low-efficiency boilers to burn out the bagasse and remove the waste [16,27]. Afterwards, to produce more electricity and take advantage of the new legislation that allowed the selling of surplus electricity to the national grid, mills began shifting from steam to electric engines, assembling more-efficient high-pressure boilers and revamping the whole industry towards a more energy-efficient production and self-consumption setup [28]. However, as this is still an ongoing process, and not every mill has state-of-the-art equipment in terms of energy efficiency, electricity production and delivery to the grid depend on a mill’s general function and adopted technology. Another important aspect is that in the particular case of Brazil, as bagasse is a waste (residue) of ethanol and sugar production, it can only become a byproduct if used to cogenerate electricity in the same mill [5] (other countries might use the bagasse for paper production, animal food enrichment, the production of pharmaceutical compounds, and other nonenergetic uses that are not common yet in Brazil [29,30]). It cannot be sent to or brought from another mill due to its low density and high transportation costs. Additionally, a mill is assembled and configured to a specific range of milling capacity; therefore, minimums of sugarcane crop yield and production are required to be economically feasible to produce sugar, ethanol, and electricity. Consequently, if the agricultural subsystem does not produce a minimum volume of sugarcane, surplus electricity will not be generated.
The agriculture subsystem functions depend on precipitation, temperature, soil amendments, and crop as well as water management. The crop yield and agricultural production efficiency are a result of the combination of the above variables. The yield potential and agricultural efficiency have improved over the years through research and innovation, improving the current production systems [5]. Crop management practices have evolved to cope with the rougher weather and soils of the Cerrado, as well as with the demand- and production-scale trends. Other relevant improvements in the system are drought-resistant sugarcane varieties, the development of mechanical instead of manual planting technology, better crop nutrition, integrated pest and disease management, including the adoption of biological control, and, especially, the shift from burnt and manual to mechanical harvesting [31]. Additionally, relevant to the system is the development of new practices, such as deficit-irrigated and minimum-till production systems [32].
Among the aforementioned developments is the improved use of vinasse, a potassium-rich liquid waste of ethanol production. It is used for sugarcane fertilisation and has been shown to improve crop yield [33]. As sugar production does not produce vinasse waste, its availability will depend on the share of sugarcane allocated to ethanol production instead of sugar, as well as the raw material quality. Vinasse is frequently mixed with industrial wastewater to irrigate sugarcane fields [34].
Vinasse and industrial wastewater are then the feedback loop to the agricultural subsystem [34]. The efficiency and water management in a mill will influence the quantity of vinasse and wastewater that will be available to return to irrigate the sugarcane fields. If a mill decreases its ethanol production, the amount of vinasse is reduced, and, therefore, a smaller area can be fertirrigated, meaning that the crop yield could be affected.
A year with lower crop yield and sugarcane with lower water content will affect the vinasse production and wastewater volume to be used for the next crop season. It will then affect the crop yield of sugarcane areas under fertirrigation and reduce the crop yield for a consecutive year, creating a loop interlinkage between the agricultural and industrial subsystems.
In terms of water, the sugarcane mill industry subsystem is almost a closed system, because the crushing process extracts most of the sugarcane water, about 72% of its content, which is later reused and recycled in other processes [35,36]. A mill needs an input of freshwater exclusively for the boilers, which require a specific water quality to keep the equipment functioning. If sugarcane is exposed to drought events for an extended period and is not strategically irrigated, its water content will decrease. Therefore, more freshwater will be required to cover the demand, even if a mill rearranges the process to recirculate water more efficiently. In this scenario, there will be less wastewater available to irrigate the fields, and, therefore, more freshwater will be required.

2.3. Risk Analysis Description

The risk assessment explained in detail in Section 2.4 is based on indicators developed to assess the different components of risk. These indicators are selected based on the system and the hazard analysed, in this case drought events, and a sugarcane system with two main subsystems (Figure 2), the agriculture and the industrial.
The risk analysis considered two particularly relevant characteristics of the system. The first one is that sugarcane is a semi-perennial crop, and its growing season usually extends for 12 months before it is harvested and processed. Because the whole sugarcane volume cannot be harvested and processed at once, and the Cerrado’s rainy season extends from November to March, the harvest and milling season lasts from April (the end of one rainy season) to November (the beginning of the next rainy season). Therefore, sugarcane relies on the soil water content of the previous rainy season to reshoot and start development, and depends on the next rainy season to continue growing in later crop phenological stages. For this reason, the sugarcane yield of a year, and then the agricultural subsystem, are affected not only by the climatic and management factors of the current year but also by those of the previous year. Therefore, there is a time lag between the agricultural and industrial subsystems. This means that, during the first year, the sugarcane will grow and be impacted by the weather and management characteristics of that year alone. However, in the second year, when the harvest starts, the crop yield will reflect the impacts not only from the current year but also from the previous year. The mill then processes the sugarcane and the industrial subsystem faces the impacts of the water availability in the second year of production (Figure 3).
The second characteristic considered was that sugarcane is frequently under water stress. In this case study, around 20% of the sugarcane area is solely rainfed, and around 60% receives fertigation or salvage irrigation. Vinasse (~15 mm) and salvage irrigation (~30–60 mm) are applied in a single event immediately after harvest to promote sugarcane reshooting for a new growing cycle. Altogether, the yearly water deficit is equivalent to 40–60% of crop potential evapotranspiration in these areas. The remaining area, around 20%, is under a deficit-irrigated production system, receiving 100 to 500 mm of irrigation throughout the growing season, which could result in a final yearly water deficit of around 20–40% of crop potential evapotranspiration. If the beginning of a new growing season starts with a well-spread late rainy season, even with solely rainfed representing a low percentage of the case study sugar mill, and the salvage and deficit-irrigated sugarcane are under constant water stress, the impacts of a drought on the crop yield might not be too substantial in this first year (see Figure 3). However, when a first short rainy season is followed by a late start of the next rainy season, extending the drought event to the beginning of the next growing season (see Figure 4), the sugarcane yield of the first year will be affected, and that of the second year even more.

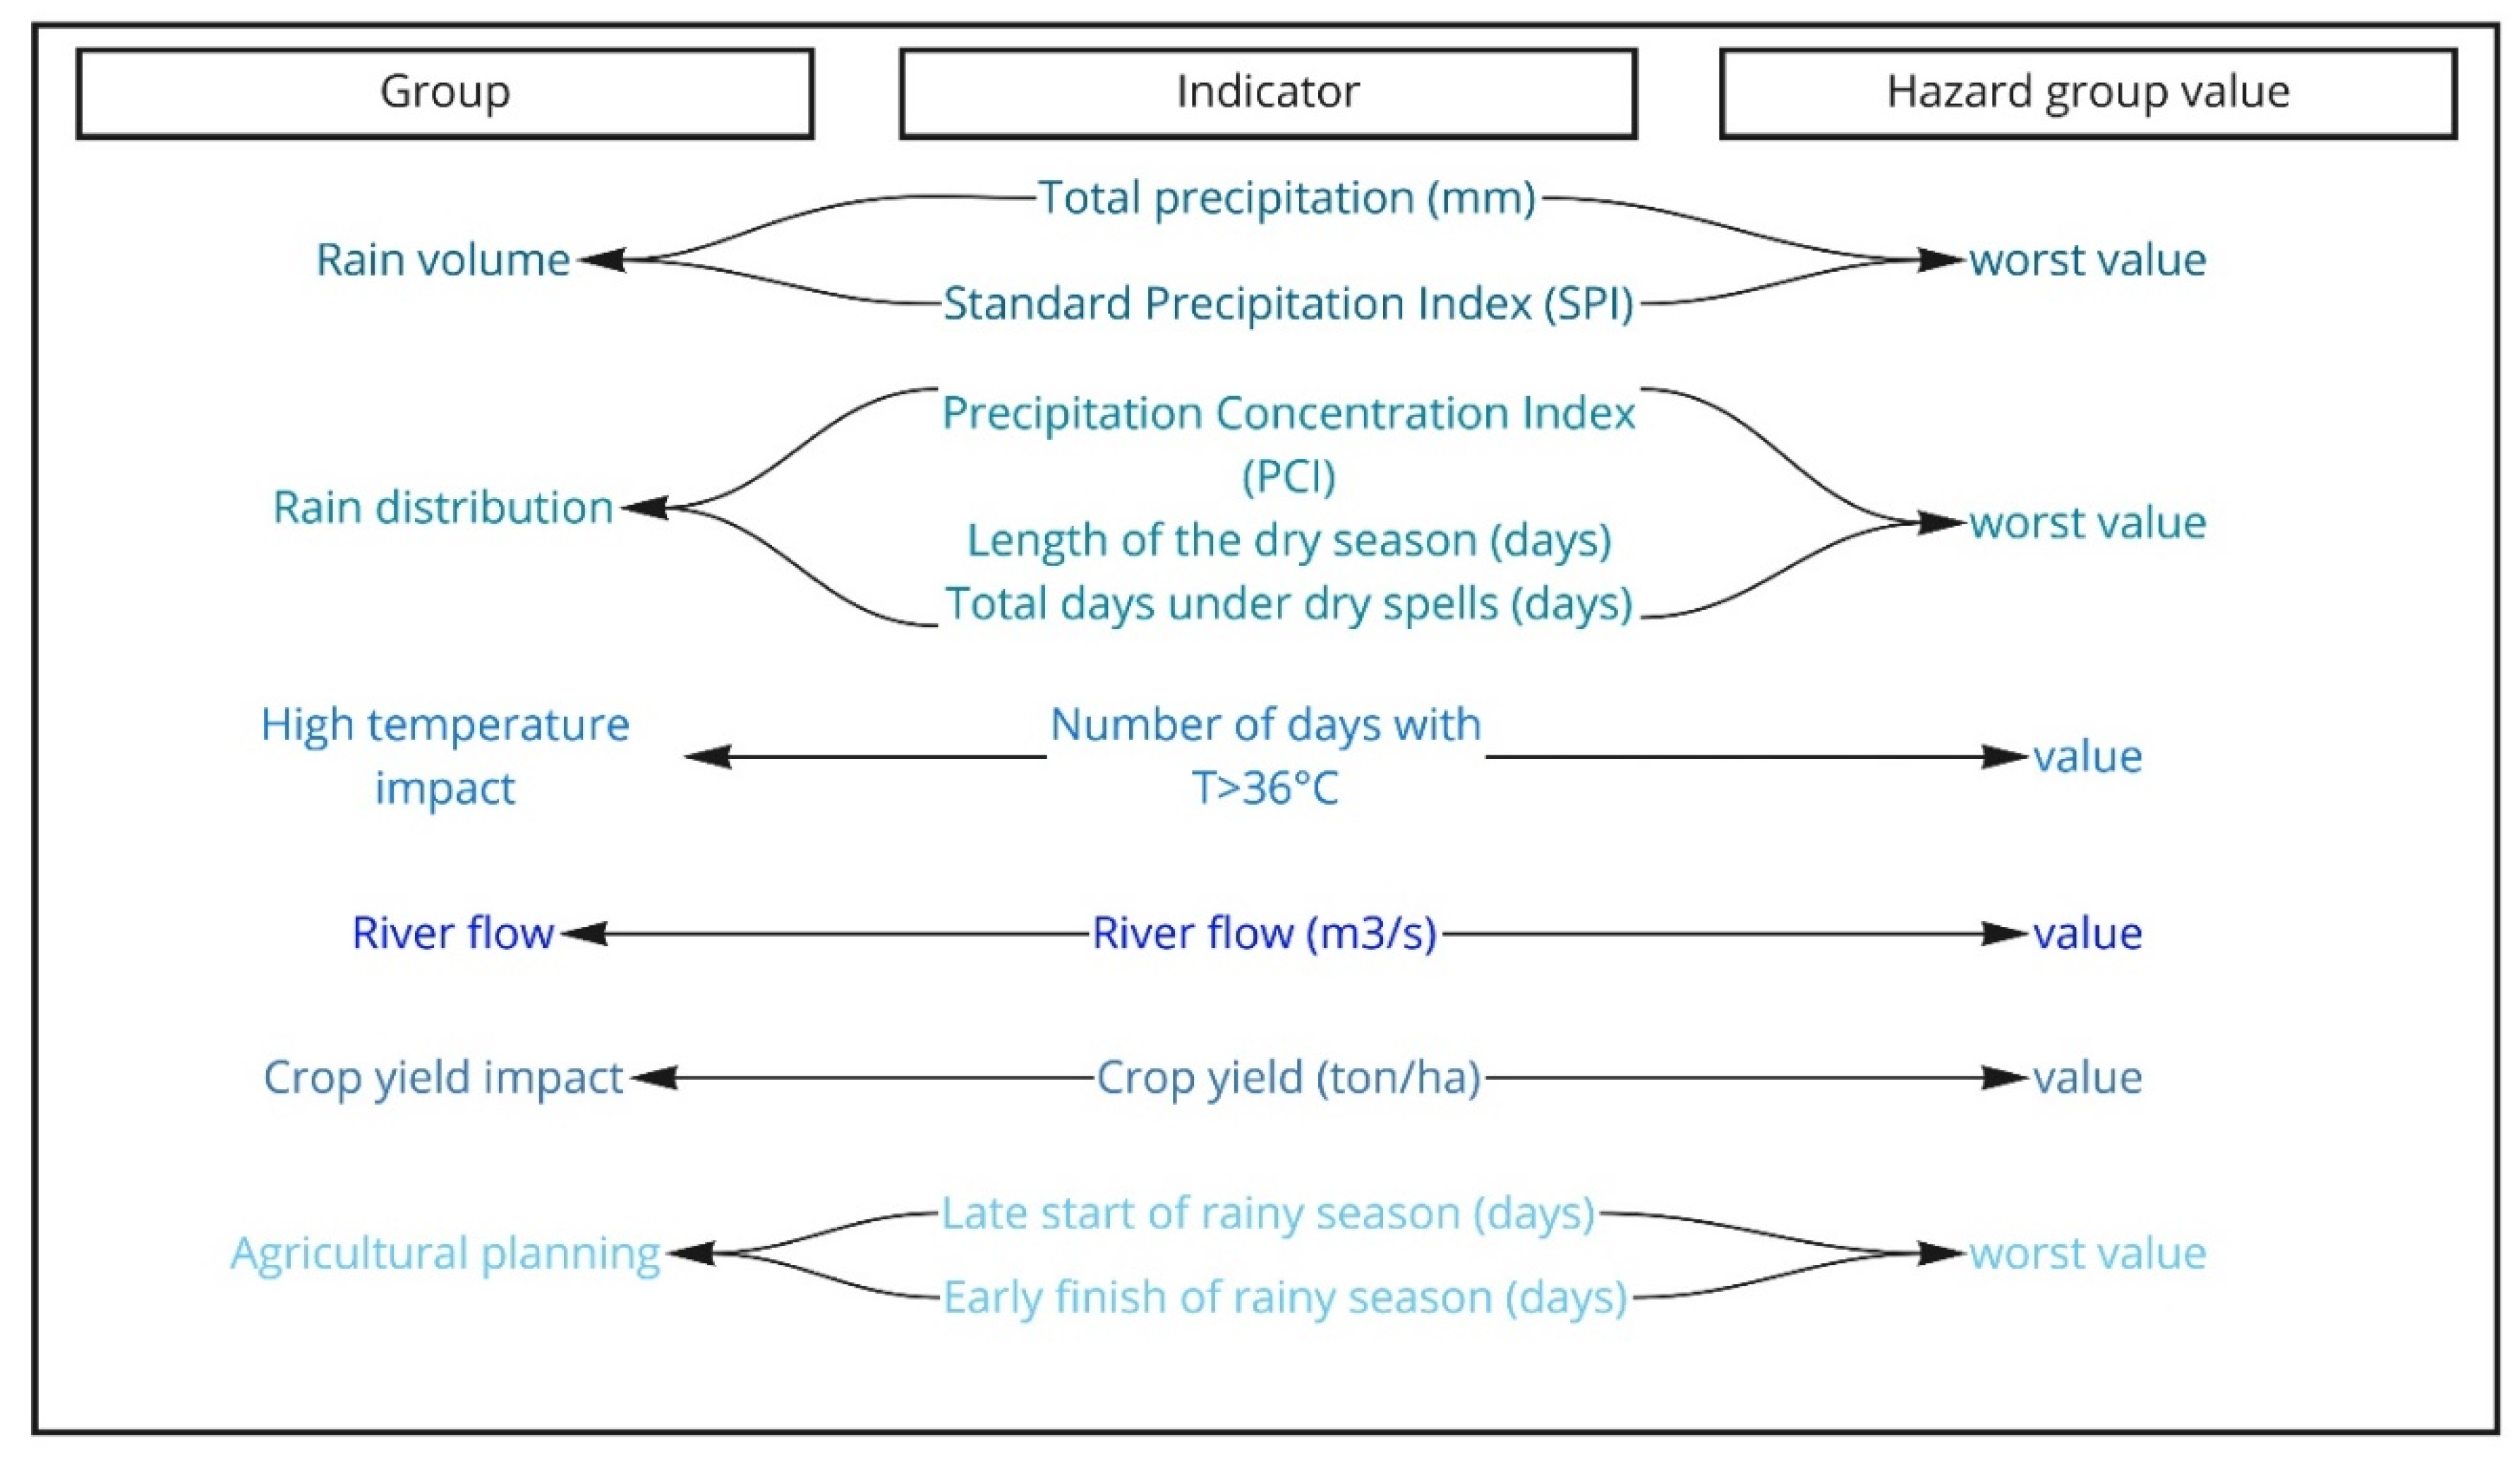
2.3.1. Agriculture Hazard Indicators

The agricultural hazard was analysed based on ten indicators (see Figure 5) and organised into six groups. The indicators were selected to capture the weather change patterns and effects in the region that characterise a drought event and affect the sugarcane growth pattern. The indicators considered as the most important were (i) the standard precipitation index (SPI), which is defined as the difference of precipitation from the median of a determined period, divided by the standard deviation from the same period [37,38], (ii) the annual total precipitation (mm) (November to March), and (iii) the crop yield (tonne/ha). Additionally, based on stakeholders’ expertise, a drought event was considered to occur when:
  • (iv and v) The precipitation starts later or ends earlier than usual (analysed by counting the number of days);
  • (vi) The length of the dry season is longer than usual;
  • (vii) There are dry spells within the rainy season (total consecutive days with precipitation less than 2 mm);
  • (viii) The precipitation is concentrated in time, as defined by the precipitation concentration index (PCI), developed by [39], which is a statistical measure of how concentrated in time the precipitation is;
  • (iv) Air temperature reaches above 36 °C;
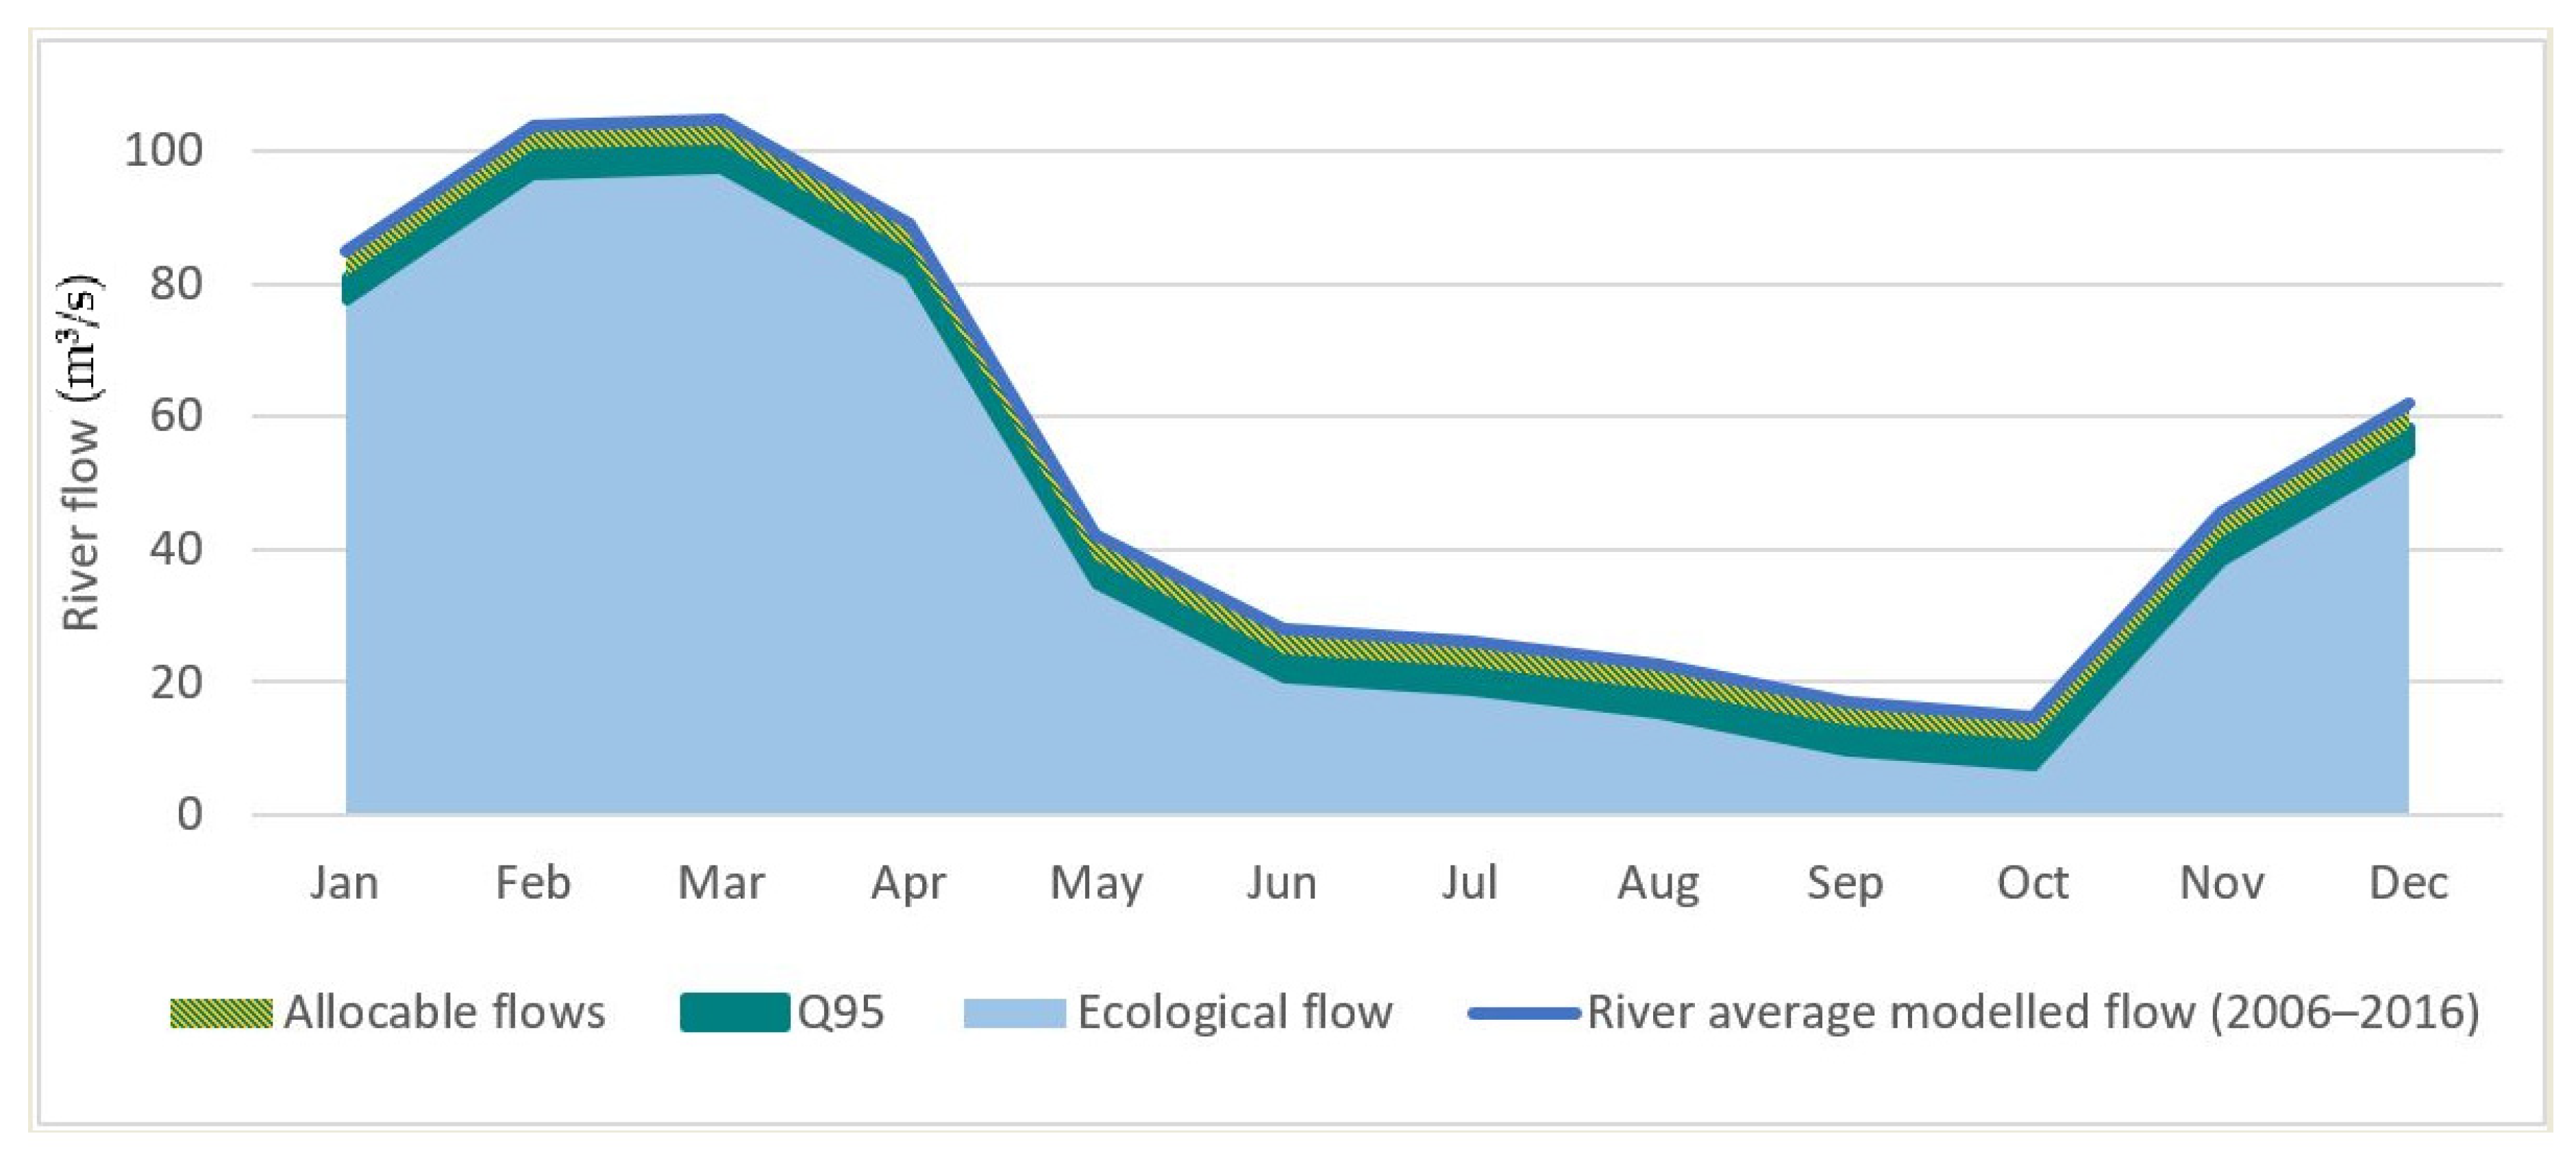
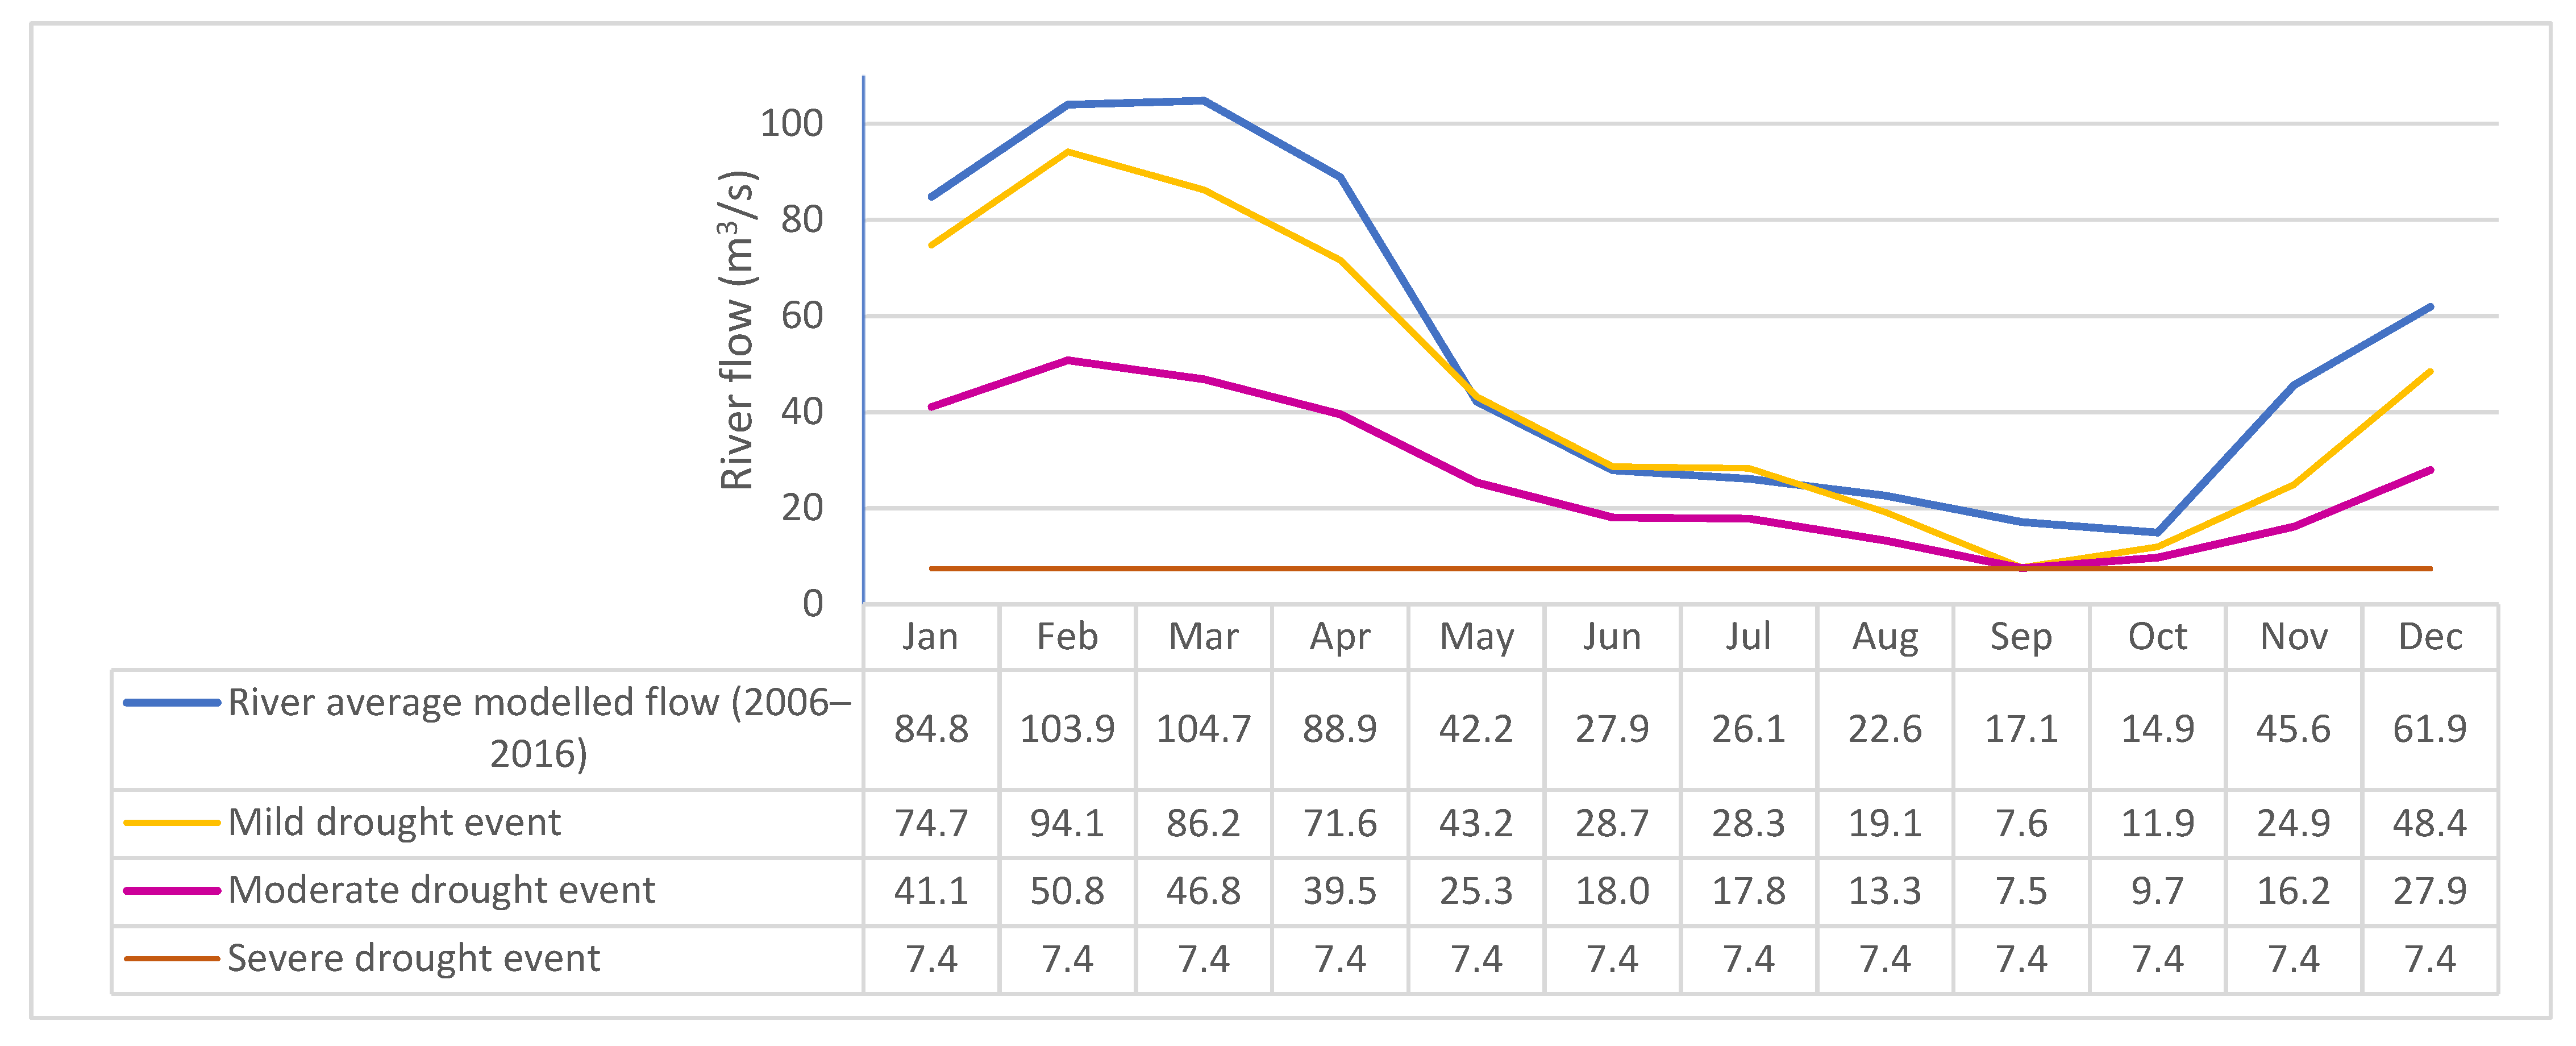
  • (v) If the ecological river flow is jeopardised.
The ten indicators reflect when the precipitation or the temperature has changed towards a drought event based on historical data. The thresholds were defined based on the first quartile of the historical data. These values are used by the sugarcane farmers and experts from Embrapa Cerrados as a threshold for expected precipitation, temperature, and water availability patterns in the region. The standard deviation was used to define levels of impact for the indicators (see Table 1). The SPI has a classification, which was used in this paper.
The six groups selected to analyse the hazards related to the agriculture subsystem were the following: (I) rain volume, (II) rain distribution, (III) high-temperature impact, (IV) river flow, (V) crop yield impact, and (VI) agriculture planning (Figure 5). The indicator values range between zero and minus three, the latter being the most severe scenario. These indicators were clustered in the mentioned groups, and the hazard overall group value was defined as the worst scenario (lowest value) among its indicators.

2.3.2. Industrial Hazard Indicators

The industrial subsystem requires a certain volume of water for the optimal performance of the system. The minimum volume of water is the so-called makeup water volume, which is the volume needed to compensate for water losses during industrial processing. Hence, the indicators relevant for the industrial drought hazard analysis are the river flow after subtracting the ecological flow [40], as well as the water retained during the rainy season.
For this indicator, monthly thresholds were set, considering the minimum ecological flow the basin should have, the water demands of other users in the basin, and the water retained during the rainy season. The highest hazard value from the monthly analysis was classified as the annual hazard. This means that, in a month in which the ecological flow was jeopardised, the indicator value was set to one.
According to Goiás state law, the river flow that can be allocated to users is half of the Q95, or the river flow rate that guarantees permanence 95% of the time [41,42].

2.3.3. Agriculture Exposure Indicators

The exposure in the agricultural subsystem is expressed as the percentage of the basin covered by irrigated and rain-fed sugarcane fields. A land-use map was prepared using MapBiomas vector data for the region as a base. Sugarcane fields were mapped using the mill shapefiles and the products from the Canasat project, a project that focuses on mapping sugarcane fields yearly and monitoring their expansion [43,44] (see Table 2).
Additional data were acquired through the Rural Environmental Register (CAR in Portuguese) [45]. Under environmental regulations, farmers are obliged to upload maps of the area of the farm, the area covered by native vegetation, permanent preserve areas (APPs in Portuguese), the restricted use area, and the legal reserve area (ARL in Portuguese). The APPs are margins of water bodies, slopes, and hilltops; for environmental protection purposes, they cannot be touched. The ARL is an area that must be preserved; instances of it vary depending on the biome. In Cerrado, this accounts for 35% of the farm area. In Cerrado, the APPs can be counted as part of the ARL. Based on the information available, it was possible to map wherein the basin those particular areas are located to understand how much sugarcane can indeed expand. Water bodies were used to identify sugarcane fields under potential irrigation.
For the estimation of potential sugarcane expansion, certain areas were excluded: APPs, legal reservation areas, ARLs, existing sugarcane crops, slopes of >12%, and areas with native vegetation remnants. Priority areas were those close to the mill (45 km) and close to current sugarcane crop areas (10 km). Sugarcane can be irrigated in areas close to streams, dams, and current withdrawal points (2 km). Accordingly, distance maps were calculated for existing sugarcane plantations, for the sugarcane mill within the study area and all rivers. Areas suitable for potential sugarcane expansion were classified according to the following:
  • Areas that were not priority areas and where irrigation was not possible.
  • Areas that were not priority areas and where irrigation was possible.
  • Areas that were priority areas and where irrigation was not possible.
  • Areas that were priority areas and where irrigation was possible.
Details about the sources can be found in Table 2 below.
Table 2. Land-use datasets used to create the current and future land use.
InformationDatasetSource
Hydrological boundaries and bodiesHMU boundaries[25]
Rivers and water bodies
SugarcaneSugarcane fields in Goiás with information about the age of the sugarcane (Cansat)[43,44]
Sugarcane fieldsSugarcane mill through Embrapa Cerrados
Land useNative vegetation, APPs, and ARLs[45]
Land-use cover[46] (MapBiomas Project—a multiinstitutional initiative to generate annual land cover and use maps using automatic classification processes applied to satellite images. A complete description of the project can be found at http://mapbiomas.org, accessed on 15 July 2019)

2.3.4. Industrial Exposure Indicators

In the industrial subsystem, the exposure is the potential installed (65 MW), which represents 5% of the installed capacity by sugarcane mills in Goiás [47] and 95% in the Rio dos Patos basin. Compared to the other seven mills in Goiás with similar milling capacities, the analysed mill has the second-largest installed power capacity [48].
For the historical analysis, information and data about the sugarcane fields and mill operations were retrieved from reports, historical data, and maps.

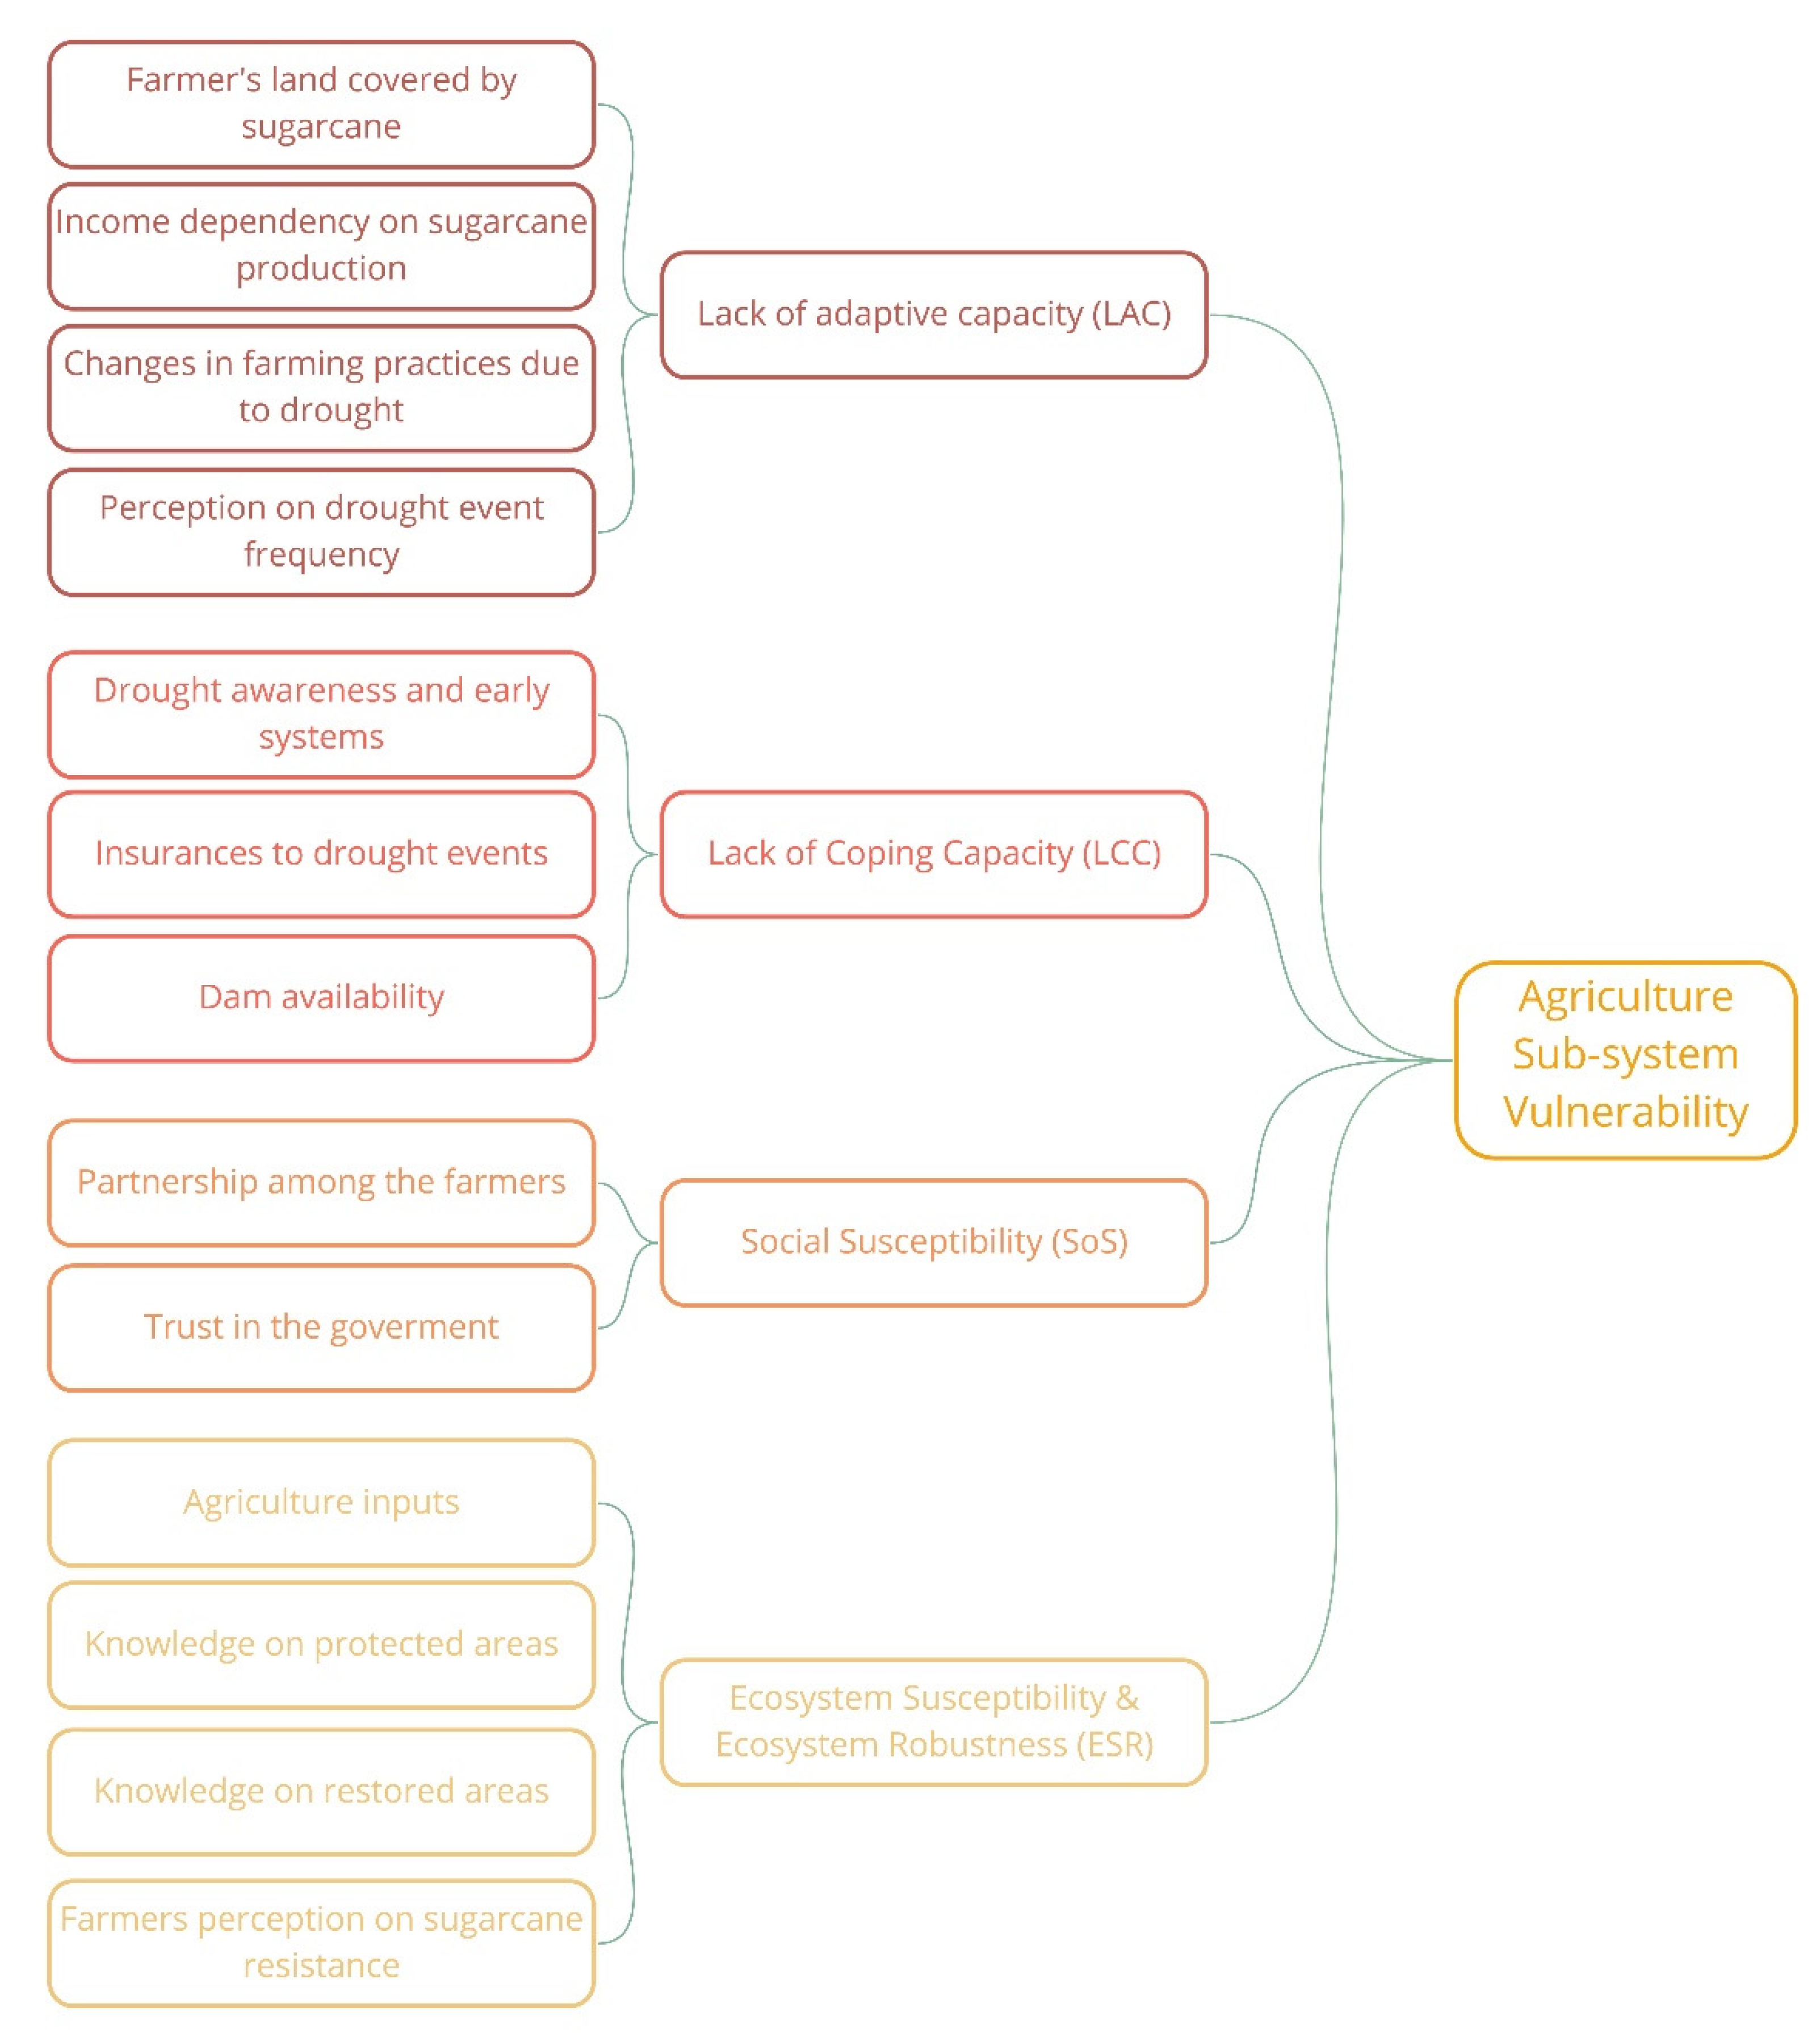
2.3.5. Agriculture Vulnerability Indicators

Socioecological data were collected through interviews with farmers involved in the sugarcane industry. A questionnaire was built to collect information covering economic, social, and environmental issues, as well as awareness. The questions were designed to include information about the partnership with the mill, access to a dam, diversification of income, awareness of protected areas and regulations related to them, and understanding of drought events, among others. Each question was an indicator that, based on the answer, had a value between zero and one (normalised), where one indicates the highest vulnerability.
The indicators were grouped into four groups: (i) lack of adaptive capacity (LAC), (ii) lack of coping capacity (LCC), (iii) social susceptibility (SoS), and (iv) ecosystem susceptibility and robustness (ESR) (see Figure 6).
The historical values were evaluated based on historical data and information, in addition to farmers’ answers during the interviews. Farmers’ interviews were used to understand when they first obtained access to a dam, if they built it or if the mill was responsible, how they felt in the past about drought events and water availability, and their perception of protected areas before regulations took place. Remote sensing historical data from MapBiomas were used to analyse sugarcane expansion.

2.3.6. Industrial Vulnerability Indicators

The technological element is directly related to mill management and efficiency. It considered (a) the volume of fresh water per tonne of sugarcane processed, (b) the kWh generated per tonne of sugarcane processed, (c) the percentage of water recovered and reused from sugarcane, (d) the kWh used per tonne of sugarcane processed, (e) the volume of water lost in the system, and (f) access to a dam to cover water requirements. Table 3 shows the values used as the best scenario, close to low vulnerability (zero), and values in the worst scenario, high vulnerability (one). The values are obtained from [22,35,49], and are references of mills in the region.
To analyse the vulnerability in past years, information was retrieved from interviews, historical mill data, reports, and environmental regulations data.

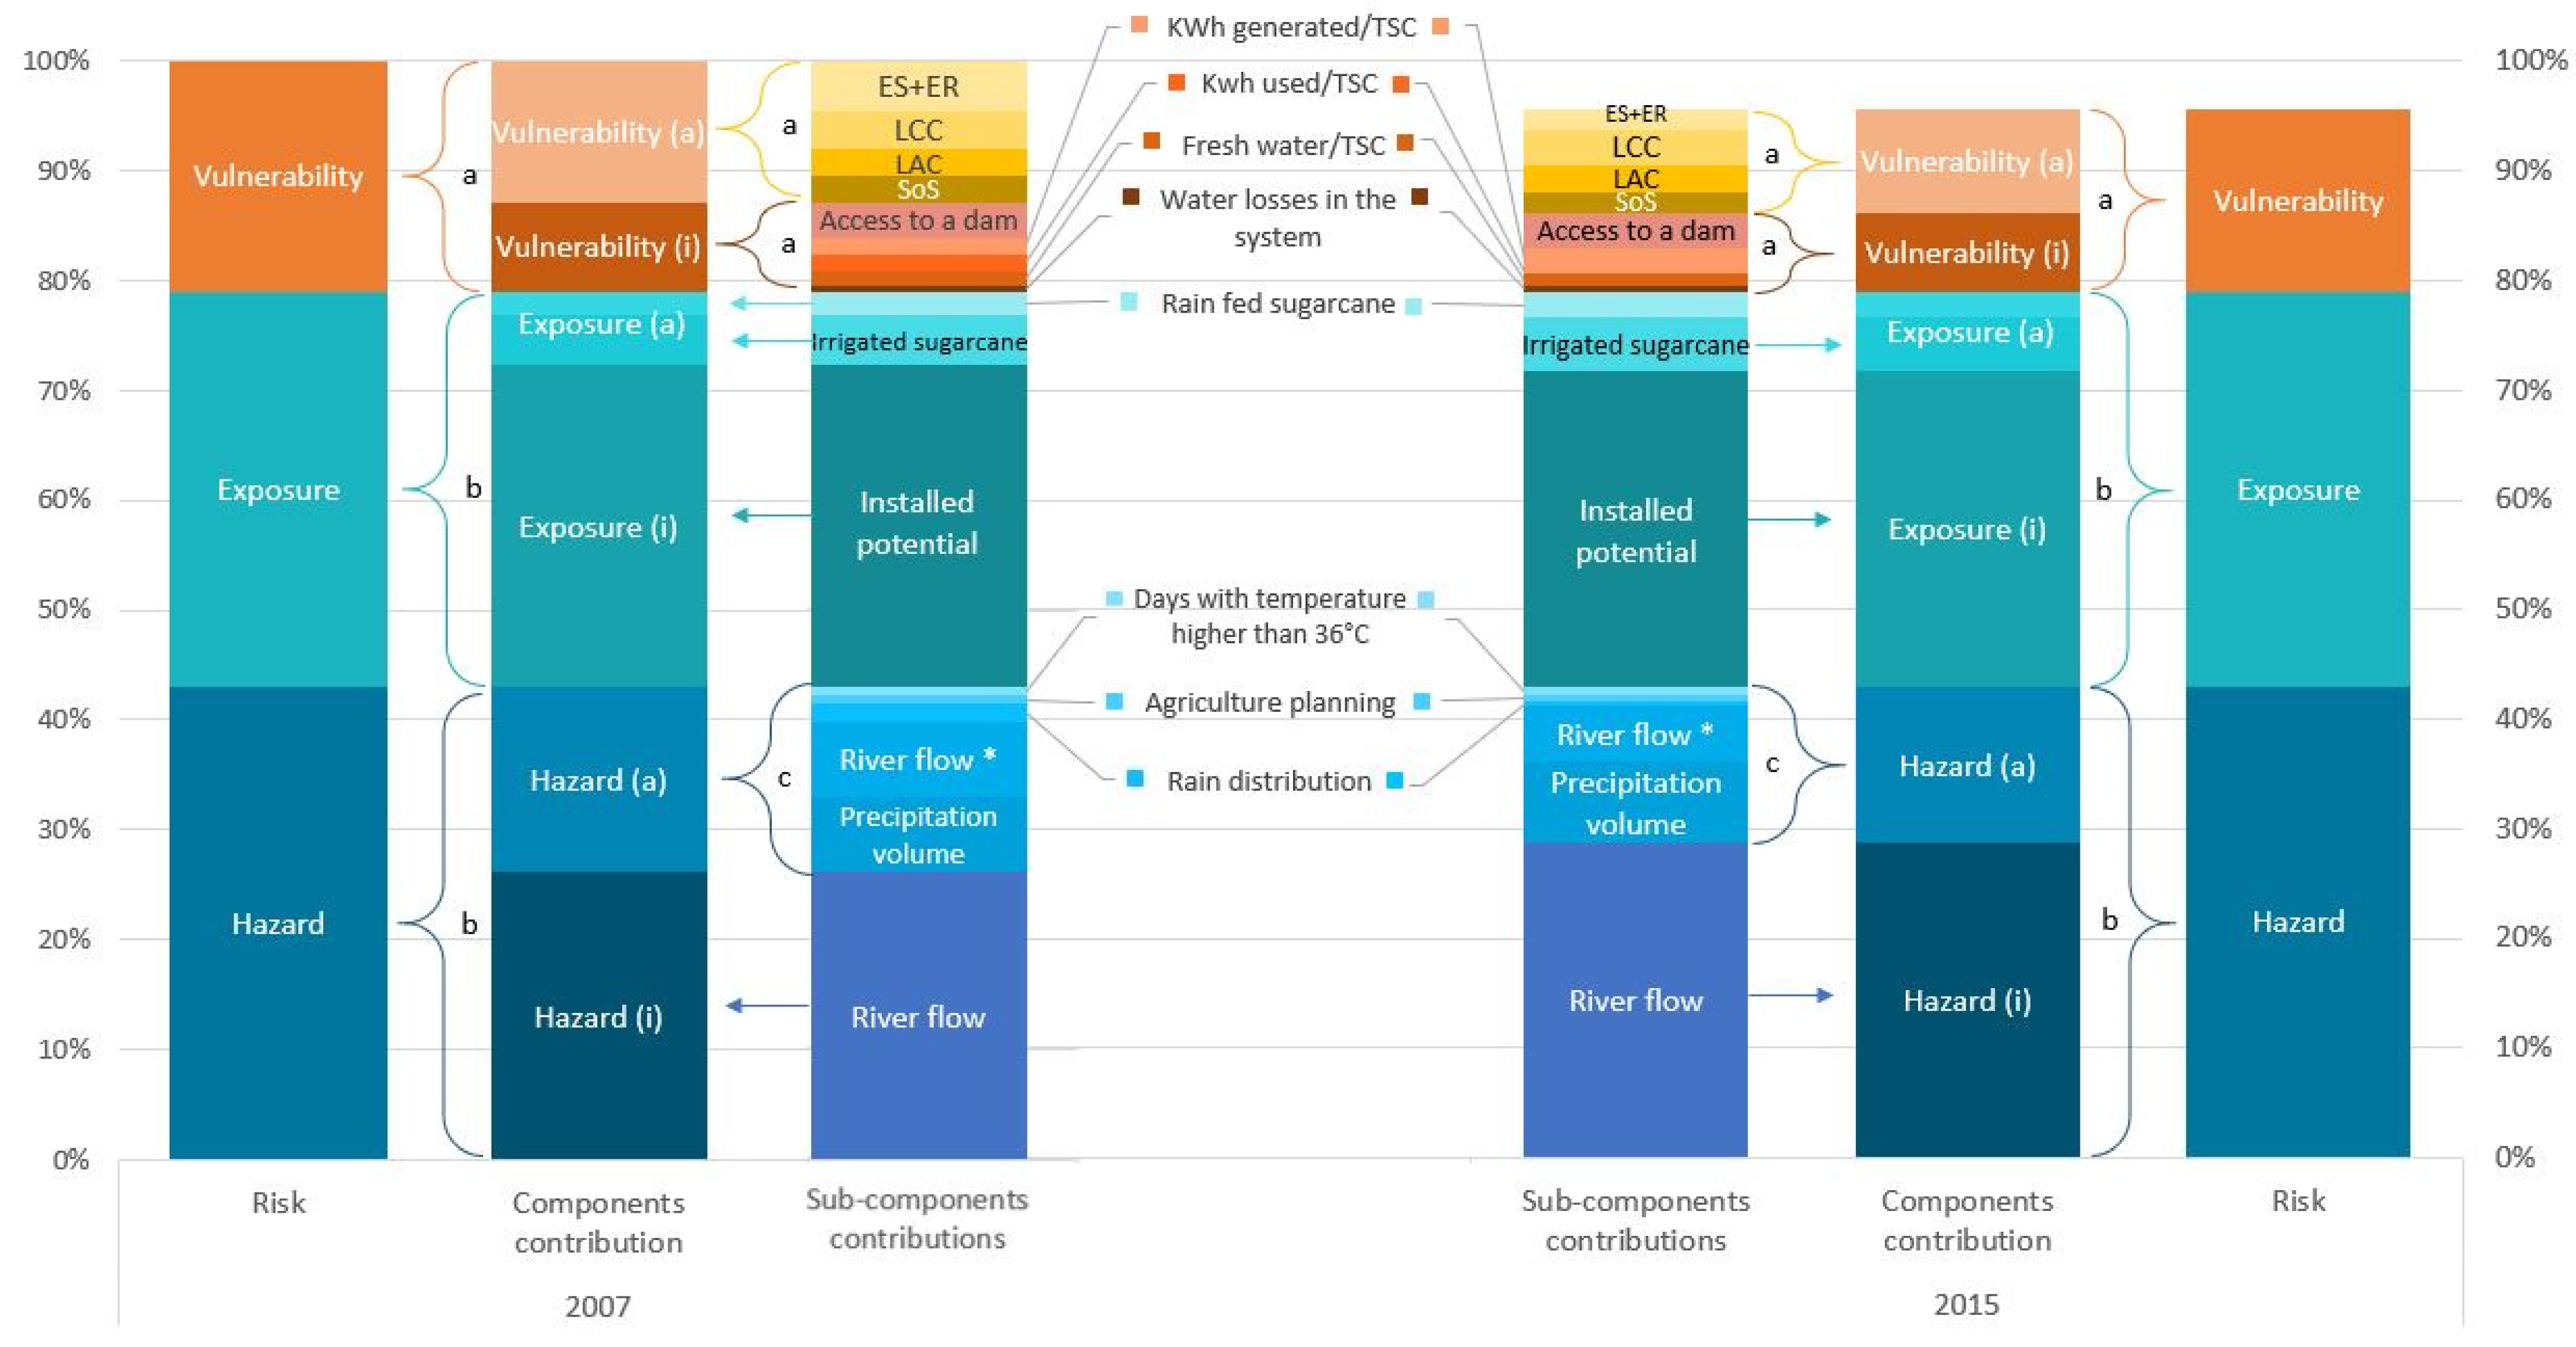
2.4. Risk Assessment

The risk assessment followed the framework proposed by the Intergovernmental Panel on Climate Change (IPCC), and considered the hazard, exposure, and vulnerability components [50]. The methodology was applied to the sugarcane energy generation system described previously, and used the sugarcane growing cycle as a time reference (April to March). The corresponding thresholds for the risk assessment were defined based on the system flows, limits, and subcomponents.
Equation (1) is the adoption of the equation proposed by the IPCC for the sugarcane energy generation system to assess risk:
S u g a r c a n e   S y s t e m   R i s k = H a z a r d     E x p o s u r e   V u l n e r a b i l i t y  
Hazard, exposure, and vulnerability are normalised indicators that are built based on specific characteristics, explained below. The indicators do not have units.

2.4.1. Hazard Estimation

Since the system is integrated by two subsystems with different characteristics, the system hazard value was the highest hazard value from both subsystems (Equation (2)) to avoid neglecting impacts on any of them:
H a z a r d = M a x   ( A g r i c u l t u r e   S u b s y s t e m   H a z a r d ,   I n d u s t r i a l   S u b s y s t e m   H a z a r d )  

Agriculture Hazard Estimation

The agriculture hazard was calculated based on a weighted average. As mentioned before, the indicators were organised into groups (Figure 5). With expert consultation, each group was assigned a weight, considering its relevance, to classify and identify drought events (Table 4). Weights were one or three, three being the most representative and most impacting.
The crop yield is the indicator connecting the agriculture and industrial subsystems. Its value and the deviation from the expected crop yield will show the impacts of drought events on the crop. Due to its relevance, the weight of the indicator was set to three.
The river flow is directly affected by drought events. Since ecological flow has to be respected, drought events will affect the volume of water that can be allocated to other users, including the water that can be dammed and stored for irrigation purposes. Low river flow will affect the water available to be retained in reservoirs during the rainy season, and the water available that can be directly extracted during the dry season. The weight for this indicator was three.
The PCI, the length of the dry season, and the total days with dry spells, grouped as “Rain distribution”, were considered as most relevant for drought characterisation in the region. Precipitation concentrated in time and dry spells in the middle of the season can highly affect sugarcane growth and water content.
The river flow, the rain distribution, the precipitation volume, and the crop yield are the main indicators showing changes towards drought events that will affect the sugarcane crop. Shifts in the start and finish dates of the rainy season will affect sugarcane yield and significantly impact crop management. Most cropping activities demand proper soil water conditions. Machinery and labour infrastructure are designed to cover demanded operations within a normal weather timing window. Therefore, if the rainy season starts later or finishes earlier, the whole planting and cropping management is affected.
The group values (Figure 5) and their corresponding weights (Table 4) were used to calculate a weighted average (Equation (2a)):
Agricultural   Subsystem   Hazard = ( P V W P V ) + ( R D W R D ) + ( T W T ) + ( Q a W Q ) + ( C Y W C Y ) + ( A P W A P ) 1 n W n  
where:
  • 1 n W n is the sum of all the weights.
  • Wx is the corresponded weight for the criteria (see Table 4).
  • PV is the precipitation volume.
  • RD is the rain distribution.
  • T is days with an air temperature higher than 36 °C.
  • Q is the available water flow in rivers (its analysis is detailed in “Industrial Hazard Estimation” section below).
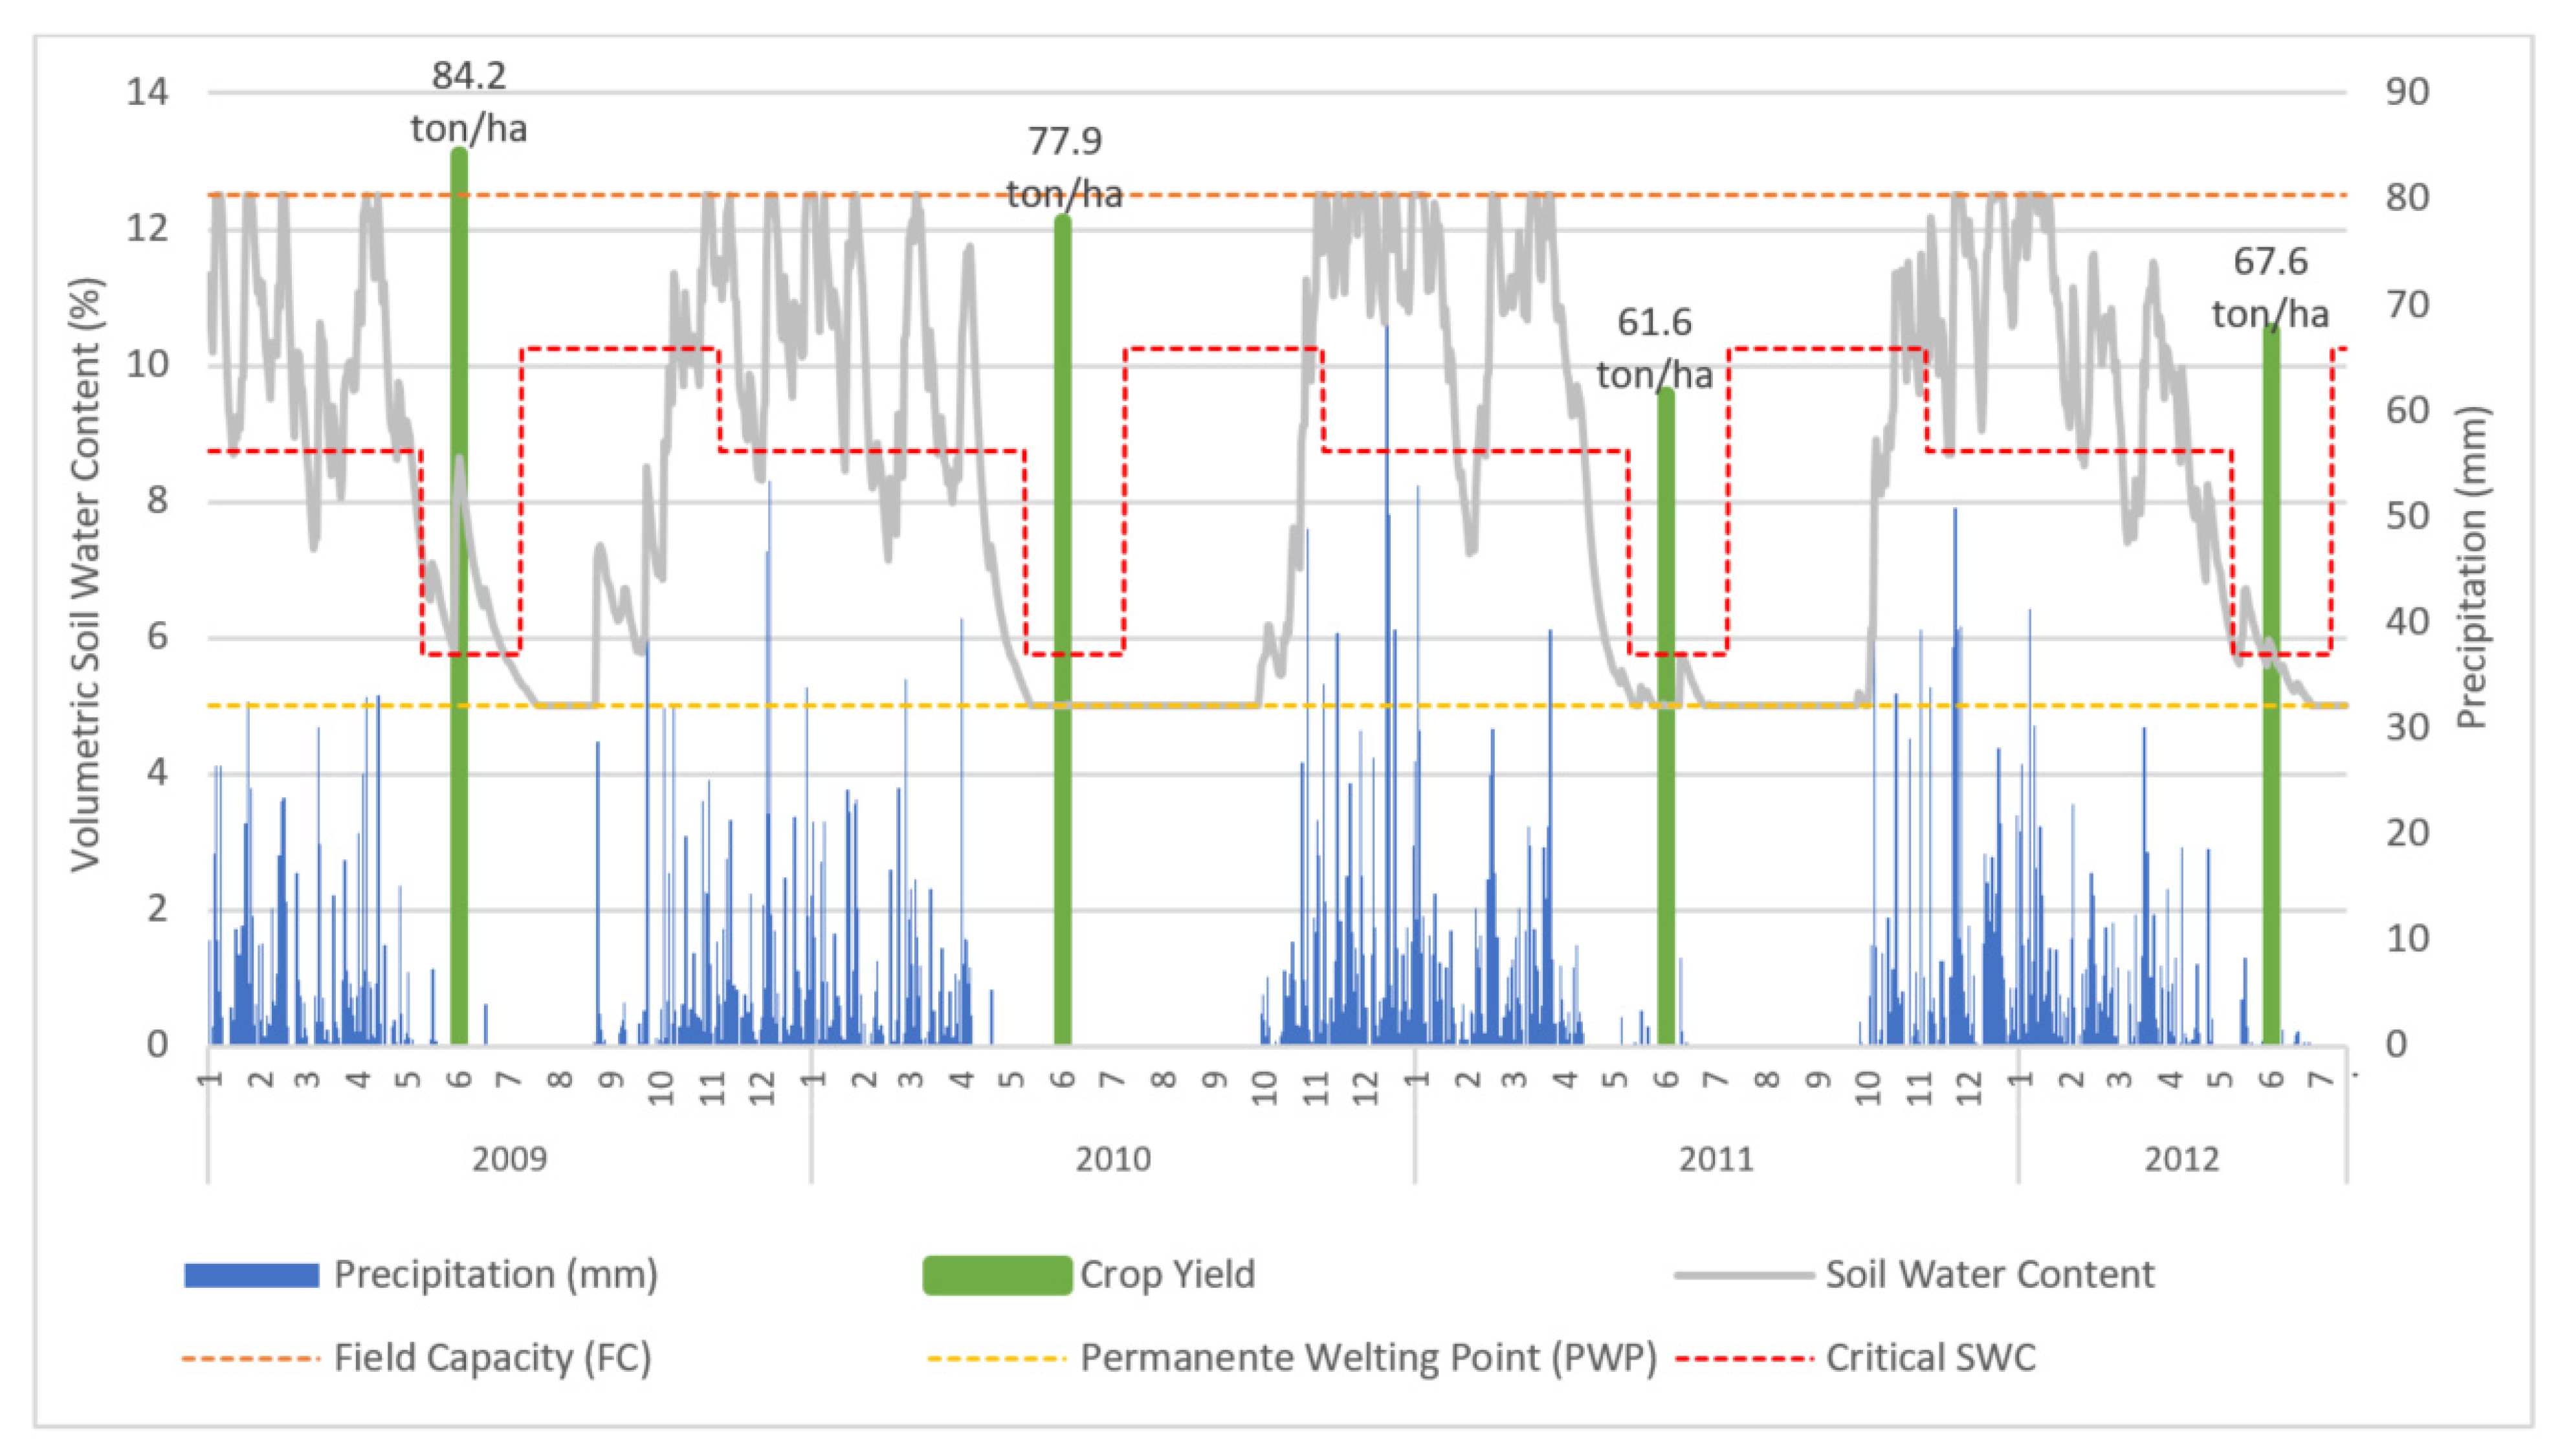
  • CY is the impact on the crop yield.
  • AP is agriculture planning.
The range limits of the result, which ranged between 0 and 3 due to the hazard indicator values, were normalised to 0 to 1, in a similar manner to the risk analysis.

Industrial Hazard Estimation

The hazard related to the industrial processes is directly related to the water available for processes in the basin after subtracting the ecological flow. As established by the state’s law, the Q95 is the reference for the allocable river water flow to users in the basin; the rest is considered ecological flow. Furthermore, according to state regulations, only 50% of the Q95 can be allocated to users [41,42]. In the case of Rio dos Patos, based on the modelled values and close to the values established by the state authority, the Secretary of State for Environment and Sustainable Development (SEMAD in Portuguese), the Q95 is 7.4 m3/s [51]. Figure 7 shows the average water flow in Rio dos Patos, the Q95, and the water volume that can be granted (yellow lines).
In this paper, we took as a reference the ecological water flow and the Q95 to establish drought thresholds (see Figure 8). As the Brazilian law does not establish a different water ecological flow per season, this paper took that value as the most extreme and severe drought event. Similar to other hazard indicators, quartile 1 is the value used by farmers and industrial farmers as a reference for expected behaviour. In that sense, a value lower than quartile 1 is considered a mild drought. Quartile 1 minus the standard deviation of the river flow, considering dams, was defined as a moderate drought event.
During the assessment, the river water flow was never less than 7 m3/s. In this sense, it was not necessary to perform a close analysis of the water allocation per sector. However, in the case of the strongest drought, it is relevant to analyse the drought per sector, as it would impact them differently. We called the drought indicator for the decrease in the river water flow “Q”:
I n d u s t r i a l   S u b s y s t e m   H a z a r d = Q  

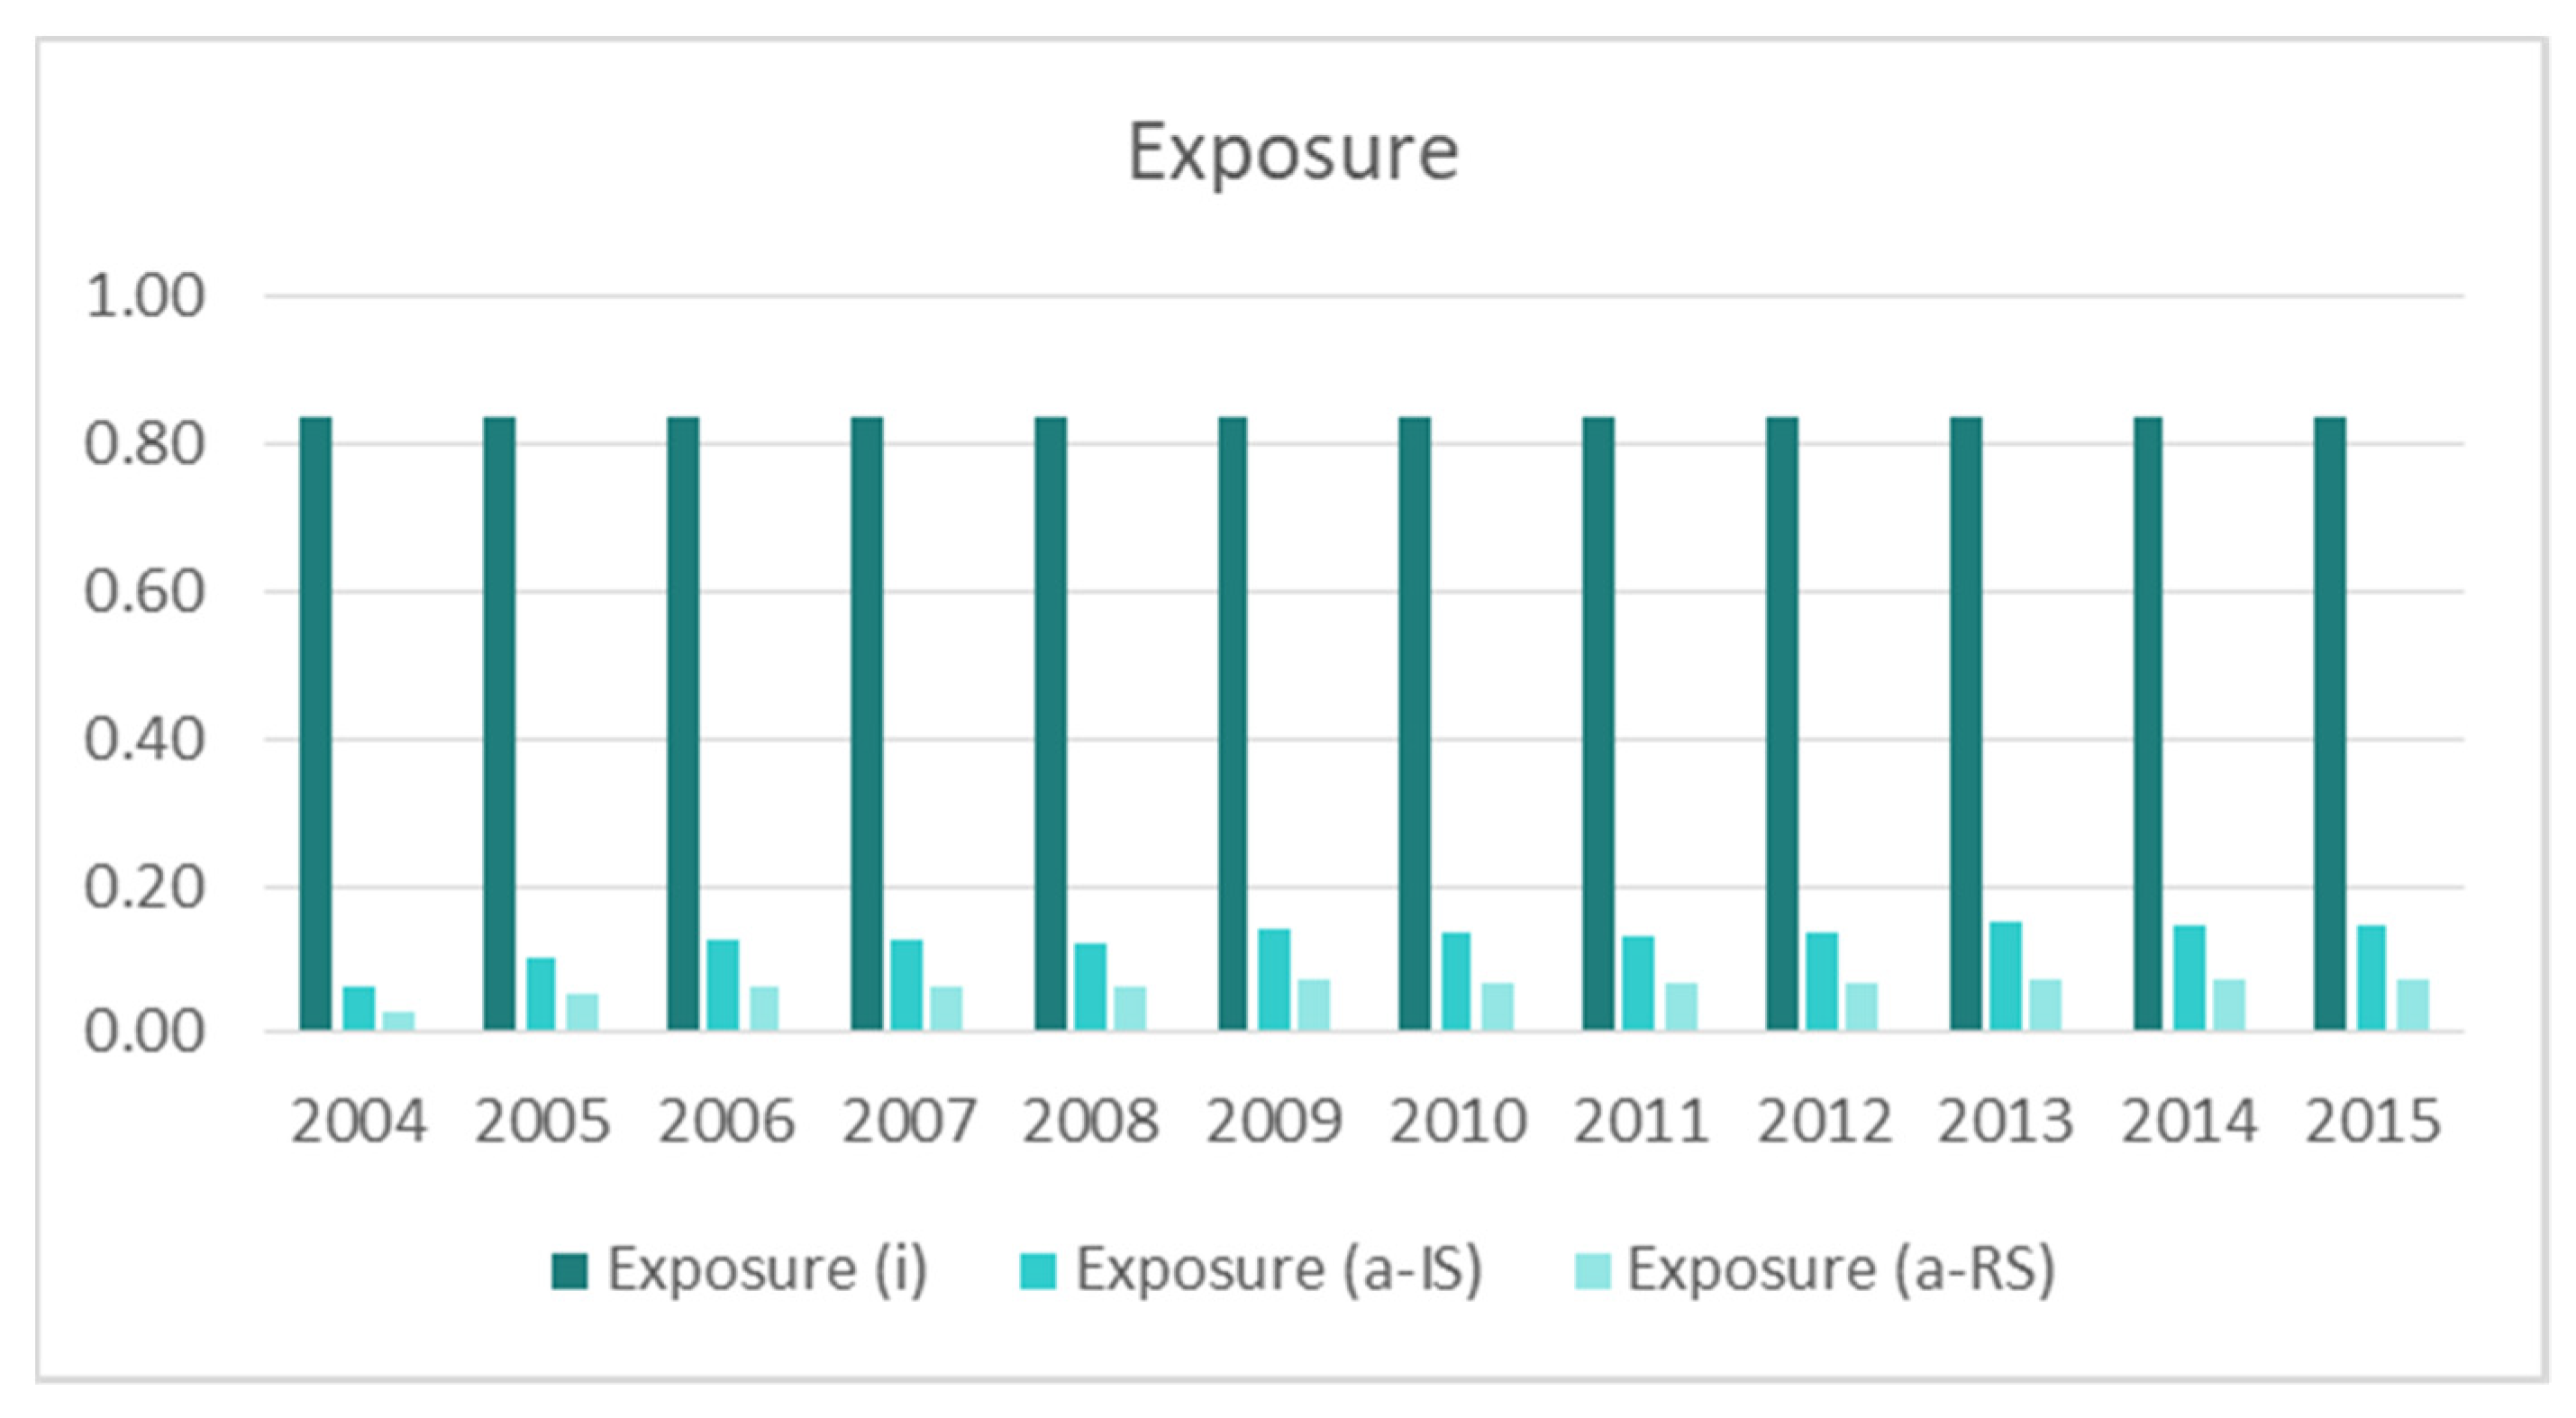
2.4.2. Exposure Estimation

Similar to the hazard evaluation, the system exposure was the most exposed subsystem (Equation (3)):
E x p o s u r e = M a x   ( A g r i c u l t u r e   S u b s y s t e m   E x p o s u r e , I n d u s t r i a l   S u b s y s t e m   E x p o s u r e )
The exposure values for the subsystem were evaluated based on the planted area (Equation (3a)) and the installed potential of the mill (Equation (3b)). The indicators are percentages and do not have units:
A g r i c u l t u r e   S u b s y s t e m   E x p o s u r e = ( I r r i g a t e d   S u g a r c a n e   A r e a   ( ha ) S u b   b a s i n   a r e a   ( ha ) ) + ( R a i n   f e d     S u g a r c a n e   A r e a   ( ha ) S u b   b a s i n   a r e a   ( ha ) )  
I n d u s t r i a l   S u b s y s t e m   E x p o s u r e = M i l l   s u g a r c a n e   i n s t a l l e d   p o t e n t i a l   ( MW ) S u b   b a s i n   e l e c t r i c i t y   i n s t a l l e d   p o t e n t i a l   ( MW )  

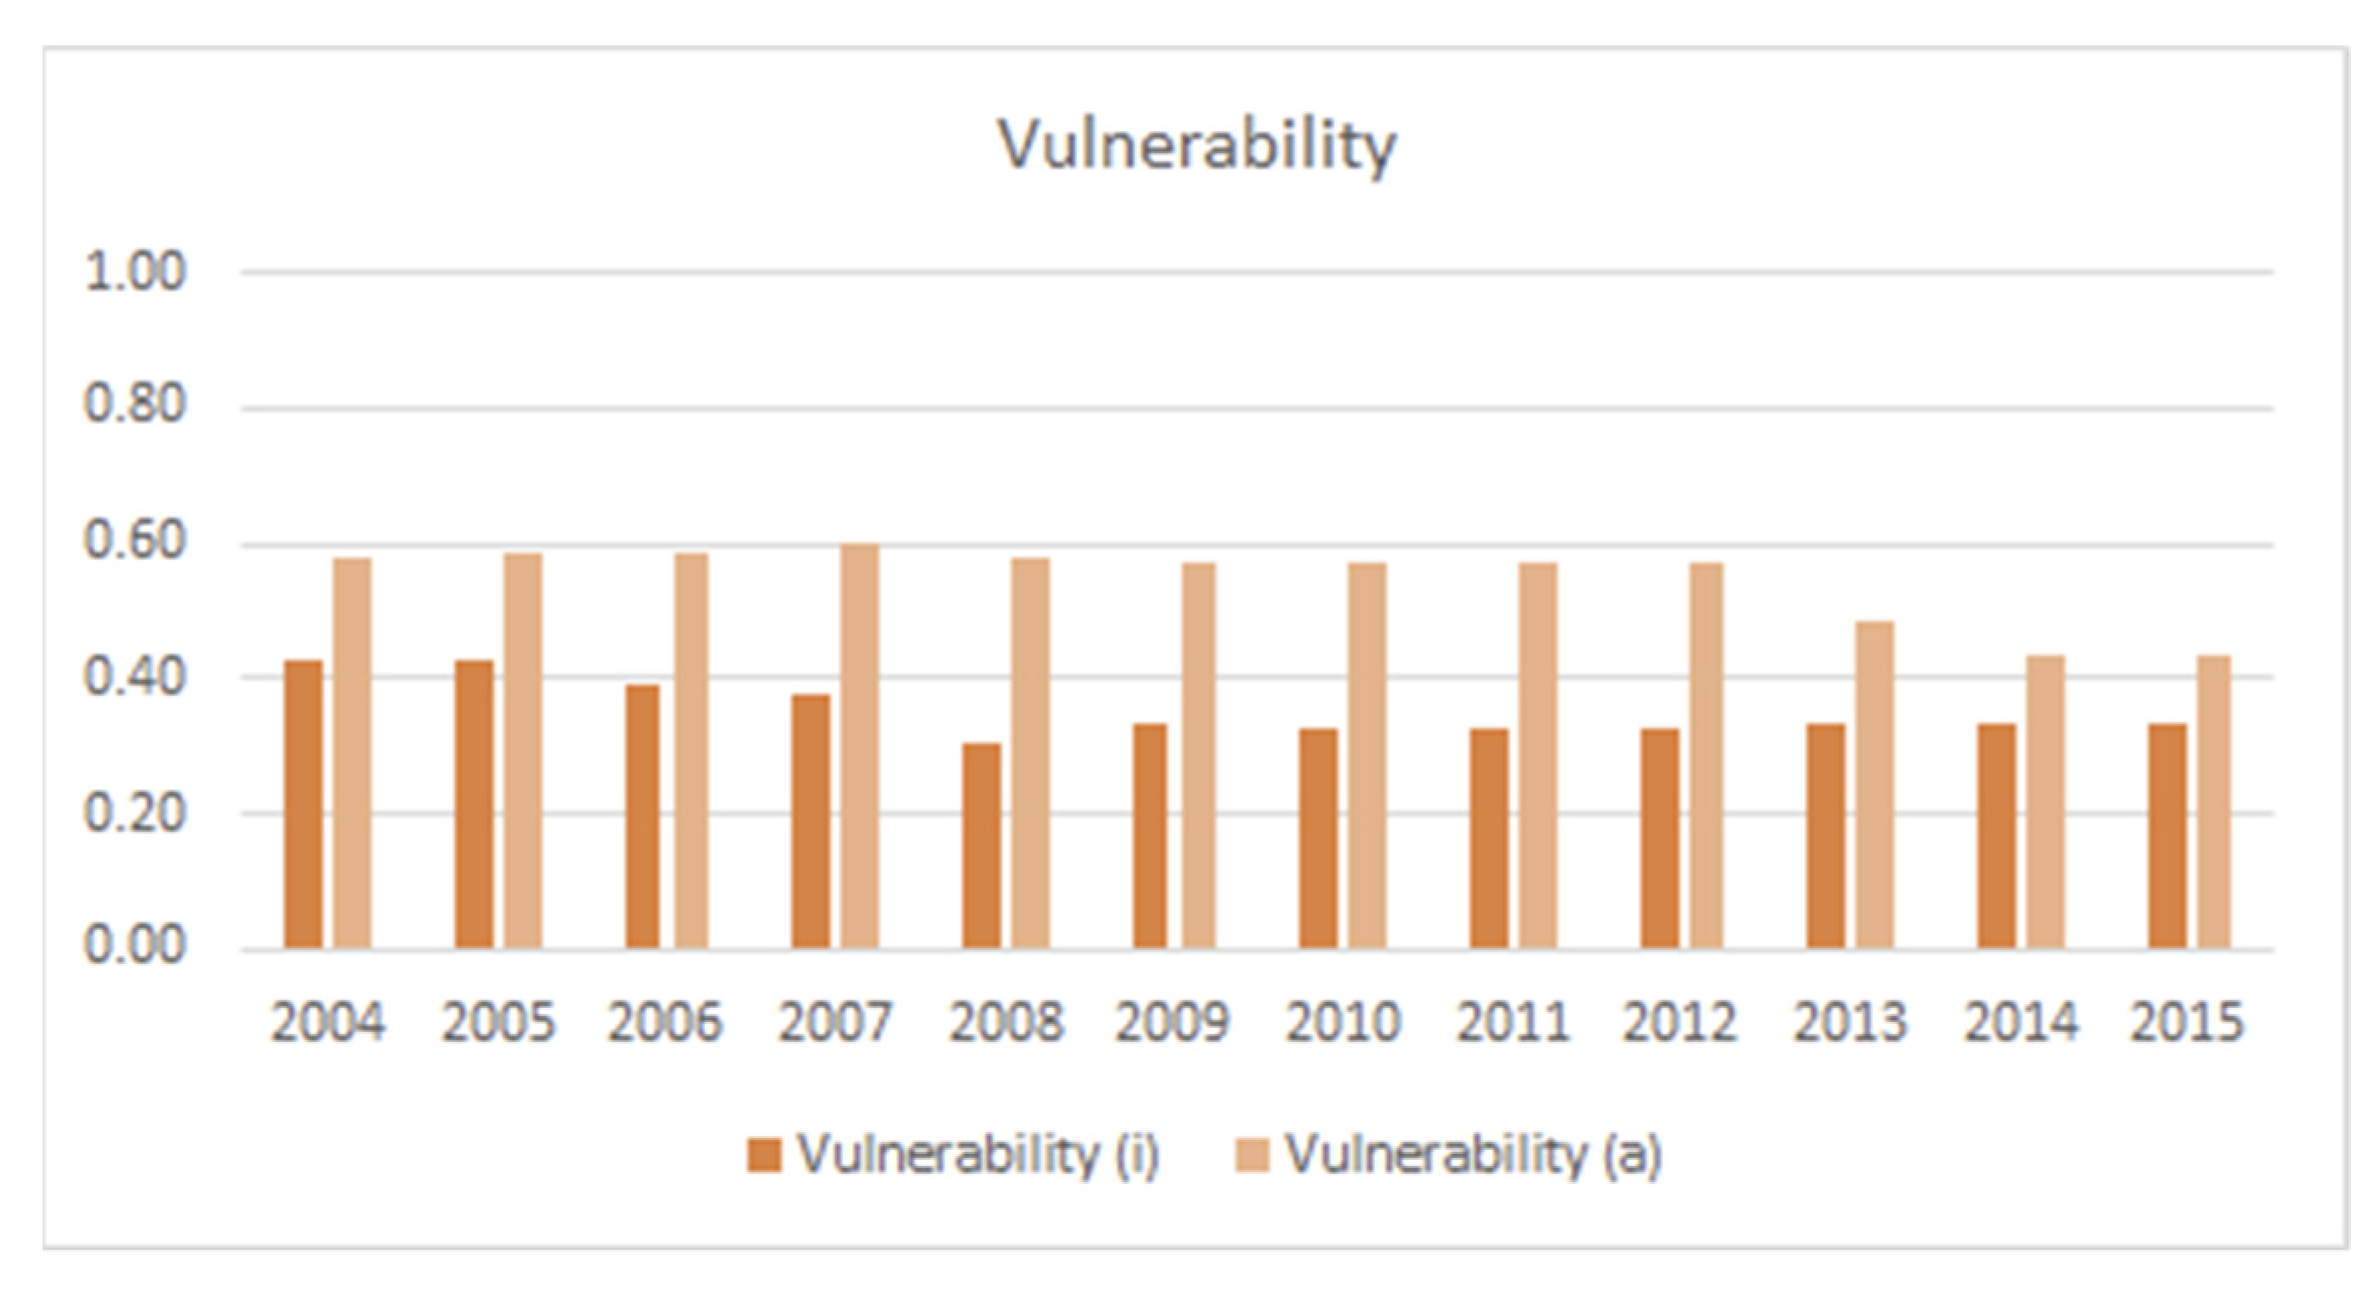
2.4.3. Vulnerability Estimation

The vulnerability indicator was analysed as follows:
V u l n e r a b i l i t y = A v e r a g e   ( A g r i c u l t u r e   S u b s y s t e m   V u l n e r a b i l i t y , I n d u s t r i a l   S u b s y s t e m   V u l n e r a b i l i t y )  
where:
A g r i c u l t u r e   S u b s y s t e m   V u l n e r a b i l i t y = L A C + L C C + S o S + E S R 4    
where:
  • LAC is the lack of adaptive capacity.
  • LCC is the lack of coping capacity.
  • SoS in the social susceptibility.
  • ESR is the ecosystem’s susceptibility and robustness.
The agriculture indicators were built based on fieldwork and questionnaires to farmers in the region. Data and information were collected, grouped, and analysed. The industrial indicators were built based on historical data and technical information.
The values were normalised based on the values presented in Table 4. The average of those values is the industrial subsystem vulnerability (Equation (4b)).
I n d u s t r i a l   S u b s y s t e m   V u l n e r a b i l i t y = W t s + E t s + W R t s + E R t s + W L + A D 6  
where:
  • Wts is the volume of fresh water per tonne of sugarcane process.
  • Ets is kWh generated per tonne of sugarcane processed.
  • WRts is the percentage of water recovered and reused from sugarcane.
  • ERts is the kWh used per tonne of sugarcane processed.
  • WL is the volume of water lost in the system.
  • AD is the access to a dam to cover water requirements.
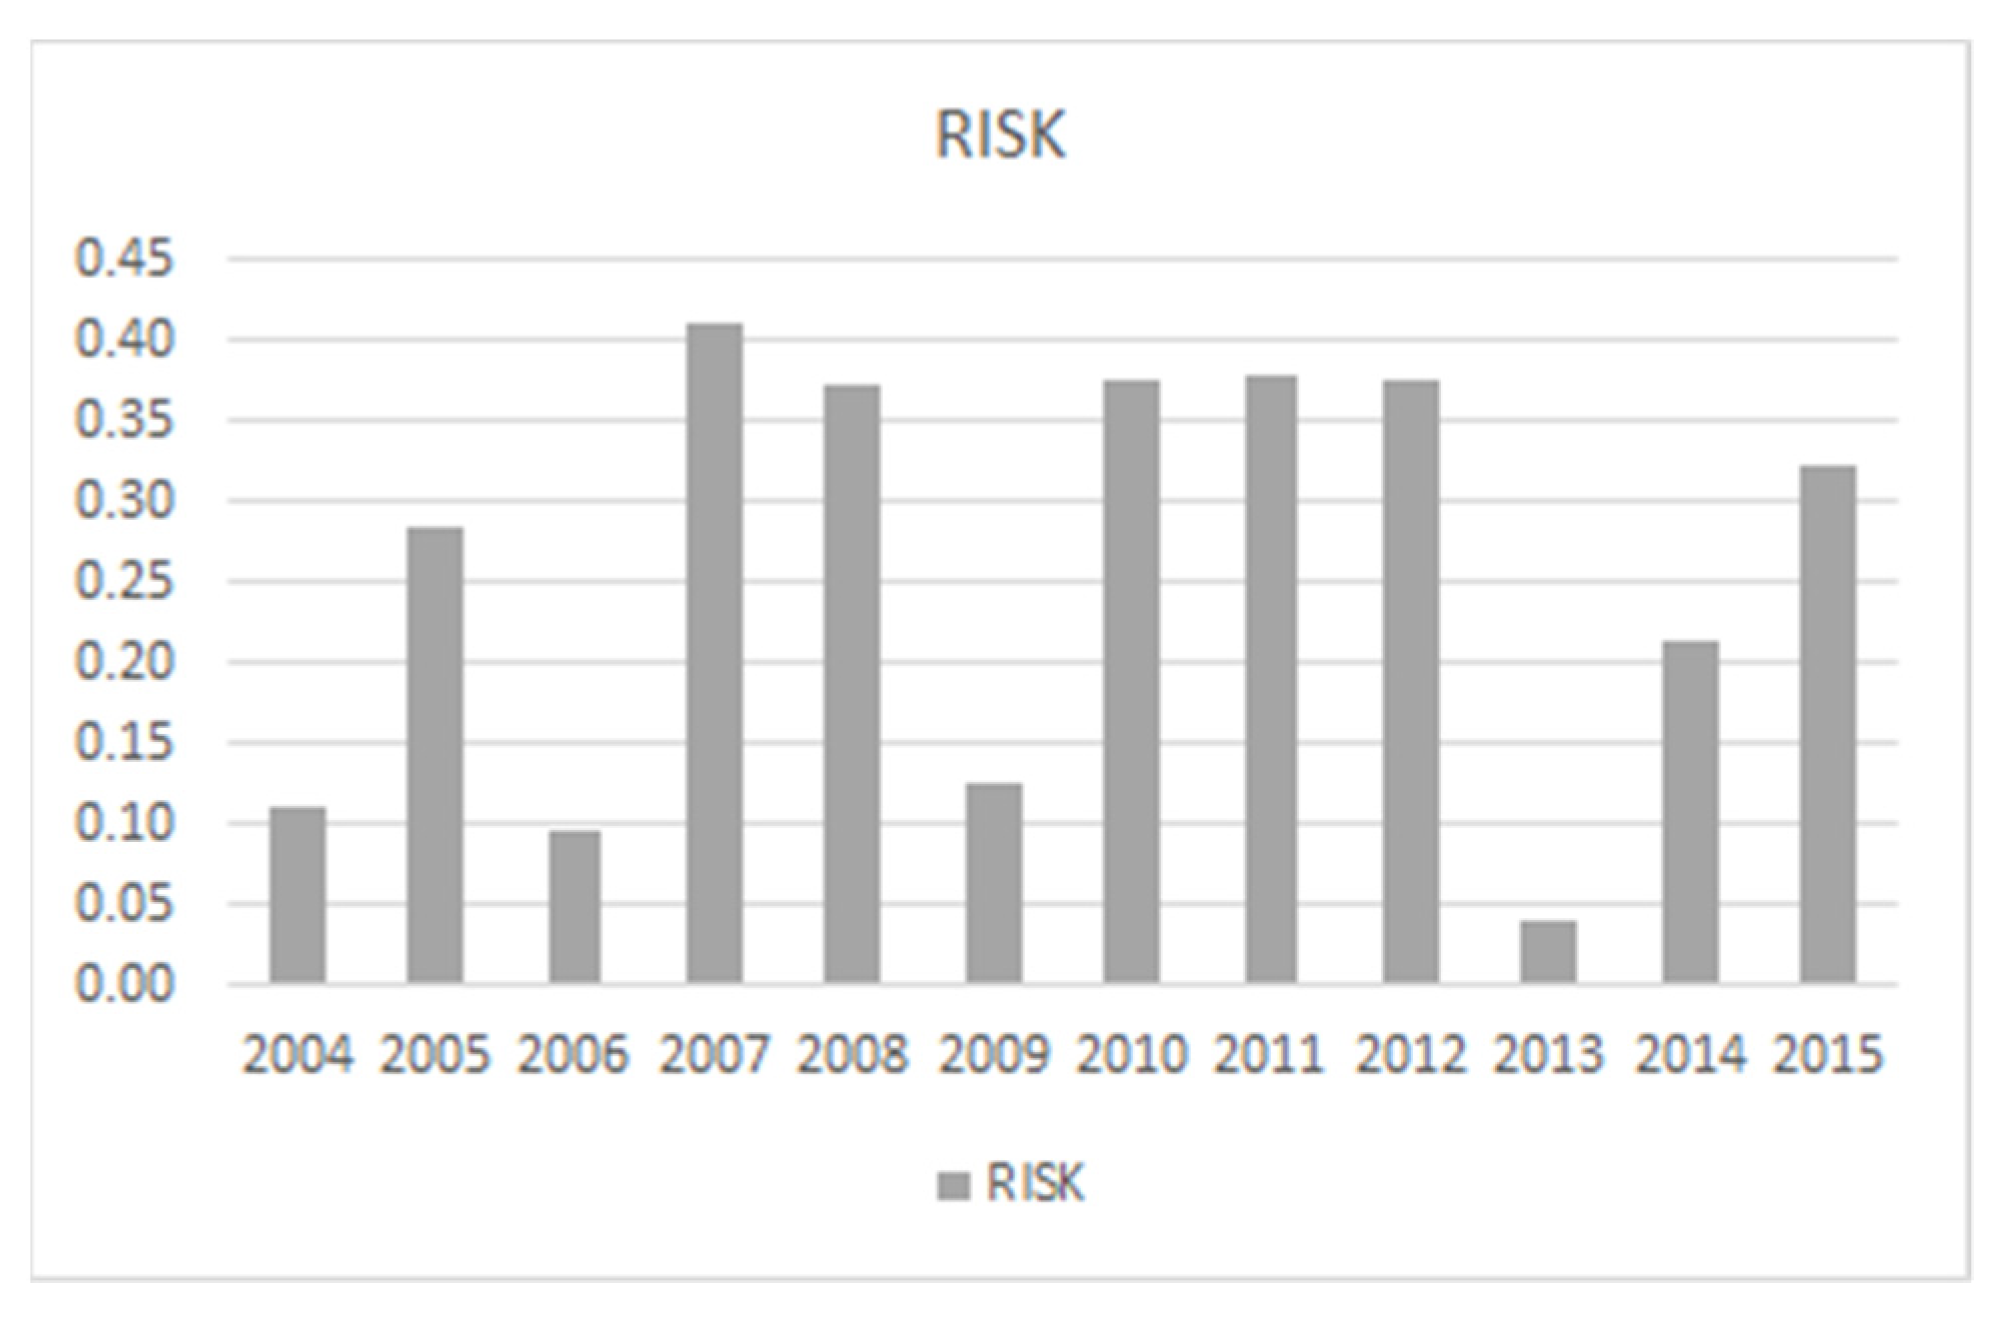
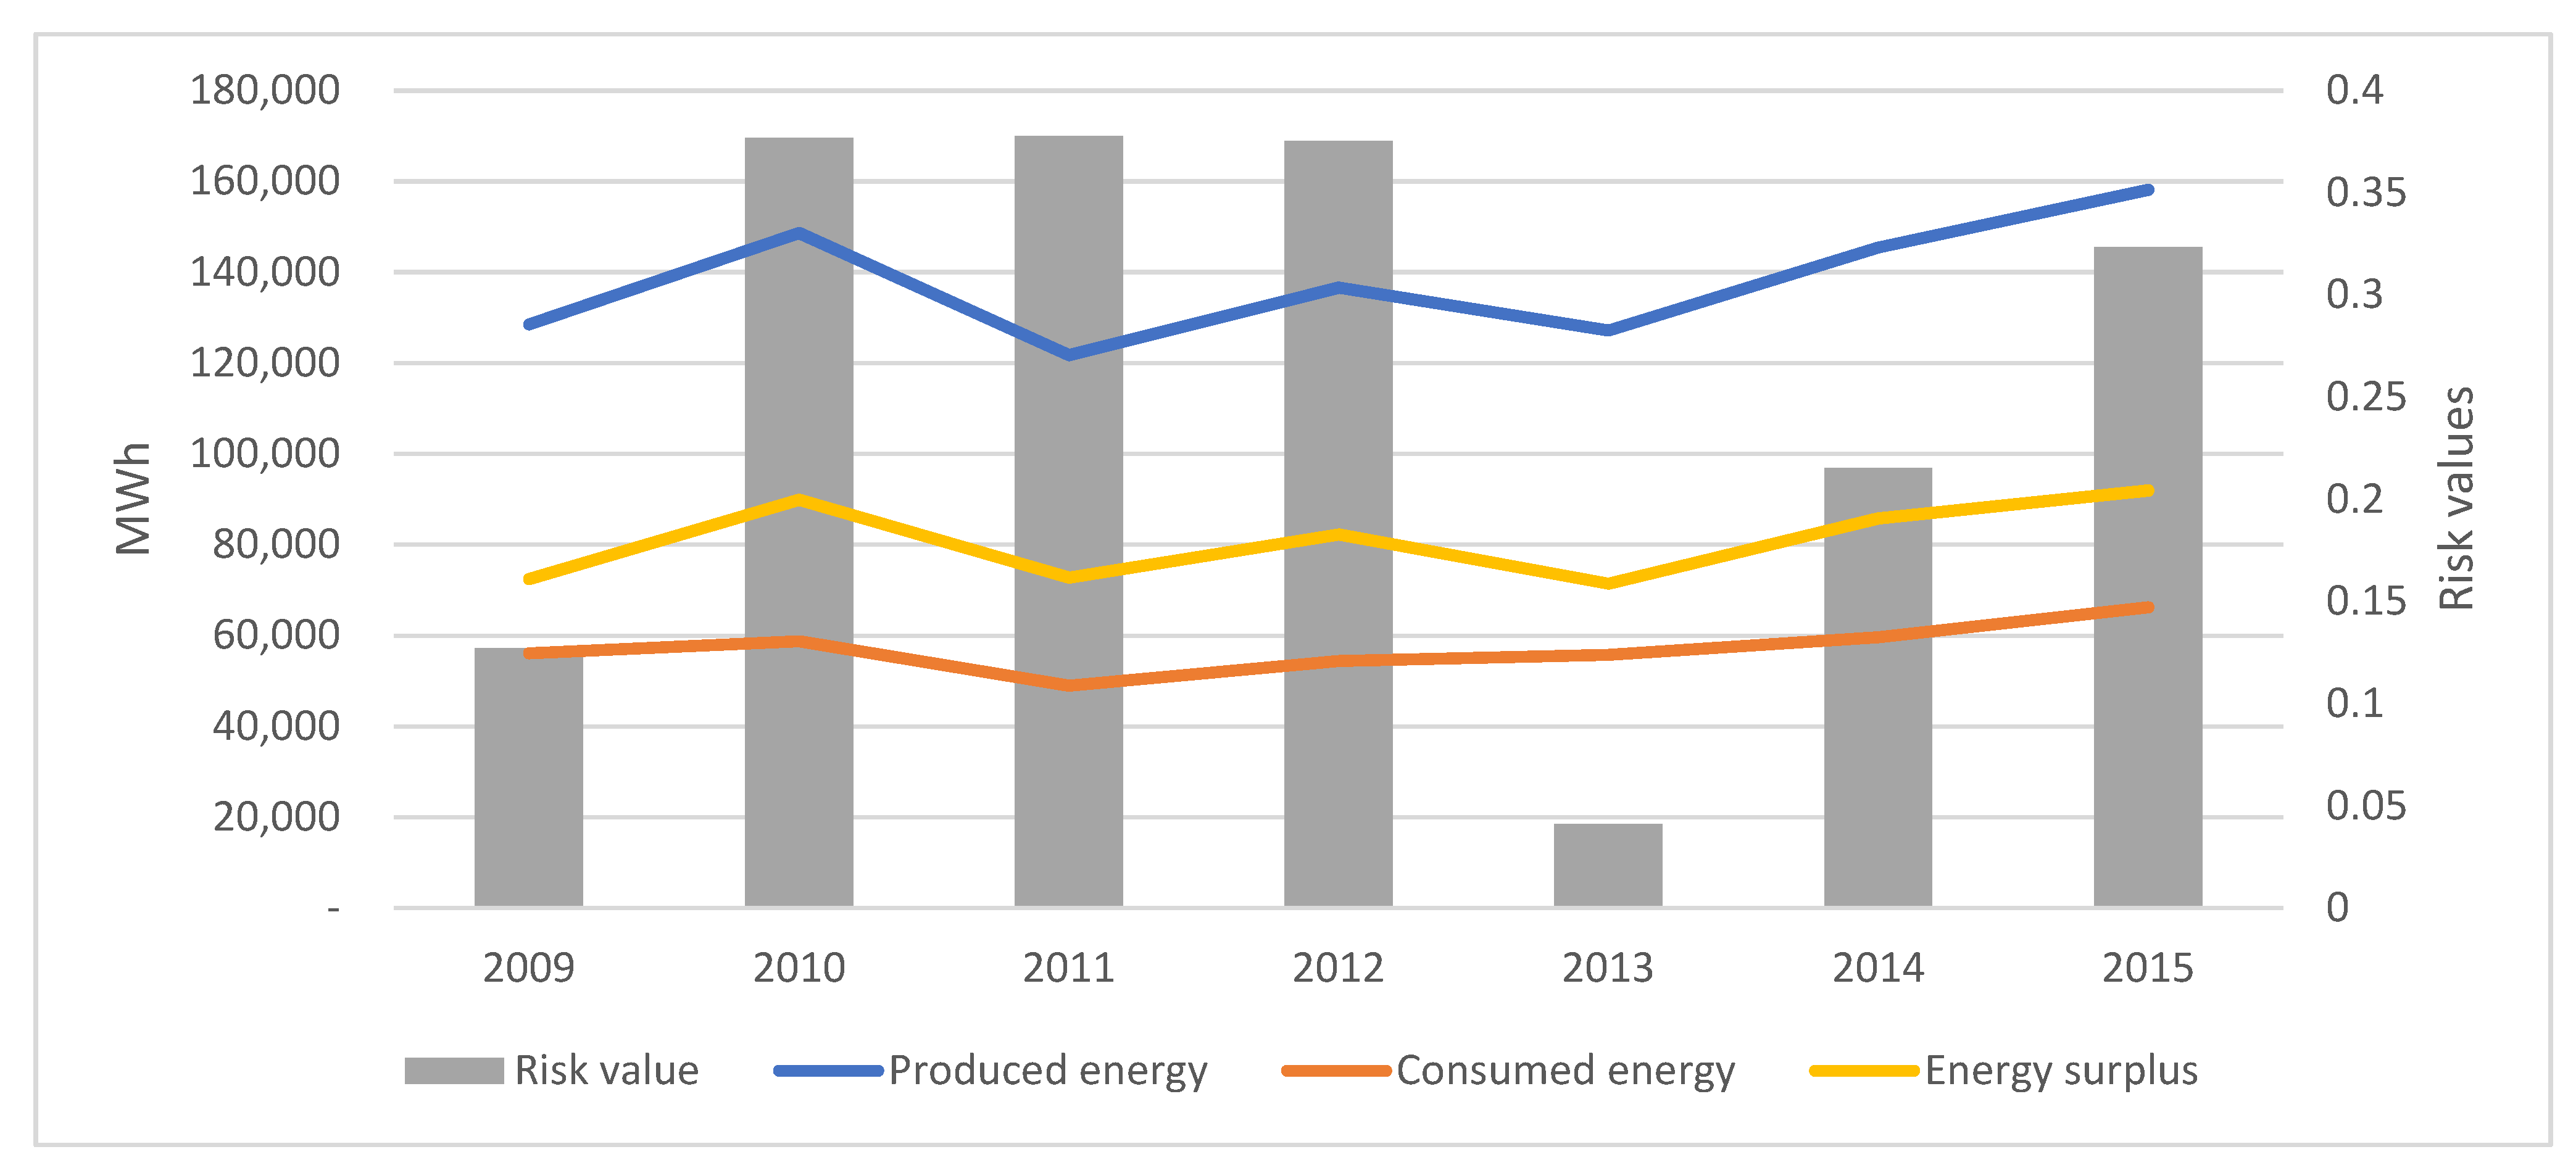
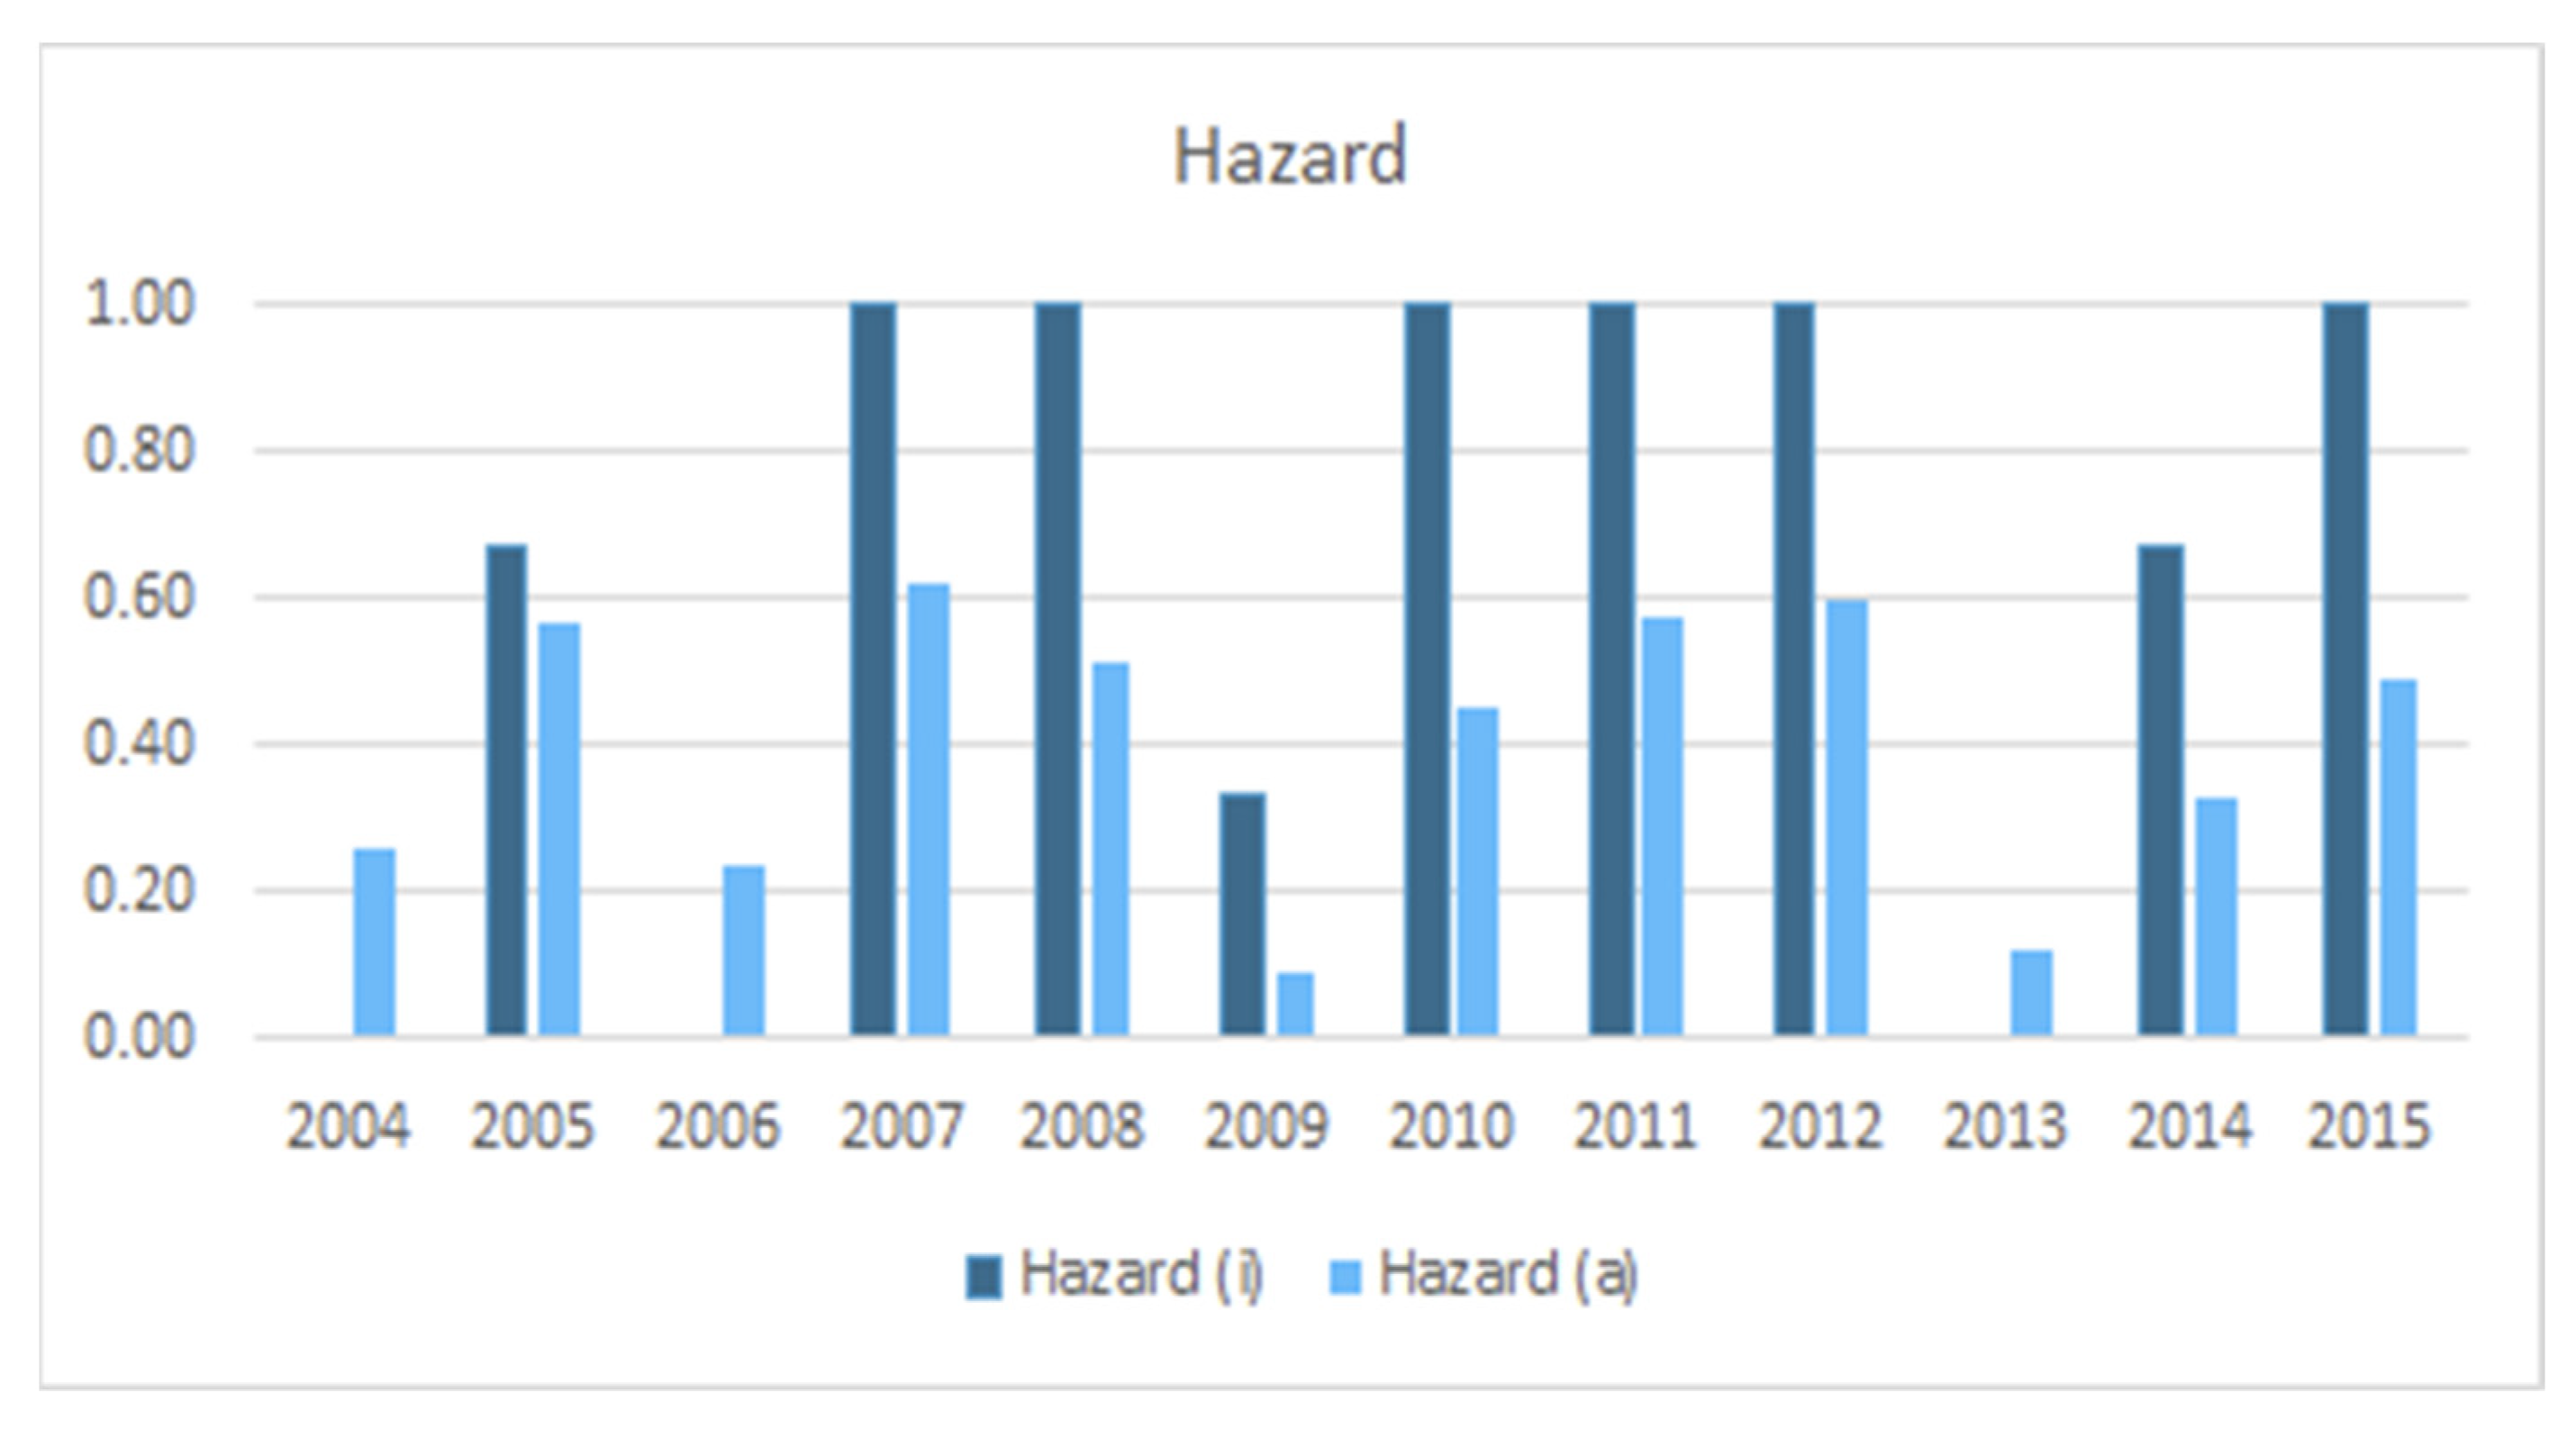
3. Results

Figure 9 shows the sugarcane system drought risk results. Risk values range between zero and one, one being the highest risk. The highest values were calculated for the years 2007, 2008, 2010, 2011, and 2012. The drought event in 2007 impacted the sugarcane sector; however, the drought in three consecutive years, from 2010 to 2012, had a more significant impact, decreasing the crop yield to the lowest value since 2000.
In terms of drought impact on electricity generation, Figure 10 shows electricity generation between 2009 and 2015 as well as the risk values. It can be noticed that the risk values between 2010 and 2012 are close to 0.4. In 2009, a year with a low risk value, the area harvested was 29,229 ha, close to 2,461,000 tonnes of sugarcane was harvested, and the electricity generated was close to 128,500 MWh during the season. In contrast, in 2011, the harvested area increased to close to 31,200 ha; however, the total sugarcane harvested decreased to approximately 1,922,700 tonnes; therefore, the electricity generation decreased to approximately 121,700 MWh. The values show the role that the industrial sub-system has to mitigate, to some extent, the risk impact on electricity.
Hazard results showed that the strongest drought for both subsystems was in 2007. Hazard results on the industrial subsystem are more sensible, since they are based solely on water availability for industrial purposes; therefore, 2007 is not the only year with a strong drought. Even though it is only one indicator, it fully represents the drought hazard for the industrial subsystem. On the other hand, the agriculture subsystem showed lower hazard values (see Figure 11).
The exposure results showed that the area covered by irrigated sugarcane was almost double the area covered by rainfed sugarcane (see Figure 12).
Even though the sugarcane area has expanded, the growth rate was not constant. The changes in the yearly planted area depend on crop ageing, plant population, potential yield losses, the renewal of partner farmers’ leasing contracts, new land leasing contracts, and the availability of financial resources to cover planting costs. The analysis also showed that due to the area that must be protected as required by the law, as well as the area unsuitable for growing sugarcane due to the slope, the agriculture exposure would never reach 100% of the basin. Regarding the industrial exposure, two sugarcane mills are located in the basin; the mill under analysis is the largest. It has expanded the electricity capacity whilst the other one has not. Every time the mill increases its installed potential, it represents a larger percentage of the energy generated in the basin, and therefore it is more exposed (see Figure 13). For those reasons, the most exposed subsystem in the basin will most probably consistently be the industrial subsystem.
Figure 14 shows the vulnerability results. Changes in the industrial subsystems are usually on a large scale due to the economic investments involved. Those changes reduced vulnerability significantly between 2007 and 2008 and later in 2013.
The agriculture vulnerability mainly changed due to the regulations on preserved areas and weather forecast information. Implementing the CAR was key to restoring areas and raising awareness in the agriculture community about protected areas. Weather forecast information that was available to farmers also played a role in decreasing the vulnerability. However, the information and data are still only weather forecasts, and there is no drought monitoring system set in place.

4. Discussion

The results’ decrease in values seems to be insignificant; however, it is, and to better understand the results the dynamic relationship between the components should be determined, and hotspots should be identified. Figure 15 illustrates the drought risk in 2007 (absolute value of 0.41) and 2015 (absolute value of 0.32). The results also show that risk values close to 0.40 are significant drought events.
The risk results, which are normalised, result from the average or highest values of the subsystem components. Figure 15 shows that the agriculture exposure (exposure (a)) is larger in 2015, but the largest changes are in the vulnerability components. Subcomponents’ results are shown in the secondary axes in absolute values for the better visualisation of the components’ contributions. The hazard values for the agriculture sector were smaller in 2015; however, the hazard for the industrial sector was equally high, since the river flow was affected in both years. The vulnerability, on the other hand, decreased in the agriculture and industrial sectors. In the industrial sector, the most relevant change was the decrease in the energy that is used per sugarcane tonne crushed (TSC). Figure 15 also shows that an increase in the water dammed for industrial purposes can greatly decrease industrial vulnerability, and improvements in the electricity generation per TSC can also decrease the sector’s vulnerability. Water losses in the system are related to the makeup water that is needed for the boilers. In this sense, technological innovation and improvement can reduce the vulnerability related to that subcomponent. The agriculture vulnerability reduced significantly in the ESR component. As mentioned previously, the decrease was mostly due to the introduction of the CAR, which raised awareness between farmers about protected and restored areas. The subcomponent can be improved by additional analysis using remote sensing data and indicators targeting vegetation health.
The rest of the subcomponents also decrease, but not as considerably as the ESR. The SoS is solely related to the partnership between farmers and the mill. In this sense, the findings should be interpreted with caution, since the second indicator, trust in government, had to be removed due to the lack of historical data and information for its analysis. In future analyses, this subcomponent should be strengthened and complemented by other indicators. In the case of the LAC and the LCC, the decrease in vulnerability was due to the farmers’ increased awareness of drought events, increased sugarcane-planted area, more drought-vulnerable crops, and weather forecasting specifically for agriculture purposes.
Hazard results did not show a clear trend of steady increase or decrease in drought events between 2004 and 2015. However, the values regarding the agriculture hazard overlapped with years that farmers identified as years with challenging weather conditions, especially referring to the erratic precipitation patterns and, overall, low precipitation rates, being very concentrated in fewer months of the sugarcane growing season. Industrial hazards are noticed less, since water availability in the basin never decreased to a point in which water was not available for industry. However, drought in the agriculture system is felt by the industrial phase due to the reduced recovered water and sucrose content. The exposure results showed a sharp difference between the agriculture and industrial phases. Sugarcane expansion grew 1.8 times between 2004 and 2015, and continues to expand. In terms of exposure values, the irrigated sugarcane increased from 0.08 to 0.14, and the rain-fed sugarcane from 0.04 to 0.07. This is not a surprise, since farmers and the mill agriculture managers prefer to plant sugarcane in areas that are accessible to irrigation. It is expected that sugarcane will be expanded first into areas closer to surface water bodies. The agriculture exposure is low due to the other agricultural areas, protected forests, permanently protected areas, and protected areas with native vegetation. Those values will be repeated in other basins, or if the area under analysis is expanded to neighbouring basins. On the other hand, industrial exposure was steady at 0.84. The value was steady as a result of the absence of installed potential expansion. Contrary to agriculture expansion, which could happen on a yearly basis, installed potential increases require strong investment and attractive economic revenues from the sale of energy, which are not done on a yearly basis. There are two sugar mills within the study area basin, and the mill under analysis is the largest, which explains the large industrial exposure. Contrary to the agriculture exposure, the industrial exposure would change if the area under analysis is larger and if the other mills are located within those boundaries.
Results on the vulnerability showed the importance of technical interventions and regulations on land use to reduce the drought risk. In the particular case of bioenergy from sugarcane bagasse in Rio dos Patos, the system has been improved to use less water in both subsystems. The implementation of actions took place to increase the overall mill environmental sustainability rather than to reduce the drought risk; however, the analysis shows that these actions also reduced the drought risk. The agriculture vulnerability was reduced, especially after the access to the weather forecast for agriculture planning and the enforcement of the CAR. Weather forecasting is a private initiative that was welcomed by farmers in the region to better plan crop planting and harvesting. The CAR, on the other hand, was implemented to protect areas and to easily monitor agriculture expansion, and it is mandatory to present the documents required to operate agriculture activities. This increased the recognition of key areas to be protected to keep the ecosystem healthy in the basin and reduce the drought risk. Another key result that must be mentioned is the cooperation between research institutes, farmers, and sugarcane industry managers, as well as its impact on decreasing vulnerability. Farmers cooperating with research and in partnerships with the mill are less vulnerable, since they are applying and supporting the improvement of new deficit-controlled irrigation techniques, different quantities of soil inputs, and crop rotation, and the mill supports them with access to machinery to plant, harvest, and monitor areas registered in the CAR. The synergy between sugarcane mills, farmers, and research institutes strengthens the sector and enables sustainable growth.
The industrial vulnerability has decreased significantly due to the use of water collected from sugarcane during the crushing, the recirculation of water within the industrial processes, and the reduction in water in the processes. The improvements are part of the sector’s efforts to reduce the environmental impact, which aim to reduce the demand for freshwater to a minimum. In this sense, industrial vulnerability is expected to decrease. Another relevant technological improvement in the sector is the changes in the temperature and pressure in which the Rankine cycle performs to generate more electricity which can be sold to the national grid. Those changes are also subject to the Brazilian electricity market opportunities and targeted auctions to bioenergy suppliers. That analysis was out of the boundaries of this analysis.
The methodology included as an indicator the access to dammed water for periods with low water availability. Farmers in the region and mill operators agree on the importance of these dams to reduce the vulnerability to drought events that, according to their experiences, are increasing in frequency and intensity. The river flow analysis showed that dams have slightly modified the natural river regime, increasing the minimum flow during the dry season due to the mandatory minimum dam flow release, and decreasing the high flow peaks. Water damming has allowed farmers to irrigate crops when the precipitation is not enough to cover the crop’s water demand. Dams are considered the most relevant action in the region to decrease the vulnerability of farmers. The government grants permits to build them and monitors their implementation; however, the farmers are the ones who look for suitable places to build them. Small dams are going to continue to be built in the region; for this reason, it is important that there is more involvement by the government in mapping areas where small areas can be built, regulating the area flooded, and monitoring closely the river flow to revise future water grants as well as modify them according to the changes in water availability.
In practice, the results help to identify exposed areas and develop policies and technologies targeting drought risk mitigation in agriculture and sugarcane mills. The vulnerability analysis shows that farmers can decrease, to some extent, the vulnerability, and that the government can stimulate the development of initiatives related to it. Risk analyses could be performed periodically (e.g., monthly) and used as a means for farmers and mills to better plan production.

5. Conclusions

Risk assessments can help to identify and highlight important actions required to reduce the hazard, vulnerability, and exposure, and thus overall risk. This paper assessed the risk in sugarcane-bagasse-based electricity generation based on an approach considering socioecological and technological factors. Considering both the agriculture and industry phases helped to identify hotspots in the system and create solutions aiming to reduce the risk via government and legislative actions, through water and natural resources management, and through technological improvements. Historical and dynamic analysis also helps to understand the potential of different actions in reducing risk; those actions could eventually be replicated in similar systems to reduce risk. This approach also helps to identify in which subcomponents the hotspots are and to create solutions targeting strategic indicators.
Analysing the entire system also highlighted the importance of considering the agriculture and industrial phases. Excluding the industrial phase would have led to omitting the implication of drought events on the industry and the role it plays in partially covering crop water demand. On the other hand, excluding the agricultural phase would have led to overlooking the importance of measures to protect strategic areas or the role of weather forecasting for agriculture planning, among other measures.
Despite the limitation of historical data available for one indicator in the vulnerability assessment, the approach and framework used in this paper can be the starting point to further develop risk analyses by considering a dynamic and historical approach to formulate actions and measures to reduce risk.

Author Contributions

Conceptualization, J.C.Z., Z.S., V.B.B. and J.R.; methodology, J.C.Z., Z.S. and V.B.B.; formal analysis, J.C.Z., V.B.B. and M.M.; investigation, J.C.Z. and V.B.B.; data curation, J.C.Z., V.B.B. and M.M.; writing—original draft preparation, J.C.Z.; writing—review and editing, J.C.Z., Z.S., J.R., V.B.B. and M.M.; visualization, J.C.Z.; supervision, Z.S., V.B.B. and J.R. All authors have read and agreed to the published version of the manuscript.

Funding

This research is part of the WANDEL project, and has been supported by the German Federal Ministry of Education and Research (BMBF; grant no. 02WGR1430D) through its Global Resource Water (GRoW) funding initiative.

Acknowledgments

This research was made possible thanks to the Jalles Machado S.A, Agrosatélite Geotecnologia Aplicada Ltd.a, Canasat project the MapBiomas project, and specially Embrapa Cerrados.

Conflicts of Interest

The authors declare no conflict of interest.

Abbreviations

ADAccess to a dam
APPsPermanent preserve areas
ARLLegal reserve area
CARRural Environmental Register
ErtskWh used per tonne of sugarcane processed
ESREcosystem susceptibility and robustness
EtskWh generated per tonne of sugarcane processed
FCField capacity
HMUHydrological management unit
IPCCIntergovernmental Panel on Climate Change
LACLack of adaptive capacity
LCCLack of coping capacity
PCIPrecipitation concentration index
PWPPermanent welting point
SEMADSecretary of State for Environment and Sustainable Development
SINNational Interconnected System
SoSSocial susceptibility
SPIStandard precipitation index
SWCSoil water content
WLWater lost in the industrial system
WRtsPercentage of water recovered and reused from sugarcane
WtsVolume of fresh water per tonne of sugarcane process

References

  1. Cunha, A.P.M.A.; Zeri, M.; Deusdará Leal, K.; Costa, L.; Cuartas, L.A.; Marengo, J.A.; Tomasella, J.; Vieira, R.M.; Barbosa, A.A.; Cunningham, C.; et al. Extreme Drought Events over Brazil from 2011 to 2019. Atmosphere 2019, 10, 642. [Google Scholar] [CrossRef] [Green Version]
  2. de Nys, E.; Engle, N.; Magalhães, A.R. (Eds.) Drought in Brazil: Proactive Management and Policy; CRC Press: Boca Raton, FL, USA, 2017; ISBN 9781498765664. [Google Scholar]
  3. Cunha, A.P.; Brito, S.S.; Neto, G.G.; Avalá, R.C. Drought Between 1963 and 2017 in the Federal District, Brazil. Anuário IGEO UFRJ 2018, 41, 487–498. [Google Scholar] [CrossRef]
  4. Semertzidis, T.; Spataru, C.; Bleischwitz, R. Cross-sectional Integration of the Water-energy Nexus in Brazil. J. Sustain. Dev. Energy Water Environ. Syst. 2017, 6, 114–128. [Google Scholar] [CrossRef] [Green Version]
  5. Instituto Brasileiro de Geografia e Estatística. A Geografia da Cana-de-Açúcar: Dinâmica Territorial da Produção Agropecuária; IBGE Instituto Brasileiro de Geografia e Estatística: Rio de Janeiro, Brazil, 2017; ISBN 9788524044434.
  6. Rodrigues, J.A.M.; Viola, M.R.; Alvarenga, L.A.; Mello, C.R.; Chou, S.C.; Oliveira, V.A.; Uddameri, V.; Morais, M.A.V. Climate change impacts under representative concentration pathway scenarios on streamflow and droughts of basins in the Brazilian Cerrado biome. Int. J. Climatol. 2020, 40, 2511–2526. [Google Scholar] [CrossRef]
  7. Oliveira, P.T.S.; Nearing, M.A.; Moran, M.S.; Goodrich, D.C.; Wendland, E.; Gupta, H.V. Trends in water balance components across the Brazilian Cerrado. Water Resour. Res. 2014, 50, 7100–7114. [Google Scholar] [CrossRef] [Green Version]
  8. Fernandes, G.; Lima Gomes, L.; Teixeira Brandão, L.E. Mitigating Hydrological Risk with Energy Derivatives. Energy Econ. 2019, 81, 528–535. [Google Scholar] [CrossRef]
  9. Freitas, M.A.V.; Soito, J.L.S. Vulnerability to climate change and water management: Hydropower generation in Brazil. In Proceedings of the 5th International Conference on River Basin Management, Mellieha, Malta, 7–9 September 2009; Brebbia, C.A., Ed.; WIT Press: Southampton, UK, 2009; pp. 217–226. [Google Scholar]
  10. Oliveira, C.; Zulanas, C.; Kashiwagi, D. A Long-term Solution to Overcome the Problems Caused by Droughts in the Brazilian Power Systems. Procedia Eng. 2016, 145, 948–955. [Google Scholar] [CrossRef] [Green Version]
  11. Paim, M.-A.; Dalmarco, A.R.; Yang, C.-H.; Salas, P.; Lindner, S.; Mercure, J.-F.; de Andrade Guerra, J.B.S.O.; Derani, C.; Bruce da Silva, T.; Viñuales, J.E. Evaluating regulatory strategies for mitigating hydrological risk in Brazil through diversification of its electricity mix. Energy Policy 2019, 128, 393–401. [Google Scholar] [CrossRef]
  12. Semertzidis, T.; Spataru, C.; Bleischwitz, R. The Nexus: Estimation of Water Consumption for Hydropower in Brazil. J. Sustain. Dev. Energy Water Environ. Syst. 2019, 7, 122–138. [Google Scholar] [CrossRef] [Green Version]
  13. Hunt, J.D.; Stilpen, D.; de Freitas, M.A.V. A review of the causes, impacts and solutions for electricity supply crises in Brazil. Renew. Sustain. Energy Rev. 2018, 88, 208–222. [Google Scholar] [CrossRef]
  14. Nobre, C.A.; Marengo, J.A.; Soares, W. Climate Change Risks in Brazil; Springer: Cham, Switzerland, 2019; ISBN 9783319928814. [Google Scholar]
  15. Laboratório Nacional de Biorrenováveis. Biomassa de Cana-de-Açúcar. Available online: https://lnbr.cnpem.br/biovalue/biomassas/palha-bagaco/ (accessed on 1 May 2022).
  16. de Souza, Z.J.; de Azevedo, P.F. Geração de energia elétrica excedente no setor sucroalcooleiro: Um estudo a partir das usinas paulistas. Rev. Econ. Sociol. Rural 2006, 44, 179–199. [Google Scholar] [CrossRef] [Green Version]
  17. Zullo, J.; Pereira, V.R.; Koga-Vicente, A. Sugar-energy sector vulnerability under CMIP5 projections in the Brazilian central-southern macro-region. Clim. Chang. 2018, 149, 489–502. [Google Scholar] [CrossRef]
  18. Scarpare, F.V.; Hernandes, T.A.D.; Ruiz-Corrêa, S.T.; Picoli, M.C.A.; Scanlon, B.R.; Chagas, M.F.; Duft, D.G.; Cardoso, T.d.F. Sugarcane land use and water resources assessment in the expansion area in Brazil. J. Clean. Prod. 2016, 133, 1318–1327. [Google Scholar] [CrossRef]
  19. de Arruda, M.R.; Giller, K.E.; Slingerland, M. Where is sugarcane cropping expanding in the brazilian cerrado, and why? A case study. An. Acad. Bras. Cienc. 2017, 89, 2485–2493. [Google Scholar] [CrossRef] [Green Version]
  20. Bufon, V.B.; Marcante, N.C.; Santos, J.M. Acúmulo e Partição de Biomassa da Cana-de-Açúcar Submetida a Diferentes Regimes Hídricos na Região do Cerrado. STAB 2016, 178–183. Available online: http://www.stab.org.br/congresso_nacional_stab/imagens/anais_congress_nacional_stab_2016.pdf (accessed on 15 July 2019).
  21. Oliveira Pires, M. Programas Agrícolas na Ocupação do Cerrado. Soc. E Cult. 2000, 3, 111–131. [Google Scholar]
  22. Jalles Machado, S.A. Annual & Sustainability Report; Jalles Machado S.A.: Goianésia, Brazil, 2021. [Google Scholar]
  23. Sistema Estadual de Geoinformação. Recursos Hídricos. Available online: http://www.sieg.go.gov.br/siegdownloads/ (accessed on 30 November 2018).
  24. Agência Nacional de Águas. Corpos Hídricos Superficiais: Base Hidrográfica Ottocodificada Multiescalas 2013—Rios. Available online: https://metadados.ana.gov.br/geonetwork/srv/pt/main.home?uuid=7bb15389-1016-4d5b-9480-5f1acdadd0f5 (accessed on 4 April 2018).
  25. Agência Nacional de Águas. Unidades de Planejamento Hídrico. Available online: http://metadados.ana.gov.br/geonetwork/srv/pt/main.home (accessed on 4 April 2018).
  26. DIVA—GIS. Download Data by Country: Brazil—Administrative Areas. Available online: https://www.diva-gis.org/gdata (accessed on 15 March 2018).
  27. Tomaz, W.L.; Serotini Gordono, F.; Piaudi da Silva, F.; Gomes de Castro, M.D.; Esperidiao, M. Cogeração de Energia a Partir do Bagaço da Cana-de-açucar: Esto de caso múltiplo no setor sucroalcoleiro. In Proceedings of the Encontro Internacional sobre Gestão Empresarial e Meio Ambiente, São Paulo, Brazil, 30 November–1 December 2015. [Google Scholar]
  28. Seabra, J.E.A.; Macedo, I.C.; Chum, H.L.; Faroni, C.E.; Sarto, C.A. Life cycle assessment of Brazilian sugarcane products: GHG emissions and energy use. Biofuels Bioprod. Bioref. 2011, 5, 519–532. [Google Scholar] [CrossRef]
  29. Parameswaran, B. Sugarcane Bagasse. In Biotechnology for Agro-Industrial Residues Utilisation; Singh nee’ Nigam, P., Pandey, A., Eds.; Springer: Dordrecht, The Netherlands, 2009; pp. 239–252. ISBN 978-1-4020-9941-0. [Google Scholar]
  30. Zaparolli, D. Paper from Cane Fiber and Leaves. Available online: https://revistapesquisa.fapesp.br/en/paper-from-cane-fiber-and-leaves/ (accessed on 6 May 2022).
  31. Silverio, J.d.M.; Da Silva, T.J.A.; Bonfim-Silva, E.M.; Iaia, A.M.; Duarte, T.F.; Pires, R.C.M. Drought tolerance of the sugar cane varieties during the initial development. Aust. J. Crop Sci. 2017, 11, 711–715. [Google Scholar] [CrossRef]
  32. Paolinelli, A.; Dourado Neto, D.; Mantovani, E.C. Diferentes Abordagens Sobre Agricultura Irrigada no Brasil: História, Política Pública, Economia e Recurso Hídrico; Universidade de São Paulo, Escola Superior de Agricultura Luiz de Queiroz: Piracicaba, Brazil, 2021; ISBN 9786587391113. [Google Scholar]
  33. Bordonal, R.d.O.; Carvalho, J.L.N.; Lal, R.; de Figueiredo, E.B.; de Oliveira, B.G.; La Scala, N. Sustainability of sugarcane production in Brazil. A review. Agron. Sustain. Dev. 2018, 38, 13. [Google Scholar] [CrossRef] [Green Version]
  34. Camelo de Souza, J.K.; De Oliveira Mesquita, F.; Dantas Neto, J.; Araújo de Souza, M.M.; de Azevedo Farias(None), C.H.; Mendes, H.C.; Mendes de Andrade Nunes, R. Fertirrigação com vinhaça na produção de cana-de-açúcar. Agropecuária Científica No Semiárido 2015, 11, 7–12. [Google Scholar]
  35. Forum Nacional Sucroenergético. Gestão dos Recursos Hídricos na Agroindústria Canaveira. União da Indústria de Cana-de-Açúcar. Brasilia. 2019. Available online: https://www.unica.com.br/wp-content/uploads/2019/06/Gestao-dos-Recursos-Hidricos.pdf (accessed on 17 March 2022).
  36. Di Donato, G.F.; Targa, M.d.S.; Da Almeida, A.A.S. Otimização do uso de recursos hídricos em uma usina de produção de etanol. Rev. Agro. Amb. 2021, 14, e006715. [Google Scholar] [CrossRef]
  37. McKee, T.B.; Doesken, N.J.; Kleist, J. Drought Monitoring with Multiple Timescales. In Proceedings of the Ninth Conference on Applied Climatology, Dallas, TX, USA, 15–20 January 1995; American Meteorological Society: Boston, MA, USA, 1995. [Google Scholar]
  38. McKee, T.B.; Doesken, N.J.; Kleist, J. The Relationship of Drought Frequency and Duration to Time Scale. In Proceedings of the Eighth Conference on Applied Climatology, Anaheim, CA, USA, 17–22 January 1993; American Meteorological Society: Boston, MA, USA, 1993. [Google Scholar]
  39. Oliver, J.E. Monthly Precipitation Distribution: A Comparative Index. Prof. Geogr. 1980, 32, 300–309. [Google Scholar] [CrossRef]
  40. van Loon, A.F. Hydrological drought explained. WIREs Water 2015, 2, 359–392. [Google Scholar] [CrossRef]
  41. Regulamento do Sistema de Outorga do di- reito de uso das águas de domínio do Estado de Goiás; Resolução N° 09, De 04 De Maio De 2005: Resolução N° 09, 2005; Gabinete do Conselho Estadual de Saneamento, Meio Ambiente e Recursos Hídricos: Goiânia, Brazil, 2005.
  42. Alterações na Vazão Alocável para Outorga em Cursos D’água sob Domínio do Estado de Goiás; Resolução N° 11, De 20 De Março De 2007: Resolução N° 11, 2007; Gabinete do Conselho Estadual de Saneamento, Meio Ambiente e Recursos Hídricos: Goiânia, Brazil, 2007.
  43. Rudorff, B.F.T.; Aguiar, D.A.; Silva, W.F.; Sugawara, L.M.; Adami, M.; Moreira, M.A. Studies on the Rapid Expansion of Sugarcane for Ethanol Production in São Paulo State (Brazil) Using Landsat Data. Remote Sens. 2010, 2, 1057–1076. [Google Scholar] [CrossRef] [Green Version]
  44. Agrosatelite. Sugarcane Harvested and Plantes Area between in Goiás; Agrosatelite: Florianópolis, Brazil, 2017. [Google Scholar]
  45. Sistema Nacional de Cadastro Ambiental Rural. Cadastro Ambiental Rural Goiás. Available online: https://www.car.gov.br/publico/municipios/downloads?sigla=GO (accessed on 1 March 2021).
  46. Projeto MapBiomas. Coleção 3.1 da Série Anual de Mapas de Cobertura e Uso de Solo do Brasil. Available online: https://mapbiomas.org/colecoes-mapbiomas-1?cama_set_language=pt-BR (accessed on 15 July 2019).
  47. NovaCana. Usinas de Açúcar e Álcool no Estado: Goiás. Available online: https://www.novacana.com/usinas_brasil/estados/goias (accessed on 1 March 2021).
  48. NovaCana. Ranking de Moagem: As Maiores Unidades de Processamento de Cana para Produção de Etanol e Açúcar. Available online: https://www.novacana.com/usinas_brasil/ranking/moagem (accessed on 1 March 2021).
  49. NovaCana. Levantamento da Cogeração de Energia no Brasil por Usina. Available online: https://www.novacana.com/n/cogeracao/mercado/levantamento-cogeracao-energia-brasil-usina-200315 (accessed on 15 April 2021).
  50. Field, C.B.; Barros, V.R. (Eds.) Climate Change 2014: Impacts, Adaptation and Vulnerability; Cambridge University Press: New York, NY, USA, 2014; ISBN 978-1-107-05807-1. [Google Scholar]
  51. Secretaria de Estado de Meio Ambiente e Desenvolvimento Sustentável; Rio dos Patos Q95 and allocated flow; Conselho Estadual de Política Ambiental: Goiás, Brazil, 2019.
Figure 2. Sugarcane system. Green boxes and lines represent the agriculture subsystem and water required in the industry, the yellow boxes and lines represent the industrial subsystem (SIN is an acronym for the National Interconnected System in Portuguese), and the grey boxes represent a zoom in of the industrial subsystem.
Sustainability 14 06219 g002
Figure 3. Sugarcane system timeframe. Green boxes and lines represent the agriculture subsystem and water required in the industry, the yellow boxes and lines represent the industrial subsystem (SIN is an acronym for the National Interconnected System in Portuguese).
Sustainability 14 06219 g003
Figure 4. Soil water content (SWC) variation (left axis) through the months in relation to the precipitation (right axis) and its impact on sugarcane crop yield. Data measured in the field.
Sustainability 14 06219 g004
Figure 5. Agriculture hazard indicators, groups that were organised, and the mathematical values representing the hazards of the groups.
Sustainability 14 06219 g005
Figure 6. Agriculture vulnerability indicators (first column) and groupings of indicators (second column).
Sustainability 14 06219 g006
Figure 7. Monthly average river and ecological water flow, and available flow for processes after subtracting water flow (50% of the Q95) in cubic meters per second.
Sustainability 14 06219 g007
Figure 8. Monthly hydrological drought thresholds in cubic meters per second.
Sustainability 14 06219 g008
Figure 9. Yearly drought risk assessment results between 2004 and 2015 (risk values range from 0 to 1).
Sustainability 14 06219 g009
Figure 10. Energy generation vs. risk assessment value between 2009 and 2015.
Sustainability 14 06219 g010
Figure 11. Yearly hazard results between 2004 and 2015 (hazard values range from 0 to 1). Captions: industrial hazard (hazard (i)); agriculture hazard (hazard (a)).
Sustainability 14 06219 g011
Figure 12. Land-use map used for the agriculture exposure.
Sustainability 14 06219 g012
Figure 13. Yearly exposure results between 2004 and 2015 (exposure values range between 0 and 1). Captions: industrial exposure (exposure (i)); agriculture exposure—irrigated sugarcane (exposure (a-IS); and agriculture exposure—rain-fed sugarcane (exposure a-RS).
Sustainability 14 06219 g013
Figure 14. Yearly vulnerability results (vulnerability results range between 0 and 1). Captions: industrial vulnerability (vulnerability (i)); agriculture vulnerability (vulnerability (a)).
Sustainability 14 06219 g014
Figure 15. Normalised risk assessment comparisons for the years 2007 and 2015. Where “a” refers to the average of values, “b” refers to the highest value, and “c” refers to the weighted average results. * refers to the “Q” value detailed in Equation (2b).
Sustainability 14 06219 g015
Table 1. Thresholds and impact levels example. Precipitation concentration index (PCI) values. The colour classification is as follow: orange—severe drought or highly concentrated rainy season, light orange—moderate drought or moderately concentrated rainy season, yellow—mild drought or slightly concentrated rainy season, light green—slightly distributed rainy season, mint green—moderately distributed rainy season, petrol green—severely distributed rainy season.
YearPCI
20110.58
20120.58
20130.56
20140.57
20150.58
Standard deviation0.041
Quartile 10.52
−3 (Severe drought)Higher than 0.64
−2 (Moderate drought)0.6–0.64
−1 (Mild drought)0.56–0.6
Normal values0.52–0.56
−10.48–0.52
−20.43–0.48
−3Less than 0
Table 3. Industrial vulnerability indicators and thresholds.
IndicatorUnitBest-Case ScenarioWorst-Case Scenario
Volume of fresh water per tonne of sugarcane processedm3/TSC0.502
kWh generated per tonne of sugarcane processedkWh/TSC12015
Percentage of water recovered and reused from sugarcanePercentage100%0%
kWh used per tonne of sugarcane processedkWh/TSC1230
Volume of water losses in the systemm3/TSC0.501
Access to a dam to cover the water needed for industrial purposesPercentage100%0%
Table 4. Agriculture hazard indicator weights.
IndicatorGroupIndicator Weight
Total precipitation (mm)Rain volume3
Standard precipitation index (SPI)
Precipitation concentration indexRain distribution3
Length of the dry season (days)
Total days under dry spells (days)
Number of days T > 36 °CDays with a maximum temperature higher than 36 °C1
Available river flow (m3/s)River flow3
Crop yield (tonne/ha)Crop yield3
Late start of rainy season (days)Agricultural planning1
Early finish of rainy season (days)
Publisher’s Note: MDPI stays neutral with regard to jurisdictional claims in published maps and institutional affiliations.

