1. Introduction
The industry and academia have been collaborating to realize the Sustainable Development Goals (SDGs) set by United Nations (UN) as the increasing human population is causing the call for dairy products to increase rapidly. Farmers in developing countries rely on the income of dairy product businesses that highly rely upon livestock health. The environmental parameter variation plays a crucial role in animal health while having a detrimental effect on diseases such as foot and mouth disease, swine fever, bovine spongiform encephalopathy, cattle rovotracheitis, squamous cell carcinoma, warts, web tear, necrotic pododermatitis, polioencephalomalacia, hypomagnesemia, clostridia, and hypoglycemia [
1]. The motivation for this research is to provide a cost-effective, intelligent system of a plug-and-play nature, free from human involvement, to attain food sustainability. The existing systems are unaffordable for farmers. A World Health Organization (WHO) document reveals that an acute breathing syndrome coronavirus (SARS-CoV-2) is stated to be a particularly contagious virus that spreads to other animals and people [
2]. Proof of this virus was first seen in Guangdong province of southern China in 2002, and by 2003, 26 countries around the globe had reported severe acute respiratory syndrome (SARS) infections. It has led to economic losses of approximately 2% of east Asia’s gross domestic product (GDP) [
3,
4,
5]. The conventional system cannot compete in the international dairy product market until it is shifted to modern technologies. Recently, WSN and IoT technologies emerged as a part of modern agriculture using advanced applications. Many researchers are focusing on the improvement of animal-fitness-monitoring packages. Moreover, the concept of fitness tracking depends on methods along with direct contact (invasive) or oblique contact (non-invasive) [
6]. Essentially, the model of a telemonitoring testing device consists of a heating unit and a reception unit with a laptop [
4]. This study aims to develop a plug-and-play system that is currently unavailable for smart animal monitoring and real-time tracking.
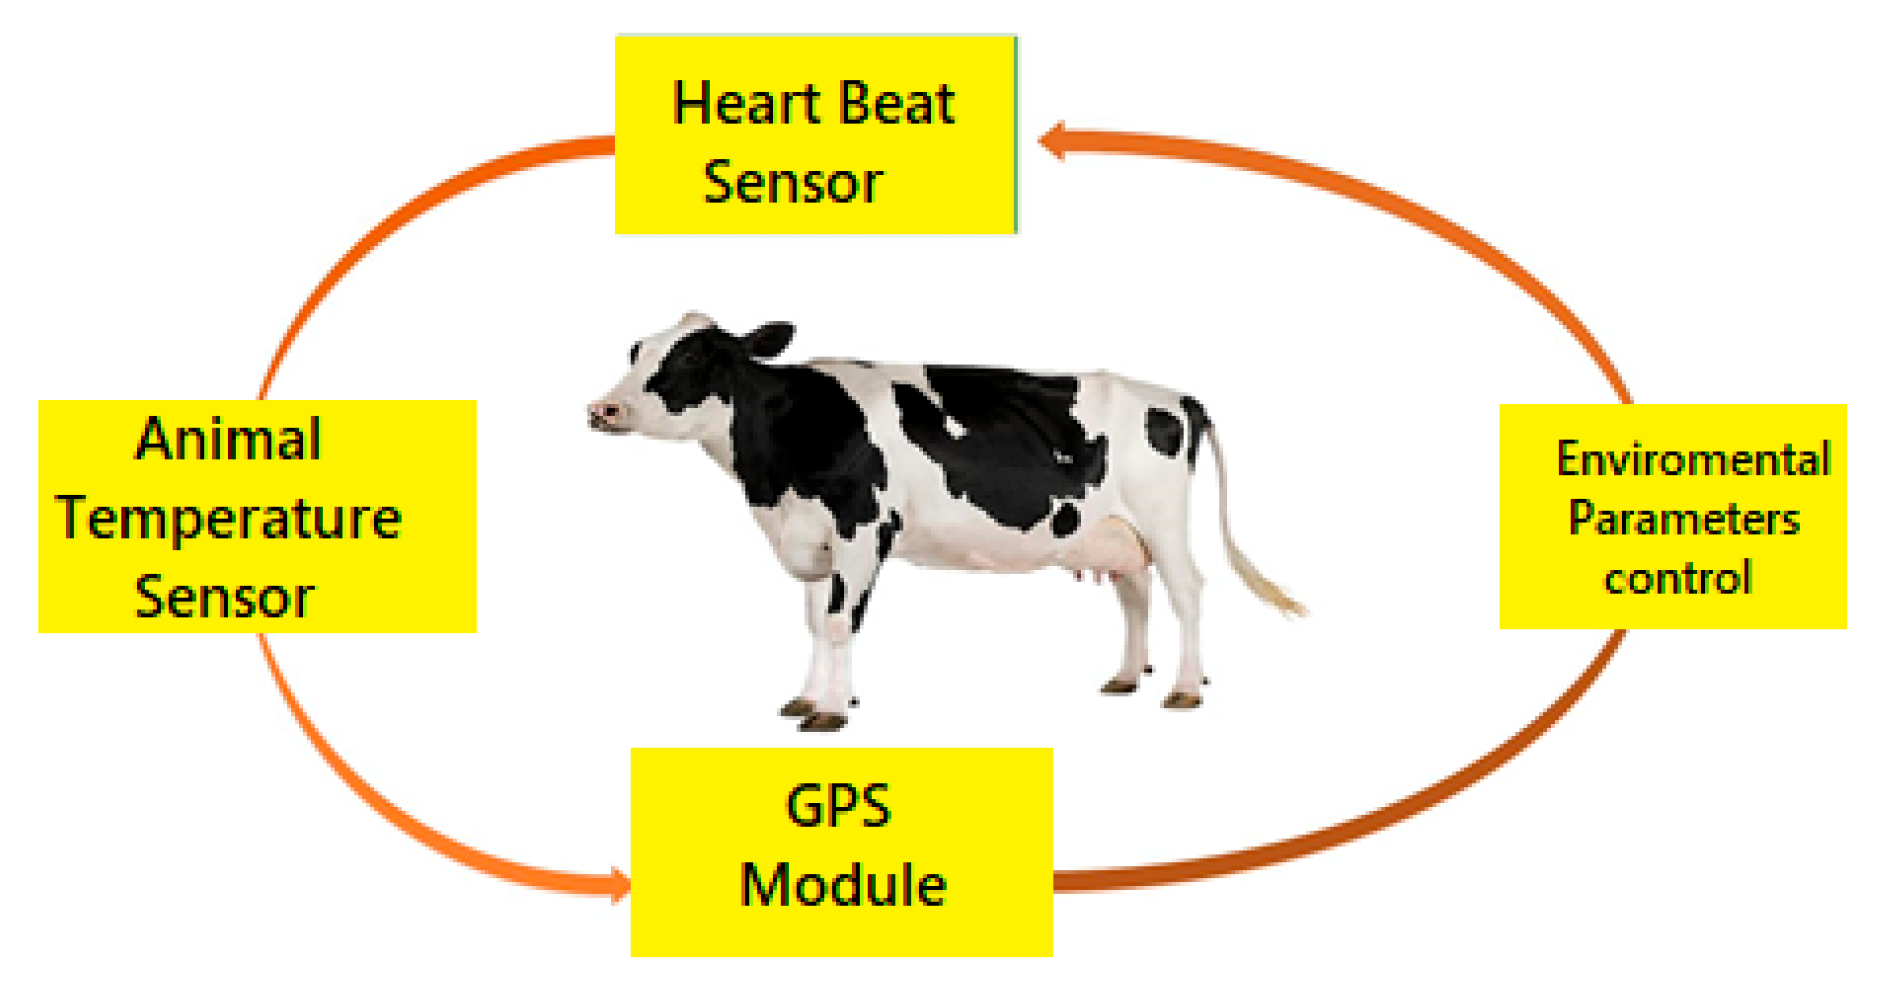
Figure 1 shows an overview of animals’ protection through the proposed implementation.
Most of the time, veterinarians check the body parameters of the animal by hand. Currently, livestock farmers are facing many problems in looking after the health of animals in developing countries. Hence, adjustments are continuously recommended using this equipment. The most common globally available systems focus only on measuring the heart rate to detect early animal diseases. The existing literature reveals that real-time, wearable, animal-health-monitoring systems are important technologies in assisting the veterinary workforce, and measurement parameters can offer accurate records of animal fitness [
7,
8,
9,
10,
11,
12]. Consequently, animal health care is relatively inexpensive. Traditionally, cattle health is determined by visual inspection of animal behavior or by manual examination by a farmer or veterinarian. The pit animal health monitor worn by each animal can provide a low-cost and highly effective solution worldwide. Each time animal details are uploaded to the base station, the owner can easily view statistics for all the animals. The condition of the animals can be easily summarized as different health conditions, such as suspicion and abnormalities. It is well known that animals do not talk and do not share their problems, so this paper has provided an example of an animal-health-monitoring program. Smart Dairy Farming (SDF) is a concept that plays a very important role in satisfying the growing demand for high-quality dairy products. SDF has many benefits that greatly benefit the modern world [
5]. SDF can reduce environmental issues, reduce resource utilization, and improve animal health through advanced sensing technology and data analysis. In this current business world, dairy farmers face many problems such as livestock management, low productivity, and high labor costs [
13]. The body must be maintained at a steady temperature, at a short distance, for the device to function properly. A definition in [
6] provides the principal function of the standard and the mixing of its preparation. The authors in [
6] define the utility of this basic protocol in national online sensory networks. An alternate in body temperature is an indication of contamination. Moreover, the herbal elements that include moisture should be taken into consideration carefully as they affect the metabolism and conduct of the animal. Additionally, flawed temperature and humidity values can affect study results. The relative humidity needs to be maintained at 30% to 70%, which has a good impact on animal health [
14]. It influences the capacity of the plant life and animals to cool off as the environmental factors are crucial [
14]. It is identical to the current availability of less costly, low-energy components [
15], including processors [
16], radios, and sensors incorporated into a minimal chip (device on one chip) [
17,
18,
19,
20].
The WSN eliminates the risks associated with cable structures and makes the technique of statistics size and monitoring a great deal less complicated and extra efficient [
21,
22]. By using WSN data transfer technology, we can automatically measure different locations remotely from the internet to obtain real-time sensor node data, so we can access the measured and stored data at various locations at a lower cost [
23]. Furthermore, the sensors may be enabled and used to switch actual-time statistics to esp8266, which may examine and process the facts provided. The wireless sensor community may be connected to the internet through the usage of a Wi-Fi router, and the real-time facts collected through those sensors may be transmitted to the IoT platform periodically [
24]. Further, the environmental adjustments can be visible in actual time on the computer or in the IoT database, which is beneficial for proprietors to look at the environmental parameters when they may be no longer available at the farm. The proposed system is a cost-effective and intelligent solution; however, it carries few limitations in the environment of developing countries, i.e., consistent availability of internet connectivity, memory management to maintain the storage of sensors’ data for a longer duration of time, and the proper design of a cow collar.
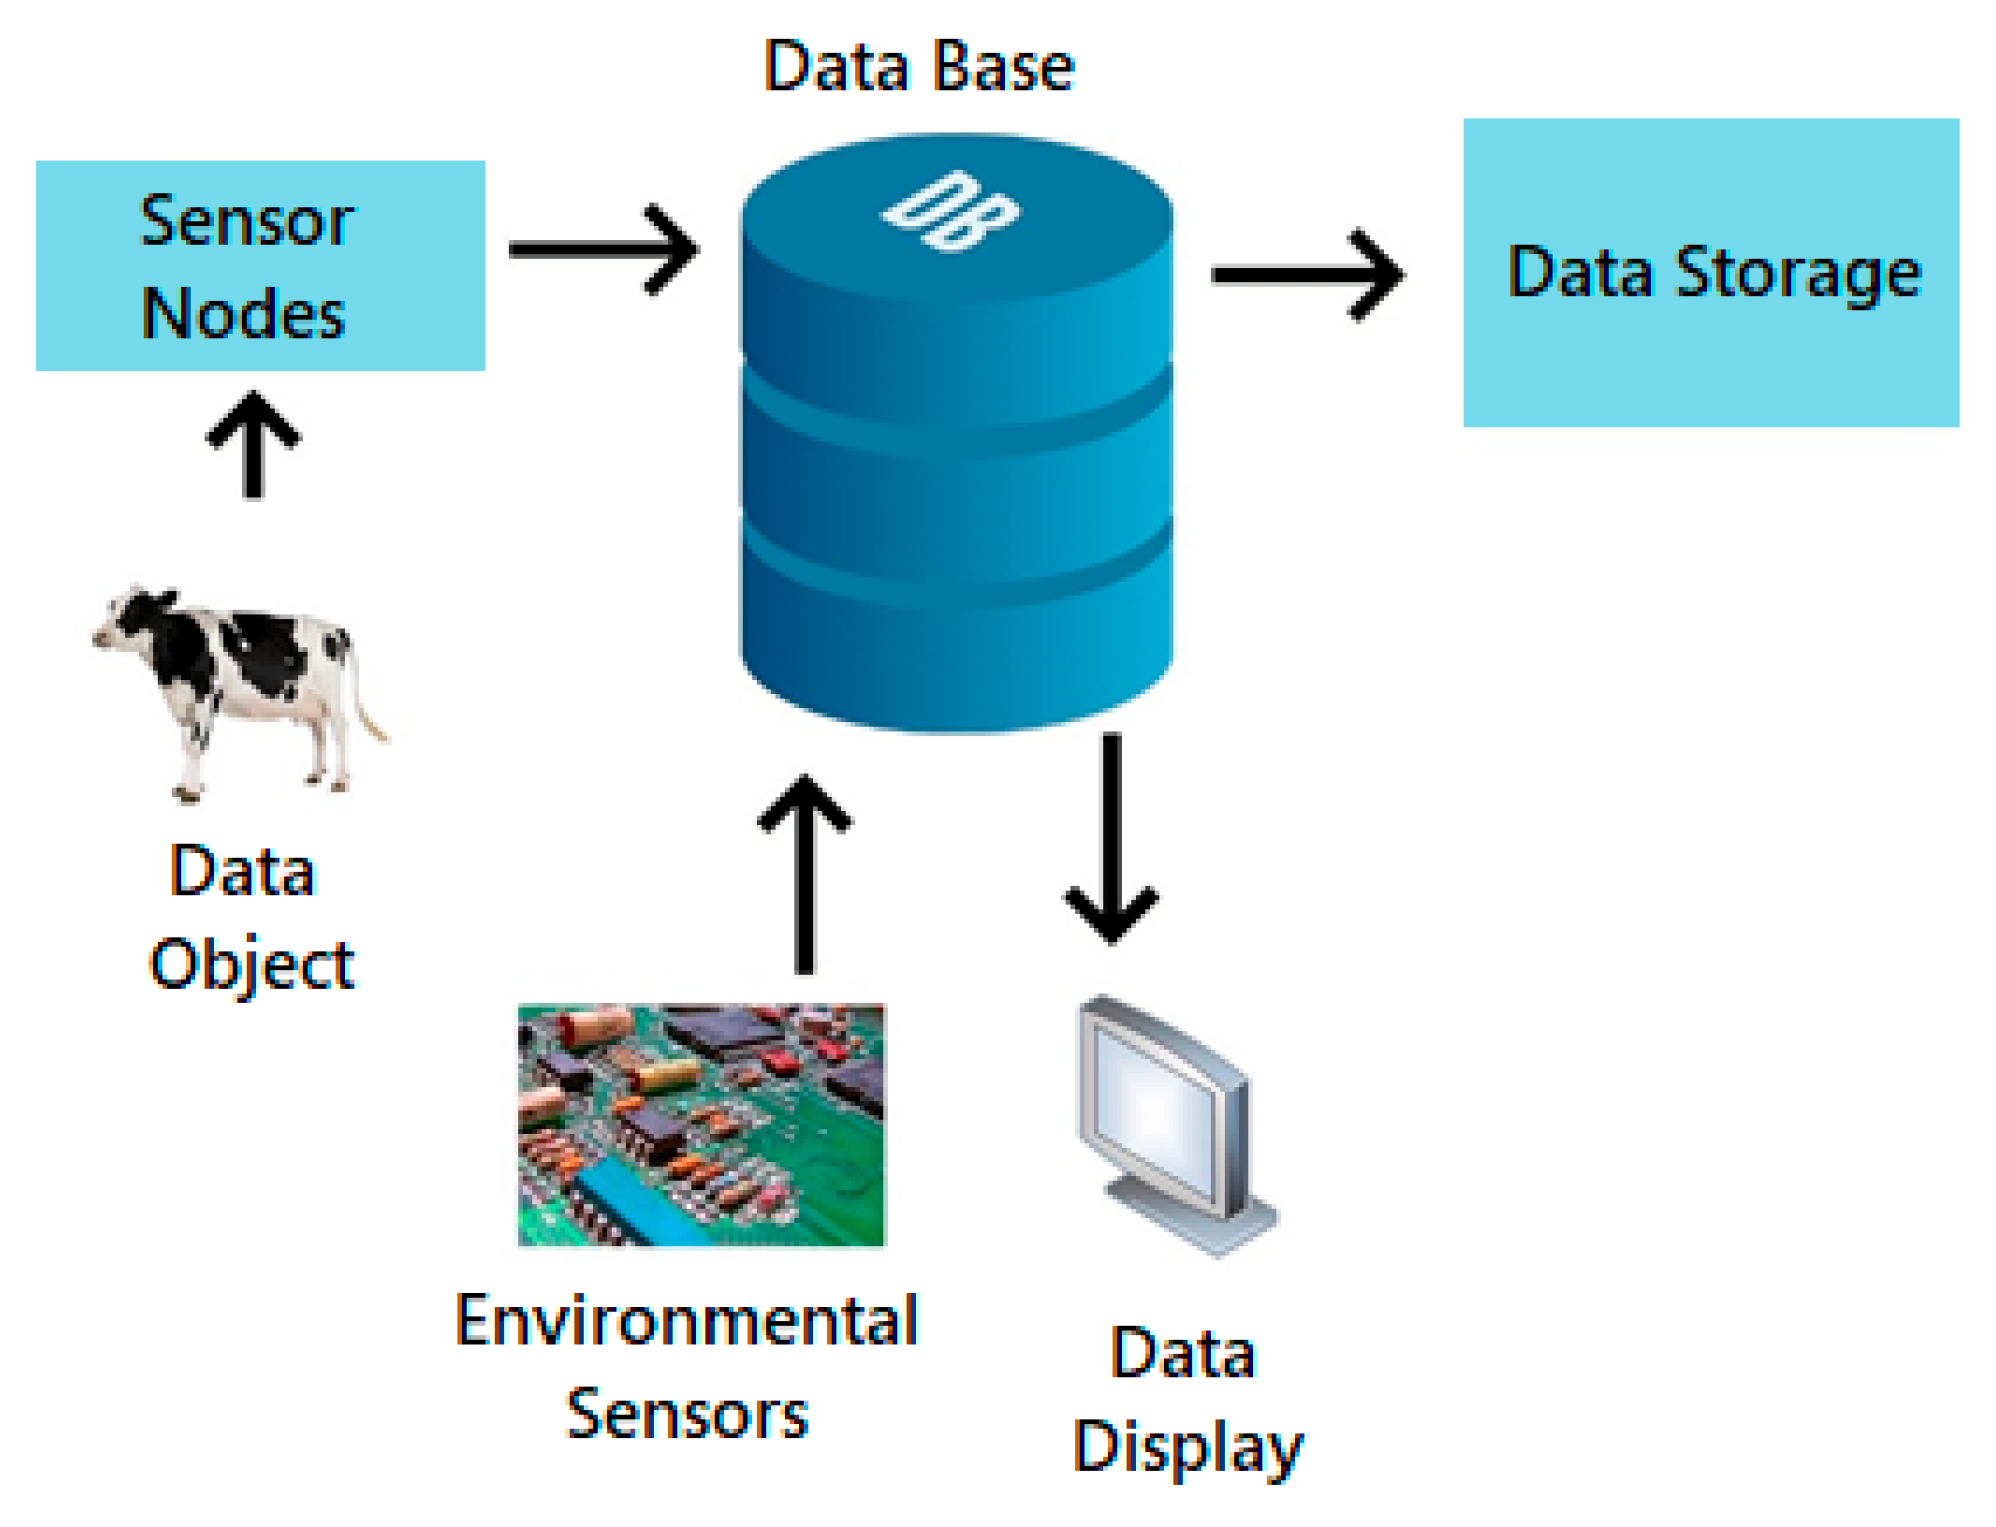
Figure 2 shows the architectural design of the proposed smart dairy system.
The proposed system is constantly updating data in the database. The environment monitoring consists of independent nodes used to monitor environmental factors such as temperature, humidity, CO2, and air quality. An irregularity in any of the parameters mentioned above causes adverse effects on cows’ health. It could lead to bad health or even the death of the animal. With this constant environment-monitoring system, all these factors can be analyzed, and upon any irregularity, immediate action is to be taken. The Internet of Things (IoT), a highly efficient technology, is a solution for low efficiency and good productivity in agriculture and livestock. IoT applications play a very important role in agriculture. These include agricultural monitoring, temperature monitoring, the monitoring of livestock, irrigation control, and soil monitoring. Following are the main objectives of this work:
- ➢
Design and development of Intelligent WSN nodes to gather real-time data on environmental parameters, i.e., temperature, humidity, CO2, and air quality.
- ➢
Configuration of WSN, IoT platform, and Node-MCU.
- ➢
Design and development of a cow collar (equipped with a temperature sensor, a GPS module to locate the animal, and a stethoscope to update the heart rate), and an automatic water-filling unit for drinking water.
- ➢
Development of a front end showing the real-time upgrading sensor data.
The principal goal of this work is to create an IoT-based livestock-monitoring system committed to the automatic measurement of the health of dairy cows. This paper proposed a smart livestock-monitoring system that implements a WSN, the IoT, and a Node-MCU module to attain the SDGs of the UN. The presented system is a plug-and-play model to provide ease in the implementation, and the automation reduces human intervention, and hence, the labor costs when a farm has hundreds of animals. The intelligent remote-monitoring system also increases the production of dairy and meat products by improving animal health.
2. Materials and Methods
This section provides the details of instruments used in the proposed implementation and the methods to interconnect different components.
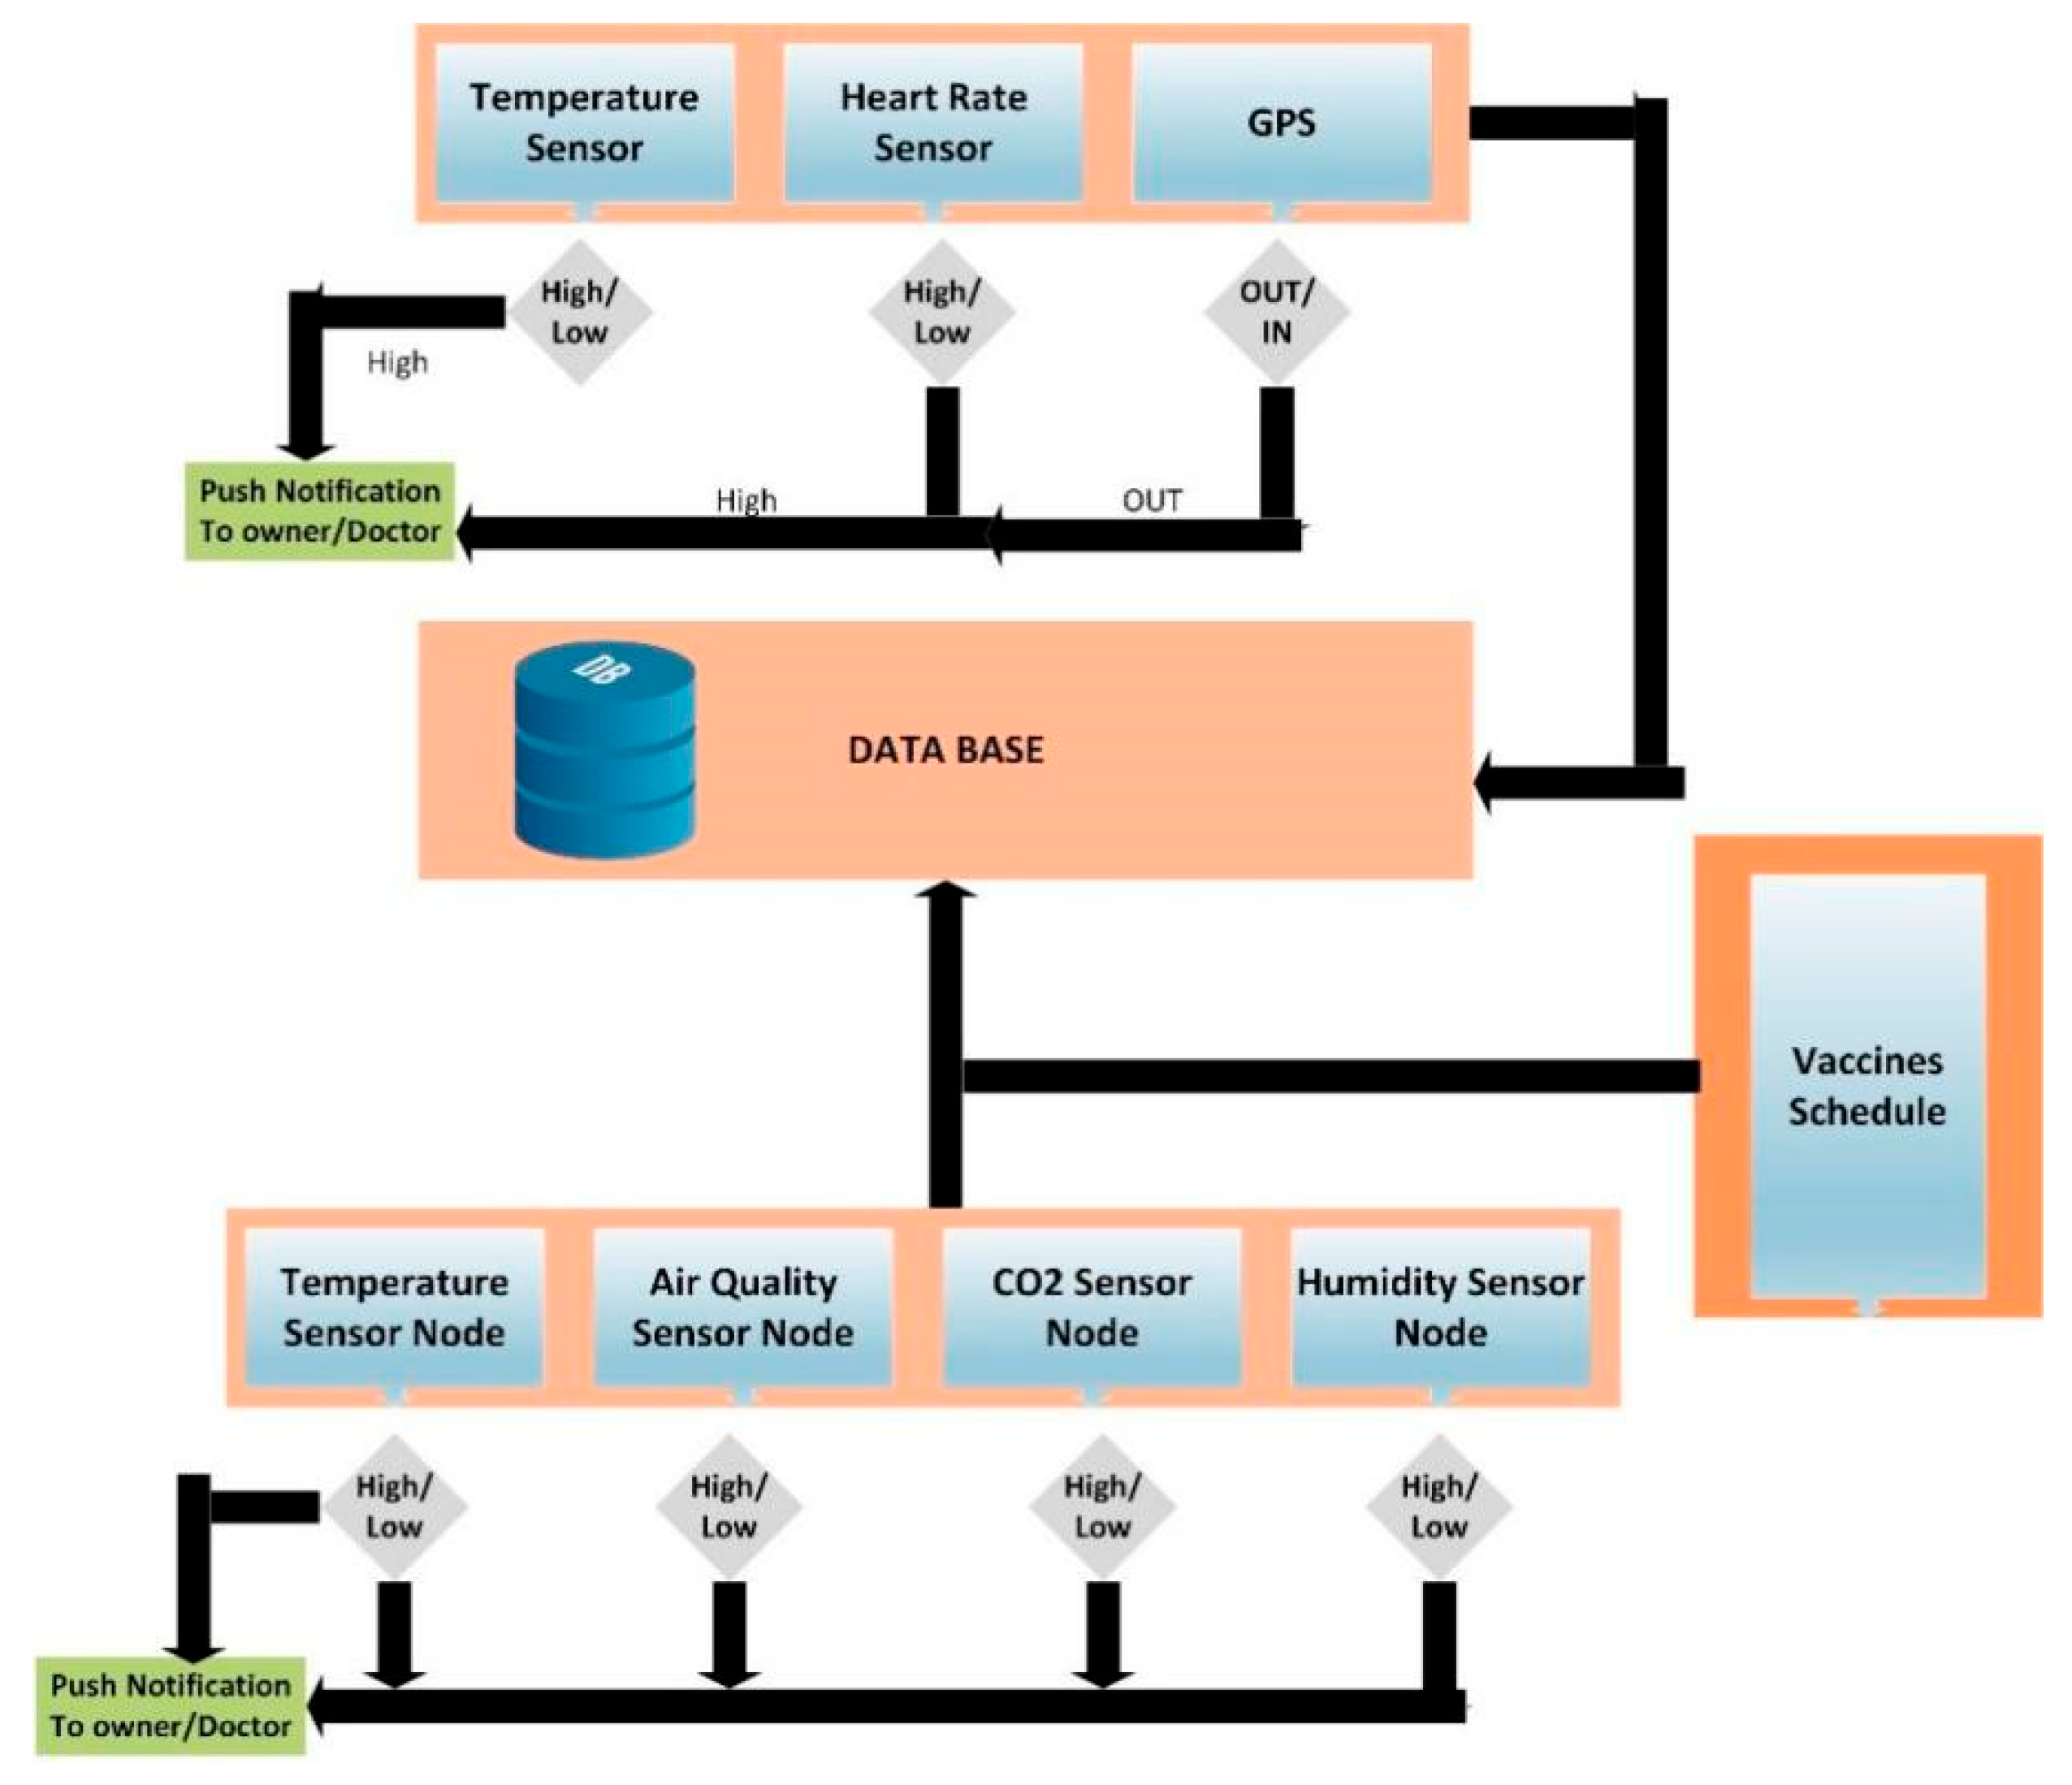
Figure 3 shows the basic block diagram of the proposed system.
The system of cow collars has been built using body area sensors, temperature and heart rate monitors, and a GPS module to locate the animals. Moreover, the environmental system consists of a CO
2 sensor node, environmental temperature sensor node, humidity sensor node, and air quality sensor node. The environmental parameter control system is interfaced with the Node-MCU, an IoT primarily based and constructed on a Wi-Fi System-on-a-chip SoC named the ESP8266. Each independent node is responsible for measuring the respective environmental parameters inside the cow’s barn to ensure no hazardous factors reach their limits and affect the animal’s health. The cow collar and environmental parameters are further forwarded to the database from where they are constantly updated, and, with the help of front-end development, the owner can easily see the details of the smart dairy farm irrespective of time and place through the internet. The proposed prototype development assisted in the definition of the modules that will be used in the proposed system and the parameters used in each module. Additionally, vaccine reminders have been programmed into the system. As the scheduled vaccination day approaches, a push message is delivered to the veterinarian’s device.
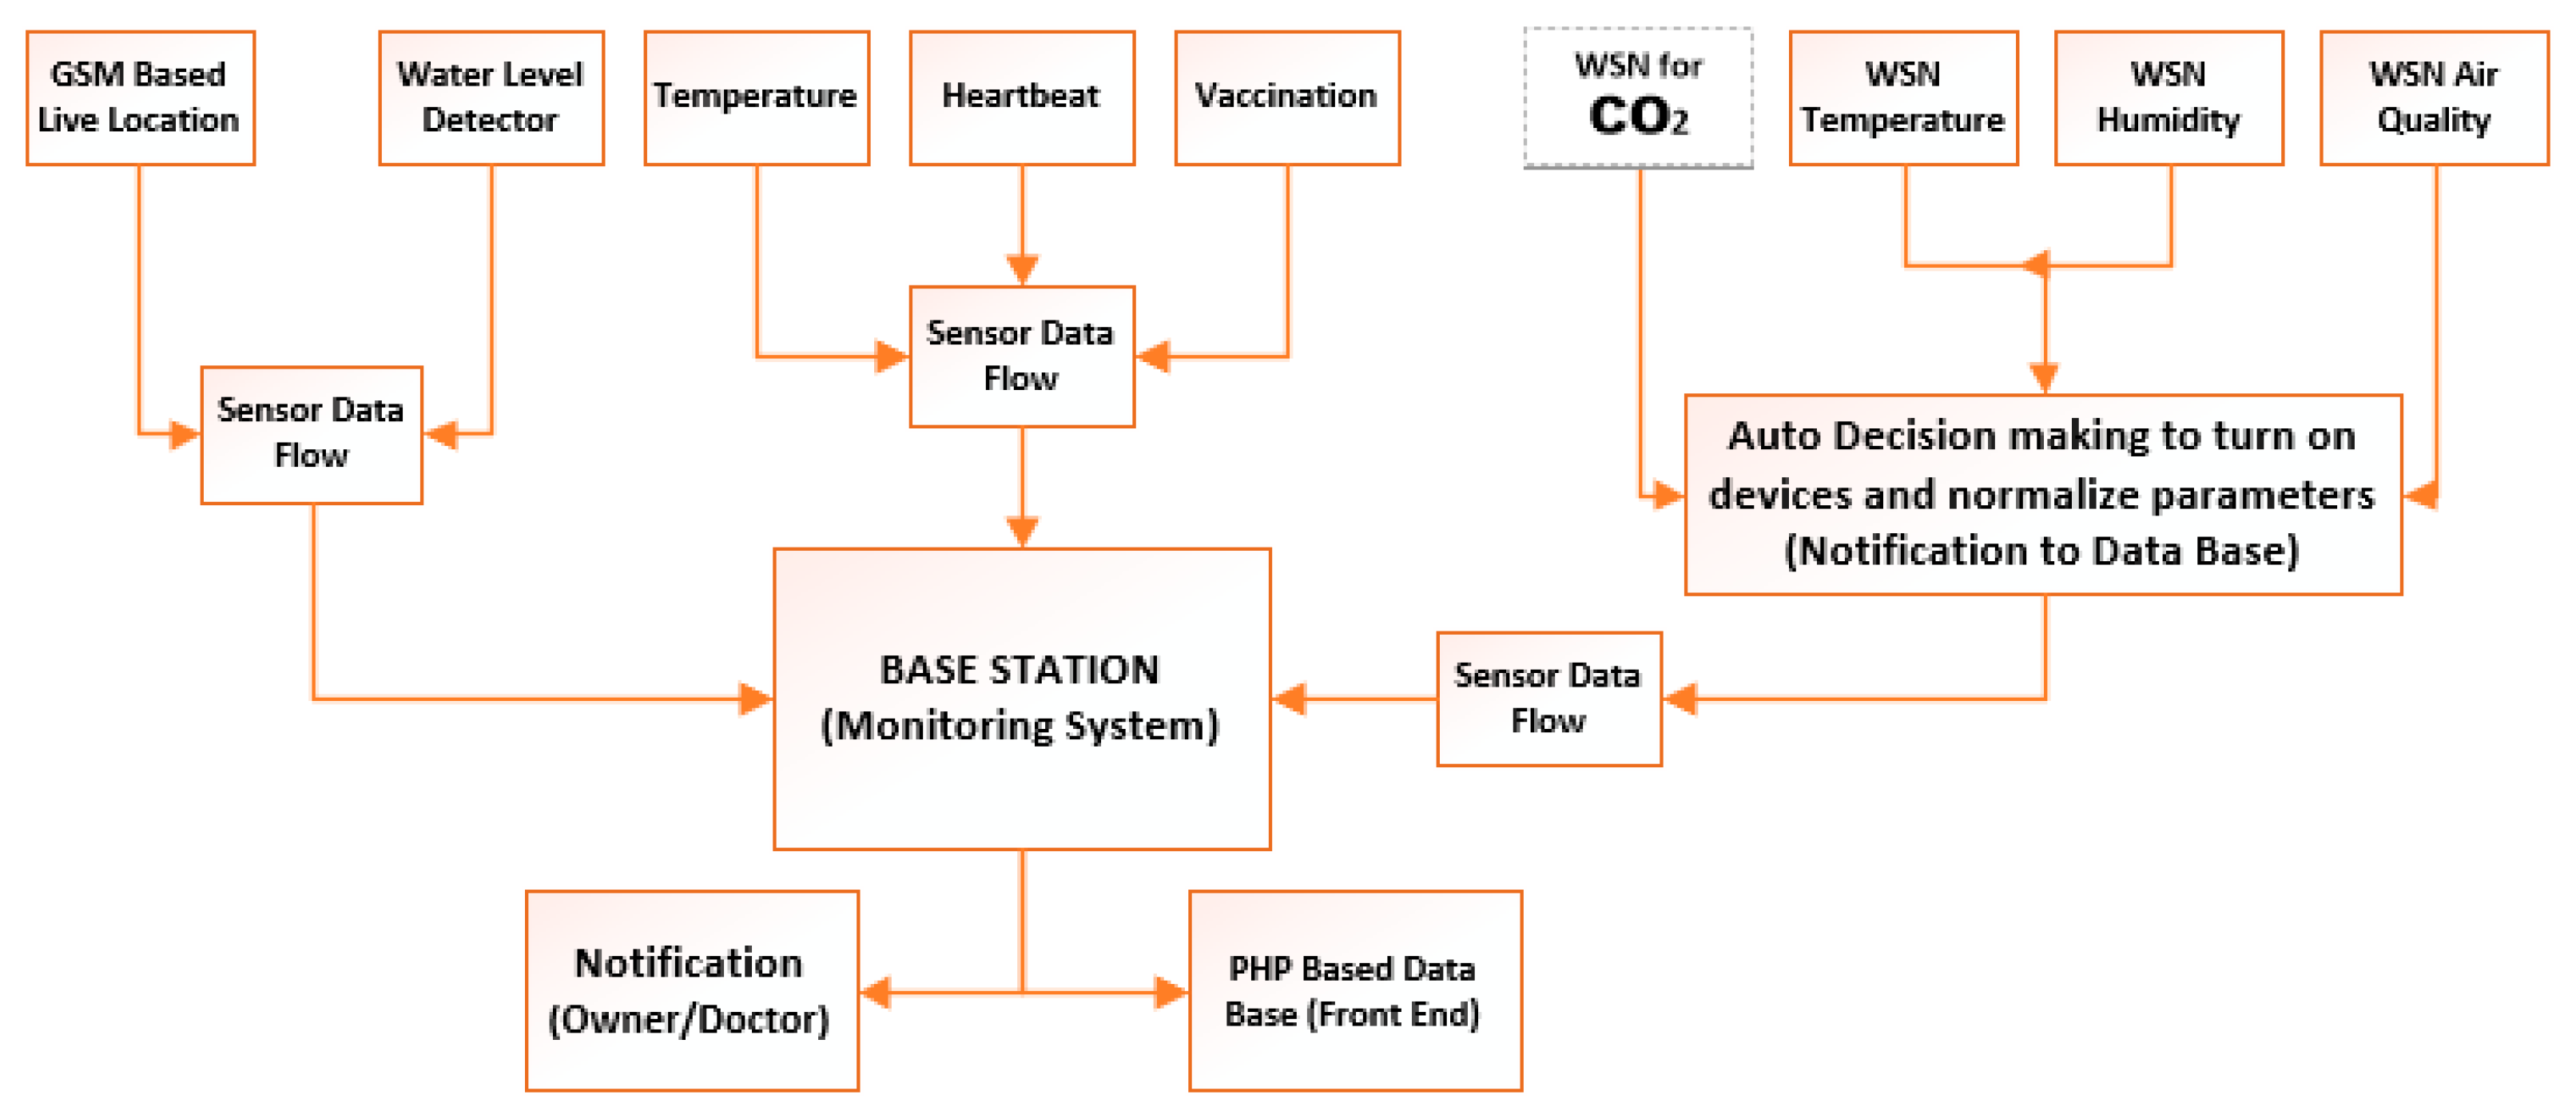
Figure 4 shows the complete workflow of the proposed model.
There are four modules, including cow collars, environmental monitoring, a water system, and the database. The cow collar for animal health monitors each animal’s temperature, heartbeat, and location on the smart dairy farm. These data are analyzed, and upon finding any irregularities, a notification is sent to the owner and the veterinarian for instant measures to be taken. Further, these data are uploaded to the database for the owner’s convenience so that he can have all the statistics for the smart dairy farm. The CO2, temperature, humidity, and air quality parameters of the cow’s barn are provided by the environmental parameters. Because all these sensors are built on separate nodes, the threshold values are set, and if the values rise, an alarm is generated to trigger the necessary action. The environmental sensor data are also uploaded and updated to the database. The water level system consists of a sensor that measures the water level of the tank. While the water drops from the predefined threshold of the tank, it refills the tank until it again drops from the value set.
2.1. Interfacing of Different Electronic Modules
The measured animal health parameters in this work include the temperature, heartbeat, and live location of the cow. Environmental sensors monitor various environmental parameters such as temperature, humidity, light, noise, air pressure, and air quality in a workspace. When monitored from Wireless Sensor Nodes, these environmental parameters provide efficient and accurate results that can be easily observed. For the measurement of water level, an ultrasonic sensor is used. We have chosen the sensors for temperature, CO2, humidity, and air quality parameters for our project. The following sections outline the details for each of the sensors.
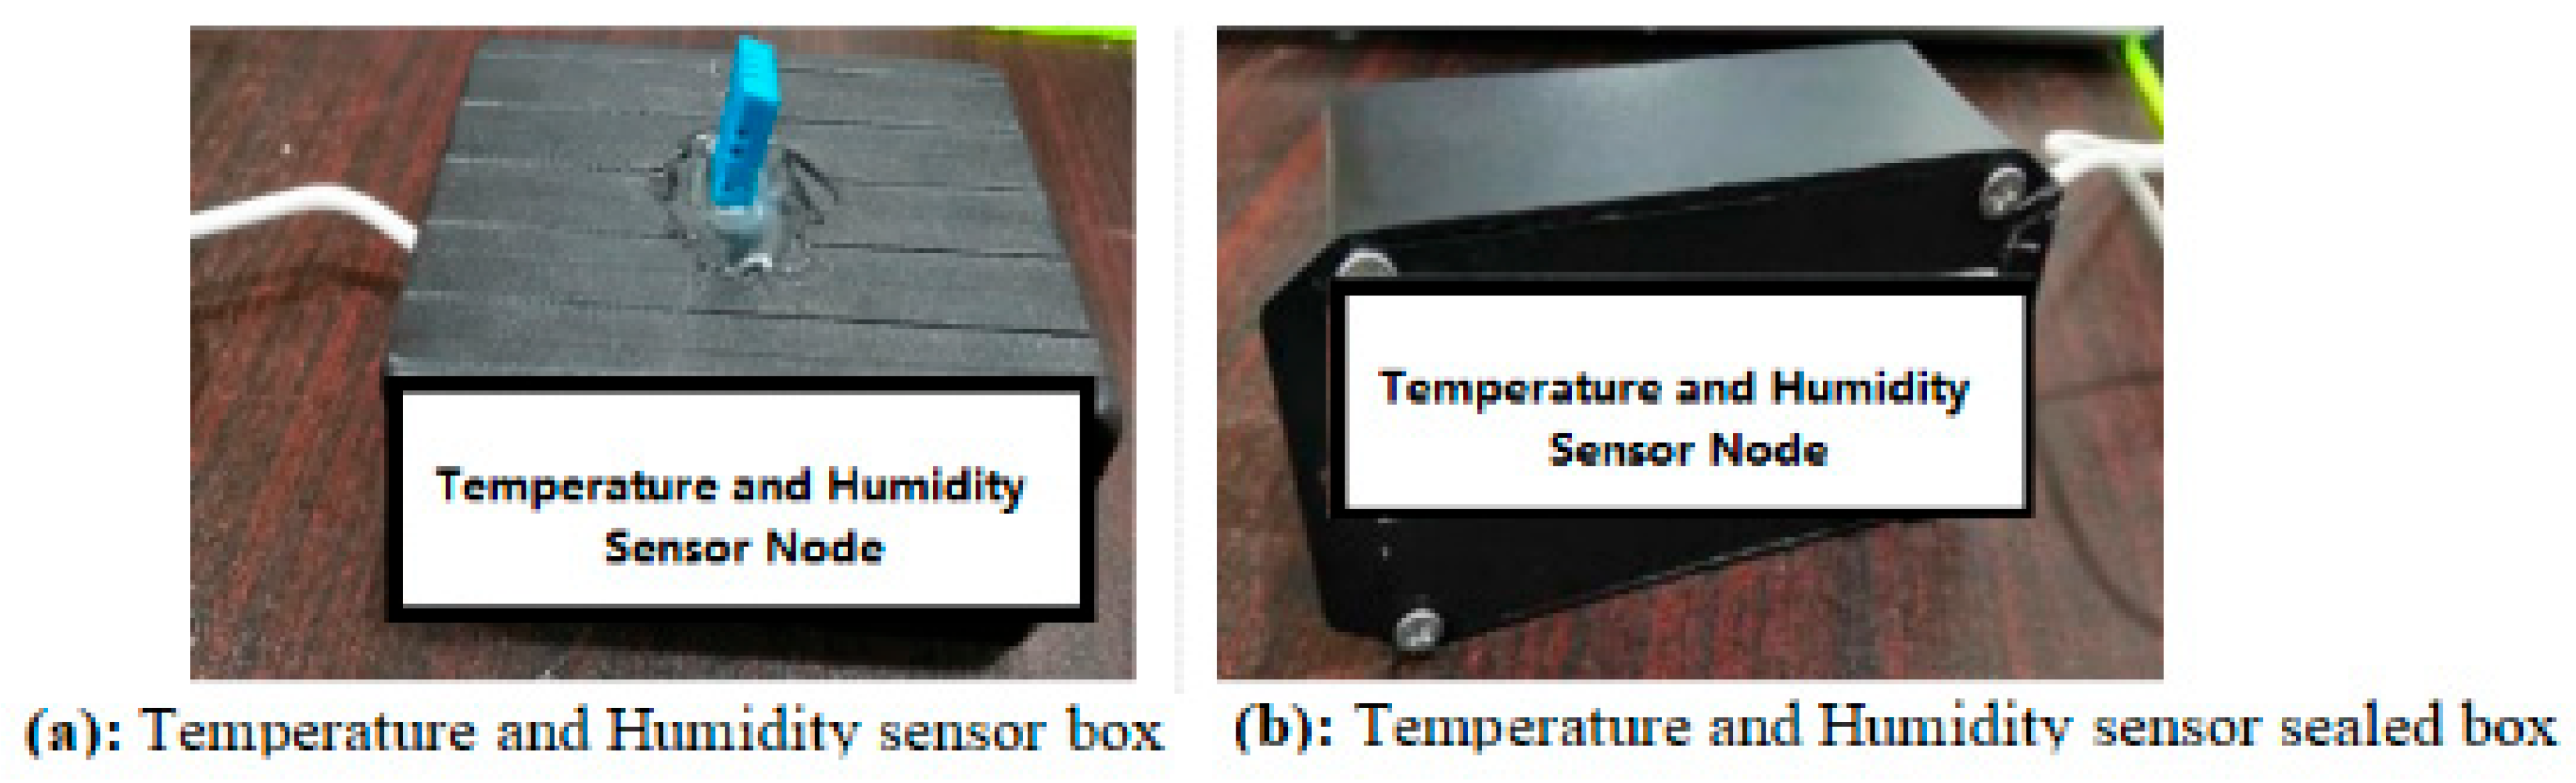
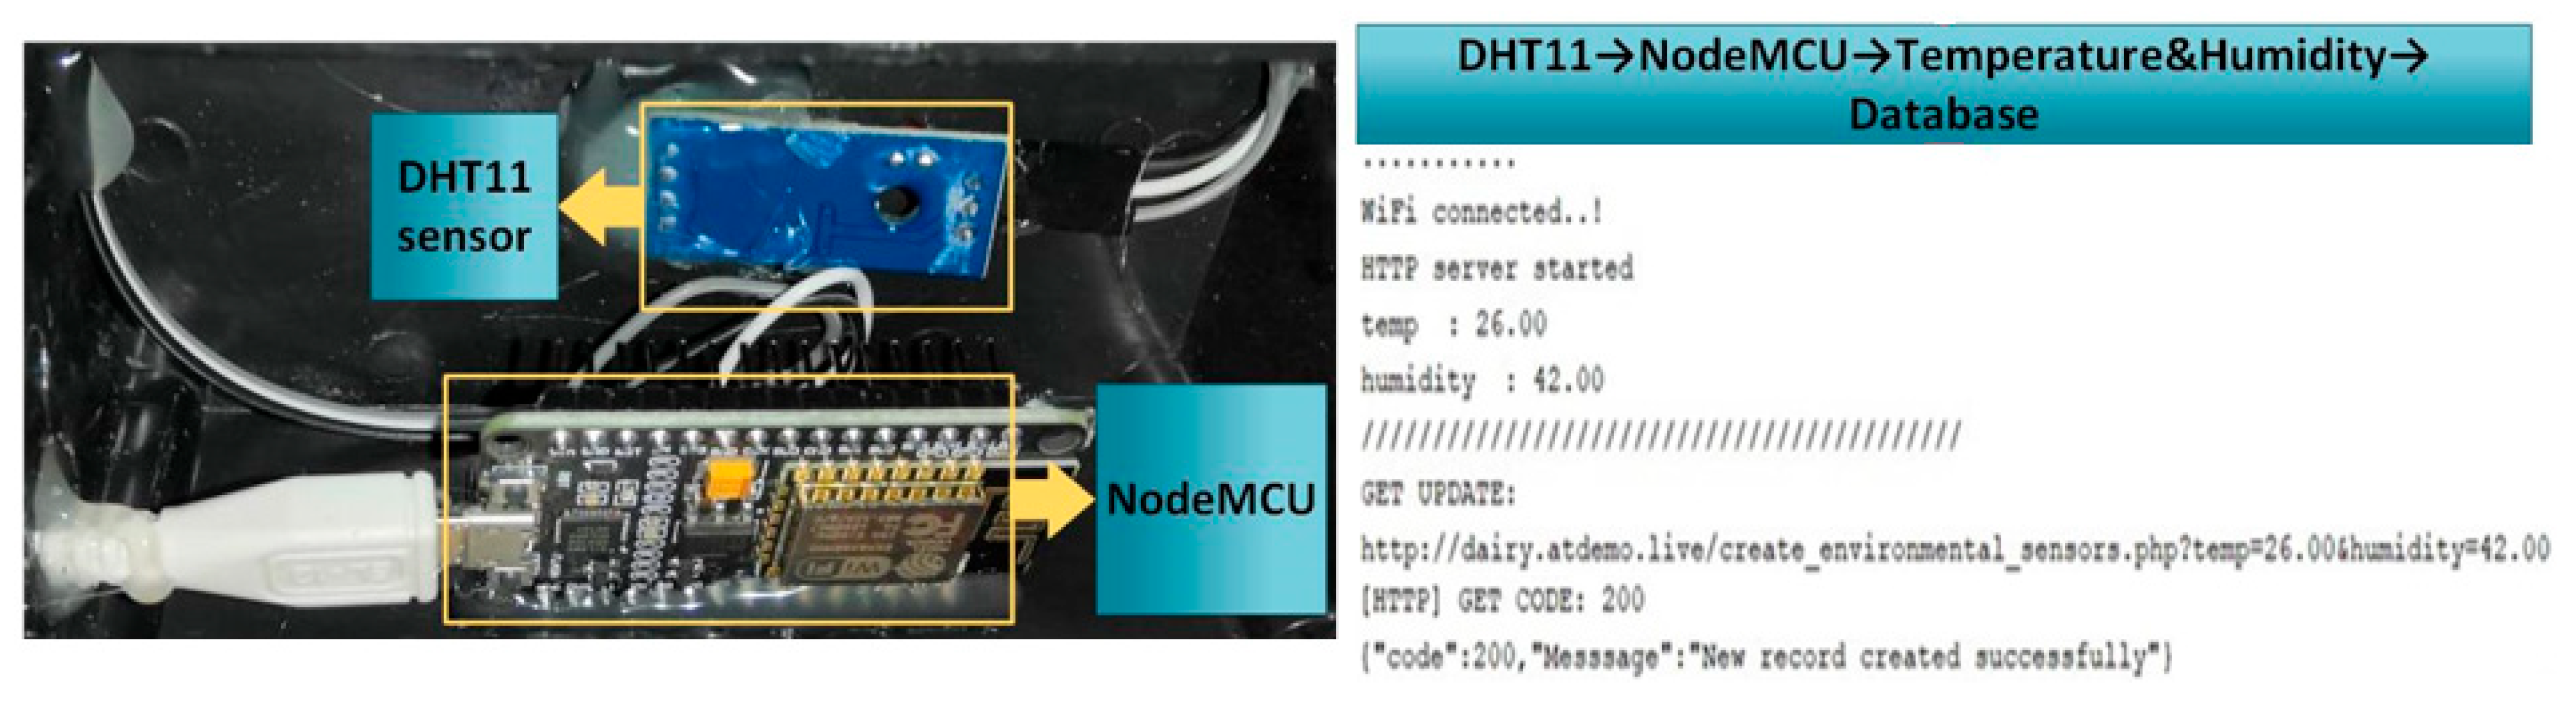
2.1.1. Temperature and Humidity Sensor
A cow’s normal body temperature is in the range of 36.5 °C to 39 °C. The MLX90614 [
12] sensor is utilized to monitor body temperature and relative humidity in this system. The analog pin of the Node-MCU is directly connected to this sensor. Temperature values below or above this range cause adverse effects on the health of the animal. When the temperature exceeds the value of 39 °C, an emergency notification is sent to the veterinarian and the owner.
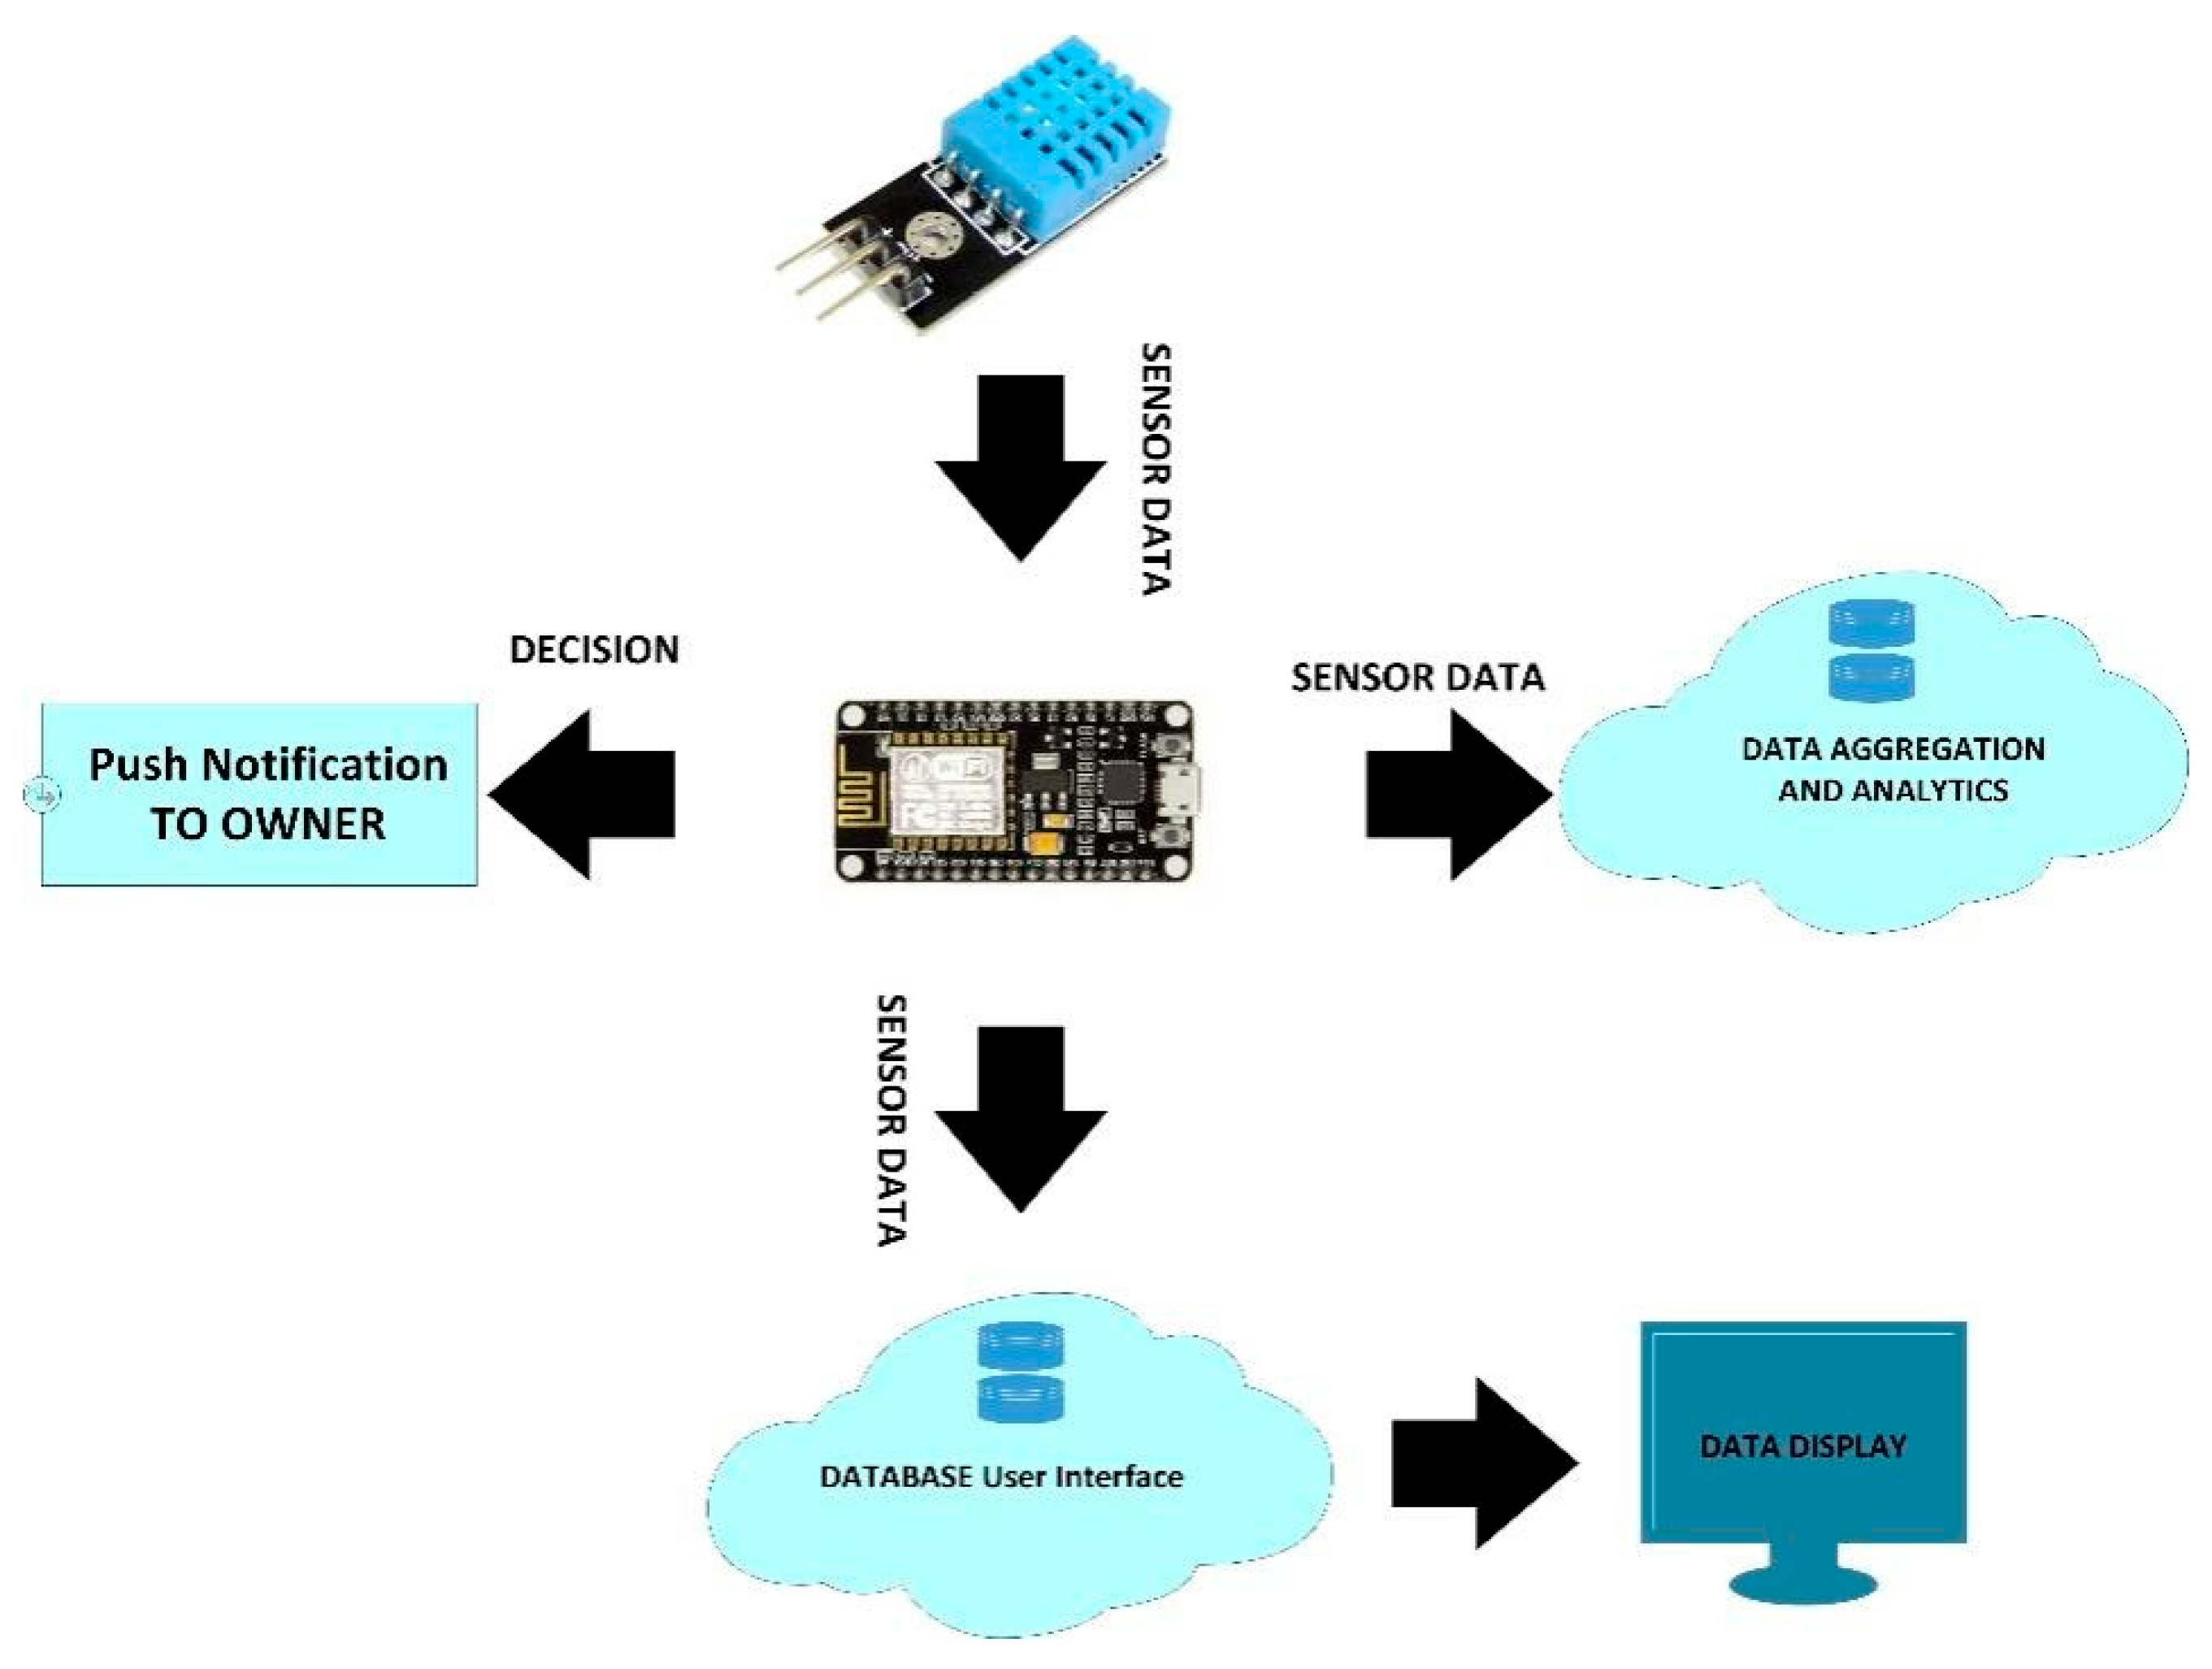
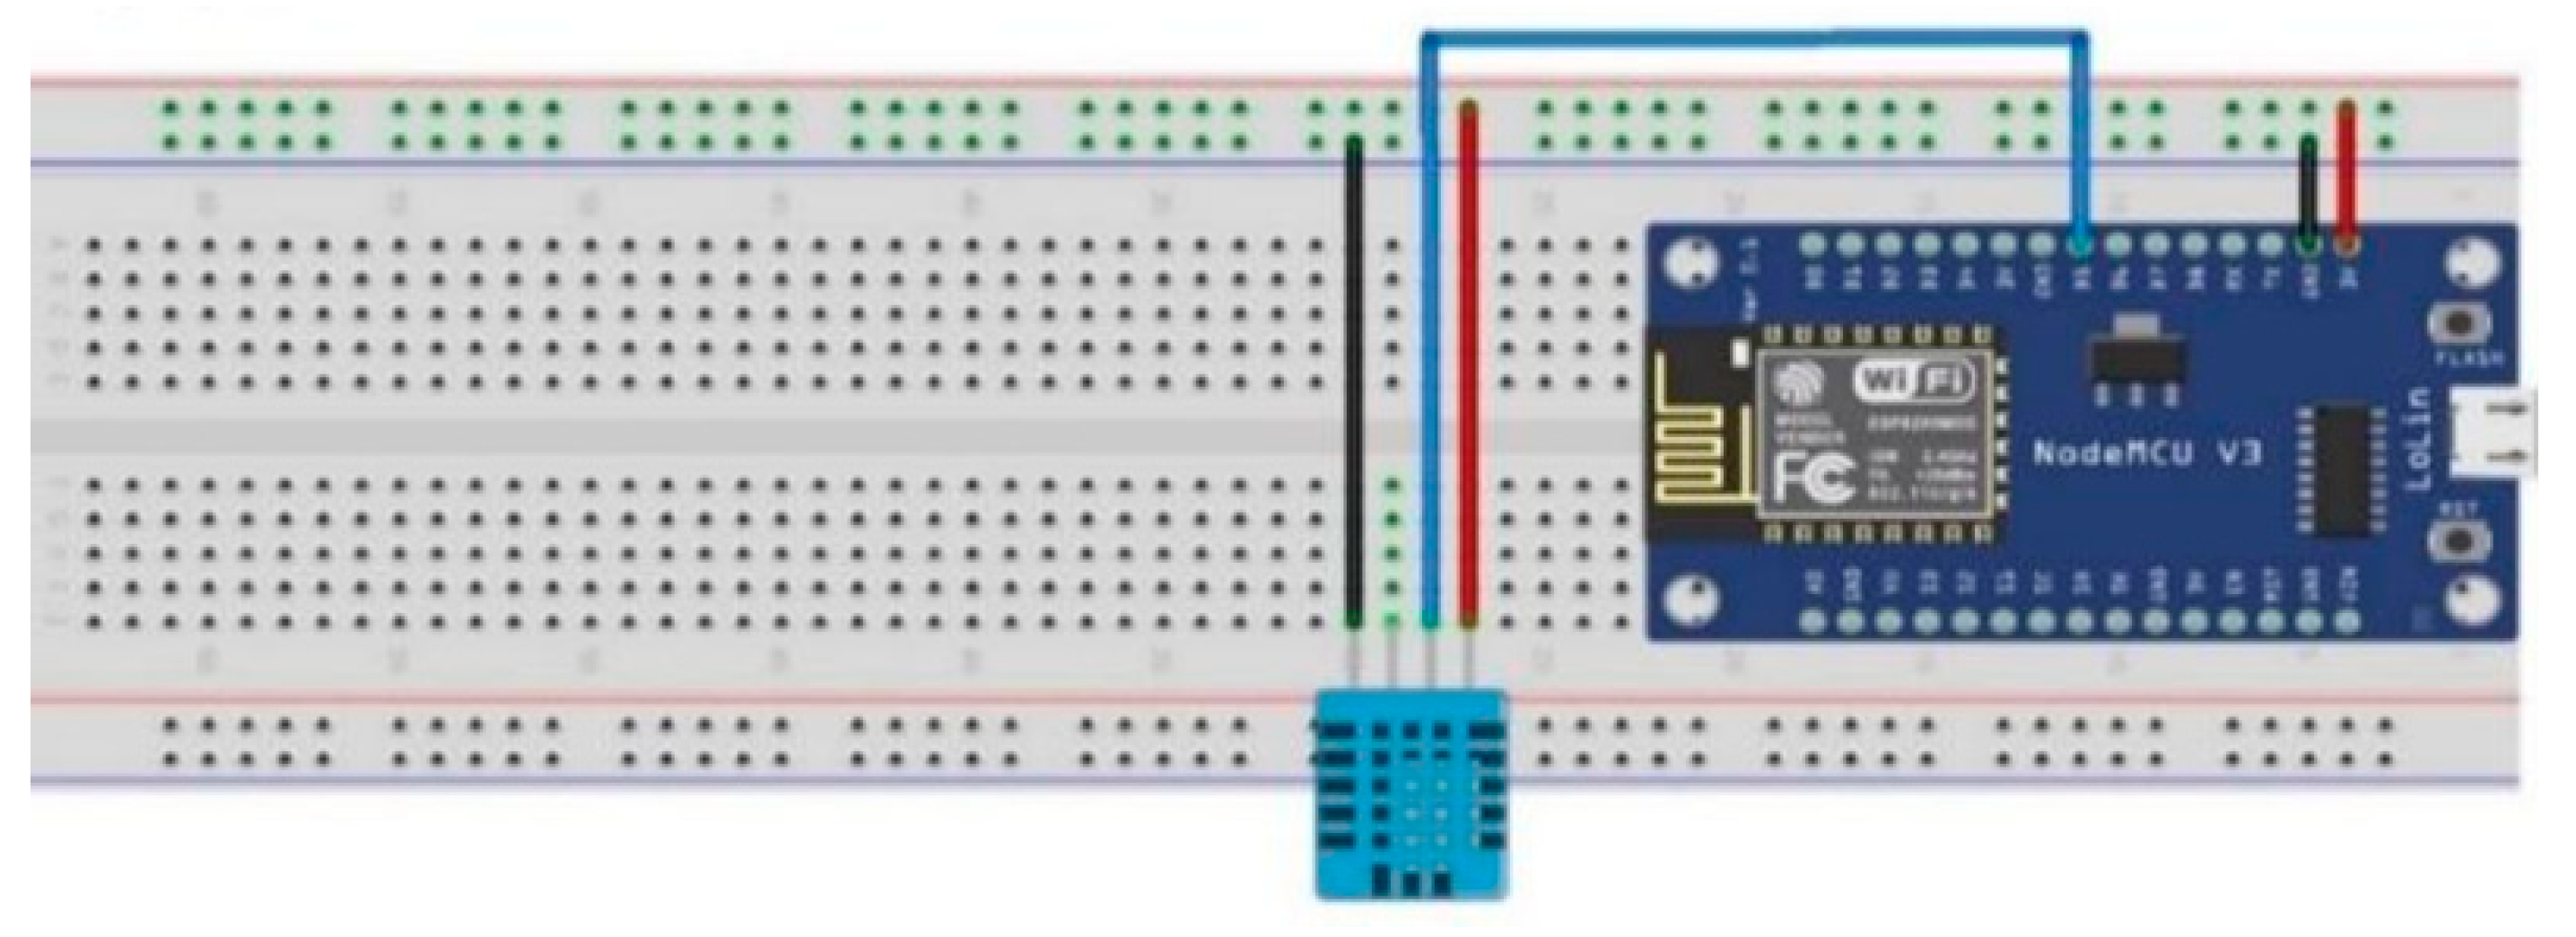
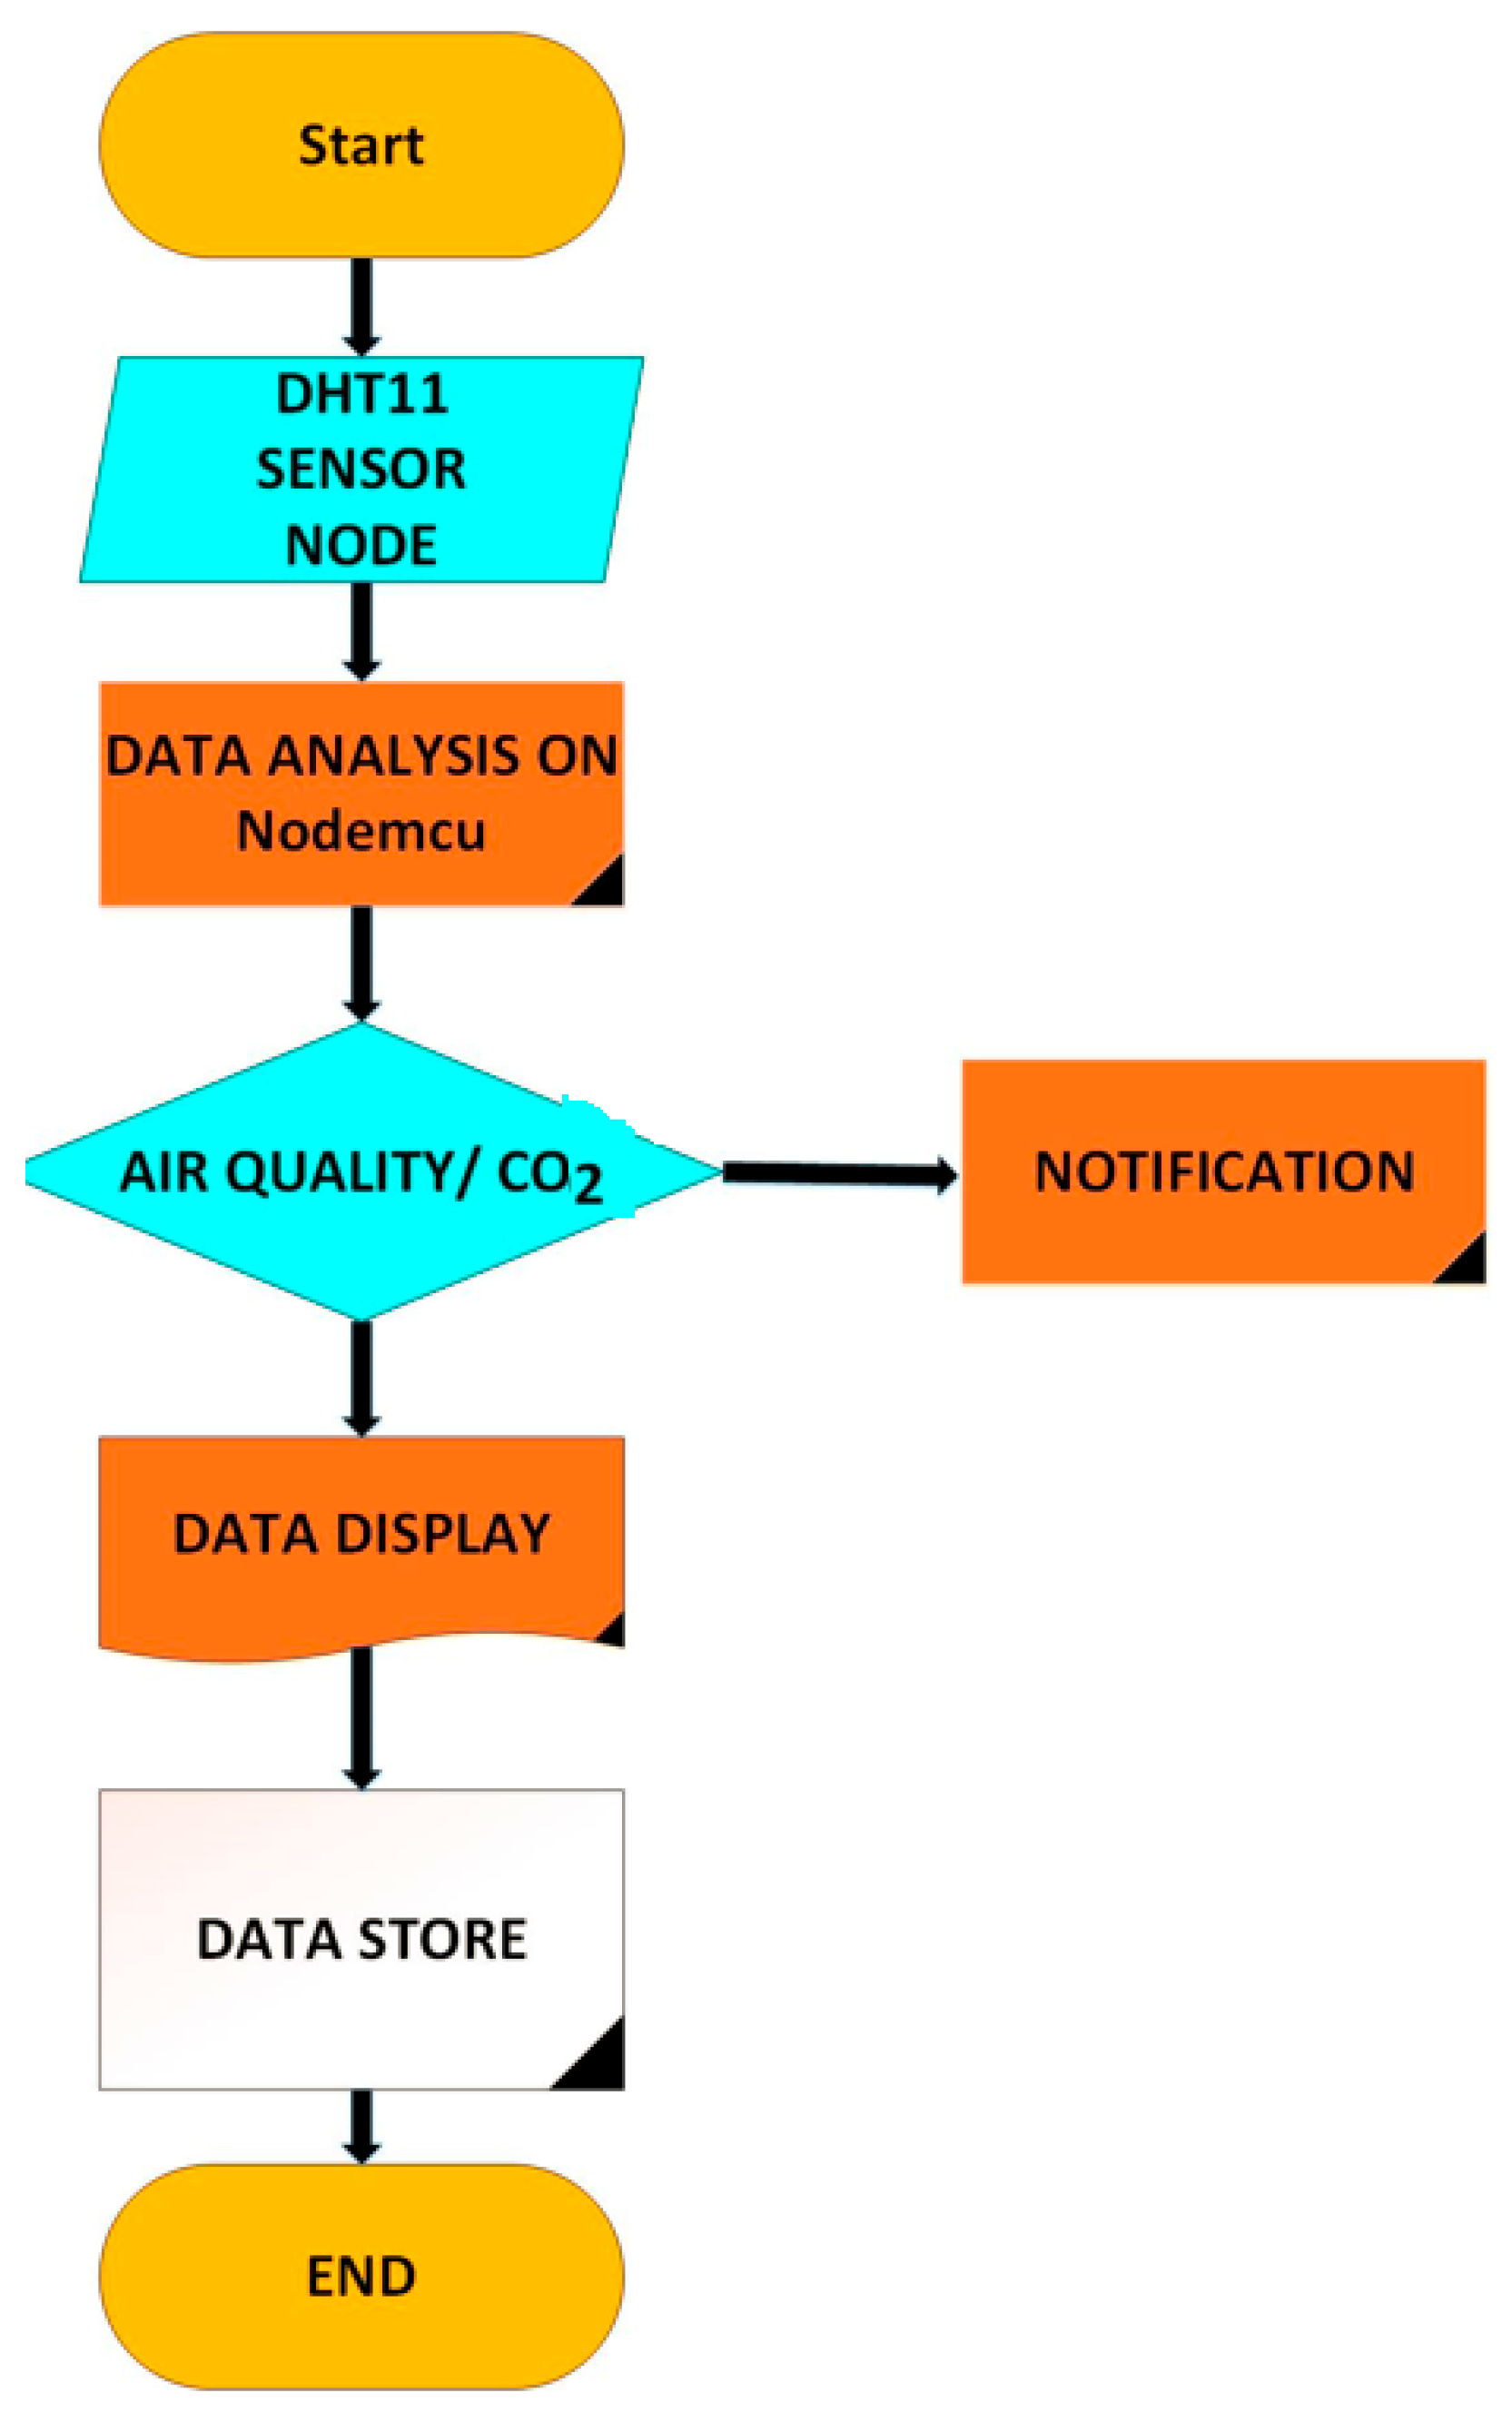
Figure 5 shows the workflow of the temperature and humidity independent node.
The sensor value of DHT11, consisting of temperature in °C and air quality in %, is obtained by Node-MCU. Node-MCU compares these values with the predefined threshold values. If these values are not in the threshold range, a push notification is sent to the owner from the database. The data for temperature and humidity are stored and updated in the database from where the owner can view the statistics.
2.1.2. Node-MCU
The Node-MCU ESP8266 [
25] development board comes with the ESP-12E module containing the ESP8266 chip with the Tensilica Xtensa 32-bit LX106 RISC microprocessor (Beijing, China) made in China [
26]. This microprocessor supports RTOS and operates at 80 MHz to 160 MHz adjustable clock frequency. Node-MCU has 128 KB RAM and 4 MB of Flash memory to store data and programs. Its high processing power with built-in Wi-Fi/Bluetooth and deep sleep operating features make it ideal for IoT projects. Node-MCU can be powered using a Micro USB jack and V
IN pin (External Supply Pin). It supports the Universal Asynchronous Receiver Transmitter (UART), the Serial Peripheral Interface (SPI), and I2C interfaces [
27].
2.1.3. Heart Rate Stethoscope
We used a stethoscope CR-747SS [
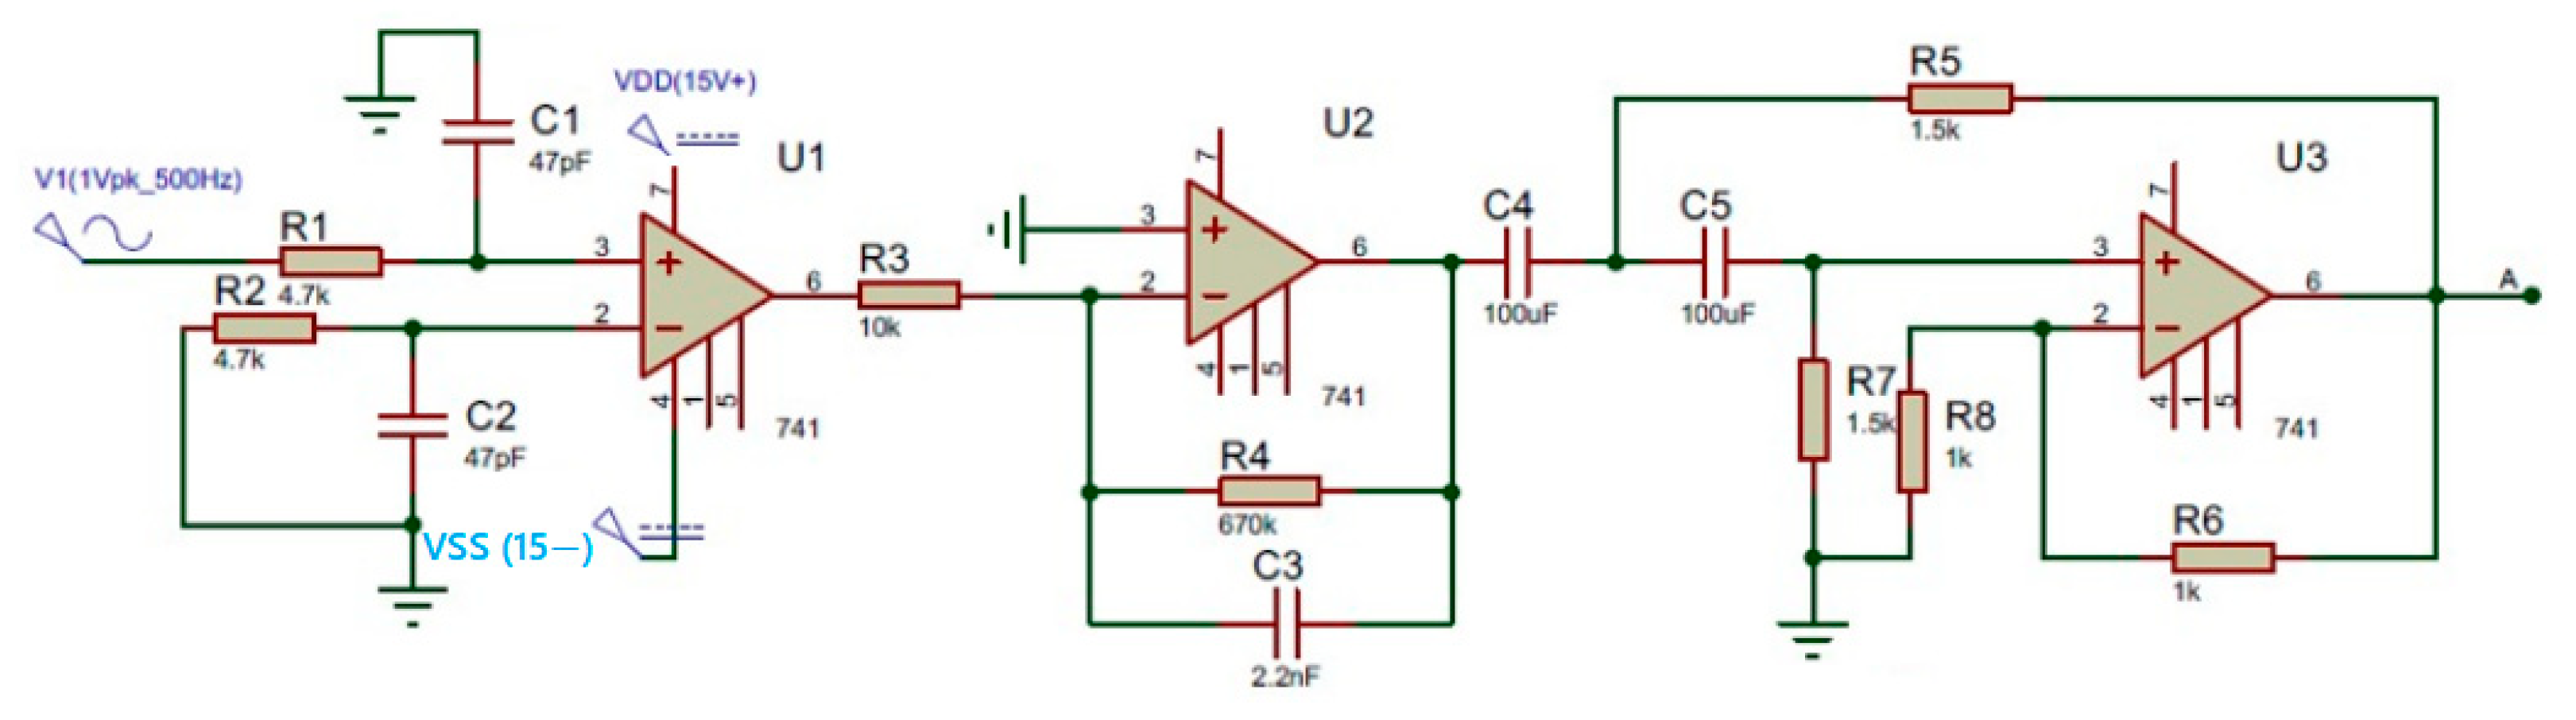
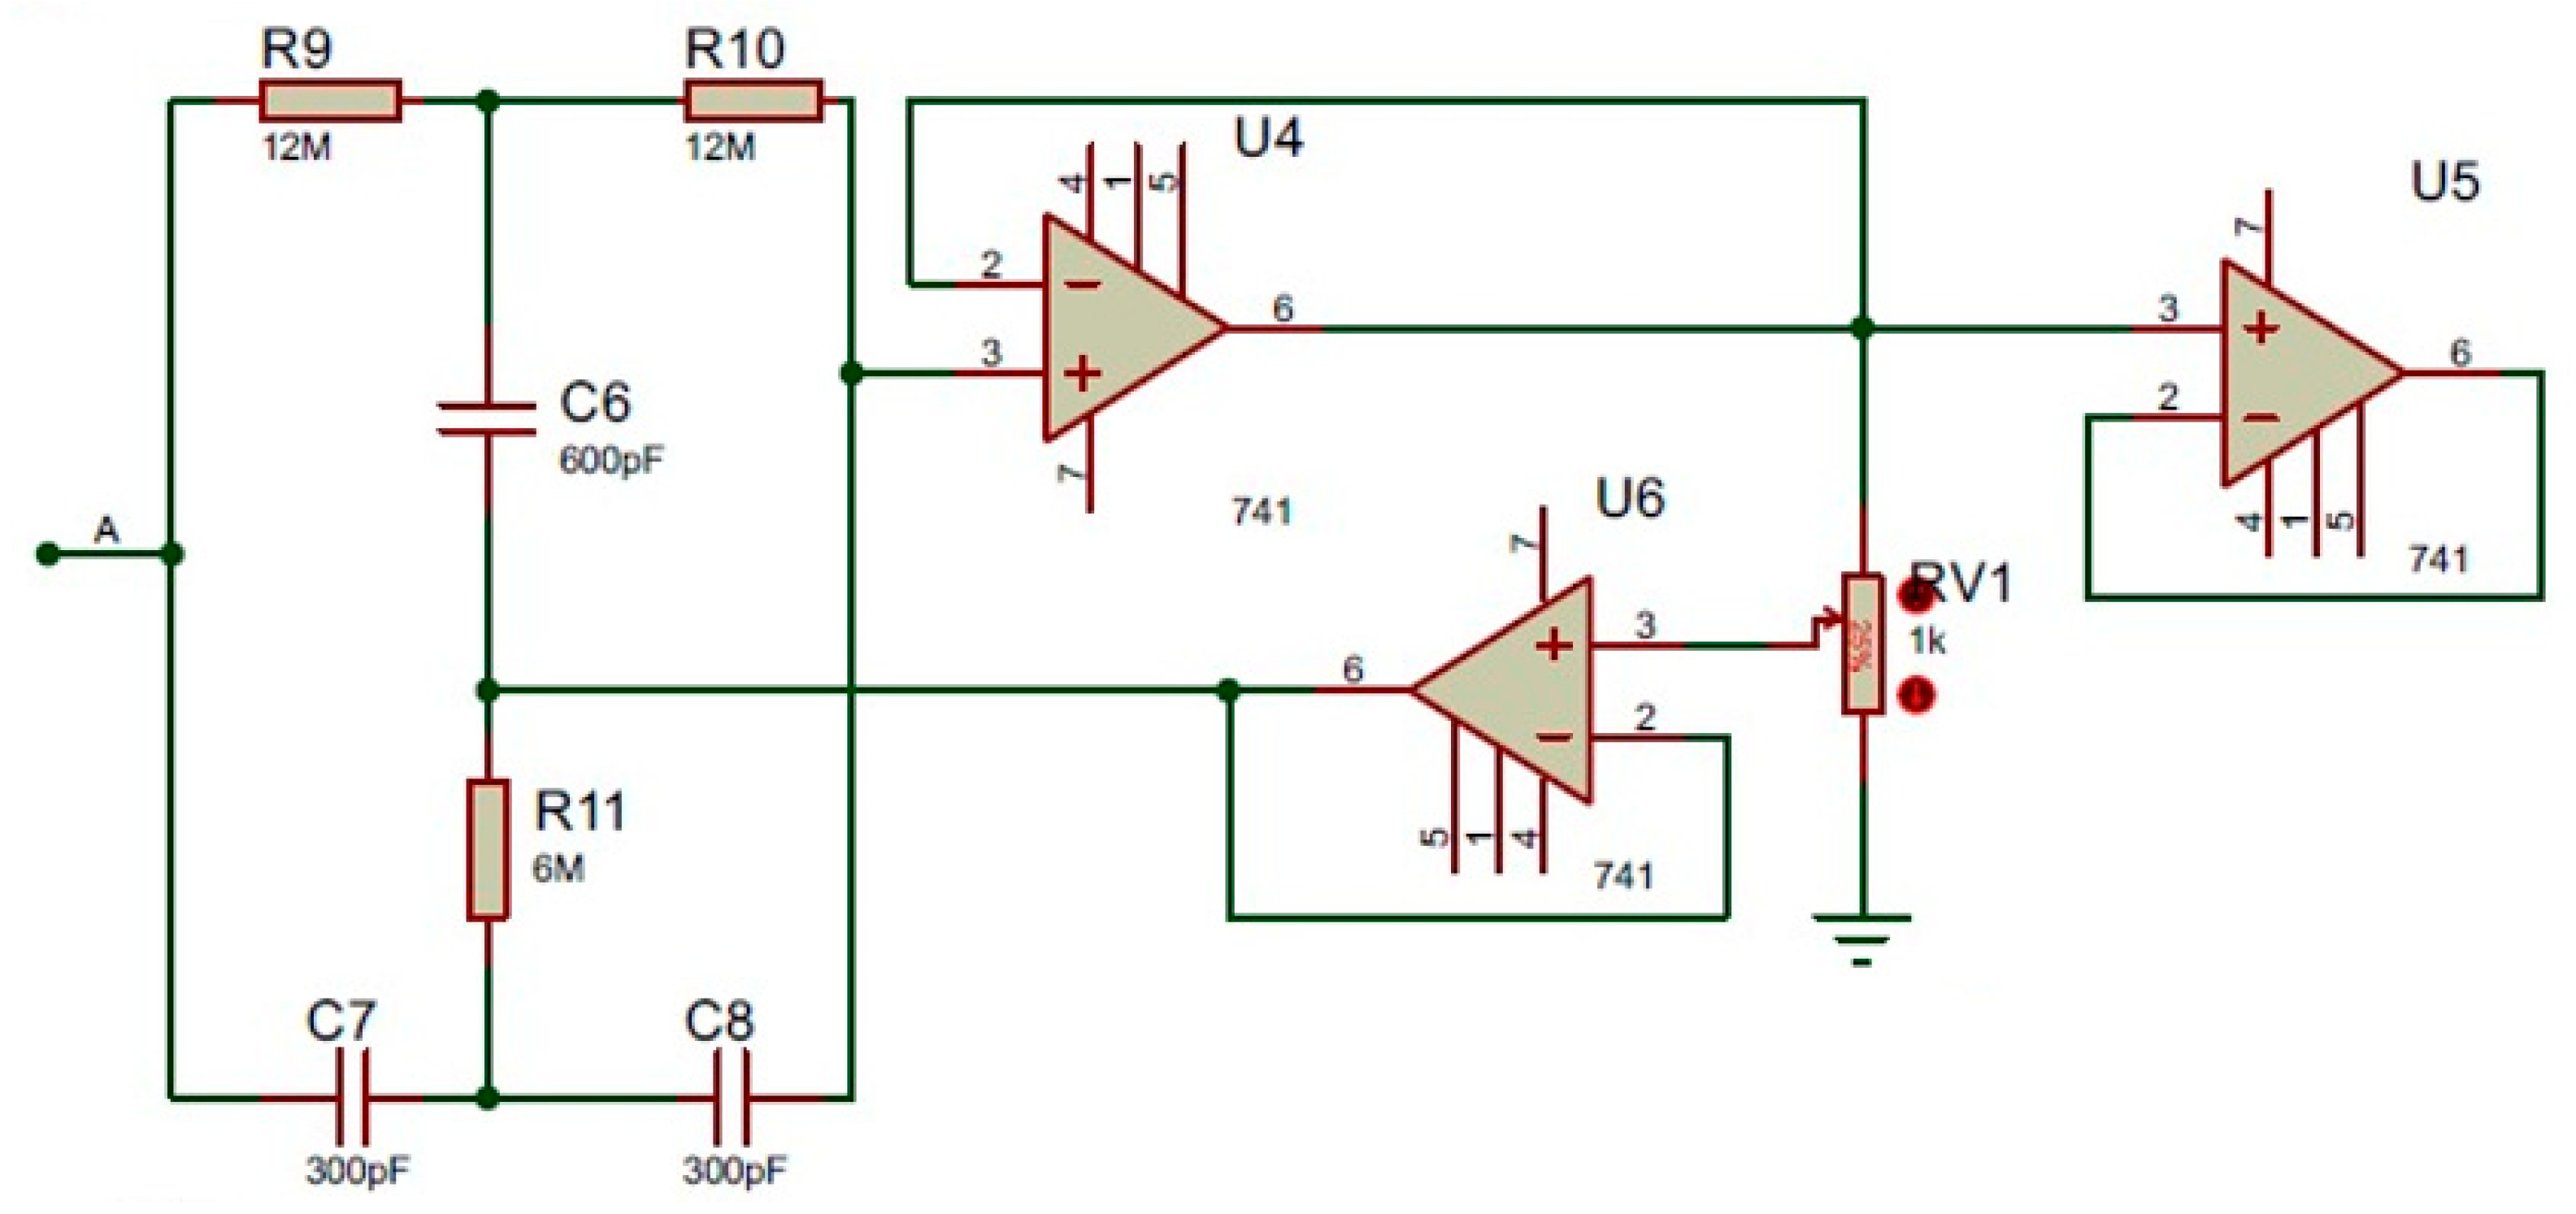
28] to detect the cows’ heart rates for this study. The human pulse sensor cannot reliably monitor the temperature due to the cow’s thick skin. An amplifier circuit has been designed and interfaced with the stethoscope to allow for the amplified heart rate measurement. This stethoscope also has a microphone that feeds the received heartbeat to an amplifier circuit, which then sends the reading to the Node-MCU after it has been amplified. This information is subsequently transferred to a database where it can be viewed. An amplifier is used in conjunction with metal electrodes to address this issue. This amplifier’s circuit diagram is designed on the “Proteus” platform. This amplifier will amplify weak Electrocardiogram (ECG) signals obtained from electrodes ranging from 1-mV to 2-mV with a gain of approximately 1000. The cow’s heart rate is normal when ranging from 48 to 84 beats per minute. An instrumentation amplifier and a standard 741 operational amplifier with a gain of approximately 1000 are used to amplify a signal of 10-millivolts. The amplifier is provided with the ECG signal measured from the metal electrodes as an input. After the data are integrated, they are transmitted to the band notch filter, allowing the 50-Hz frequency to pass, as illustrated in
Figure 6. This circuit is built on Proteus software with the implementation of the amplifiers.
After completing successful simulations on Multisim, the amplifier has been built using a PCB board, as shown in
Figure 7. This circuit was then installed in the cow collar, where the heartbeat was monitored [
29,
30,
31].
2.1.4. GPS Module
On these modules, the u-blox NEO-6M GPS engine is rather good, and it also has a high sensitivity for indoor applications. A backup MS621FE-compatible rechargeable battery is also included, as well as an EEPROM for recording setup settings. A DC input in the 3.3-V to 5-V range works nicely with the module (due to its built-in voltage regulator) [
32].
2.1.5. Battery and Charging Module
A 18,650 lithium-ion battery powers the cow collar. The cow collar’s size is kept to a minimum. The 18,650 cell has a charging voltage of 4.2-V and a suggested charging current of 1 A. (0.5 C). The mAh and C ratings are two of the most popular phrases used when working with batteries. We can use the Ah rating to calculate how long the battery will last for the application based on the current consumption. A 18,650-cell rated at 2850 mAh means consumption of 2.850-A current from the battery that lasts in 1 hour, and similarly, if it consume only 0.285 A from the battery, it lasts in 10 h [
16]. This cell is charged and discharged using the TP4056A module (Addicor Technologies Pvt. Ltd., Allahabad, India). The module runs on 5 volts, which a USB remote connection may supply, often used to charge smartphones. To power this module, any sort of mobile charger and its cord can be used. This module can be powered directly by connecting IN+ to a 5 V supply and IN− to the ground. The RED led will turn on when the charge is connected correctly, showing that the battery is charged. The TP4056 Liner voltage IC controls the charging process [
33].
2.1.6. Microphone Sound Sensor
This microphone sound sensor KY-038 [
33] relates to the stethoscope to detect the heartbeat. The cow’s heartbeat is received from the mic of this module and sent to the analog input (A0) on the sensor. This analog signal is then amplified from the amplifier circuit and sent to Node−MCU at the A0 pin.
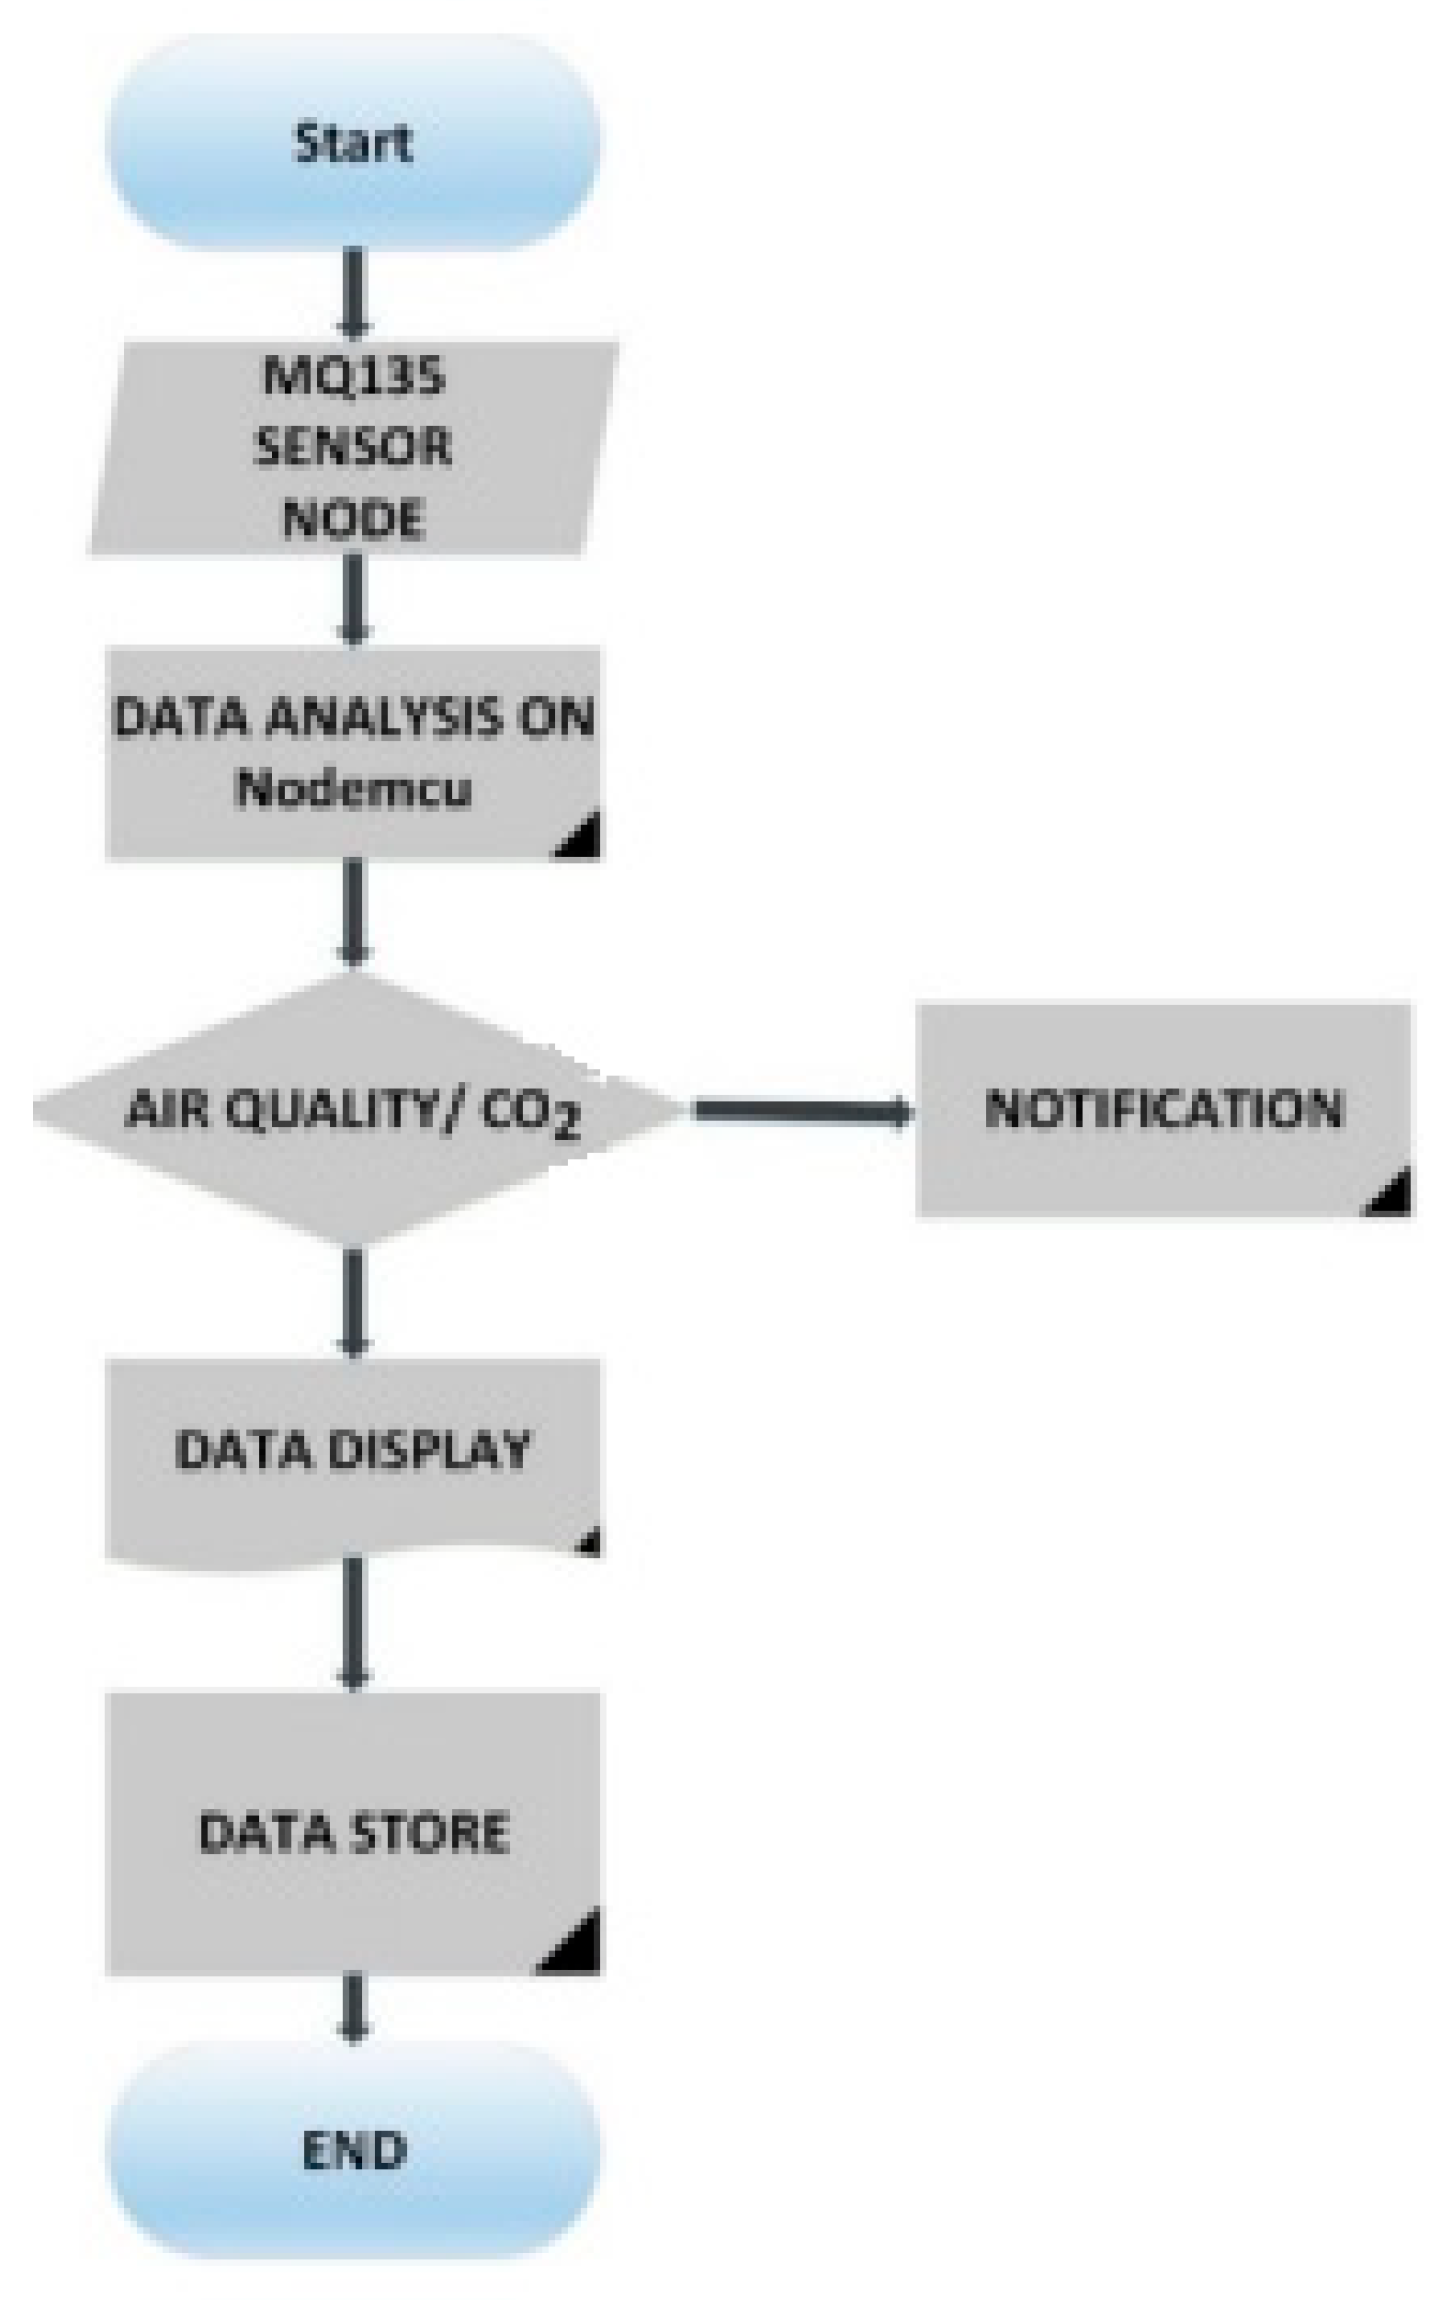
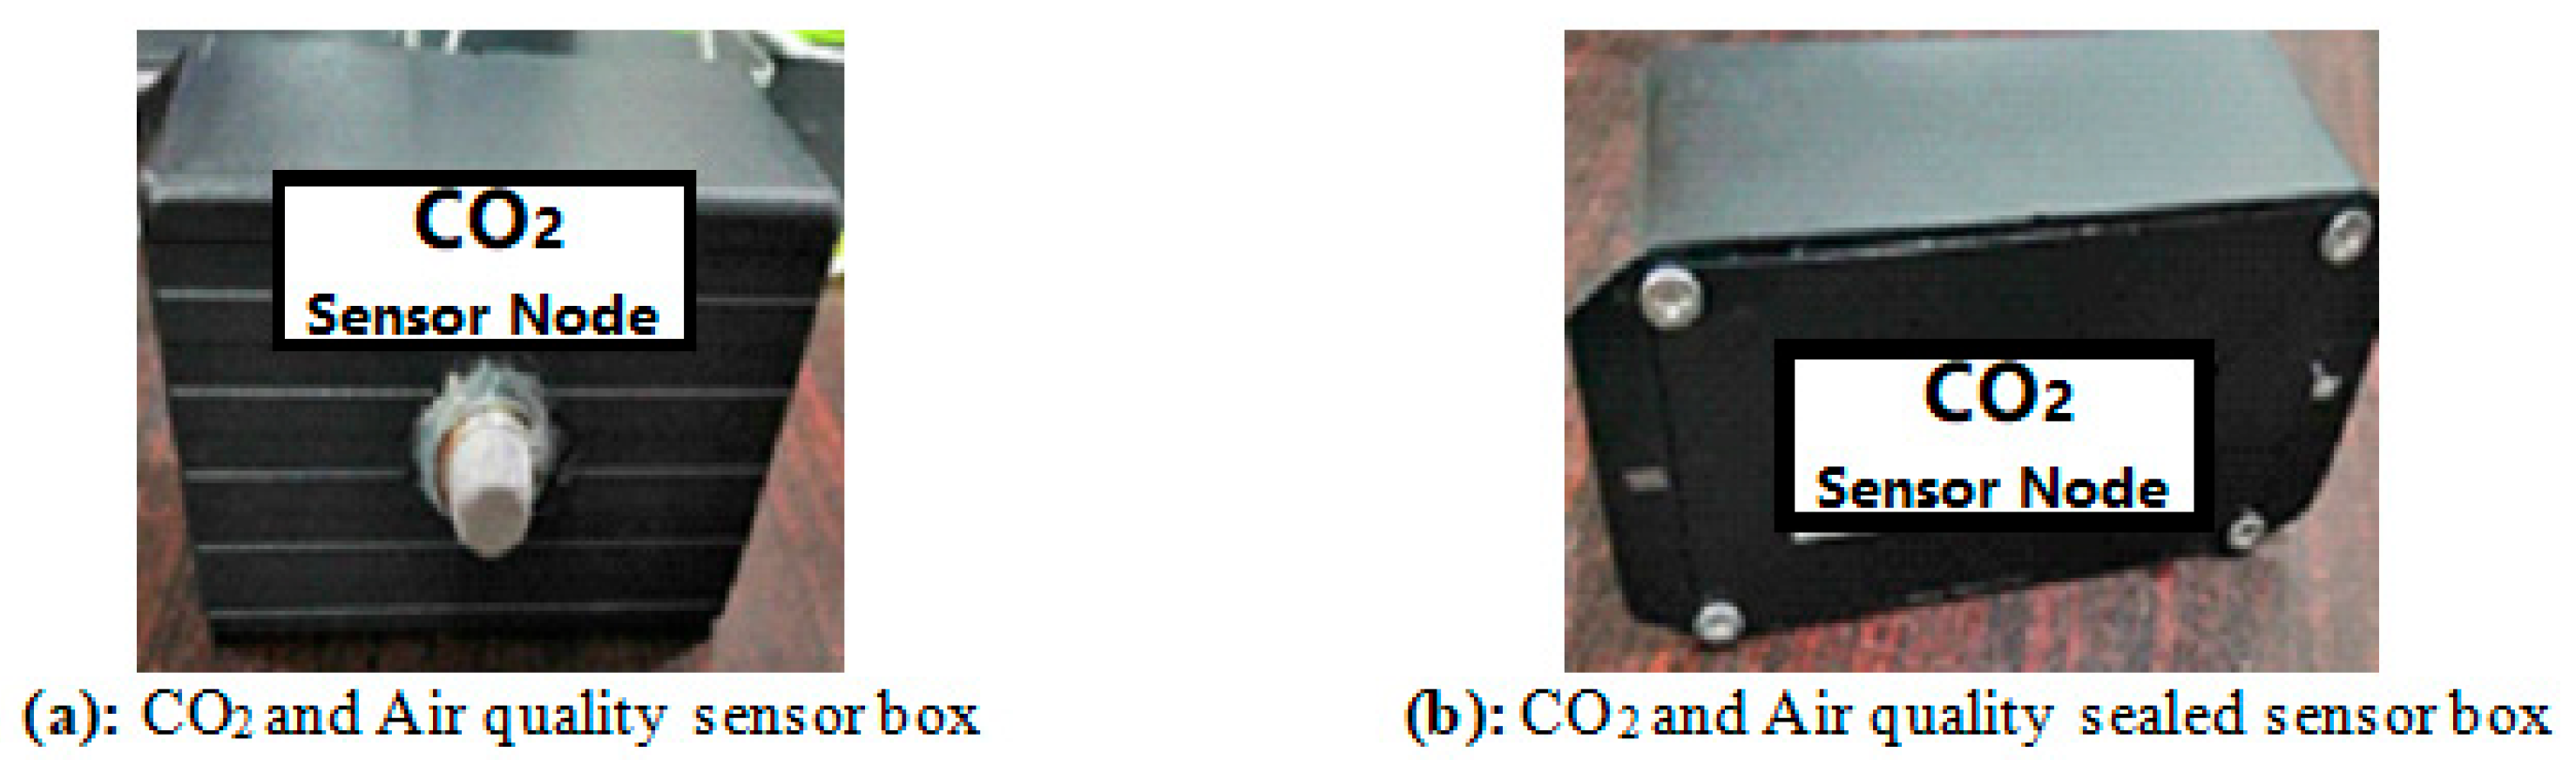
2.1.7. CO2 and Air Quality Sensor
The sensor used for the implementation of CO
2 and air quality is MQ−135. The sensor (MQ135) is used to collect data for both the CO and air quality index. Normal AQI (Air Quality Index) and CO
2 levels are
0–300 and
400–1000 ppm. These ranges are set on the Node-MCU through the developed program. These data are collected every two minutes. If an irregularity occurs, a message is sent to the owner from the GSM module. This GSM module is also interfaced with the Node−MCU. The collective data on CO
2 and Air Quality are collected in the database. This database updates when the time interval is reached and new data for CO
2 and Air Quality are recorded. The owner of the database can easily observe these data at any time.
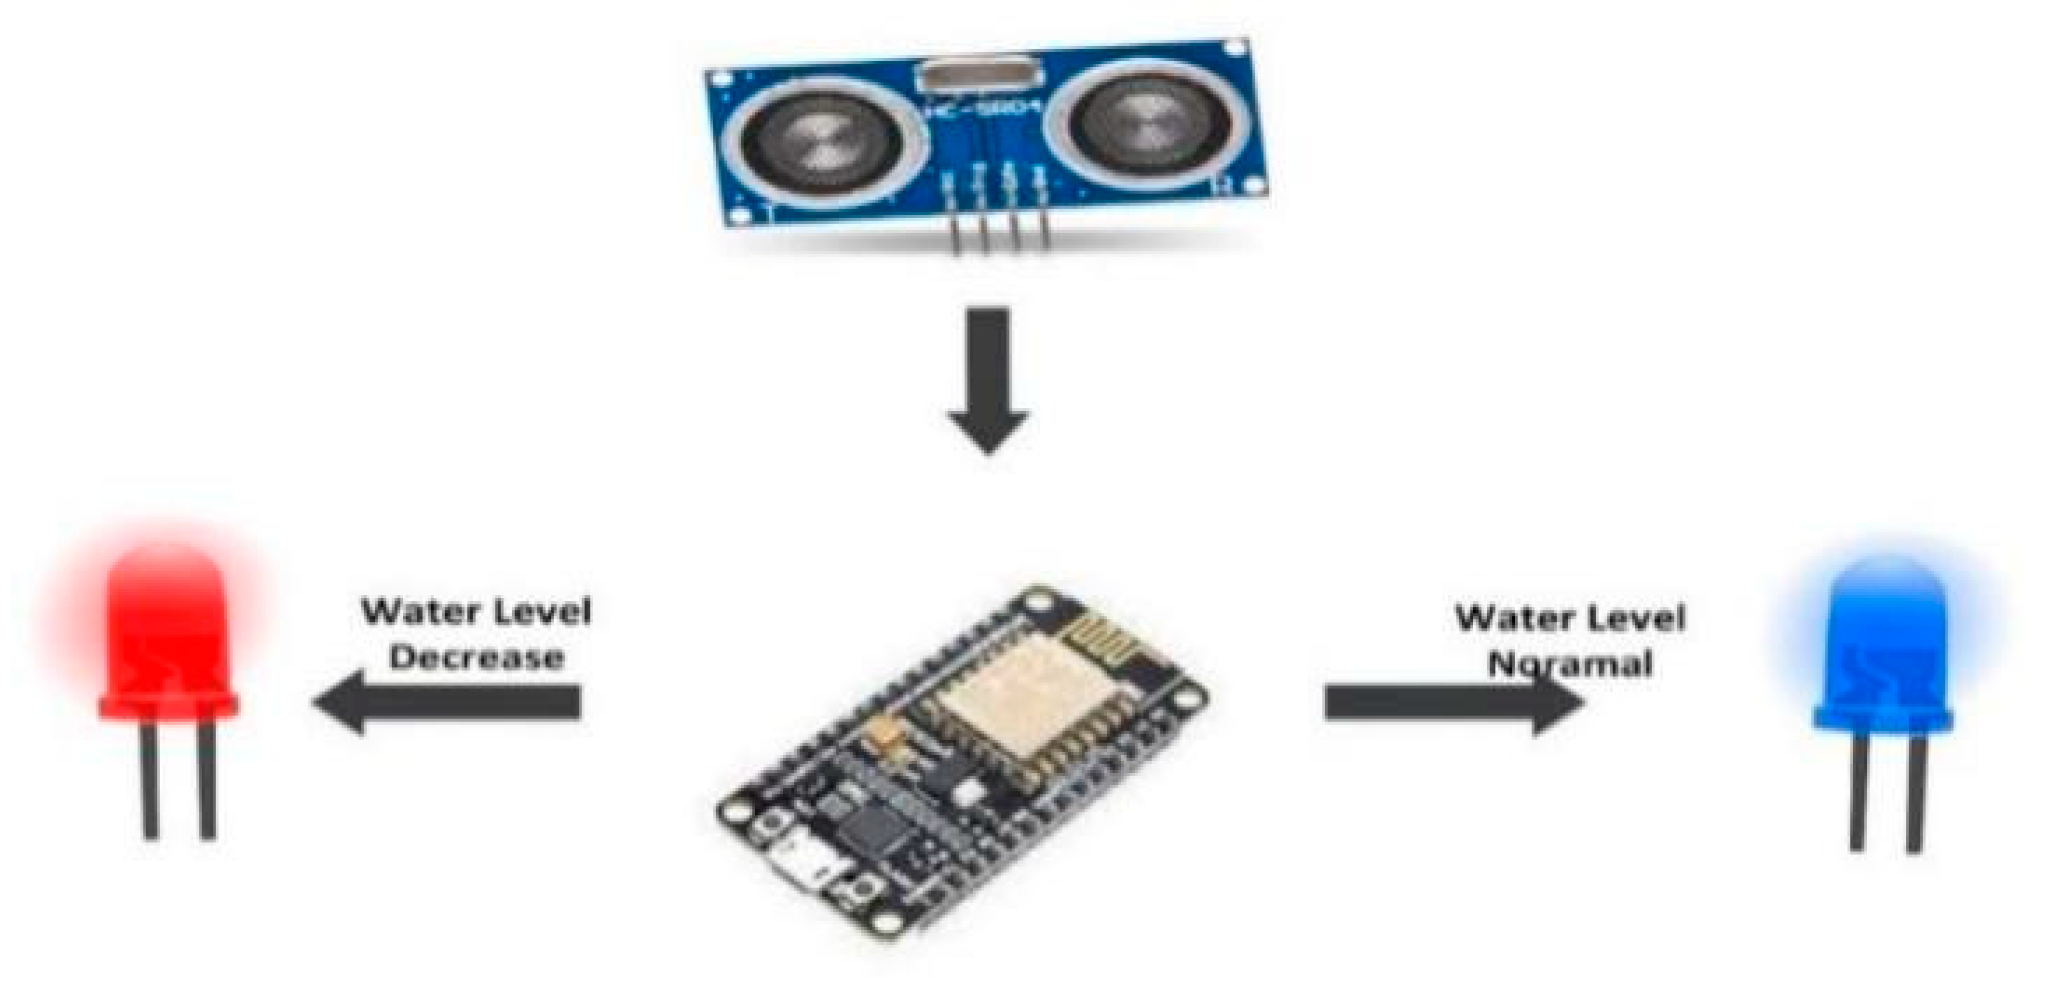
Figure 8 shows the workflow of the CO
2 and air quality independent node.
The sensor value of MQ−135, consisting of CO2 in ppm and Air quality in air quality index, is obtained by the Node−MCU, which compares gathered values with the predefined threshold values. If these values are not in the threshold range, a push notification is sent to the owner from the database. The CO2 and air quality data are stored and updated in the database, where the owner can view the statistics.
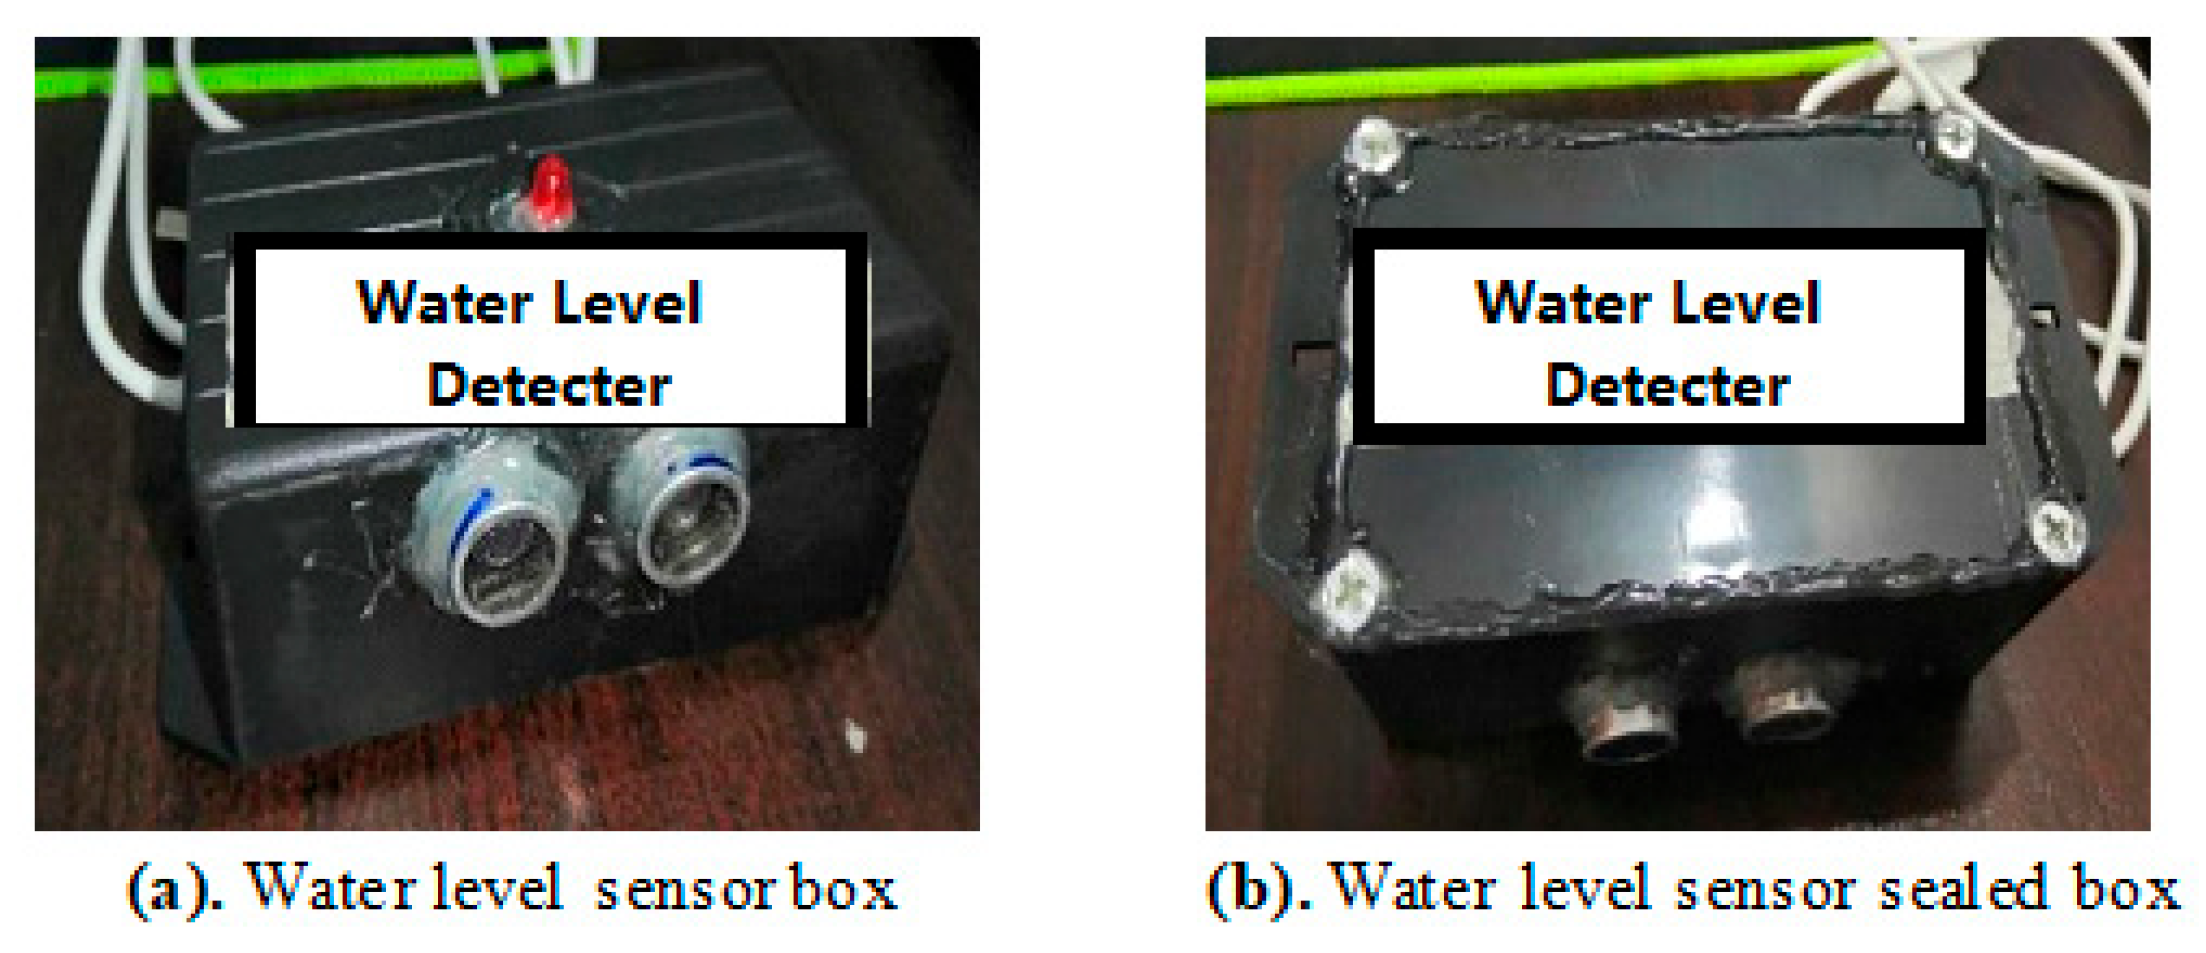
2.1.8. Water Level Detection Sensor
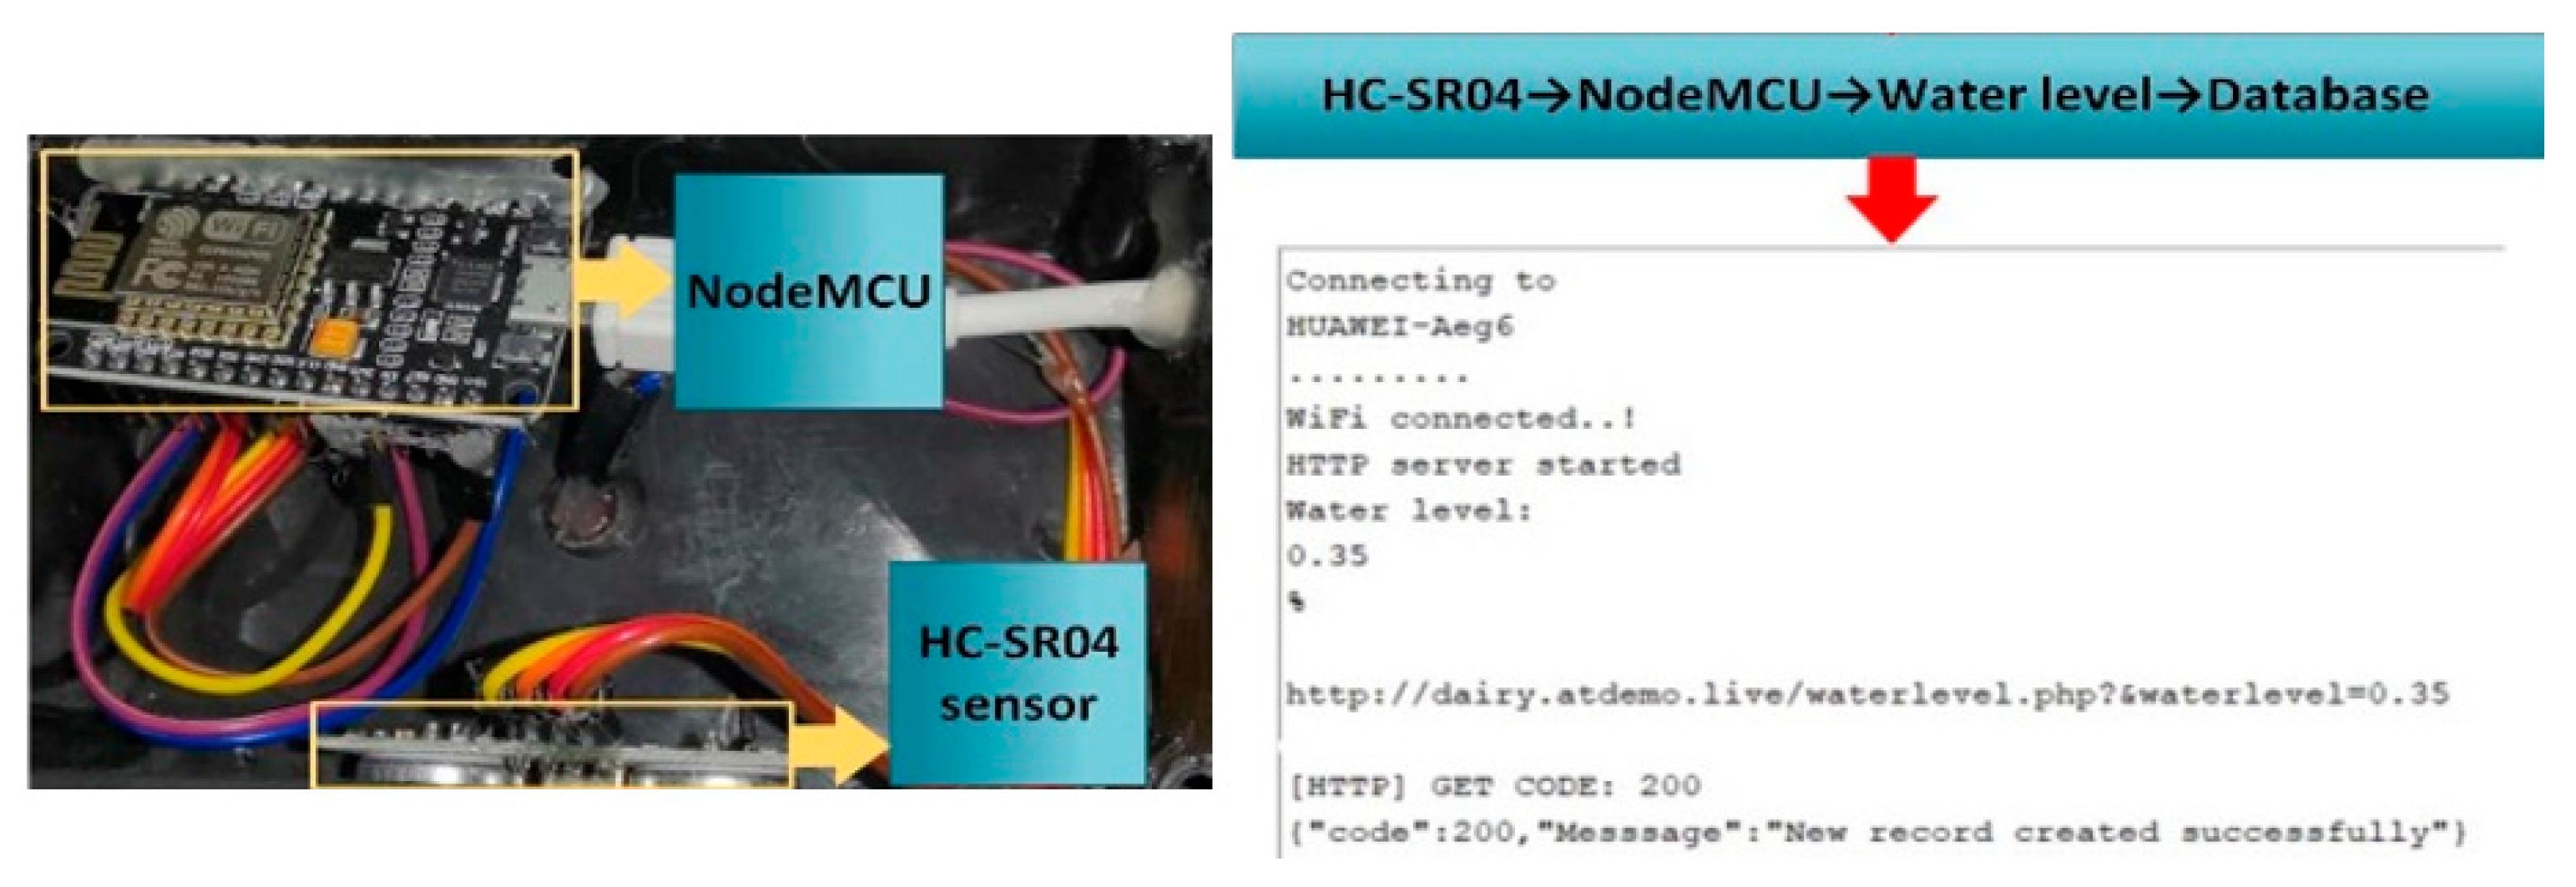
The sensor used for the implementation of the water level system is the HC−SR04. It has a +5 V operating voltage and a feasible measuring range of 2 cm to 80 cm with a 3 mm precision. Moreover, it has a four-pin module with VCC, trigger, echo, and ground [
19].
Figure 8 shows the components used in the water level system. It consists of a Node-MCU, a water level sensor (HC-SR04), and an LED. The purpose of the LED is to indicate when the water tank is full and when it is not. When the LED is turned on, it indicates that the water is below the threshold value set. As soon as the water level exceeds the threshold value, the LED turns off and indicates the water level has reached the mark in the water tank.
2.2. Front-End Database
We created a database to store data in three parts. There are three sections of the database. These three sections display the data of each parameter:
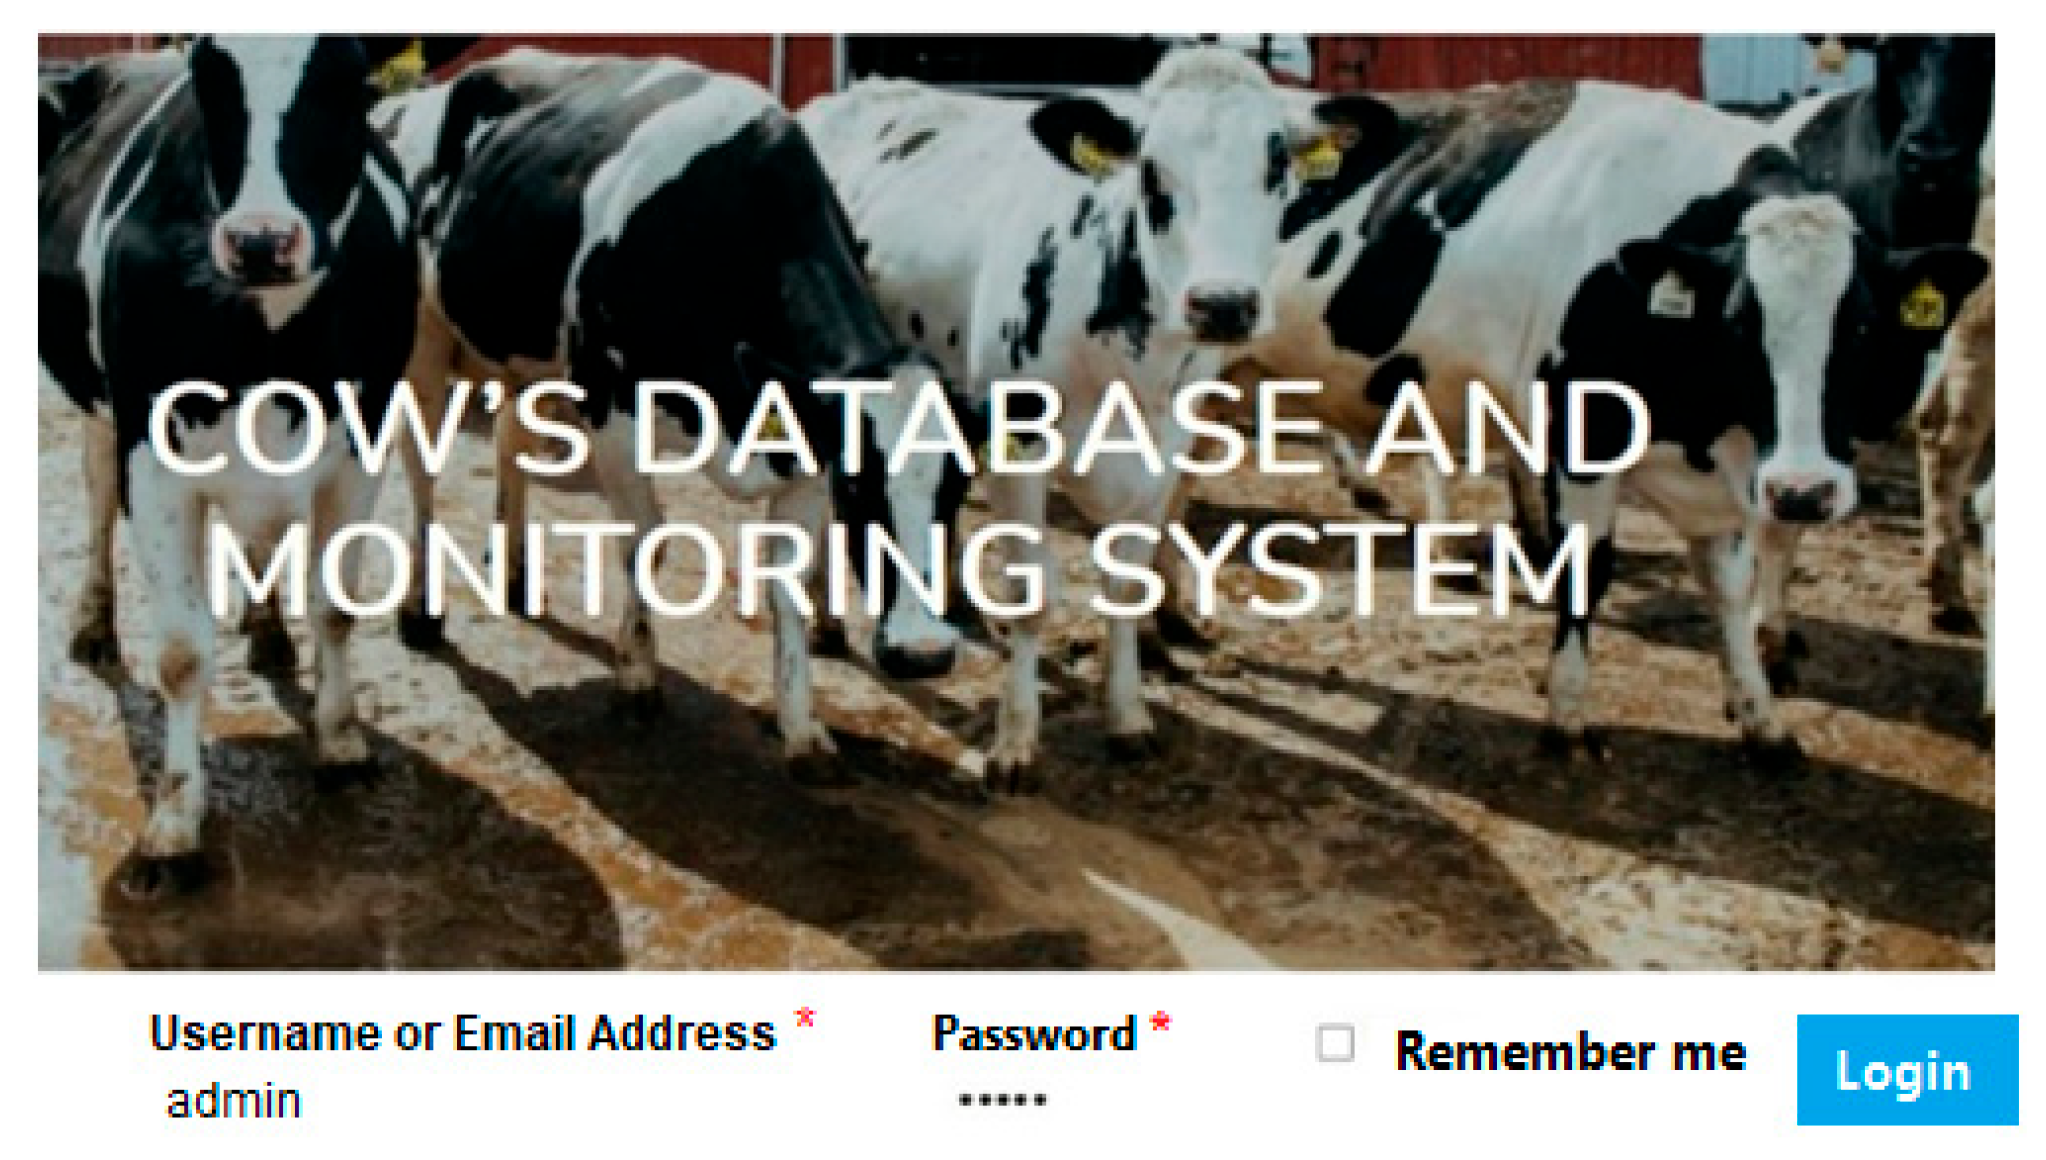
The initial UI of the database is presented in
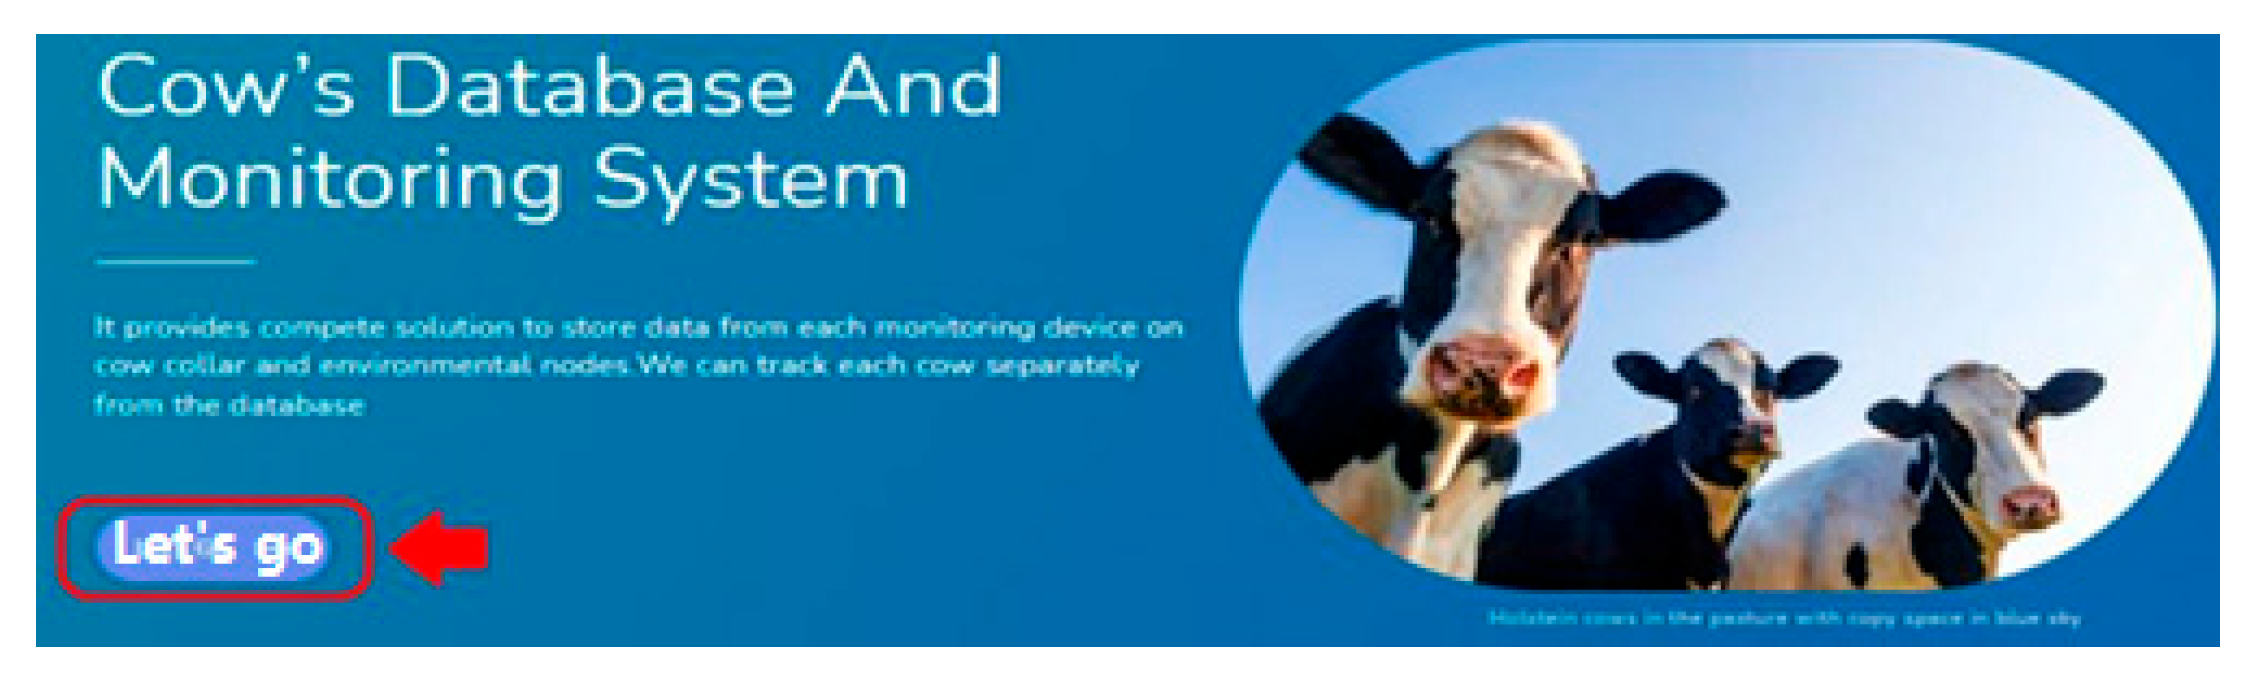
Figure 9. It is the login credential page that only the owner can access by providing the corresponding email and password. After logging in to the database, the initial UI appears as shown in
Figure 10.
2.2.1. Cow Collar Front-End Database
Cow collar data have four parameters, which are taken from the cow collar device. These four parameters help to monitor each cow with its unique ID number. The ID number display indicates each cow’s data, which helps to search and recognize a specific cow to monitor its data. These four parameters displayed in the cow collar section are the following:
Temperature.
Heartbeat rate.
Latitude.
Longitude.
The latitude/longitude for the animal’s location is collected by a GPS module. The temperature and heartbeat are taken by using mlx90614 developed by Melexis Inspired Engineering, Sofia, Bulgaria and a stethoscope, respectively.
Node-MCU uploads data from sensors to the API in the JSON format, which is displayed in the cow collar section with a specific node ID. These APIS data are created with the help of PHP. There is also a proper monitoring system that monitors every value of each cow. It monitors the temperature, heart rate, and location of each cow. When it senses something unexpected, it generates a notification.
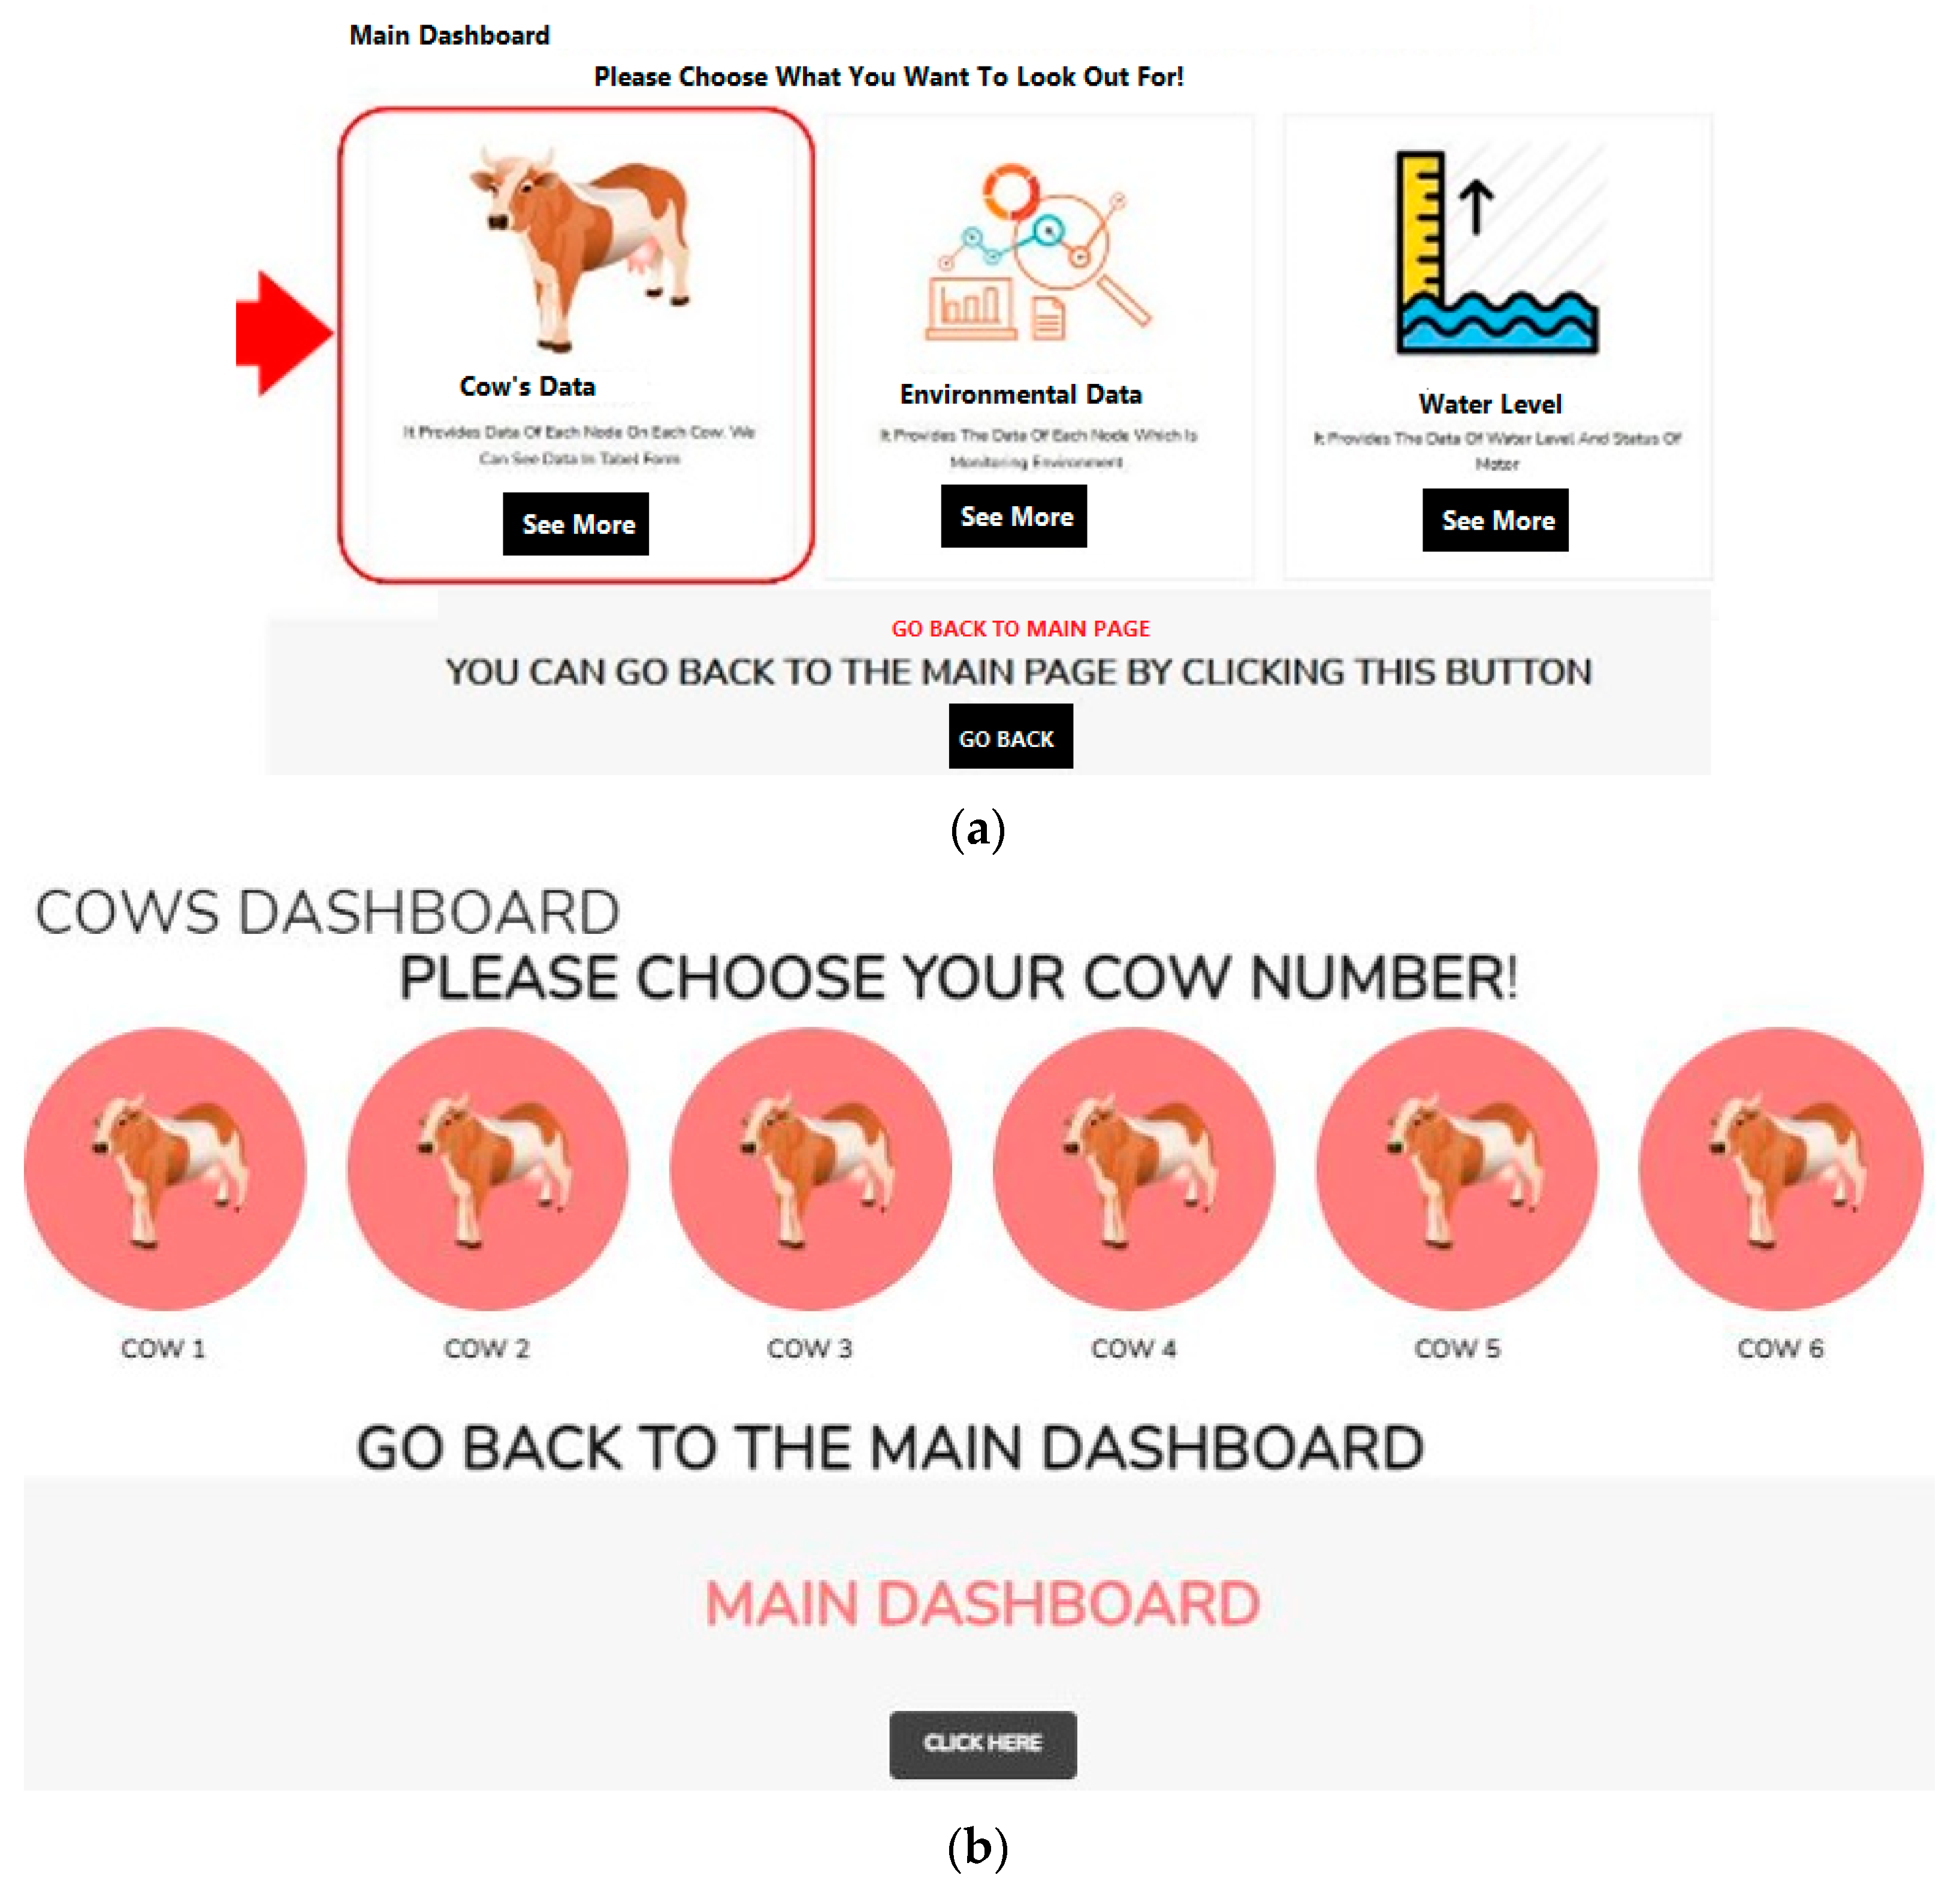
When the temperature or heartbeat of the cow goes above the normal range, it informs the owner about an emergency through a notification. In addition, we created Geo-fencing, which helps to monitor the location of each cow. If the cow moves beyond the fence, it delivers a message to the owner through a notification. The UI of the cow collar section is presented in
Figure 11a. When clicking on the cow data, it proceeds to the number of cows pages, where clicking on any cow leads to the health monitoring parameters, as shown in
Figure 11b. The ‘
Go’ back button takes the user back to the main interface.
2.2.2. Environmental Front-End Database
Likewise, the environmental monitoring system has four parameters. These four parameters help to monitor the environment of the farm containing cows. There is only one device for each parameter, so there is no unique number for each device, but if someone wants to install more than one device, there is space to do that.
The four parameters of the environmental monitoring section are temperature, humidity, CO
2 and air quality. These are all represented as integer values. We collect data on these parameters by integrating API with Node-MCU, which uploads data on API in JSON format. The prescribed APIS is created in PHP language. Further, the data gathered from each sensor node is displayed in the respective section. There is also a proper monitoring system that monitors this value, and when any value increases above its specific range, it sends a notification to the owner. It monitors all four values of temperature, humidity, air quality, and CO
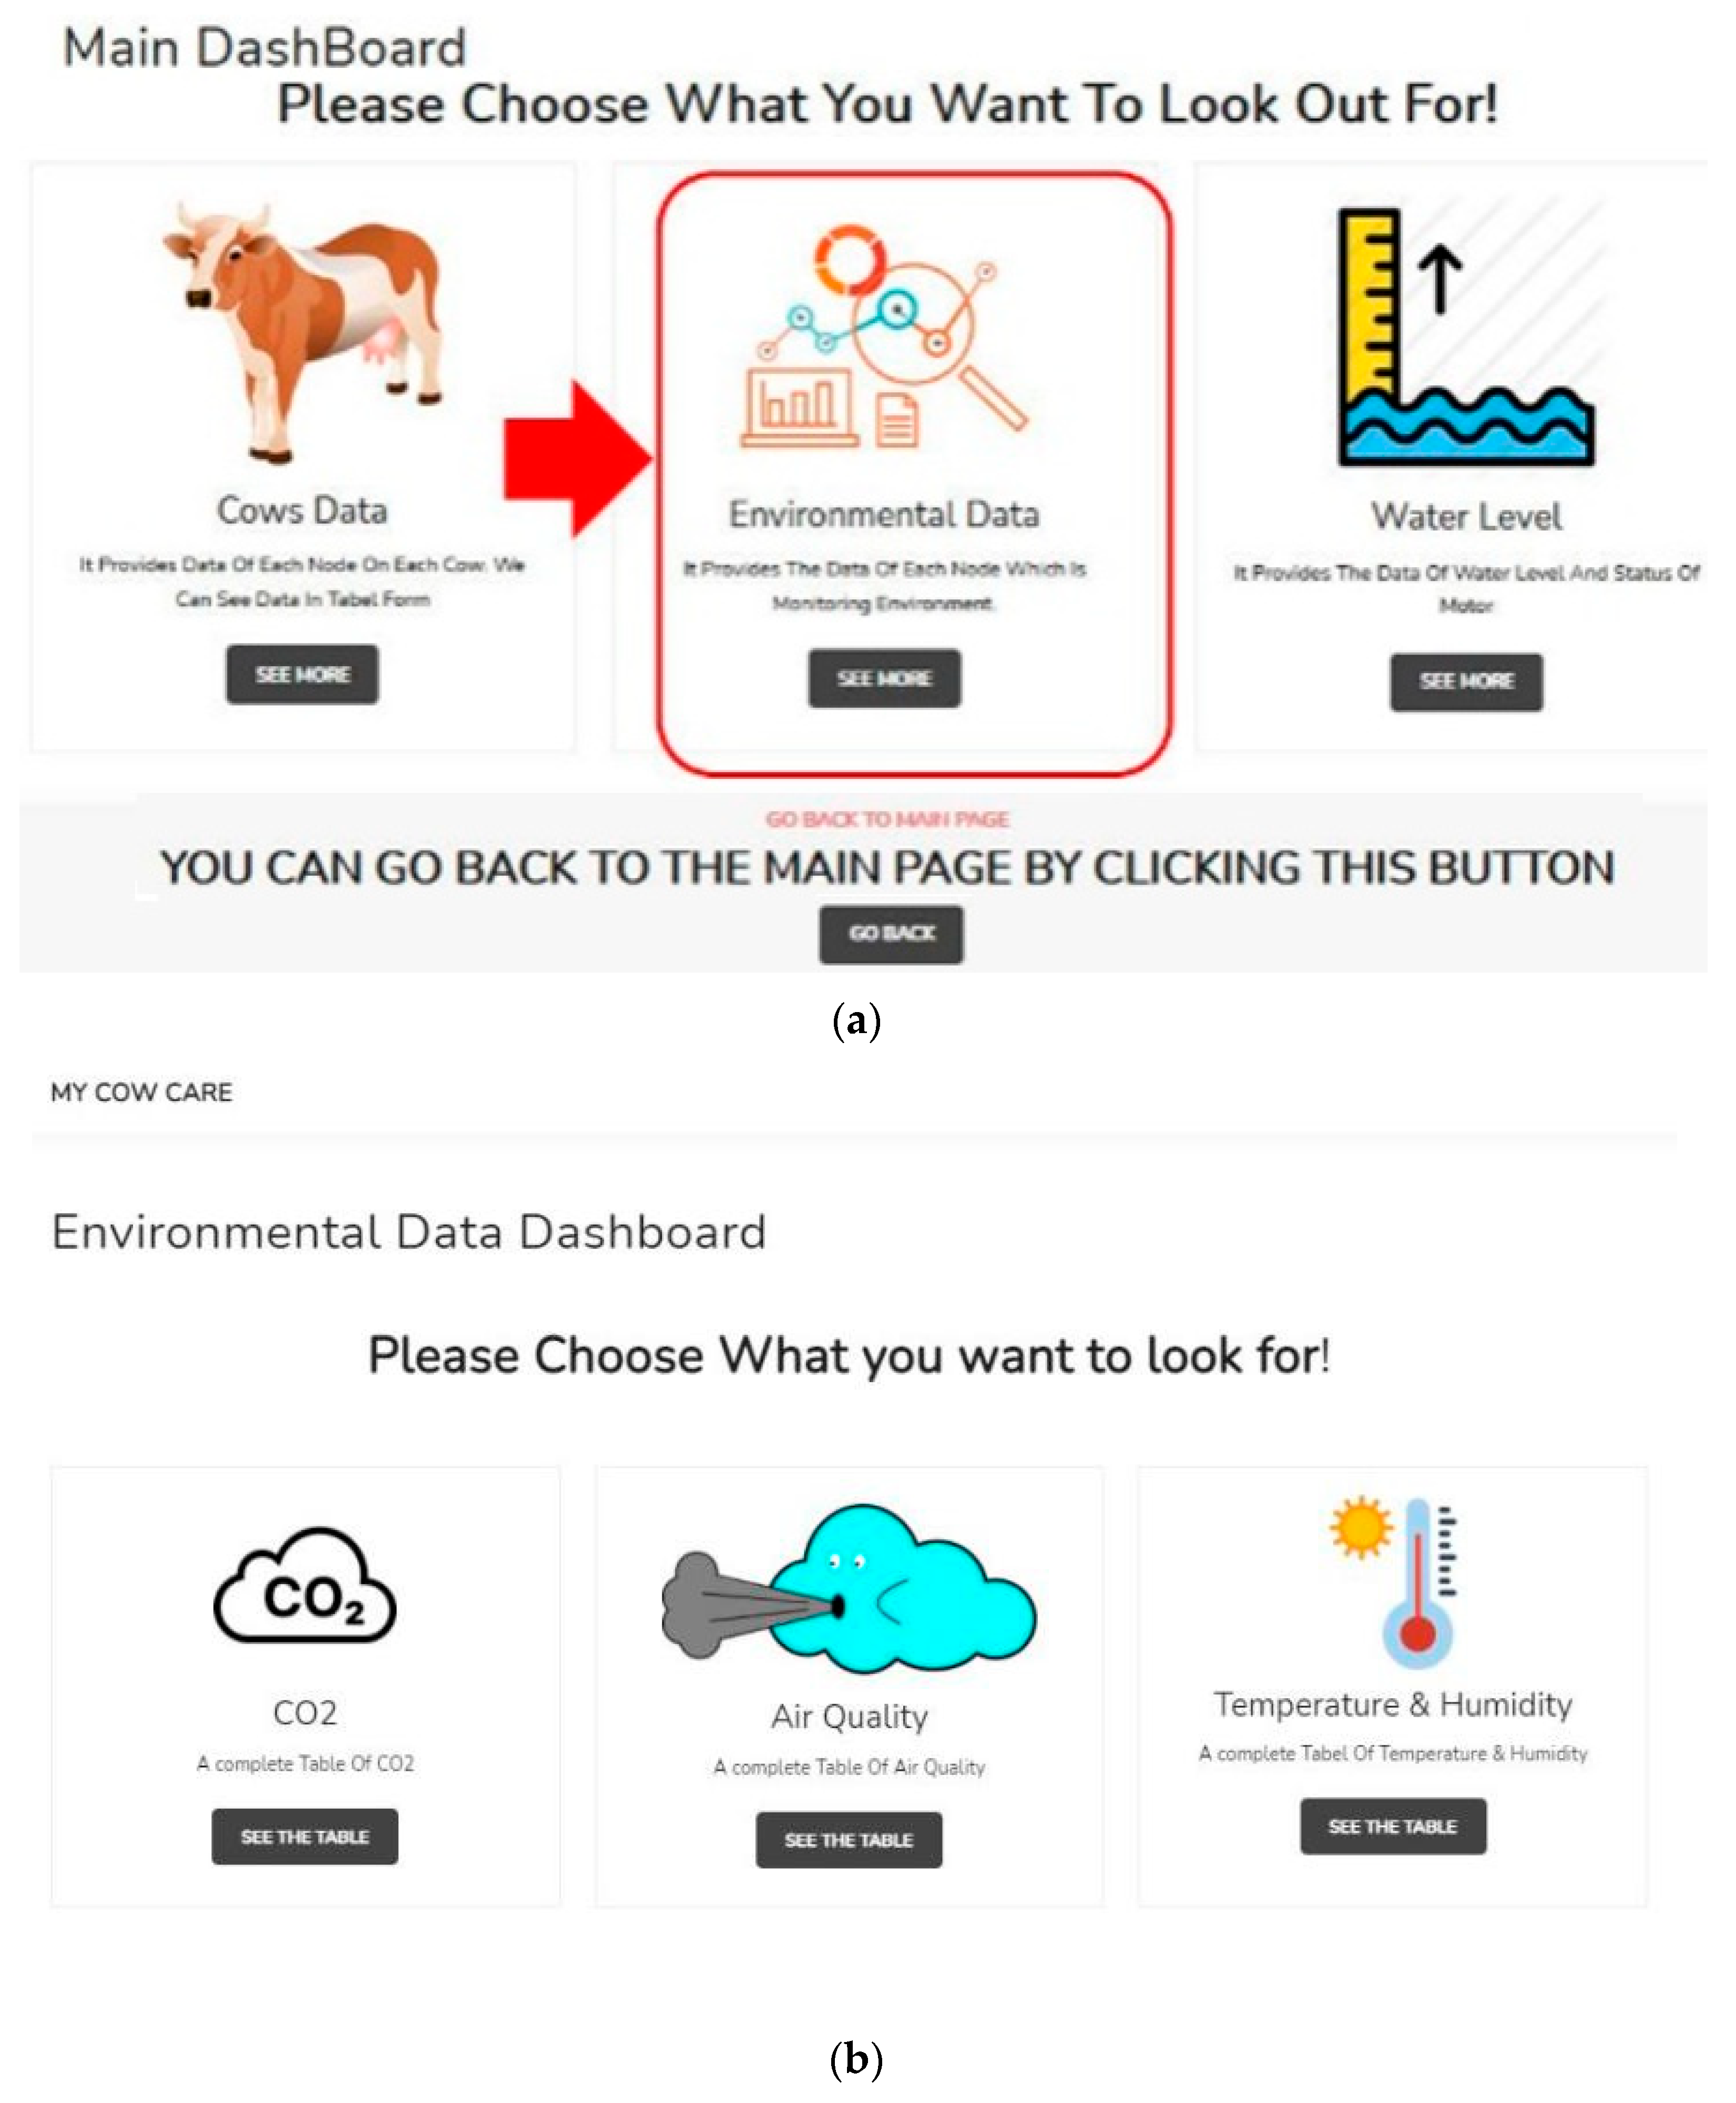
2 quantity. When any of them move into the emergency range, it will notify the owner with a notification. The UI of the cow environmental monitoring section is presented in
Figure 12a. By clicking on the environmental data, it proceeds to the environmental monitoring parameters pages, where clicking on any parameter leads to the statistics of environmental monitoring parameters as shown in
Figure 12b. The ‘
Go back’ button takes the user back to the main interface.
2.2.3. Water Level Front-End Database
The water-level monitoring sensor node helps display parameters such as the percentage of eater and water level. This device is the only one on the whole farm, so it also has no unique number. There is the capacity for adding another node with a unique number. The parameters of the water level section are the following:
We only deliver the percentage of data from the sensor node that helps refill the water can when required. Suppose the level of water becomes lower than a specific percentage. In that case, the water pump will be on from the device, and it will produce a notification that notifies the owner about turning on the water pump. In our case, we have an LED instead of a motor pump. The UI of the water-level monitoring section is given in
Figure 13. By clicking on the water level, it proceeds to the water-level monitoring parameter page and shows the water tank’s water level.
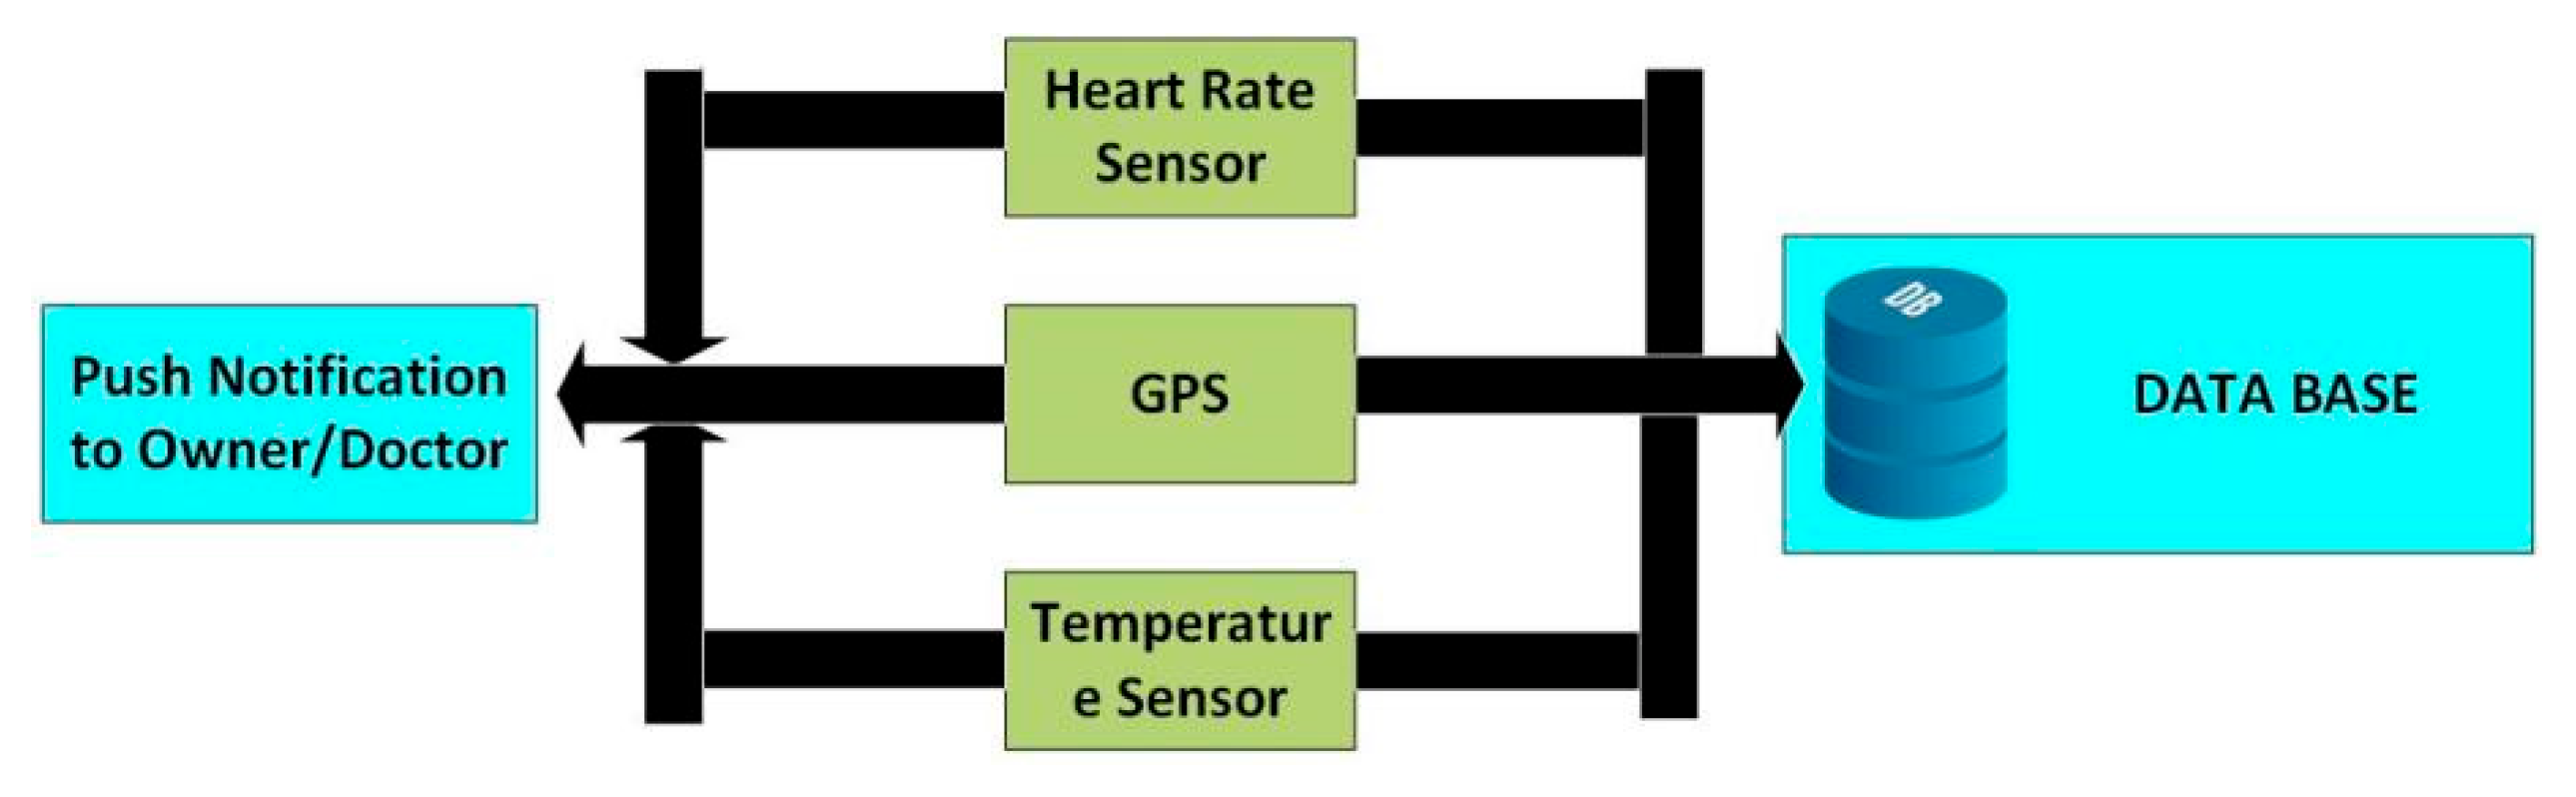
2.3. Animal Health Monitoring System Using Cow Collar
The processing for the cow collar is depicted in
Figure 14. The temperature, heart rate, and current position measurements are transferred to a continually updated database with new data. Any abnormality causes a push notification to be sent to the owner and doctor from the database, who are then notified.
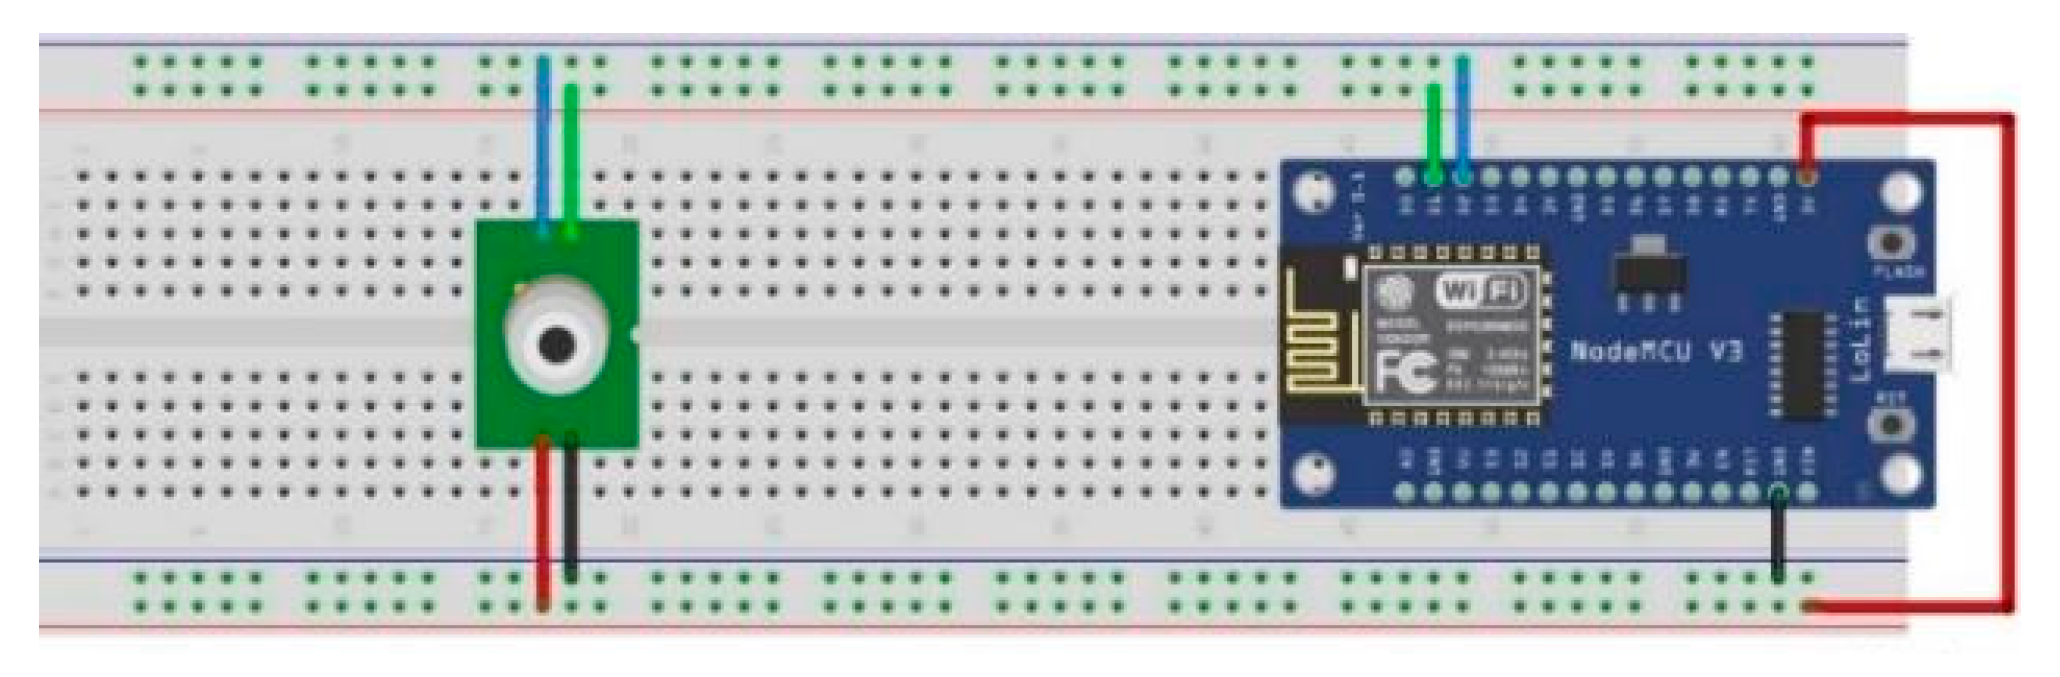
Figure 15 shows the MLX90614 interfacing with the Node-MCU, designed on “fritzing” software [
20].
V
IN and
GND pins for MLX90614 are connected to Node-MCU VIN and GND pins, respectively. The D1 and D2 pins of the Node-MCU are connected to SCL and SDA, respectively.
Figure 16 shows the Neo-6m V2 U blox interfacing with the Node-MCU. VCC and GND pins for the GPS module are connected to Node-MCU VE and GND pins, respectively. For the transmission of data, the TX pin of GPS is connected to the TX of Node-MCU.
This study was conducted in the final year project lab of COMSATS university Islamabad, Lahore Campus in November 2021. The cow data were gathered from a dairy farm situated in a village near the mentioned university. The animals were aged between 15 and 20 months.
3. Results
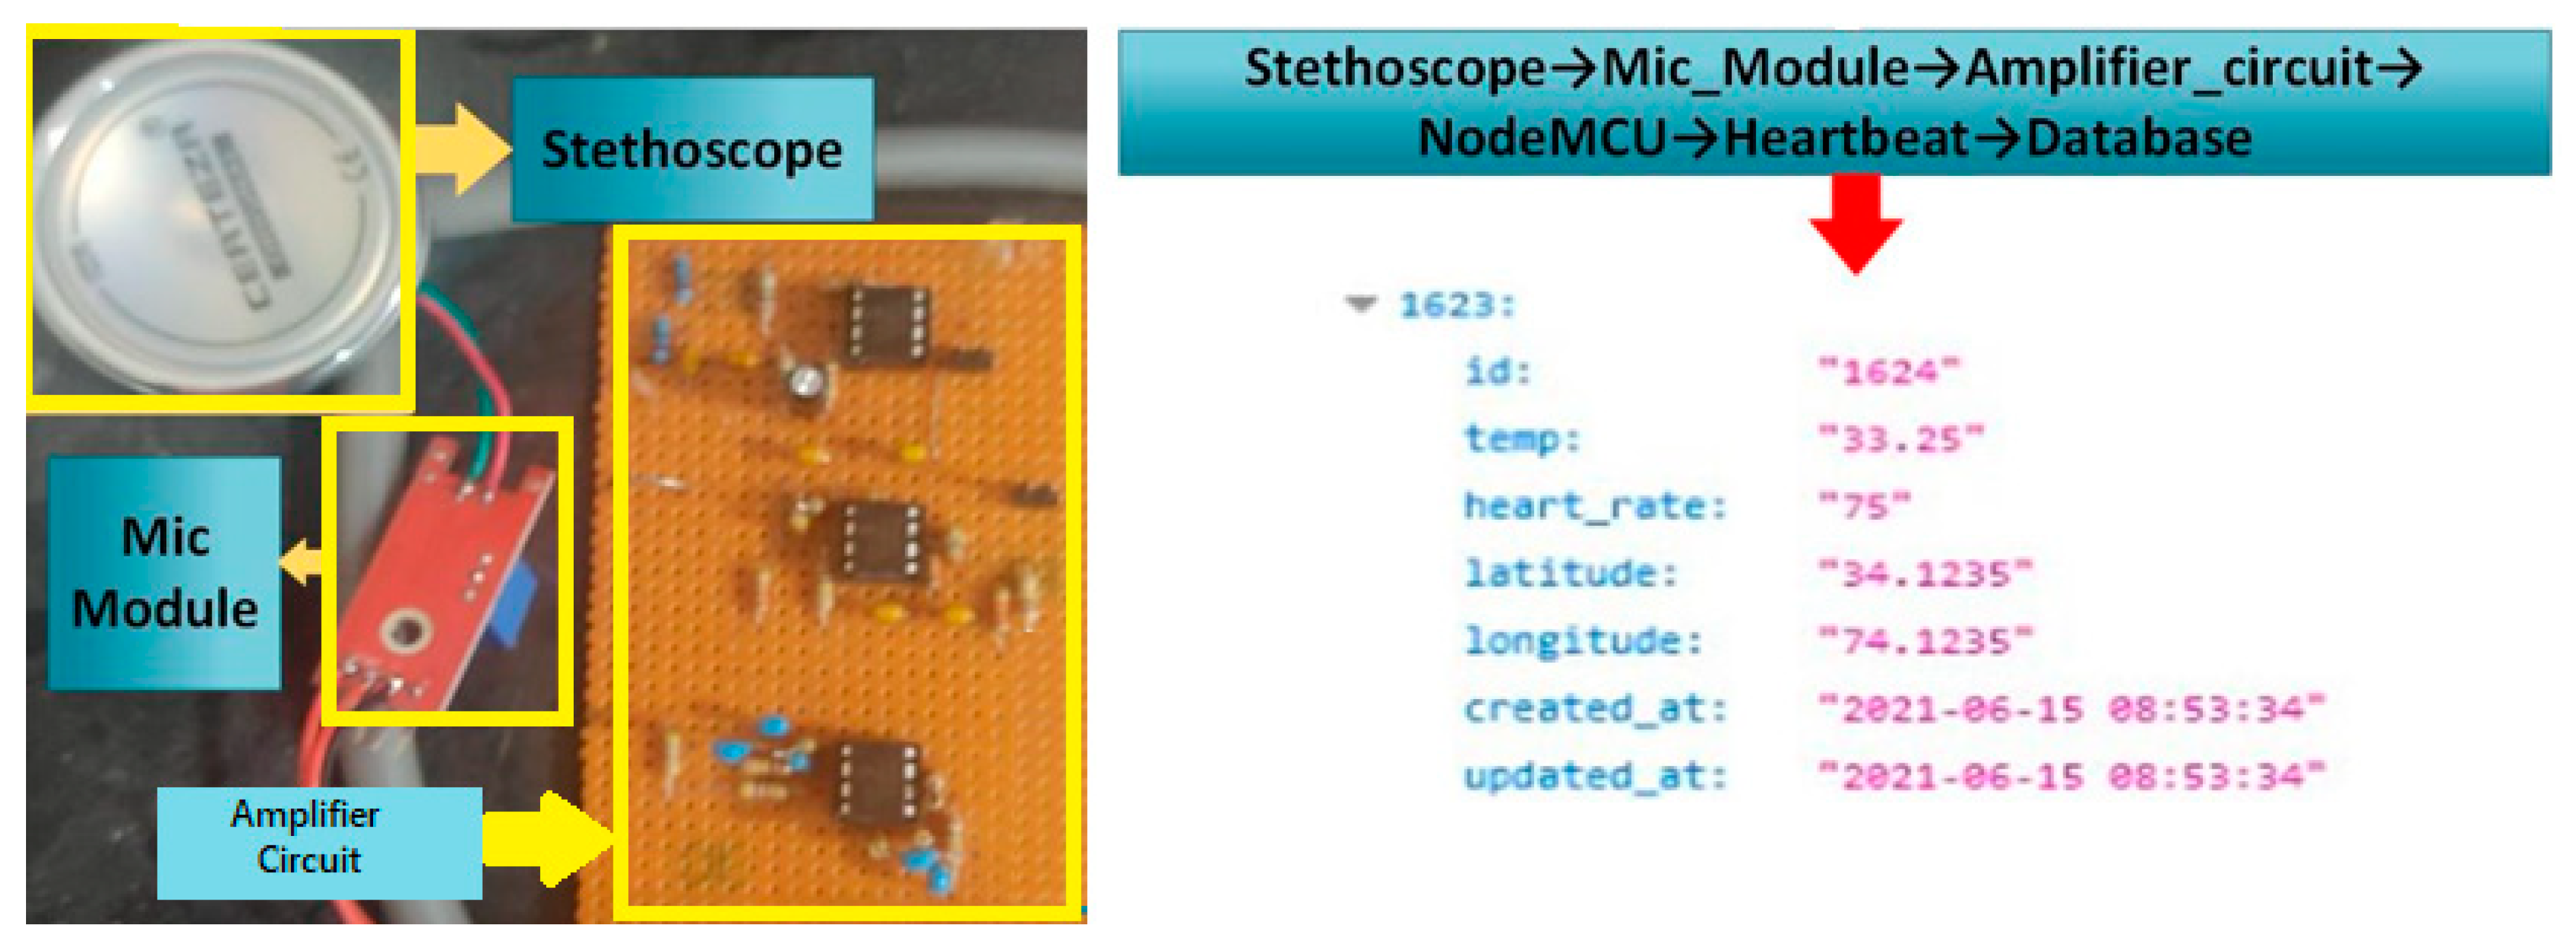
Figure 17 shows the interfacing and operation of the heart rate sensor (MLX90614) integrated into the cow collar. The heartbeat values were collected from the cow and maintained in the database. In the case of irregularity in the values, an automatic message was generated and sent to the concerned party through a push notification. Moreover, a notification was also sent to the owner if the temperature faced any problems in comparison with the set threshold.
Figure 17 also illustrates the function of the heart rate module. A stethoscope CR-747SS [
13] was employed to detect the cows’ heart rates. As the human pulse sensor cannot reliably monitor the temperature due to thick skin, we designed an amplifier circuit that is interfaced with a stethoscope to allow amplified heart rate measurement. The stethoscope has a microphone that feeds the received heartbeat to an amplifier circuit, which then sends the reading to the Node-MCU after it has been amplified. The information is subsequently transferred to a database, where it can be viewed.
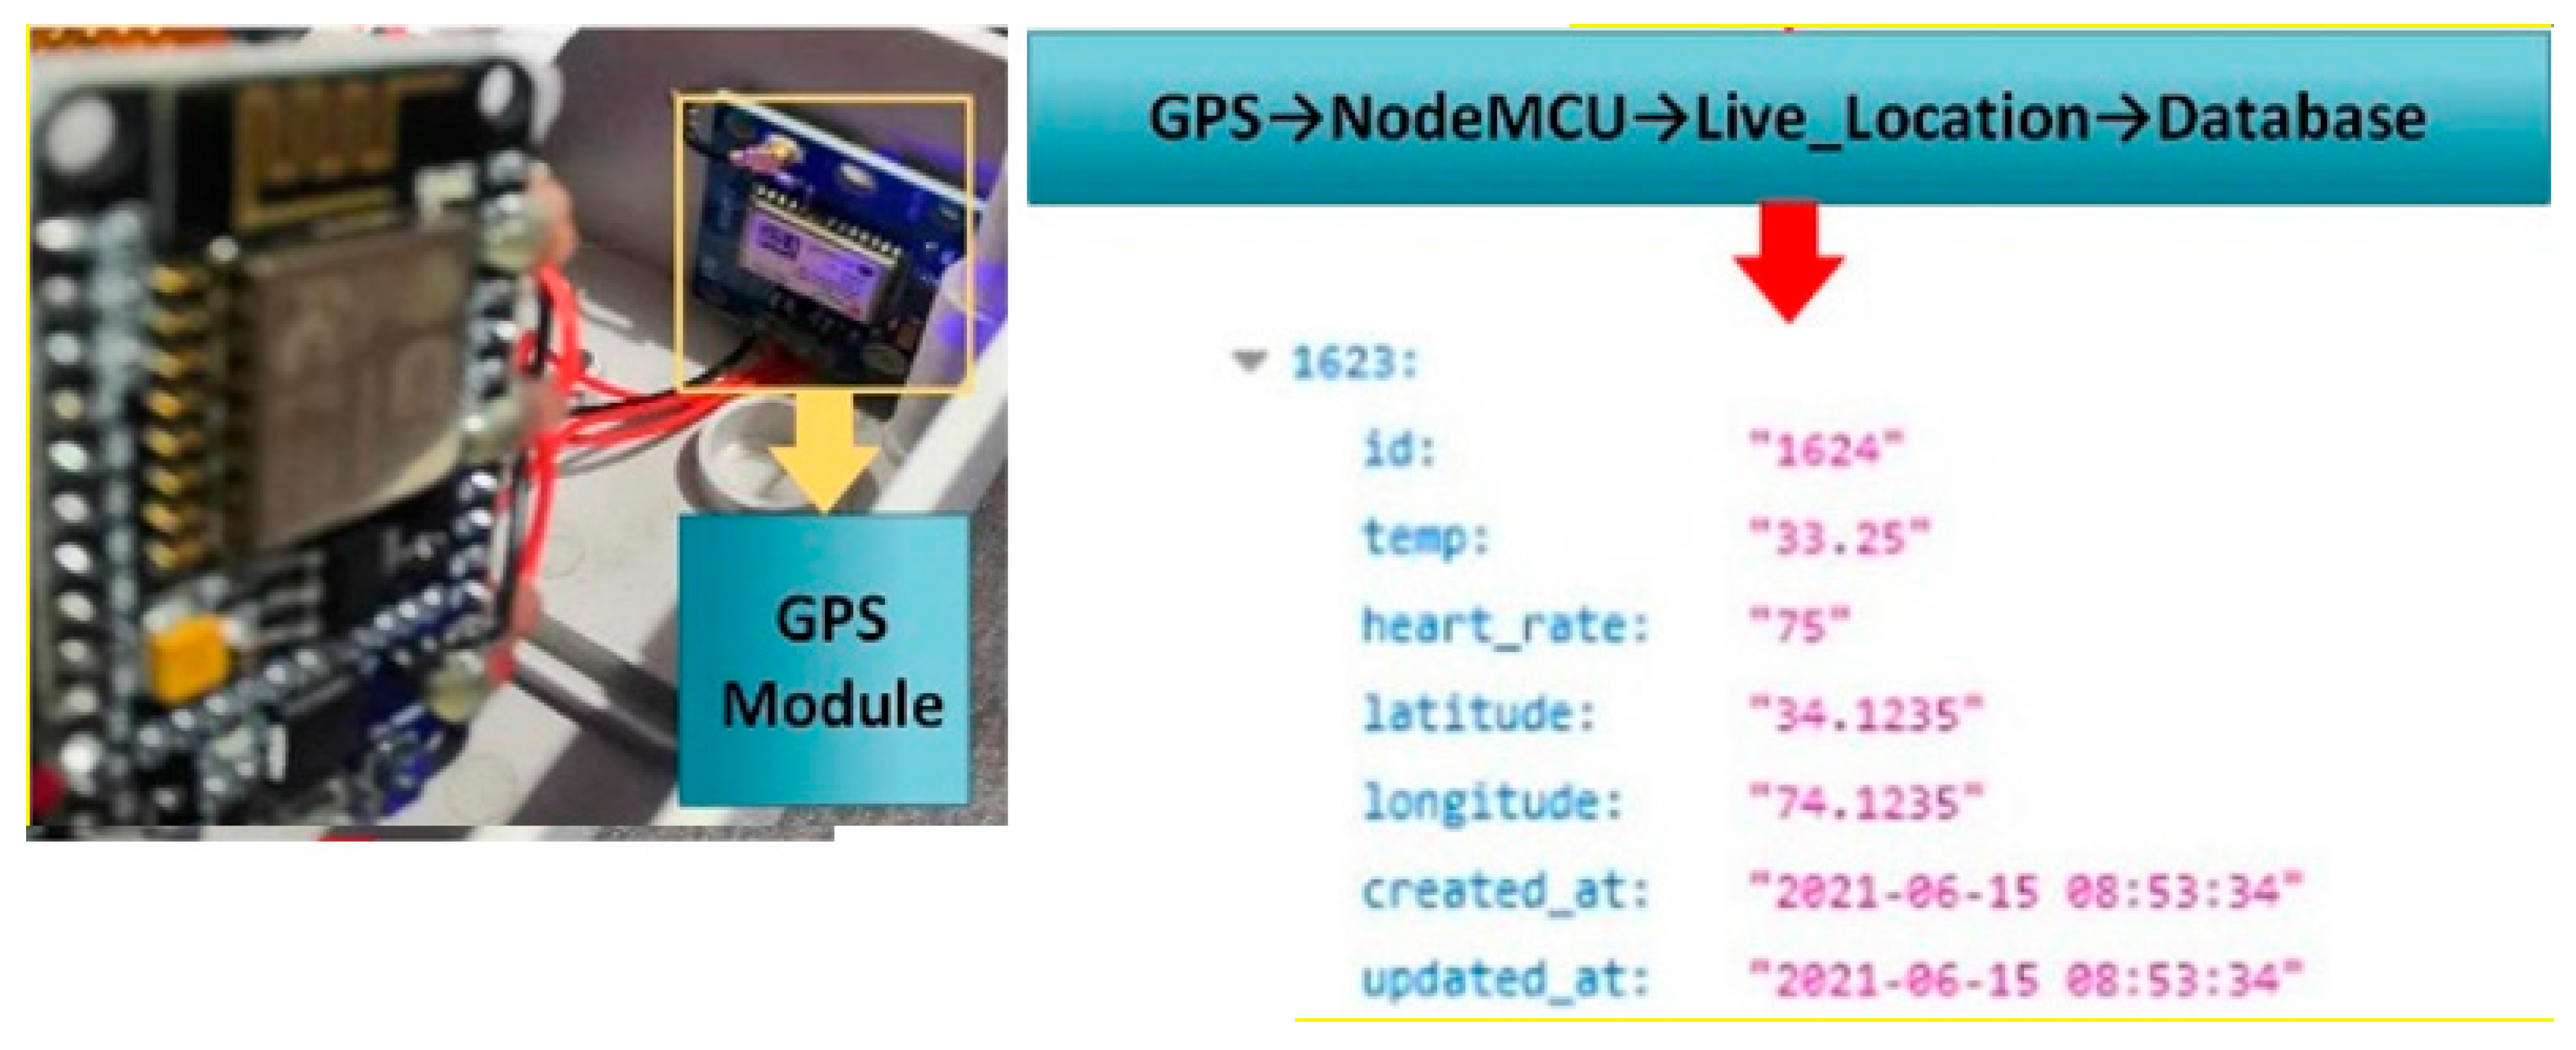
Furthermore, the longitude and latitude are set on the Node-MCU through programming that updates the animal’s live location set at one-second intervals. The geofencing was included in the database, and when the cow moves out of the defined range, an automatic push notification is sent to the owner from the database.
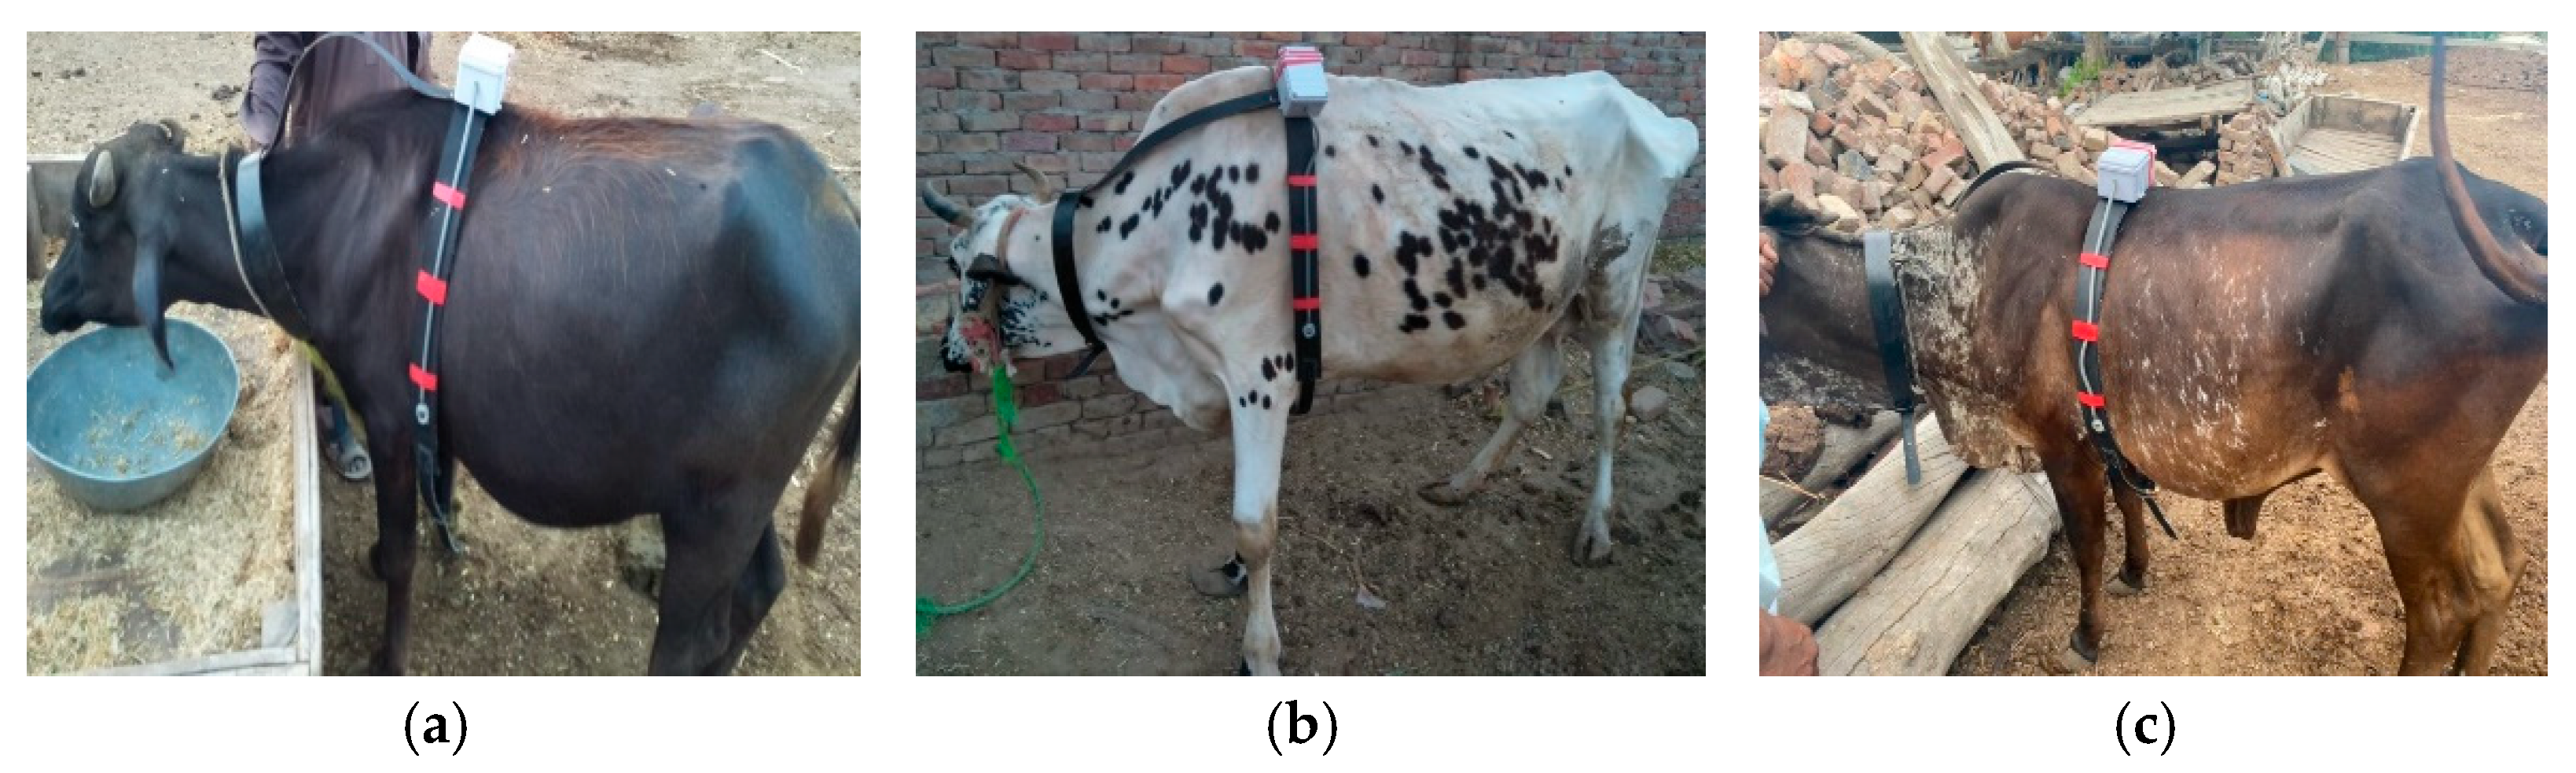
Figure 18 shows the function of the GPS module. The GPS provides the live location of the cow, which can be observed from the front end of the developed database. The results of the cow collar on the cow are significant. The cow collar was placed on the cow’s back for the measurement of temperature, heartbeat, and live location. The strap for the cow collar was designed to fit on the back of the cow easily. The data of the heartbeat, temperature, and the live location were uploaded and updated at regular intervals of 2 s.
Figure 19 shows the cow collar placed on the back of the cow. The heart rate sensor is just below the box for the measurements, and a stethoscope (for measuring the heartbeat) is placed on the side of the cow.
The GPS module is on the side of the cow collar, which provides the cow’s live location. The practical application of the cow collar on the cow is shown in
Figure 19a–c. The cow’s temperature, heartbeat, and live location were all measured using the cow collar, which was mounted on the cow’s back.
The cow collars were placed on the backs of cows for 15–20 min, and continuous monitoring of cow parameters was calculated and recorded in the database. These parameters were also observed in the database’s front end.
Table 1 shows the calculated temperature, heartbeat, and live location of three different cows. Cow1 initially had a temperature of 32 °C when the cow collar was placed on the cow’s back. The temperature remained stable while it was properly attached to the cow’s back, and 36 °C was recorded. Cows’ normal temperature range is 37.8–38.5 °C. The cases of Cow2 and Cow3 were similar. Cow2 had a constant temperature of 37 °C for a time interval of 15 min when the cow collar was on its back. The cow’s temperature was initially 38 °C, but it decreased due to its intense motion after attaching the cow collar, and one possible reason for this is that the cow collar was not fixed in the correct position due to the cow’s constant movement. The heartbeat of each cow showed normal results. The stethoscope, which measures the cow’s heartbeat, is attached to the cow’s side. The normal heartbeat range for a cow is between 48 and 84 BPM. The heartbeat measuring system requires little time for accurate measurements, and the readings in
Table 2 are the mean of all the values taken in 5 min.


 ,
, 


