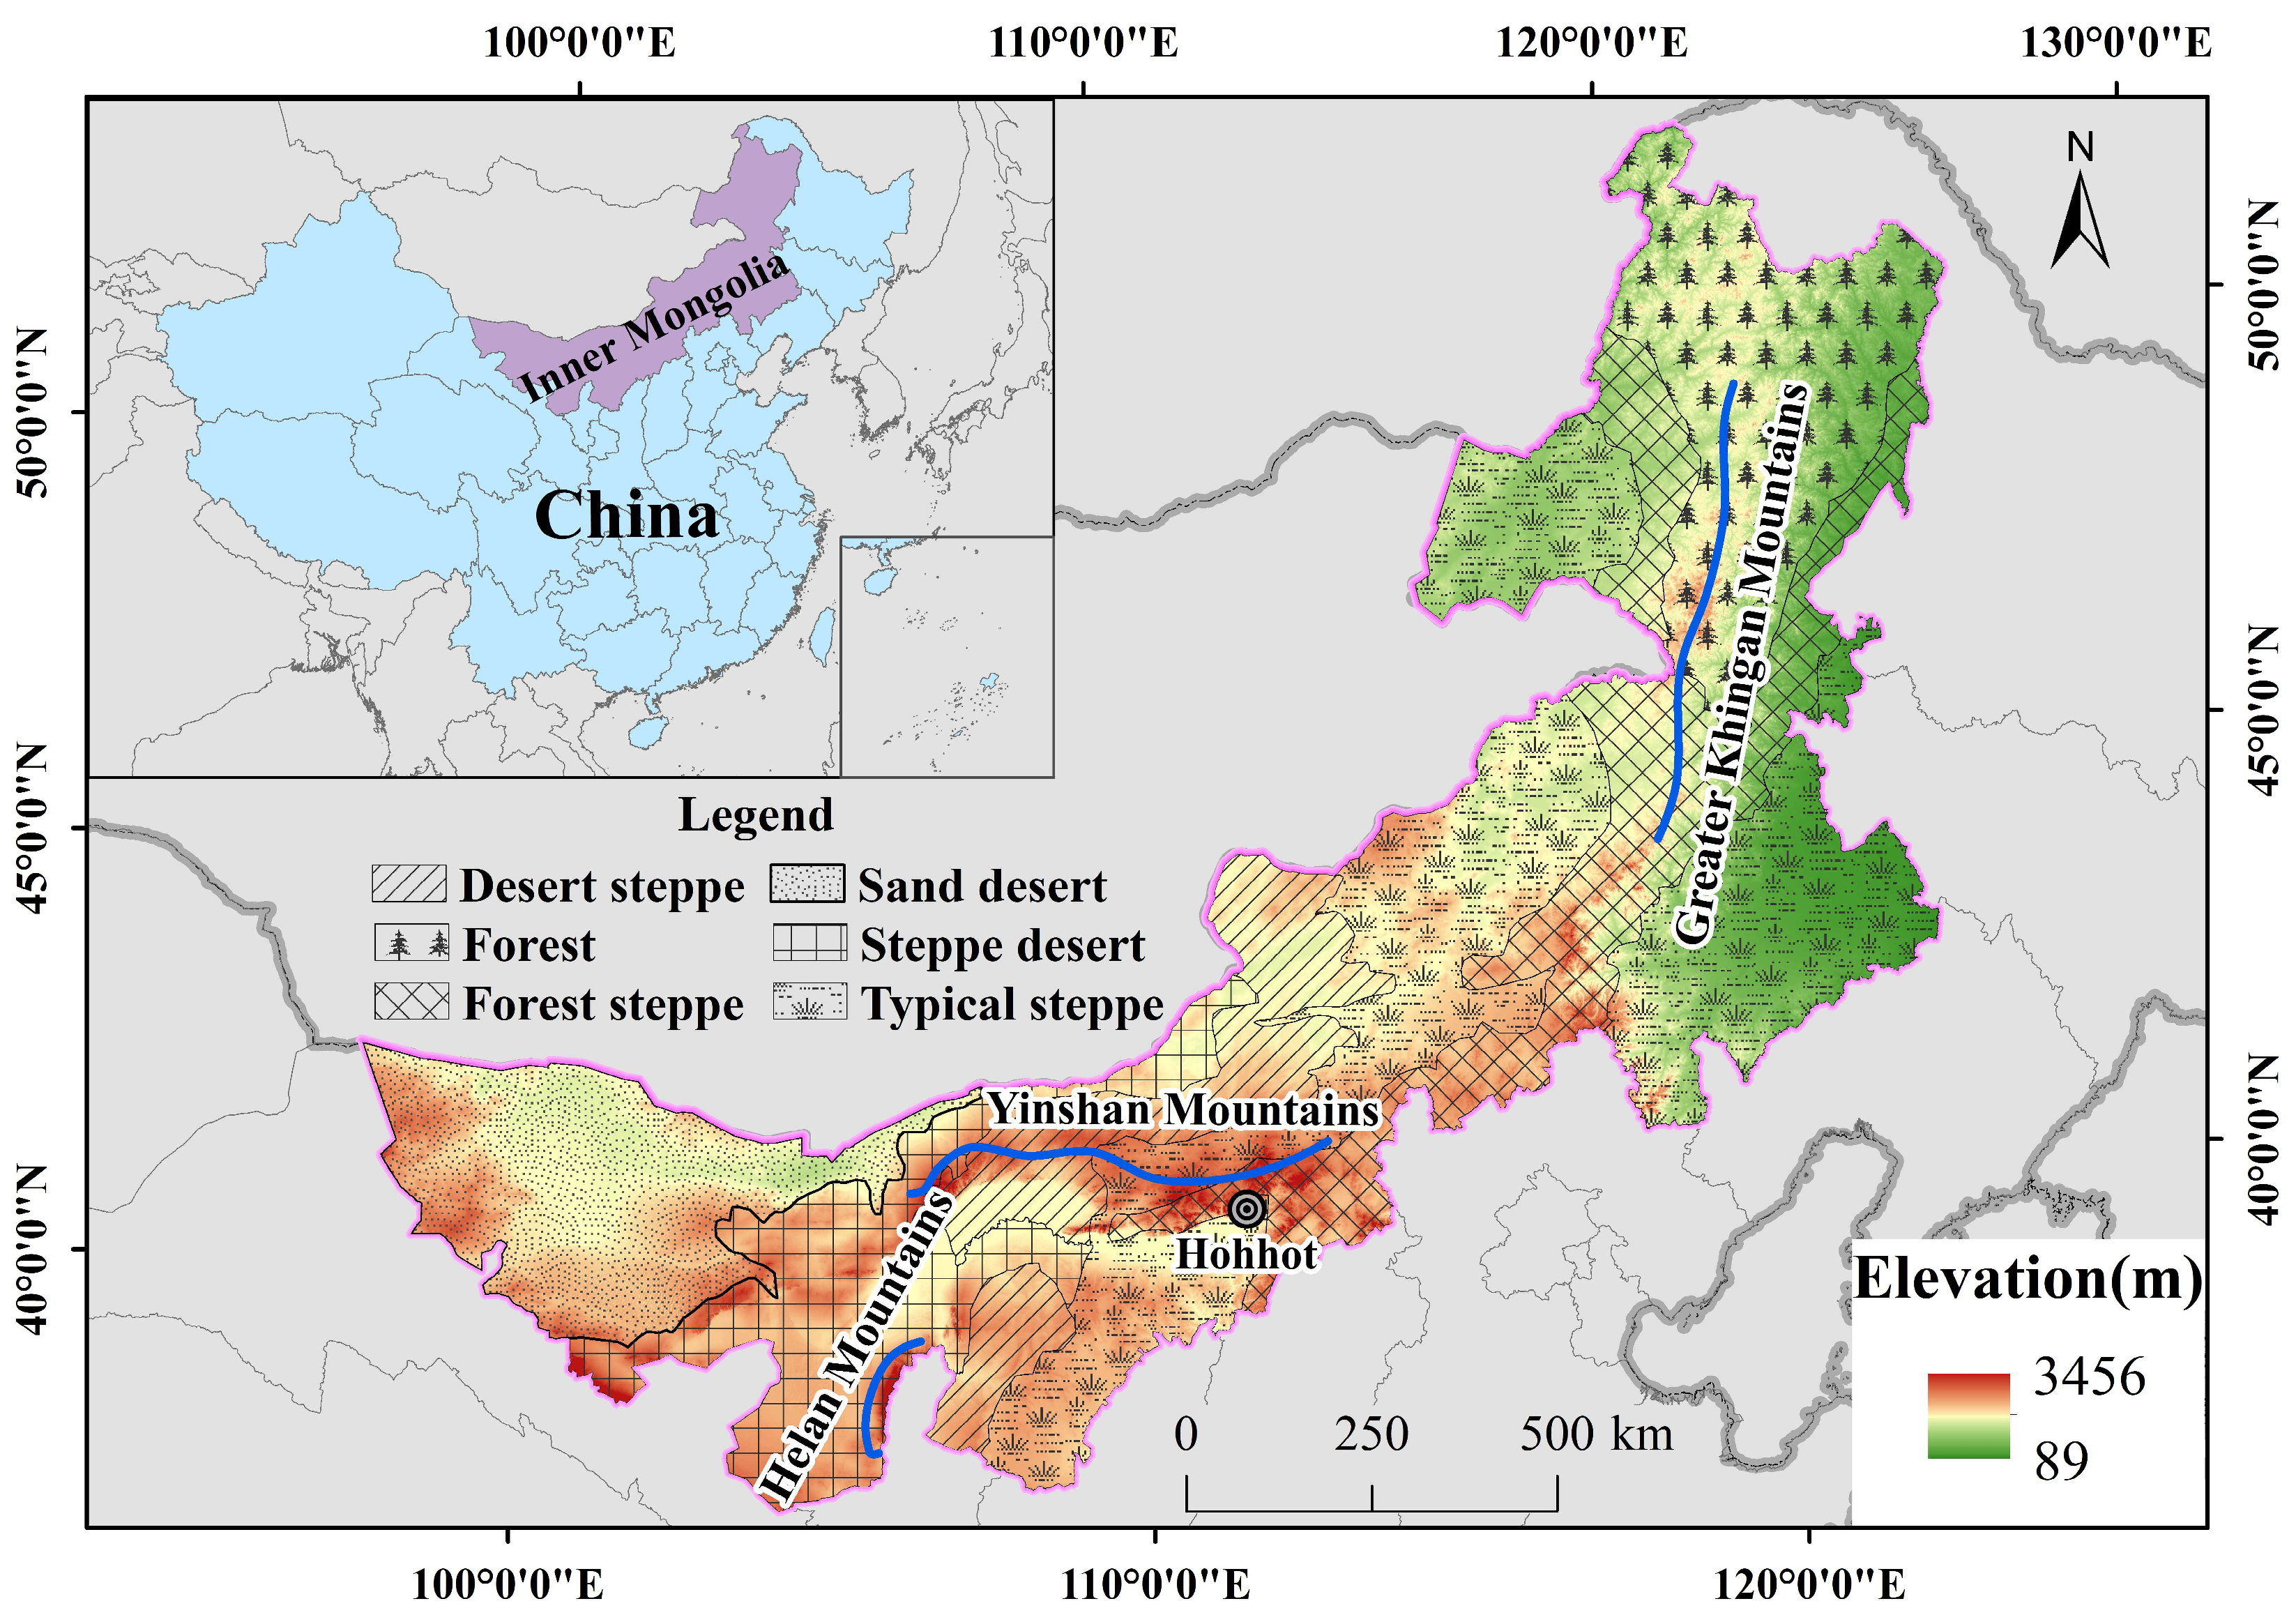
Article

Spatiotemporal Variations in the Intensity of Human Activity in Inner Mongolia and the Identification of Influencing Forces

1
College of Geographical Science, Inner Mongolia Normal University, Hohhot 010022, China
2
Inner Mongolia Key Laboratory of Disaster and Ecological Security on the Mongolian Plateau, Inner Mongolia Normal University, Hohhot 010022, China
3
College of Education for the Future, Beijing Normal University at Zhuhai, Zhuhai 519087, China
4
School of Environment, Northeast Normal University, Changchun 130024, China
*
Author to whom correspondence should be addressed.
Sustainability 2022, 14(10), 6252; https://0-doi-org.brum.beds.ac.uk/10.3390/su14106252
Submission received: 12 April 2022 / Revised: 17 May 2022 / Accepted: 17 May 2022 / Published: 20 May 2022

Abstract

:
The quantitative evaluation of the intensity of regional human activity can reflect changes in the relationship between people and the environment and provide a scientific basis for the formulation of land-use policy and for the construction of the ecological environment. This paper adopted the ratio of the area of construction land to the total area to calculate human activity intensity in Inner Mongolia at the league/city, banner/county, and pixel levels, respectively. On this basis, the overall change in human activity intensity and its spatiotemporal differentiation, geographical unit change, and spatial autocorrelation were analyzed. The results are as follows: (1) The intensity of human activity increased from 2000 to 2020. The intensity of human activity in Inner Mongolia was 8.71% in 2000, and it increased to 8.73% in 2010 and to 9.71% in 2020. The growth rate has accelerated since 2010. (2) The areas with high and medium intensity of human activities are mainly concentrated in the area south of the Hinggan–Yinshan–Helan Mountains. The intensity in the Hulunbeier grassland area and Alxa desert area is relatively low, and the diffusion effect gradually becomes prominent in the proximal local area. (3) The results for the detection of influencing factors indicate that the livestock density, multi-year average precipitation conditions, and population density have significant driving effects on the changes in intensity of human activity in Inner Mongolia.

1. Introduction

With rapid socio-economic development, the human demand for natural resources is continuing to accelerate. Additionally, with the increasing scale and quantity of human activity, the impact on the ecological environment is also more and more serious. Furthermore, the disturbance of and pressure on the ecological environment are also growing, causing regional conflicts over land and restricting the healthy and sustainable development of human society [1]. Therefore, this quantitative study on the intensity of human activities provides a new vision for research to promote ecologically friendly civilization. The intensity of human activity refers to the degree of disturbance caused by human activities in a certain area, including human production and living activities [2]. It is an important quantifiable indicator to measure the degree of human activity in the natural environment, and the research related to the regional intensity of human activity has received great attention from scholars [3,4]. The quantification and spatial expression of intensity of human activity is the basis for evaluating the impact of human activities on the ecological environment [5]. The land is the foundation and main support for the survival and development of human society, and changes in land use are closely related to socio-economic development and ecological environmental protection [6,7]. As the main manifestation of human activities, change in land use reflects the transformation of the natural landscape by human activities, and its temporal and spatial changes reflect the spatiotemporal patterns of intensity of human activity [8]. Much empirical research has been conducted on the spatiotemporal characteristics [9,10], driving mechanisms [11,12], evaluation methods, and models of land-use change [13]. Rich research results have been obtained, providing a foundation for the quantitative evaluation of the regional intensity of human activity through the changing status of land use.
Since the 21st century, the intensity of human activity has increased at a rate greater than before [14,15,16]. According to the previous research results, the quantitative evaluation of the regional intensity of human activity involves multiple aspects such as multi-indicator superposition analysis [17,18], human activity footprints [19,20], and other methods to quantify the intensity of human activity. For example, some papers use methods based on geospatial big data [21]. Additionally, the changes in a certain element of a region caused by population activities have been quantitatively analyzed, including changes in regional land use [22,23,24], changes in functions of ecosystem services [25], and ecological environmental problems caused by human activities [26].
Based on the ideas and research frameworks of previous studies, this paper attempts to build a comprehensive evaluation index system that can reflect the intensity of human activity from the perspective of land-use change and the change in the intensity of human activity. Additionally, the evolution of the spatial pattern of human activity in the Inner Mongolia region is systematically analyzed based on the land-use data from 2000 to 2020. In addition, a geographical detector model is established to reveal the main disturbance factors in change in intensity of human activity in the study area. The exploration of the spatiotemporal evolution patterns of intensity of human activity in Inner Mongolia over a long time period is significant to promoting ecological protection and high-quality socio-economic development in Inner Mongolia.

2. Materials and Methodology

2.1. Study Area

Inner Mongolia, known in full as the Inner Mongolia Autonomous Region, is located at the southern edge of the Mongolian Plateau, and it is the second-largest “water tower” in China. It is a vast territory that stretches in a great crescent for some 2400 km across northern China. It is bordered to the north by Mongolia and Russia; to the east by the Chinese provinces of Heilongjiang, Jilin, and Liaoning; to the south by the provinces of Hebei, Shanxi, and Shaanxi and the Hui Autonomous Region of Ningxia; and to the west by the province of Gansu. Inner Mongolia is essentially an inland plateau with a flat surface lying at an elevation of about 1000 m above sea level and fringed by mountains and valleys. The Greater Hinggan–Yinshan–Helan mountain ranges form an important natural boundary in the north of China, dividing the Inner Mongolian Plateau from the surrounding low plains, as well as an important dividing line between climate types, internal and external watersheds, agricultural and pastoral areas, and even population distributions. Its ecological environment is extremely fragile and has a very special ecological status (Figure 1). In addition, Inner Mongolia is an important ecological security barrier in the north of China. In recent years, the overall ecological environment in Inner Mongolia has deteriorated sharply, and the conflict between humans and land has become an issue that academia has focused on at home and abroad.

2.2. Data Source and Preprocessing

The land-use data for 2000, 2010, and 2020 were obtained from GlobeLand30 series data (http://www.globallandcover.com/, accessed on 24 January 2022). The images for the land cover classification of development and update of GlobeLand30 are mainly 30-m multispectral images, including TM5 ETM+, and OLI multispectral images from Landsat (USA) and HJ-1 (China Environment and Disaster Reduction Satellite, http://www.cresda.com/, accessed on 24 January 2022). Additionally, 16-m resolution GF-1 (China High-Resolution Satellite) multispectral images are used by GlobeLand30 for 2020. The data include ten types of land cover, including cultivated land, forest, grassland, shrubland, wetland, water bodies, tundra, artificial surfaces, bare land, perennial snow, and ice. The overall classification accuracy of the data set is greater than 80%. This data set is crucial for studying global climate change, implementing sustainable development, and addressing the challenges in the areas of resources, the environment, and ecology [27]. GlobeLand30 series data provide convenient and effective data support for the study of land-use changes and are used extensively by researchers in China [28,29]. In this study, the land-use types were reclassified into cultivated land, forest, grassland, shrubland, wetland, water bodies, artificial surfaces, and bare land to study and analyze the intensity of human activity distribution characteristics, spatiotemporal evolution, and driving forces of intensity of human activity change and evolution. The socio-economic data for the region were downloaded from the National Bureau of Statistics (http://www.stats.gov.cn/, accessed on 24 January 2022). Furthermore, ArcGIS10.7 software was adopted for data cropping, attribute management, and data collation. A flowchart of the data acquisition intensity of human activity index calculation process is shown in Figure 2.

2.3. Research Methodology

The previously proposed method using the percentage of the area equivalent to construction land out of the total regional land area was used to calculate the intensity of human activities in different spatial units in Inner Mongolia from 2000 to 2020. Then, the calculation results were classified into different types according to the unified grading criteria. On this basis, the spatial autocorrelation model and geographical detector were adopted to explain the spatiotemporal evolution of intensity of human activity and to explore the driving factors of spatial differentiation of human activities.

2.3.1. Model of the Intensity of Human Activity

In this paper, the calculation of intensity of human activity on land surface is based on the model proposed by Xu Yong et al. [30], and the conversion index (CI) of and equivalent to construction land is shown in Table 1.
Intensity of human activity is calculated as follows:
H = S C L E S × 100 % ,   S C L E = i = 1 n ( S L i × C I i )  
where H is the intensity of human activity; S C L E is the land equivalent area; S is the total area of the region; S L i is the area of the i-th land-use/land-cover type; C I i is the conversion index of the construction land equivalent to the i-th land-use/land-cover type; and n is the number of land-use/land-cover types in the study area. In particular, C I i of the construction land is calculated using a two-tier stepwise calculation method.

2.3.2. Exploratory Spatial Analysis

The spatial autocorrelation analysis concerns the spatial interconnection and influence of intensity of human activity in the study area. Based on the intensity of human activity of each study unit, this paper used Moran’s I index to measure the degree of spatial clustering of intensity of human activity, i.e., the degree of spatial autocorrelation. Getis–Ord Gi* values were used to detect the spatial aggregation distribution of the hot-spot and cold-spot areas of the intensity of human activity in the study area. The zoning was performed based on the calculated results and spatially visualized by ArcGIS10.7 (Esri (Environmental Systems Research Institute, Inc., Redlands, CA, USA)).
  • Global Moran’s I
Moran’s I index was proposed by Moran in 1948 to reflect the similarity of the intensity of human activities in spatial adjacency or spatial proximity, which is calculated as follows:
I = n i = 1 n j = 1 n w i j ( x i x ¯ ) ( x j x ¯ ) i = 1 n j = 1 n w i j i = 1 n ( x i x ¯ ) 2  
In Equation (2), x i and x j are the intensity of human activity values of area i and j, respectively; w is the spatial power matrix; and w i j indicates the degree of influence between spatial units i and j, with the value being assigned according to the spatial adjacency between the research unit i and the adjacent unit j (called the Queen’s Case); x ¯ is the mean value of the intensity of human activity in the study area. The calculation formula is x ¯ = 1 n i = 1 n x i . The value of Moran’s I index falls between −1 and 1. Specifically, Moran’s I > 0 indicates a positive spatial correlation, and a larger value indicates a more obvious spatial correlation; Moran’s I < 0 indicates a negative spatial correlation, and a smaller value indicates a greater spatial variation; Moran’s I = 0 indicates that the space presents randomness.
2.
Hot-Spot Analysis
The Getis–Ord G i index is calculated as follows [31]:
G i = j = 1 n w i j x j X ¯ j = 1 n w i j S n j = 1 n w i j 2 ( j = 1 n w i j ) 2 n = 1  
In Equation (3), w i j is the spatial weight between cells i and j; X ¯ and S are, respectively, the mean and the standard deviation, which are calculated as X ¯ = 1 n j = 1 n x j , S = 1 n j = 1 n x i 2 X ¯ 2 . If G* (Z value) is positive and statistically significant, a higher Z value indicates a tighter clustering of high values (hot spots); if G* (Z value) is negative, a lower Z value indicates a tighter clustering of low values (cold spots).

2.3.3. Geographical Detector Analysis Method

Geodetectors are a series of statistical methods used to detect spatial heterogeneity and reveal the driving forces [32]. In recent years, the geodetector method has been applied to many fields, because it requires few assumptions and can effectively overcome the limitations of traditional statistical methods in dealing with categorical variables [33,34,35]. In this paper, the mechanism influencing the intensity of human activity and the factors influencing the intensity of human activity in Inner Mongolia are investigated. On this basis, the explanatory power of the factors influencing the intensity of human activity in Inner Mongolia was measured using geographic probes. The geographic probe consists of four parts: risk detection, factor detection, ecological detection, and interaction detection.
Risk detection is mainly used to explore the location of risk areas and indicate the factors that influence the intensity of human activities. It is tested with a t-statistic:
t y ¯ i = 1 y ¯ i = 2 = Y ¯ i = 1 Y ¯ i = 2 [ V a r ( Y ¯ i = 1 ) n i = 1 + V a r ( Y ¯ i = 2 ) n i = 2 ] 1 2  
In Equation (4), Y denotes the mean value of the attributes in the region; n i is the number of samples in region I; and V a r is the variance.
Factor detection is used to identify the factors that contribute to risk and the extent to which different influences explain the changes in the intensity of human activity in Inner Mongolia. It is usually measured with a q-value, which is calculated as follows:
q = 1 1 n σ 2 i = 1 m n i σ i 2  
In Equation (5), q indicates the explanatory power of the influence factor on the changes in the intensity of human activity; n and σ2 are the sample size and variance, respectively; and n i and σ i 2 are the sample size and variance of layer i (i = 1, 2, …, m), respectively.
Ecological detection is mainly used to explain the relative importance of risk factors and is measured by F statistics.
F = n C , p ( n C , p 1 ) σ C , p 2 n D , p ( n D , p 1 ) σ D , p 2  
In Equation (6), n C , p and n D , p are the number of samples of impact factors C and D at the scale of P, respectively; σ C , p 2 and σ D , p 2 are the variance of C and D, and they conform to the distribution of F ( n C , p 1 , n D , p 1 ) and df ( n C , p , n D , p ) , respectively.
Interaction detection is used to determine whether the influence factors act independently or interact. First, the q values ( q ( X 1 ) and q ( X 2 ) ) of the two factors X 1 and X 2 of the explanatory variable Y are calculated. If q ( X 1 X 2 ) < min [ q ( X 1 ) , q ( X 2 ) ] , this indicates that the nonlinearity weakens after the two factors interact; if min [ q ( X 1 ) , q ( X 2 ) ] < q ( X 1 X 2 ) < max [ q ( X 1 ) , q ( X 2 ) ] , this indicates that the bilinearity strengthens after the two factors interact; if q ( X 1 X 2 ) > q ( X 1 ) + q ( X 2 ) , this shows that the nonlinearity strengthens after the interaction of the two factors; if q ( X 1 X 2 ) = q ( X 1 ) + q ( X 2 ) , this indicates that the two factors are independent of each other.

3. Results

3.1. Characteristics of the Spatiotemporal Variation in the Intensity of Human Activity

3.1.1. The Variation in Land Use in Different Regions

Figure 3 shows the spatial distributions of land-use types across Inner Mongolia from 2000 to 2020. The land in Inner Mongolia is mainly grassland, which accounted in 2000, 2010, and 2020 for 46.16%, 47.43%, and 46.57% of the total land area, respectively. Grassland is mainly distributed in Xilingol and Hulunbeier plateau areas. Cultivated land is concentrated in the south of Hinggan–Yinshan–Helan Mountains, and it accounted for 12.4%, 11.95%, and 13.27% of the total area in 2000, 2010, and 2020, respectively. The bare land in the study area, i.e., the land covered by less than 10% of natural cover, includes desert, sandy land, gravel land, bare rock, saline land, etc. The area of this land-use type accounted for 27.61%, 26.58%, and 25.52% of the total area in 2000, 2010, and 2020, respectively. The forest land accounted for 11.45%, 11.47%, and 11.57% of the total area in 2000, 2010, and 2020, respectively. It is mainly distributed in the Hinggan area. Inner Mongolia consistently features extensive land and a sparse population; the proportion of the construction land area is only 1.5%. Inner Mongolia spans 2400 km from east to west and across five natural zones. There are obvious regional differences in the climate and topography and an uneven land-use structure in each league and city. Xilingol is dominated by grassland; Hulunbeier City and Alxa League are two extremes, as the former has the highest proportion of forest land, and the latter is dominated by bare sandy land.
From 2000 to 2020, the land-use changes in Inner Mongolia are most obvious for cultivated land, grassland, artificial surfaces, and bare land (Figure 4 and Table 2). The changes in both artificial surfaces and cultivated land area show an increasing trend, and the growth rate of the artificial surface area reaches 95.62%. In this period, the area of bare land decreases by 7.57%.

3.1.2. The Variation in the Intensity of Human Activities

It can be seen from Figure 5 that the equivalent area of construction land and the intensity of human activities in Inner Mongolia remained basically unchanged between 2000 and 2010 but grew rapidly between 2010 and 2020. The equivalent area of construction land in Inner Mongolia in 2000, 2010, and 2020 was 100,260 km2, 100,460 km2, and 111,809 km2, respectively, and the corresponding intensity of human activities was 8.71%, 8.73%, and 9.71%, respectively. The intensity of human activities in Inner Mongolia in all years is close to the national average and lower than that in the eastern coastal region [30].
To fully reveal the similarities and differences in the relative levels of intensity of human activity in Inner Mongolia, as well as the evolutionary characteristics of its spatial pattern, the indices of the intensity of human activity in 2000, 2010, and 2020 for different periods at the levels of Inner Mongolia’s leagues, banners and counties, and grid were determined. Furthermore, the compromise method was used to classify the intensity of human activity of each league and city into three levels (high, medium, and low), and the spatial visualization effect is shown in Figure 6, Figure 7 and Figure 8.
Change in Human Activity Intensity at League/City Scale
Figure 6 shows the change in the intensity of human activity at the scale of league or city. The spatial distribution pattern of the intensity of human activity from 2000 to 2020 is high in the central part and low in the eastern and western parts. The spatial distribution of the type of area with a high intensity of human activity is more stable, while the spatial distribution of the other two types varies more obviously. During the period of 2000–2020, the areas where the high intensity of human activity was mainly concentrated were Hohhot, Wuhai, and Tongliao. These cities are located south of the Three Mountains (the Hinggan–Yinshan–Helan Mountains), and they have relatively good natural base conditions, with the most extensive urban area and arable land in Inner Mongolia. Economic development zones of “Hu-Bao-E” and “Chi-Tong” have been formed, mainly including the cities of Hohhot, Baotou, Erdos, Chifeng, Tongliao, and the surrounding areas. In addition, Inner Mongolia relies on rich water resources of the Yellow River and Liaohe River basin. The central part of the Hetao Plain and the eastern part of the West Liaohe Plain have the richest arable land resources, and this area features a higher intensity of human activities. Alax League, Xilingol League, and Hulunbeier have the lowest intensity of human activity, and these areas have poor natural environmental conditions, low levels of socio-economic development, and relatively small population size. In 2000, the areas with a low intensity of human activity included five leagues and cities in Inner Mongolia, accounting for 42% of the 12 leagues and cities in the whole study area; in 2020, three leagues and cities in the study area had a low intensity of human activity, accounting for 25% of the 12 leagues and cities in all of Inner Mongolia. It can be seen from the graph of the intensity of human activity change (Figure 6d) that Bayannur, Tongliao, Wuhai, and Chifeng are the league cities with the most obvious change in the intensity of human activity.
Change in the Intensity of Human Activity at the Banner/County Scale
To gain an insight into the change in the intensity of human activity in 103 banner and county districts in the study area, the intensity of human activity was obtained using ArcGIS10.7 software statistical tools; values lower than 0.35, between 0.15 and 0.35, and higher than 0.15 were considered high, medium, and low, respectively. The spatial distribution and the number of counties at each level of intensity of human activity are shown in Figure 7 and Table 3. During the period of 2000–2020, the intensity of human activity in the study area was mainly medium and low. Specifically, the number of banners and counties with a low intensity of human activity decreased; the number of banners and counties with a high intensity of human activity increased; and the number of banners and counties with a medium intensity of human activity did not change significantly. The percentage of banners with a low intensity of human activity decreased from 43.57% to 35.64%, and the percentage of banners with a high intensity of human activity increased from 9.90% to 15.84% between 2000 and 2020.
Change in the Intensity of Human Activity at the Pixel Level
The spatial distribution of land-use types in Inner Mongolia shows that the main land-use type is grassland. The grassland hilly areas to the north of the Hinggan–Yinshan–Helan Mountains have a low intensity of human activity; the areas to the south of the Hinggan–Yinshan–Helan Mountains have a high and medium intensity; and the grassland area in Hulunbeier and the desert area in Alxa tend to have a low intensity of human activity, which basically coincides with the fact that these areas form the boundary zone between pastoralism and agriculture in Inner Mongolia. The main reason for the low intensity of human activity in the region north of the three mountains in Inner Mongolia is that the soil, precipitation, and temperature in the region are not suitable for production activities such as extensive farming (Figure 8). During the period of 2000–2020, 13.68% of the study area experienced changes in the intensity of human activity, while the remaining 86.32% of the area remained unchanged. As for the change in the intensity of human activity, the weakening and strengthening of human activities were 4.86% and 8.82%, respectively (Figure 7d).
Change in Intensity of Human Activity at the Nature Level
It can be seen from Figure 9 and Figure 10 that the sand desert and desert steppe have poor natural conditions. These regions have a weak foundation for socio-economic development, and thus exhibit low intensity of human activities. In comparison, the regions of a typical steppe and a forest steppe have good natural conditions, and they have good momentum for socio-economic development and high intensity of human activities.

3.1.3. Spatial Autocorrelation Analysis of the Intensity of Human Activity

Table 4 lists the global Moran’s I index values of the intensity of human activity in Inner Mongolia from 2000 to 2020. The values at the banner/county level and pixel level are greater than 0, and the z-value test indicates the significance. Thus, the intensity of human activity in the study area has significant spatial clustering characteristics during all years. The Moran’s I index values at the banner level and pixel level fluctuate around 0.6 and 0.8, respectively, indicating that there has been no significant change in the spatial aggregation of the intensity of human activity in Inner Mongolia during the last 20 years. To further reveal the spatial differences, the hot and cold spots of the intensity of human activity were identified, and the changes in these spots were investigated in this paper.
The hot-spot map of the intensity of human activity in Inner Mongolia (Figure 11), which has passed the Z-test, (p < 0.001), shows the hot-spot and cold-spot areas, with an intensity of human activity higher and lower than the average of the study area, respectively. The spatially adjacent areas form high-value and low-value agglomeration areas. The overall pattern of the hot-spot and cold-spot areas of the intensity of human activity in Inner Mongolia during the study period was basically stable. The cold-spot areas gradually decreased from 25.25% in 2000 to 22.41% in 2020, and the hot spot areas increased from 17.76% in 2000 to 17.86% in 2020. In terms of spatial distribution, the hot spots are mainly distributed in the region south of the Hinggan–Yinshan–Helan Mountains. Furthermore, the hot spots at the banner and county levels are mainly distributed in the Hubao-Ewu urban agglomeration region, and the cold spots are mainly distributed in the region north of the three mountains, including the Alxa, Hulunbeier, and Xilingol grassland areas.
The changes in the hot spots of the intensity of human activity in Inner Mongolia from 2000 to 2020 are mainly concentrated in Urad Middle Banner and Urat Rear Banner in Bayannur City; Sonid Left Banner in Xilingol League; Zalut Banner, Naiman Banner, and Kailu County in Tongliao City; Xin Barag Left Banner and Prairie Chenbarhu Banner in Hulunbeier City; and Ar Horqin Banner and Wengniut Banner in Chifeng City. All of these are areas with rapid development of urbanization and industrialization. The changes in the cold spots of the intensity of human activity are mainly concentrated in the areas of the Oroqen Autonomous Banner and the Molidawa Daur Autonomous Banner in Hulunbeier City; Taibus Banner and Zhengxiangbai Banner in Xilingol League; Siziwang Banner in Ulanqab City; Guyang County in Baotou City; and Wuchuan County in Hohhot City.

3.2. Geographical Detection Model for the Factors Influencing the Intensity of Human Activity

Based on domestic and foreign studies on the factors influencing the regional intensity of human activity and considering the specificity of the study area and the data availability, this paper constructed an index system of the factors influencing the intensity of human activity. The index system consists of 17 indicators, as shown in Table 5. The data on factors with spatially divergent characteristics influencing the intensity of human activity in Inner Mongolia were clustered by the K-means method and then discretized to generate the type data (Figure 12). No correlation in terms of type data is required, because the geodetector method is immune to independent variable covariates. The risk detection, factor detection, ecological detection, and interaction detection were conducted on the overall and zonal characteristics of the intensity of human activity in Inner Mongolia to fully reveal the mechanisms influencing the spatial differentiation of the intensity of human activity in the study area.

3.2.1. Explanatory Power of Factors Influencing the Intensity of Human Activity

The detection of factors related to changes in the intensity of human activity was performed in the study area using a geographic probe model, and the relative importance of the 17 factors influencing spatial differentiation of the changes in the intensity of human activity in Inner Mongolia was compared. The results of the analysis show that the spatially distributed differences in changes in the intensity of human activity in Inner Mongolia are influenced by a combination of natural and socioeconomic factors. The results of factor detection in terms of the statistical data from 2020 are listed in Table 6, and the influencing factors are ranked according to their ability to explain the changes in the intensity of human activity as follows: X10 (Livestock density) > X7 (Average annual precipitation) > X14 (Population density) > X2 (Traffic conditions) > X16 (Eco-functional zone) > X3 (Density of settlements) > X1 (Distance from central city) > X6 (DEM) > X5 (Distance to nature reserve) > X15 (Major-function-oriented zoning) > X12 (The proportion of secondary industry) > X9 (Number of industrial enterprises) > X4 (River density) > X11 (Per capita GDP) > X13 (The proportion of primary industry) > X8 (Transformation of aspect) > X17 (Distribution of coal resources). Our research shows that the spatial distribution of changes in the intensity of human activity is affected by livestock density, precipitation, population density, and the influence of traffic density.
Among these influencing factors, population, as the main body of human activity, is one of the basic factors influencing the intensity of regional human activities. The total population of Inner Mongolia increased from 23,725,400 in 2000 to 24,028,000 in 2020 (an increase of 302,600), and the urban population increased by 6,204,000 [36]. The urbanization rate increased from 42.23% in 2000 to 63.37% in 2020 (increased by 21.14%), and the average rate of annual increase was 1.11%, which is higher than the national average rate of annual increase [37]. A large number of people are concentrated in cities, leading to the expansion of the size of the urban population. The rapid development of regional industrialization and urbanization causes the ecological space to be occupied by production space such as industrial and mining space and urban living space, leading to an increasingly tense relationship between the people and the land in the region.

3.2.2. Interaction of the Factors Influencing the Changes in the Intensity of Human Activity

The interaction detector is mainly used to analyze whether the influencing factors have an interactive effect on the spatial distribution of the intensity of human activity in the study area. On this basis, the explanatory power of different influencing factors can be investigated when they interact to increase or decrease the level of the intensity of human activity. The interaction detection results show that the interaction of any two factors among the selected factors is greater than the effect of a single factor (except for the interaction of X17 and X14), and the interaction of the two factors belongs to non-linear enhancement or two-factor enhancement (Figure 13). This indicates that the spatially divergent results of the change in the intensity of human activity in the study area are not caused by a single influencing factor but the combined effect of different types of influencing factors. The interaction of urban distance and elevation have the strongest effect on spatial variation in the change in the intensity of human activity, followed by the interaction of precipitation and elevation and the interaction of livestock density and secondary production weight. Furthermore, among the non-linearly enhanced interactions, the interaction between precipitation and elevation and other factors is the strongest.

3.2.3. Significant Difference in Factors Influencing the Change in the Intensity of Human Activity

Ecological detectors were used to identify the effects of 17 influencing factors on changes in the intensity of human activity. The results of statistically significant differences between every two influencing factors are presented in Figure 14, where Y indicates that there is a significant difference between the corresponding factors, and N indicates no significant difference. The results show that except for X15 (Majorfunction-oriented zoning), X5 (Distance to nature reserve), and X12 (The proportion of secondary industry), there are significant differences in the effects of the remaining factors on the spatial distribution of the changes in the intensity of human activity. In addition, there is a significant difference between the effects of two superimposed factors on the spatial distribution of the changes in intensity of human activity.

3.2.4. Results of the Intensity of Human Activity Spatial Differentiation Risk Detector

The most suitable range or type of influencing factors for the intensity of human activity in Inner Mongolia was analyzed using the risk detector method. The results of each factor passed the statistical test at a 95% confidence, and the mean values of the intensity of human activity differed significantly among the different influencing factors (Table 7 and Figure 15).
As shown in Figure 14, the area (Subarea 5) with the farthest urban distance (X1) has a negative value for the change in the intensity of human activity, indicating that the farther the distance from the central city, the weaker the trend of variation in the intensity of human activity. The areas with the fastest change in traffic conditions (Subarea 1) also have the greatest change in human activity intensity, while the areas with relatively weak traffic conditions do not have significant changes in the intensity of human activity. The area with the highest density of settlements presented the largest change in the intensity of human activity (Subarea 5). The intensity of human activity decreased as the density of settlements decreased, indicating that the density of settlements had a certain contribution to the change in the regional intensity of human activity. With the increasing density of the water network, the change in the intensity of human activity increased first and then decreased, reaching the highest level when the density of the water system was between 0.143 and 0.231 km/km2 (Subarea 3). The Inner Mongolia region is located deep in the Eurasian continent, and its main precipitation source is the southeastern airflow carrying water vapor from the Pacific Ocean. The spatial distribution of the water system density in the study area was generally consistent with that of the precipitation. Since the study area was blocked by the Helan Mountains and the Yinshan Mountains to the west and by the Hinggan to the north, a small and unevenly distributed precipitation resource was formed. The spatial distribution of the water network density was highly consistent with economic and social development. The elevation range of the areas corresponding to an obvious improvement in the intensity of human activity is between 89 and 498 m (Subarea 1). These areas are mainly concentrated in relatively flat terrain, and such areas provide sites for human living and production activities. The average annual precipitation in the regions with high variation in the intensity of human activity ranges from 330–429 mm (Subarea 4), and the regions with less precipitation have little variation in the intensity of human activity. The topographic relief in the areas with high variation in the intensity of human activity ranges from 0.2 to 0.4 (Subarea 2), and a higher value of topographic relief indicates a dryer and hotter growing environment. The areas with more significant variation in the intensity of human activity have less topographic relief, indicating better growing conditions in these areas. The regions with the highest livestock density, population density, and GDP per capita showed the highest changes in the intensity of human activity (Subarea 5, Subarea 4, and Subarea 5). There was a linear positive correlation between the intensity of human activity and livestock density, GDP per capita, and population density, indicating that the livestock density and GDP per capita contributed to the regional changes in the intensity of human activity.
The change in the intensity of human activity is most obvious in areas with urbanization development, agro-ecological areas, and areas with rich mineral resources. The main functional area plays a basic institutional role in the process of land development. Promoting the construction of main functional areas is a major strategic decision made by the Chinese government, which is crucial to achieving a balanced development of the economy and protection of the ecological environment. The planning of major-function-oriented zoning is based on the bearing capacity of resources and the environment, existing development intensity, and future development potential of different areas. Additionally, whether and how to carry out highe-level and high-intensity industrialized urbanized development is considered. Urbanized development areas are among the areas that provide industrial goods and services and are also among the areas with the highest intensity of human activities.

4. Discussion

This paper adopts the concept of intensity of human activity proposed by Xu Yong et al., that is, the extent of human activities of land surface utilization, modification, and exploitation in a certain region [30]. On this basis, a model is constructed to measure the intensity of human activities in the region using the percentage of the area construction land equivalent out of the total regional land area. Land use is the most direct manifestation of human disturbance, and in recent years, land use and grassland vegetation have been the hot spots of the research related to the geology of the Mongolian Plateau [38,39]. The intensity of human activity correlates with population. In general, the research on the change in the intensity of human activity has achieved much progress, but there are still many shortcomings in the construction of the evaluation index systems and evaluation methods. The intensity of human activities involves multiple factors such as nature, humanities, technology, industrial type, and development stage. However, it does not consider the current mode of human activities, such as grassland degradation caused by overgrazing of grassland or environmental degradation caused by backward industrial technology with high energy consumption and high pollution.

4.1. The Impact of Government Policy on the Intensity of Human Activity Changes

Relevant national and regional policies have a significant impact on the changes in regional land-use types and the intensity of human activity, indicating that policy institutions play a key role in shaping land use. The previous research on the impact of policies on the regional ecological environment can be summarized in terms of two aspects [40,41]: (1) positive effects brought about by policies, such as the prevention of the deterioration of regional ecological environments to a certain extent; (2) negative effects brought about by policies such as the occupation of ecological spaces by urbanization and industrial development and the increasingly prominent role of people in regional development. Therefore, it is important to consider the influences of policy at different levels when studying the drivers of spatiotemporal variation in the intensity of human activity in Inner Mongolia. This paper investigates the major land-use policies after 2000 to provide support for fully analyzing the factors influencing the spatiotemporal changes in the intensity of human activity in the study area (Figure 16).
Relevant studies have demonstrated the suppressive effect of policies on the intensification of regional human activity [42]. Since 2000, a series of ecological protection engineering policies have been implemented in the study area, such as the Beijing–Tianjin Sand Source Control Engineering Project (BTSSC), Return Grazing to Grassland Program (RGGP), and Fencing Grassland and Moving Users (FGMU). These policies have an important role in the change in the land-use structure in the region. This is shown by the increase in forest land area, the decrease in desert and unused land area, the conversion of arable land and desert to grassland, the optimization of land-use structure, and the improvement in the regional ecological environment. The implementation of engineering policies in the region has achieved phased results. For instance, the RGGP Project, which was implemented during 1999–2010, has achieved significant progress in wind and sand control. The BTSSC Project is a major ecological project implemented to curb the trend of land desertification in Beijing and the surrounding areas, and it has improved the atmospheric environment in the Beijing–Tianjin region. In addition, it has been found that the project has been significantly effective in improving the vegetation, ecosystem, ecological quality, and services in the Beijing–Tianjin Wind and Sand Source area [43,44].
Since the implementation of the “Western Development” strategy in 2000, the government has introduced a series of policies in urban construction, land management, and infrastructure construction that have led to rapid urbanization and industrialization in Inner Mongolia. The land is one of the core elements in the development of urbanization. In the process of rapid urbanization and industrialization, the area of urban construction land has been constantly expanding, and other types of land are being occupied. According to the research results of Dong et al., the spatial changes to production and life in Inner Mongolia have led to the rapid increase in the level of urbanization and industrialization [45]. In the 21st century, Inner Mongolia has experienced continuous and rapid social and economic development. With the rapid increase in the level of urbanization, the proportion of the urban and rural population in Inner Mongolia has been increasing, and by 2020, the urbanization rate of the resident population in Inner Mongolia reached 67.48% (the data were obtained from the seventh census in 2020). The growth rate of the urbanization rate between 2000 and 2010 was 3.9%, but the rate between 2010 and 2020 was as high as 52.16%. The average annual growth rate of the urbanization rate between 2000 and 2020 was 15.71%, while the rates between 2000 and 2010 and 2010 and 2020 were, respectively, 4.75% and 33.05% (Figure 17).
Due to rapid urbanization and industrialization, the ecological environment of Inner Mongolia has suffered serious damage, which seriously affects the process of sustainable socio-economic development of the region. Since the 18th Party Congress, the construction of ecological civilization has been a prominent priority in the government’s work. Additionally, the government has responded positively to the national main function zoning, planning of three zones and three lines, ecological restoration of the national land space, and other spatial governance work. A total of more than 83 billion yuan has been invested to implement national key ecological projects such as the protection of natural forest resources, control of Beijing–Tianjin wind and sand sources, “Three Norths” protective forest, and returning farmland to forest and grass. In particular, due to the grassland ecological compensation policy, the ecological environment has been transformed into an overall containment and local improvement.

4.2. The Impact of Mineral Resource Mining on the Changes in the Intensity of Human Activity

The Inner Mongolia Autonomous Region is rich in coal resources. It ranks first in China with 732.3 billion tons of proven coal reserves and ranks second in China in prospective forecast coal reserves. The coal resources in Inner Mongolia are mainly concentrated in two major areas, one of which is the low metamorphic bituminous coal area dominated by Erdos city, and the other is the lignite coal area distributed in the eastern part of the study area (Figure 18). Along with the industrialization process based on the high level of exploitation of coal resources in Inner Mongolia, a series of problems and conflicts, such as environmental pollution and ecological damage, have become increasingly acute. Many scholars have focused on the issue of mineral resource exploitation and ecological degradation, and they have concluded that the surface coal mining process encroaches on high-level ecological space and poses a serious threat to the ecological environment [46,47]. It is worth mentioning that Inner Mongolia is home to the world’s largest “open-pit coal mine”. There are five major open-pit coal mines in China, four of which are located in Inner Mongolia, namely in Yimin, Huolinhe, Yuanbaoshan, and Jungar. Surface coal mining is an activity in which coal is easily extracted by open-pit mining because of the shallow coal seams. Unlike underground mining, surface mining removes the overburden from the ore body before mining, which causes serious damage to the surface soil and the original ecological vegetation. In particular, open-pit mining on grasslands can cause especially serious ecological damage. To pursue economic benefits, mining enterprises are continuing to expand their mining areas. It can be seen from the remote-sensing map of the major mining areas that the mining areas are rapidly expanding. For example, in the open-pit coal mining area in Xilinhot City, the mining operation area was 670.8 hm2 in 2005 and reached 6722.19 hm2 in 2015 [48]. Furthermore, the high level of mining of mineral resources has produced an increase in the urbanization of the population; for example, Bayanhua town and other cities have grown due to coal. In summary, the exploitation of coal resources plays an important role in the regional changes in land use, which results in the reduction of ecological space, the expansion of living and production spaces, and finally, the increasing intensity of regional human activities.

4.3. The Changes in the Intensity of Human Activities at the Farming and Grazing Household Level

Changes in the intensity of human activities are a result of the evolution and differentiation of the human–land system. The change in the regional intensity of human activity is essentially caused by the evolution and divergence of the territorial system of human–land relations and is related to climate change and related policies. This article contains relatively detailed analyses of the changes in the intensity of human activity at the league, county, and pixel levels, but changes in the intensity of human activity at the farming and grazing household levels were not investigated. Farming and grazing households are the micro-subjects of agricultural and pastoral production. They are not only economic organizations but also organizations that play certain social functions. In the typical grassland areas of Inner Mongolia, with the emergence of family ranching, nomadic herding has been gradually replaced, and herding households have formed a complex system involving multiple dimensions such as the environment, resources, economy, society, and management. Grassland pastoral units are the smallest ecological cells in grassland settlement ecosystems. Therefore, a more accurate explanation of land-use degradation and the driving forces of regional changes in the intensity of human activity can only be achieved by focusing on the basic cells of the agro-pastoral production process (Figure 19).

5. Conclusions

This study reveals the spatiotemporal evolution patterns in the intensity of human activity and its influencing factors based on land-use data of Inner Mongolia from 2000 to 2020. The following main conclusions are drawn: (1) Over the past 20 years, there has been a clear temporal and spatial change in land use, and the living and production spaces in Inner Mongolia have expanded. (2) The areas with a high intensity of human activities in Inner Mongolia are mainly concentrated south of the Greater Hinggan–Yinshan–Helan Mountains. The intensity of human activities has shown increases from 2000 to 2020, and the diffusion effect is gradually shown in the proximity of local areas. (3) There are differences in the impact of the influencing factors on changes in the intensity of human activity. Livestock density, multi-year average precipitation conditions, and population density are the main factors affecting the spatial distribution of the changes in the intensity of human activity. (4) Various factors influence the change in the intensity of human activity based on a combination of natural and socio-economic factors. Different influencing factors interact with each other, and the combined influence of any two influencing factors is greater than any single factor. Furthermore, the influence on the change in the intensity of human activity is non-linearly enhanced or enhanced by bifactors. (5) Some of the influencing factors have a significant differential impact on the change in the intensity of human activity, and the mean value of the change in the intensity of human activity for different types or ranges of influencing factors is significantly different.
Due to the availability of data, the factors influencing the change in the intensity of human activity selected in this paper may not be comprehensive. In future research, some natural, socio-economic, and policy-related factors will be considered to construct a relatively complete index system of impact factors to comprehensively identify the mechanisms of changes in the intensity of human activity. These results can provide a scientific basis for spatial planning of land, ecological civilization, and the construction of the beautiful region of Inner Mongolia. In addition, we will improve the spatial resolution of remote-sensing data, obtain detailed land-use change data, and improve the classification system and grading criteria of the intensity of human activity so as to discover the real state of the intensity of human activity in the study area.

Author Contributions

All authors contributed significantly to this manuscript. B.T. was responsible for the original idea and the theoretical aspects of the paper; Z.D. was responsible for the data collection and preprocessing, T.Y. was responsible for the methodology design, and R.A. drafted the manuscript. All authors have read and agreed to the published version of the manuscript.

Funding

This study was supported by the National Natural Science Foundation of China (No. 42001127, 41901143), the Inner Mongolia Social Science Planning Project (2019NDC097), and the Research Foundation for Advanced Talents of Inner Mongolia Normal University (2018YJRC007).

Institutional Review Board Statement

Not applicable.

Informed Consent Statement

Not applicable.

Data Availability Statement

Not applicable.

Acknowledgments

We thank the Data Center for Resources and Environmental Sciences, Chinese Academy of Sciences (RESDS, http://www.resdc.cn (accessed on 24 January 2021)) for providing the land-use data set.

Conflicts of Interest

The authors declare no conflict of interest.

References

  1. Qin, D.H. Climate change science and sustainable development. Prog. Geogr. 2014, 33, 874–883. [Google Scholar]
  2. Wen, Y. Preliminary discussion on quantitative evaluation method of human activity intensity. Sci. Soc. 1998, 4, 56–61. Available online: https://kns.cnki.net/kns8/defaultresult/index (accessed on 2 March 2022).
  3. Peng, K.; Zhang, Y.F.; Gao, W.F.; Lu, Z. Evaluation of human activity intensity in geological environment problems of Ji’nan City. Eur. J. Remote Sens. 2020, 54, 117–121. [Google Scholar] [CrossRef]
  4. Gao, W.W.; Zeng, Y.; Liu, Y.L.; Wu, B.F. Human Activity Intensity Assessment by Remote Sensing in the Water Source Area of the Middle Route of the South-to-North Water Diversion Project in China. Sustainability 2019, 11, 5670. [Google Scholar] [CrossRef] [Green Version]
  5. Liu, S.; Liu, L.; Wu, X.; Hou, X.; Zhao, S.; Liu, G. Quantitative evaluation of human activity intensity on the regional ecological impact studies. Acta Ecol. Sin. 2018, 38, 6797–6809. [Google Scholar]
  6. Mooney, H.A.; Duraiappah, A.; Larigauderie, A. Evolution of natural and social science interactions in global change research programs. Proc. Natl. Acad. Sci. USA 2013, 110, 3665–3672. [Google Scholar] [CrossRef] [Green Version]
  7. Janus, J.; Bozek, P. Land abandonment in Poland after the collapse of socialism: Over a quarter of a century of increasing tree cover on agricultural land. Ecol. Eng. 2019, 138, 106–117. [Google Scholar] [CrossRef]
  8. Cai, Y.L. A study on Land Use/Cover Change: The Need for a New Integrated Approach. Geogr. Res. 2001, 20, 645–652. [Google Scholar]
  9. Li, P.; Li, X.B.; Liu, X.J. Macro- analysis on the driving forces of the land- use change in China. Geogr. Res. 2001, 20, 129–138. [Google Scholar]
  10. Ning, J.; Liu, J.; Kaung, W.; Xu, X.; Zhang, S.; Yan, C.; Li, R.; Wu, S.; Hu, Y.; Du, G.; et al. Spatiotemporal Patterns and Characteristics of Land-Use Change in China During 2010–2015. J. Geogr. Sci. 2018, 28, 547–562. [Google Scholar] [CrossRef] [Green Version]
  11. Li, Y.; Xiao, L.M.; Hu, W.M.; Yi, M.; Xie, Y.Z. Spatiotemporal Pattern of Land Use Change in Changsha-Zhuzhou-Xiangtan Core Areas and Its Driving Forces. Econ. Geogr. 2021, 41, 173–182. [Google Scholar]
  12. Mitsova, D.; Shuster, W.; Wang, X. A cellular automata model of land cover change to integrate urban growth with open space conservation. Landsc. Urban Plan. 2011, 99, 141–153. [Google Scholar] [CrossRef]
  13. Hu, Y.F.; Batu, N.C.; Zhen, L.; Zhuang, D.F. Assessment of Land-Use and Land-Cover Change in Guangxi, China. Sci. Rep. 2019, 9, 2189. [Google Scholar] [CrossRef] [PubMed] [Green Version]
  14. Teng, M.; Zeng, L.; Hu, W.; Wang, P.; Yan, Z.; He, W.; Zhang, Y.; Huang, Z.; Xiao, W. The impacts of climate changes and human activities on net primary productivity vary across an ecotone zone in Northwest China. Sci. Total Environ. 2020, 714, 136691. [Google Scholar] [CrossRef]
  15. Zhang, D.; Zhang, Q.; Qiu, J.; Bai, P.; Liang, K.; Li, X. Intensification of hydrological drought due to human activity in the middle reaches of the Yangtze River, China. Sci. Total Environ. 2018, 637–638, 1432–1442. [Google Scholar] [CrossRef]
  16. Yao, J.; Zhang, Q.; Ye, X.; Zhang, D.; Bai, P. Quantifying the impact of bathymetric changes on the hydrological regimes in a large floodplain lake: Poyang Lake. J. Hydrol. 2018, 561, 711–723. [Google Scholar] [CrossRef]
  17. Li, X.Y.; Wang, L.X.; Zhang, Y.S. Analysis of roles of human activities in land desertification in arid area of Northwest China. Sci. Geogr. Sin. 2004, 24, 68–75. [Google Scholar]
  18. Zhu, W.J.; Han, M.; Kong, X.L.; Li, Y.L.; Kong, F.B.; Wei, F.; Rong, J.H. Spatiotemporal Characteristics of Human Activity Intensity and Its Driving Factors in the Yellow River Delta from 1990 to 2018. Res. Soil Water Conserv. 2021, 28, 287–292. [Google Scholar]
  19. Fu, G.J.; Xu, H.L.; Chen, W.T. Effect of Human Activities on Natural Ecology in Hainan Province. Res. Environ. Sci. 2007, 6, 61–66. [Google Scholar]
  20. Zhou, T.; Chen, W.X.; Li, J.F.; Liang, J.L. Spatial relationship between human activities and habitat quality in Shennongjia Forest Region from 1995 to 2015. Acta Ecol. Sin. 2021, 41, 6134–6145. [Google Scholar]
  21. Song, Y.; Chen, B.; Kwan, M.-P. How does urban expansion impact people’s exposure to green environments? A comparative study of 290 Chinese cities. J. Clean. Prod. 2020, 246, 119018. [Google Scholar] [CrossRef]
  22. Pathirana, A.; Denekew, H.B.; Veerbeek, W.; Zevenbergen, C.; Banda, A.T. Impact of urban growth-driven landuse change on microclimate and extreme precipitation—A sensitivity study. Atmos. Res. 2014, 138, 59–72. [Google Scholar] [CrossRef]
  23. He, D.; Zhou, J.; Cai, J.M.; Chen, Z.X. Analysis of land use and landscape pattern changes on the areas along the high-speed railway in China. Ecol. Sci. 2021, 40, 184–194. [Google Scholar]
  24. Liu, F.; Yu, K.; Zhang, J.L.; Guo, W.Y.; Yin, S.Q. Temporal and Spatial Variations of Land Uses and Their Influences on Ecosystem Service Values around the Opencast Coal Mining Area of East Junggar Basin in Xinjiang. Ecol. Econ. 2021, 37, 169–175. [Google Scholar]
  25. Gao, X.; Shen, J.; He, W.; Zhao, X.; Li, Z.; Hu, W.; Wang, J.; Ren, Y.; Zhang, X. Spatial-temporal analysis of ecosystem services value and research on ecological compensation in Taihu Lake Basin of Jiangsu Province in China from 2005 to 2018. J. Clean. Prod. 2021, 317, 128241. [Google Scholar] [CrossRef]
  26. Song, J.; Yang, Z.; Xia, J.; Cheng, D. The impact of mining-related human activities on runoff in northern Shaanxi, China. J. Hydrol. 2021, 598, 126235. [Google Scholar] [CrossRef]
  27. Chen, J.; Chen, J.; Liao, A. Remote Sensing Mapping of Global Land Cover; Science Press: Beijing, China, 2016. [Google Scholar]
  28. Shi, X.; Nie, S.; Ju, W.; Yu, L. Climate effects of the GlobeLand30 land cover dataset on the Beijing Climate Center climate model simulations. Sci. China Earth Sci. 2016, 59, 1754–1764. [Google Scholar] [CrossRef]
  29. Cao, X.; Chen, J.; Chen, L.; Liao, A.; Sun, F.; Li, Y.; Li, L.; Lin, Z.; Pang, Z.; Chen, J.; et al. Preliminary analysis of spatiotemporal pattern of global land surface water. Sci. China Earth Sci. 2014, 57, 2330–2339. [Google Scholar] [CrossRef]
  30. Xu, Y.; Sun, X.; Tang, Q. Human activity intensity of land surface: Concept, method and application in China. Acta Geogr. Sin. 2015, 70, 1068–1079. [Google Scholar] [CrossRef]
  31. Getis, A.; Ord, J.K. The analysis of spatia1 association by the use of distance statistics. Geogr. Anal. 1992, 24, 189–206. [Google Scholar] [CrossRef]
  32. Wang, J.F.; Xu, C.D. Geodetector: Principle and prospective. Acta Geogr. Sin. 2017, 72, 116–134. [Google Scholar]
  33. Yu, G.L.; Li, J.H.; Sun, J.X. Research on BMI influencing factors of urban male adolescents in China based on geographical detector. Geogr. Res. 2019, 38, 2288–2301. [Google Scholar]
  34. Ding, Y.; Cai, J.M.; Ren, Z.P. Spatial disparities of economic growth rate of China’s National level ETDZs and their determinants based on geographical detector analysis. Prog. Geogr. 2014, 33, 657–666. [Google Scholar]
  35. Song, Y.; Chen, B.; Ho, H.C.; Kwan, M.-P.; Liu, D.; Wang, F.; Wang, J.; Cai, J.; Li, X.; Xu, Y.; et al. Observed inequality in urban greenspace exposure in China. Environ. Int. 2021, 156, 106778. [Google Scholar] [CrossRef]
  36. National Bureau of Statistics of the People’s Republic of China. Inner Mongolia Autonomous Region Statistical Yearbook; China Statistics Press: Beijing, China, 2020.
  37. National Bureau of Statistics of the People’s Republic of China. China Statistical Yearbook; China Statistics Press: Beijing, China, 2020.
  38. Wang, X.; Li, F.Y.; Tang, K.; Wang, Y.; Suri, G.; Bai, Z.; Baoyin, T. Land use alters relationships of grassland productivity with plant and arthropod diversity in Inner Mongolian grassland. Ecol. Appl. 2020, 30, e02052. [Google Scholar] [CrossRef]
  39. Nendel, C.; Hu, Y.; Lakes, T. Land-use change and land degradation on the Mongolian Plateau from 1975 to 2015—A case study from Xilingol, China. Land Degrad. Dev. 2018, 29, 1595–1606. [Google Scholar] [CrossRef]
  40. Chen, G.; Wang, M.; Liu, Z.; Chi, W. The Biogeophysical Effects of Revegetation around Mining Areas: A Case Study of Dongsheng Mining Areas in Inner Mongolia. Sustainability 2017, 9, 628. [Google Scholar] [CrossRef] [Green Version]
  41. Lambin, E.F.; Geist, H.J.; Lepers, E. Dynamics of Land-Use and Land-Cover Change in Tropical Regions. Annu. Rev. Environ. Resour. 2003, 28, 205–241. [Google Scholar] [CrossRef] [Green Version]
  42. Hu, Y.; Nacun, B. An Analysis of Land-Use Change and Grassland Degradation from a Policy Perspective in Inner Mongolia, China, 1990–2015. Sustainability 2018, 10, 4048. [Google Scholar] [CrossRef] [Green Version]
  43. Zhang, B.; Li, Q.-X.; Wang, S.; Xie, G.-D. Spatial-temporal changes and regional differences of the sand-fixing service in the Beijing-Tianjin sandstorm source region. J. Nat. Resour. 2019, 34, 1041–1053. [Google Scholar] [CrossRef]
  44. Wu, D.; Gong, G.L.; Shao, Q.Q.; Cao, W. Ecological Effects Assessment of Beijing and Tianjin Sandstorm Source Control Project. J. Arid. Land Resour. Environ. 2016, 30, 117–123. [Google Scholar]
  45. Dong, Z.; Zhang, J.; Si, A.; Tong, Z.; Na, L. Multidimensional Analysis of the Spatiotemporal Variations in Ecological, Production and Living Spaces of Inner Mongolia and an Identification of Driving Forces. Sustainability 2020, 12, 7964. [Google Scholar] [CrossRef]
  46. Ma, Q.; He, C.; Fang, X. A rapid method for quantifying landscape-scale vegetation disturbances by surface coal mining in arid and semiarid regions. Landsc. Ecol. 2018, 33, 2061–2070. [Google Scholar] [CrossRef]
  47. Ah, R.; Bi, Q.G.; Dong, Z.H. Change of grassland vegetation and driving factors based on MODIS/NDVI in Xilingol, China. Resour. Sci. 2019, 41, 1374–1386. [Google Scholar]
  48. Guan, C.Z.; Zhang, B.L.; Zhao, J.L.; Li, J.N. Analysis on Land Use Disturbances of Surface Coal Mining in Xilinhot. Environ. Monit. Forewarning 2017, 9, 14–18. [Google Scholar]
Figure 1. The mountain ranges, elevation, steppe types, and location of Inner Mongolia.
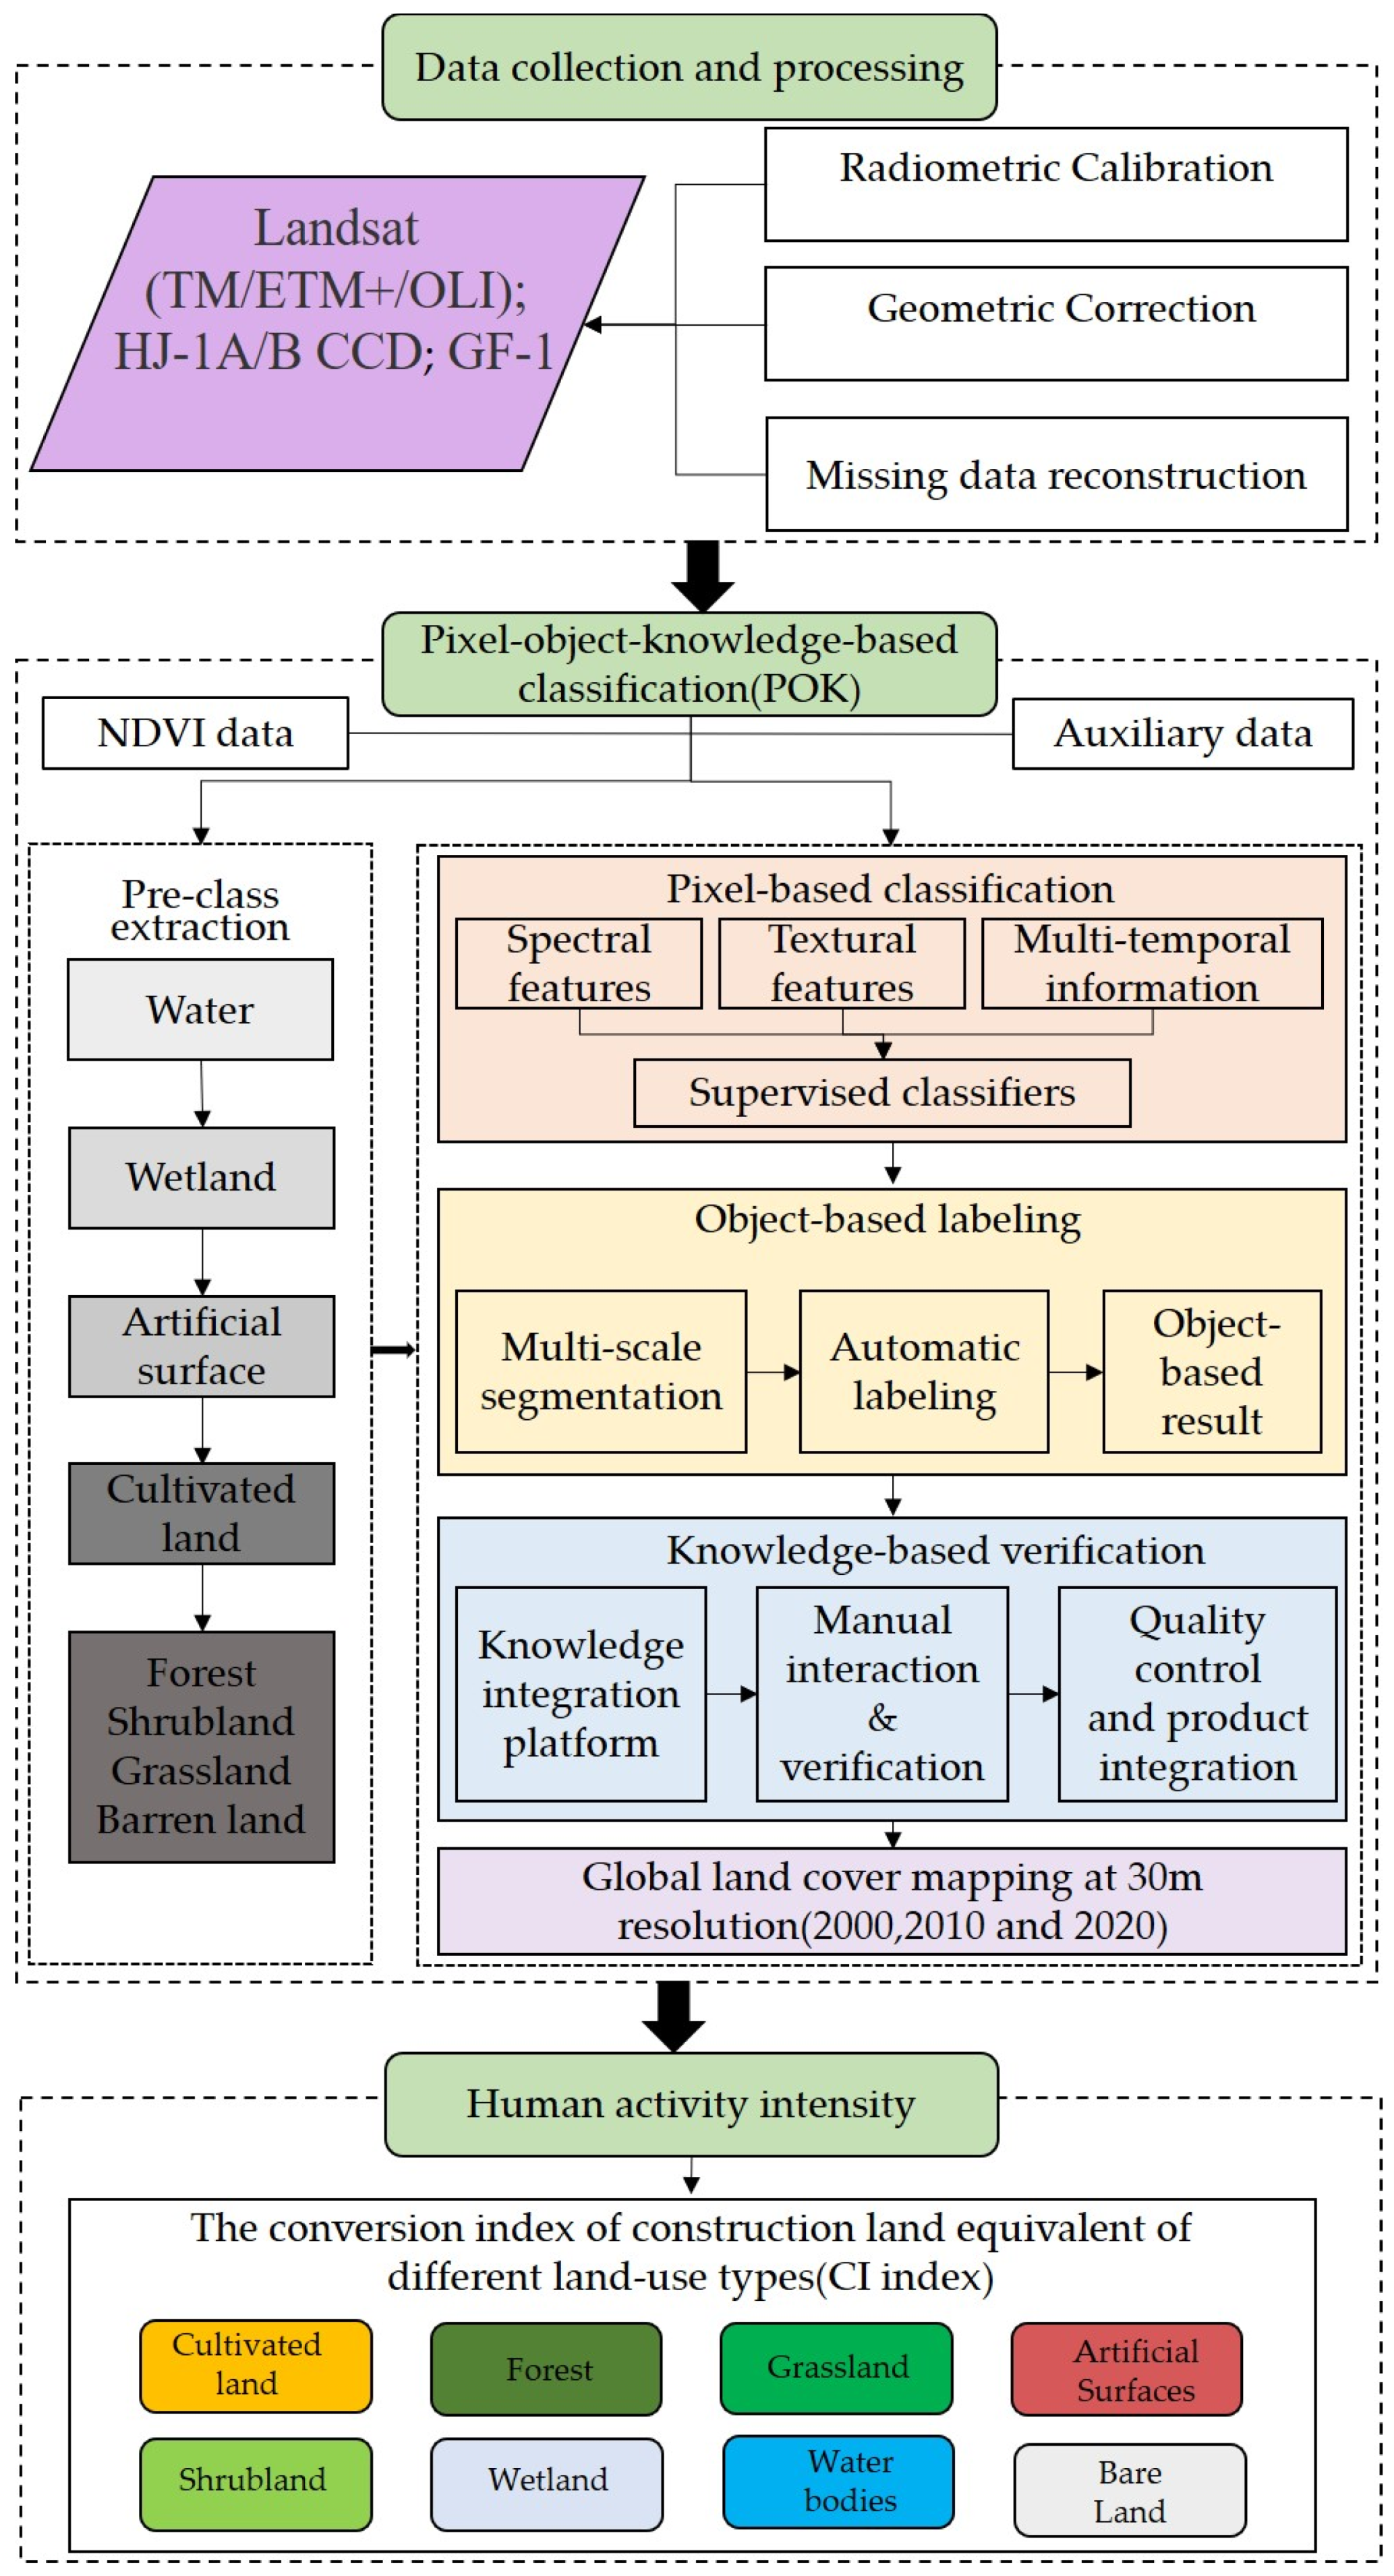
Sustainability 14 06252 g001
Figure 2. The flowchart of GlobeLand30 land-use raster data generation and the calculation process of the intensity of human activity index.
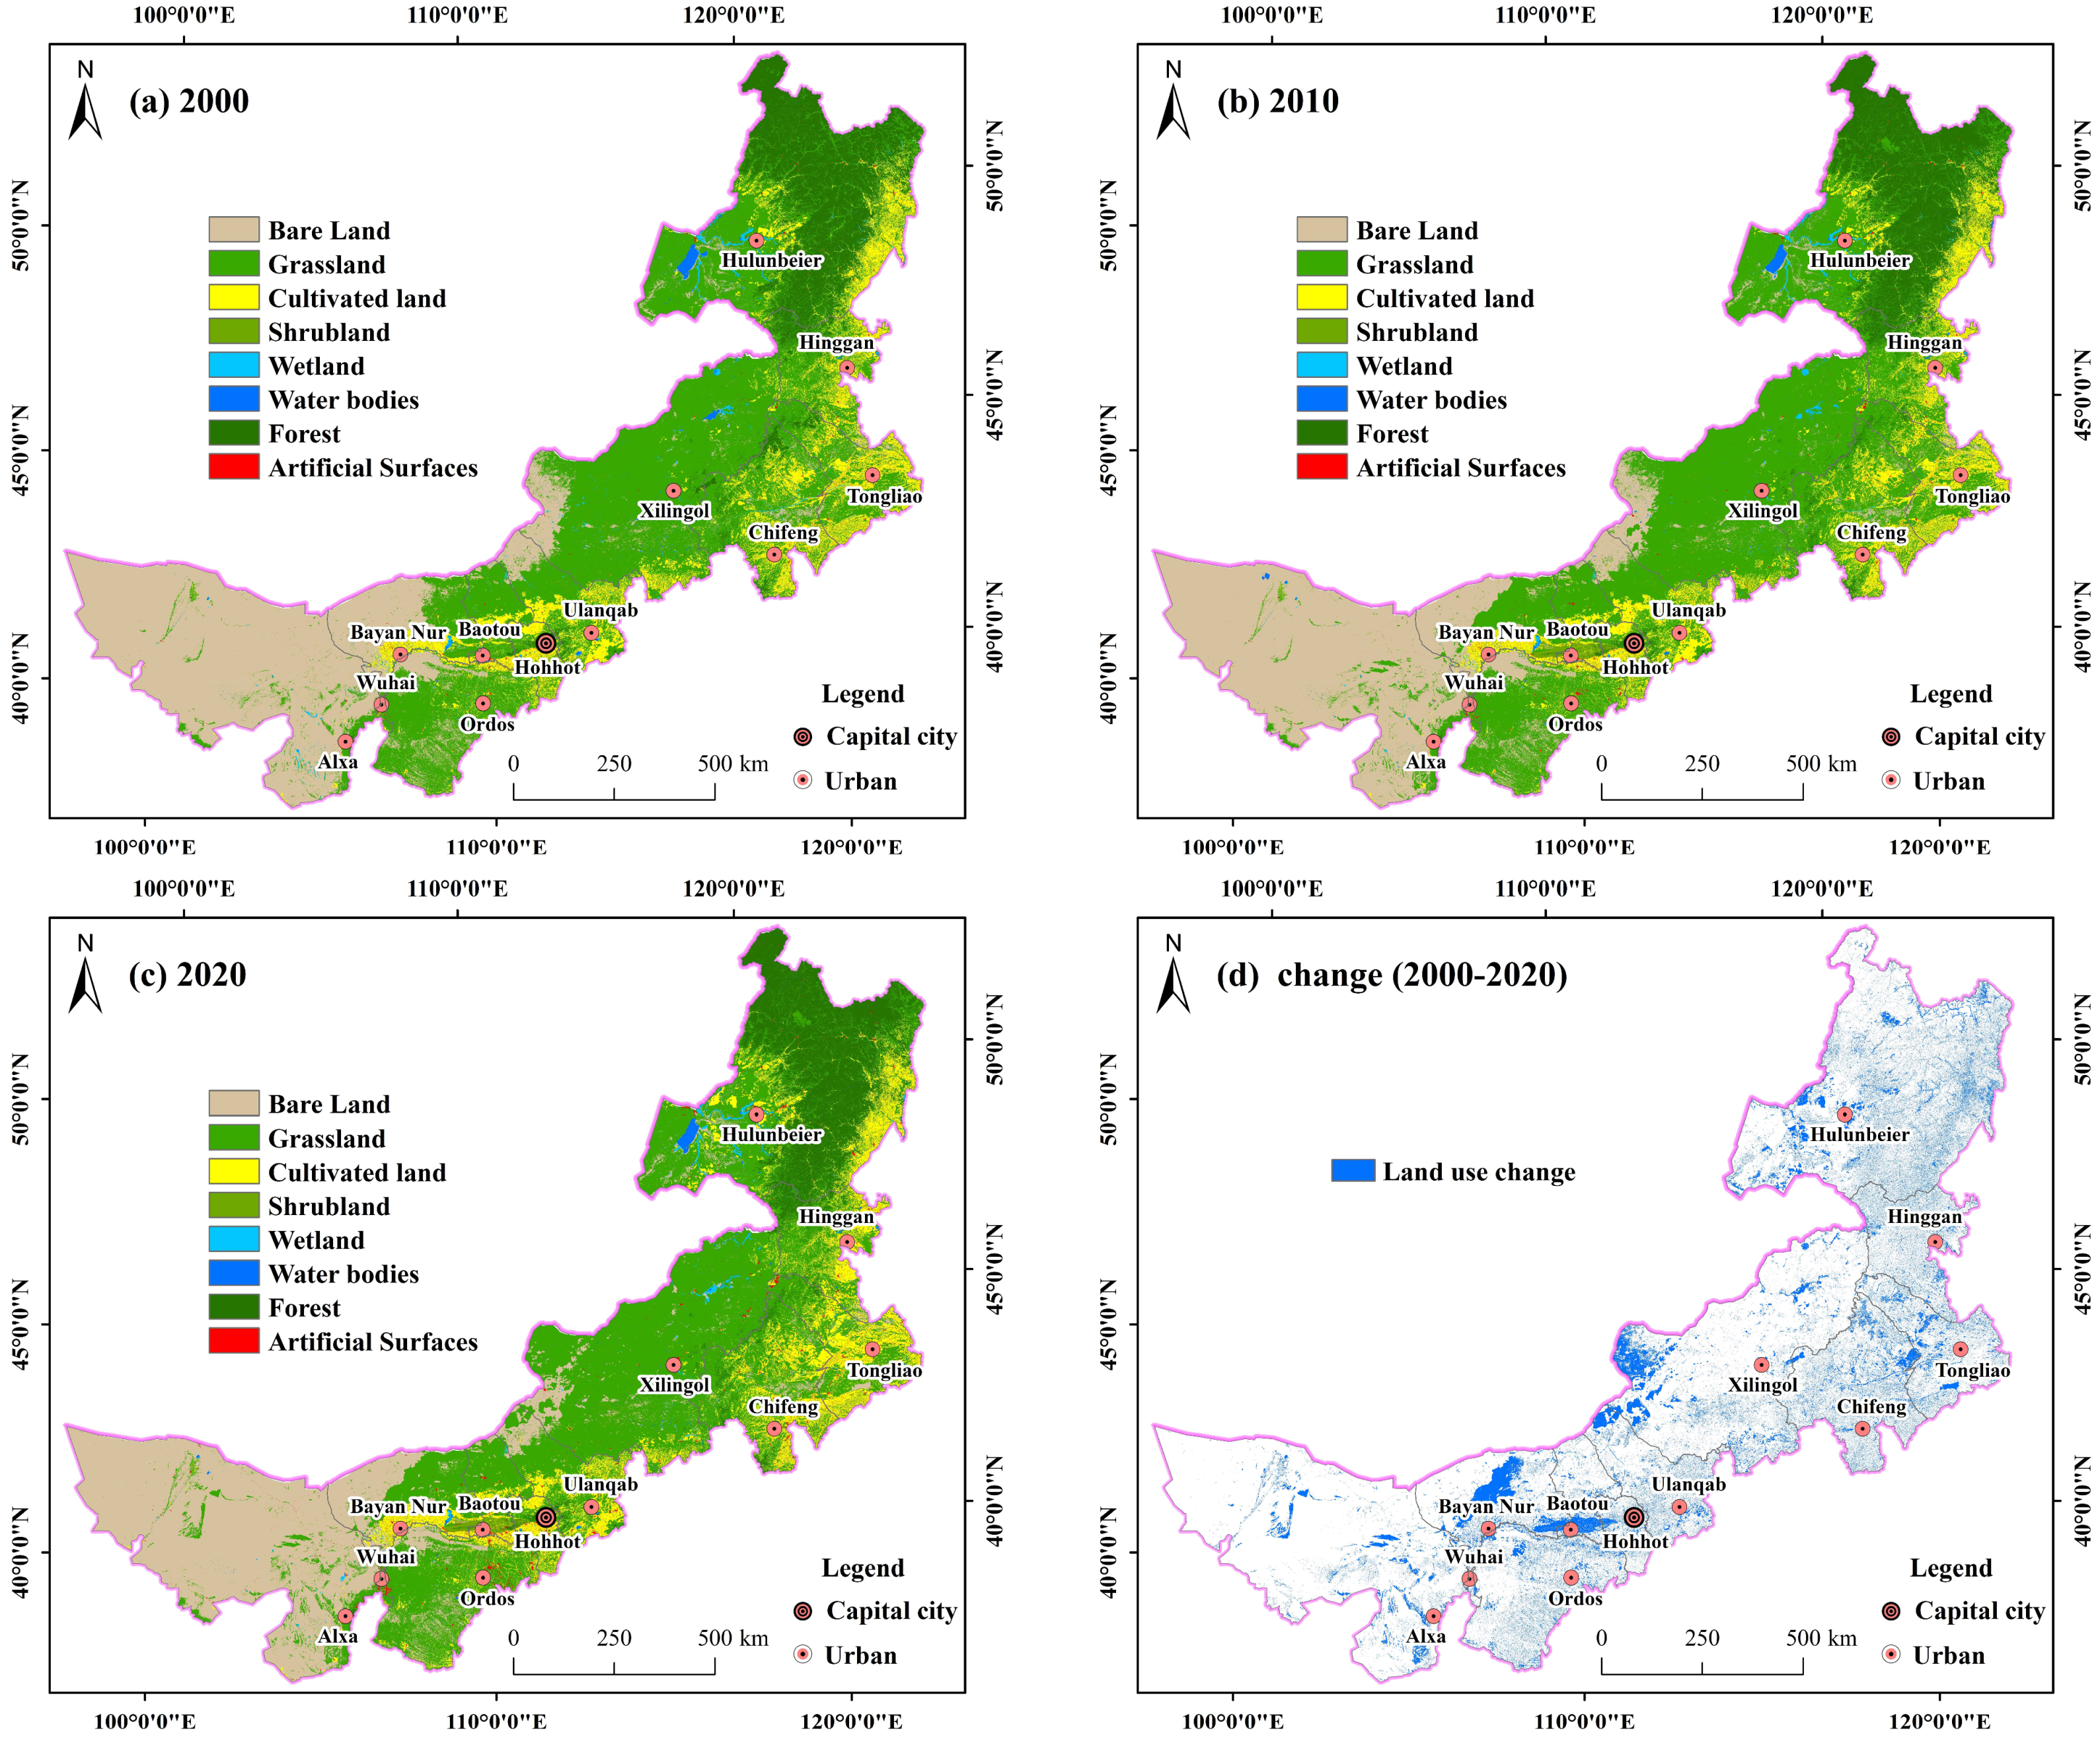
Sustainability 14 06252 g002
Figure 3. The spatial distribution of land-use types and the change in Inner Mongolia (2000–2020). (The spatial distribution of land-use types in (a) 2000, (b) 2010, and (c) 2020; and (d) the changes from 2000 to 2020 in Inner Mongolia).
Sustainability 14 06252 g003
Figure 4. The change in area of land-use types in Inner Mongolia (2010–2000 and 2020–2010).
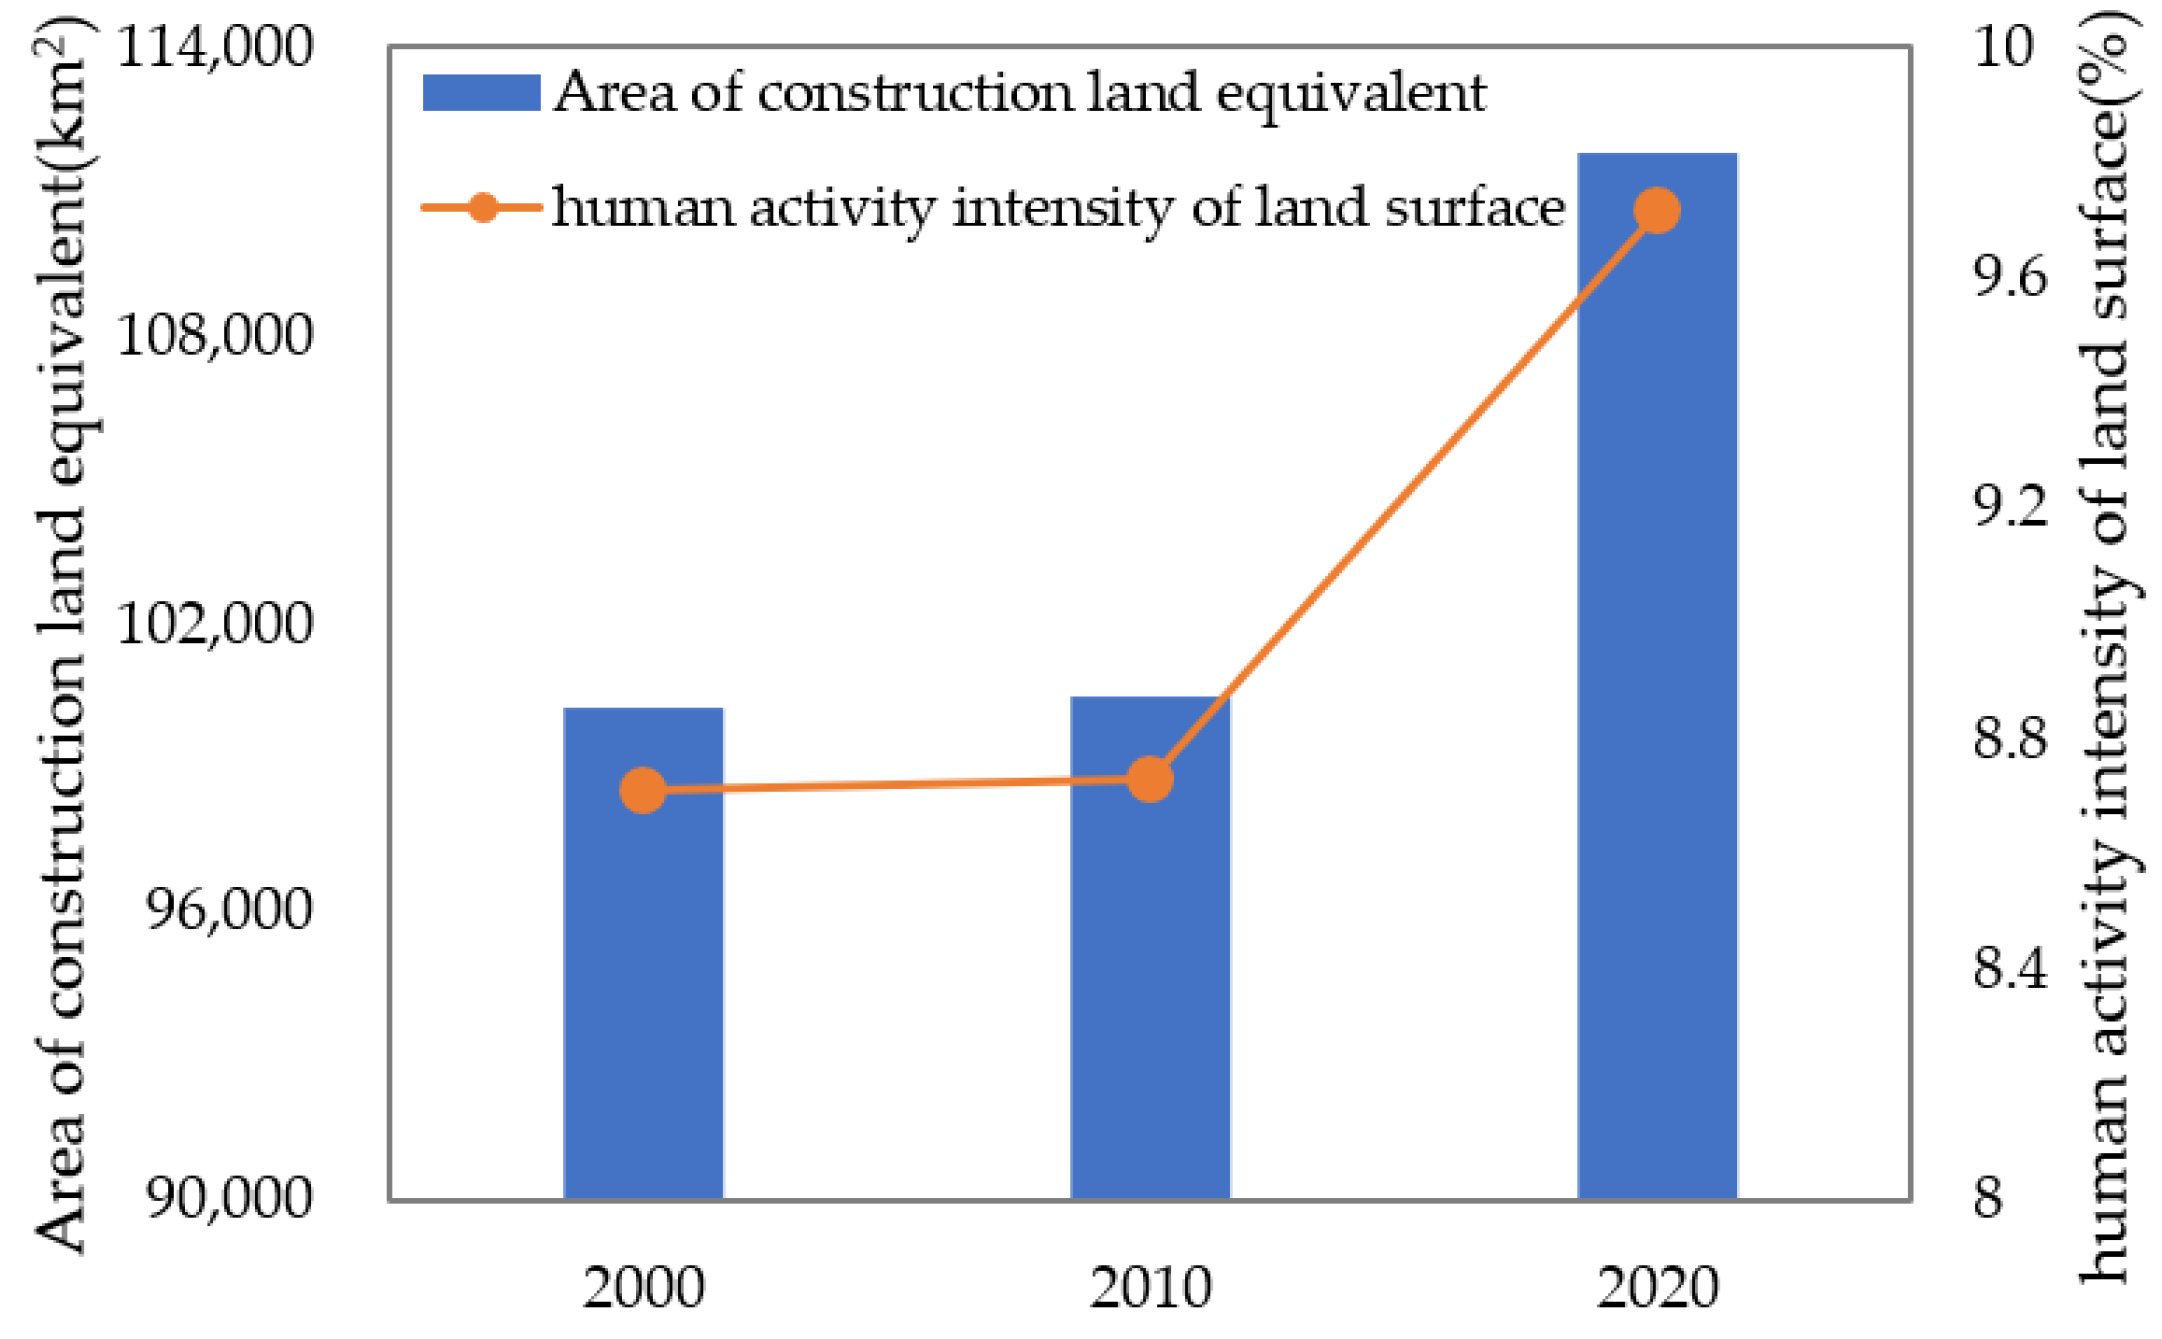
Sustainability 14 06252 g004
Figure 5. Changes in the equivalent area of construction land and the intensity of human activity of Inner Mongolia, 2000–2020.
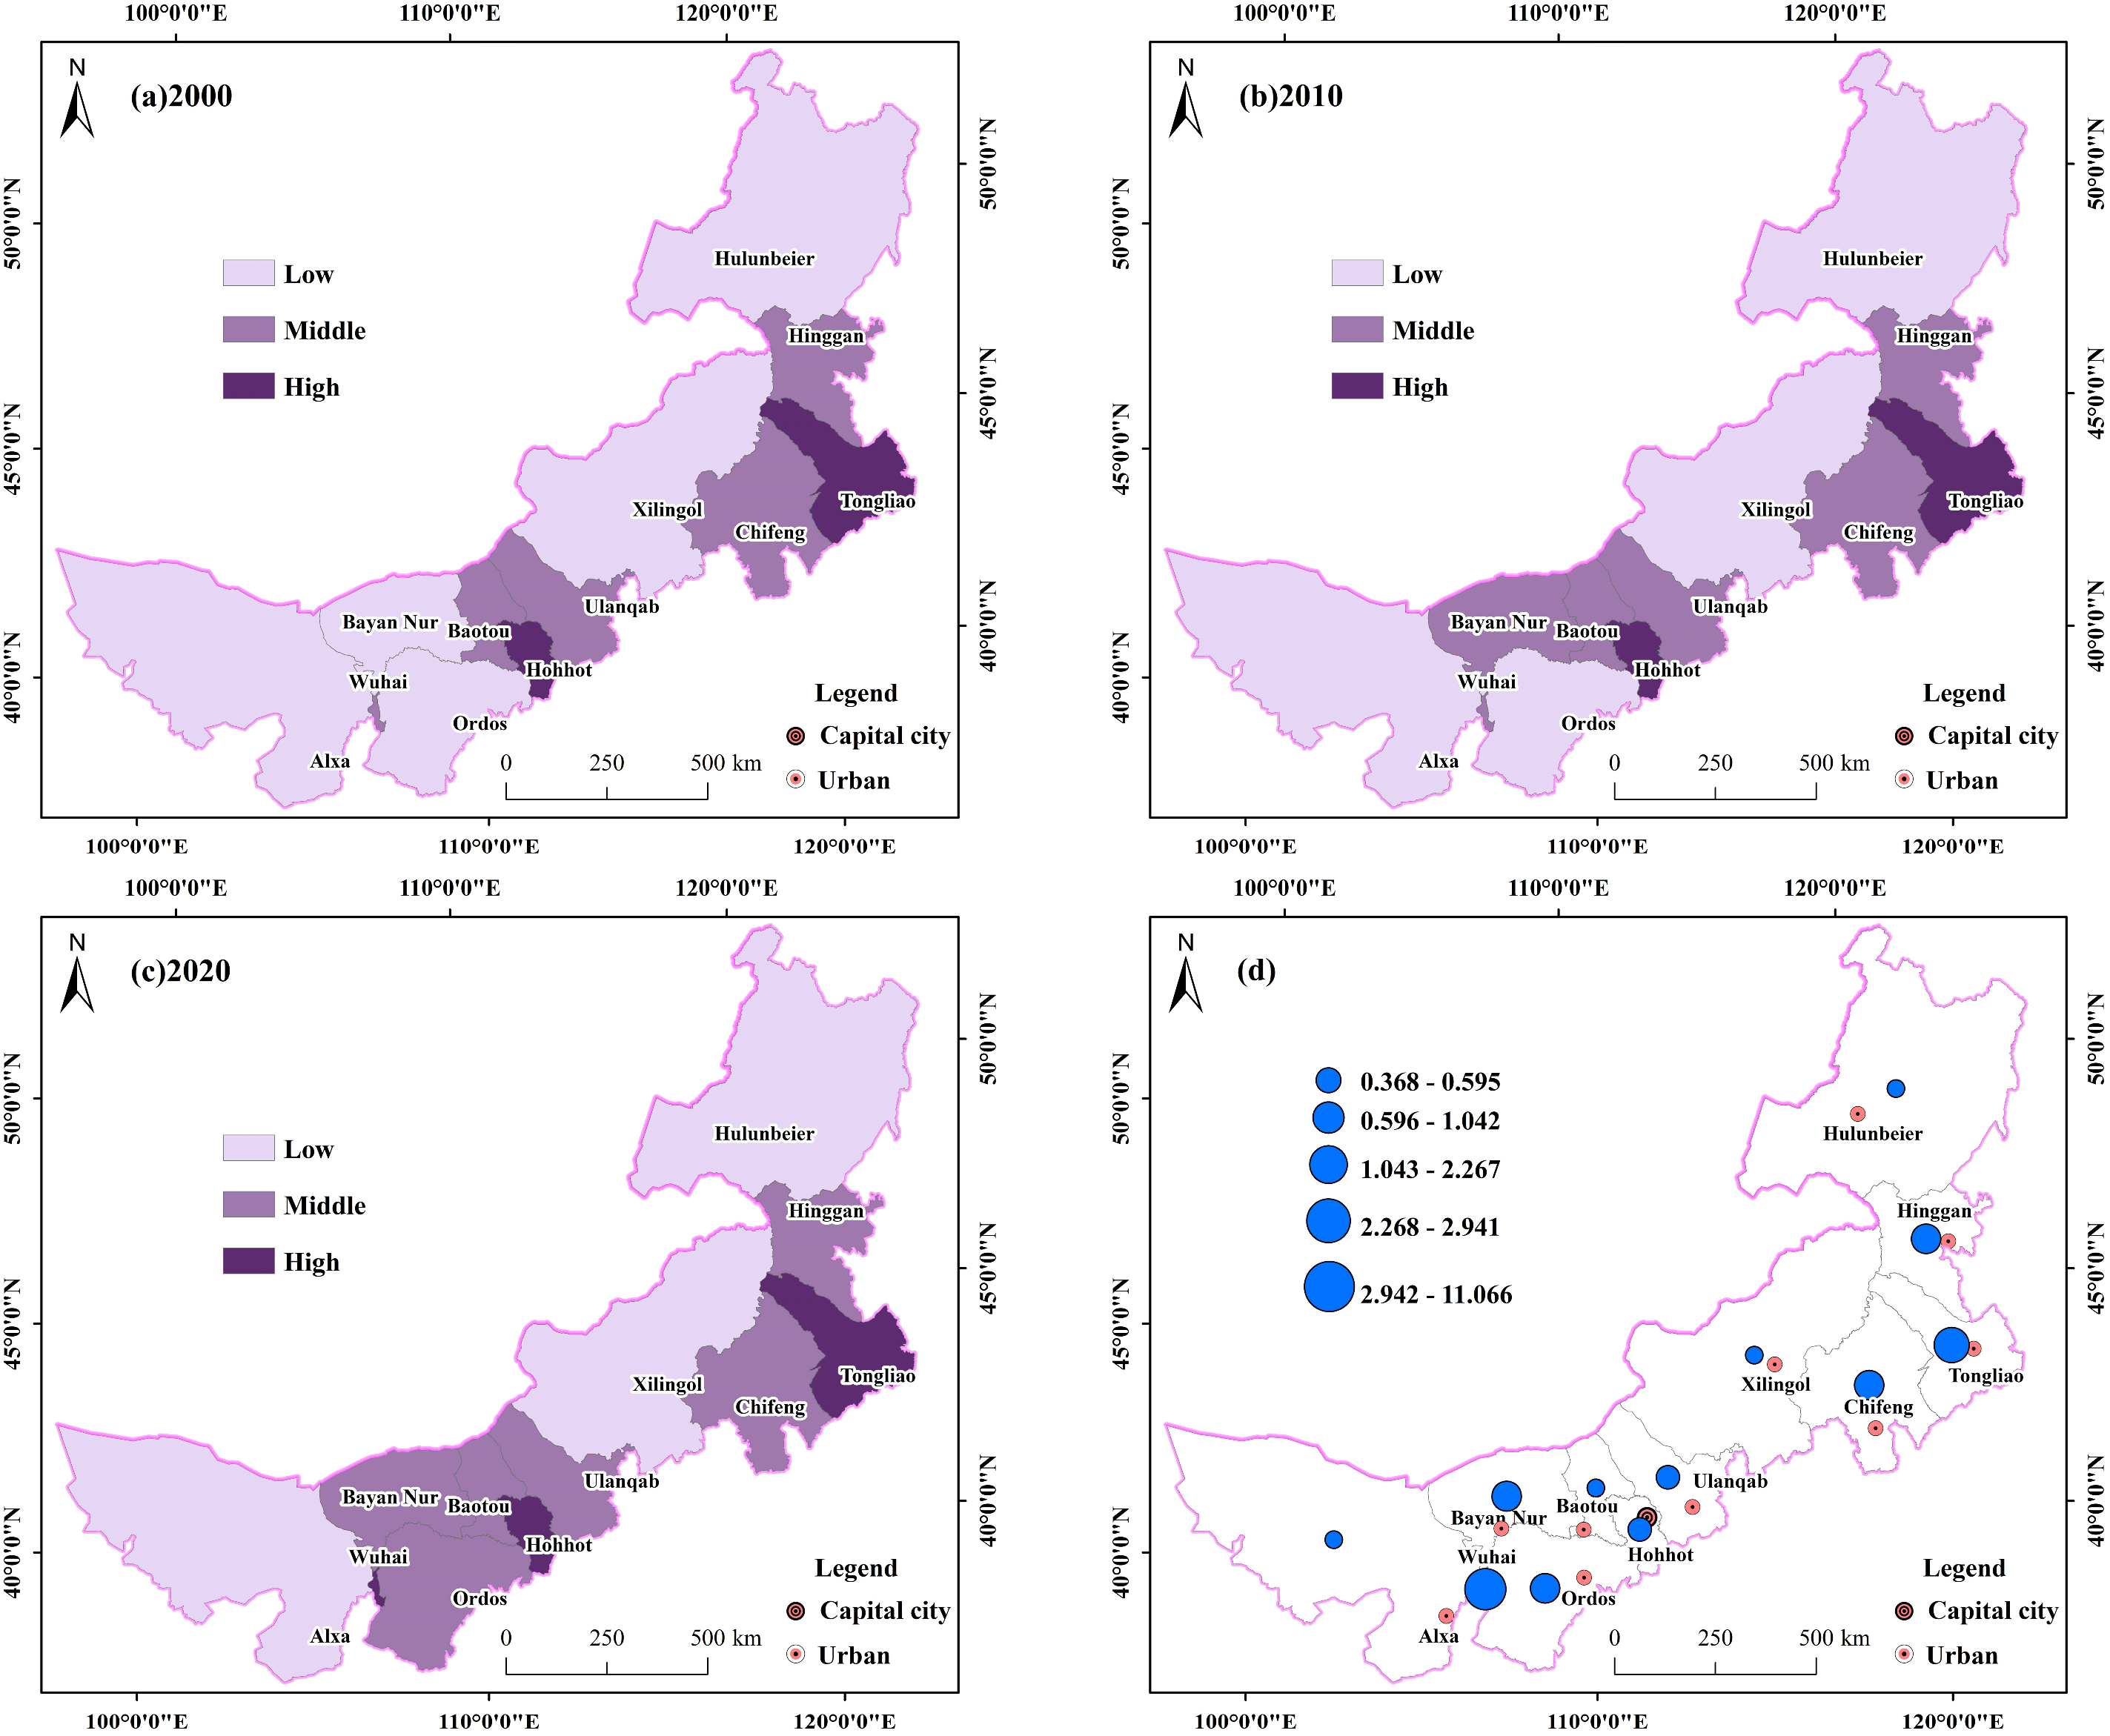
Sustainability 14 06252 g005
Figure 6. Classification and change in intensity of human activity at league/city scale of Inner Mongolia from 2000 to 2020. (The spatial distribution of intensity of human activity in (a) 2000, (b) 2010, and (c) 2020; the blue circle in Figure (d) represents the change in intensity of human activity at the league/city scale from 2000 to 2020, and the size of the circle indicates the strength of the change).
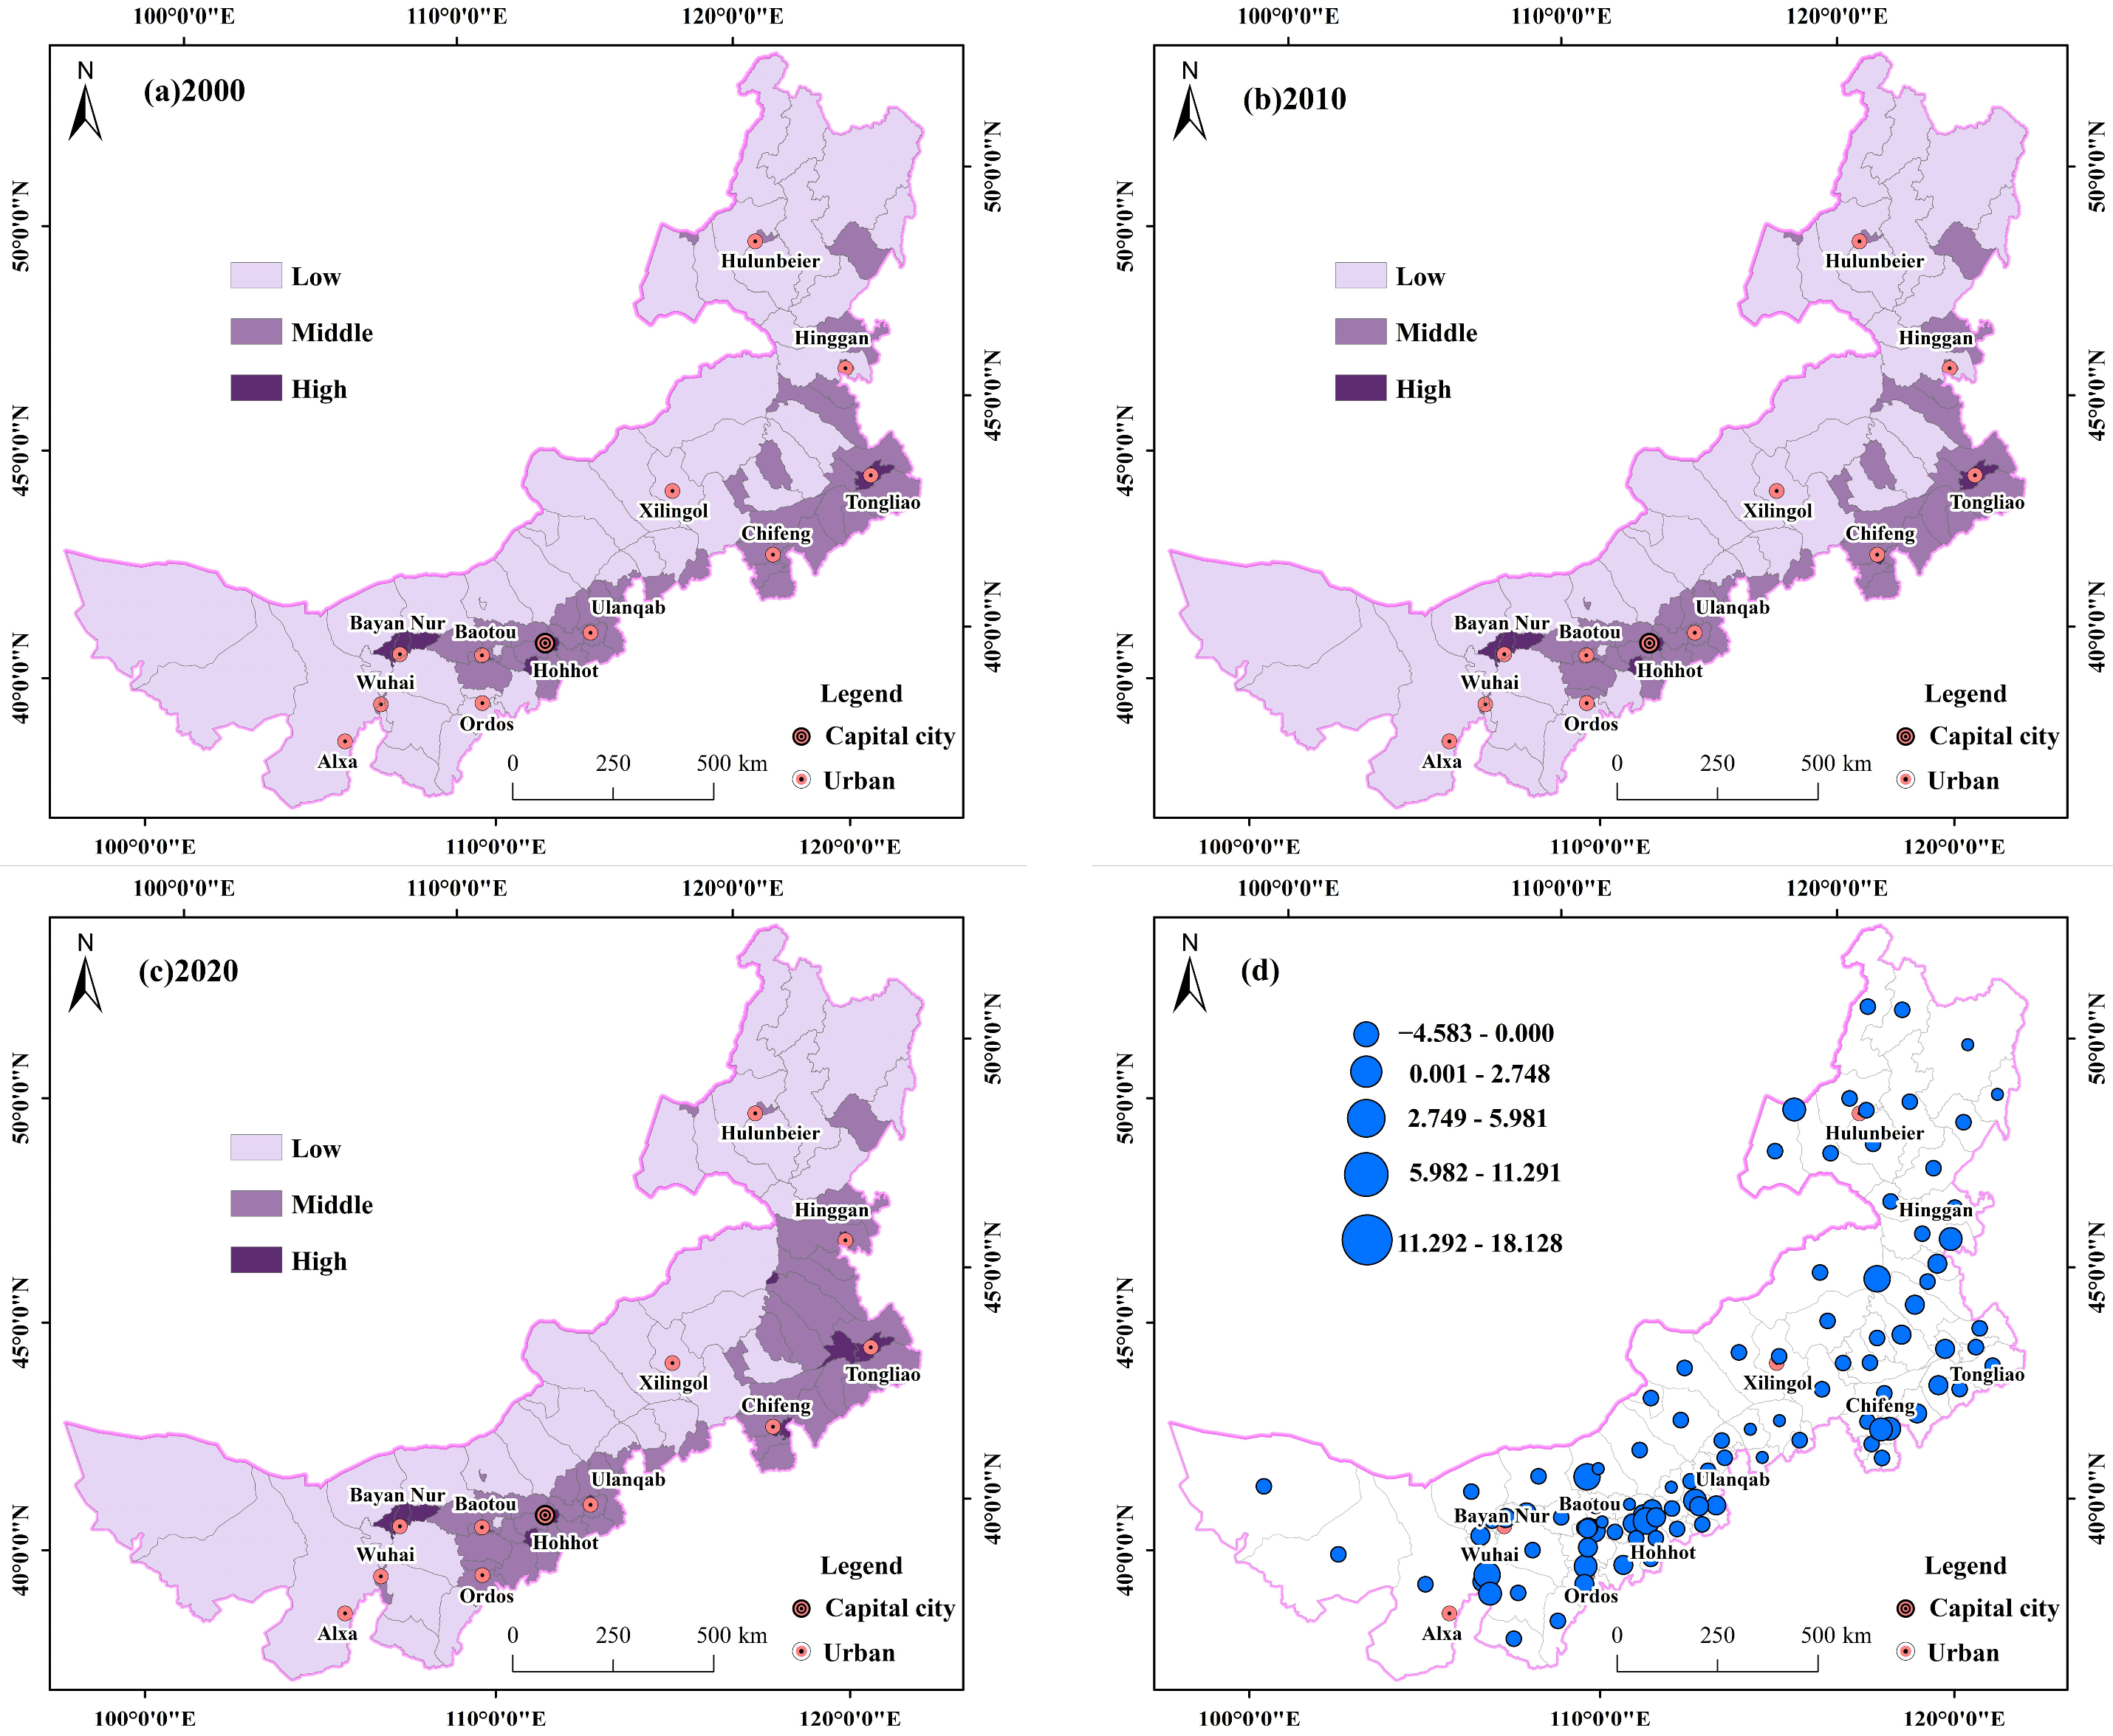
Sustainability 14 06252 g006
Figure 7. Classification of the intensity of human activity at the banner/county scale of Inner Mongolia from 2000 to 2020. (The spatial distribution of intensity of human activity in (a) 2000, (b) 2010 and (c) 2020; the blue circle in (d) represents the change in intensity of human activity at the banner scale from 2000 to 2020, and the size of the circle indicates the strength of the change).
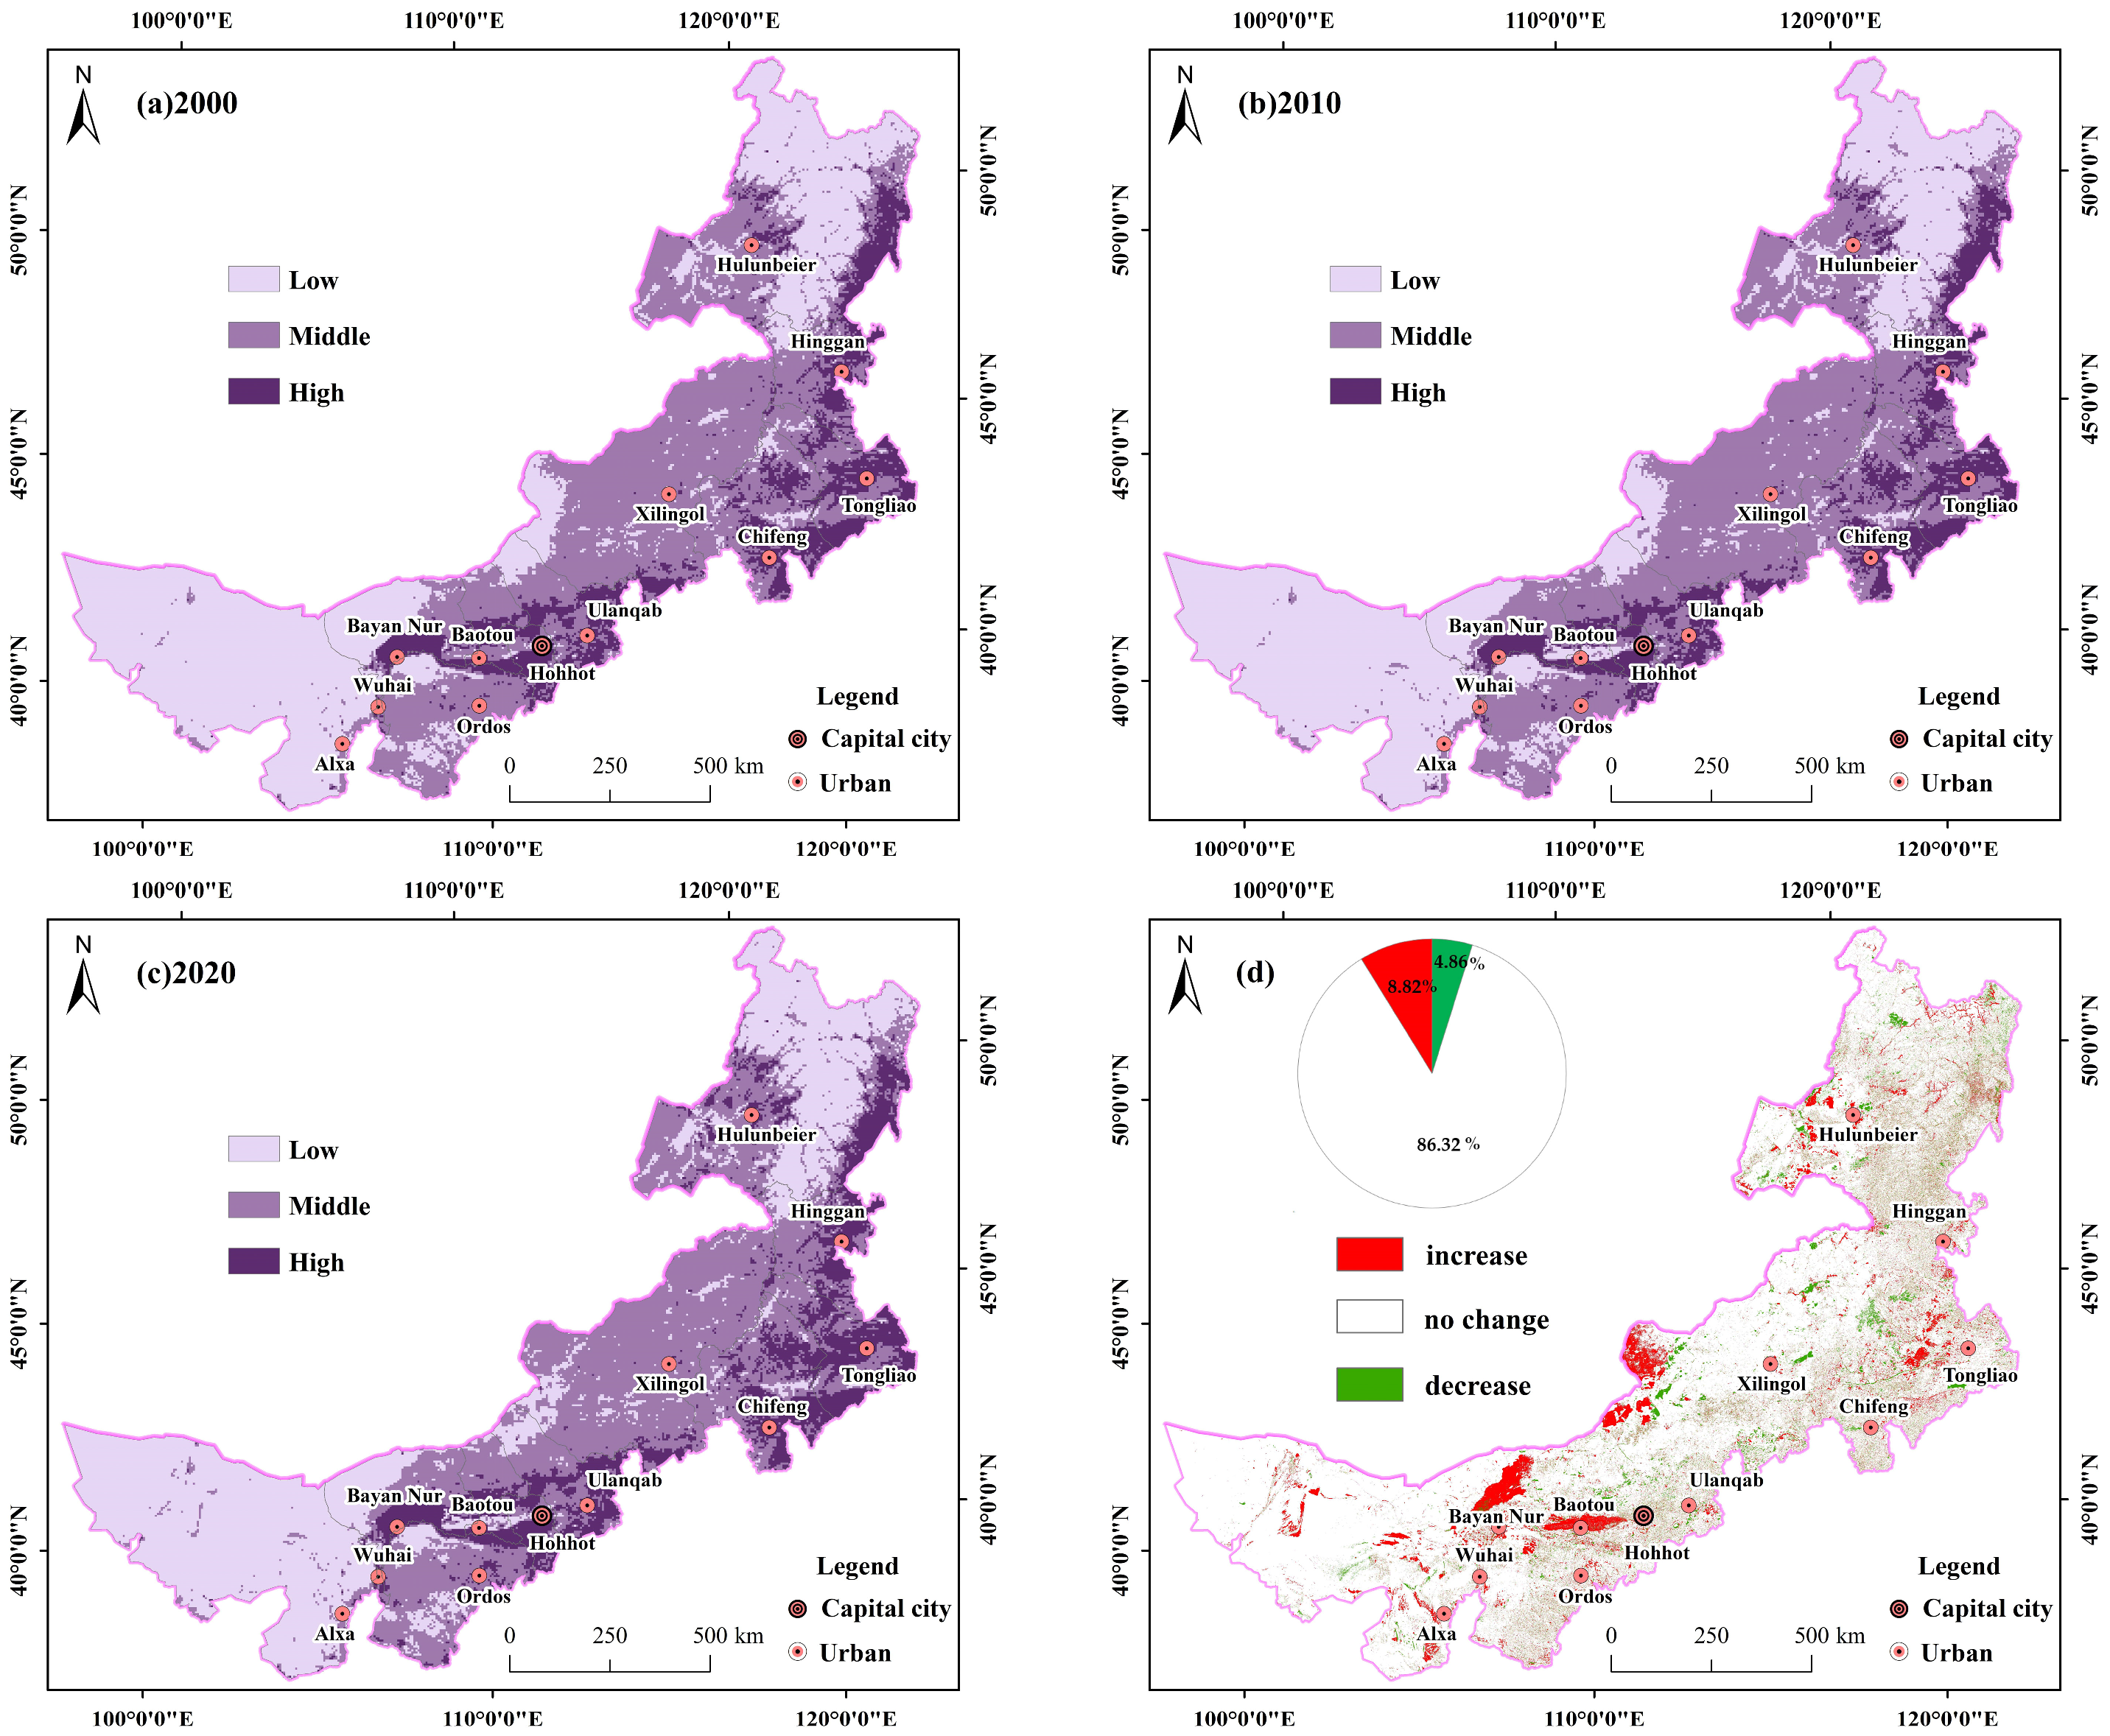
Sustainability 14 06252 g007
Figure 8. Classification of intensity of human activity at pixel level in Inner Mongolia from 2000 to 2020. (The spatial distribution of intensity of human activity in (a) 2000, (b) 2010, (c) 2020 and (d) represents the change in intensity of human activity at the pixel scale from 2000 to 2020, and the pie chart in the upper left corner of (d) shows the statistics for the of change in the intensity of human activity).
Sustainability 14 06252 g008
Figure 9. Classification of intensity of human activity in steppe types of Inner Mongolia from 2000 to 2020. (The spatial distribution of intensity of human activity in (a) 2000, (b) 2010, and (c) 2020; the grassland-type boundary is shown in black gray line).
Sustainability 14 06252 g009
Figure 10. Temporal variation trends in intensity of human activity for steppe types from 2000 to 2020 (The blue lines represent the intensity of human activity, the dashed red lines represent the linear trends, and the red lines represent the mean values).
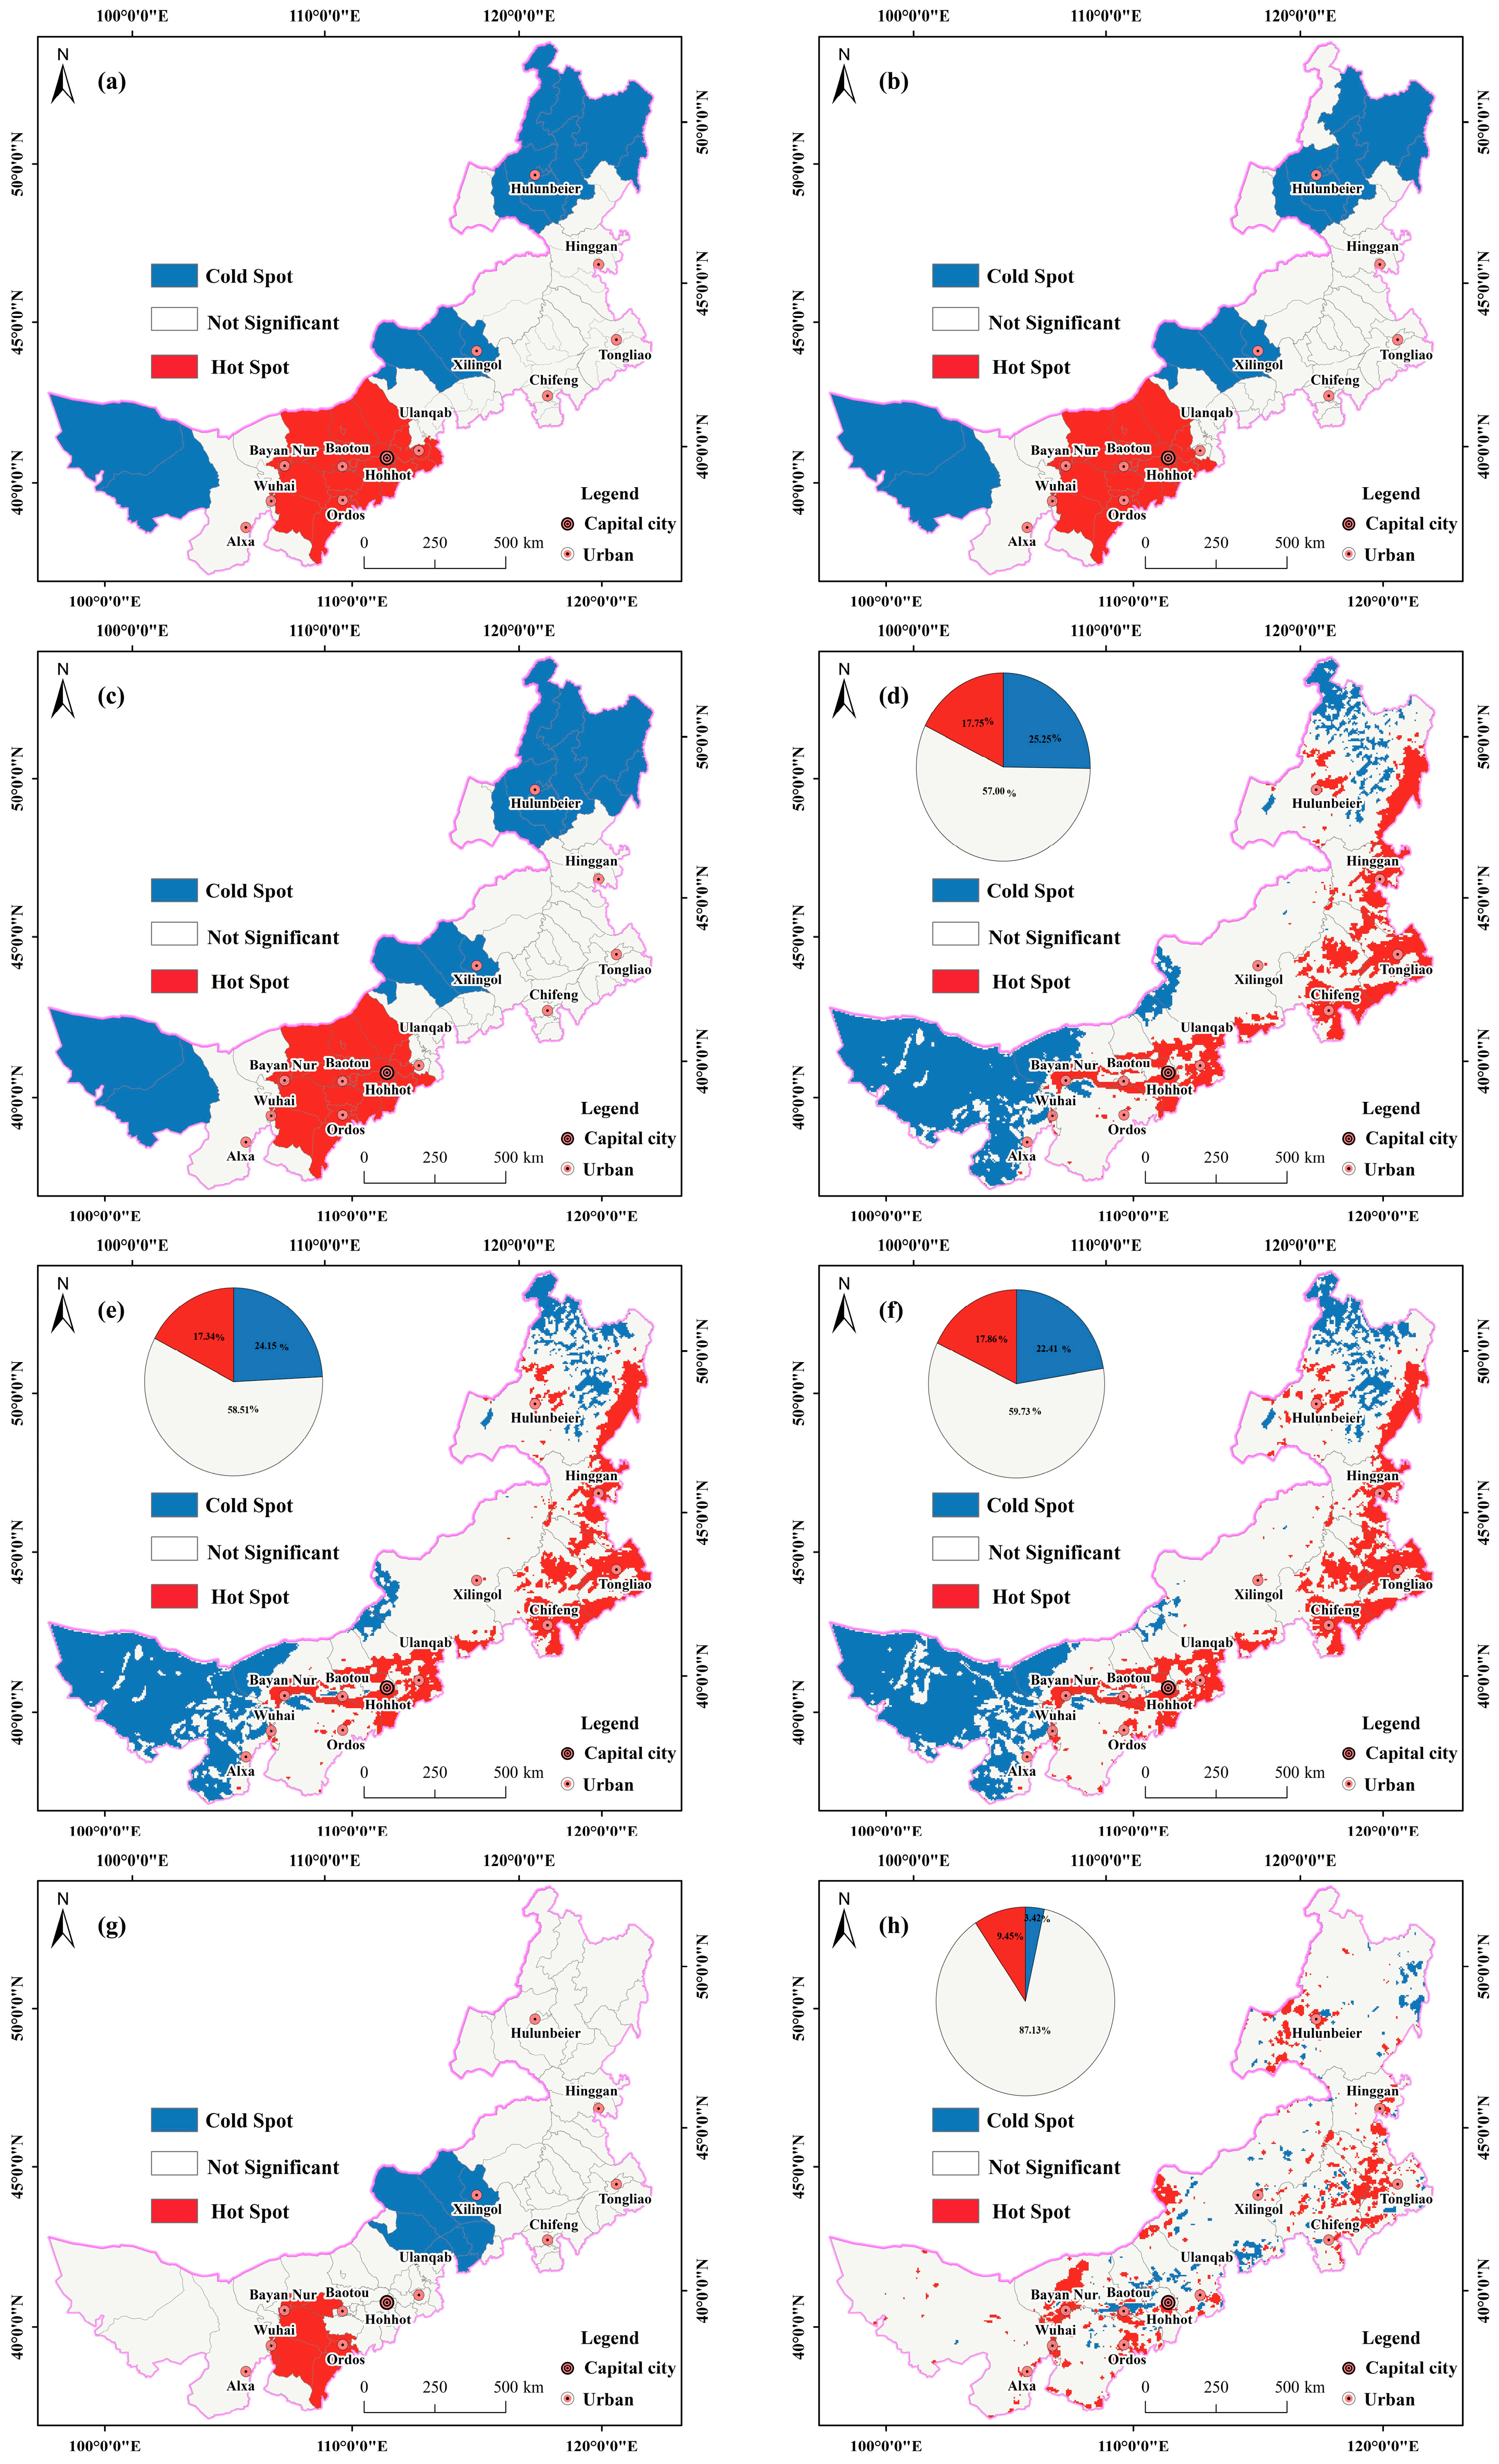
Sustainability 14 06252 g010
Figure 11. The hot-spot map of the intensity of human activity in Inner Mongolia, 2000–2020. ((ac) show the hot-spot map of the intensity of human activity at the banner scale for 2000, 2020 and 2020 respectively. (df) show the hot-spot map of human activity intensity in pixel scale for 2000, 2010, and 2020, respectively. (d,e,g) show the hot-spot map of the intensity of human activity change in banner scale from 2000 to 2020. (h) shows the hot-spot map of the intensity of human activity change in a grid scale from 2000 to 2020. The pie chart in the upper left corner of subfigure shows the percentage statistics of the cold-spot, hot-spot, and not-significant areas).
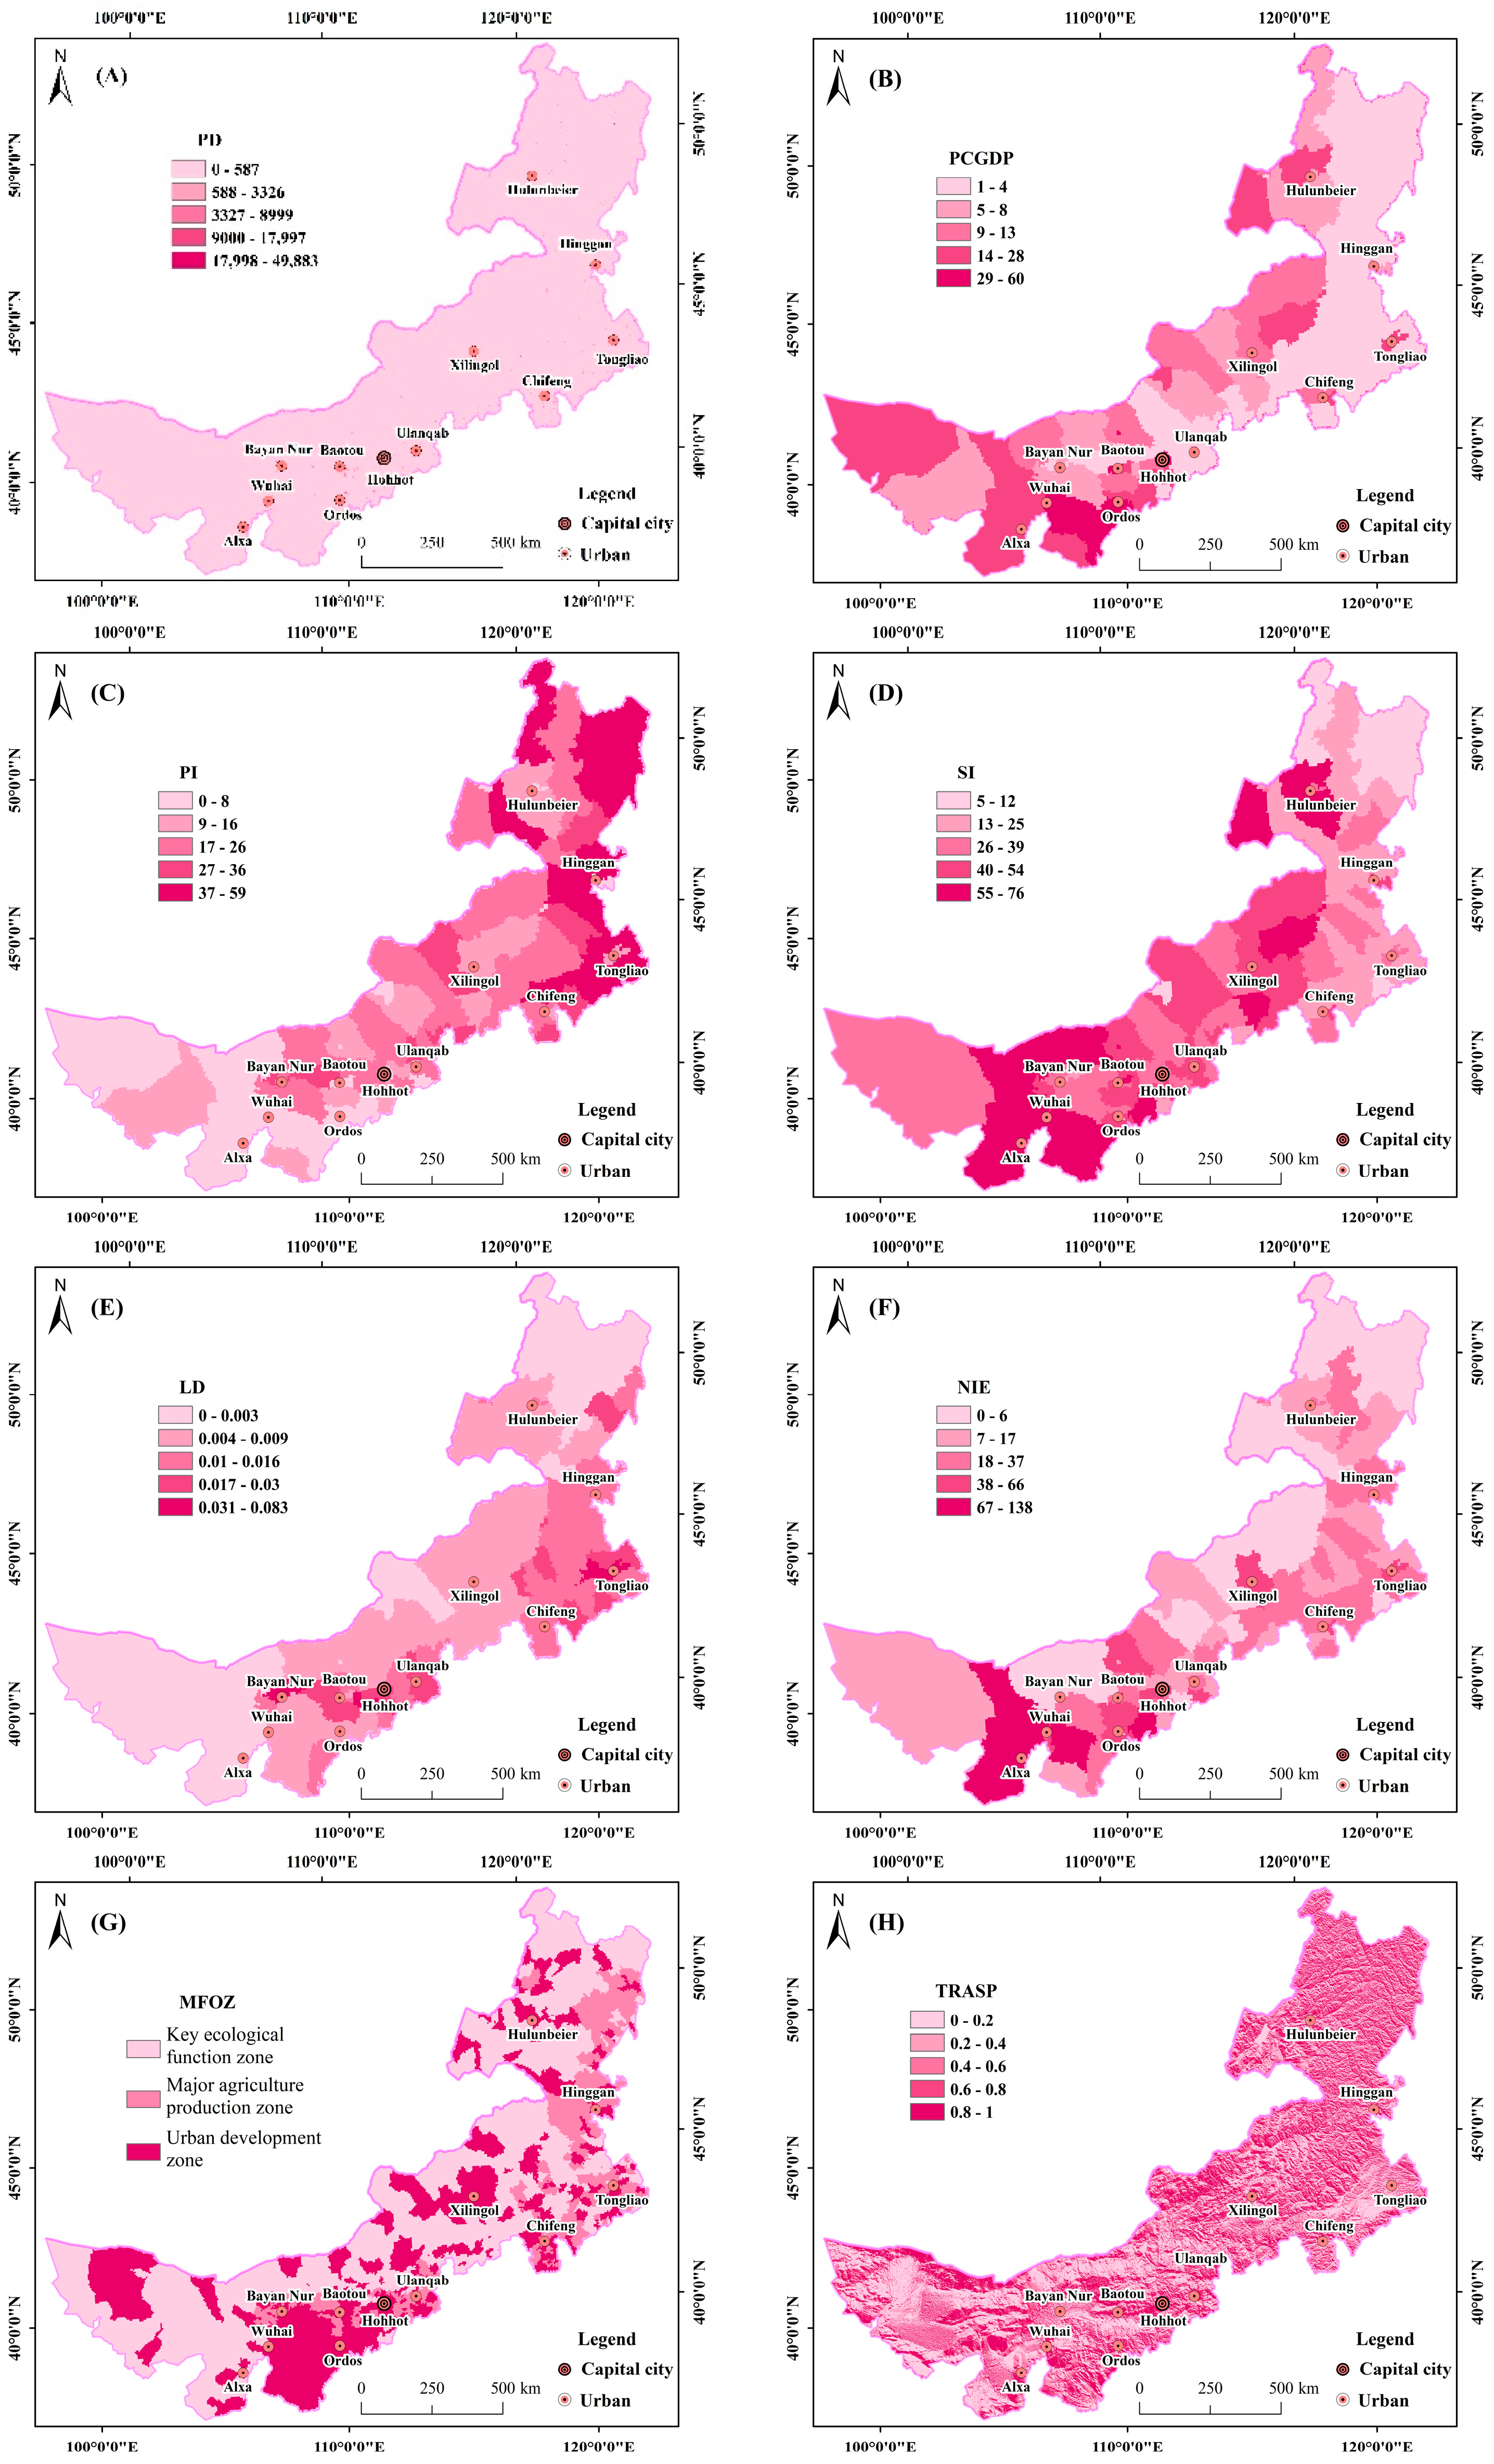
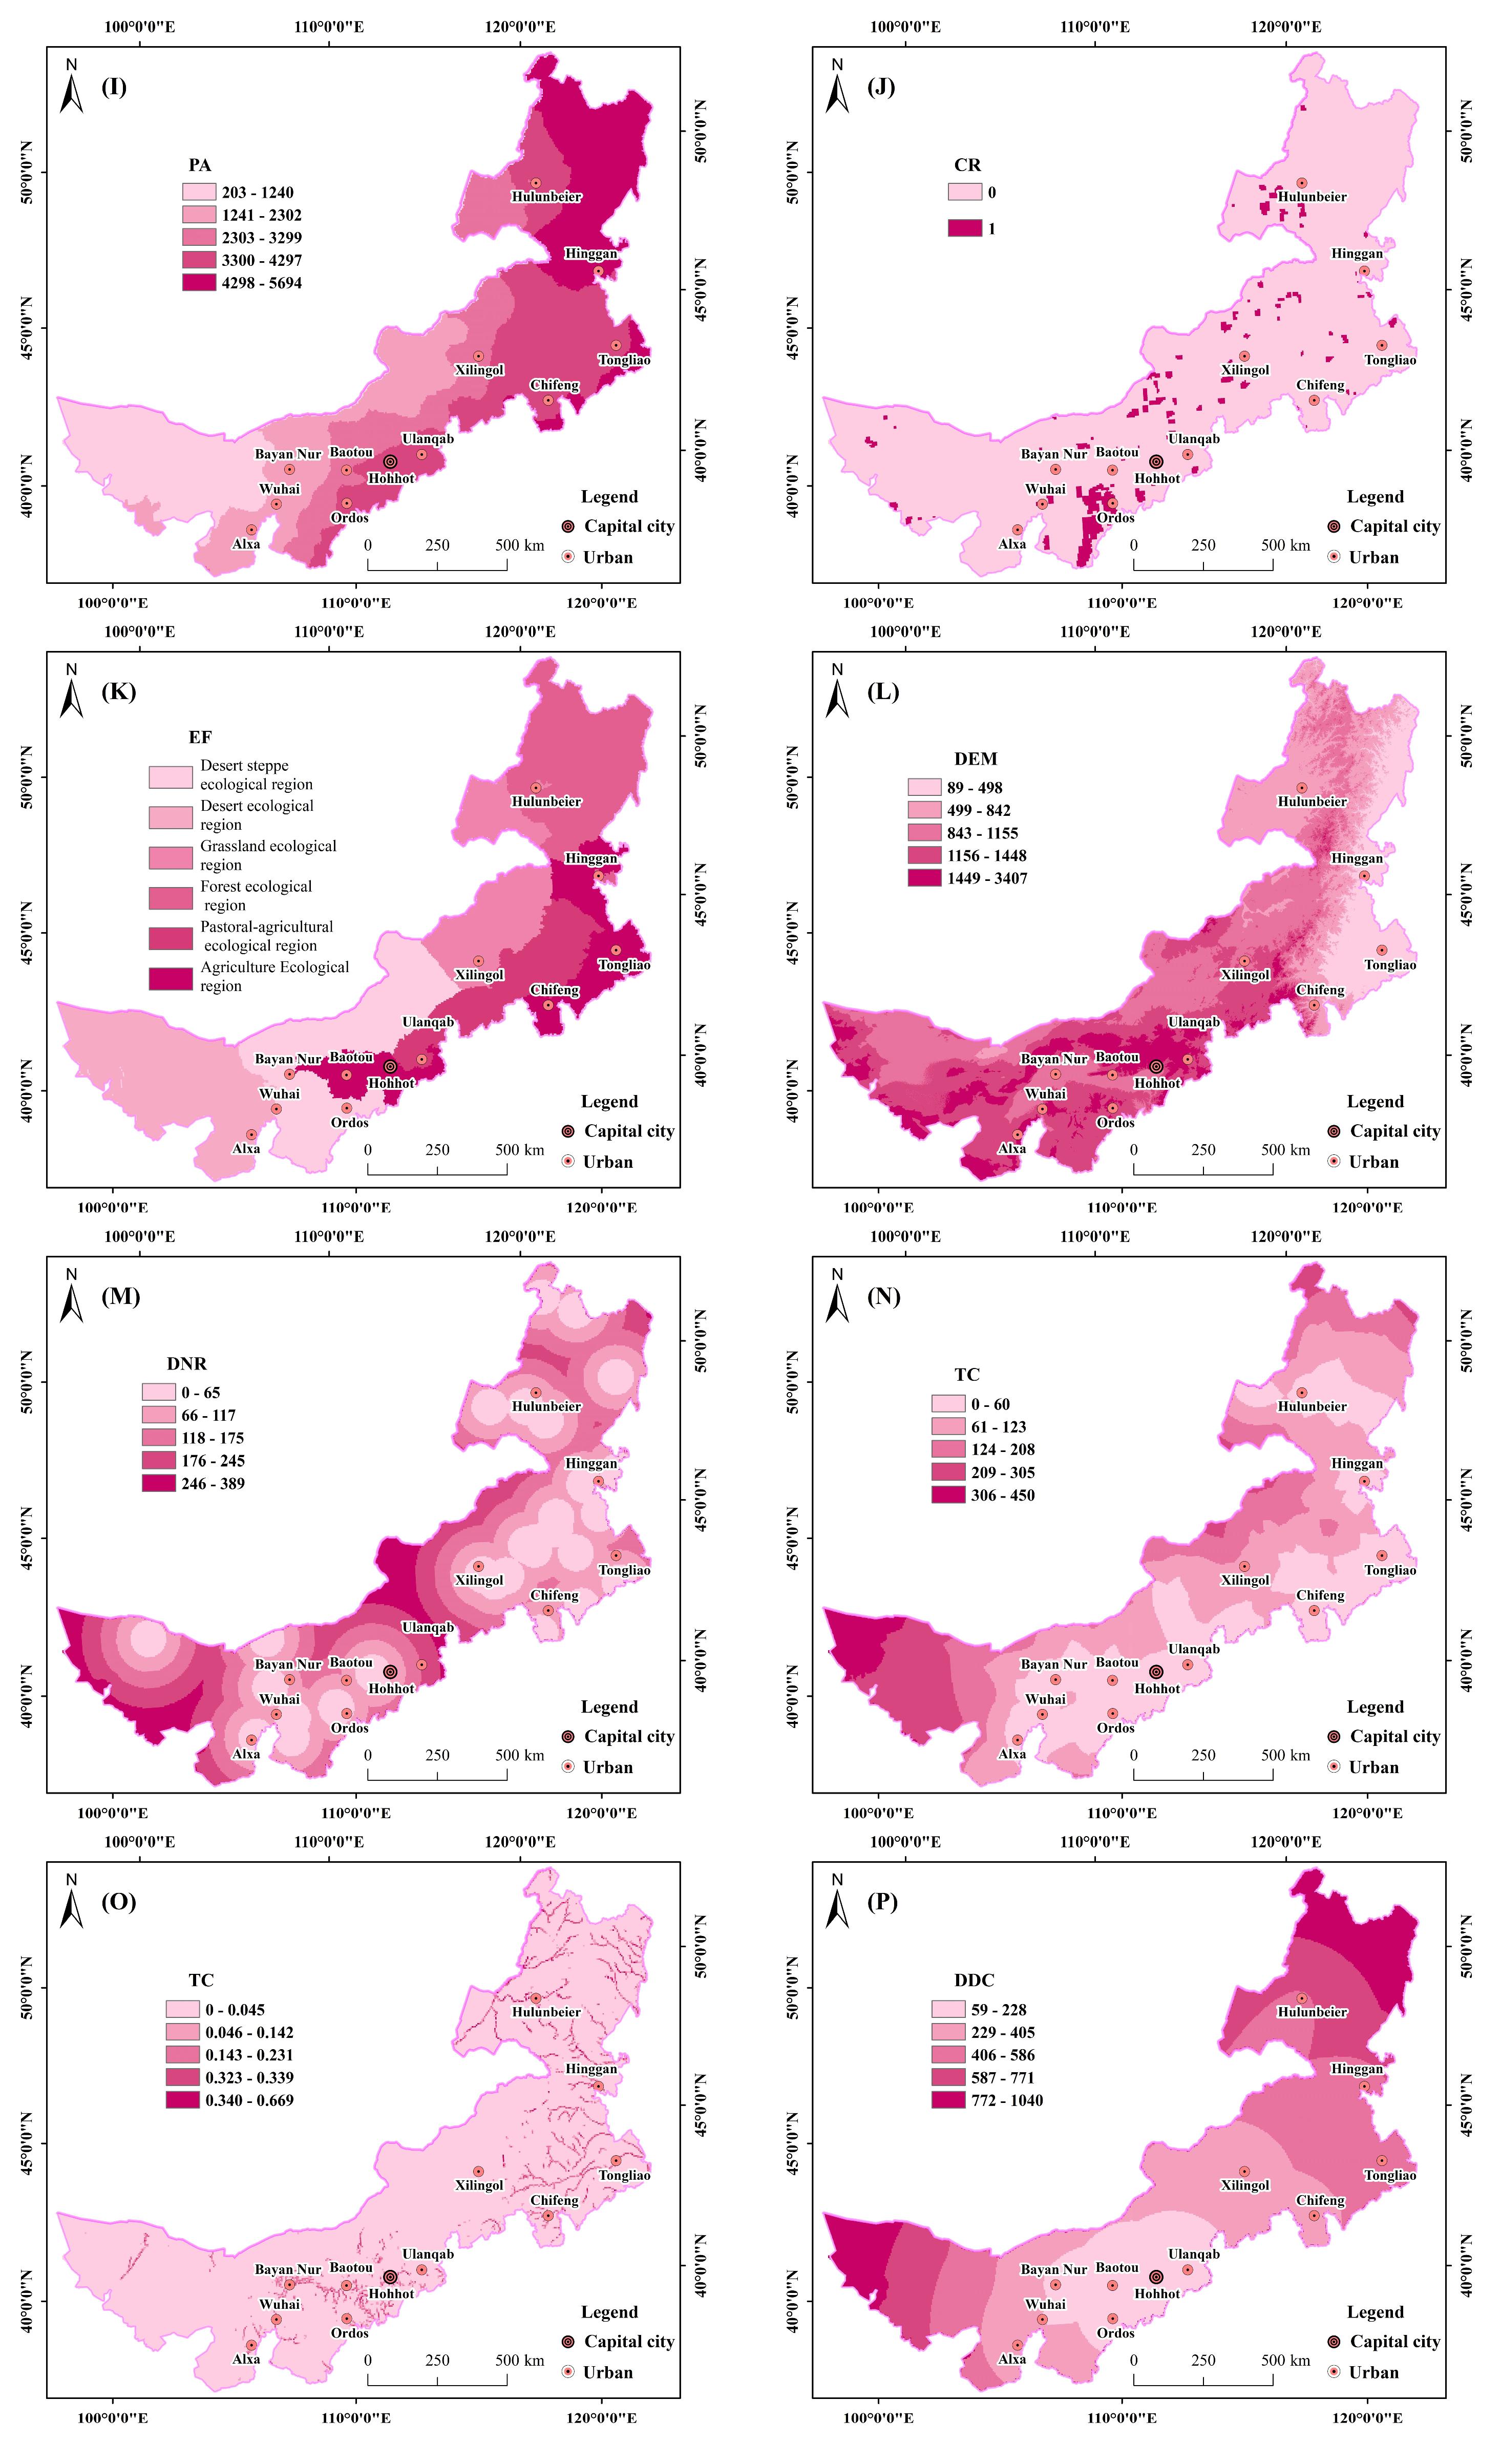
Sustainability 14 06252 g011
Figure 12. Map of factors influencing the intensity of human activity in Inner Mongolia region. (A) Population density; (B) Per capita GDP; (C) The proportion of primary industry; (D) The proportion of secondary industry; (E) Livestock density; (F) Number of industrial enterprises; (G) Major-function-oriented zoning; (H) Transformation of aspect; (I) Average annual precipitation; (J) Distribution of coal resources; (K) Eco-functional zone; (L) DEM; (M) Distance to nature reserve; (N) Traffic conditions; (O) River density; (P) Distance from the central city; (Q) Density of settlements.
Sustainability 14 06252 g012aSustainability 14 06252 g012bSustainability 14 06252 g012c
Figure 13. Results of the interaction detection between the factors influencing the intensity of human activity. (The blue circle represents an association that is univariate and weakened by the interaction. Red/yellow circles represent an association that is nonlinearly/bivariately enhanced by the interaction. In particular, a nonlinear enhanced effect means that the explanatory power of the interaction of the two factors is greater than the sum of the explanatory power of two single factors; a bivariate enhanced effect means that the interaction enhances the explanatory power of any single factor but is not greater than their sum. The size of the circle indicates the strength of the interaction).
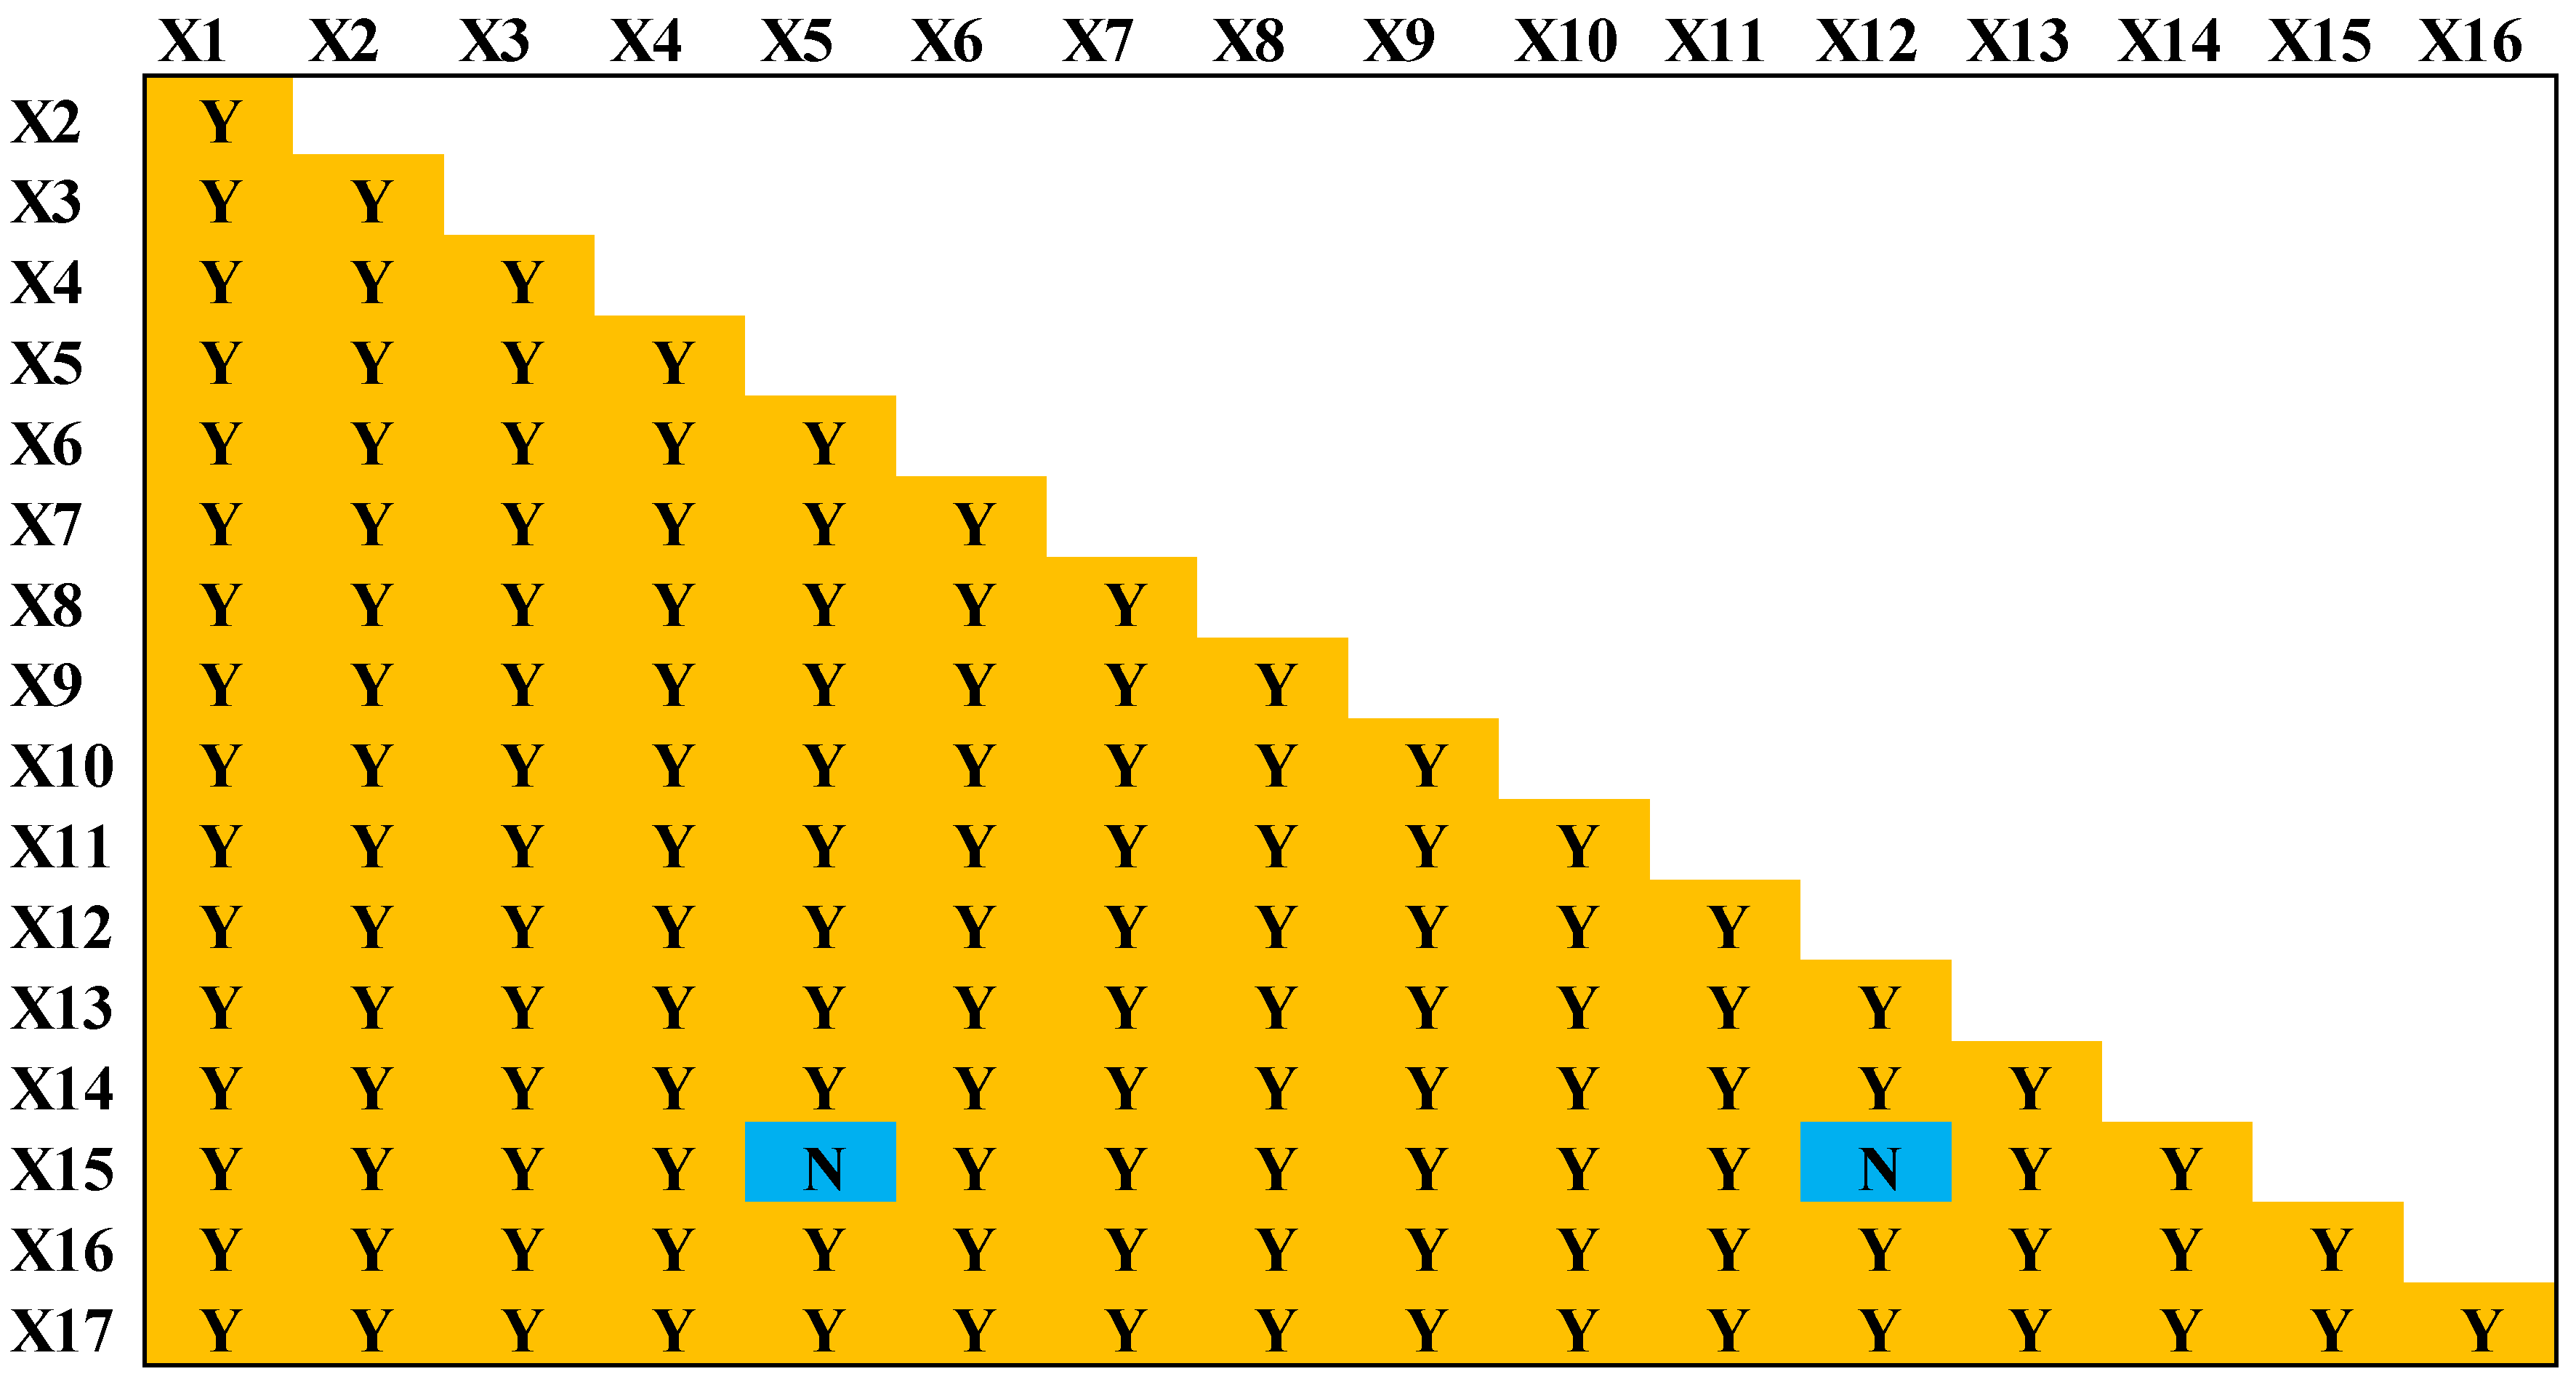
Sustainability 14 06252 g013
Figure 14. Ecological detector results for each factor of the change in the intensity of human activity in Inner Mongolia from 2000 to 2020. Note: positions marked with Y in the figure indicate significant differences in the influence of each factor on the spatial distribution of the intensity of human activity, with different mechanisms of influence; positions marked with N indicate a lack of significant differences in the mechanisms of influence of the two factors on the spatial distribution of the intensity of human activity.
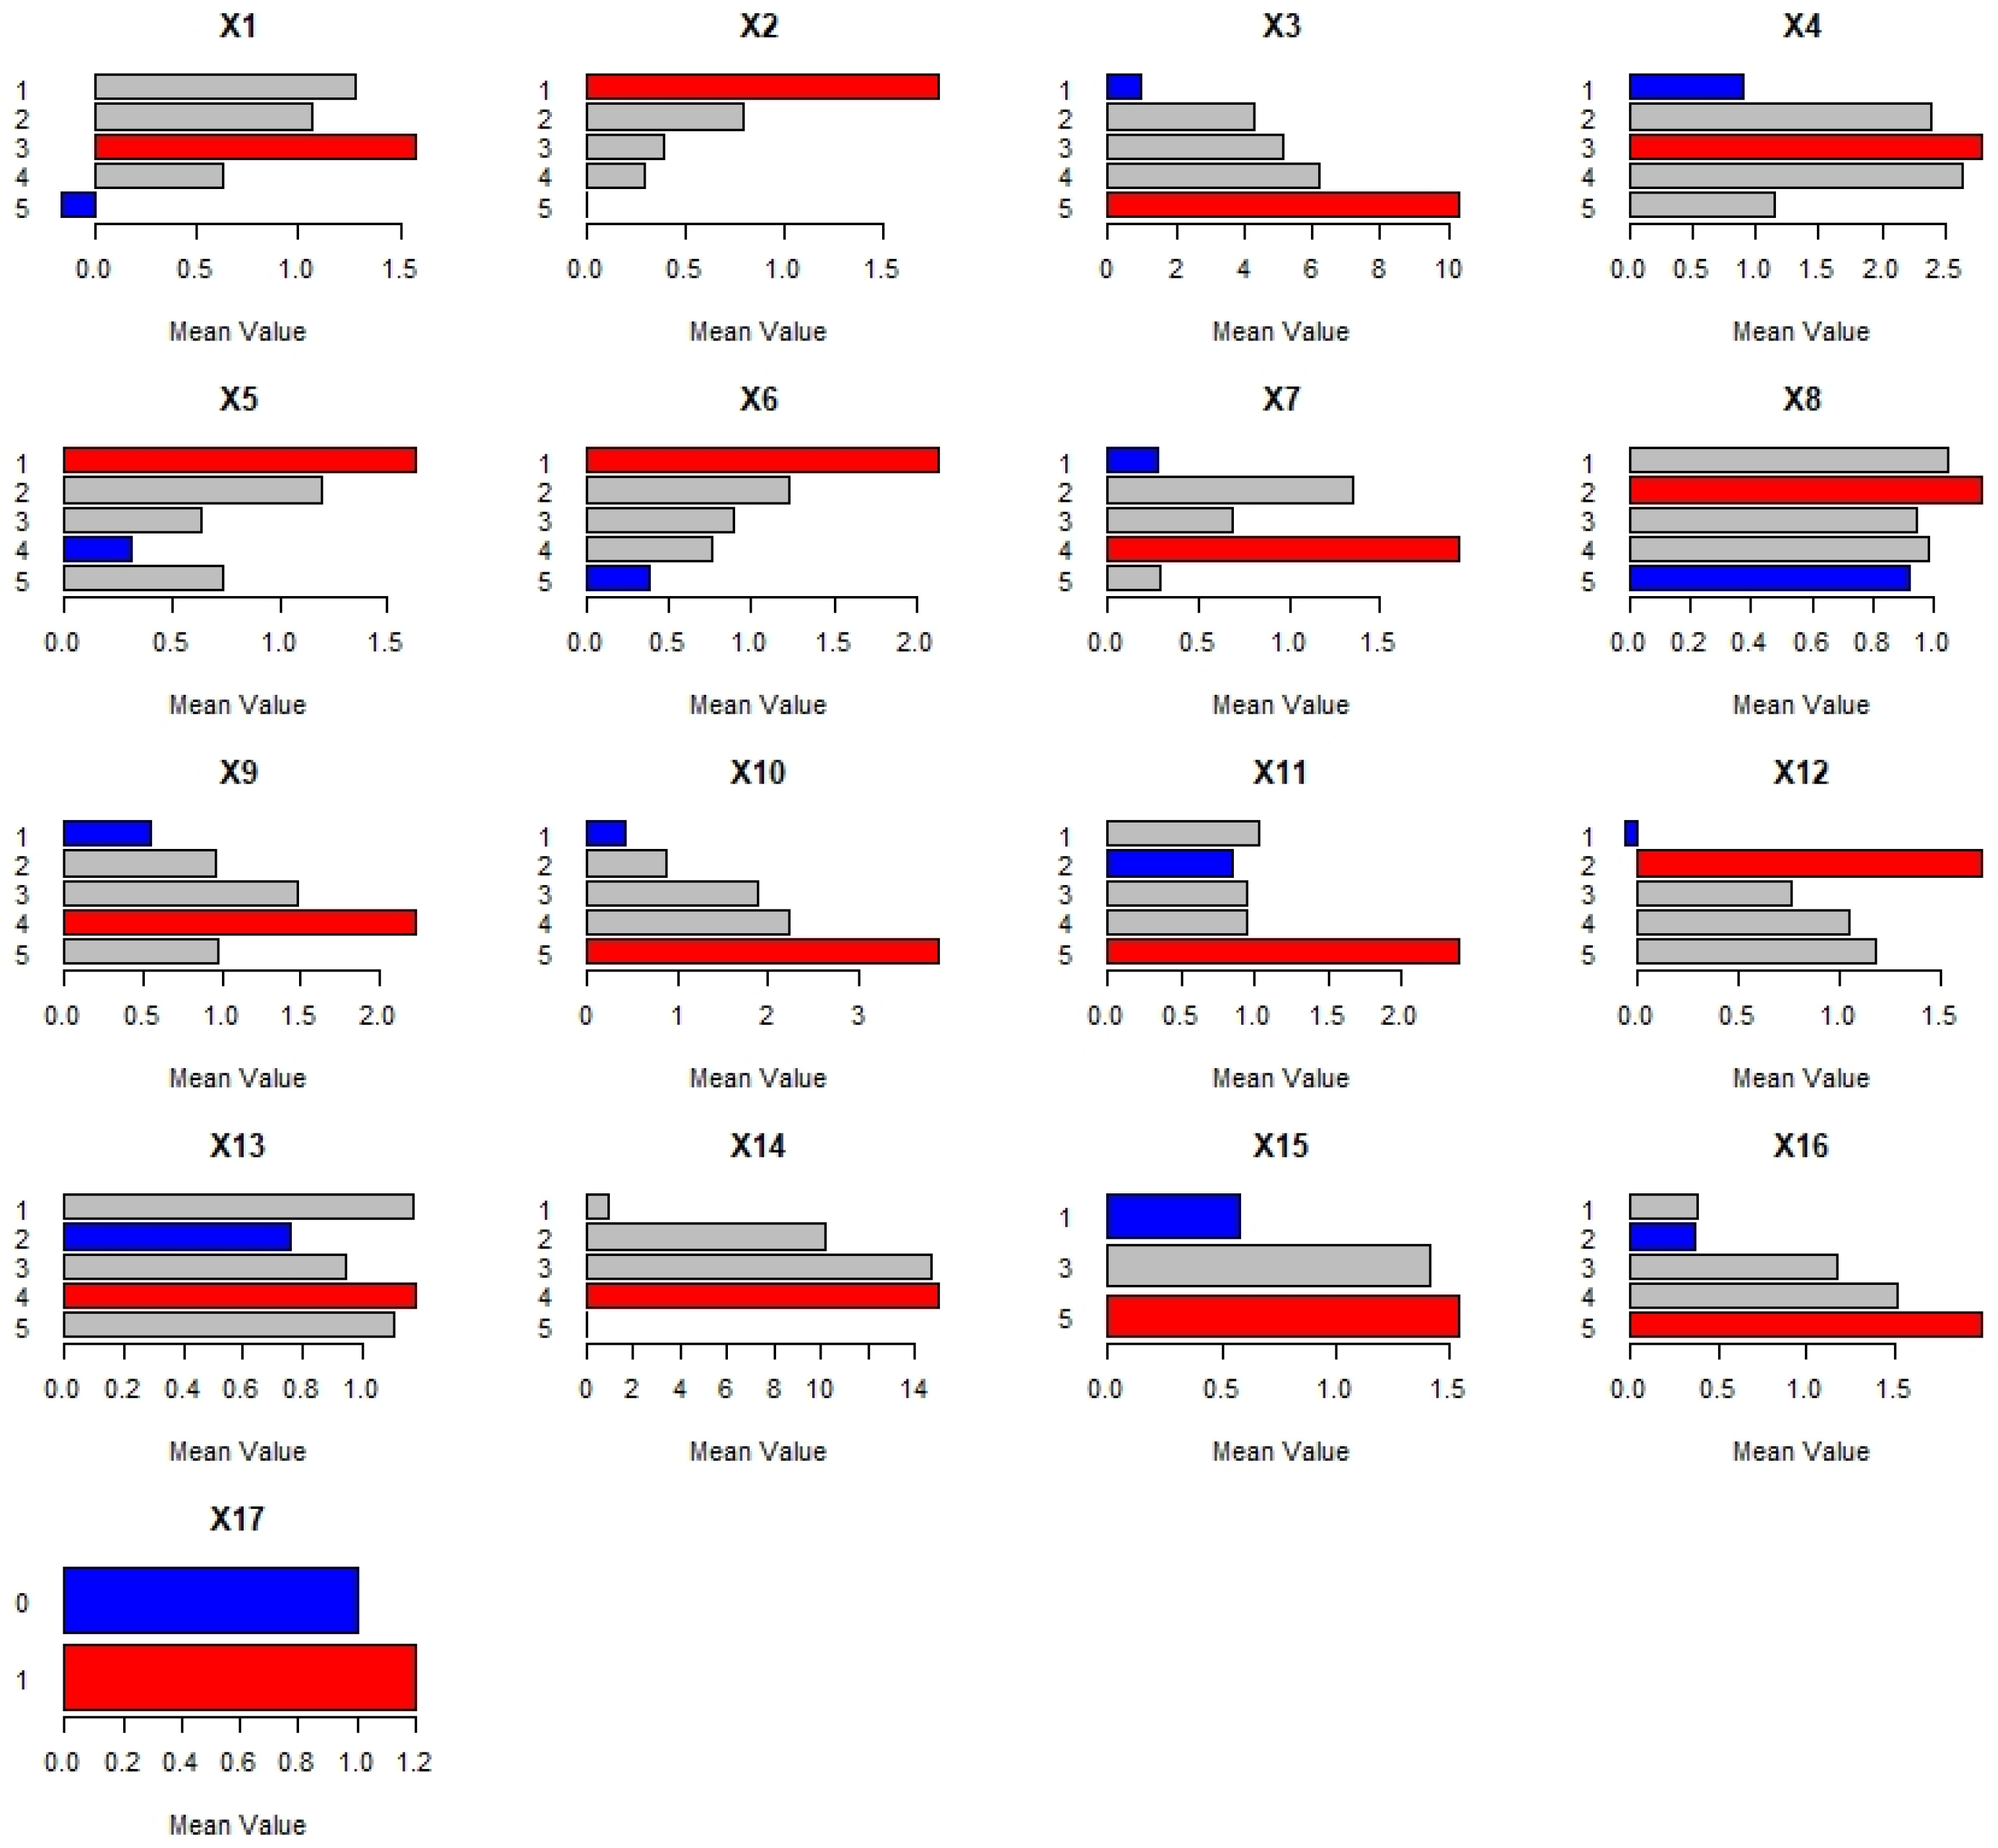
Sustainability 14 06252 g014
Figure 15. Risk detector results for each factor of the intensity of human activity in Inner Mongolia from 2000 to 2020, in which, the red and blue bar indicates the maximum and minimum value, respectively; Axis y is the classification grade of factor.
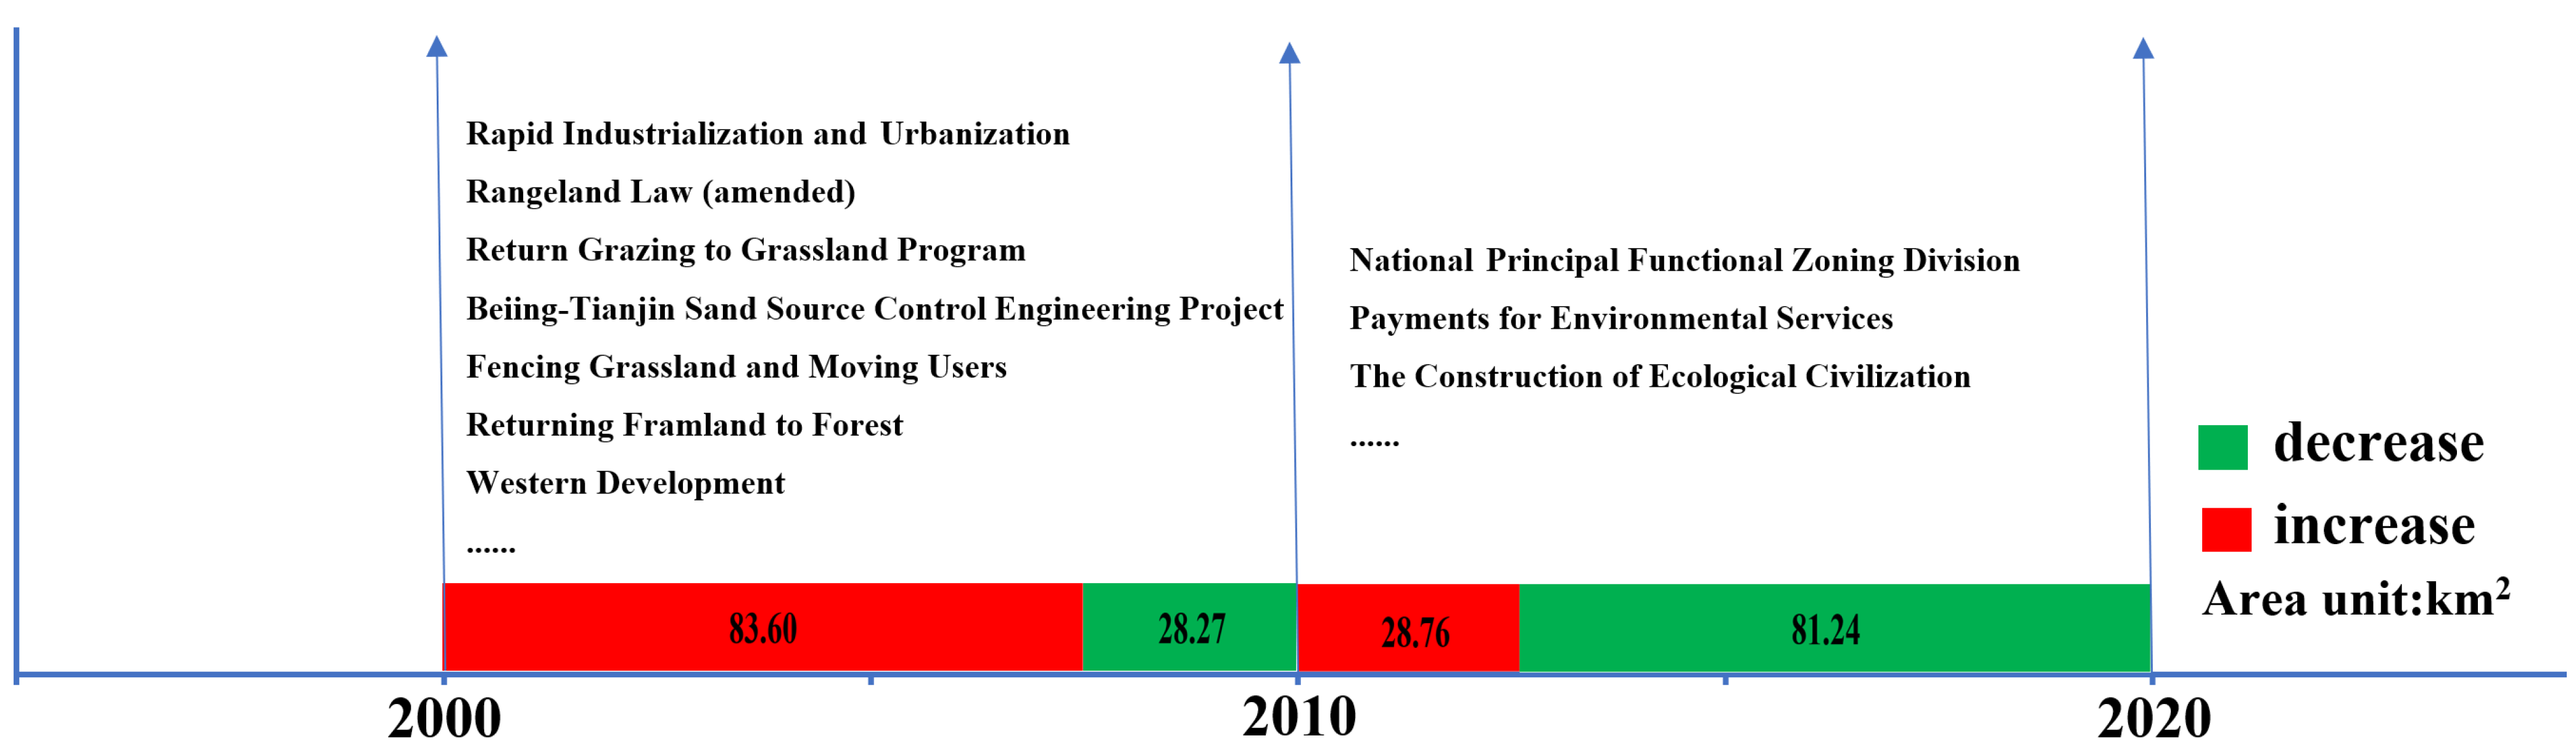
Sustainability 14 06252 g015
Figure 16. The major policy framework in Inner Mongolia. (Note: red indicates the proportion of the area where the intensity of human activities increases, while green indicates the proportion of the area where the intensity of human activities decreases).
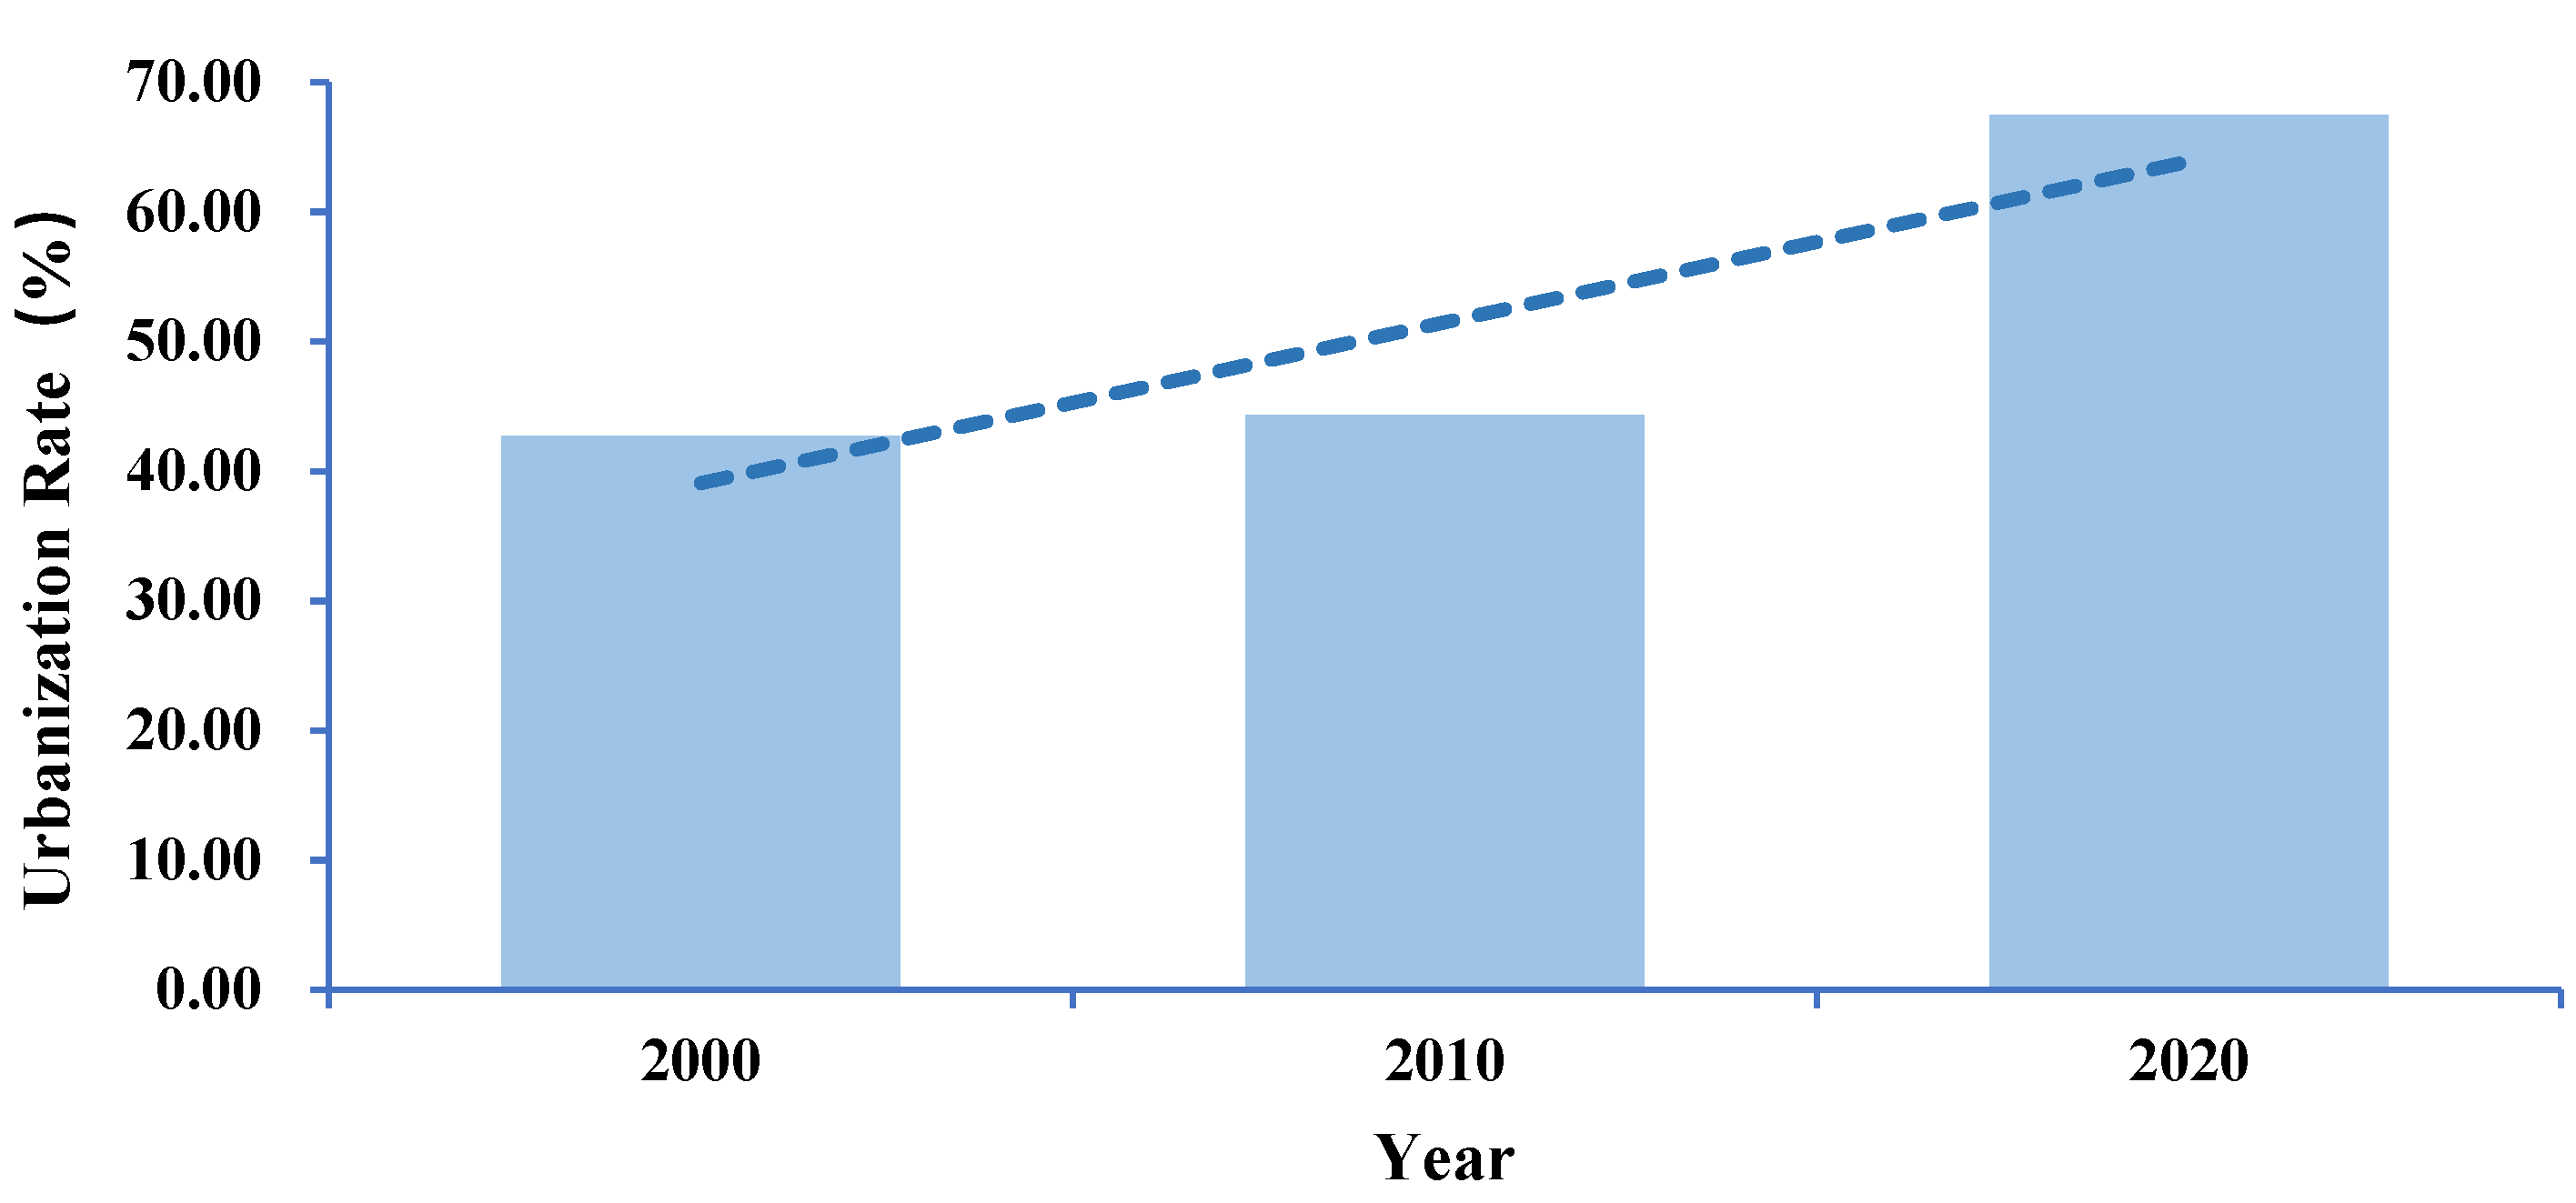
Sustainability 14 06252 g016
Figure 17. Change in the urbanization rate of Inner Mongolia from 2000 to 2020. Dashed lines indicate the slopes of changes.
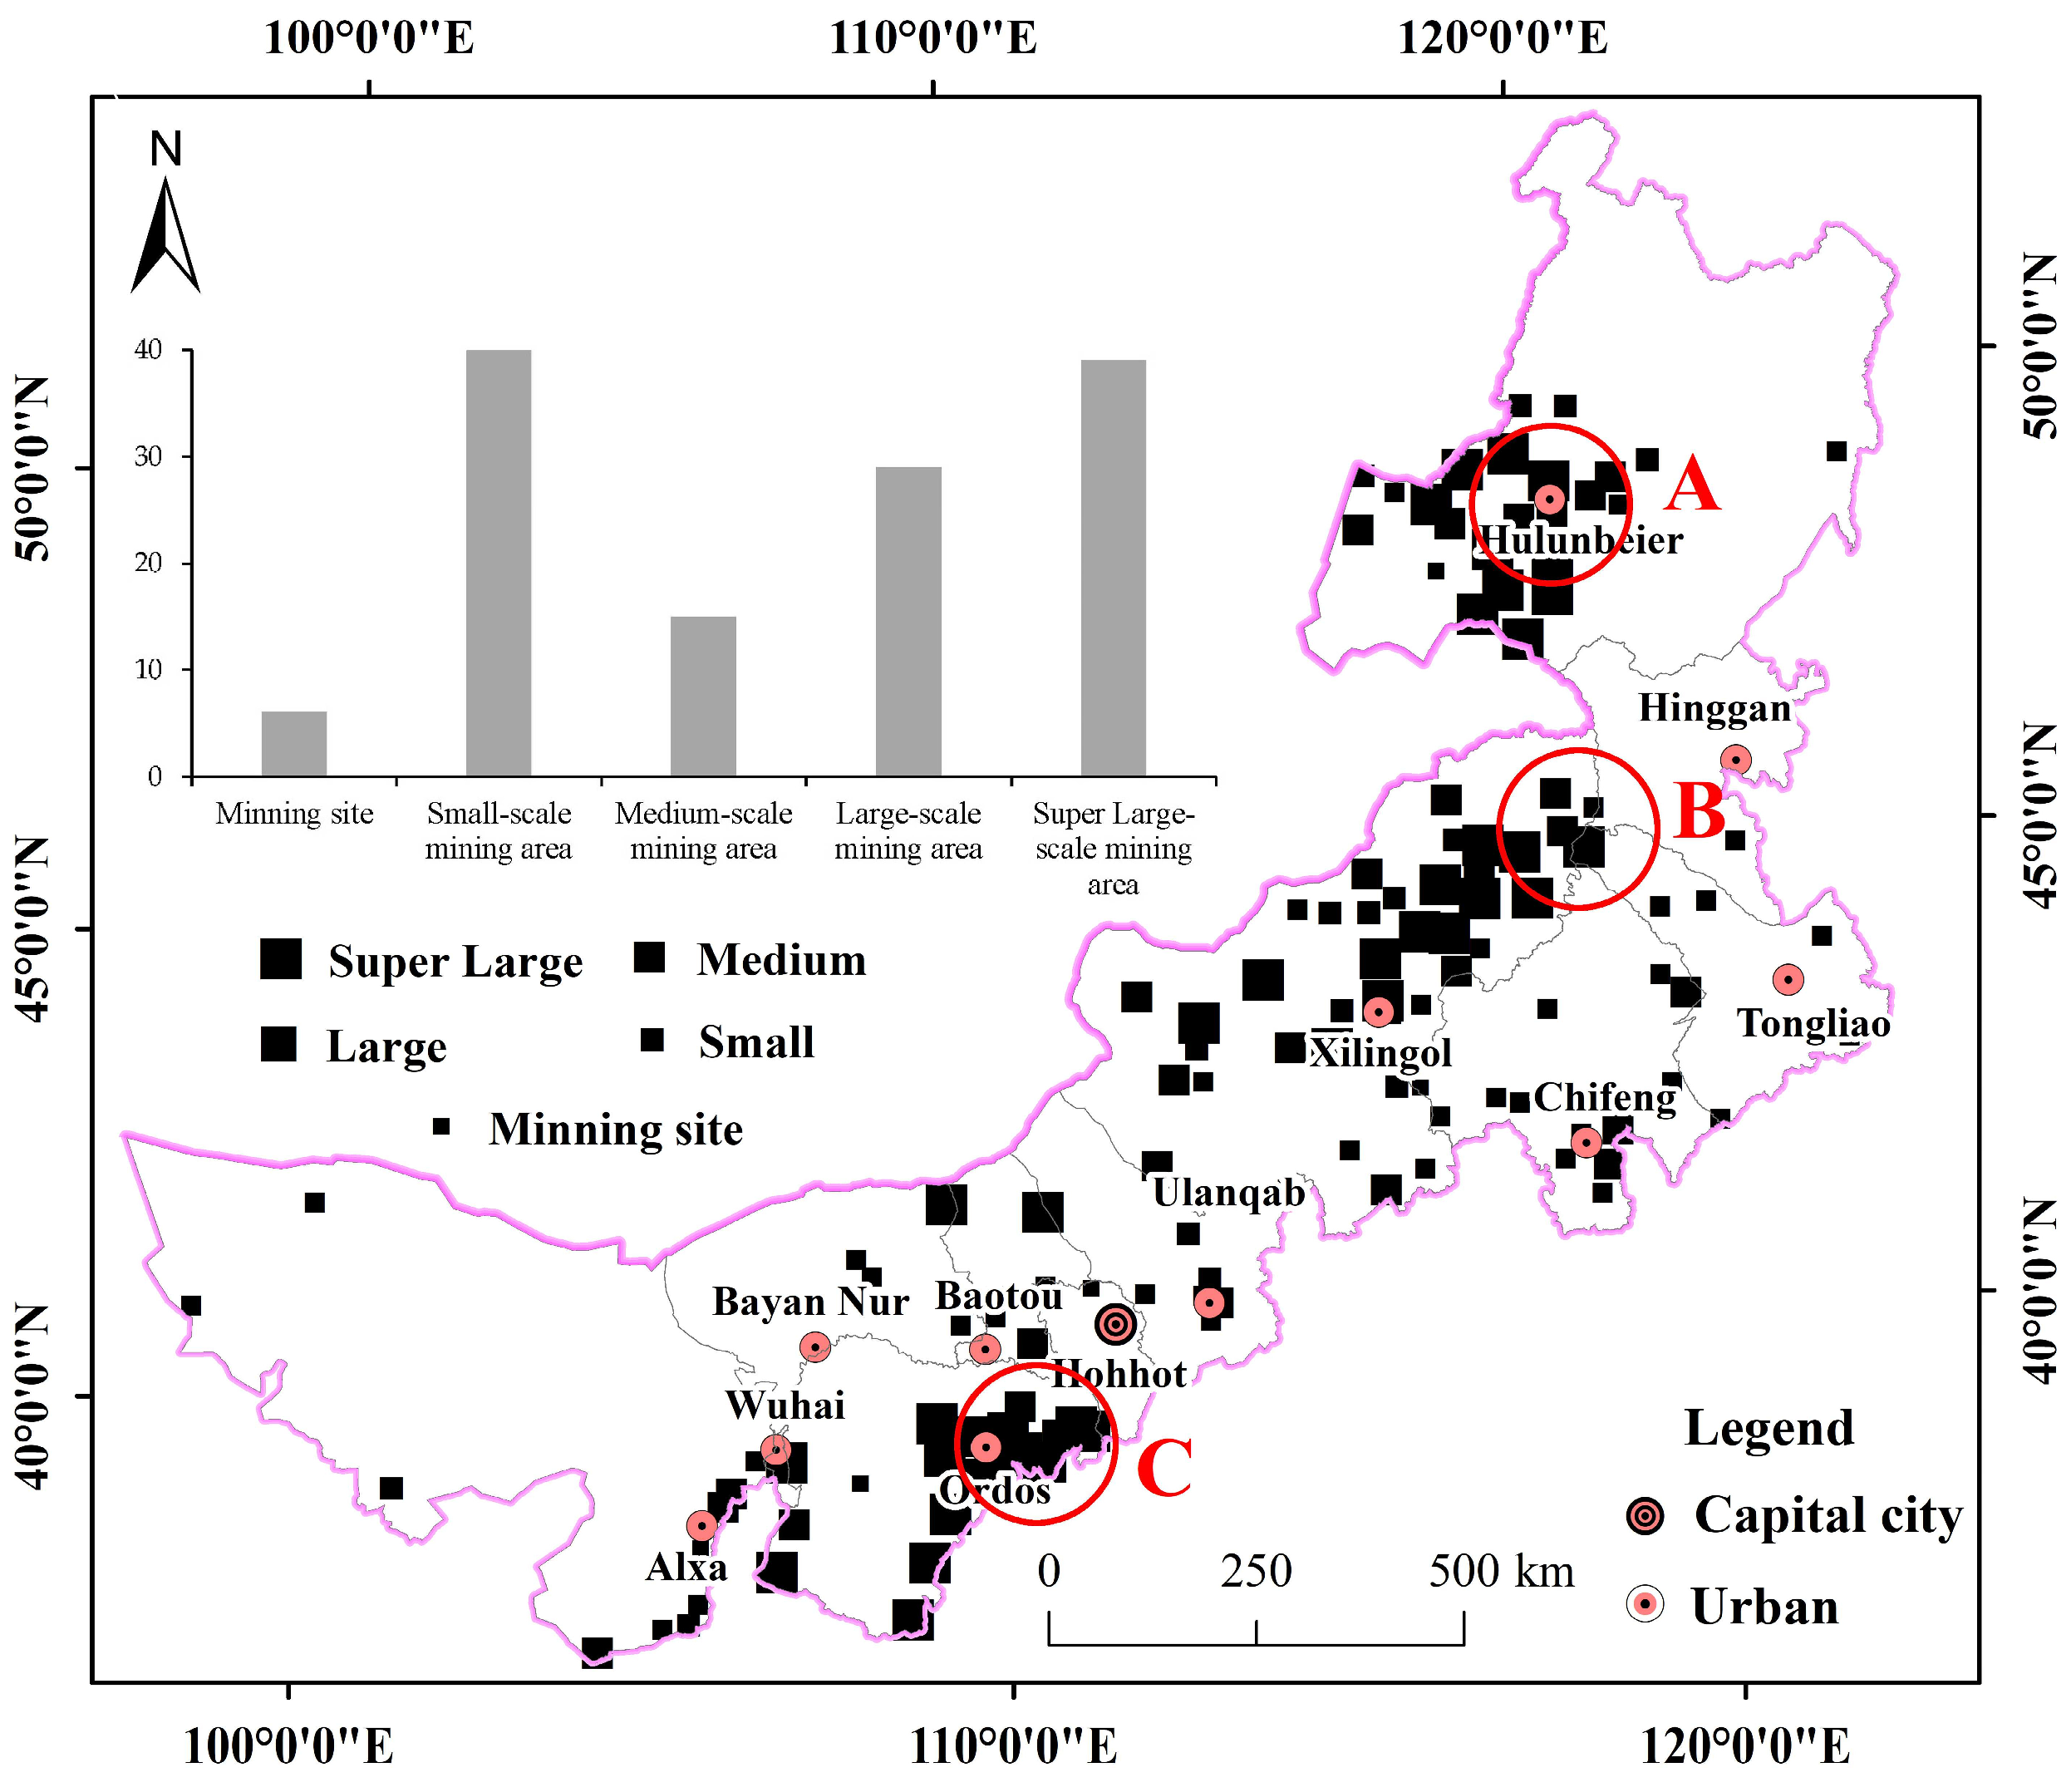
Sustainability 14 06252 g017
Figure 18. Image showing the distribution of coal mining areas in Inner Mongolia. (The bar chart in the upper right shows the number of mining areas of different sizes. Subfigures show the differences in the Yimin coal mining area (A), the Huolingole coal mining area (B), and the Jungar coal mining area (C) from 2000 to 2020).
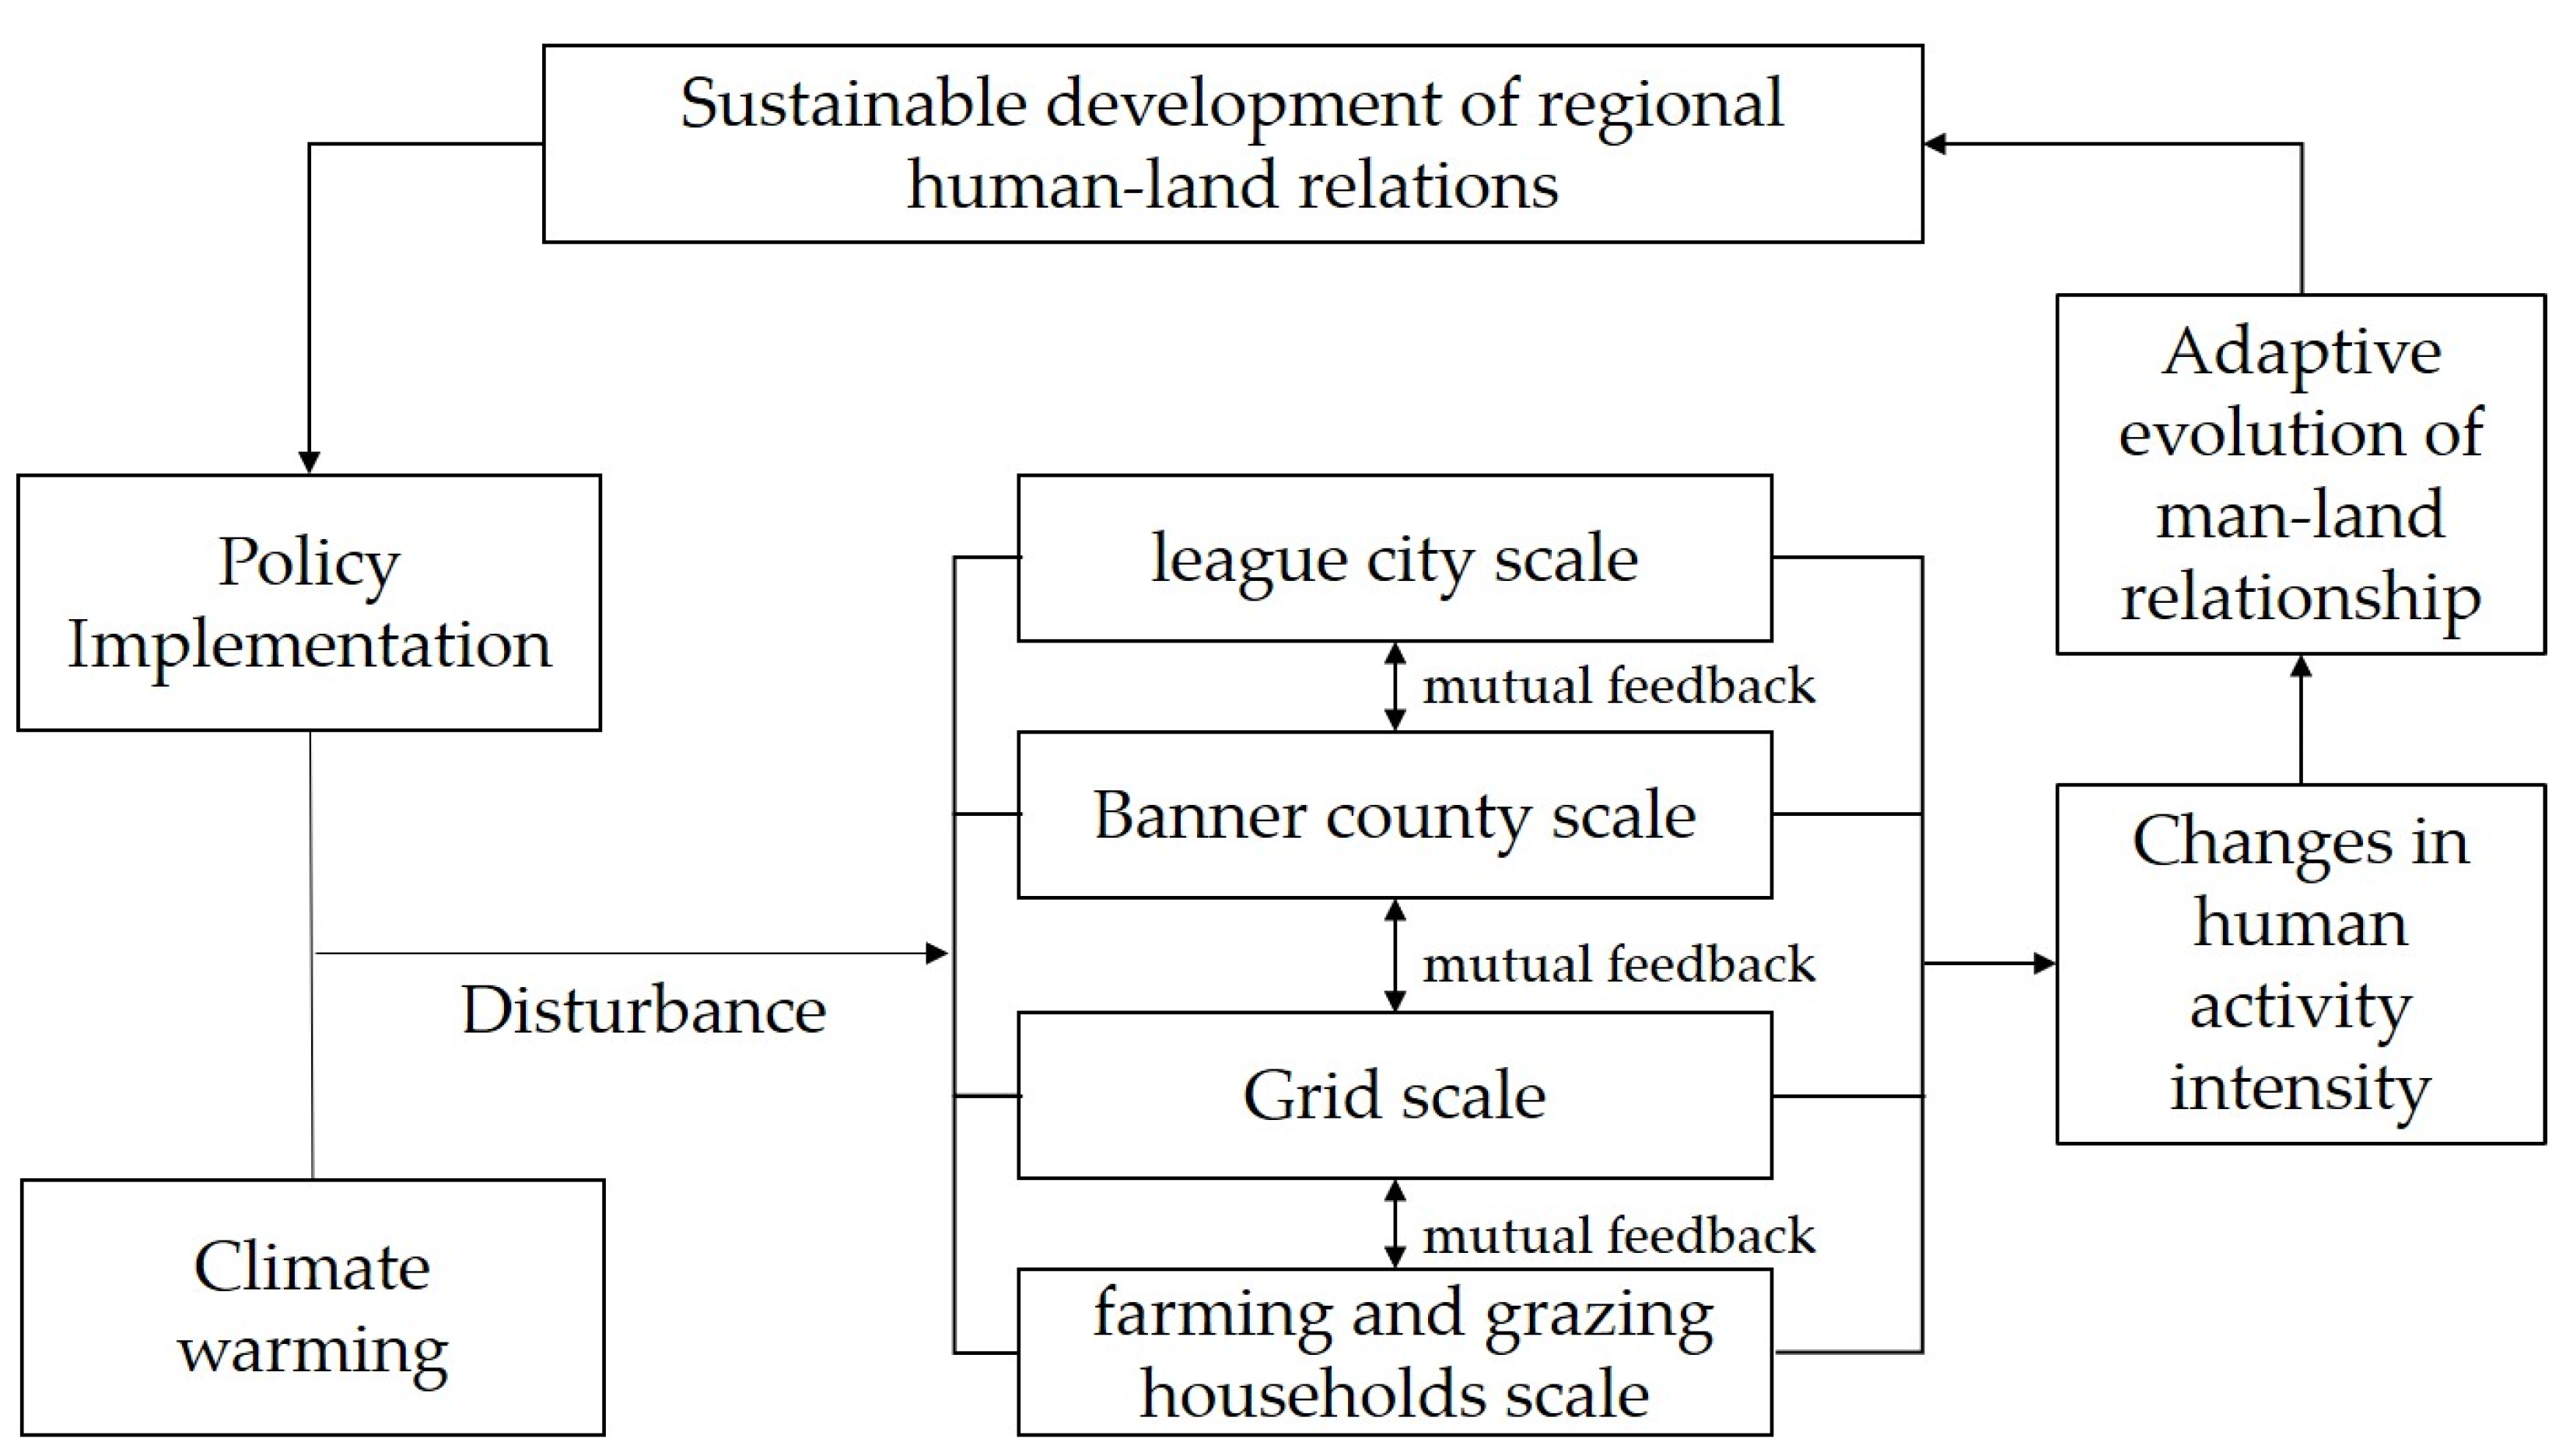
Sustainability 14 06252 g018aSustainability 14 06252 g018b
Figure 19. The cyclic evolution mechanism of the intensity of human activity.
Sustainability 14 06252 g019
Table 1. The conversion index of construction land equivalent of different land-use types.
Land-Use TypeCIDescription of Characteristic Signs
Cultivated land0.2The surface natural cover is changed; Planting 1-year-old crops
Forest0The surface natural cover is unaltered and unused
Grassland0.067The surface natural cover is unaltered but utilized
Shrubland0Dominated by annual crops
Wetland0The surface natural cover is unaltered and unused
Water bodies0The surface natural cover is unaltered and unused
Artificial Surfaces1The artificial compartment on the surface; water, nutrient, air, and heat exchange are blocked
Bare Land0The surface natural cover is unaltered and unused
Table 2. Area and change in land use in Inner Mongolia (104 km2).
YearCultivated LandForestGrasslandShrublandWetlandWater BodiesArtificial SurfacesBare Land
200014.27513.17653.1280.5750.7550.6480.75631.782
201013.75713.20754.5960.9490.5860.5280.88530.589
202015.27613.31353.5980.8800.5710.6041.47929.375
2010–2000−0.5180.0311.4680.374−0.169−0.120.129−1.193
2020–20101.5190.106−0.998−0.069−0.0150.0760.594−1.214
2020–20001.0010.1370.470.305−0.184−0.0440.723−2.407
Table 3. The number of counties in the three levels of the intensity of human activity from 2000 to 2020 (%).
YearHighMiddleLow
20009.9046.5343.57
201010.8947.5341.58
202015.8448.5235.64
Table 4. Global Moran’s I index values of the intensity of human activity in Inner Mongolia.
IndexLeague/City LevelBanner/County LevelPixel Level
2000201020202000201020202000201020202020–2000
Moran’s I−0.014−0.032−0.2370.6110.6110.5520.8810.8750.8630.572
z0.3880.297−0.71911.99412.06410.782269.545267.742264.215175.076
p0.6980.7670.4720.0000.0000.0000.0000.0000.0000.000
Table 5. Index selection of factors influencing the intensity of human activity.
IDNameAbbreviationCode
1Distance from central cityDCCX1
2Traffic conditionsTCX2
3Density of settlementsSDX3
4River densityRDX4
5Distance to nature reserveDNRX5
6DEMDEMX6
7Average annual precipitationPAX7
8Transformation of aspectTRASPX8
9Number of industrial enterprisesNIEX9
10Livestock densityLDX10
11Per capita GDPPCGDPX11
12The proportion of secondary industrySIX12
13The proportion of primary industryPIX13
14Population densityPDX14
15Major-function-oriented zoningMFOZX15
16Eco-functional zoneEFX16
17Distribution of coal resourcesCRX17
Table 6. Results of factor detection.
VariableqvSigRank of q Values
X1 Distance from central city0.01730.00007
X2 Traffic conditions0.02150.00004
X3 Density of settlements0.01810.00006
X4 River density0.01110.000013
X5 Distance to nature reserve0.01280.00009
X6 DEM0.01320.00008
X7 Average annual precipitation0.02790.00002
X8 Transformation of aspect0.00040.001116
X9 Number of industrial enterprises0.01150.000012
X10 Livestock density0.02910.00001
X11 Per capita GDP0.00460.000014
X12 The proportion of secondary industry0.01250.000011
X13 The proportion of primary industry0.00140.000015
X14 Population density0.02560.00003
X15 Major-function-oriented zoning0.01270.000010
X16 Eco-functional zone0.01950.00005
X17 Distribution of coal resources0.00010.034917
Table 7. Type or range of the influencing factors corresponding to the maximum intensity of human activity.
Impact FactorsType or RangeThe Maximum Change in Intensity of Human Activity
Distance from central city406–586 (km)1.581
Traffic conditions0–60 (km)1.777
Density of settlements1.8–3.1 (km/km2)10.337
River density0.143–0.231 (km/km2)2.788
Distance to nature reserve251–373 (km)1.634
DEM89–498 (m)2.132
Average annual precipitation330–429 (mm)1.942
Transformation of aspect0.2–0.41.155
Number of industrial enterprises38–662.234
Livestock density0.031–0.0833.87
Per capita GDP29–60 (million yuan)2.396
The proportion of secondary industry13–25 (%)1.697
The proportion of primary industry27–36 (%)1.186
Population density90,000–17,999 (person)14.972
Major-function-oriented zoningUrbanized development zone1.548
Eco-functional zoneAgro-ecological zone1.986
Distribution of coal resourcescoal bearing area2.205
Publisher’s Note: MDPI stays neutral with regard to jurisdictional claims in published maps and institutional affiliations.

