Article

Economic, Functional, and Social Factors Influencing Electric Vehicles’ Adoption: An Empirical Study Based on the Diffusion of Innovation Theory

1
School of Information Management, Wuhan University, Wuhan 430072, China
2
Information Center, Wuhan University, Wuhan 430072, China
3
Economics and Management School, Wuhan University, Wuhan 430072, China
*
Author to whom correspondence should be addressed.
These authors contributed equally to this work.
Sustainability 2022, 14(10), 6283; https://0-doi-org.brum.beds.ac.uk/10.3390/su14106283
Submission received: 19 April 2022 / Revised: 15 May 2022 / Accepted: 19 May 2022 / Published: 21 May 2022

Abstract

:
Although electric vehicles (EVs) have been heavily promoted as an effective solution to sustainable problems such as environmental pollution and resource constraints, the market penetration of EVs remains below expectations. By viewing EVs as innovative products that are different from traditional fuel vehicles, this study proposes a research model based on the diffusion of innovation theory, in which a series of factors influencing the adoption of EVs are identified. We collected 375 valid responses through an offline survey, and the structural equation modeling technique was used to empirically test the proposed model. The empirical results indicate that consumer adoption of EVs can be effectively predicted by three important innovation characteristics, namely perceived compatibility, perceived complexity, and perceived relative advantage. Furthermore, the results also suggest that factors in the economic aspect (monetary subsidy and risk of a price reduction), functional aspect (intelligent function and risk of sustainability), and social aspect (status symbol and risk of reputation), exert significant impacts on the adoption of EVs by influencing consumers’ perceptions of innovation characteristics. Theoretically, this study contributes to the literature by providing an appropriate theoretical perspective for understanding consumer adoption of EVs and identifying numerous significant antecedents of such behavior. Practically, the findings of this study can be applied to promote the market penetration of EVs.

1. Introduction

Compared with traditional fuel vehicles (FVs), electric vehicles (EVs) have the characteristics of zero pollution, low noise, and high efficiency, thus being more environmentally friendly, economical, and practical [1]. Especially in the context of global calls for energy conservation and emission reduction, EVs have been heavily promoted in the past two decades. However, due to the limited desire of consumers to purchase EVs, the market penetration rate of EVs is still not high, with the overall global market share at only about 8% for 2021 [2]. As the largest market for EVs, China is gradually tightening financial subsidies for manufacturers and consumers to transform from high-speed to high-quality development, which will obviously affect EVs’ further market penetration [3]. But indeed, relying solely on subsidies may ultimately become politically challenging as EVs scale up [4]. Therefore, it is urgent to investigate the other factors that facilitate or hinder an individual’s adoption of EVs.
Recently, an increasing number of studies have addressed this topic; however, most of them are built on classic behavioral theories that focus unilaterally on consumer cognition of EVs [5,6,7,8,9,10], such as the theory of planned behavior (TPB), the theory of reasoned action (TRA), the technology acceptance model (TAM), and rational choice theory (RCT), which ignore the fact that when making decisions people are actually faced with a choice of purchasing an FV or an EV, and that the final decision depends on their comparison of traditional FVs and emerging EVs. In this regard, the famous diffusion of innovation theory (DOI) that posits that the spread of an innovative product depends on five perceived characteristics (compatibility, complexity, relative advantage, observability, and trialability [11]), is more effective in understanding consumer behavior toward the adoption of EVs, because it not only focuses on the product itself but also captures the interaction between products and individuals, as well as the comparison between innovative products and traditional products [12,13,14].
Although several researchers have explored the market penetration of EVs from the perspective of the DOI theory [14,15,16], existing knowledge stops at examining the significant impacts of certain innovation characteristics on an individual’s purchasing behavior. As a result, the factors that will further affect consumer evaluation of these innovation characteristics remain unclear. In this regard, the current study first aims to test the relationships between the innovation characteristics from the DOI theory and consumer adoption of EVs and then attempts to investigate the specific factors that engender consumer perceptions of these innovation characteristics. Specifically, similar to many previous studies [14,17], this study focuses on three characteristics of the DOI theory, namely compatibility, complexity, and relative advantage. The other two innovation characteristics of the DOI theory, i.e., trialability and observability, were excluded because they are objective facts in the current research context, and they were found to be inconsistently related to the innovation diffusion process [18]. Furthermore, to overcome the biases due to the unequal attention paid to the benefits and risks of adopting EVs, this study identifies and discusses six important factors that are divided into three different aspects: economic aspect (monetary subsidies and risk of a price reduction), functional aspect (intelligent function and risk of sustainability), and social aspect (status symbol and risk of reputation).
The findings of this study can be useful for both academic and practical applications. Theoretically, this study enriches the literature related to the adoption of EVs by building on three important innovation characteristics from the DOI theory. Our empirical results confirm the strong explanatory power of the DOI theory in understanding consumer willingness to adopt EVs. Meanwhile, this study is expected to deepen academic cognition of the adoption of EVs by examining the impacts of numerous constructs on perceived innovation characteristics and consumers’ behavioral intentions. Practically, the findings obtained in this study can provide guidance for both government and manufacturers, especially in terms of financial subsidies, price setting, marketing promotion, product innovation, and some other aspects.
This paper is organized as follows: The literature review and theoretical basis will be presented in Section 2. Next, we propose our research model and develop the associated hypotheses in Section 3. The methodology and empirical results will be elaborated in Section 4 and Section 5, respectively. Section 6 will discuss the key findings, theoretical and practical implications, limitations, and future directions. Finally, Section 7 concludes this study.

2. Literature Review and Theoretical Background

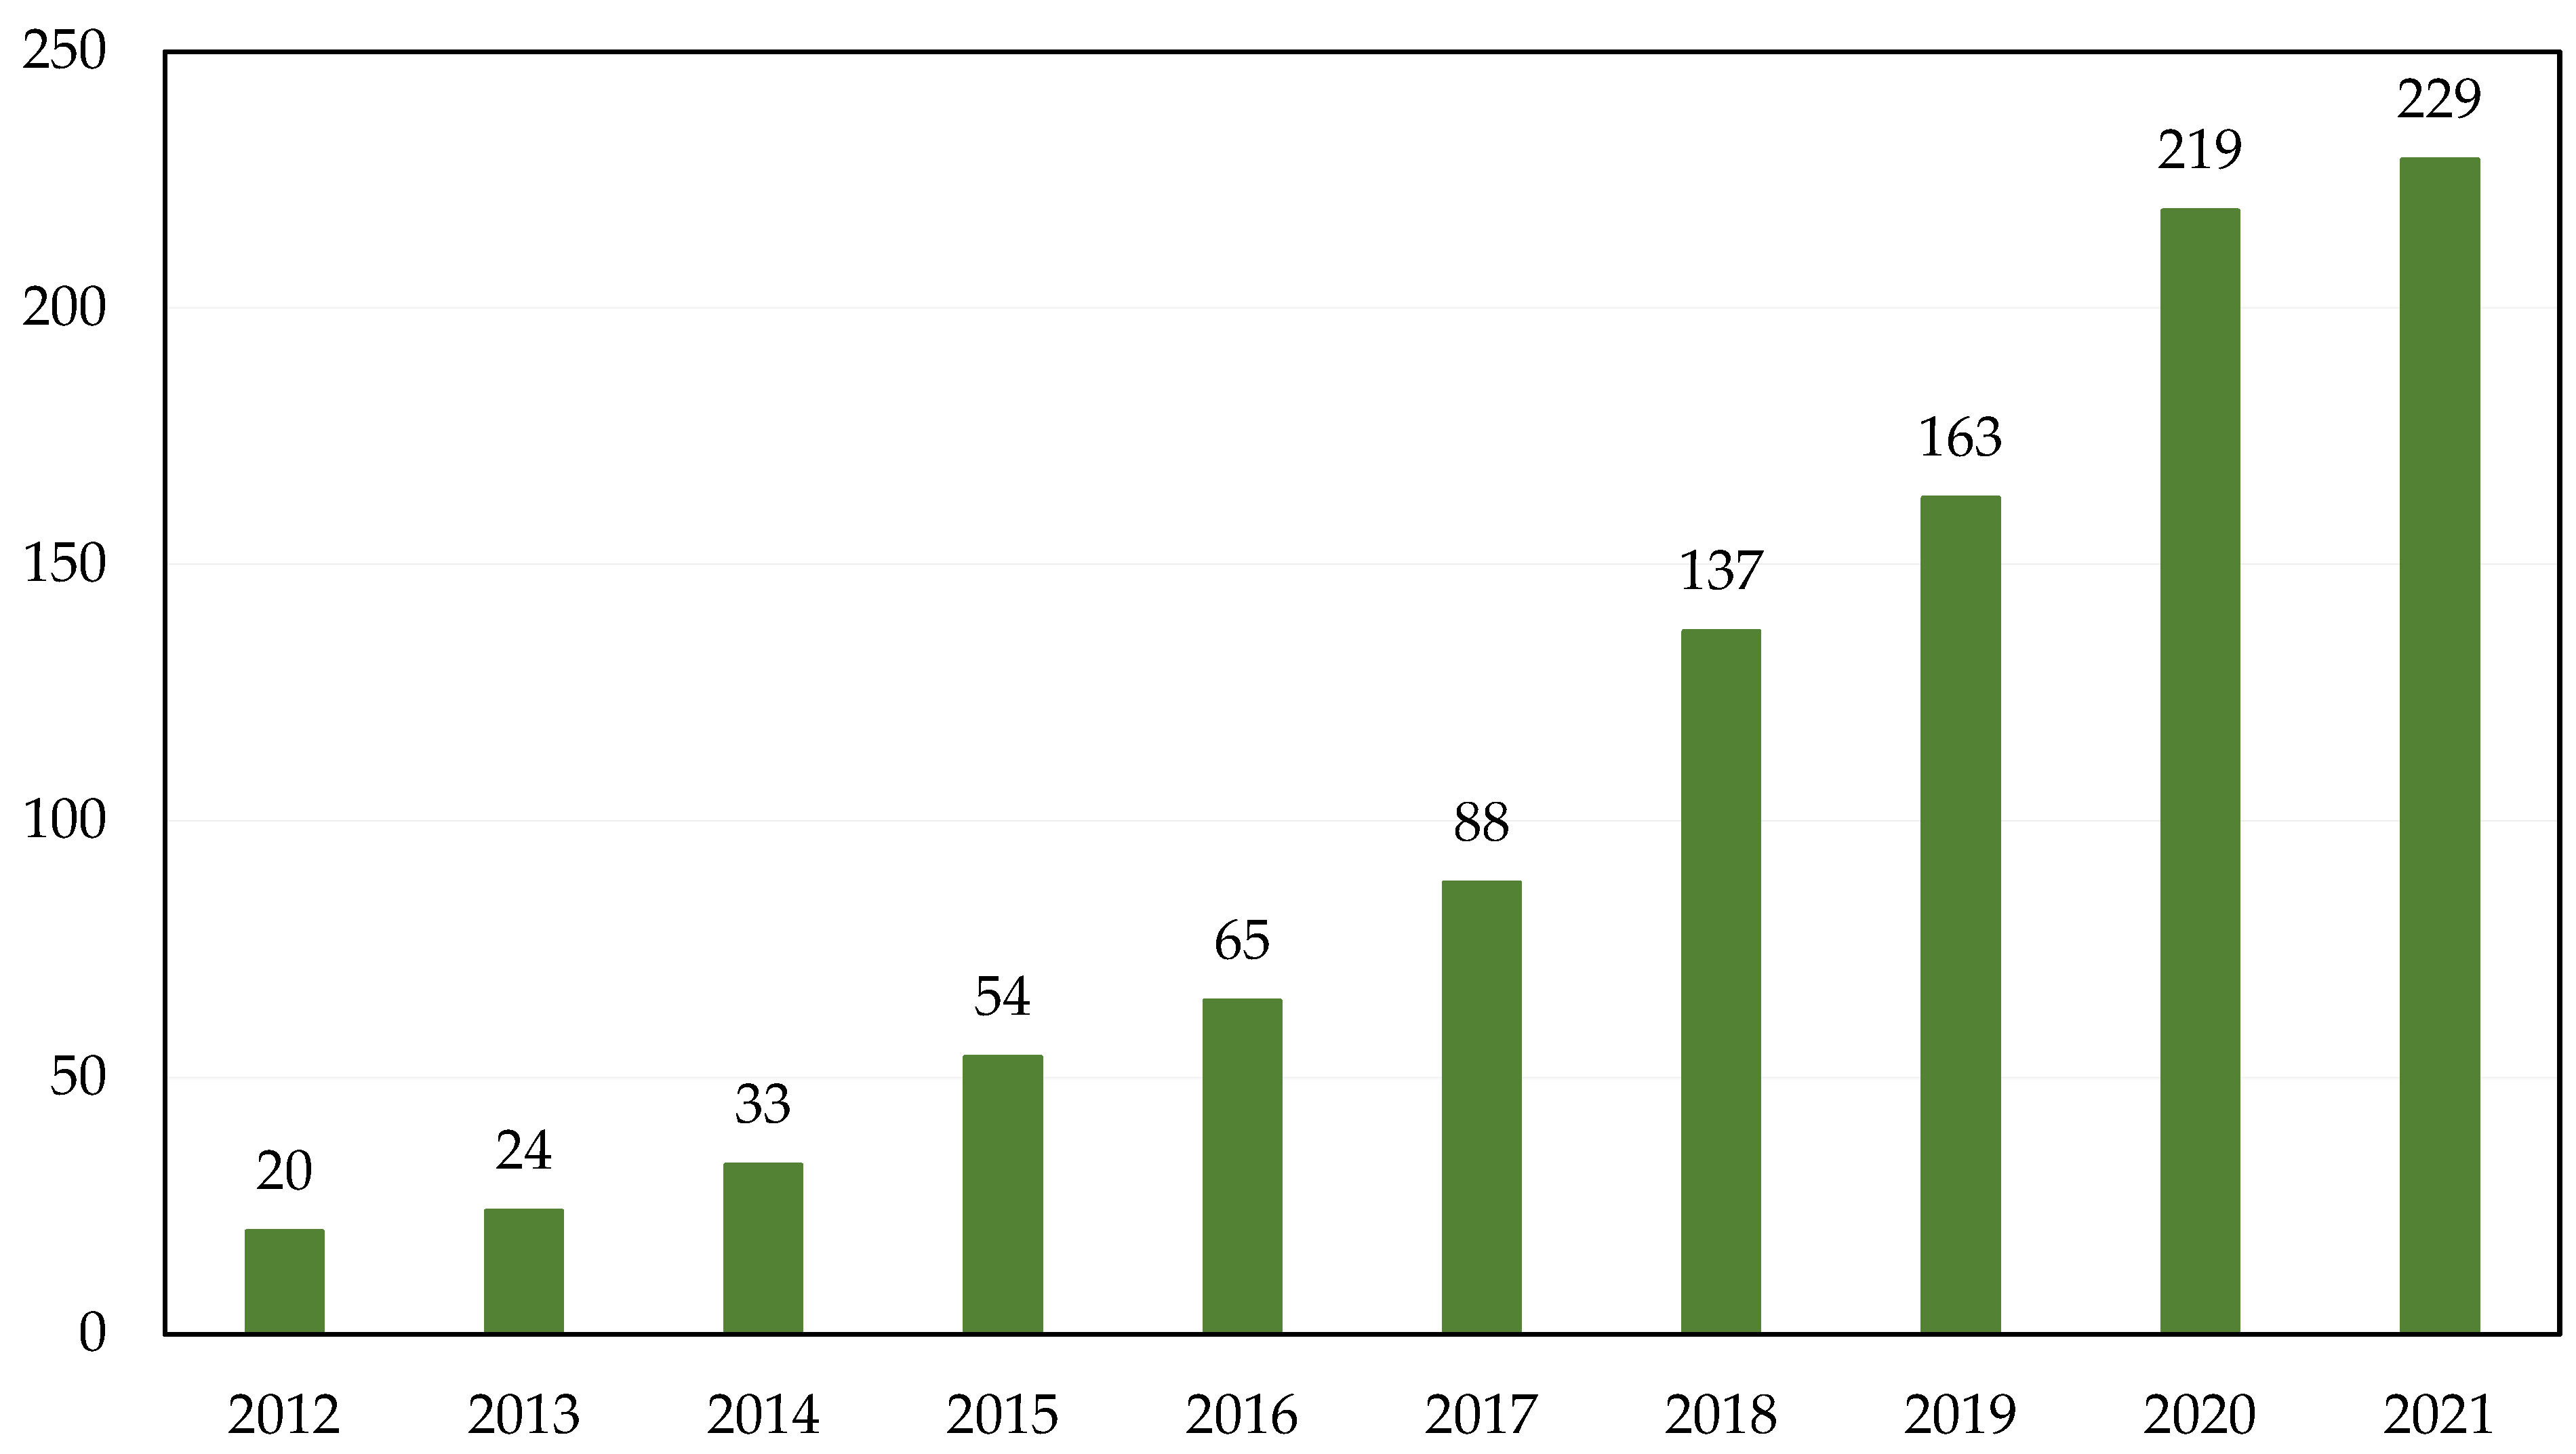
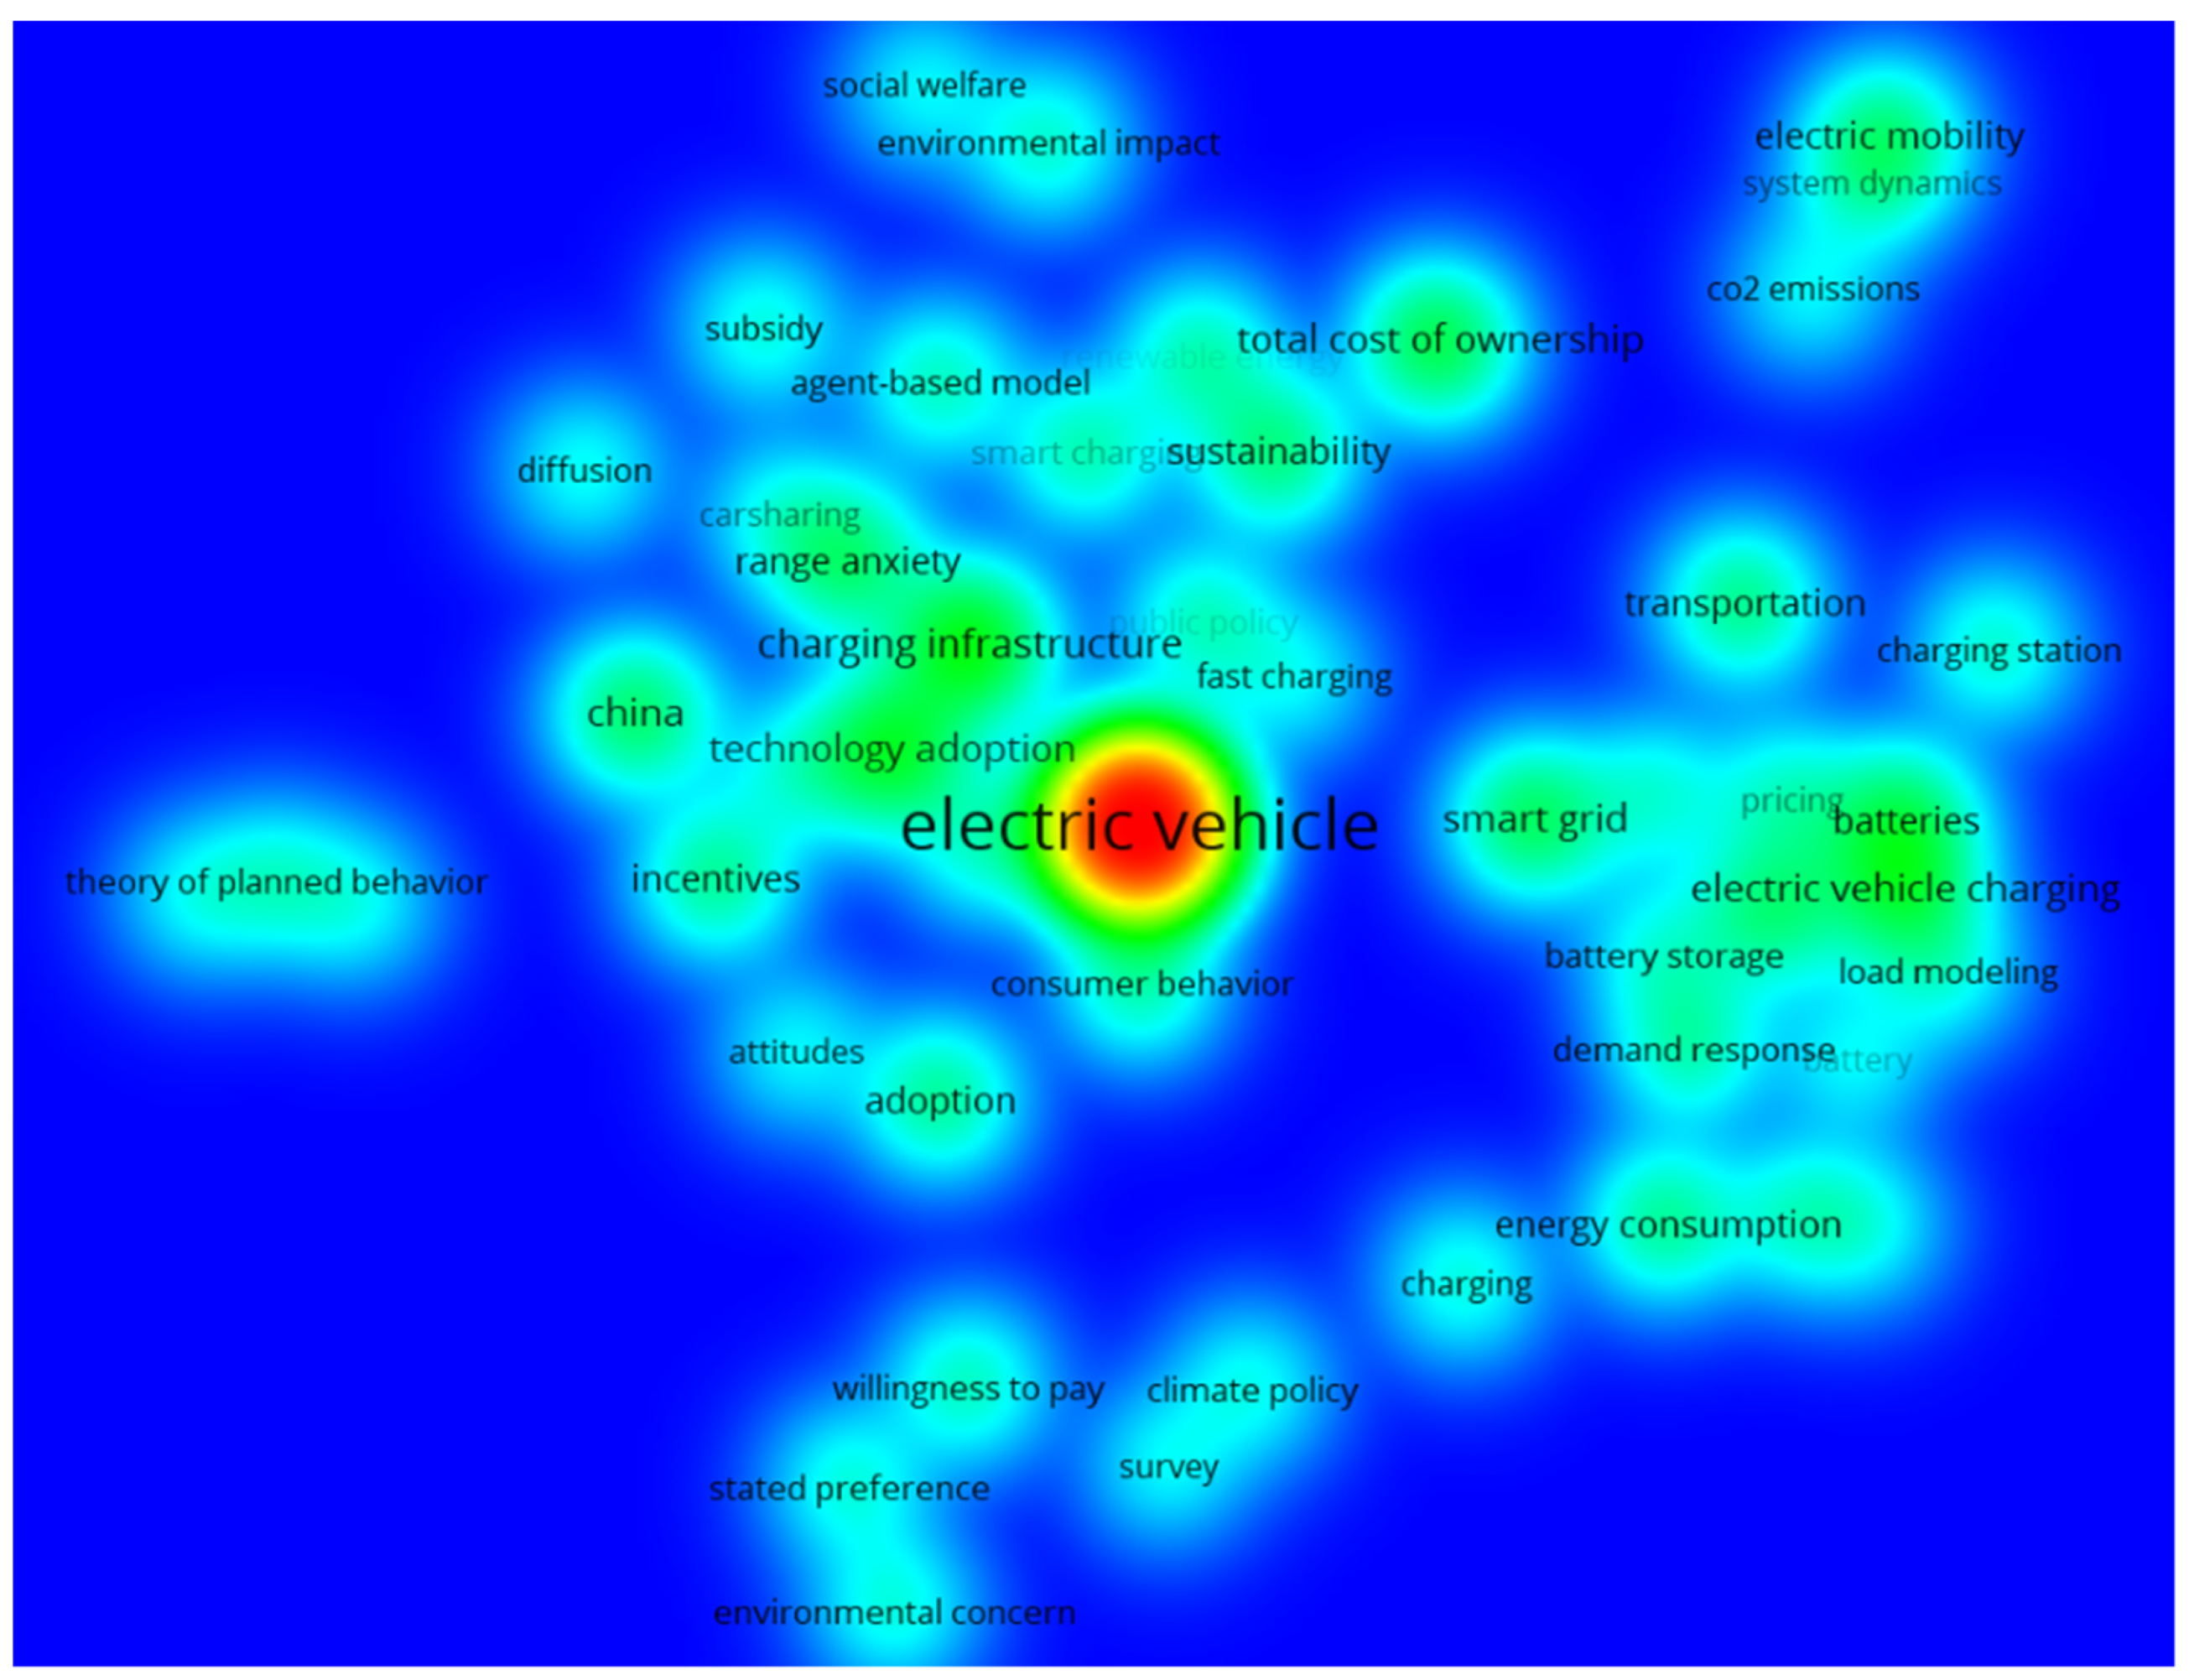
2.1. Literature Review

EVs have gradually entered the public consciousness during the past decade, attracting increasing interest from scholars. Accordingly, the number of relevant research articles has grown quickly. Several recent review articles have summarized the existing works in detail [12,19,20], so repetitious exposition is not necessarily conducive to deepening the academic understanding of this topic. In this regard, bibliometric methods, which provide a valuable tool to overcome subjective analysis in literature reviews [21], were used in this section. Specifically, we used the SCI-Expanded (Science Citation Index Expanded) and SSCI (Social Sciences Citation Index) in WOS (Web of Science) as bibliometric databases, because they are the most reliable databases and have been widely adopted in previous studies [22,23]. We applied the formula “TS = (“electric vehicle” OR “electric car”) AND TS = (“purchase” OR “adoption”)” to search for information during the last week of December 2021, and we limited our search to journal articles in the English language published in the past ten years (2012–2021). The results returned 1032 articles. Figure 1 shows the trend of publications.
To better explore the knowledge bases and research fronts in the field of the adoption EVs, we conducted a co-word analysis, which has been regarded as “a powerful tool for knowledge discovery in databases” [24]. Figure 2 displays the results of the keyword co-occurrence analysis using VOSviewer, in which the color coldness of the region where the keyword is located is positively correlated with its frequency. According to Figure 2, we can see that survey, agent-based modeling, stated preference analysis, and system dynamics are the most used methods in previous research [25,26,27]. TPB and TAM were widely adopted to develop the research models [28,29]. More specifically, scholars have paid particular attention to the factors that influence consumers’ adoption of EVs, which can be classified into three main categories. The first is the product and surrounding factors, and the related keywords include total cost of ownership, pricing, battery/battery storage, electric mobility, charging/charging station, smart charging, fast charging, and smart grid [30,31,32,33,34]. The second is policy factors, covering climate policy, public policy, social welfare, subsidy, incentive, and some other keywords [35,36,37,38]. The third is personal factors, such as environmental concern, attitude, range anxiety, and consumer preference [39,40,41,42]. Moreover, the impacts of promoting EVs on the environment, transportation, CO2 emissions, and energy consumption have also been emphasized in previous literature [43,44,45].
Although a great deal of work has been done to deepen the understanding of why consumers adopt EVs, the market penetration performance of EVs is still far below expectations. An important reason is that previous literature intensively focused on certain factors, such as subsidies and charging, which, to some extent, prevents practitioners from taking comprehensive measures to promote the further spread of EVs. Meanwhile, the illusion of a high growth rate caused by the small base in macroeconomic data makes researchers relatively optimistic about EVs, thus paying more attention to the factors promoting the adoption of EVs and ignoring the inhibitors. To narrow the above biases, this study remains neutral and identifies a series of factors influencing EVs adoption. The specific mechanisms will be discussed in detail in Section 3.

2.2. Diffusion of Innovation Theory

Rogers’s [46] diffusion of innovation theory (DOI) has become one of the most widely adopted models for investigating the process of innovation adoption during the past 30 years [47]. There are five stages from the emergence of innovation to its prosperity: (1) the knowledge stage, which means the exposure of the innovation; (2) the persuasion stage, in which favorable or unfavorable attitudes are established; (3) the decision stage, where an individual engages in activities that lead to either choosing to adopt the innovation or to reject it; (4) the implementation stage, which describes the usage of the innovation; and (5) the confirmation stage, in which the innovation is reinforced. Specific to the persuasion and decision stages, Labay and Kinnear [48] suggest that innovation characteristics are a significant construct that determine an individual’s technology adoption. In this regard, Rogers [11] identified five important innovation characteristics: (1) compatibility, defined as “the degree to which an innovation is perceived as consistent with the existing values, past experiences and needs of the potential adopters”; (2) complexity, defined as “the degree to which an innovation is perceived as relatively difficult to understand and use”; (3) relative advantage, defined as “the degree to which an innovation is perceived as being better than the idea it supersedes”; (4) observability, defined as “the degree to which the results of an innovation are visible to others”; and (5) trialability, defined as “the degree to which an innovation may be experimented with on a limited basis”.
Many researchers in the field of consumer behavior have developed models based on the DOI theory and proved the great explanatory power of this theory regarding individual behavioral intentions [49,50,51]. More relevantly, several recent studies have explained consumers’ EVs adoption from the perspective of the DOI theory, for example, Peters and Dütschke [14] found that the compatibility of EVs with personal needs is the most influential factor in the willingness to purchase an EV and that environmental advantages and financial incentives are much more important than the performance characteristics. Indeed, compared with traditional FVs, EVs can be regarded as innovative products, as EVs bring new experiences to users by using new energy, new systems, and new technologies. Taking into account the above discussions, the DOI theory is suitable for investigating EVs’ diffusion and was thus employed in the current study. Moreover, given that trialability and observability are not consistently related to the innovation diffusion process [17,18] and that they are usually objective facts that do not depend on individual perceptions in the context of EVs, in this study we focus on the impacts of the other three perceived innovation characteristics (compatibility, complexity, and relative advantage).

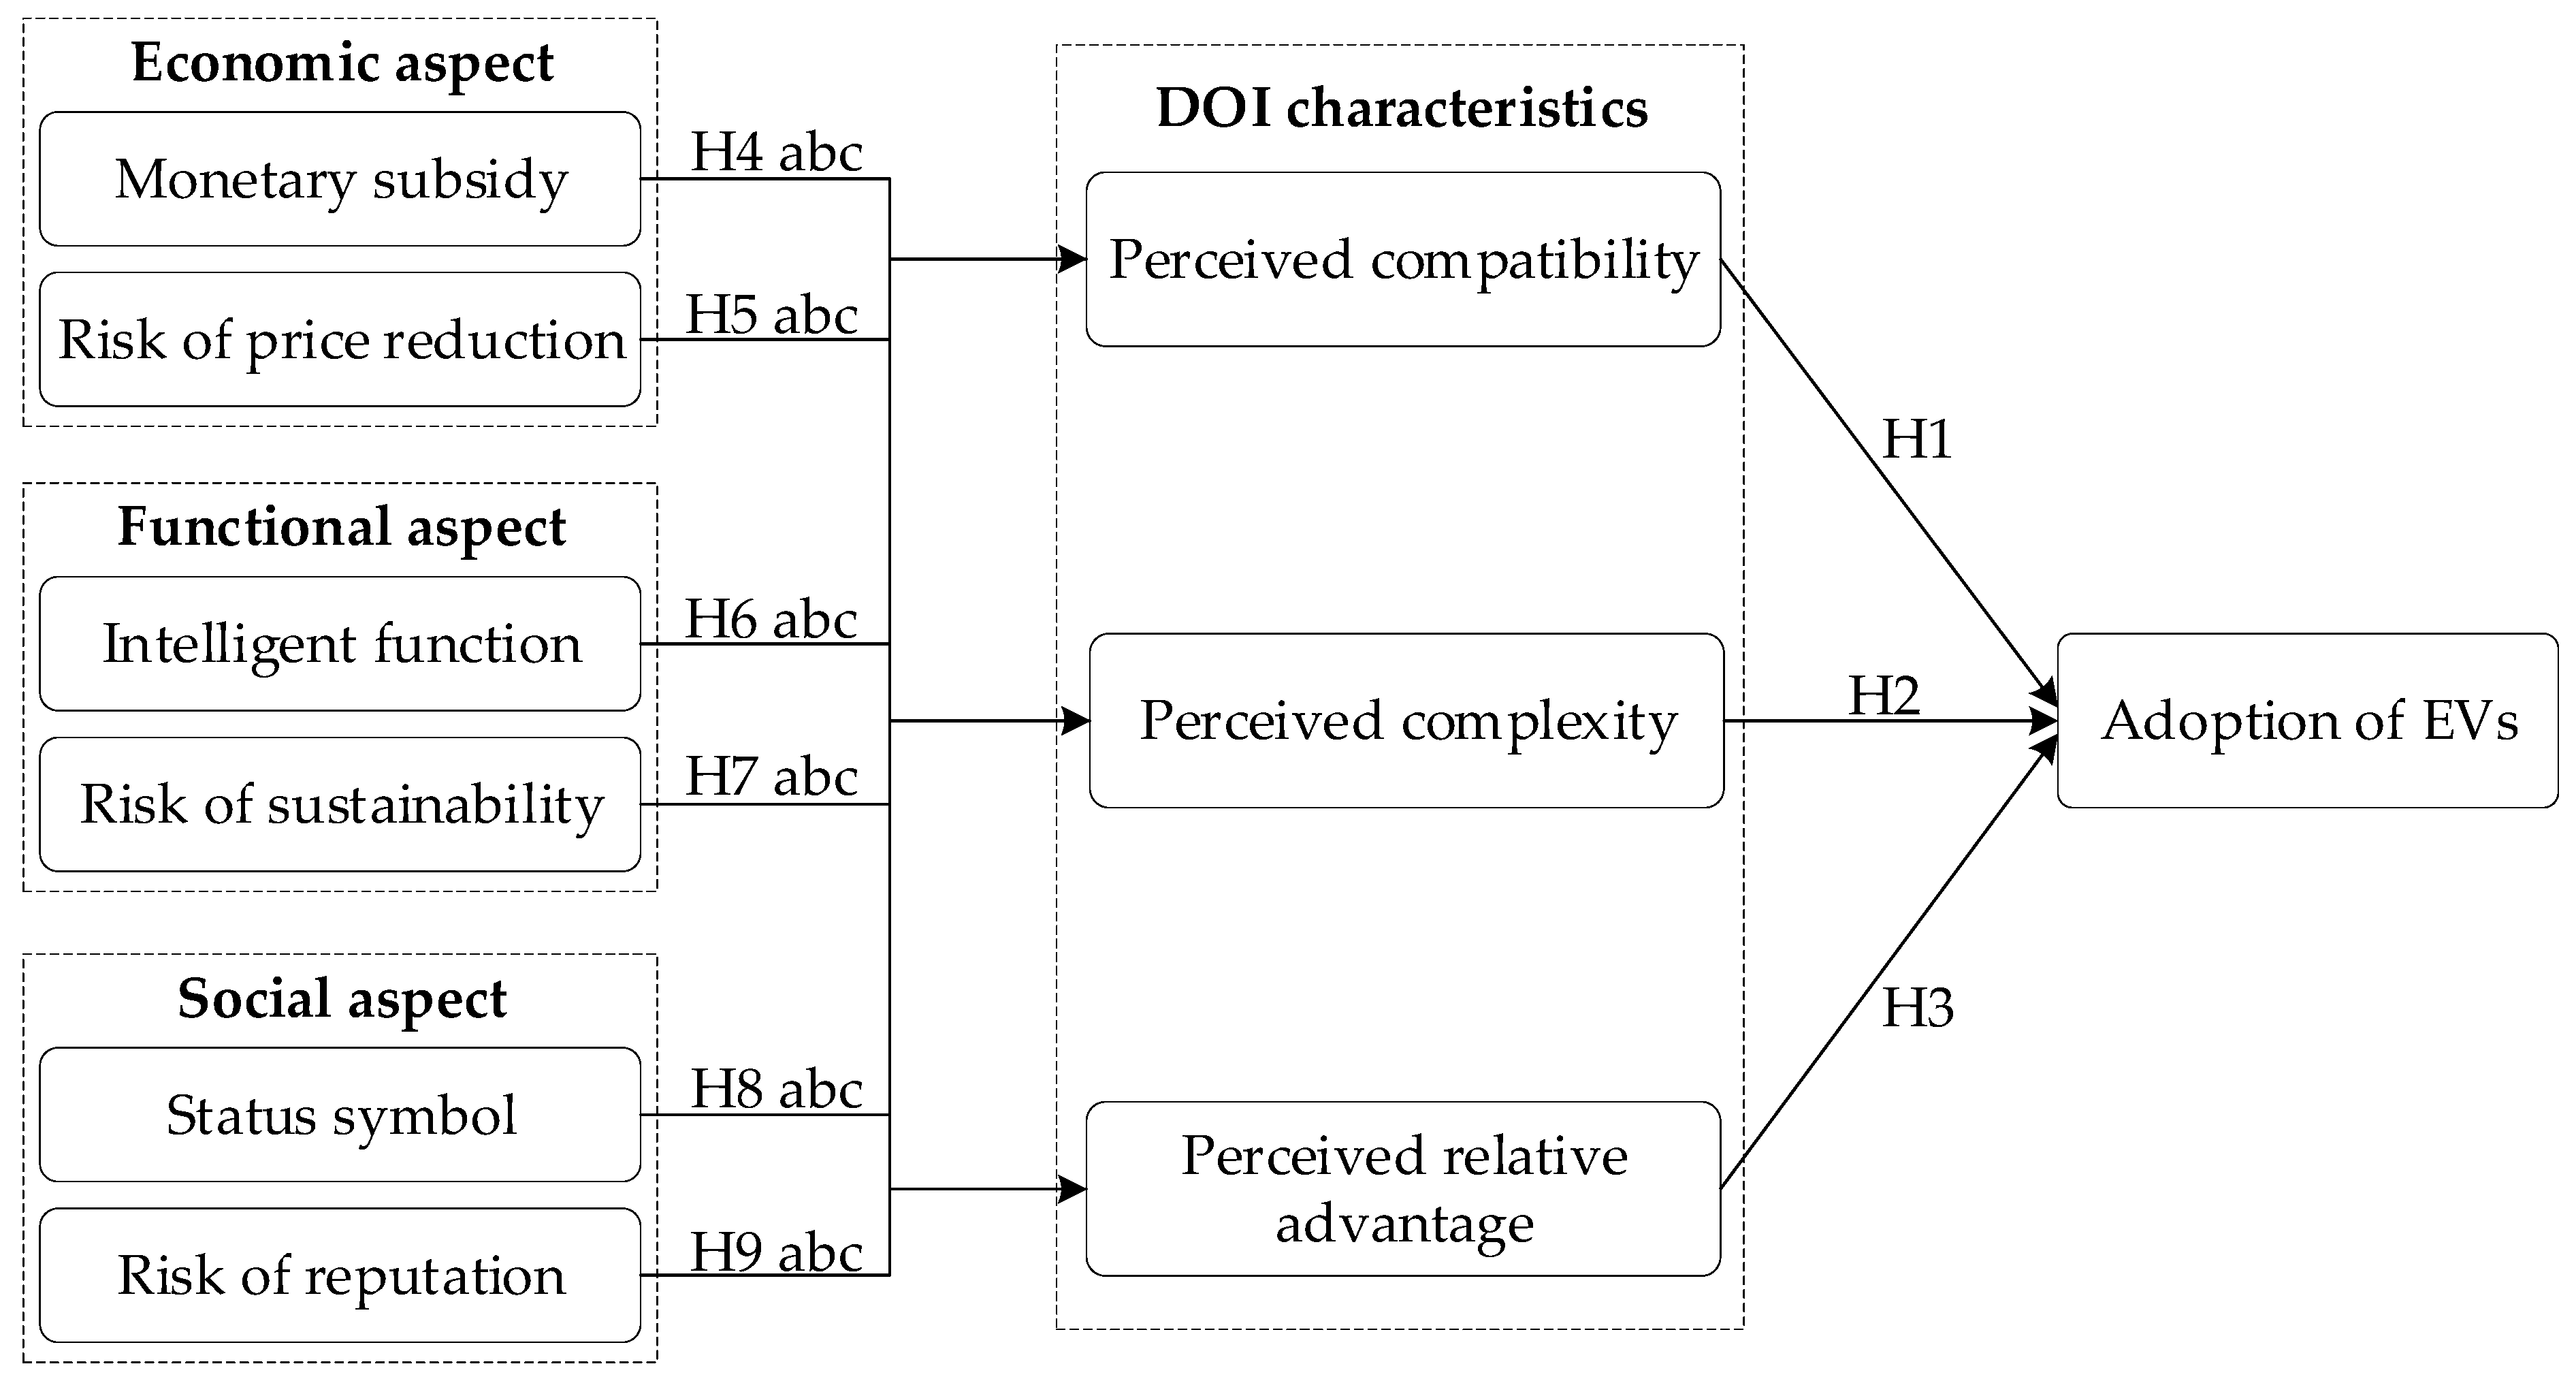
3. Research Model and Hypotheses

As depicted in Figure 3, this study developed a research model to investigate the factors influencing consumers’ adoption of EVs. Drawing on the DOI theory, we first propose that a consumer’s decision to adopt EVs depends on three important innovation characteristics, in which perceived compatibility and perceived relative advantage play a positive role, whereas perceived complexity plays a negative role (H1–H3). Then, we propose that economic factors (monetary subsidy and risk of a price reduction), functional factors (intelligent function and risk of sustainability), and social factors (status symbol and risk of reputation) will significantly affect the adoption of EVs by influencing consumer perceptions of innovation characteristics (H4–H9). The hypotheses presented in Figure 3 will be further developed in the following sections.

3.1. The Effects of Perceived Innovation Characteristics on the Adoption of EVs

Perceived compatibility refers to the degree to which an innovation is perceived as consistent with the existing values, beliefs, habits, and previous experiences of consumers [52]. Previous studies have shown that people are more likely to adopt technologies with which they are compatible, such as mobile banking [53], electronic commerce [54], smart speakers [50], and e-magazines [55]. Specific to the context of this study, perceived compatibility can be understood as the extent to which EVs fit with personal needs. According to the task-technology fit theory [56], the existence of a fit among tasks and technologies makes people feel relaxed and thus promotes their willingness to use the technology; On the contrary, people tend to reject the technology due to misfit-induced stress. In this regard, it is natural to suppose that consumers who believe that EVs can meet their daily needs and match their lifestyles are inclined to adopt EVs and if not, they are more likely to choose traditional FVs. Based on the above discussion, we posit the following hypothesis:
Hypothesis 1 (H1).
Perceived compatibility is positively related to consumer adoption of EVs.
Perceived complexity was defined by Rogers [57] as the degree to which a product is perceived to be difficult to understand, learn, and use; it captures users’ overall assessment of the ease of using an innovation. The technology acceptance model has argued that perceived ease of use is one of the primary determinants for technology adoption intentions, in that limited time and energy cause people to prefer easy-to-use technologies rather than complex ones [58]. In this sense, if using EVs causes too much concern and apprehension, people will perceive it as difficult and have a resistant attitude toward EVs. By contrast, people who believe EVs are easy to use will show a higher likelihood of adopting this innovative product. Beyond this, many previous studies have consistently shown that high complexity is a key factor impeding the diffusion of new technologies [59,60,61]. Therefore, in this study we naturally propose the following hypothesis:
Hypothesis 2 (H2).
Perceived complexity is negatively related to consumer adoption of EVs.
Perceived relative advantage refers to the degree to which an innovation provides more benefits than traditional technology [11]. As a comprehensive assessment of benefits and losses, plenty of literature has confirmed perceived relative advantage as a sufficient predictor of adopting innovations [62,63]. In this study, it measures the consumer value comparison between EVs and FVs. Although each of them may have drawbacks, this comparison only focuses on which one is better. For example, the range limitations of EVs can be offset by their special advantages, such as cheaper prices, lower operating costs, higher energy efficiency, fewer polluting emissions, relatively loose license issuance, and priority of passage. In this regard, consumers who discover the above advantages and hold the view that EVs are better than FVs are more likely to make the final decision to adopt EVs [64], leading to the following hypothesis:
Hypothesis 3 (H3).
Perceived relative advantage is positively related to consumer adoption of EVs.

3.2. The Antecedents of Perceived Innovation Characteristics

3.2.1. Economic Aspect

Monetary subsidy is an important measure to promote the distribution of EVs worldwide [65,66]. For example, official statistics show that annual sales of EVs in the Chinese market continued to increase after the subsidy policy was proposed in 2013, whereas the growth rate slowed down from 2018 onward due to the government’s adjustment of subsidy policies in 2017 [39]. Although the ultimate positive effects of monetary subsidies on consumer intention to purchase an EV is obvious, the underlying mechanisms need to be explored. In this study, we propose that the perceptions of innovation characteristics may act as a bridge that links them. Firstly, the conservation of resources theory states that humans have a natural tendency to conserve resources, such as food, water, and money [67]. Monetary subsidies reduce spending on transportation and save people money, which is highly compatible with their awareness of resource conservation. Therefore, we believe monetary subsidies can increase consumer perception of compatibility. Secondly, monetary subsidies help to reduce the complexities of adopting EVs. On the one hand, the saved money can be used to improve the ease of using EVs, such as by installing charging points at home. On the other hand, monetary subsidies are provided by the government, whose credibility can largely allay user concerns, as the government will be keen to help them with the difficulties of using EVs. Finally, the government offers discounts for EV owners, which is not available when buying FVs. Monetary subsidies save purchase costs, making EVs a better deal than FVs. Hence, we believe that monetary subsidies are conducive to increasing peoples’ perceived relative advantages of EVs. Taking into account the above discussions, we propose the following hypotheses:
Hypothesis 4a (H4a).
Monetary subsidy is positively related to perceived compatibility.
Hypothesis 4b (H4b).
Monetary subsidy is negatively related to perceived complexity.
Hypothesis 4c (H4c).
Monetary subsidy is positively related to perceived relative advantage.
The production cost of EVs is uncertain, especially in the current era of rapid technological iteration, and the price of EVs fluctuates more wildly than that of FVs. For example, Tesla, the world’s biggest EV manufacturer, has lowered its selling prices in China several times over the past two years [68]. As a result, some people openly call Tesla owners “leeks”. Although this is just a joke, this phenomenon reflects the risk of price reduction that consumers may face after purchasing an EV. Specifically, price reduction means that the value of the product people buy now will be discounted in the future, which does not conform to their preference for value preservation and appreciation [69]. Therefore, the risk of price reduction makes people uncomfortable and ultimately reduces their compatibility assessment. Meanwhile, to avoid further potential price reduction, people must consider carefully when to purchasing an EV. Previous studies have also found that price uncertainty can easily lead to consumers’ negative emotions such as regret and remorse [70]. Thus, the risk of price reduction will increase the complexity of adopting EVs. Finally, it is generally agreed that a stable price is advantageous to consumers because people usually do not want to see their purchases fall in price in the future [71]. In this regard, EVs with a high risk of price reduction can hardly be considered better than FVs. Based on the above discussion, we posit the following hypotheses:
Hypothesis 5a (H5a).
Risk of price reduction is negatively related to perceived compatibility.
Hypothesis 5b (H5b).
Risk of price reduction is positively related to perceived complexity.
Hypothesis 5c (H5c).
Risk of price reduction is negatively related to perceived relative advantage.

3.2.2. Functional Aspect

Similar to smart devices such as smartphones, smartwatches, and smart homes, EVs are powered by electricity. The consistency of the energy supply between primary and secondary functions makes it convenient to equip them with intelligent functions. For instance, manufacturers usually install automatic energy recovery systems for EVs to achieve more mileage [72], and it is almost certain that reliable internet connectivity and intelligent driving functions are now available in most EVs [73]. Therefore, people may feel that EVs are more intelligent. As an important aspect that sets EVs apart from traditional FVs, this study believes that intelligent functions can change overall consumer cognition of EVs. Specifically, out of motivation for self-presentation, people tend to do things that reflect who they are [74]. Similarly, the products people use, to some extent, represent their personality and shape their public image. For example, luxury goods make a person appear rich [75] and intelligent functions make the owner appear smart; such consistency can be understood as compatibility. In this sense, the smarter a person thinks EVs are, the more likely he/she is to develop a high level of compatibility that signals his/her intelligence. In addition, intelligent functions provide users with personalized services, which reduces the complexity of using EVs. Finally, intelligence is conducive to improving individual image. consumers who believe that EVs are intelligent will positively evaluate EVs and will want to discover more about their advantages. Based on the above discussion, we suggest the following hypotheses:
Hypothesis 6a (H6a).
Intelligent function is positively related to perceived compatibility.
Hypothesis 6b (H6b).
Intelligent function is negatively related to perceived complexity.
Hypothesis 6c (H6c).
Intelligent function is positively related to perceived relative advantage.
The risk of sustainability measures the vulnerability of EVs in terms of range and battery life, which has been highlighted as a major concern for consumers in previous literature [41,76,77]. In this study, we propose that the risk of sustainability will influence an individual’s perception of the innovation characteristics. Specifically, poor sustainability is a defect that inevitably affects an individual’s day-to-day use of an EV, for example, the Wuling mini EV only has a range of 120 km, making it seem less reliable. Due to a natural human preference for reliability [78], consumers who evaluate EVs as unsustainable will feel mismatched with them, resulting in a lower perception of compatibility. Secondly, the limited cruising range of EVs requires users to charge frequently. However, the number of charging stations is far fewer than regular gas stations and charging speeds are far slower than regular refueling speeds. As a result, EV owners often suffer from range anxiety [79]. Furthermore, the cost of replacing the battery, which is the core of an EV’s functionality but which faces a high risk of loss, is very high. Considering the above issues, those concerned with the risk of sustainability will regard using an EV as complicated [80]. Finally, FVs have obvious advantages in both refueling convenience and cruising range; the risk of sustainability thus reduces the relative advantage of EVs over FVs. Hence, we posit the following hypotheses:
Hypothesis 7a (H7a).
Risk of sustainability is negatively related to perceived compatibility.
Hypothesis 7b (H7b).
Risk of sustainability is positively related to perceived complexity.
Hypothesis 7c (H7c).
Risk of sustainability is negatively related to perceived relative advantage.

3.2.3. Social Aspect

Status symbol refers to the beliefs linking EVs and perceived social status, measured by an individual’s sense of superiority. Prior studies have shown that status symbol is an important motivation for consumer purchasing intentions and behaviors [81,82]. For example, a survey by Pojani et al. [83] suggested that most adolescents in Tirana, including those who do not particularly like cars and driving, intend to purchase cars because they are considered a necessity and a strong status symbol. In China, the CEOs of Li and NiO, have also publicly touted their EVs’ high-end positioning, which can undoubtedly create a noble status symbol. Specific to the context of this study, EVs are relatively new compared to FVs; thus, EV owners themselves tend to feel like innovators [84]. Meanwhile, EVs have the characteristics of zero pollution and low-energy consumption; driving an EV establishes an image of an environmental protection practitioner [85]. These symbols form part of an individual’s social capital, thereby enhancing the perception of compatibility. As for perceived complexity, the theory of limited attention [86] motivates us to believe that the positive outcomes will diminish consumer attention on the negative ones, and compensate for the complexity of EVs. Finally, as a special form of perceived value, status symbol undoubtedly increases the relative advantage of EVs, whereas traditional FVs are too common to be a status symbol. Based on the above discussion, we posit the following hypotheses:
Hypothesis 8a (H8a).
Status symbol is positively related to perceived compatibility.
Hypothesis 8b (H8b).
Status symbol is negatively related to perceived complexity.
Hypothesis 8c (H8c).
Status symbol is positively related to perceived relative advantage.
Although EVs can be a positive status symbol, they could also face negative social outcomes, conceptualized in this study as the risk of reputation. For example, with FVs still dominating the market, people who drive EVs could be regarded by others as out-of-touch and consequently encounter social exclusion [87]. Meanwhile, the inherent shortcomings of EVs, such as short battery life and inconvenient charging, could be magnified, leading to discrimination against EV owners. In addition, there may be a cognitive bias in society that EV owners are poor and that their purpose is to reduce transportation costs, as financial subsidies are only available for EVs and the price of electricity is much lower than gasoline. These inappropriate perceptions of EVs have negative impacts on owners’ social reputations, thus weakening their perceptions of their own compatibility with EVs, as well as the other relative advantages EVs have over FVs. Furthermore, the theory of planned behavior proposes that subjective norm is a key factor determining human behavior [88], including the adoption of EVs [28]. In this aspect, the risk of reputation, which runs counter to social norms, will undoubtedly increase the social pressures experienced by EV owners, leading to a higher level of perceived complexity. Taking into account the above discussion, we posit the following hypotheses:
Hypothesis 9a (H9a).
Risk of reputation is negatively related to perceived compatibility.
Hypothesis 9b (H9b).
Risk of reputation is positively related to perceived complexity.
Hypothesis 9c (H9c).
Risk of reputation is negatively related to perceived relative advantage.

4. Methodology

4.1. Measures

The measures for the innovation characteristics and the adoption of EVs were selected from previous literature, with slight modifications to fit the current study. Specifically, perceived compatibility was measured with four items from Makanyeza [53], perceived complexity was measured with four items from Moore and Benbasat [89], and perceived relative advantage was measured with three items from Xu et al. [64]. To measure consumer adoption intentions, four items from Xu et al. [64] and Sreen et al. [90] were selected. Regarding the benefits and risks explored in this study, we invited five potential buyers of EVs and conducted several focus group discussions to identify their concerns. Then, we conducted a pre-test with 30 experienced graduate students, and the questions for each construct were adjusted based on their suggestions. Finally, monetary subsidy was measured with four items; a sample item is “the purchase subsidy for EVs is attractive to me”. Risk of price reduction was measured with three items; a sample item is “the price of EVs is likely to fall in the future”. Intelligent function was measured with three items; a sample item is “EVs are smart”. Risk of sustainability was measured with four items; a sample item is “the battery of EVs is easy to loss and scrap”. Status symbol was measured with three items; a sample item is “EVs are a symbol of identity and status”. Risk of reputation was measured with three items; a sample item is “driving EVs harms one’s social reputation”. The detailed measurement items can be found in Appendix A. All of them were answered on a seven-point Likert scale with 1 = “strongly disagree”, 4 = “neutral” and 7 = “strongly agree”.

4.2. Data Collection and Samples

Although online surveys have advantages such as lower costs and less time required, the potential drawbacks are also salient. To avoid taking up time, respondents may not answer the questions carefully. Therefore, we adopted a supervised offline survey to obtain more reliable empirical data in this study. The data were collected in Wuhan, the largest city in central China with more than 13.5 million permanent residents. With the help of local subway staff, we selected several core subway stations (i.e., Wuhan railway station, Zhongnan Road, Jianghan Road) as the places to distribute questionnaires. Some small gifts worth about RMB 10 were offered to entice passengers, but only those familiar with EVs were allowed to participate in our survey. To improve data quality, we conducted one-to-one supervision when the respondents filled in the questionnaires and solved the problems they encountered during the process. A total of 400 questionnaires were sent out, of which 25 were incomplete. Hence, we finally obtained 375 valid responses. Table 1 reports the demographic characteristics of the respondents.

4.3. Statistical Analysis

Firstly, we performed a statistical power analysis using G*Power 3.1 to ensure the statistical power of our data in estimating the proposed model [91]. The results suggest that the required minimum sample size is 226, with an anticipated effect size of 0.15, a desired statistical power level of 0.95, and a confidence level of 0.99. In this sense, the sample size of 375 in this study demonstrates sufficient statistical power.
Secondly, we assessed the non-response bias by testing any significant differences between early and late responses [92]. A t-test was performed on the mean values of all the constructs from the 243 early respondents (65%) and the 132 late respondents (35%). The results suggest that the p-values range from 0.234 to 0.984, that is, no significant difference exists between the two sets. As such, this study does not suffer from the non-response bias and the representativeness of our sample was satisfied.
Thirdly, we tested multicollinearity by running the variance inflation factor and the tolerance. All the constructs were put into a model and a linear regression was performed in SPSS. The results indicate that the values of the variance inflation factor range from 1.459 to 3.148, well below the recommended threshold of 3.3 [93]. The test also yielded a minimum tolerance of 0.318, which is much greater than the benchmark of 0.1 [94]. Hence, the multicollinearity problem is not a concern in this study.
Additionally, we examined the issue of common method bias through two methods. Harman’s single factor test was first employed [95]. The factor analysis extracted eight factors with eigenvalues greater than 1, and the first factor only explains 22.66% of the total variance, which is far less than 50%. Liang et al.’s [96] procedure was then carried out and the results are shown in Table 2. The average variance explained by the substantive constructs is 0.693, whereas the average variance explained by the method construct is 0.004. The ratio of substantive variance to method variance is about 173:1, demonstrating that the method-based variance is small enough to be ignored. Taken together, the common method bias is not a threat in this study.

5. Data Analysis and Results

The partial least-squares-based structural equation modeling (PLS-SEM) technique was adopted to analyze the data, as it is more appropriate for exploratory research and performs better in small and non-normal sample analyses [97]. Following Anderson and Gerbing’s [98] two-stage analysis procedure, we first test the measurement model with confirmatory factor analysis and then examine the proposed hypotheses by calculating the structural model. In particular, SmartPLS 3.2.9 serves the process of data analysis [99].

5.1. Measurement Model

The measurement model was examined to assess the reliability and validity of the constructs. As illustrated in Table 3, the Cronbach’s alpha (CA) values of our constructs range from 0.729 to 0.853, and the composite reliability (CR) values range from 0.847 to 0.965, both of which exceed the recommended value of 0.70, indicating good reliability [100]. Meanwhile, the item loadings of each construct have exceeded the acceptable cutoff of 0.60 [101], and the average variance extracted (AVE) from each construct is higher than the 0.50 threshold [102], demonstrating adequate convergent validity. Regarding discriminant validity, Table 4 shows that all the squared roots of AVE are larger than the related inter-construct correlations, satisfying Fornell and Larcker’s [102] criterion. Taken the above results together, the measurement model of this study has excellent reliability, adequate convergent validity, and strong discriminant validity.

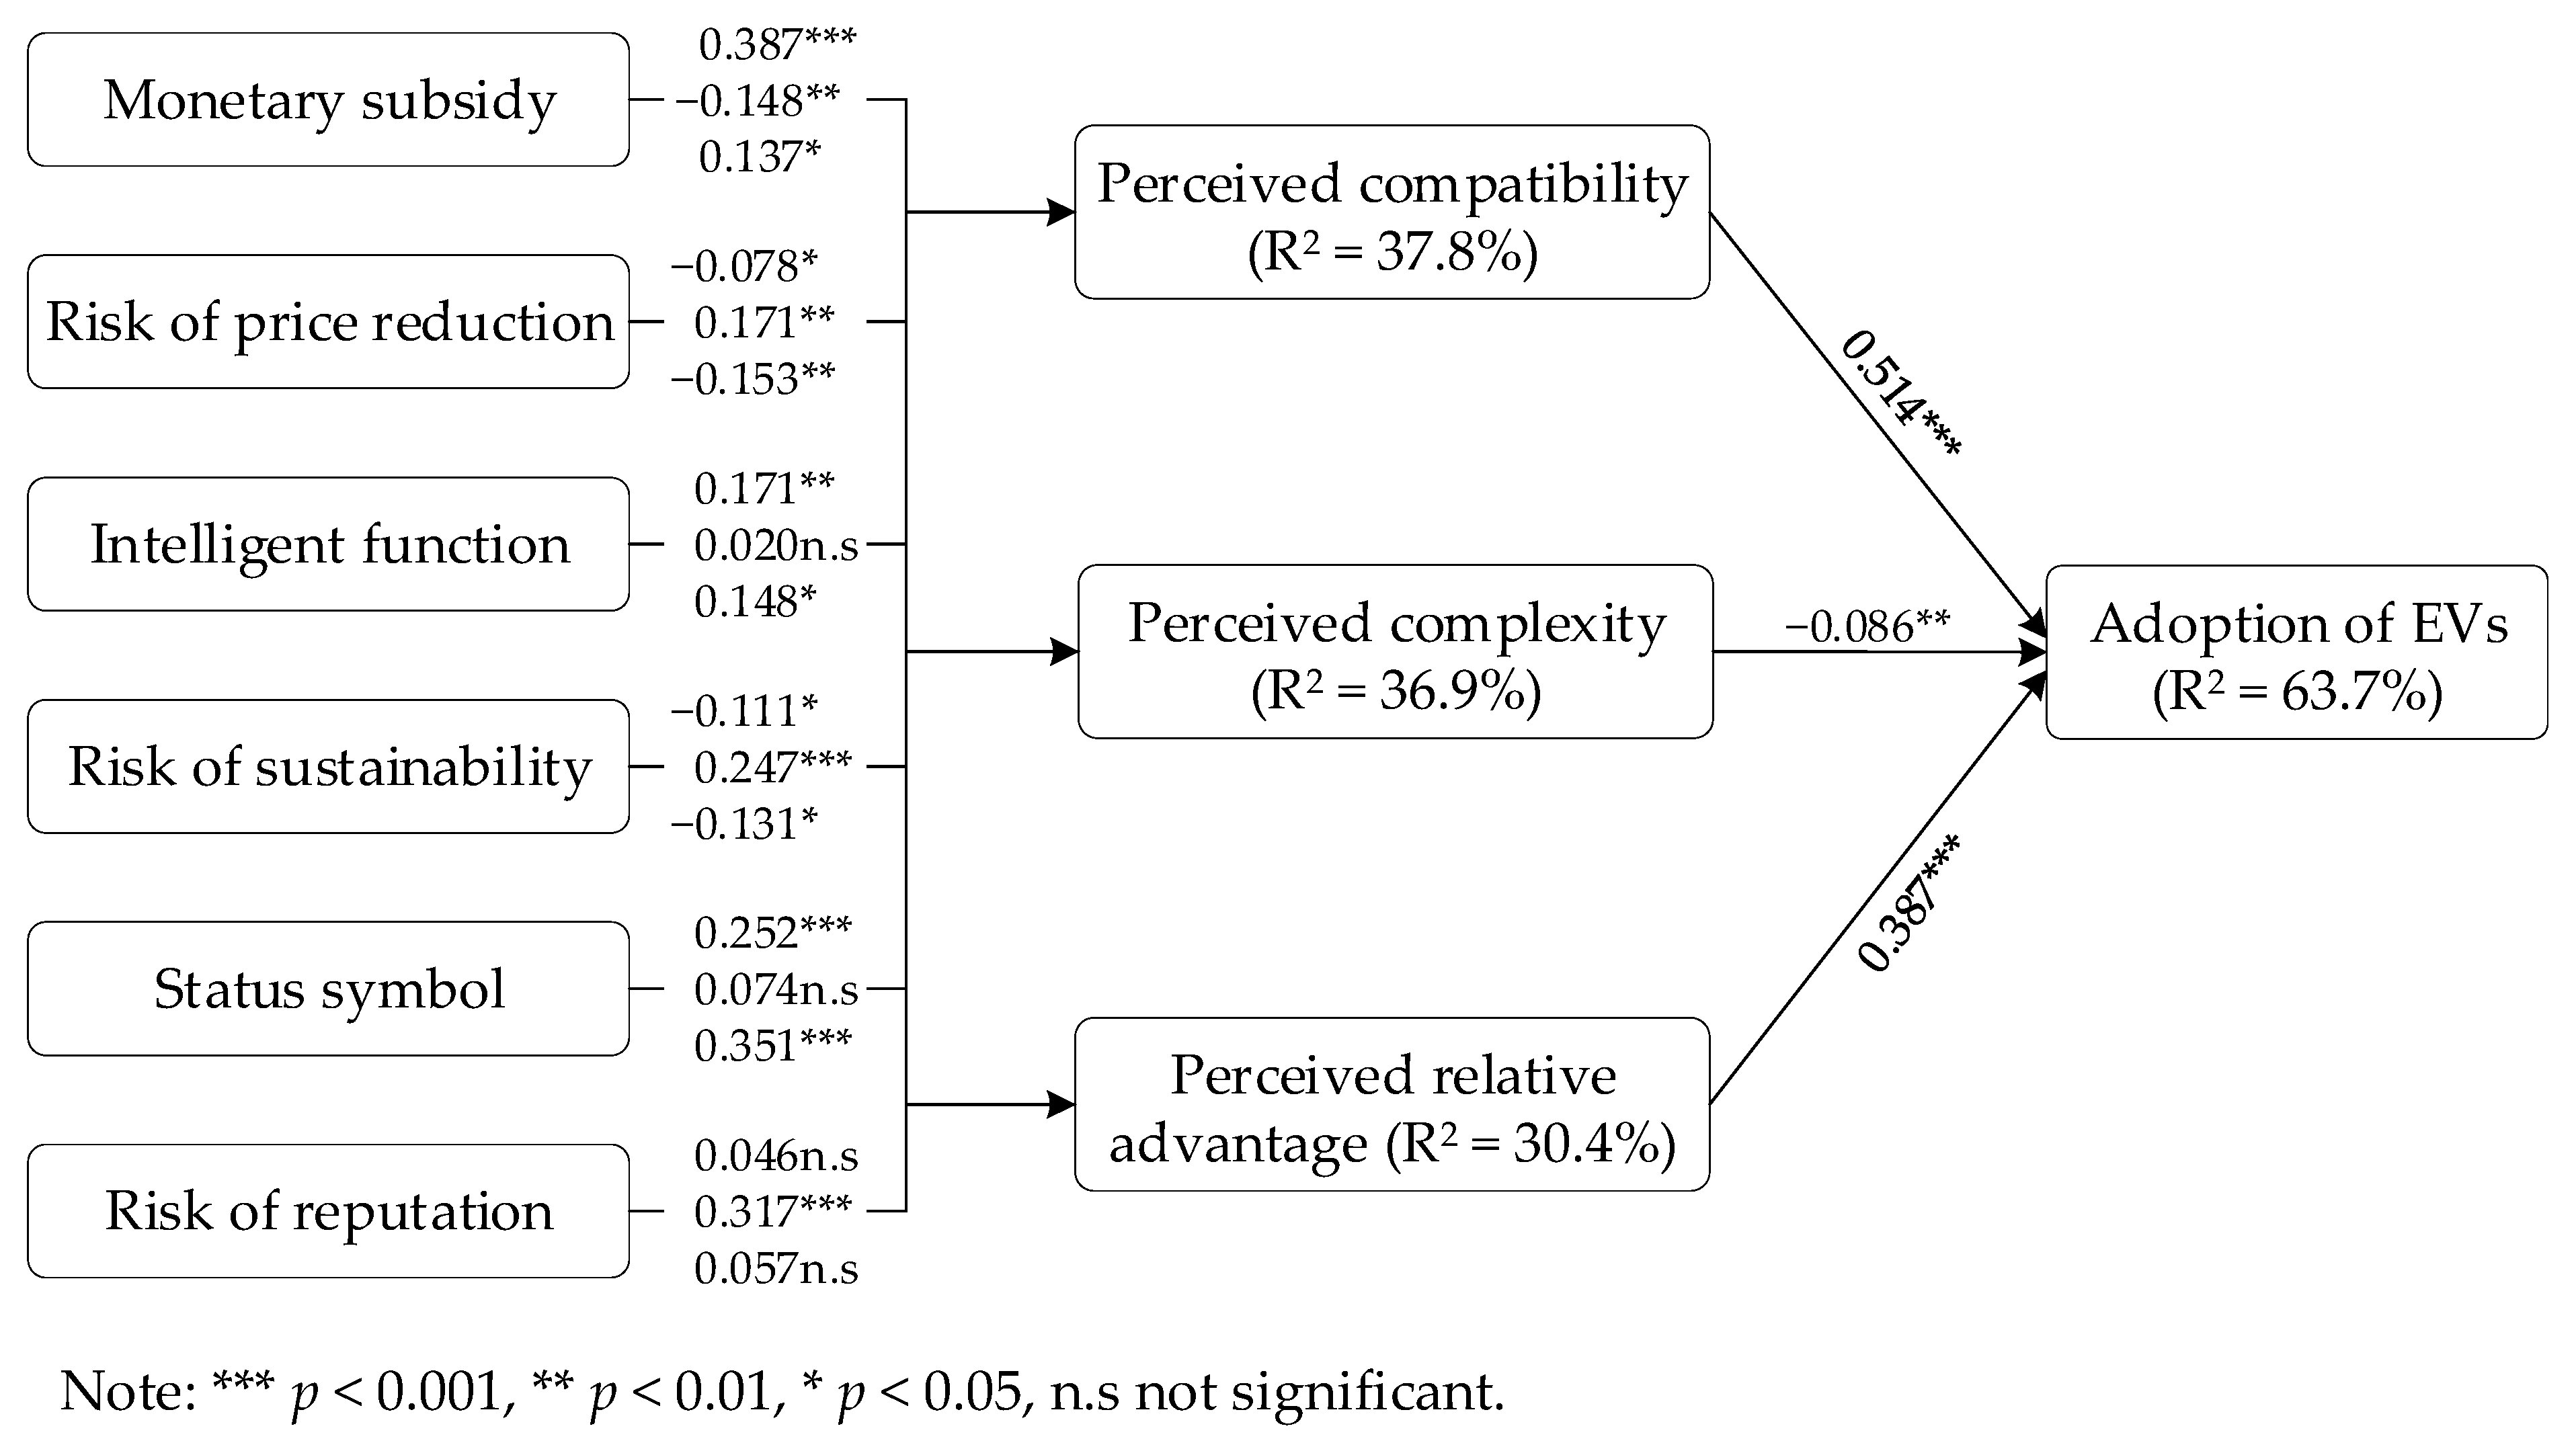
5.2. Structural Model

The bootstrapping procedure method was used to calculate the statistical significance of the parameter estimates and the results are presented in Figure 4. Overall, the proposed model explains a substantial proportion of the variance in perceived compatibility (37.8%), perceived complexity (36.9%), perceived relative advantage (30.4%), and adoption of EVs (63.7%). In addition, the goodness-of-fit (GoF) of our model is 0.542, much greater than the cutoff value of 0.36 for a large effect size [103]; the calculated SRMR is 0.067, less than the standard of 0.08 for a good model fit [104]. Therefore, the research model performs well in terms of explanatory power.
As summarized in Table 5, three innovation characteristics, i.e., perceived compatibility, perceived complexity, and perceived relative advantage, are significantly associated with consumer adoption of EVs, with path coefficients at 0.514 (t = 10.752, p < 0.001), −0.086 (t = 2.732, p < 0.01), and 0.387 (t = 8.511, p < 0.001), respectively, thus H1, H2, and H3 are supported. In the economic aspect, monetary subsidy has significant and positive impacts on perceived compatibility (β = 0.387, t = 6.783, p < 0.001) and perceived relative advantage (β = 0.137, t = 2.475, p < 0.05), but a negative impact on perceived complexity (β = −0.148, t = 3.004, p < 0.01), supporting H4a, H4b, and H4c. On the contrary, risk of price reduction is significantly and negatively related to perceived compatibility (β = −0.078, t = 2.115, p < 0.05) and perceived relative advantage (β = −0.153, t = 2.873, p < 0.01), but positively related to perceived complexity (β = 0.171, t = 2.928, p < 0.01), supporting H5a, H5b, and H5c. In the functional aspect, the results indicate that intelligent function exerts a significant role in improving perceived compatibility (β = 0.171, t = 3.084, p < 0.01) and perceived relative advantage (β = 0.148, t = 2.256, p < 0.05), whereas the relationship between intelligent function and perceived complexity is not significant (β = 0.020, t = 0.373, p > 0.05); H6a and H6c are thus supported, and H6b is rejected. As expected, risk of sustainability negatively affects perceived compatibility (β = −0.111, t = 2.304, p < 0.05) and perceived relative advantage (β = −0.131, t = 2.396, p < 0.05), and strongly and positively affects perceived complexity (β = 0.247, t = 3.970, p < 0.001), supporting H7a, H7b, and H7c. Regarding the social aspect, status symbol is positively associated with perceived compatibility (β = 0.252, t = 4.552, p < 0.001) and perceived relative advantage (β = 0.351, t = 5.846, p < 0.001) and H8a and H8c are thus supported. The path from status symbol to perceived complexity is not significant (β = 0.074, t = 1.195, p > 0.05), thus rejecting H8b. Finally, risk of reputation has a significant and positive effect on perceived complexity (β = 0.317, t = 4.958, p < 0.001), supporting H9b. However, there is not enough evidence to support H9a and H9c, as the relationships between risk of reputation with perceived compatibility (β = 0.046, t = 0.956, p > 0.05) and perceived relative advantage (β = 0.057, t = 0.849, p > 0.05) are not significant.

6. Discussion

6.1. Key Findings

Drawing on the DOI theory and practice, this study identifies and conceptualizes a series of factors that facilitate and hinder an individual’s adoption of EVs. Data from 375 general consumers were used to verify their impacts on the adoption of EVs and the empirical results support 17 of 21 hypotheses. The findings of this study are summarized as follows.
First, this study finds that the DOI theory has strong explanatory power for the adoption of EVs. By viewing EVs as innovative products that are different from traditional FVs, this study tries to understand consumer EV purchasing behavior from the perspective of innovation diffusion. On the one hand, the results indicate that all the three innovation characteristics explored in this study significantly affect the adoption of EVs, which is highly consistent with previous studies [63,105]. The coefficient comparative analysis based on the formula proposed by Chin et al. [97], further suggests that perceived compatibility plays the most important role (β = 0.514, p < 0.001), followed by perceived relative advantage (β = 0.387, p < 0.001), whereas the influence of perceived complexity is quite weak (β = −0.086, p < 0.05). On the other hand, the three innovation characteristics explored in this study explain 63.7% of the variance in adoption of EVs, which is greater than most prior models based on theories such as TPB, TAM, and RCT [40,106], indicating that the DOI theory is extremely effective in predicting consumer intention to adopt EVs.
Second, this study provides evidence that monetary subsidy and risk of price reduction are two important economic elements that influence EVs’ diffusion. For the former, although many previous studies have confirmed the positive impact of financial subsidy, the theoretical mechanism analysis remains inadequate [5,107]. This research proposed and empirically examined the potential mechanisms linking them. That is, that monetary subsidy can promote consumer adoption of EVs by enhancing their perceptions of compatibility and relative advantage while weakening the perception of complexity. With regard to the latter, little attention has been paid to the risk of price reduction, which is quite common in the current EV market. As discussed in Section 3, people do not like products that depreciate easily and the risk of price reduction will bring negative emotions. Our results support all the three hypotheses related to this construct, that is, that it hinders consumer adoption of EVs by negatively affecting their perceptions of compatibility and relative advantage, and positively affecting their perception of complexity.
Third, we find that functional factors are important in determining the adoption of EVs. Intelligent function and risk of sustainability were investigated in the current study and the results suggest that higher levels of intelligent function significantly contribute to consumer intention to purchase an EV, whereas the risk of sustainability exerts an opposite role. Specifically, the supported H6a and H6c provide the influencing paths of an intelligent function, that is, primarily by increasing perceived compatibility and perceived relative advantage, rather than reducing complexity perception. In contrast, the risk of sustainability is significantly associated with all the three innovation characteristics, which, to some extent, confirms Baumeister et al.’s [108] argument that “bad is stronger than good”. As described before, the excellent sustainable performance of EVs can greatly lower users’ range anxiety and concerns related to the service life. In this regard, it is urgent to speed up battery technology innovation and improve battery utilization efficiency.
Finally, this study finds that social factors also influence consumer adoption of EVs. We identified status symbol and risk of reputation as the key societal benefits and risks of using EVs, and the results support our hypotheses. For instance, consumers who regard EVs as a status symbol will perceive higher levels of compatibility between EVs and personal lifestyle and they are more likely to believe that EVs are better than FVs. The risk of reputation, as the main aspect of violating social norms, causes great social pressure and positively influences the perception of complexity. Exceeding our expectations, the impacts of reputation risk on perceived compatibility and relative advantage are not significant. One possible reason is that positive publicity surrounding EVs has generally shaped peoples’ positive attitudes towards them. In other words, the negative aspect of using an EV on personal reputation has not yet caught consumer attention, and our survey also shows that the mean risk of reputation is 3.454, which is the only construct lower than the neutral value.

6.2. Theoretical Implications

This study contributes to the literature in the following two ways. First, this study extends the application scope of the DOI theory and offers a valuable theoretical perspective for understanding the adoption of EVs. As mentioned before, although an increasing number of studies have been conducted, most of them are built on theories that focus unilaterally on an individual’s cognition of EVs, such as TPB, TRA, and TAM, ignoring the fact that people are faced with the choice of purchasing an FV or an EV. Compared with traditional FVs, EVs bring new experiences to users by using new energy, systems, and technologies, thus they can be regarded as innovative products. Drawing on the DOI theory, this study develops a research model covering three important innovation characteristics (perceived compatibility, perceived complexity, and perceived relative advantage) in the adoption of EVs. The results not only provide empirical evidence for the significant relationships between them but also confirm the strong explanatory power of the DOI theory as the three innovation characteristics account for more than 60% of the variance in the adoption of EVs.
Second, this study advances existing knowledge of the adoption of EVs by identifying a series of significant antecedents. Based on the in-depth excavation of practice, six factors from the economic, functional, and social aspects are concerned in this study. Specifically, through acting on consumer perceptions of innovation characteristics (perceived compatibility, perceived complexity, and perceived relative advantage), benefits such as monetary subsidy, intelligent function, and status symbol can significantly promote the adoption of EVs, whereas risks such as price reduction, sustainability, and reputation will significantly hinder the adoption of EVs. Considering most of the above constructs have not been addressed in previous literature, the findings of this study are expected to greatly deepen the academic cognition of the market penetration dilemma faced by EVs, thus offering possible ideas and directions for future research.

6.3. Practical Implications

The practical implications of this paper are extensive and sufficient. First, the findings suggest that monetary subsidy is helpful in increasing consumer adoption of EVs, which highlights the important channel for accelerating the market penetration of EVs. However, the resulting financial pressures have forced many regions to wind down subsidies for EV purchases. According to the latest policies released by the Chinese government, the monetary subsidy standard for new-energy vehicles will be reduced by 30% in 2022 [109], which undoubtedly dampens the further penetration of EVs. In this regard, it is recommended to guide the capital in the financial market to participate in the production and sales of green industries such as EVs to relieve financial pressure while continuing the monetary subsidies.
Second, since the risk of price reduction harms the adoption of EVs, the following suggestions can be given to promote the penetration of EVs in the market. For example, it is necessary to maintain relatively stable market prices for EVs. Although raising prices is not a wise choice, reducing prices frequently can result in adverse consequences, such as wait-and-see attitudes. If the price must be reduced due to technological progress or scale effect, it is suggested to provide a corresponding price insurance service for consumers who purchased in the past year or six months. We believe these measures can largely dispel consumer concerns about the risk of price reduction.
Third, the significantly positive effect of intelligent function on the adoption of EVs demonstrates a new way of facilitating the market penetration of EVs. Recently, with the continuous increase in the demand for a high-quality life, emerging technologies represented by artificial intelligence have found a wide range of application scenarios in our daily life. Equipment with intelligent functions is an important advantage of EVs over FVs, which brings users a new driving experience and makes them feel more compatible and comfortable. Hence, enterprises are advised to design and manufacture smarter products and highlight these unique advantages in their marketing.
Fourth, how to improve the sustainable performance of EVs deserves great attention. Numerous previous literature, including the current study, has shown that fearing sustainability risk is one of the key reasons people resist purchasing EVs. To solve this dilemma, we must invest more human and capital resources in developing more efficient and energy-dense batteries. Meanwhile, it is necessary to speed up the process of unifying the charging standards across the industry, which will hopefully make EVs easier to use. In addition, as the core component of EVs, the cost of battery replacement should not be underestimated. We believe consumer concerns will be largely eliminated if manufacturers offer free or low-cost battery replacement services.
Fifth, the positive relationship between status symbols and the adoption of EVs provides new ideas for furthering the market penetration of EVs. Inspired by previous research, we argue that EV owners tend to feel like innovators and environmental protection practitioners. The results indicate that consumers who perceive the status symbol role of EVs have higher levels of compatibility with their own image, and they are more likely to purchase EVs. As such, emphasizing the social benefits of using EVs, such as status symbol, is conducive to opening the market for EVs. Enterprises are advised to make bold attempts related to this aspect when promoting their products.
Finally, more positive information about EVs should be disseminated to reduce public misunderstandings. Although reputation risk only has a significant impact on perceived complexity, whose hindrance to the adoption of EVs is already weak, we cannot guarantee that there are no other possible mechanisms linking them. Moreover, as EVs become more widely available over time, the comparison between EVs and FVs also tends to be fierce. In this case, avoiding incorrect perceptions of EVs and establishing correct social norms can effectively eliminate consumer concerns about the negative consequences of using EVs on personal reputation.

6.4. Limitations and Future Research

Although this study provides salient theoretical and practical implications, several limitations warrant future research. First, as with many previous studies, the measure of the dependent variable captures behavioral intention rather than actual purchasing behavior. Although behavioral intentions exert a decisive role in the final behavior, they are not the real behavior after all. In this regard, it is recommended that future studies obtain empirical data directly from EV owners, especially those s who have just bought an EV. If possible, it is necessary to compare the differences in the influencing factors in the purchase of different EV brands such as Tesla, NiO, Li, Volkswagen, and so on. Second, more than 80% of our respondents already own at least one car, and we believe that FVs are likely to be the majority. There is no doubt that peoples’ experiences with existing products will affect their intentions to adopt new technologies, which unfortunately was not considered in this study. Hence, it would be better for future studies to collect data from consumers who have no vehicle to eliminate any possible bias. Third, although we have explored the impacts of six factors in economic, functional, and social aspects on consumer perceptions and adoption of EVs, some other important antecedents, such as appearance, style, security coefficient, perceived quality, etc., deserve further examination. In particular, it is suggested to pay more attention to those factors impeding the adoption of EVs, as numerous studies have shown that consumer resistance is more decisive in determining the diffusion of innovation.

7. Conclusions

Grounded in the diffusion of innovation theory, this study proposed a research model to investigate the antecedents of consumer adoption of EVs. The results of the analysis verify that innovation characteristics, i.e., perceived compatibility, perceived complexity, and perceived relative advantage, can effectively predict consumer decisions regarding the adoption of EVs. Furthermore, factors in economic aspect (monetary subsidy and risk of price reduction), functional aspect (intelligent function and risk of sustainability), and social aspect (status symbol and risk of reputation), exert significant impacts on the adoption of EVs by influencing consumer perceptions of innovation characteristics. Theoretically, this study contributes to the literature by providing an appropriate theoretical perspective and identifying numerous significant antecedents in the adoption of EVs. Practically, the findings of this study can provide valuable insights for improving the market penetration of EVs.

Author Contributions

Conceptualization, Z.X. and D.W.; methodology, L.Z.; software, L.Z.; validation, D.W.; formal analysis, D.W.; investigation, Z.X.; resources, Z.X.; data curation, Z.X.; writing—original draft, Z.X. and D.W.; writing—review and editing, D.W.; visualization, D.W.; supervision, L.Z. All authors have read and agreed to the published version of the manuscript.

Funding

This research was funded by the National Natural Science Foundation of China, grant number 72171180.

Institutional Review Board Statement

Not applicable.

Informed Consent Statement

Informed consent was obtained from all subjects involved in the study.

Data Availability Statement

The data presented in this study are available on request from the corresponding authors.

Acknowledgments

The authors are very grateful to the anonymous reviewers for their hard work and constructive comments.

Conflicts of Interest

The authors declare no conflict of interest.

Appendix A

Table A1. Measurement Items.
ConstructsItems
Monetary subsidy (MS)MS1: The purchase subsidy for electric vehicles is attractive to me.
MS1: The tax exemption policy for electric vehicles is attractive to me.
MS1: The larger purchase loan amounts for electric vehicles is attractive to me.
MS4: The lower insurance premium for electric vehicles is attractive to me.
Risk of price reduction (RPR)RPR1: The price of electric vehicles is likely to fall in the future.
RPR2: Buying electric vehicles faces the risk of a price reduction in the future.
RPR3: The price of electric vehicles is unstable.
Intelligent function (IF)IF1: Electric vehicles are smart.
IF2: Electric vehicles are full of intelligence.
IF3: Electric vehicles are equipped with a lot of intelligent functions.
Risk of sustainability (RS)RS1: The battery of electric vehicles is easy to loss and scrap.
RS2: Electric vehicles cannot run for a long duration.
RS3: The lifespan of electric vehicles is short.
RS4: Overall, electric vehicles are unsustainable.
Recommendation (REC)REC1: I will introduce this smart health device to my friends.
REC2: I will commend this smart health device to my friends.
REC3: I will tell others about the benefits of this smart health device.
Status symbol (SS)SS1: Electric vehicles are a symbol of identity and status.
SS2: People who drive electric vehicles are brave innovators.
SS3: People who drive electric vehicles are practitioners of environmental protection.
Risk of reputation (RR)RR1: Driving electric vehicles harms one’s social reputation.
RR2: Driving electric vehicles is not gregarious.
RR3: Driving electric vehicles will be ostracized by others.
Perceived compatibility (PCB)PCB1: Electric vehicles are compatible with my lifestyle.
PCB2: Electric vehicles fits well with the way I go out and come home in my daily life.
PCB3: Using electric vehicles is completely compatible with my current situation.
PCB4: Electric vehicles are a good match for my needs.
Perceived complexity (PCP)PCP1: I believe that electric vehicles are cumbersome to use.
PCP2: Using electric vehicles raises a lot of concerns.
PCP3: Using electric vehicles requires a lot of effort.
PCP4: Using electric vehicles is not easy.
Perceived relative advantage (PRA)PRA1: Electric vehicles are more convenient than traditional fuel vehicles.
PRA2: Electric vehicles are better than traditional fuel vehicles.
PRA3: Electric vehicles have more advantages than traditional fuel vehicles.
Adoption of EVs (AEV)AEV1: Compared with fuel vehicles, I will give priority to buying electric vehicles.
AEV2: I intend to buy an electric vehicle.
AEV3: I am willing to buy an electric vehicle in the near future
AEV4: I will recommend relatives and friends to buy electric vehicles.

References

  1. Vidyanandan, K.V. Overview of electric and hybrid vehicles. Energy Scan 2018, 3, 7–14. [Google Scholar]
  2. Cevrioglu, E.S. Electric Vehicles’ Global Market Share Projected to Reach 29% by 2025. Available online: https://www.aa.com.tr/en/economy/electric-vehicles-global-market-share-projected-to-reach-29-by-2025/2398806 (accessed on 1 March 2022).
  3. Wu, Y.A.; Ng, A.W.; Yu, Z.; Huang, J.; Meng, K.; Dong, Z.Y. A review of evolutionary policy incentives for sustainable development of electric vehicles in China: Strategic implications. Energy Policy 2021, 148, 111983. [Google Scholar] [CrossRef]
  4. Meckling, J.; Biber, E. A policy roadmap for negative emissions using direct air capture. Nat. Commun. 2021, 12, 1–6. [Google Scholar] [CrossRef] [PubMed]
  5. Huang, X.; Ge, J. Electric vehicle development in Beijing: An analysis of consumer purchase intention. J. Clean. Prod. 2019, 216, 361–372. [Google Scholar] [CrossRef]
  6. Kaplan, S.; Gruber, J.; Reinthaler, M.; Klauenberg, J. Intentions to introduce electric vehicles in the commercial sector: A model based on the theory of planned behaviour. Res. Transp. Econ. 2016, 55, 12–19. [Google Scholar] [CrossRef]
  7. Alzahrani, K.; Hall-Phillips, A.; Zeng, A.Z. Applying the theory of reasoned action to understanding consumers’ intention to adopt hybrid electric vehicles in Saudi Arabia. Transportation 2019, 46, 199–215. [Google Scholar] [CrossRef]
  8. Müller, J.M. Comparing technology acceptance for autonomous vehicles, battery electric vehicles, and car sharing-A study across Europe, China, and North America. Sustainability 2019, 11, 4333. [Google Scholar] [CrossRef] [Green Version]
  9. Asadi, S.; Nilashi, M.; Samad, S.; Abdullah, R.; Mahmoud, M.; Alkinani, M.H.; Yadegaridehkordi, E. Factors impacting consumers’ intention toward adoption of electric vehicles in Malaysia. J. Clean. Prod. 2021, 282, 124474. [Google Scholar] [CrossRef]
  10. Globisch, J.; Dütschke, E.; Schleich, J. Acceptance of electric passenger cars in commercial fleets. Transp. Res. Part A Policy Pract. 2018, 116, 122–129. [Google Scholar] [CrossRef]
  11. Rogers, E.M. Diffusion of Innovations; Simon and Schuster: New York, NY, USA, 2003. [Google Scholar]
  12. Singh, V.; Singh, V.; Vaibhav, S. A review and simple meta-analysis of factors influencing adoption of electric vehicles. Transp. Res. Part D Transp. Environ. 2020, 86, 102436. [Google Scholar] [CrossRef]
  13. Speaks, J.T. A Grounded Theory Method Approach to Understanding the Symbolic Meaning of Smoke and Behaviors Related to Household Air Pollution; University of California: San Francisco, CA, USA, 2018; ISBN 978-0-438-47490-1. [Google Scholar]
  14. Peters, A.; Dütschke, E. How do consumers perceive electric vehicles? A comparison of German consumer groups. J. Environ. Policy Plan. 2014, 16, 359–377. [Google Scholar] [CrossRef]
  15. Nordhoff, S.; Malmsten, V.; van Arem, B.; Liu, P.; Happee, R. A structural equation modeling approach for the acceptance of driverless automated shuttles based on constructs from the unified theory of acceptance and use of technology and the diffusion of innovation theory. Transp. Res. Part F Traffic Psychol. Behav. 2021, 78, 58–73. [Google Scholar] [CrossRef]
  16. Su, D.; Gu, Y.; Du, Q.; Zhou, W.; Huang, Y. Factors affecting user satisfaction with new energy vehicles: A field survey in Shanghai and Nanjing. J. Environ. Manag. 2020, 270, 110857. [Google Scholar] [CrossRef] [PubMed]
  17. Martins, R.; Oliveira, T.; Thomas, M.A. An empirical analysis to assess the determinants of SaaS diffusion in firms. Comput. Human Behav. 2016, 62, 19–33. [Google Scholar] [CrossRef]
  18. Oliveira, T.; Thomas, M.; Espadanal, M. Assessing the determinants of cloud computing adoption: An analysis of the manufacturing and services sectors. Inf. Manag. 2014, 51, 497–510. [Google Scholar] [CrossRef]
  19. Kumar, R.R.; Alok, K. Adoption of electric vehicle: A literature review and prospects for sustainability. J. Clean. Prod. 2020, 253, 119911. [Google Scholar] [CrossRef]
  20. Austmann, L.M. Drivers of the electric vehicle market: A systematic literature review of empirical studies. Financ. Res. Lett. 2021, 41, 101846. [Google Scholar] [CrossRef]
  21. Zupic, I.; Čater, T. Bibliometric methods in management and organization. Organ. Res. Methods 2015, 18, 429–472. [Google Scholar] [CrossRef]
  22. Ma, R.; Ho, Y.S. Comparison of environmental laws publications in Science Citation Index Expanded and Social Science Index: A bibliometric analysis. Scientometrics 2016, 109, 227–239. [Google Scholar] [CrossRef]
  23. Wang, M.H.; Ho, Y.S.; Fu, H.Z. Global performance and development on sustainable city based on natural science and social science research: A bibliometric analysis. Sci. Total Environ. 2019, 666, 1245–1254. [Google Scholar] [CrossRef]
  24. He, Q. Knowledge discovery through co-word analysis. Libr. Trends 1999, 48, 133–159. [Google Scholar]
  25. Wu, J.; Liao, H.; Wang, J.W.; Chen, T. The role of environmental concern in the public acceptance of autonomous electric vehicles: A survey from China. Transp. Res. Part F Traffic Psychol. Behav. 2019, 60, 37–46. [Google Scholar] [CrossRef]
  26. Shafiei, E.; Thorkelsson, H.; Ásgeirsson, E.I.; Davidsdottir, B.; Raberto, M.; Stefansson, H. An agent-based modeling approach to predict the evolution of market share of electric vehicles: A case study from Iceland. Technol. Forecast. Soc. Change 2012, 79, 1638–1653. [Google Scholar] [CrossRef]
  27. Liu, D.; Xiao, B. Exploring the development of electric vehicles under policy incentives: A scenario-based system dynamics model. Energy Policy 2018, 120, 8–23. [Google Scholar] [CrossRef]
  28. Moon, S.J. Effect of consumer environmental propensity and innovative propensity on intention to purchase electric vehicles: Applying an extended theory of planned behavior. Int. J. Sustain. Transp. 2021, 1–15. [Google Scholar] [CrossRef]
  29. Wang, S.; Wang, J.; Li, J.; Wang, J.; Liang, L. Policy implications for promoting the adoption of electric vehicles: Do consumer’s knowledge, perceived risk and financial incentive policy matter? Transp. Res. Part A Policy Pract. 2018, 117, 58–69. [Google Scholar] [CrossRef]
  30. Palmer, K.; Tate, J.E.; Wadud, Z.; Nellthorp, J. Total cost of ownership and market share for hybrid and electric vehicles in the UK, US and Japan. Appl. Energy 2018, 209, 108–119. [Google Scholar] [CrossRef]
  31. Degirmenci, K.; Breitner, M.H. Consumer purchase intentions for electric vehicles: Is green more important than price and range? Authors’ reply. Transp. Res. Part D Transp. Environ. 2018, 65, 846–848. [Google Scholar] [CrossRef]
  32. Bubeck, S.; Tomaschek, J.; Fahl, U. Perspectives of electric mobility: Total cost of ownership of electric vehicles in Germany. Transp. Policy 2016, 50, 63–77. [Google Scholar] [CrossRef]
  33. Taiebat, M.; Xu, M. Synergies of four emerging technologies for accelerated adoption of electric vehicles: Shared mobility, wireless charging, vehicle-to-grid, and vehicle automation. J. Clean. Prod. 2019, 230, 794–797. [Google Scholar] [CrossRef]
  34. Ahmed, M.; Zheng, Y.; Amine, A.; Fathiannasab, H.; Chen, Z. The role of artificial intelligence in the mass adoption of electric vehicles. Joule 2021, 5, 2296–2322. [Google Scholar] [CrossRef]
  35. Vatne, A.; Molinas, M.; Foosnæs, J.A. Analysis of a scenario of large scale adoption of electrical vehicles in nord-trøndelag. Energy Procedia 2012, 20, 291–300. [Google Scholar] [CrossRef] [Green Version]
  36. Qian, L.; Yin, J. Linking Chinese cultural values and the adoption of electric vehicles: The mediating role of ethical evaluation. Transp. Res. Part D Transp. Environ. 2017, 56, 175–188. [Google Scholar] [CrossRef]
  37. Lopez-Arboleda, E.; Sarmiento, A.T.; Cardenas, L.M. Systemic approach for integration of sustainability in evaluation of public policies for adoption of electric vehicles. Syst. Pract. Action Res. 2021, 34, 399–417. [Google Scholar] [CrossRef]
  38. Li, J.; Jiao, J.; Tang, Y. Analysis of the impact of policies intervention on electric vehicles adoption considering information transmission—based on consumer network model. Energy Policy 2020, 144, 111560. [Google Scholar] [CrossRef]
  39. Wu, D.; Yu, L.; Zhang, Q.; Jiao, Y.; Wu, Y. Materialism, ecological consciousness and purchasing intention of electric vehicles: An empirical analysis among chinese consumers. Sustain. 2021, 13, 2964. [Google Scholar] [CrossRef]
  40. Wang, S.; Fan, J.; Zhao, D.; Yang, S.; Fu, Y. Predicting consumers’ intention to adopt hybrid electric vehicles: Using an extended version of the theory of planned behavior model. Transportation 2016, 43, 123–143. [Google Scholar] [CrossRef]
  41. Noel, L.; Sovacool, B.K. Why Did Better Place Fail?: Range anxiety, interpretive flexibility, and electric vehicle promotion in Denmark and Israel. Energy Policy 2016, 94, 377–386. [Google Scholar] [CrossRef]
  42. Egbue, O.; Long, S. Barriers to widespread adoption of electric vehicles: An analysis of consumer attitudes and perceptions. Energy Policy 2012, 48, 717–729. [Google Scholar] [CrossRef]
  43. Zhang, Q.; Ou, X.; Yan, X.; Zhang, X. Electric vehicle market penetration and impacts on energy consumption and CO2 emission in the future: Beijing case. Energies 2017, 10, 228. [Google Scholar] [CrossRef] [Green Version]
  44. de Mello Bandeira, R.A.; Goes, G.V.; Schmitz Gonçalves, D.N.; D’Agosto, M.d.A.; Oliveira, C.M. Electric vehicles in the last mile of urban freight transportation: A sustainability assessment of postal deliveries in Rio de Janeiro-Brazil. Transp. Res. Part D Transp. Environ. 2019, 67, 491–502. [Google Scholar] [CrossRef]
  45. Wang, H.; Zhang, X.; Ouyang, M. Energy consumption of electric vehicles based on real-world driving patterns: A case study of Beijing. Appl. Energy 2015, 157, 710–719. [Google Scholar] [CrossRef]
  46. Rogers, E. Diffusion of Innovations; The Free Press: New York, NY, USA, 1962. [Google Scholar]
  47. Celik, I.; Sahin, I.; Aydin, M. Reliability and validity study of the mobile learning adoption scale developed based on the diffusion of innovation theory. Int. J. Educ. Math. Sci. Technol. 2014, 2, 300–316. [Google Scholar] [CrossRef] [Green Version]
  48. Labay, D.G.; Kinnear, T.C. Exploring the consumer decision process in the adoption of solar energy systems. J. Consum. Res. 1981, 8, 271–278. [Google Scholar] [CrossRef]
  49. Ali, M.; Raza, S.A.; Puah, C.H.; Amin, H. Consumer acceptance toward takaful in Pakistan: An application of diffusion of innovation theory. Int. J. Emerg. Mark. 2019, 14, 620–638. [Google Scholar] [CrossRef]
  50. Ling, H.C.; Chen, H.R.; Ho, K.K.W.; Hsiao, K.L. Exploring the factors affecting customers’ intention to purchase a smart speaker. J. Retail. Consum. Serv. 2021, 59, 102331. [Google Scholar] [CrossRef]
  51. Franceschinis, C.; Thiene, M.; Scarpa, R.; Rose, J.; Moretto, M.; Cavalli, R. Adoption of renewable heating systems: An empirical test of the diffusion of innovation theory. Energy 2017, 125, 313–326. [Google Scholar] [CrossRef] [Green Version]
  52. Al-Jabri, I.M.; Sohail, M.S. Mobile banking adoption: Application of diffusion of innovation theory. J. Electron. Commer. Res. 2012, 13, 379–391. [Google Scholar]
  53. Makanyeza, C. Determinants of consumers’ intention to adopt mobile banking services in Zimbabwe. Int. J. Bank Mark. 2017, 35, 997–1017. [Google Scholar] [CrossRef]
  54. Hoang, T.D.L.; Nguyen, H.K.; Nguyen, H.T. Towards an economic recovery after the COVID-19 pandemic: Empirical study on electronic commerce adoption of small and medium enterprises in Vietnam. Manag. Mark. 2021, 16, 47–68. [Google Scholar] [CrossRef]
  55. Chen, S.C.; Yen, D.C.; Peng, S.C. Assessing the impact of determinants in e-magazines acceptance: An empirical study. Comput. Stand. Interfaces 2018, 57, 49–58. [Google Scholar] [CrossRef]
  56. Goodhue, D.L.; Thompson, R.L. Task-technology fit and individual performance. MIS Q. 1995, 19, 213–233. [Google Scholar] [CrossRef]
  57. Rogers, E.M. Diffusion of Innovations, 3rd ed.; The Free Press: Florence, MA, USA, 1983. [Google Scholar]
  58. Venkatesh, V. Determinants of perceived ease of use: Integrating control, intrinsic motivation, and emotion into the technology acceptance model. Inf. Syst. Res. 2000, 11, 342–365. [Google Scholar] [CrossRef] [Green Version]
  59. Lawson-Body, A.; Illia, A.; Willoughby, L.; Lee, S. Innovation characteristics influencing veterans’ adoption of E-government services. J. Comput. Inf. Syst. 2014, 54, 34–44. [Google Scholar] [CrossRef]
  60. Pan, Y.; Froese, F.; Liu, N.; Hu, Y.; Ye, M. The adoption of artificial intelligence in employee recruitment: The influence of contextual factors. Int. J. Hum. Resour. Manag. 2021, 6, 1–23. [Google Scholar] [CrossRef]
  61. Bhardwaj, R.; Soni, P. Examining the dynamics of customer adoption of retail loyalty programmes in India. Int. J. Electron. Cust. Relatsh. Manag. 2020, 12, 357–372. [Google Scholar]
  62. Mombeuil, C. An exploratory investigation of factors affecting and best predicting the renewed adoption of mobile wallets. J. Retail. Consum. Serv. 2020, 55, 102127. [Google Scholar] [CrossRef]
  63. Yuen, K.F.; Cai, L.; Qi, G.; Wang, X. Factors influencing autonomous vehicle adoption: An application of the technology acceptance model and innovation diffusion theory. Technol. Anal. Strateg. Manag. 2021, 33, 505–519. [Google Scholar] [CrossRef]
  64. Xu, G.; Wang, S.; Li, J.; Zhao, D. Moving towards sustainable purchase behavior: Examining the determinants of consumers’ intentions to adopt electric vehicles. Environ. Sci. Pollut. Res. 2020, 27, 22535–22546. [Google Scholar] [CrossRef]
  65. Alogdianakis, F.; Dimitriou, L. Planning the urban shift to electromobility using a cost-benefit-analysis optimization framework: The case of Nicosia Cyprus. In Advances in Mobility-as-a-Service Systems; Advances in Intelligent Systems and Computing; Springer: Cham, Switzerland, 2021; Volume 1278, pp. 230–240. [Google Scholar]
  66. Zheng, Y.; Shao, Z.; Zhang, Y.; Jian, L. A systematic methodology for mid-and-long term electric vehicle charging load forecasting: The case study of Shenzhen, China. Sustain. Cities Soc. 2020, 56, 102084. [Google Scholar] [CrossRef]
  67. Hobfoll, S.E.; Freedy, J. Conservation of resources: A general stress theory applied to burnout. In Professional Burnout: Recent Developments in Theory and Research; Taylor & Francis: Abingdon, UK, 1993; pp. 115–129. [Google Scholar]
  68. Tesla TESLA. Available online: www.tesla.cn (accessed on 1 March 2022).
  69. Inesi, M.E. Power and loss aversion. Organ. Behav. Hum. Decis. Process. 2010, 112, 58–69. [Google Scholar] [CrossRef]
  70. Noone, B.M.; Lin, M.S. Scarcity-based price promotions: How effective are they in a revenue management environment? J. Hosp. Tour. Res. 2020, 44, 883–907. [Google Scholar] [CrossRef]
  71. Septianto, F.; Lee, M.S.; Putra, P.G. Everyday “low price” or everyday “value”? The interactive effects of framing and construal level on consumer purchase intentions. J. Retail. Consum. Serv. 2021, 58, 102317. [Google Scholar] [CrossRef]
  72. Qi, L.; Wu, X.; Zeng, X.; Feng, Y.; Pan, H.; Zhang, Z.; Yuan, Y. An electro-mechanical braking energy recovery system based on coil springs for energy saving applications in electric vehicles. Energy 2020, 200, 117472. [Google Scholar] [CrossRef]
  73. Ullah, A.; Zhang, Q.; Ahmed, M. The impact of smart connectivity features on customer engagement in electric vehicles. Sustain. Prod. Consum. 2021, 26, 203–212. [Google Scholar] [CrossRef]
  74. Baumeister, R.F.; Jones, E.E. When self-presentation is constrained by the target’s knowledge: Consistency and compensation. J. Pers. Soc. Psychol. 1978, 36, 608–618. [Google Scholar] [CrossRef]
  75. Young, J.H.; Nunes, J.C.; Drèze, X. Signaling status with luxury goods: The role of brand prominence. J. Mark. 2010, 74, 15–30. [Google Scholar]
  76. Noel, L.; Zarazua de Rubens, G.; Sovacool, B.K.; Kester, J. Fear and loathing of electric vehicles: The reactionary rhetoric of range anxiety. Energy Res. Soc. Sci. 2019, 48, 96–107. [Google Scholar] [CrossRef]
  77. Zhang, X.; Bai, X.; Shang, J. Is subsidized electric vehicles adoption sustainable: Consumers’ perceptions and motivation toward incentive policies, environmental benefits, and risks. J. Clean. Prod. 2018, 192, 71–79. [Google Scholar] [CrossRef]
  78. Wade, K.A.; Nash, R.A.; Garry, M. People consider reliability and cost when verifying their autobiographical memories. Acta Psychol. 2014, 146, 28–34. [Google Scholar] [CrossRef] [Green Version]
  79. Bonges, H.A.; Lusk, A.C. Addressing electric vehicle (EV) sales and range anxiety through parking layout, policy and regulation. Transp. Res. Part A Policy Pract. 2016, 83, 63–73. [Google Scholar] [CrossRef] [Green Version]
  80. He, X.; Zhan, W. How to activate moral norm to adopt electric vehicles in China? An empirical study based on extended norm activation theory. J. Clean. Prod. 2018, 172, 3546–3556. [Google Scholar] [CrossRef]
  81. James, M.X.; Hu, Z.; Leonce, T.E. Predictors of organic tea purchase intentions by Chinese consumers: Attitudes, subjective norms and demographic factors. J. Agribus. Dev. Emerg. Econ. 2019, 9, 202–219. [Google Scholar] [CrossRef]
  82. Malviya, S.; Saluja, M.S.; Thakur, A.S. A study on the factors influencing consumer’s purchase decision towards smartphones in Indore. Int. J. Adv. Res. Comput. Sci. Manag. Stud. 2013, 1, 14–21. [Google Scholar]
  83. Pojani, E.; Van Acker, V.; Pojani, D. Cars as a status symbol: Youth attitudes toward sustainable transport in a post-socialist city. Transp. Res. Part F Traffic Psychol. Behav. 2018, 58, 210–227. [Google Scholar] [CrossRef]
  84. Jones, A. The electric vehicle and the consumer: From environmentalists to innovators? Soc. Bus. 2018, 8, 29–36. [Google Scholar] [CrossRef]
  85. Klabi, F.; Binzafrah, F. Exploring the relationships between Islam, some personal values, environmental concern, and electric vehicle purchase intention: The case of Saudi Arabia. J. Islam. Mark. 2021. [Google Scholar] [CrossRef]
  86. Dukas, R. Causes and consequences of limited attention. Brain. Behav. Evol. 2004, 63, 197–210. [Google Scholar] [CrossRef]
  87. Nilsson, M.; Nykvist, B. Governing the electric vehicle transition – Near term interventions to support a green energy economy. Appl. Energy 2016, 179, 1360–1371. [Google Scholar] [CrossRef]
  88. Ajzen, I. From intentions to actions: A theory of planned behavior. In Action Control; Springer: Berlin/Heidelberg, Germany, 1985; pp. 11–39. [Google Scholar]
  89. Moore, G.C.; Benbasat, I. Development of an instrument to measure the perceptions of adopting an information technology innovation. Inf. Syst. Res. 1991, 2, 192–222. [Google Scholar] [CrossRef] [Green Version]
  90. Sreen, N.; Purbey, S.; Sadarangani, P. Impact of culture, behavior and gender on green purchase intention. J. Retail. Consum. Serv. 2018, 41, 177–189. [Google Scholar] [CrossRef]
  91. Faul, F.; Erdfelder, E.; Buchner, A.; Lang, A.-G. Statistical power analyses using G* Power 3.1: Tests for correlation and regression analyses. Behav. Res. Methods 2009, 41, 1149–1160. [Google Scholar] [CrossRef] [PubMed] [Green Version]
  92. Armstrong, J.S.; Overton, T.S. Estimating nonresponse bias in mail surveys. J. Mark. Res. 1977, 14, 396–402. [Google Scholar] [CrossRef] [Green Version]
  93. Diamantopoulos, A.; Siguaw, J.A. Formative versus reflective indicators in organizational measure development: A comparison and empirical illustration. Br. J. Manag. 2006, 17, 263–282. [Google Scholar] [CrossRef]
  94. Miles, J. Tolerance and variance inflation factor. Wiley StatsRef: Statistics Reference Online; John Wiley & Sons: Hoboken, NJ, USA, 2014. [Google Scholar]
  95. Podsakoff, P.M.; MacKenzie, S.B.; Lee, J.Y.; Podsakoff, N.P. Common method biases in behavioral research: A critical review of the literature and recommended remedies. J. Appl. Psychol. 2003, 88, 879–903. [Google Scholar] [CrossRef]
  96. Liang, H.; Saraf, N.; Hu, Q.; Xue, Y. Assimilation of enterprise systems: The effect of institutional pressures and the mediating role of top management. MIS Q. 2007, 31, 59–87. [Google Scholar] [CrossRef]
  97. Chin, W.W.; Marcelin, B.L.; Newsted, P.R. A partial least squares latent variable modeling approach for measuring interaction effects: Results from a Monte Carlo simulation study and an electronic-mail emotion/adoption study. Inf. Syst. Res. 2003, 14, 189–217. [Google Scholar] [CrossRef] [Green Version]
  98. Anderson, J.C.; Gerbing, D.W. Structural equation modeling in practice: A review and recommended two-step approach. Psychol. Bull. 1988, 103, 411–423. [Google Scholar] [CrossRef]
  99. Ringle, C.M.; Wende, S.; Becker, J.-M. “SmartPLS 3.” Boenningstedt; SmartPLS GmbH: Hamburg, Germany, 2015. [Google Scholar]
  100. Fornell, C.; Bookstein, F.L. Two structural equation models: LISREL and PLS applied to consumer exit-voice theory. J. Mark. Res. 1982, 19, 440–452. [Google Scholar] [CrossRef] [Green Version]
  101. Hess, T.J.; Fuller, M.; Campbell, D.E. Designing interfaces with social presence: Using vividness and extraversion to create social recommendation agents. J. Assoc. Inf. Syst. 2009, 10, 889–919. [Google Scholar] [CrossRef]
  102. Fornell, C.; Larcker, D.F. Structural equation models with unobservable variables and measurement error: Algebra and statistics. J. Mark. Res. 1981, 18, 382–388. [Google Scholar] [CrossRef]
  103. Wetzels, M.; Odekerken-Schröder, G.; Van Oppen, C. Using PLS path modeling for assessing hierarchical construct models: Guidelines and empirical illustration. MIS Q. 2009, 33, 177–196. [Google Scholar] [CrossRef]
  104. Hair, J.F.; Hult, G.T.M.; Ringle, C.M.; Sarstedt, M. A Primer on Partial Least Squares Structural Equation Modeling (PLS-SEM); Sage Publications: Thousand Oaks, CA, USA, 2021. [Google Scholar]
  105. De Oliveira, M.B.; da Silva, H.M.R.; Jugend, D.; Fiorini, P.D.C.; Paro, C.E. Factors influencing the intention to use electric cars in Brazil. Transp. Res. Part A Policy Pract. 2022, 155, 418–433. [Google Scholar] [CrossRef]
  106. Adu-Gyamfi, G.; Song, H.; Obuobi, B.; Nketiah, E.; Wang, H.; Cudjoe, D. Who will adopt? Investigating the adoption intention for battery swap technology for electric vehicles. Renew. Sustain. Energy Rev. 2022, 156, 111979. [Google Scholar] [CrossRef]
  107. Kalthaus, M.; Sun, J. Determinants of electric vehicle diffusion in China. Environ. Resour. Econ. 2021, 80, 473–510. [Google Scholar] [CrossRef]
  108. Baumeister, R.F.; Bratslavsky, E.; Finkenauer, C.; Vohs, K.D. Bad is stronger than good. Rev. Gen. Psychol. 2001, 5, 323–370. [Google Scholar] [CrossRef]
  109. MoF of PRC Notice on Fiscal Subsidy Policies for the Promotion and Application of New Energy Vehicles in 2022. Available online: http://www.gov.cn/zhengce/zhengceku/2021-12/31/content_5665857.htm (accessed on 1 March 2022).
Figure 1. Number of publications from 2012 to 2021.
Sustainability 14 06283 g001
Figure 2. Density visualization network of keyword co-occurrence analysis.
Sustainability 14 06283 g002
Figure 3. Research model.
Sustainability 14 06283 g003
Figure 4. Partial least-squares (PLS) results.
Sustainability 14 06283 g004
Table 1. Sample characteristics.
Demographic VariableTypesFrequencyPercentage (%)
GenderMale 19852.80
Female17747.20
AgeYounger than 1820.53
19–259124.27
26–3014037.33
31–4011831.47
41–50195.07
Older than 5151.33
Educational levelHigh school and below215.60
Junior college11229.87
Undergraduate21657.60
Master and above266.93
Personal annual income (CNY)Less than 50,000215.60
50,000 to less than 100,0005514.67
100,000 to less than 150,00012834.13
150,000 to less than 200,00011931.73
More than 200,0005213.87
Number of cars owned05414.40
128174.93
2287.47
More than 2123.20
Table 2. Common method bias analysis.
IndicatorSubstantive Factor Loading (R1)R12Method Factor Loading (R2)R22
MS10.845 ***0.714−0.0170.000
MS20.881 ***0.776−0.084 *0.007
MS30.572 ***0.3270.174 **0.030
MS40.832 ***0.692−0.0440.002
RPR10.858 ***0.736−0.0490.002
RPR20.888 ***0.7890.0550.003
RPR30.875 ***0.766−0.0060.000
IF10.841 ***0.707−0.0200.000
IF20.874 ***0.7640.0150.000
IF30.847 ***0.7170.0040.000
RS10.804 ***0.646−0.0560.003
RS20.826 ***0.6820.0110.000
RS30.854 ***0.729−0.0260.001
RS40.817 ***0.6670.0740.005
SS10.871 ***0.7590.0040.000
SS20.815 ***0.6640.0660.004
SS30.885 ***0.783−0.0700.005
RR10.877 ***0.769−0.0270.001
RR20.870 ***0.7570.0530.003
RR30.878 ***0.771−0.0260.001
PCB10.667 ***0.4450.0900.008
PCB20.913 ***0.834−0.1230.015
PCB30.784 ***0.6150.0070.000
PCB40.768 ***0.5900.0320.001
PCP10.845 ***0.714−0.0570.003
PCP20.789 ***0.623−0.0340.001
PCP30.843 ***0.7110.0490.002
PCP40.858 ***0.7360.0400.002
PRA10.852 ***0.726−0.110 *0.012
PRA20.787 ***0.6190.0870.008
PRA30.786 ***0.6180.0100.000
AEV10.723 ***0.5230.0880.008
AEV20.871 ***0.759−0.0380.001
AEV30.974 ***0.949−0.1180.014
AEV40.756 ***0.5720.0740.005
Average0.8290.6930.0010.004
Notes: MS—Monetary subsidy, RPR—Risk of price reduction, IF—Intelligent function, RS—Risk of sustainability, SS—Status symbol, RR—Risk of reputation, PCB—Perceived compatibility, PCP—Perceived complexity, PRA—Perceived relative advantage, AEV—Adoption of EVs. * p < 0.05, ** p < 0.01, *** p < 0.001.
Table 3. Results of reliability and convergent validity.
ConstructsItemsLoadingsCACRAVE
Monetary subsidy (MS)MS10.8460.7960.8680.623
MS20.826
MS30.685
MS40.791
Risk of price reduction (RPR)RPR10.8740.8450.9060.763
RPR20.875
RPR30.872
Intelligent function (IF)IF10.8160.8140.8900.729
IF20.884
IF30.860
Risk of sustainability (RS)RS10.8150.8440.8950.681
RS20.814
RS30.855
RS40.815
Status symbol (SS)SS10.8790.8190.8920.734
SS20.843
SS30.849
Risk of reputation (RR)RR10.8810.8470.9070.766
RR20.873
RR30.870
Perceived compatibility (PCB)PCB10.7460.7910.9650.615
PCB20.803
PCB30.788
PCB40.799
Perceived complexity (PCP)PCP10.8620.8540.9010.695
PCP20.778
PCP30.835
PCP40.856
Perceived relative advantage (PRA)PRA10.7550.7290.8470.649
PRA20.859
PRA30.799
Adoption of EVs (AEV)AEV10.8140.8530.9010.694
AEV20.832
AEV30.864
AEV40.820
Table 4. Descriptive statistics and discriminant validity.
ConstructsMeanS.DMSRPRIFRSSSRRPCPPPRAAEV
MS5.2721.0390.789
RPR4.4271.217−0.0100.873
IF4.7521.2300.304−0.0370.854
RS4.4051.293−0.0570.3850.0560.825
SS4.3181.3210.157−0.0170.4920.1240.857
RR3.4541.489−0.2720.1010.2420.3320.4390.875
PC5.2050.9670.471−0.1280.412−0.1090.3930.0370.784
PP4.0991.337−0.2200.3010.0930.4360.2220.489−0.1020.834
PRA4.8291.0860.226−0.2110.370−0.1300.4540.1510.5210.0650.806
AEV5.1031.1000.505−0.2420.443−0.1870.4090.0080.725−0.1040.6440.833
Notes: S.D—Standard deviation, MS—Monetary subsidy, RPR—Risk of price reduction, IF—Intelligent function, RS—Risk of sustainability, SS—Status symbol, RR—Risk of reputation, PCB—Perceived compatibility, PCP—Perceived complexity, PRA—Perceived relative advantage, AEV—Adoption of EVs. The values in bold on the diagonal are the square roots of AVE.
Table 5. Structural model results.
HypothesisPathsβt−Statisticsp−ValuesResults
H1Perceived compatibility → Adoption of EVs0.51410.7520.000Support
H2Perceived complexity → Adoption of EVs−0.0862.7320.007Support
H3Perceived relative advantage → Adoption of EVs0.3878.5110.000Support
H4aMonetary subsidy → Perceived compatibility0.3876.7830.000Support
H4bMonetary subsidy → Perceived complexity−0.1483.0040.003Support
H4cMonetary subsidy → Perceived relative advantage0.1372.4750.014Support
H5aRisk of price reduction → Perceived compatibility−0.0782.1150.035Support
H5bRisk of price reduction → Perceived complexity0.1712.9280.004Support
H5cRisk of price reduction → Perceived relative advantage−0.1532.8730.004Support
H6aIntelligent function → Perceived compatibility0.1713.0840.002Support
H6bIntelligent function → Perceived complexity0.0200.3730.709Not support
H6cIntelligent function → Perceived relative advantage0.1482.2560.025Support
H7aRisk of sustainability → Perceived compatibility−0.1112.3040.022Support
H7bRisk of sustainability → Perceived complexity0.2473.9700.000Support
H7cRisk of sustainability → Perceived relative advantage−0.1312.3960.017Support
H8aStatus symbol → Perceived compatibility0.2524.5520.000Support
H8bStatus symbol → Perceived complexity0.0741.1950.233Not support
H8cStatus symbol → Perceived relative advantage0.3515.8460.000Support
H9aRisk of reputation → Perceived compatibility0.0460.9560.340Not support
H9bRisk of reputation → Perceived complexity0.3174.9580.000Support
H9cRisk of reputation → Perceived relative advantage0.0570.8490.396Not support
Publisher’s Note: MDPI stays neutral with regard to jurisdictional claims in published maps and institutional affiliations.

